Embed Size (px)
Citation preview
Global Technology Roadmap for CCS in Industry
Sectoral Assessment: Cement
August 2010
Final

276986 PNC RGF 01 D
276986/Final
27 August 2010
Global Technology Roadmap for CCS in Industry
Sectoral Assessment: Cement
August 2010
Mott MacDonald, Victory House, Trafalgar Place, Brighton BN1 4FY, United Kingdom T +44(0) 1273 365000 F +44(0) 1273 365100 W www.mottmac.com

Global Technology Roadmap for CCS in Industry
Mott MacDonald, Victory House, Trafalgar Place, Brighton BN1 4FY, United Kingdom T +44(0) 1273 365000 F +44(0) 1273 365100 W www.mottmac.com
��������� ��� � ������ � ������ � ��� ��� � ��� �������
A 25 June 2010 D Barker A Popa D Holding First draft
B 28 July 2010 D Barker A Popa J Laing Final draft
C 29 July 2010 D Barker A Popa J Laing Final draft (client details removed)
D 27 August 2010 D Barker S Tassos S Tassos Final report
Issue and revision record
This document is issued for the party which commissioned it and for specific purposes connected with the above-captioned project only. It should not be relied upon by any other party or used for any other purpose.
We accept no responsibility for the consequences of this document being relied upon by any other party, or being used for any other purpose, or containing any error or omission which is due to an error or omission in data supplied to us by other parties
This document contains confidential information and proprietary intellectual property. It should not be shown to other parties without consent from us and from the party which commissioned it.

276986/PNC/RGF/01/D 27 August 2010 276986/Final
Global Technology Roadmap for CCS in Industry
����� � ������ ����
Executive Summary i
1. Introduction 1 1.1 Project context _____________________________________________________________________ 1 1.2 Project Objectives ___________________________________________________________________ 2 1.3 Scope of Work _____________________________________________________________________ 3
2. Current and projected emissions 4 2.1 Overview__________________________________________________________________________ 4 2.2 Emissions in the cement sector at present ________________________________________________ 4 2.3 Projections for emissions in the cement sector in the future ___________________________________ 5 2.4 Regional considerations ______________________________________________________________ 6
3. Technical overview of capture options 11 3.1 Overview_________________________________________________________________________ 11 3.2 Mitigation options __________________________________________________________________ 11 3.3 Post-combustion CCS technologies ____________________________________________________ 11 3.4 Oxyfuel CCS technology_____________________________________________________________ 13 3.5 Biological capture of CO2 ____________________________________________________________ 15
4. CO2 capture energy requirements and emission reductions 16 4.1 Overview_________________________________________________________________________ 16 4.2 Consequences of CO2 capture energy requirements _______________________________________ 16 4.3 Consequences of CO2 capture for upstream emissions _____________________________________ 16 4.4 Potential CO2 emission reductions in the sector due to CCS _________________________________ 16
5. Current activities and projections on CCS role 18 5.1 Overview_________________________________________________________________________ 18 5.2 CCS research programmes in the cement sector __________________________________________ 18 5.3 Large-scale demonstration projects ____________________________________________________ 20 5.4 Role that CCS would play in the cement sector ___________________________________________ 21
6. Estimated investment and costs 23 6.1 Overview_________________________________________________________________________ 23 6.2 Costs of applying CO2 capture to the cement industry ______________________________________ 23 6.2.1 Post-combustion capture using absorption technologies ____________________________________ 23 6.2.2 Post-combustion capture using membrane technology______________________________________ 24 6.2.3 Oxyfuel technology _________________________________________________________________ 25
7. Characterisation of the industry 27 7.1 Overview_________________________________________________________________________ 27 7.2 Industries involved in the sector _______________________________________________________ 27 7.3 Dominant companies _______________________________________________________________ 27 7.3.1 The Chinese Market ________________________________________________________________ 28
Content
276986/PNC/RGF/01/D 27 August 2010 276986/Final
Global Technology Roadmap for CCS in Industry
7.3.2 The Indian Market __________________________________________________________________ 29 7.4 Assessment of the business environment within the cement industry___________________________ 30 7.4.1 Risk-averse or risk-seeking?__________________________________________________________ 30 7.4.2 Innovative or conservative? __________________________________________________________ 30 7.4.3 Globally active or primarily supplying a domestic market? ___________________________________ 30 7.4.4 Heavily regulated or fully free? ________________________________________________________ 31
8. Current environmental legislation and pressures 32 8.1 Overview_________________________________________________________________________ 32 8.2 Greenhouse Gases_________________________________________________________________ 32 8.2.1 International ______________________________________________________________________ 32 8.2.2 Europe __________________________________________________________________________ 33 8.2.3 Asia_____________________________________________________________________________ 33 8.2.4 The Americas _____________________________________________________________________ 34 8.2.5 Australasia _______________________________________________________________________ 35 8.2.6 Africa____________________________________________________________________________ 35 8.3 Other Environmental Issues __________________________________________________________ 35 8.4 Environmental Pressures ____________________________________________________________ 36
9. Major gaps and barriers to implementation 37 9.1 Overview_________________________________________________________________________ 37 9.2 General gaps and barriers to deployment of CO2 capture in the cement sector ___________________ 37 9.3 Gaps and barriers to deployment of post-combustion CO2 capture in the cement sector____________ 39 9.4 Gaps and barriers to deployment of oxyfuel CO2 capture in the cement sector ___________________ 40
10. References 41
Glossary 45
276986/PNC/RGF/01/D 27 August 2010 276986/Final
i
Global Technology Roadmap for CCS in Industry
Industry accounts for almost 40% of total energy-related CO2 emissions. CO2 Capture and Storage (CCS) is one of the key potential options for reducing CO2 emissions within the industrial sector. Although some industrial sectors have started to assess the potential of CCS, there is a need for additional, sector-specific analysis of CCS costs, benefits and potential, particularly in developing countries. The United Nations Industrial Development Organisation (UNIDO) is undertaking a project to develop a CCS industrial sector roadmap to provide relevant information on actions and milestones to government and industry decision-makers that can facilitate the deployment of CCS in industry.
As part of this project, UNIDO contracted Duncan Barker from Mott MacDonald Limited (MML) to assist in the preparation of a sectoral assessment of the cement industry. This report is the final version of the assessment and consists of the context, literature review and the state of play with regard to CCS in the cement sector. The first draft of this report was used as a basis of discussion for a two day expert workshop held in Abu Dhabi on 30 June and 1 July 2010 and comments and inputs from attendees at the workshop have been included within this report. The final draft was also submitted for peer review and the comments from reviewers have been considered and addressed.
The assessment covers the following topics for the cement industry: � Current and projected emissions; � Technical overview of capture options; � CO2 capture energy requirements and emission reductions; � Current activities and projections on role of CCS; � Estimated investment and costs; � Characterisation of the industry; � Current environmental legislation and pressures; and � Major gaps and barriers to implementation.
The key issues for CCS in the cement industry are considered to be: � Projected baseline direct emissions for the cement sector have been estimated by the
IEA at 2.938 GtCO2/y under a high demand scenario with the largest amount of emissions predicted to occur in China, India, other developing Asian countries and Africa and the Middle East.
� Although other measures such as improvements in thermal and electrical efficiency, alternative fuel use and clinker substitution can make significant reductions in CO2 emissions CCS is a potentially key option for the cement industry to make deep cuts in CO2 emissions.
Executive Summary
276986/PNC/RGF/01/D 27 August 2010 276986/Final
ii
Global Technology Roadmap for CCS in Industry
� A number of different technological options are being investigated for applying CCS at cement plants. All these options would tend to lead to large increases in thermal and electrical energy consumption at the capture sites.
� Research programmes are on-going into applying CCS at cement plants and a small number of large scale projects have been announced. The most notable projects are focused on solid sorbent technology, post-combustion carbonation capture technology and biological capture with algae.
� There is limited data available on the costs for applying CCS at cement plants but current estimates indicate that applying CCS would result in a significant increase in the final product cost.
� The cement industry is generally considered to be risk-adverse and it would appear that future development of CCS technologies for the industry will most likely be driven by plant equipment suppliers rather than the cement manufacturers themselves.
� Current environmental legislation with respect to greenhouse gases is applied differently around the world but there does appear to be clear pressure to improve the efficiency of production and reduce CO2 emissions associated with cement.
� The most significant gap and barrier to the further development of CCS within the cement industry is most likely the lack of an economic framework.
The assessment will now be used as input for drafting a CCS roadmap for industrial processes and will form the basis for identifying the steps that need to be undertaken to expand industrial CCS from where it is today to 2050 in order to achieve global GHG targets.
276986/PNC/RGF/01/D 27 August 2010 276986/Final
1
Global Technology Roadmap for CCS in Industry
��� � ��������������
Industry consumes approximately one-third of global final energy use and accounts for almost 40% of total energy-related CO2 emissions (IEA, 2009). Over recent decades, industrial energy efficiency has improved and CO2 intensity has declined substantially in many sectors. However, this progress has been more than offset by growing industrial production worldwide. As a result, total industrial energy consumption and CO2 emissions have continued to rise. Projections of future energy use and emissions show that without decisive action, these trends will continue. This path is not sustainable. Making substantial cuts in industrial CO2 emissions will require the widespread adoption of current best available technology (BAT), and the development and deployment of a range of new technologies. This technology transition is urgent; industrial emissions must peak in the coming decade if the worse impacts of climate change are to be avoided.
In contrast to the power sector, few alternatives exist for emissions mitigation in the manufacturing industry sector. According to the IEA (2009) CO2 Capture and Storage (CCS) can be regarded as the most important new technology for reducing direct emissions in industry and upstream processes and should therefore be a priority technology development area. There are limited activities in some industrial sectors to develop CCS for full-scale projects. However, a comprehensive effort across all sectors is lacking.
CCS is a key technology option for greenhouse gas (GHG) emissions mitigation. The International Energy Agency (IEA) estimates that CCS would contribute 19% of the total global mitigation that is needed for halving global GHG emissions by 2050. The 19% can be split into 10% coming from the power sector and 9% from the manufacturing industry and fuel transformation (refineries, etc.). However, up to date almost all the efforts in analysing CCS have been focused on the power sector.
In industry, CCS is especially suited for large-scale processes, specifically: refineries, biofuel, iron, cement, ammonia, and chemical pulp production. Also, a number of biomass processing plants (pulp making, second generation biofuels production) offer the prospect of biomass with CCS, an option that results in a net CO2 removal from the atmosphere. The later option would likely be required if emission levels below 450 ppm CO2e are targeted (IEA, 2008).
Even today, developing countries account for the majority of industrial energy use and CO2 emissions. China stands out as the largest producer of energy intensive commodities such as cement, iron and ammonia. Thus, CCS applied to industry is a good opportunity to consider an emerging key low-carbon technology via deployment in the developing world. Capacity building for CCS in industry should be therefore a priority, and major developing countries with industrial activities such as Brazil, China, India, Indonesia, Mexico, Qatar, Saudi Arabia, South Africa, and Trinidad and Tobago should be part of this effort. It is however obvious that the needs and capacity of the different countries where CCS potential is high are diverse.
A comprehensive technology status analysis and road-mapping exercise is required for CCS in the industry. This will complement ongoing technology road-mapping exercises for other key energy technologies (e.g. coal, nuclear, solar photovoltaic (PV), heat pumps, etc.), and would expand the work and associated data already available for CCS applied in the power sector.
1. Introduction
276986/PNC/RGF/01/D 27 August 2010 276986/Final
2
Global Technology Roadmap for CCS in Industry
��� � �����������������
This section outlines the overarching objectives of the United Nations Industrial Development Organisation (UNIDO) CCS Industrial Sector Roadmap which will build up on existing knowledge and further advance it, providing an in-depth vision and next steps for the next few decades.
Current trends in both energy supply and use are clearly unsustainable. Urgent and broad actions are required to reduce greenhouse gas emissions. Under stringent emission reduction scenario, a wide array of technologies will be necessary. Some of those are ripe and ready to be deployed, whereas others need further development.
CCS represents one of the most promising potential options for moving towards a low-carbon economy. While there has been significant effort in assessing such technology in the context of power generation, little has been done to comprehensively assess CCS in industry where a significant part of the potential for emission reductions is in developing countries.
The overall objective of this project is to advance the global development and uptake of the low-carbon technologies in the industry needed to stabilise greenhouse gas concentrations in the atmosphere at a level that would prevent dangerous anthropogenic interference with the climate system. The project contributes to UNIDO’s mission to support developing countries and economies in transition in their efforts to achieve sustainable industrial development. It aims at promoting sustainable patterns of industrial consumption and production, and more specifically:
� To provide relevant stakeholders with a vision of industrial CCS up to 2050
The CCS Industrial Sector Roadmap will provide a vision for the short and medium term. It will assist paving the way towards low carbon industrial growth in both industrialized and developing countries.
� To strengthen the capacities of various stakeholders with regard to industrial CCS
This project will provide a bridge between CCS experts and CCS stakeholders in developing countries. This collaborative approach will particularly benefit the developing countries with energy intensive industries. Future climate change mitigation agreements will most likely involve the need for developing countries to decouple greenhouse gas emissions from economic growth. It is therefore of utmost importance for those countries to fully participate in efforts related to low carbon technology.
� To inform policymakers and investors about the potential of CCS technology
The roadmap will provide insights that will assist policymakers to evaluate the benefits of CCS technology so as to make informed decisions. It will also provide investors with a much needed assessment of the potential for CCS in industry, an application that has been thus far neglected.
276986/PNC/RGF/01/D 27 August 2010 276986/Final
3
Global Technology Roadmap for CCS in Industry
The Roadmap will focus on 5 sectors, namely:
� High-purity CO2 sources; � Cement; � Iron and steel; � Refineries; and � Biomass-based industrial CO2 sources.
This report focuses solely on the cement sector. Other sectors are being addressed by other consultants.
��� ������� �! � ��
Duncan Barker from Mott MacDonald Limited (MML) has been contracted by UNIDO to assist in the preparation of the sectoral assessment of cement in the context of the Global Technology Roadmap for CCS in Industry. The work has been undertaken in accordance with the agreed scope of work in the contract dated 3 June 2010. The deliverables are as follows: 1. Concept note for the expert group meeting. 2. First draft of the sectoral assessment (cement). 3. Final draft of the sectoral assessment (cement). 4. Final sectoral assessment (cement). 5. Review of roadmap. 6. Input on actions and milestones.
This report represents the fourth deliverable – final sectoral assessment. The report consists of the context, literature review and the state of play with regard to CCS in the cement sector. The first draft of this report was used as a basis of discussion for the two day expert workshop held in Abu Dhabi on 30 June and 1 July 2010. Comments and inputs from attendees at the workshop have been included within this report.
The final draft report was submitted for peer review and comments were received from the following:
� Nathalie Trudeau, IEA � Egmont Otterman, Pretoria Portland Cement Company � Volker Hoenig, ECRA � Howard Klee, WBCSD � Michel Folliet, IFC
Comments from the reviewers were considered and addressed prior to the submission of the final report.
276986/PNC/RGF/01/D 27 August 2010 276986/Final
4
Global Technology Roadmap for CCS in Industry
��� ��� ���" �
This section addresses the following questions:
� What is the amount of emissions in the sector at present and what are the projections (and assumptions for growth/decline) for the future?
� What are the most important regions and countries in terms of value added in the sector, currently and in the future, as well as for energy use and emissions?
��� #$ �����������������$ ��������� ���� ������
It is widely reported that the cement industry is responsible for around 5-6% of current global man-made CO2 emissions from stationary sources (ECRA, 2007). The following sources provide estimates on the global emissions in the cement sector:
� Hendriks et al. (1998) – 587 Tg (0.587 Gt) of CO2 from process carbon emissions and 830 Tg (0.830 Gt) of CO2 from carbon emissions due to energy use resulting in a total emission of 1,126 Tg (1.126 Gt) of CO2 in 1994.
� IEA (2007) – total1 emissions of 1.8 Gt of CO2 in 2005 � IEA (2008) – 1.66 Gt of CO2 direct emissions in 2005 � IEA (2009) – 1.9 Gt of CO2 direct emissions in 2006 with around 0.8 Gt CO2 emitted from fuel
combustion and 1.1 Gt CO2 from process emissions. � IEA/WBCSD (2009) – total emissions of 2,047 million tonnes (2.047 Gt) of CO2 in 2006. � IEA (2010) – 2.0 Gt of CO2 direct emissions in 2007 with around 0.8 Gt CO2 emitted from fuel
combustion and 1.2 Gt CO2 from process emissions.
It is also important to note the typical quantity of CO2 emissions from each cement plant as this can vary markedly from country to country and within each country. The size of a new plant is generally determined by feedstock availability, market opportunities and by considerations of economies of scale. Element Energy (2010) noted that the capacity of European Union Emissions Trading Scheme (EU ETS) eligible cement plants in the UK varies from around 250,000 tonnes clinker per year to 1.8 Mt clinker per year with average annual direct CO2 emissions per installation of 0.55 Mt in 2008. Much larger facilities exist elsewhere in the world. Kilns with a capacity of up to 15,000 tonnes per day are technically possible, although new plants in Europe typically have a capacity between 3,000 and 5,000 tonnes per day (IEA, 2009). Holcim, for example, opened a 4 Mt/y cement plant consisting of a single kiln producing 12,000 tonnes of clinker per day in Ste. Genevieve County, Missouri in 20092. There are a number of production sites in developing countries with significant production capacity. For example, PT Semen Padang has a 5.4 Mt/y integrated plant in West Sumatra, Indonesia consisting of three kilns (ADB, 2007) and Indocement Tunggal Prakarsa (part of the Heidelberg Cement Group) operates nine dry process plants with a total cement capacity of approximately 11.9 Mt/y at its Citeureup site in Citeureup, Bogor, West Java (Indocement, 2010).
_________________________ 1 Total CO2 emissions includes both ‘direct’ CO2 emissions attributable to the process and burning of fossil fuels together with ‘indirect’
CO2 emissions attributable to the use of electricity from the grid. 2 http://www.holcim.us/USA/EN/id/1610655210/mod/2_2/page/editorial.html
2. Current and projected emissions
276986/PNC/RGF/01/D 27 August 2010 276986/Final
5
Global Technology Roadmap for CCS in Industry
��� � ���������� � ��$ �����������������$ ��������� �������� %�% ��
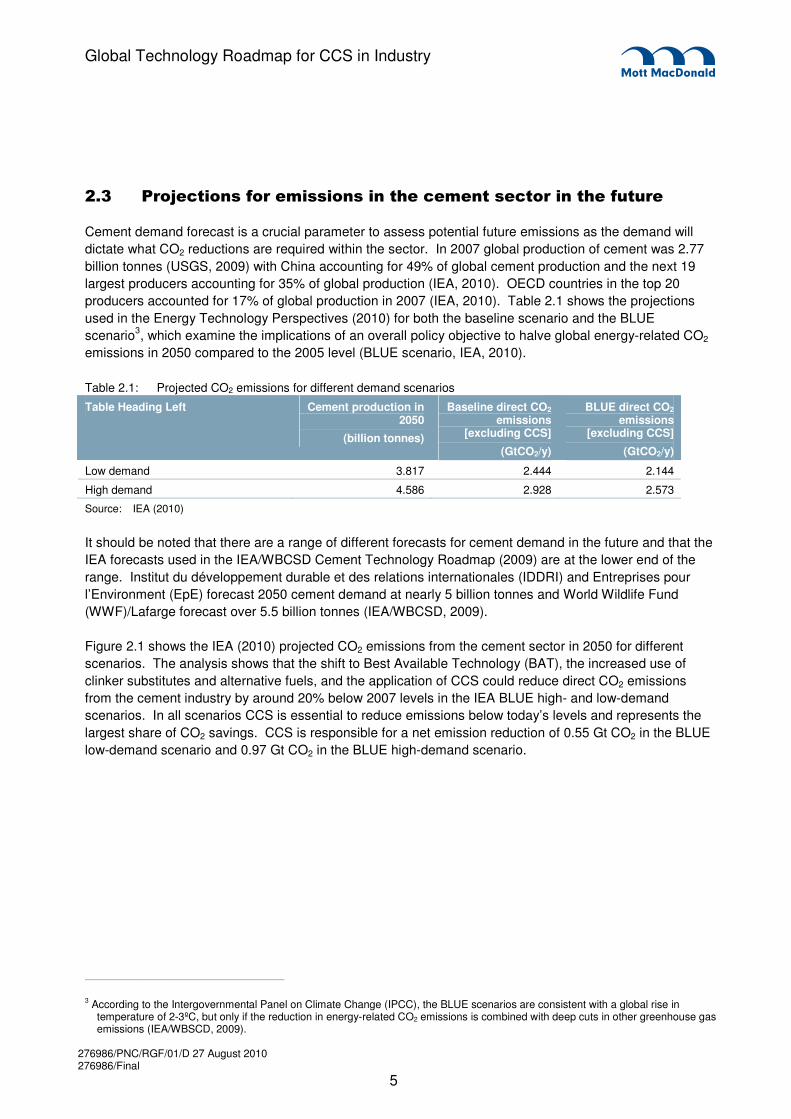
Cement demand forecast is a crucial parameter to assess potential future emissions as the demand will dictate what CO2 reductions are required within the sector. In 2007 global production of cement was 2.77 billion tonnes (USGS, 2009) with China accounting for 49% of global cement production and the next 19 largest producers accounting for 35% of global production (IEA, 2010). OECD countries in the top 20 producers accounted for 17% of global production in 2007 (IEA, 2010). Table 2.1 shows the projections used in the Energy Technology Perspectives (2010) for both the baseline scenario and the BLUE scenario3, which examine the implications of an overall policy objective to halve global energy-related CO2 emissions in 2050 compared to the 2005 level (BLUE scenario, IEA, 2010).
Table 2.1: Projected CO2 emissions for different demand scenarios
Table Heading Left Cement production in 2050
(billion tonnes)
Baseline direct CO2 emissions
[excluding CCS]
(GtCO2/y)
BLUE direct CO2 emissions
[excluding CCS]
(GtCO2/y)
Low demand 3.817 2.444 2.144
High demand 4.586 2.928 2.573
Source: IEA (2010)
It should be noted that there are a range of different forecasts for cement demand in the future and that the IEA forecasts used in the IEA/WBCSD Cement Technology Roadmap (2009) are at the lower end of the range. Institut du développement durable et des relations internationales (IDDRI) and Entreprises pour l’Environment (EpE) forecast 2050 cement demand at nearly 5 billion tonnes and World Wildlife Fund (WWF)/Lafarge forecast over 5.5 billion tonnes (IEA/WBCSD, 2009).
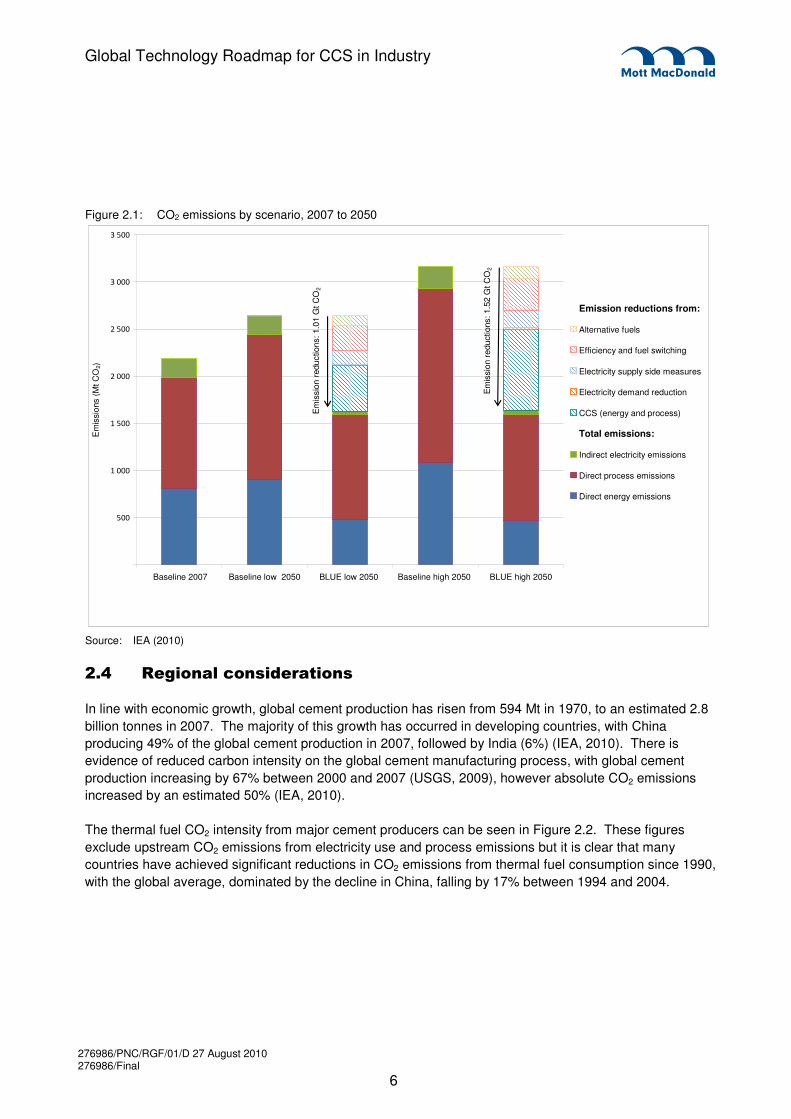
Figure 2.1 shows the IEA (2010) projected CO2 emissions from the cement sector in 2050 for different scenarios. The analysis shows that the shift to Best Available Technology (BAT), the increased use of clinker substitutes and alternative fuels, and the application of CCS could reduce direct CO2 emissions from the cement industry by around 20% below 2007 levels in the IEA BLUE high- and low-demand scenarios. In all scenarios CCS is essential to reduce emissions below today’s levels and represents the largest share of CO2 savings. CCS is responsible for a net emission reduction of 0.55 Gt CO2 in the BLUE low-demand scenario and 0.97 Gt CO2 in the BLUE high-demand scenario.
_________________________ 3 According to the Intergovernmental Panel on Climate Change (IPCC), the BLUE scenarios are consistent with a global rise in
temperature of 2-3ºC, but only if the reduction in energy-related CO2 emissions is combined with deep cuts in other greenhouse gas emissions (IEA/WBSCD, 2009).
276986/PNC/RGF/01/D 27 August 2010 276986/Final
6
Global Technology Roadmap for CCS in Industry
Figure 2.1: CO2 emissions by scenario, 2007 to 2050
����
�����
�����
�����
�����
�����
�����
Baseline 2007 Baseline low 2050 BLUE low 2050 Baseline high 2050 BLUE high 2050
Em
issi
ons
(Mt C
O2)
Emission reductions from:
Alternative fuels
Efficiency and fuel switching
Electricity supply side measures
Electricity demand reduction
CCS (energy and process)
Total emissions:
Indirect electricity emissions
Direct process emissions
Direct energy emissions
Em
issi
on r
educ
tions
: 1.0
1 G
t CO
2
Em
issi
on re
duct
ions
: 1.5
2 G
t CO
2
Source: IEA (2010)
��& �������������'� ������
In line with economic growth, global cement production has risen from 594 Mt in 1970, to an estimated 2.8 billion tonnes in 2007. The majority of this growth has occurred in developing countries, with China producing 49% of the global cement production in 2007, followed by India (6%) (IEA, 2010). There is evidence of reduced carbon intensity on the global cement manufacturing process, with global cement production increasing by 67% between 2000 and 2007 (USGS, 2009), however absolute CO2 emissions increased by an estimated 50% (IEA, 2010).
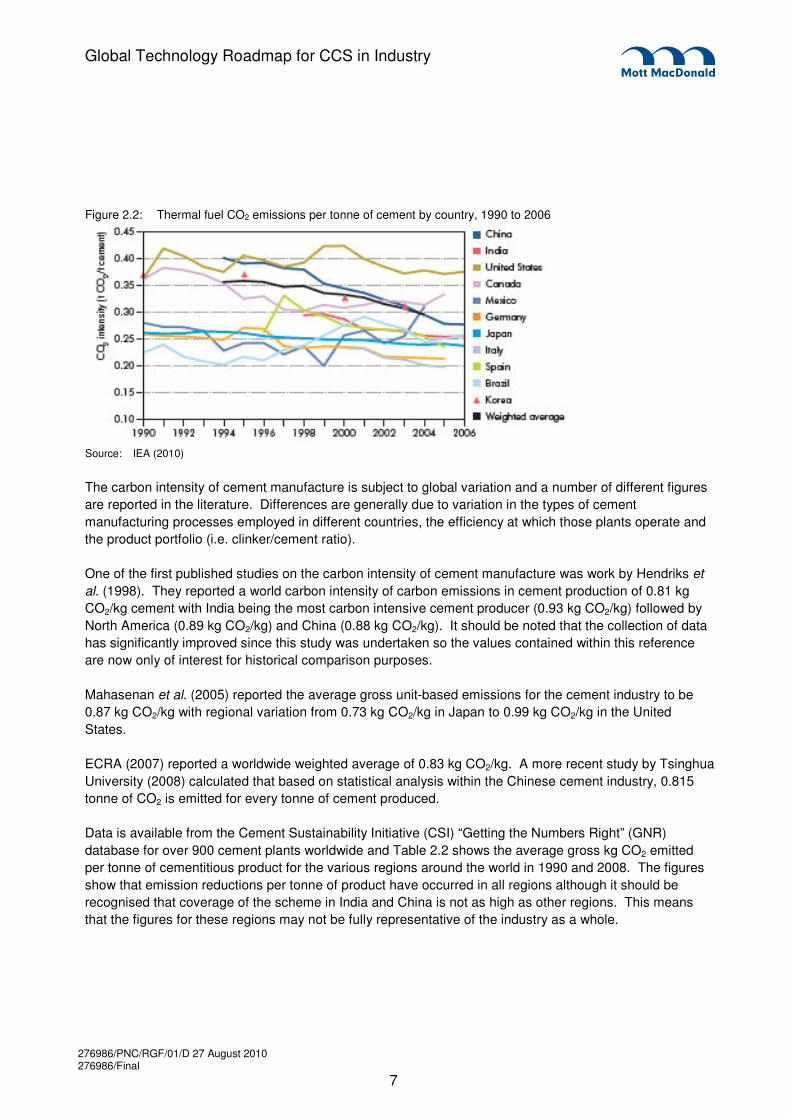
The thermal fuel CO2 intensity from major cement producers can be seen in Figure 2.2. These figures exclude upstream CO2 emissions from electricity use and process emissions but it is clear that many countries have achieved significant reductions in CO2 emissions from thermal fuel consumption since 1990, with the global average, dominated by the decline in China, falling by 17% between 1994 and 2004.
276986/PNC/RGF/01/D 27 August 2010 276986/Final
7
Global Technology Roadmap for CCS in Industry
Figure 2.2: Thermal fuel CO2 emissions per tonne of cement by country, 1990 to 2006
Source: IEA (2010)
The carbon intensity of cement manufacture is subject to global variation and a number of different figures are reported in the literature. Differences are generally due to variation in the types of cement manufacturing processes employed in different countries, the efficiency at which those plants operate and the product portfolio (i.e. clinker/cement ratio).
One of the first published studies on the carbon intensity of cement manufacture was work by Hendriks et al. (1998). They reported a world carbon intensity of carbon emissions in cement production of 0.81 kg CO2/kg cement with India being the most carbon intensive cement producer (0.93 kg CO2/kg) followed by North America (0.89 kg CO2/kg) and China (0.88 kg CO2/kg). It should be noted that the collection of data has significantly improved since this study was undertaken so the values contained within this reference are now only of interest for historical comparison purposes.
Mahasenan et al. (2005) reported the average gross unit-based emissions for the cement industry to be 0.87 kg CO2/kg with regional variation from 0.73 kg CO2/kg in Japan to 0.99 kg CO2/kg in the United States.
ECRA (2007) reported a worldwide weighted average of 0.83 kg CO2/kg. A more recent study by Tsinghua University (2008) calculated that based on statistical analysis within the Chinese cement industry, 0.815 tonne of CO2 is emitted for every tonne of cement produced.
Data is available from the Cement Sustainability Initiative (CSI) “Getting the Numbers Right” (GNR) database for over 900 cement plants worldwide and Table 2.2 shows the average gross kg CO2 emitted per tonne of cementitious product for the various regions around the world in 1990 and 2008. The figures show that emission reductions per tonne of product have occurred in all regions although it should be recognised that coverage of the scheme in India and China is not as high as other regions. This means that the figures for these regions may not be fully representative of the industry as a whole.
276986/PNC/RGF/01/D 27 August 2010 276986/Final
8
Global Technology Roadmap for CCS in Industry
Table 2.2: Average gross CO2 emissions per tonne of cementitious product (1990-2008)
Region 1990 (kg CO2 /tonne cementitious product)
2008 (kg CO2 /tonne cementitious product)
Africa and Middle East 807 650
Asia ex. China, India CIS and Japan 802 713
Brazil 698 579
Central America 706 651
China 816 638
CIS 775 774
Europe 717 644
India 807 613
Japan, Australia and NZ 729 692
North America 913 789
South America ex. Brazil 693 567
Source: Global Cement Database on CO2 and Energy Information, WBCSD
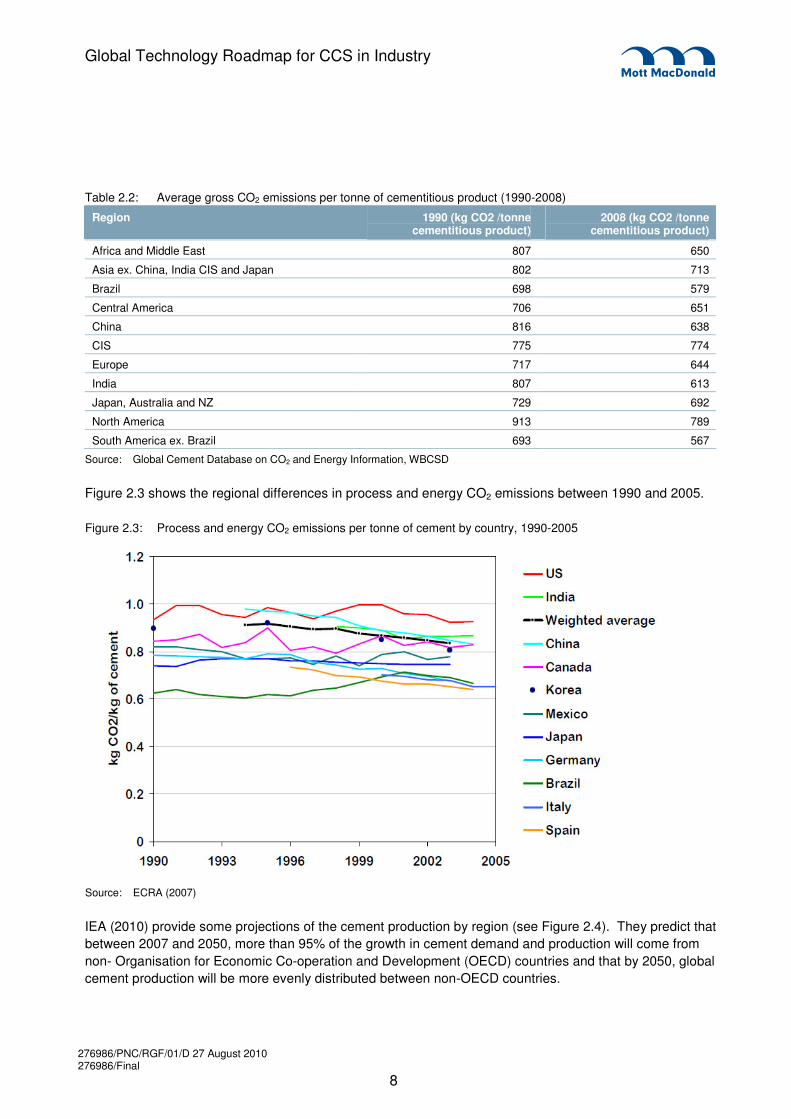
Figure 2.3 shows the regional differences in process and energy CO2 emissions between 1990 and 2005.
Figure 2.3: Process and energy CO2 emissions per tonne of cement by country, 1990-2005
Source: ECRA (2007)
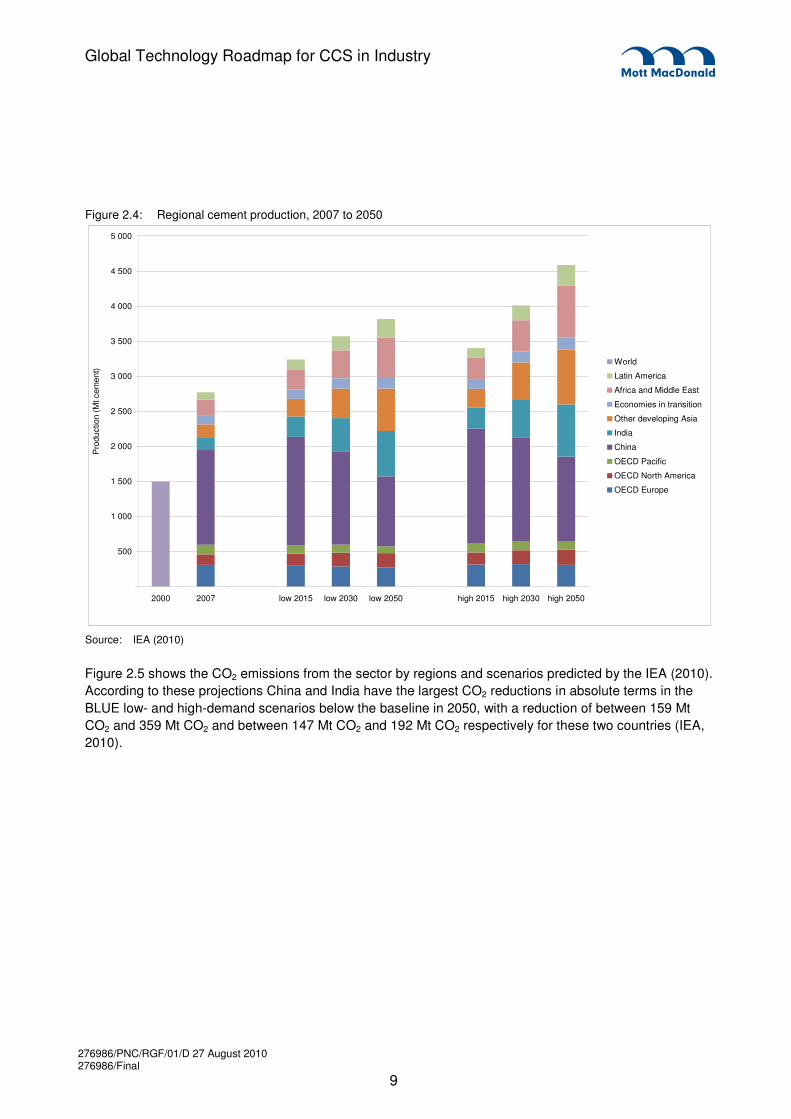
IEA (2010) provide some projections of the cement production by region (see Figure 2.4). They predict that between 2007 and 2050, more than 95% of the growth in cement demand and production will come from non- Organisation for Economic Co-operation and Development (OECD) countries and that by 2050, global cement production will be more evenly distributed between non-OECD countries.
276986/PNC/RGF/01/D 27 August 2010 276986/Final
9
Global Technology Roadmap for CCS in Industry
Figure 2.4: Regional cement production, 2007 to 2050
500
1 000
1 500
2 000
2 500
3 000
3 500
4 000
4 500
5 000
2000 2007 low 2015 low 2030 low 2050 high 2015 high 2030 high 2050
Pro
duct
ion
(Mt c
emen
t)
World
Latin America
Africa and Middle East
Economies in transition
Other developing Asia
India
China
OECD Pacific
OECD North America
OECD Europe
Source: IEA (2010)
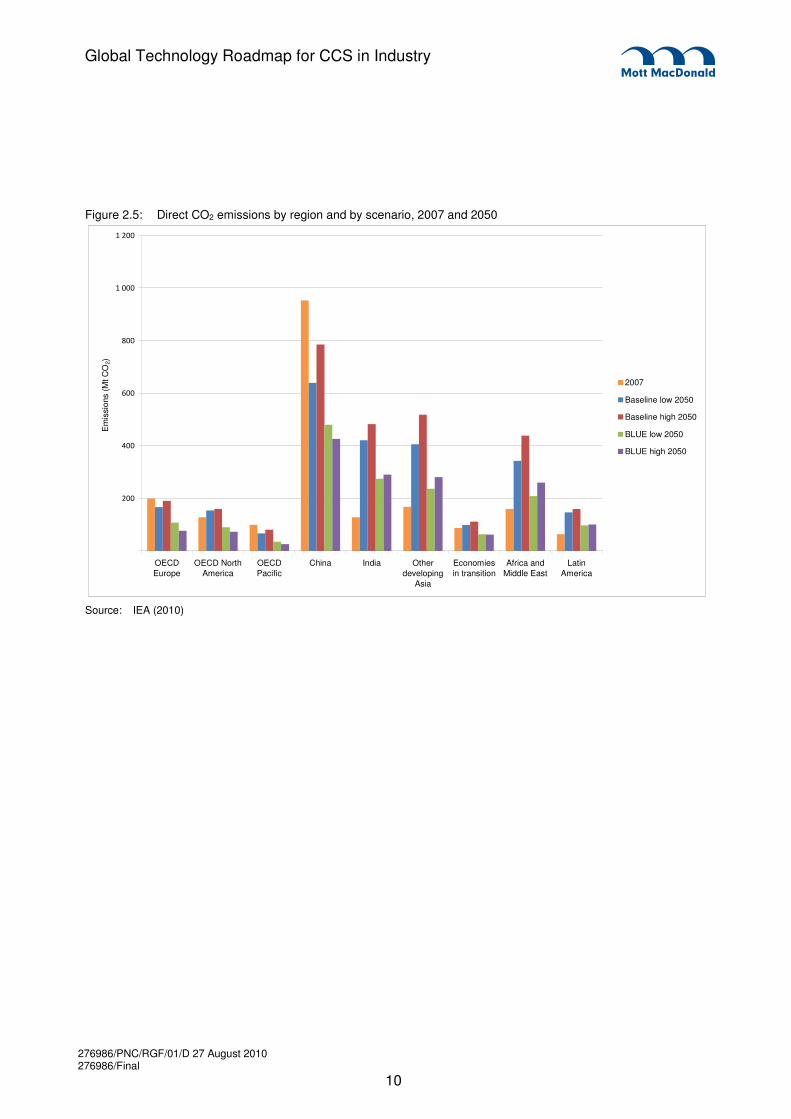
Figure 2.5 shows the CO2 emissions from the sector by regions and scenarios predicted by the IEA (2010). According to these projections China and India have the largest CO2 reductions in absolute terms in the BLUE low- and high-demand scenarios below the baseline in 2050, with a reduction of between 159 Mt CO2 and 359 Mt CO2 and between 147 Mt CO2 and 192 Mt CO2 respectively for these two countries (IEA, 2010).
276986/PNC/RGF/01/D 27 August 2010 276986/Final
10
Global Technology Roadmap for CCS in Industry
Figure 2.5: Direct CO2 emissions by region and by scenario, 2007 and 2050
����
����
����
���
�����
�����
OECDEurope
OECD NorthAmerica
OECDPacific
China India Otherdeveloping
Asia
Economiesin transition
Africa andMiddle East
LatinAmerica
Em
issi
ons
(Mt C
O2)
2007
Baseline low 2050
Baseline high 2050
BLUE low 2050
BLUE high 2050
Source: IEA (2010)
276986/PNC/RGF/01/D 27 August 2010 276986/Final
11
Global Technology Roadmap for CCS in Industry
��� ��� ���" �
The CCS aspects of the cement industry are assessed in the following section. Also the answer to the following question is addressed:
� What are the mitigation options in general and the CO2 capture options specifically in the sector (including integration into current and new processes)?
��� ( �����������������
The technology mitigation options for the cement industry are outlined in a set of 38 technology papers developed by the European Cement Research Academy (ECRA) for the Cement Technology Roadmap (IEA/WBSCD, 2009). The report (ECRA, 2009a) summarises independent research efforts by ECRA to identify, describe and evaluate technologies which may contribute to increase energy efficiency and to reduce greenhouse gas emissions from global cement production today as well as in the medium and long-term future. The papers focus on the following four distinct “reduction levers” available to the cement industry: 1. Thermal and electric efficiency – deployment of existing state-of-the-art technologies in new cement
plants, and retrofit of energy efficiency equipment where economically viable e.g. waste heat recovery schemes for generating electrical power.
2. Alternative fuel use – use of less carbon-intensive fossil fuels and more alternative (fossil) fuels and biomass fuels in the cement production process.
3. Clinker substitution – substituting carbon-intensive clinker, an intermediate in cement manufacture, with other, lower carbon, materials with cementitious properties.
4. Carbon capture and storage – capturing CO2 before it is released into the atmosphere and storing it securely so it is not released in the future.
In terms of carbon capture technologies for cement production the two key technologies are: 1. Post-combustion technologies; and 2. Oxyfuel technology.
These are explained in detail in a number of reports (e.g. ECRA (2007), IEA GHG (2008)) and the sections below summarise the main findings.
Biological capture of CO2 with algae is also discussed separately.
��� ����)��$ �%�����������������������
These are ‘end-of-pipe’ options that would not require fundamental changes in the clinker-burning process and so could be available for new kilns and in particular for retrofits to existing plants. The most promising technology options at present include:
� Chemical absorption using amines, ammonia and other chemicals. Chemical absorption with
alkanolamines is considered to be a proven technology and has an extensive history in the chemical and gas industries although at a much smaller scale than would be necessary in the cement industry (IEA, 2009).
3. Technical overview of capture options
276986/PNC/RGF/01/D 27 August 2010 276986/Final
12
Global Technology Roadmap for CCS in Industry
� Membrane technologies. However, this technology is not expected to be ready for commercial application by or around 2020 (LEK, 2009).
� Carbonate looping – an adsorption process in which calcium oxide is put into contact with the combustion gas containing CO2 to produce calcium carbonate. This is a technology currently being assessed by the cement industry as a potential retrofit option for existing kilns and in the development of new oxy-firing kilns (IEA/WBSCD, 2009).
Other post-combustion technologies such as physical absorption or mineral adsorption are at a much earlier stage of development but may become commercial within the timeframe of the roadmap. Some technologies under development include:
� Calera4 who is developing a process whereby flue gas is contacted with seawater to produce a
metastable calcium and magnesium carbonate and bicarbonate minerals that can be used to produce a replacement material for Portland cement.
� Skyonic Skymine5 who is also developing a process to remove CO2 from the exhaust steam of industrial processes to generate solid carbonates and bicarbonates that have a market value.
� GreenMag Group6 of Australia who is also developing a CO2 mineral carbonation technology to capture the CO2 from flue gas to produce magnesium carbonate which could be used as a component of building materials.
These technologies offer the opportunity of solid storage of CO2 as opposed to geological storage of gaseous or liquid CO2.
A simple block diagram showing how post-combustion CCS could be applied at a cement plant is shown in Figure 3.1.
_________________________ 4 www.calera.com 5 http://skyonic.com/skymine/ 6 http://www.greenmaggroup.com/index.htm
276986/PNC/RGF/01/D 27 August 2010 276986/Final
13
Global Technology Roadmap for CCS in Industry
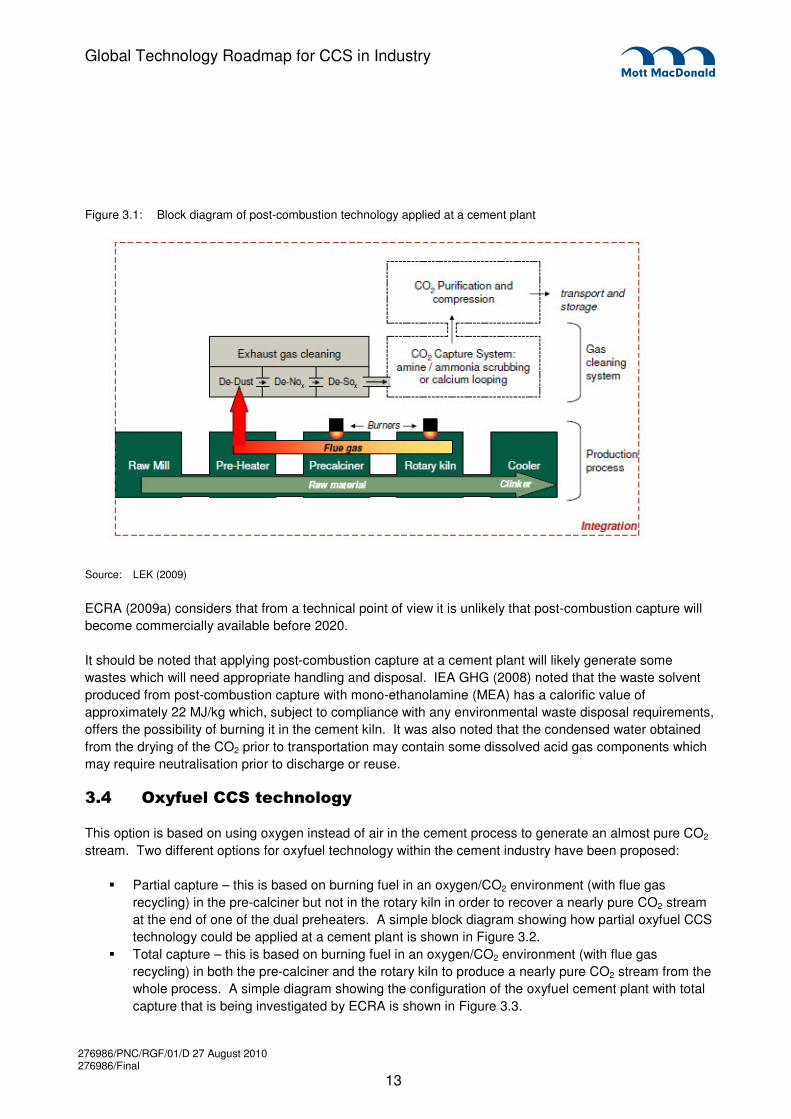
Figure 3.1: Block diagram of post-combustion technology applied at a cement plant
Source: LEK (2009)
ECRA (2009a) considers that from a technical point of view it is unlikely that post-combustion capture will become commercially available before 2020.
It should be noted that applying post-combustion capture at a cement plant will likely generate some wastes which will need appropriate handling and disposal. IEA GHG (2008) noted that the waste solvent produced from post-combustion capture with mono-ethanolamine (MEA) has a calorific value of approximately 22 MJ/kg which, subject to compliance with any environmental waste disposal requirements, offers the possibility of burning it in the cement kiln. It was also noted that the condensed water obtained from the drying of the CO2 prior to transportation may contain some dissolved acid gas components which may require neutralisation prior to discharge or reuse.
��& ��* %����������������*�
This option is based on using oxygen instead of air in the cement process to generate an almost pure CO2 stream. Two different options for oxyfuel technology within the cement industry have been proposed:
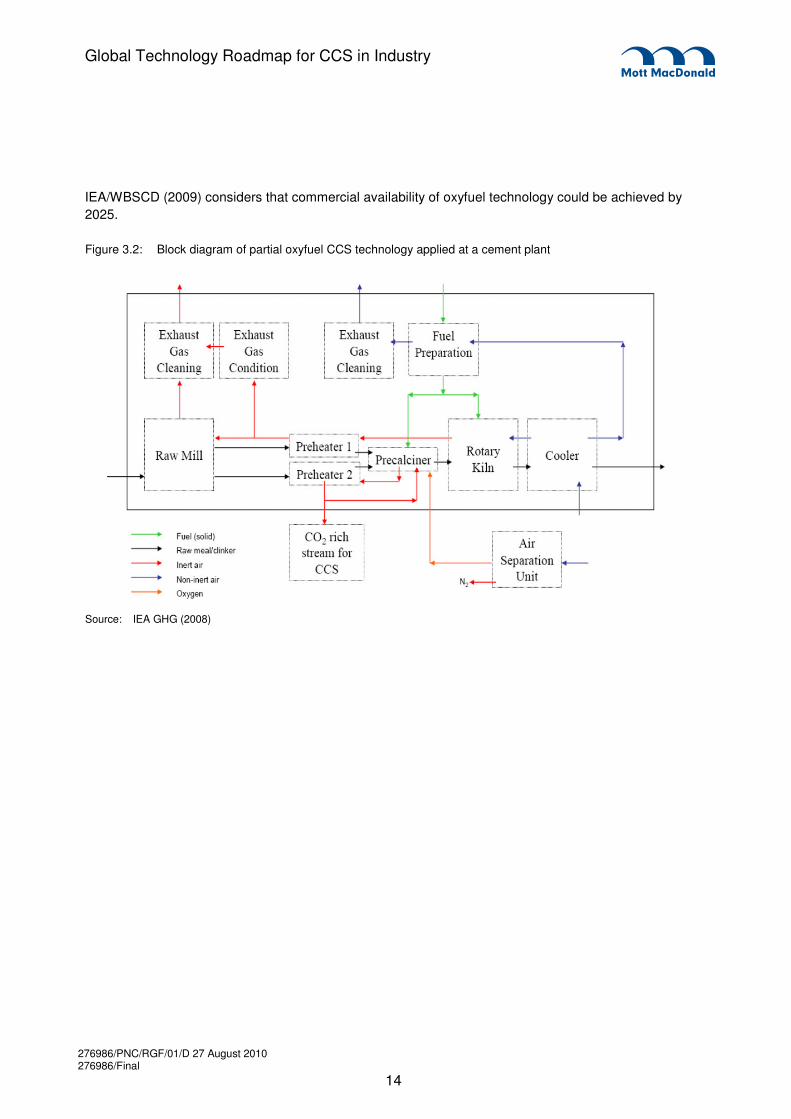
� Partial capture – this is based on burning fuel in an oxygen/CO2 environment (with flue gas recycling) in the pre-calciner but not in the rotary kiln in order to recover a nearly pure CO2 stream at the end of one of the dual preheaters. A simple block diagram showing how partial oxyfuel CCS technology could be applied at a cement plant is shown in Figure 3.2.
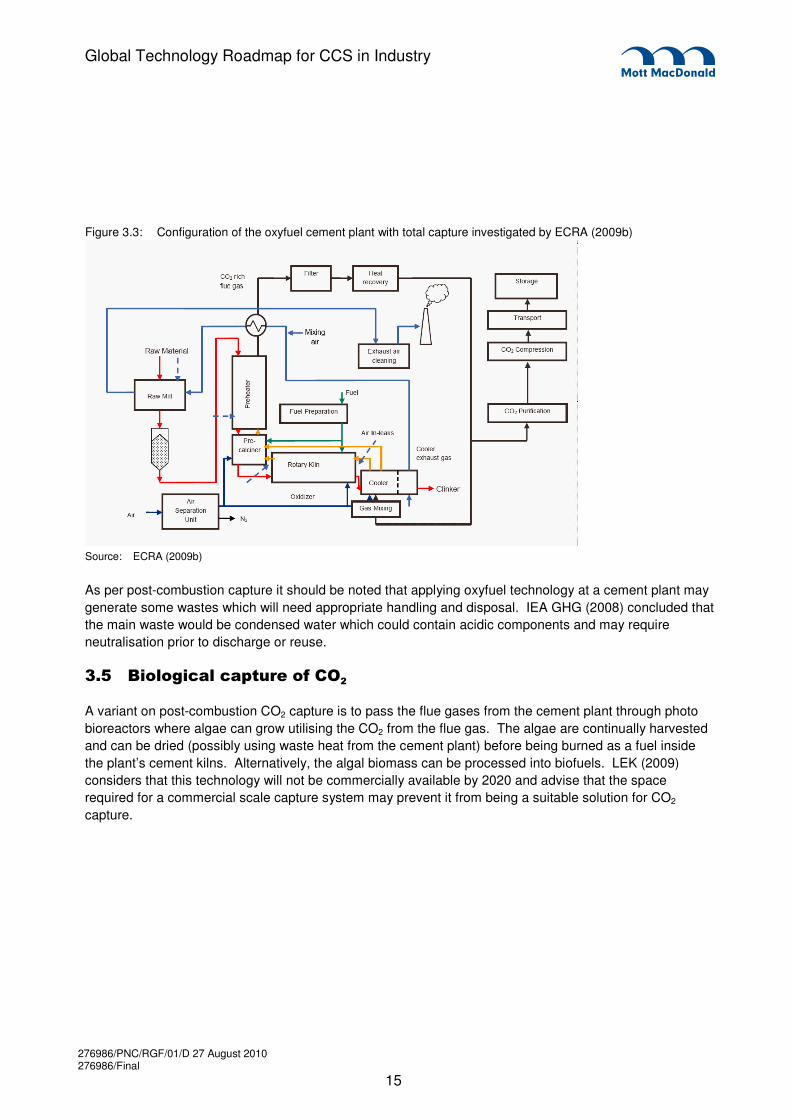
� Total capture – this is based on burning fuel in an oxygen/CO2 environment (with flue gas recycling) in both the pre-calciner and the rotary kiln to produce a nearly pure CO2 stream from the whole process. A simple diagram showing the configuration of the oxyfuel cement plant with total capture that is being investigated by ECRA is shown in Figure 3.3.
276986/PNC/RGF/01/D 27 August 2010 276986/Final
14
Global Technology Roadmap for CCS in Industry
IEA/WBSCD (2009) considers that commercial availability of oxyfuel technology could be achieved by 2025.
Figure 3.2: Block diagram of partial oxyfuel CCS technology applied at a cement plant
Source: IEA GHG (2008)
276986/PNC/RGF/01/D 27 August 2010 276986/Final
15
Global Technology Roadmap for CCS in Industry
Figure 3.3: Configuration of the oxyfuel cement plant with total capture investigated by ECRA (2009b)
Source: ECRA (2009b)
As per post-combustion capture it should be noted that applying oxyfuel technology at a cement plant may generate some wastes which will need appropriate handling and disposal. IEA GHG (2008) concluded that the main waste would be condensed water which could contain acidic components and may require neutralisation prior to discharge or reuse.
��+ ,������������% ��� �����
A variant on post-combustion CO2 capture is to pass the flue gases from the cement plant through photo bioreactors where algae can grow utilising the CO2 from the flue gas. The algae are continually harvested and can be dried (possibly using waste heat from the cement plant) before being burned as a fuel inside the plant’s cement kilns. Alternatively, the algal biomass can be processed into biofuels. LEK (2009) considers that this technology will not be commercially available by 2020 and advise that the space required for a commercial scale capture system may prevent it from being a suitable solution for CO2 capture.
276986/PNC/RGF/01/D 27 August 2010 276986/Final
16
Global Technology Roadmap for CCS in Industry
&�� ��� ���" �
This section addresses the following questions:
� What would be the consequences of CO2 capture for the energy requirements in the process and in the sector?
� What would be the consequences of CO2 capture for upstream emissions, such as those relating to coal mining or transport?
� What are the potential CO2 emission reductions in the sector due to CCS?
&�� �����-%������� ��������% ����� �*� �-%� �$ �����
It is generally accepted that although CCS is a potentially key technology for the reduction of CO2 emissions it leads to a large increase in thermal and electrical energy consumption at the capture site. For example, the electrical power consumption has been estimated to increase by 50-120% at plant level due to requirements for the CO2 capture process, CO2 purification, CO2 compression etc (IEA/WBSCD, 2009).
ECRA (2009a) provide some estimates of the impact on energy consumption for the application of CCS within the cement sector. These are summarised in Table 4.1. It should be noted that based on GNR data for the current state-of-the-art technology (dry process with precalcining technology) the weighted average of the specific thermal energy consumption in 2006 was 3,382 MJ/tonne clinker (ECRA 2009a). GNR data also indicated that the global weighted average of the specific electrical energy consumption was 111 kWh/tonne cement in 2006 (ECRA 2009a). IEA (2009) reports that BAT for electricity consumption in the cement industry is in the range of 95 kWh/tonne to 100 kWh/tonne cement.
Table 4.1: Impact on energy consumption for different CCS technologies in the cement sector
CCS Technology Thermal
[MJ/tonne clinker]
Electric
[kWh/tonne clinker]
Oxyfuel Increase of 90-100 Increase of 110-115
Post-combustion based on absorption Increase of 1000-3500 Increase of 50-90
Post-combustion based on membrane n/a n/a
Source: ECRA (2009a)
&�� �����-%������� ��������% �� � �%��� �$ ��$ ��������
The topic of the consequences of CO2 capture at cement plants for upstream emissions does not appear to have been investigated in the literature. The consequences on operations such as quarrying or mining for the main raw materials, like limestone, chalk marl and shale or clay, are unlikely to be significant. However, if the location of cement plants with CCS becomes dominating by proximity to the CO2 storage site rather than to the source of limestone (as is the case at present) then there is a possibility that the CO2 emissions associated with the transport of raw materials to the cement plant will increase. However, the extent of the increase would be site specific.
&�& ��������������$ ������� �'%������������������� �'%���������
ECRA (2009a) provided some estimates of the potential CO2 reduction potentials for different CCS technologies within the cement sector. These are summarised in Table 4.2 and are in reasonable alignment with the CO2 reductions reported by IEA GHG (2008).
4. CO2 capture energy requirements and emission reductions
276986/PNC/RGF/01/D 27 August 2010 276986/Final
17
Global Technology Roadmap for CCS in Industry
GNR data for 2008 (CSI, 2010) reports a global average gross7 CO2 emission of 862 kgCO2/tonne clinker (excluding CO2 from electric power) and a global average net8 CO2 emissions of 838 kgCO2/tonne clinker (excluding CO2 from electric power) hence the data shows that oxyfuel technology has the greatest potential for reducing emissions from the process.
Table 4.2: Potential CO2 reduction for different CCS technologies in the cement sector
CCS Technology Direct CO2 reduction potential
(kg CO2/tonne clinker)
Indirect CO2 reduction potential
(kg CO2/tonne clinker)
Oxyfuel Decrease of 550-870 Increase of 60-80
Post-combustion based on absorption Decrease of up to 740 Increase of 6-25
Post-combustion based on membrane Decrease of > 700 n/a
Source: ECRA (2009a)
_________________________ 7 Gross CO2 emissions are direct CO2 emissions (excluding on-site electricity production) minus emissions from biomass fuel sources. 8 Net CO2 emissions are gross CO2 emissions minus emissions from alternative fossil fuels.
276986/PNC/RGF/01/D 27 August 2010 276986/Final
18
Global Technology Roadmap for CCS in Industry
+�� ��� ���" �
This section addresses the following questions:
� What are the ongoing research programmes within the sector? � Are the R&D efforts privately or publicly funded? � What are the current experiments and (if applicable) larger-scale demonstration of CO2 capture in
the sector? � What role would CCS play in the sector and what are the main assumptions behind those
projections?
+�� ���� ��� ���� �� $ $ ������������$ ��������� �
Research on CCS within the cement sector is still at an early stage. Some key research activities within the sector are summarised below:
ECRA CCS Project
ECRA’s Technical Advisory Board and the CCS Steering Group set up the structure for a long-term research project on CCS, which comprises the following five phases:
� Phase I: Literature and scoping study (January – June 2007) – finalised
� Phase II: Study about technical and financial aspects of CCS projects, concentrating on oxyfuel and post-combustion technology (summer 2007 – summer 2009) – finalised
� Phase III: Laboratory-scale / small-scale research activities (autumn 2009 – summer 2011) – it is understood that this programme of work has commenced.
� Phase IV: Pilot-scale research activities (timeframe: 2-3 years)
� Phase V: Demonstration plant (timeframe: 3-5 years)
ECRA is funded by its members which include companies operating cement plants, national cement associations and international cement associations. The ECRA CCS project is co-funded by equipment suppliers and a gas producer.
IEA GHG / British Cement Association (BCA) (now Mineral Products Association (MPA))
On behalf of the IEA GHG and the BCA (now MPA) the consultant Mott MacDonald undertook a study (IEA GHG, 2008) about CO2 capture in the cement industry. The IEA GHG is an international collaborative research programme established in 1991 and funding for the programme is provided by the members which include 19 member countries, the European Commission, the Organisation of the Petroleum Exporting Countries (OPEC) and 21 multi-national sponsors.
5. Current activities and projections on CCS role
276986/PNC/RGF/01/D 27 August 2010 276986/Final
19
Global Technology Roadmap for CCS in Industry
Cooperative Research Centre for Greenhouse Gas Technologies (CO2CRC)
The CO2CRC is an unincorporated joint venture comprising participants from Australian and global industry, universities and other research bodies from Australia and New Zealand, Australian Commonwealth, State and international government agencies. Its resources come from the Federal Government’s Cooperative Research Centres Programme, other Federal and State Government programs, CO2CRC participants, and wider industry. The CO2CRC has shown interest in studying the various options for CO2 capture from the clinker burning process as the cement industry is one of the major CO2 emitters in Australia (ECRA, 2009b).
World Business Council for Sustainable Development (WBSCD) / Cement Sustainability Initiative (CSI)
A study was commissioned by the CSI, a member-led program of the WBCSD (ECRA, 2009a) to identify, describe and evaluate technologies which may contribute to increase energy efficiency and to reduce greenhouse gas emissions from global cement production. This work fed into the development of the Cement Technology Roadmap 2009 (IEA & WBCSD, 2009).
Cansolv
J. Sarlis and D. Shaw presented the Cansolv activities about amine scrubbing at the 11th Workshop of the Post-Combustion Network in Vienna (Sarlis, 2008). According to the presentation, in January and February 2008 a trial was carried out at a cement kiln of California Portland during which 90% removal rate for CO2 was achieved. However, there is no more information available about the detailed results of the trial and it is understood that the results of the trial are confidential.
German Combustion Research Association (DVV) / German Cement Works Association (VDZ)
According to ECRA (2009b) DVV and VDZ have submitted a joint application for a research project about “carbonate looping” to the German Federation of Industrial Research Associations. VDZ’s research task is to investigate the utilisation of deactivated absorbents in the clinker burning process.
The Earth Institute at Columbia University
Numerous papers and reports have been produced by Frank Zeman on the reduced emission oxygen (REO) kiln. This work was undertaken at The Earth Institute at Columbia University, New York although the author is now at the New York Institute of Technology (NYIT).
Institute of Energy Systems
A research programme, funded by industry, will take place between February 2009 and January 2013 to investigate the potential of CCS Technologies for reducing CO2 emissions in cement production. The work will include process analysis and model generation, development of a cement-oxyfuel concept, evaluation of the newly developed concept for CO2-free cement production and comparison of the oxyfuel process for cement production with post-combustion with chemical stripping. The research is being led by Professor Dr-Ing Alfons Kather.
276986/PNC/RGF/01/D 27 August 2010 276986/Final
20
Global Technology Roadmap for CCS in Industry
Pond Biofuels
It is reported9 that a pilot scale project to demonstrate biological capture of CO2 from the flue gas of a St Marys Group cement plant, near Waterloo, Canada has been ongoing since the fall of 2009. The $4 million facility occupies 1,500 square feet and uses algal bioreactors that are designed to achieve the right balance of light and CO2.
Aurantia-GreenFuel project at Holcim
In December 2007 at the Holcim cement plant near Jerez, Spain GreenFuel Technologies Corporation and Aurantia initiated a project to demonstrate that industrial CO2 emissions could be used to grow algae for use in high value feeds, foods and fuels. Following an initial field assessment the second phase of the project commenced with the successful inoculation and subsequent harvest of a 100 m2 prototype vertical thin-film algae-solar bioreactor. Unfortunately, the next phase of the project announced in October 200810 which involved the construction of a 1,000 m2 algae greenhouse and harvesting facilities adjacent to the cement plant did not proceed as GreenFuel Technologies Corporation ceased trading.
Other work of interest that has been published includes:
� Mahasenan et al. (2005) on the role of CCS in reducing emissions from cement plants in North America. This was undertaken by the Pacific Northwest National Laboratory (operated by Batelle).
� Hegerland et al. (2006) on a concept study for capturing CO2 at one of the existing cement plants of Norcem, a member of the Heidelberg Cement Group. This was undertaken by Project Invest Energy, GassTEK and Norcem.
� Bosoaga et al. (2009) on a novel concept for capturing CO2 from cement industry: calcium looping. This work was part of “C3 Capture - Calcium Cycle For Efficient And Low Cost CO2 Capture In Fluidised Bed Systems” EU FP6 Framework project funded by the European Commission. The work was undertaken by ENDESA, Alstom, CANMET Canada, University of Stuttgart, Cranfield University, Consejo Superior De Investigaciones Cientificas (CSIC) and CEMEX and is likely to move to pilot scale demonstration. Starting from 2008, CEMEX co-sponsors a Ph.D. thesis on the calcium looping technology at Imperial College London.
The author of this report is also aware that cement equipment manufacturers are already undertaking some research and development into the oxy-fuel process.
+�� . ��)�����'�$ ���� ������ �������
It is understood that pilot projects are being discussed within the industry but there have been few public announcements.
It was reported in March 2010 that Cemex USA was awarded US$1.1 million in funding from the US Department of Enegy (DOE) to demonstrate a dry sorbent CO2 capture technology at one of its cement
_________________________ 9 http://www.thestar.com/business/article/781426--co2-eating-algae-turns-cement-maker-green 10 http://www.pollutiononline.com/article.mvc/GreenFuel-Algae-CO2-Recycling-Project-With-
0001?atc%7Ec=771+s=773+r=001+l=a&VNETCOOKIE=NO
276986/PNC/RGF/01/D 27 August 2010 276986/Final
21
Global Technology Roadmap for CCS in Industry
plants in the US. According to press reports the plant is expected to store up to 1 million tonne of CO2 per year and Cemex will fund 20% of Phase 1 of the project which will last around 7 months. At the end of this period it is understood that the project will undergo a competitive analysis for additional funding for design, construction and operation.
Skyonic Corporation were awarded a $25 million grant from the US DOE in July 201011 to develop a project to capture CO2 using its mineralisation technology from the flue gases of a Capital Aggregates Ltd cement manufacturing plant in San Antonio, Texas. According to a press release issued by Skyonic (2010) the plant is targeted to capture 75,000 t/y of CO2 emitted by the cement plant. Construction of the plant is due to commence in the fall of 2010 with the plant being fully operational in the first half of 2012.
Other potential large scale projects of interest include:
� ECRA’s proposed Phase III, IV and V CCS project.
� Lafarge announced in April 2009 (Reuters 2009) that it was ‘hoping to take part in Britain’s future CCS infrastructure’ but no details on a CCS project in Europe were provided.
� Cansolv’s trial in California as discussed in section 5.2 (scale unknown).
It should be noted that a number of post-combustion technology providers (e.g. Cansolv, HTC Pure Energy Canada, Aker Clean Carbon) have mobile test rigs or modular equipments that could in principal be taken to cement plants to test the process with flue gas from the cement process. ECRA (2009b) estimates that a complete pilot project in the cement industry would cost between €6 and €12 million.
It should also be noted that EU Directive 2009/29/EC, which improves and extends the greenhouse gas emission allowance trading scheme of the Community, will reserve up to 300 million allowances (EUAs) from the new entrants' reserve (NER 300) until 31 December 2015 to help stimulate the construction and operation of CCS demonstration projects and demonstration projects of innovative renewable energy technologies. The programme will be launched around September 2010 and the objective of the European Commission is to support at least 8 CCS projects (covering a wide range of capture technologies and storage options) and 34 innovative renewable energy projects. It is understood that a demonstration project at a cement kiln with 500 kt/y stored CO2 would be eligible for funding but it is not yet known if any cement producers are interested in submitting an application.
+�& �������������"�%�'���*����������$ ��������� �
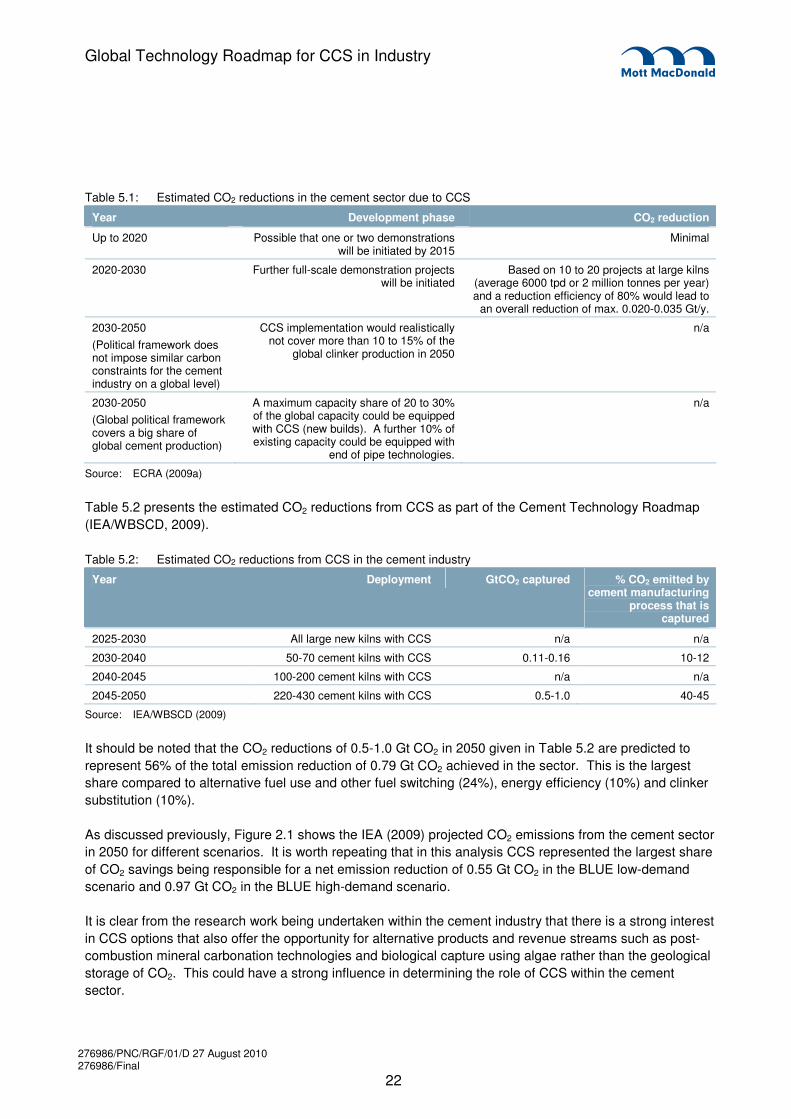
The emission reductions that can be achieved by the application of CCS to the cement sector clearly depend on a number of factors including technical viability, political willingness and social acceptance. ECRA (2009a) consider that from a technical perspective carbon capture technologies would probably not be available for the cement industry before 2020. Their estimates of the potential CCS emission reductions in the cement industry between now and 2050 are summarised in Table 5.1.
_________________________ 11 http://www.energy.gov/news/9247.htm
276986/PNC/RGF/01/D 27 August 2010 276986/Final
22
Global Technology Roadmap for CCS in Industry
Table 5.1: Estimated CO2 reductions in the cement sector due to CCS
Year Development phase CO2 reduction
Up to 2020 Possible that one or two demonstrations will be initiated by 2015
Minimal
2020-2030 Further full-scale demonstration projects will be initiated
Based on 10 to 20 projects at large kilns (average 6000 tpd or 2 million tonnes per year) and a reduction efficiency of 80% would lead to
an overall reduction of max. 0.020-0.035 Gt/y.
2030-2050 (Political framework does not impose similar carbon constraints for the cement industry on a global level)
CCS implementation would realistically not cover more than 10 to 15% of the
global clinker production in 2050
n/a
2030-2050 (Global political framework covers a big share of global cement production)
A maximum capacity share of 20 to 30% of the global capacity could be equipped with CCS (new builds). A further 10% of existing capacity could be equipped with
end of pipe technologies.
n/a
Source: ECRA (2009a)
Table 5.2 presents the estimated CO2 reductions from CCS as part of the Cement Technology Roadmap (IEA/WBSCD, 2009).
Table 5.2: Estimated CO2 reductions from CCS in the cement industry
Year Deployment GtCO2 captured % CO2 emitted by cement manufacturing
process that is captured
2025-2030 All large new kilns with CCS n/a n/a
2030-2040 50-70 cement kilns with CCS 0.11-0.16 10-12
2040-2045 100-200 cement kilns with CCS n/a n/a
2045-2050 220-430 cement kilns with CCS 0.5-1.0 40-45
Source: IEA/WBSCD (2009)
It should be noted that the CO2 reductions of 0.5-1.0 Gt CO2 in 2050 given in Table 5.2 are predicted to represent 56% of the total emission reduction of 0.79 Gt CO2 achieved in the sector. This is the largest share compared to alternative fuel use and other fuel switching (24%), energy efficiency (10%) and clinker substitution (10%).
As discussed previously, Figure 2.1 shows the IEA (2009) projected CO2 emissions from the cement sector in 2050 for different scenarios. It is worth repeating that in this analysis CCS represented the largest share of CO2 savings being responsible for a net emission reduction of 0.55 Gt CO2 in the BLUE low-demand scenario and 0.97 Gt CO2 in the BLUE high-demand scenario.
It is clear from the research work being undertaken within the cement industry that there is a strong interest in CCS options that also offer the opportunity for alternative products and revenue streams such as post-combustion mineral carbonation technologies and biological capture using algae rather than the geological storage of CO2. This could have a strong influence in determining the role of CCS within the cement sector.
276986/PNC/RGF/01/D 27 August 2010 276986/Final
23
Global Technology Roadmap for CCS in Industry
/�� ��� ���" �
This section addresses the following questions:
� What are the costs of applying CO2 capture to the cement industry? � What are the assumptions behind the costs? � What might be the cost reduction as a consequence of learning and economies of scale in the
sector? � What does the learning curve look like?
As the feasibility of capturing CO2 at cement plants has not been widely investigated or reported in the literature there is still significant uncertainty regarding the costs of applying CO2 capture. Some studies report a generic capture cost range, e.g. McKinsey (2009) reported an avoided cost to society in 2030 of €45-60/ tCO2 including transportation and storage costs with the range reflecting new build versus retrofit. In the sections below, the costs presented in the literature have been split into the different technology options in order to highlight the differences.
It should be noted that apart from the work by ECRA (2009a) there appears to have been little work undertaken to examine the differences between costs for a first of a kind (FOAK) cement plant with CCS and the nth of a kind (NOAK).
/�� ������� ����*�����������% �����������$ ������'%�� *�
/���� ����)��$ �%���������% ��%�������� �������������������
Mahesenan et al. (2005), based on a survey of literature and the typical CO2 content of the flue gas from cement plants, estimated the cost of capturing CO2 from the stack of a cement kiln using an amine-based process at about $50/t of CO2 plus another $9/t of CO2 to compress the CO2 to pipeline specifications (not fully described).
The key figures from the Hegerland et al. (2006) evaluation of applying post-combustion CO2 capture as a retrofit at a 1.4 Mt/y cement plant in Norway are summarised in Table 6.1. The reported accuracy of the figures is ±35%.
Table 6.1: Conceptual costs for retrofitting post-combustion CO2 capture
Parameter Norwegian Kroner (NOK)
Euro
(€)
Total equipment cost 255M 32M
Total investment cost 877M 111M
Total variable operating costs 212M 27M
Fixed operating costs 40M/y 5M/y
Total cost per capture 360/t of CO2 46/t of CO2
Source: Hegerland et al. (2006)
Table 6.2 summarises the key figures presented by IEA GHG (2008) for the costs of providing a cement plant with post-combustion capture using MEA. The European scenario was based on a 1 Mt/y plant sited
6. Estimated investment and costs
276986/PNC/RGF/01/D 27 August 2010 276986/Final
24
Global Technology Roadmap for CCS in Industry
in the UK. The Asian Developing Country scenario was based on a 3 Mt/y plant. Costs for CO2 transport and storage are excluded. Key assumptions in the Asian Developing Country scenario included:
� Equipment costs estimated at 60% of the European prices. � Cost-scale exponent of 0.6. � Labour costs estimated at 50% of the European prices. � The administration, rates and insurance estimated at 50% of the European prices.
Table 6.2: Cost estimates for cement plant with post-combustion capture
Parameter Unit Without CCS (European scenario)
With post-combustion capture (European scenario)
With post-combustion capture (Asian Developing
Country scenario)
Total investment cost €M 263 558 647
Net variable operating costs €M/y 17 31 97
Fixed operating costs €M/y 19 35 50
Cost per tonne of CO2 emissions avoided
€/t n/a 107.4 58.8
Costs per tonne of cement product €/t 65.6 129.4 72.2
Cost per tonne of CO2 captured €/t n/a 59.6 Not reported
Source: IEA GHG (2008)
OECD/IEA (2008) reports a capture cost range of US$75-100/tCO2 based on new and retrofit post-combustion.
Table 6.3 shows the cost estimations for post-combustion capture using absorption technologies generated by ECRA (2009a). The costs are rough estimations based on IEA and McKinsey studies as well as calculations by ECRA. Investment costs have been indicated as additional costs to the cement plant investment cost. Costs for CO2 transport and storage are excluded. A learning rate of 1% per year is considered for the period between 2030 and 2050.
Table 6.3: Cost estimation for post combustion capture using absorption technologies
New installation Retrofit
Year Investment
[€M]
Operational [€/tonne clinker]
Investment
[€M]
Operational [€/tonne clinker]
2015 n/a n/a n/a n/a
2030 100 to 300 10 to 50 100 to 300 10 to 50
2050 80 to 250 10 to 40 80 to 250 10 to 40
Source: ECRA (2009a)
/���� ����)��$ �%���������% ��%�����$ �$ � ������������*�
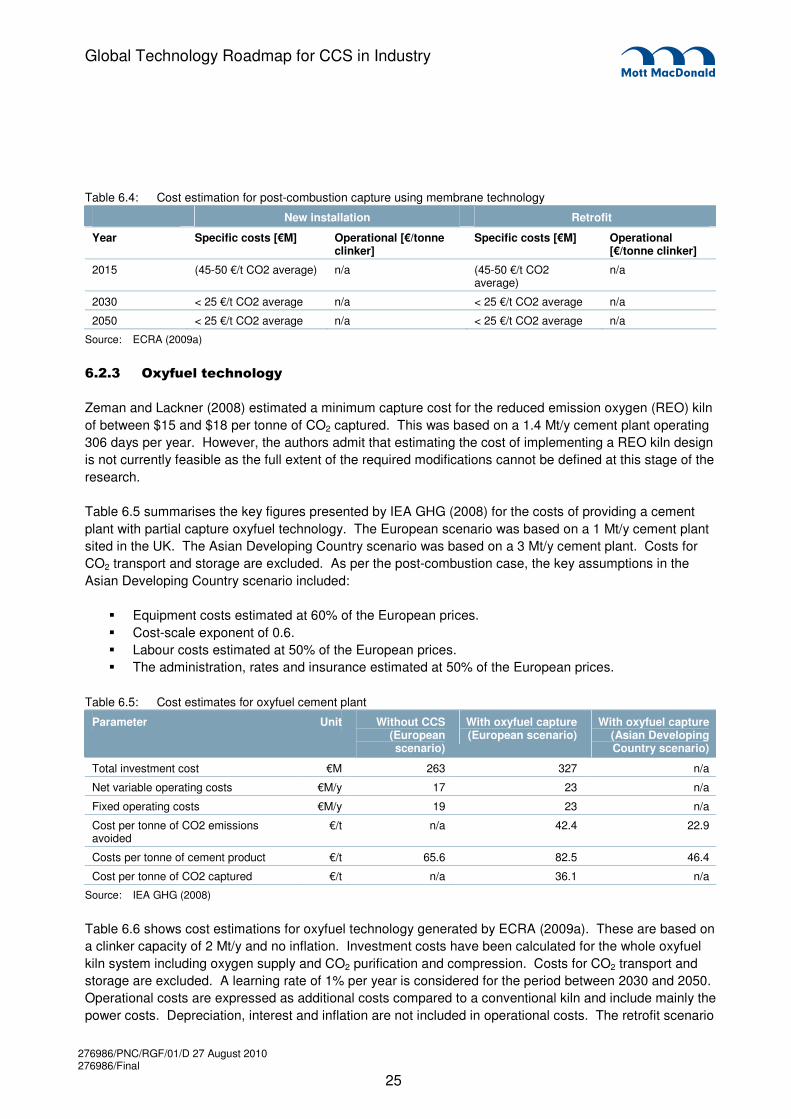
Table 6.4 shows the cost estimations for post-combustion capture using membrane technology generated by ECRA (2009a). As membrane technologies are not yet available for industrial application in the cement industry the estimations given are according to UNESCO Centre for Membrane Science and Technology Membranes.
276986/PNC/RGF/01/D 27 August 2010 276986/Final
25
Global Technology Roadmap for CCS in Industry
Table 6.4: Cost estimation for post-combustion capture using membrane technology
New installation Retrofit
Year Specific costs [€M] Operational [€/tonne clinker]
Specific costs [€M] Operational [€/tonne clinker]
2015 (45-50 €/t CO2 average) n/a (45-50 €/t CO2 average)
n/a
2030 < 25 €/t CO2 average n/a < 25 €/t CO2 average n/a
2050 < 25 €/t CO2 average n/a < 25 €/t CO2 average n/a
Source: ECRA (2009a)
/���� ��* %������������*�
Zeman and Lackner (2008) estimated a minimum capture cost for the reduced emission oxygen (REO) kiln of between $15 and $18 per tonne of CO2 captured. This was based on a 1.4 Mt/y cement plant operating 306 days per year. However, the authors admit that estimating the cost of implementing a REO kiln design is not currently feasible as the full extent of the required modifications cannot be defined at this stage of the research.
Table 6.5 summarises the key figures presented by IEA GHG (2008) for the costs of providing a cement plant with partial capture oxyfuel technology. The European scenario was based on a 1 Mt/y cement plant sited in the UK. The Asian Developing Country scenario was based on a 3 Mt/y cement plant. Costs for CO2 transport and storage are excluded. As per the post-combustion case, the key assumptions in the Asian Developing Country scenario included:
� Equipment costs estimated at 60% of the European prices. � Cost-scale exponent of 0.6. � Labour costs estimated at 50% of the European prices. � The administration, rates and insurance estimated at 50% of the European prices.
Table 6.5: Cost estimates for oxyfuel cement plant
Parameter Unit Without CCS (European scenario)
With oxyfuel capture (European scenario)
With oxyfuel capture (Asian Developing Country scenario)
Total investment cost €M 263 327 n/a
Net variable operating costs €M/y 17 23 n/a
Fixed operating costs €M/y 19 23 n/a
Cost per tonne of CO2 emissions avoided
€/t n/a 42.4 22.9
Costs per tonne of cement product €/t 65.6 82.5 46.4
Cost per tonne of CO2 captured €/t n/a 36.1 n/a
Source: IEA GHG (2008)
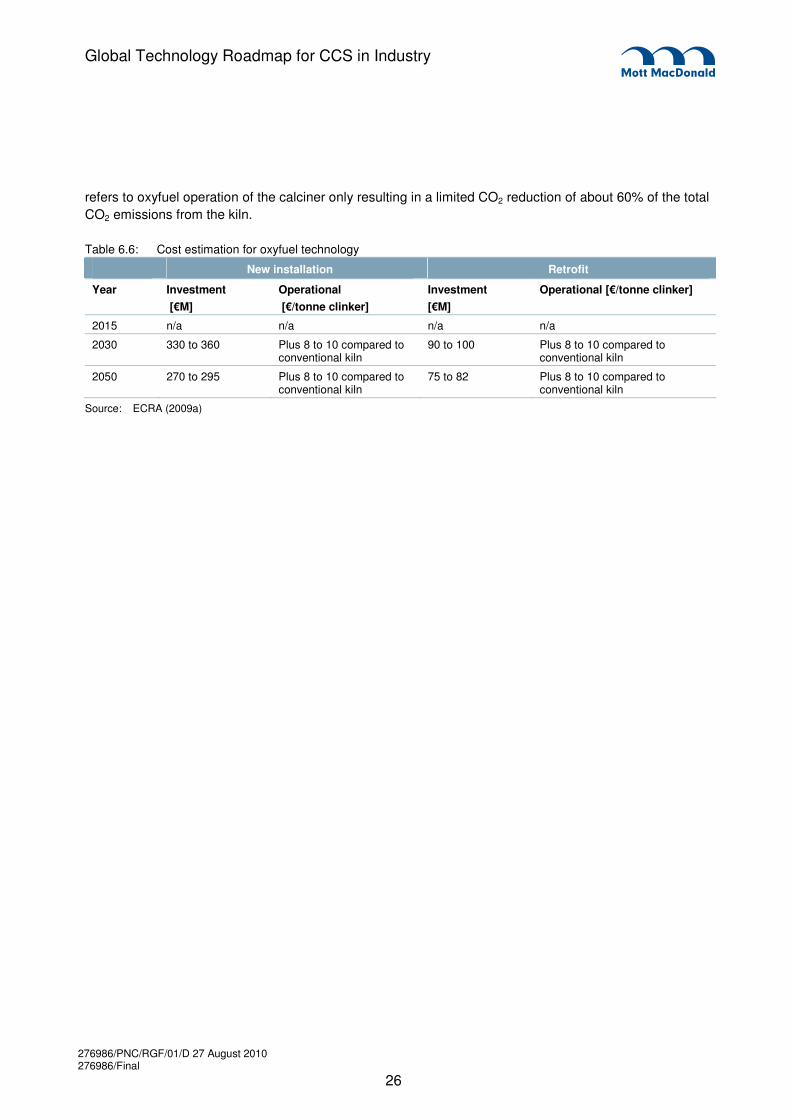
Table 6.6 shows cost estimations for oxyfuel technology generated by ECRA (2009a). These are based on a clinker capacity of 2 Mt/y and no inflation. Investment costs have been calculated for the whole oxyfuel kiln system including oxygen supply and CO2 purification and compression. Costs for CO2 transport and storage are excluded. A learning rate of 1% per year is considered for the period between 2030 and 2050. Operational costs are expressed as additional costs compared to a conventional kiln and include mainly the power costs. Depreciation, interest and inflation are not included in operational costs. The retrofit scenario
276986/PNC/RGF/01/D 27 August 2010 276986/Final
26
Global Technology Roadmap for CCS in Industry
refers to oxyfuel operation of the calciner only resulting in a limited CO2 reduction of about 60% of the total CO2 emissions from the kiln.
Table 6.6: Cost estimation for oxyfuel technology
New installation Retrofit
Year Investment [€M]
Operational [€/tonne clinker]
Investment [€M]
Operational [€/tonne clinker]
2015 n/a n/a n/a n/a
2030 330 to 360 Plus 8 to 10 compared to conventional kiln
90 to 100 Plus 8 to 10 compared to conventional kiln
2050 270 to 295 Plus 8 to 10 compared to conventional kiln
75 to 82 Plus 8 to 10 compared to conventional kiln
Source: ECRA (2009a)
276986/PNC/RGF/01/D 27 August 2010 276986/Final
27
Global Technology Roadmap for CCS in Industry
0�� ��� ���" �
This section addresses the following questions:
� What industries are involved in the sector? � What are the dominant companies? � Does the sector consist of many smaller companies or is the global picture dominated by a limited
number of players? � Is the industry risk-averse or risk-seeking; innovative or conservative; globally active or primarily
supplying a domestic market; heavily regulated or fully free?
0�� 1�'%�� �����������'������������� �
The production of cement itself is an independent process. In general, cement producers mine limestone, process and sell cement without participation from outside companies. Occasionally, the limestone used to produce the cement may be brought in from other mining companies if demand is particularly high. Other materials, such as coal required to heat the kiln, are purchased from outside companies. The production of clinker and cement are generally carried out internally within a company but procurement of clinker does occur, especially in areas where the cement industry is still developing and supply is unbalanced, such as China. This occurrence is becoming less common as the Chinese market becomes more consolidated (Anhui Conch Cement Co. Ltd., 2009).
As cement is used to make materials such as concrete and mortar the sale of cement has had strong links with the aggregates industry. Traditionally, these two industries have operated independently, with end users purchasing cement and aggregate from separate sources. However, since the 1990s all of the main members in the cement industry have moved to acquire the leading aggregates and concrete suppliers. This trend towards vertical integration not only has the benefit of providing an in-house supply but has helped to increase the sale of ready-mix concrete (The Economist, 2007).
Concrete being one of the most widely used materials in the world, end users range from multi national construction companies to household individuals.
The production of ‘burnt lime’ is similar in process to the production of cement, and so in this sense the industries are related with advances in one sector possibly benefiting the other. However, in terms of end use the two industries are not related.
0�� �$ �������$ ������
The cement industry is dominated by some large multinational players, with four out of the five largest companies based in Europe. In order of cement production in 2008 (see Table 7.1), these are:
� Lafarge (France) � Holcim (Switzerland) � Cemex (Mexico) � HeidelbergCement (Germany) � Italcementi (Italy).
Table 7.1 shows the global market share in 2003 and 2008.
7. Characterisation of the industry
276986/PNC/RGF/01/D 27 August 2010 276986/Final
28
Global Technology Roadmap for CCS in Industry
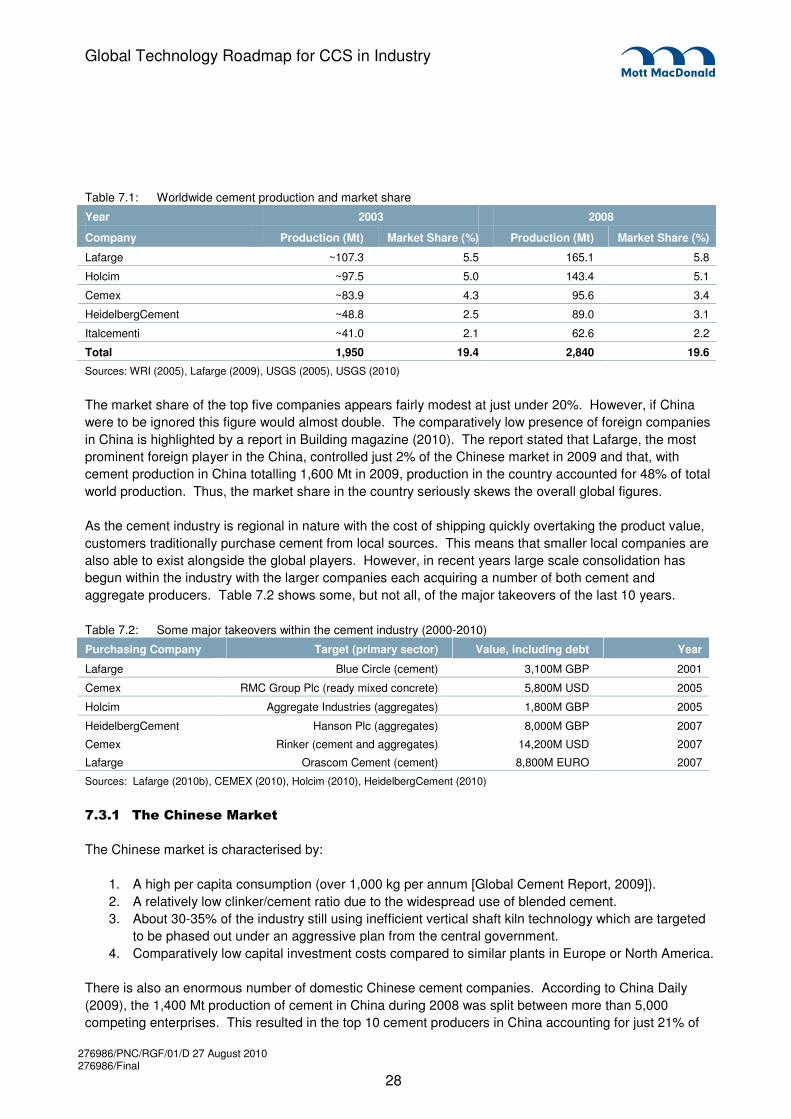
Table 7.1: Worldwide cement production and market share
Year 2003 2008
Company Production (Mt) Market Share (%) Production (Mt) Market Share (%)
Lafarge ~107.3 5.5 165.1 5.8
Holcim ~97.5 5.0 143.4 5.1
Cemex ~83.9 4.3 95.6 3.4
HeidelbergCement ~48.8 2.5 89.0 3.1
Italcementi ~41.0 2.1 62.6 2.2
Total 1,950 19.4 2,840 19.6
Sources: WRI (2005), Lafarge (2009), USGS (2005), USGS (2010)
The market share of the top five companies appears fairly modest at just under 20%. However, if China were to be ignored this figure would almost double. The comparatively low presence of foreign companies in China is highlighted by a report in Building magazine (2010). The report stated that Lafarge, the most prominent foreign player in the China, controlled just 2% of the Chinese market in 2009 and that, with cement production in China totalling 1,600 Mt in 2009, production in the country accounted for 48% of total world production. Thus, the market share in the country seriously skews the overall global figures.
As the cement industry is regional in nature with the cost of shipping quickly overtaking the product value, customers traditionally purchase cement from local sources. This means that smaller local companies are also able to exist alongside the global players. However, in recent years large scale consolidation has begun within the industry with the larger companies each acquiring a number of both cement and aggregate producers. Table 7.2 shows some, but not all, of the major takeovers of the last 10 years.
Table 7.2: Some major takeovers within the cement industry (2000-2010)
Purchasing Company Target (primary sector) Value, including debt Year
Lafarge Blue Circle (cement) 3,100M GBP 2001
Cemex RMC Group Plc (ready mixed concrete) 5,800M USD 2005
Holcim Aggregate Industries (aggregates) 1,800M GBP 2005
HeidelbergCement Hanson Plc (aggregates) 8,000M GBP 2007
Cemex Rinker (cement and aggregates) 14,200M USD 2007
Lafarge Orascom Cement (cement) 8,800M EURO 2007
Sources: Lafarge (2010b), CEMEX (2010), Holcim (2010), HeidelbergCement (2010)
0���� ������������( ����
The Chinese market is characterised by: 1. A high per capita consumption (over 1,000 kg per annum [Global Cement Report, 2009]). 2. A relatively low clinker/cement ratio due to the widespread use of blended cement. 3. About 30-35% of the industry still using inefficient vertical shaft kiln technology which are targeted
to be phased out under an aggressive plan from the central government. 4. Comparatively low capital investment costs compared to similar plants in Europe or North America.
There is also an enormous number of domestic Chinese cement companies. According to China Daily (2009), the 1,400 Mt production of cement in China during 2008 was split between more than 5,000 competing enterprises. This resulted in the top 10 cement producers in China accounting for just 21% of
276986/PNC/RGF/01/D 27 August 2010 276986/Final
29
Global Technology Roadmap for CCS in Industry
total production in the country. The Chinese government has made attempts in recent years to consolidate the industry through the use of regulations and this is discussed in section 7.4.4. It has also given strong backing to the 12 largest Chinese cement producers (China Cement Industry Report, 2009).
As of 2009, the largest Chinese based cement producer is Anhui Conch Cement Co. Ltd. (Conch). According to its company Annual Report for 2009 it had a production capacity of approximately 105 Mt of cement at the end of the year, which would now place the company comfortably in the top 5 world producers (see Table 7.1). Considering the cement branch of the company was only formed in 1997, the rate of cement consolidation in even the least consolidated market is clear (Anhui Conch Cement co. Ltd., 2010).
Although the rise of Conch is impressive, a rival company threatens to dwarf it and all other cement producers. The Chinese National Building Material Co (CNBM), the second largest Chinese producer as of 2009, has an impressive portfolio of companies. According to China Daily (2009) and the CNBM Website (2010a), at the start of 2009 the parent company’s portfolio included:
� China United Cement Group Corp. Ltd. (CUCC). Founded in 1999 and fully owned by CNBM, it has an annual production capacity of 40 Mt.
� South Cement Company (SCC). Founded in 2007, CNBM owns 82.9% of the company. It has an annual production capacity of more than 100 Mt.
� North Cement Company (NCC). Founded in 2009, CNBM owns 45% of the company and expects production capacity to exceed 50 Mt by 2012.
CNBM has set itself up to have the largest portfolio of cement production capacity by the end of 2012 (CNBM, 2010b). Even if the target is not reached it seems certain that at least one of the large Chinese producers will be joining the likes of Lafarge and Holcim as the world’s top producers within the near future.
0���� ����1�'���( ����
The second largest cement market in the world is India, with production capacity totalling approximately 250 Mt at the start of 2010 (Intercem, 2010). This still places India in the list of lowest per capita usage at approximately 125 kg per annum (e.g. UK consumption is around 210 kg per annum (Parrott, 2002)) but production capacity is expected to continue the growth displayed in recent years. For example, between 2007-2008 and 2009-2010 cement consumption in the country has risen more than 22% (Maps of India, 2010). Although the Indian market is less developed than China in terms of production capacity, the general makeup is a lot more comparable to that of the developed global market. India is one of the top performers in energy efficiency (see Figure 2.2) and like China is also characterised by widespread usage of blended cements and a comparatively low capital investment cost compared to similar plants in Europe or North America.
The country has welcomed international investment, with approximately $1.71 billion of foreign investment between April 2000 and February 2010 (IBEF, 2010). Holcim, in particular, has a strong presence, with large stakes in two of the largest producers in the country.
The market share of the top companies is also more comparative to global trends. Associated Cement Companies (ACC) Ltd. and Ambuja Cements Ltd., in both of which Holcim has a 45% share, have a combined capacity of 46 Mt. The combined capacity of Ultratech Cement Ltd. and Grasim Industries, which have recently merged, is almost identical. This means both groups have a market share of approximately 18.4%. Even by taking the four mentioned companies separately, the top 20 companies in
276986/PNC/RGF/01/D 27 August 2010 276986/Final
30
Global Technology Roadmap for CCS in Industry
India account for 70% of the domestic production, substantially higher than the 21% seen in the Chinese market (Maps of India, 2009).
0�& ������$ ����� ������%����������� ��$ ����" ������������$ ������'%�� *�
0�&�� ����)�� ���� � ���)�������2�
The nature of use for the final product in the cement industry has lead to the development of a risk-averse attitude in the cement industry. Considering that the main end product, concrete, is used to build structures such as buildings and bridges it is understandable that everyone involved in the production of cement, from producers through to the end users, tries to minimise any risks as much as possible. The industry is therefore seen as conservative in no small part due to its customers being conservative. Another contributing factor to the risk adverse attitude is the high capital intensity of the industry.
0�&�� 1���������� ������ �����2�
The cement industry in general is considered to be conservative in nature. The amount of money invested in research and development is substantially lower than many other sectors. Lafarge (2010a) stated that they invested €150M in R&D in 2008, a figure they consider to be much higher than competitors – Italcementi (2010), for example, invests just €13M a year in R&D projects - but the Lafarge budget is still just 1% of their total group sales. However, even this relatively small sum has seen a substantial increase since pre-2005 levels, where the group’s total R&D budget amounted to less than €25M. The percentage of the budget dedicated to sustainable development has also increased, from approximately 35% in 2004 to 53% in 2008.
There are two main areas of research within the cement industry – the production technique and the final product. The main players in the industry tend to focus their efforts on improving the standard of their products rather than improving the efficiency or altering the production process. This has lead to some criticism of the industry, with The Chemical Engineer magazine (Provis et al., 2008) citing “a complete lack of meaningful innovation by traditional cement industry on CO2 emissions”.
In general, developments in cement production are driven by the manufacturers of plant equipment and picked up by the large producers once fully developed. The three largest manufacturers, FLSmidth, Sinoma and Polysius have global market shares based on contracted kiln capacity (excluding China) of 35%, 27% and 16% respectively and so account for over three quarters of supply outside of China (FLSmidth, 2009). The high degree of consolidation on the manufacturing side means that new developments from equipment manufacturers can have a greater impact on the industry than any developments from cement producers. This perhaps justifies the decision of the large cement producers to concentrate on other areas of development.
0�&�� 3�����*�������� �� �$ ��*��%���*�����'�$ ������$ ���2�
The cement industry has traditionally been a domestic market, driven by the fact that the exportation costs quickly overtake any cost benefits. CEMBUREAU (2010) suggests that the maximum possible road transportation distance is 300 km, although transportation across seas via bulk shipping can be economically viable, particularly when exporting between countries with large discrepancies in operating costs (such as labour), market prices and capital investment cost.
276986/PNC/RGF/01/D 27 August 2010 276986/Final
31
Global Technology Roadmap for CCS in Industry
Without the ability to mass produce and distribute cement from one base location, the cement industry remained primarily domestic throughout most of the 20th century. However, consolidation of the industry has started to occur. In order to become a global supplier, the large global players are required to purchase or build plants in each region they plan to operate. According to respective company websites, Lafarge and Holcim have plants in 78 and 70 countries respectively, as of 2010.
0�&�& 4����*� ��%���'�� � %��*� ��2�
The industry has regulations in several different areas. The environmental regulations covering CO2 emissions within the industry are discussed in section 8 of the report.
Performance related regulations vary according to region and producers. The accepted worldwide standards are based on the European EN 197 and US ASTM C150/C595/C1157 standards. These standards have traditionally set out the specific make-up of cement and concrete products, as well as acceptable production techniques. The intention of the standards is to guarantee that all building and construction materials are produced using reliable, predictable methods (Provis et al., 2008).
One possible disadvantage of the standards is highlighted by the slow development of replacement materials, such as geopolymer concretes. The new material has the potential to seriously reduce the carbon footprint associated with the construction industry. However, due to the chemistry of the material falling outside of the allowable concrete make-up it has been difficult to demonstrate that it lives up to the same high standards expected for concrete products (Provis et al., 2008).
The cement industry is also subject to regulations regarding production, imposed by national governments. Although less of an issue in developed markets it has become an important issue in countries with expanding industries. The Chinese government, for example, has announced a series of measures in recent years, such as ordering the closure of almost 500 Mt worth of backward production capacity between 2007 and 2012. Other regulations include a restriction on new cement lines being built in provinces with more than 1000 kg clinker capacity per capita, and limits on production capacity linked to the output of the previous year. All these policies have been made with the aim of encouraging consolidation and stemming over-production by pushing smaller providers out of the business (CemWeek, 2009).
276986/PNC/RGF/01/D 27 August 2010 276986/Final
32
Global Technology Roadmap for CCS in Industry
5�� ��� ���" �
This section addresses the following question:
� How is the industry regulated in different regions for greenhouse gases or (if relevant) for other environmental pressures?
Environmental pressure on industry often can be translated as both a cost to operators and an opportunity to emissions abatement manufactures. Progressive tightening on environmental permitting of traditional pollutants such as NO2, SO2, heavy metals and particles has meant that operators of highly polluting processes have been obliged to invest in technologies that help reduce these pollutants either in-process or at the tailpipe, or modify their feedstock in some way. In the last decade, environmental regulation has begun to extend to greenhouse gases, notably CO2, and it is expected that regulation will continue to grow in the long-term. Unlike other pollutants however, CO2 emissions are in some places regulated by economic disincentives, rather than explicit limits on the amount or rate of emission, in an effort to internalise the externalities of pollution related to those pollutants. To date, this has mostly been done through emissions trading schemes. In addition, greenhouse gases are not a pollutant in the traditional sense as there is no direct relation between the point of emission and the area that will be ultimately affected by that emission. However, the greenhouse gases are indirectly controlled through permitting requirements, such as energy efficiency or fuel selection, in accordance with BAT.
For the cement industry, this is particularly pertinent, as greenhouse gas emissions that arise from manufacture are both from the energy use spent on producing the cement and from the chemical transformation process itself. While the former could theoretically be abated through use of non-fossil fuel energy technologies, the latter is inevitable. From an emissions trading scheme perspective, this means that cement manufacture could have an additional fixed cost from the permits required, and therefore could make CCS technology attractive in this sector in the medium to long term.
5�� 3 �����%���3����
5���� 1��� �������
The Clean Development Mechanism (CDM) and Joint Implementation (JI) are instruments mandated by the Kyoto Protocol (part of the United Nations Framework Convention on Climate Change) in which developed countries (as specified in Annex I of the Protocol) invest in projects that reduce emissions in developing countries (or non-Annex I countries) for which the emission savings are awarded credits, commonly known in the CDM as Certified Emissions Reductions (CERs).
It is possible to claim CERs for emissions reduction projects through the CDM and a number of methodologies exist through which these savings can be estimated and subsequently realised. A number of projects have been successfully completed and been awarded CERs within the cement sector. These are predominantly associated with the fuel changes (e.g. using biomass or waste tyres to fire the kilns), although one project (yet to be approved) has sought CERs based on using a feedstock that does not contain carbonates12. It is possible that an approval through CDM could be sought for deployment of CCS
_________________________ 12 http://cdm.unfccc.int/Projects/DB/DNV-CUK1260178757.69/view
8. Current environmental legislation and pressures
276986/PNC/RGF/01/D 27 August 2010 276986/Final
33
Global Technology Roadmap for CCS in Industry
technology which could provide the economic incentives to invest in the technology in non-Annex I countries.
5���� #% ����
The main mechanism for managing CO2 emissions in Europe is the EU ETS. This scheme manages the emissions from all large industrial plants (as defined in its regulations). Cement production is included for emissions of CO2 as per its inclusion in Schedule I13:
� Activities of installations for the production of cement clinker in rotary kilns with a production
capacity of more than 500 tonnes per day.
Both the process emissions and the emissions from fuel consumption at the production sites are included within the ETS. However, it is up to individual countries to decide on the allocations of permits for these industries although the way this is done is broadly similar (i.e. normally formula based, with the allocations dependant on the plant size and nationally derived emission factors). The scheme is implemented through National legislation in each of the EU Member States—the plant owner has to report emissions annual directly to the national administrator.
The EU ETS will soon enter its third phase (2013-2020) which has a declining emissions cap of 1.74% per annum and will contribute a majority of the EU’s emissions reduction goals. Importantly, Phase III will see the proportion of auctioned allowances increase to 50% (up from only 3% in Phase II) and there will be limits on the number of credits from Kyoto-related instruments (CDM) that can count towards an operators allowance. Both of these are likely to increase the carbon price in the EU and potentially serve to reduce emissions by making emission reductions technologies such as CCS more economically viable.
Plants in the EU are also required through their nationally administered permits to demonstrate the use of BAT when applying to operate. This means that new plants will be required to incorporate industry-standard and modern equipment that serves to limit the energy intensity of the cement sector, thus reducing CO2 emissions.
5���� ����
Asia contains the two single largest cement producers in China and India. There are currently no formal plans to implement an EU-style emissions trading scheme in those countries and there are currently limited regulations relating to the cement sectors specifically.
China announced in Spring 2010 that it will implement a National Plan to reduce emissions of GHG from the country as a whole (emissions per capita) which does not preclude them from continued economic growth. A specific target has not yet been set. It is possible that in the medium term limits will be set on specific sectors, or a trading scheme implemented to help achieve these goals. However, China has encouraged energy efficiency in the sector, including the dismantling of older, smaller kilns as well as subsidising energy efficiency projects which have served to reduce energy use in the sector14.
_________________________ 13 Directive 2003/87/EC - http://ec.europa.eu/environment/climat/emission/implementation_en.htm 14 Via http://www.ccap.org/docs/resources/694/China%20Cement%20Sector%20Case%20Study.pdf and
http://www.ifg.org/pdf/occasional_paper6-climate_change_and_china.pdf
276986/PNC/RGF/01/D 27 August 2010 276986/Final
34
Global Technology Roadmap for CCS in Industry
India does not currently have any plans for legislation for direct CO2 regulation and has not indicated how this may be implemented. However, the Indian Government has agreed in principle to reduce its emissions as per its agreement to be a party to the Copenhagen Accord (and has declared its intention to limit per capita emissions to levels comparable with the average OECD country). In India’s ‘National Action Plan on Climate Change’15, it is however noted that large energy consumers, including cement plants, are covered through the Energy Conservation Act (2001) which monitors plant efficiency (and indirectly the emissions associated with those plant). However, this does not affect the process emissions associated with cement production. Additionally, India has Environmental Impact Assessment16 (EIA) guidance that requires specific attention to be paid to emissions of CO2 when operators are applying to build new plants—the guidance specifies that this information could be used to incorporate specific mitigation measures such as offsetting of emissions in order to minimise the environmental impacts.
Russia, a country that sits both in Asia and Europe, is another large producer but is not part of the EU ETS and does not currently have in place any regulations to control GHG emissions from cement manufacture.
Asia is one of the major locations for CDM projects, with over three-quarters of registered projects located in the Asia-Pacific region17.
5���& �����$ � ����
There are currently no regulations in place in the United States to manage GHG emissions from any sector, however a package of measures are currently progressing through legislature that would place emission limits on a number of sources. Following revisions to the Clean Air Act, from 2011, new large installations (typically over 75,000 tCO2e per year) will be required to obtain a permit for their operations (with certain exceptions), which will require them to provide BAT on those installations, as related to its GHG emissions. This specifically includes cement production. Over time, the level of emissions at which permits will be required for will be lowered and further legislation is possible to cover a wider range of sources if the Environmental Protection Agency (EPA) finds that significant burdens still exist.
Although the current legislature does not mention an emissions trading scheme (as in its current form it is to minimise through demonstration of BAT), it is possible that the Clean Air Act will provide the data that could support the implementation of such a scheme. However, the regulations as they currently stand means that if CCS technology for cement plants became commercially viable, it may be required through BAT for new plants.
At the sub-national level, regional emissions trading schemes are or are soon to be in place. The most mature is the Regional Greenhouse Gas Initiative (RGGI) which covers ten of the North-eastern US States, that places caps to effectively reduce emissions between 2009 and 2018 by 10%. This only applies to fossil fuel plants with a 25 MW generating capacity. The Western Climate Initiative is currently being developed with a view to implementation in 2015 that would see a similar cap-and-trade system across all industries (and by implication cement manufacturers).
_________________________ 15 http://pmindia.nic.in/climate_change.htm 16 http://moef.nic.in/Manuals/Cement.pdf 17 http://cdm.unfccc.int/Statistics/Registration/RegisteredProjByRegionPieChart.html
276986/PNC/RGF/01/D 27 August 2010 276986/Final
35
Global Technology Roadmap for CCS in Industry
5���+ �%�� ����
Australia has since 2009 formed proposals for an emissions trading scheme that would have been implemented in 2011 aimed at achieving a national pledge of emission reductions of up to 25% by 2020; however, the scheme has now been delayed until at least 2013. The scheme would have included all industrial sources of GHGs including cement producers and operated in a similar cap-and-trade fashion as the EU system.
New Zealand has an emission trading scheme that became operational in July 2010. Although there is an initial transition period where permits are discounted, from 2013 the scheme will be in full operation. From 2010 the scheme covers most sectors including cement production. Similar to Phase I and II of the EUETS, most installations will be entitled to allocated permits, with a progressive decrease of 1.3% per annum from 2013. These regulations do not set a specific limit on the size of the cement plant that must participate in the Scheme.
5���/ � ���
Policy in Africa is still very nascent as many of the nations do not have significant pressures to reduce emissions. An exception to this is South Africa which ranks in the top twenty CO2 emitters (total country emissions). South Africa has formed a Government Committee for Climate Change, although it has yet to formalise any policy. Egypt (the next largest African emitter) has a similar Committee and also a climate Change Unit, where the focus has been on encouraging CDM investments.
Currently there are no explicit controls on CO2 emissions from any industry. However individual nations such as South Africa do have indirect regulations18 on cement processes which include the use of alternative fuels in kilns.
It is not clear what obligations to control emissions might be placed on Africa through future international agreements, but there are unlikely to be significant burdens in the short and medium terms, although individual nations with significant emissions, such as South Africa, might be included in such agreements which could put pressure on them directly controlling emissions from industrial processes such as cement manufacture.
5�� ���� �#��� ��$ �����1��%���
Almost all countries have regulations pertaining to the operation of cement plants that require them to either have a permit to operate, undertake an EIA prior to operation, or both. Typically air pollutant emissions are an area of concern. Typical combustion pollutants such as NOx and SO2 arise due to the common use of fossil fuels (in particular from coke- and coal-based fuels) as well as dust. Other pollutants such as volatile organic compounds and dioxins and furans may also be emitted. A further historical issue of concern has been the release of heavy metals into the atmosphere that result from the presence of these elements in the raw materials. The contamination of wastes and dust with these metals is also an issue for water quality control.
Often the environmental regulations will require that an environmental management system is in place for the plant, although the requirements of such systems vary considerably. For example, in Europe, the EU
_________________________ 18 http://www.environment.gov.za/hotissues/2008/cementproduction/cement.html
276986/PNC/RGF/01/D 27 August 2010 276986/Final
36
Global Technology Roadmap for CCS in Industry
has published detailed guidance (through the BAT reference documents (BREF) notes19) that prescribes requirements for the energy performance of the plant, fuel selection and emission levels and monitoring in order to demonstrate that BAT has been used on the plant. The national permitting authority will often use this as the basis on which to determine the award of a permit or planning permission. Many developed nations have in place guidance and regulation in the form of BAT or other industrial rules that indirectly influence CO2 emissions by specifying target process efficiencies, mandating alternative fuels and substituting clinker.
5�& #��� ��$ ������ ���% ���
The cement industry itself has responded to environmental issues. The Portland Cement Association (PCA), for example, provides ongoing reporting on the environmental and sustainability performance of the industry20 noting that the industry as a whole has moved to lower energy use, CO2 emissions and other pollutant emissions. For example, the PCA report that energy use in the cement energy fell by more than a third between 1972 and 2008.
The industry also has ties with the WBCSD, which has a dedicated global Cement Sustainability Initiative (CSI)21 and has produced along with the IEA a roadmap for emissions reduction for the cement sector, providing details on energy efficiency, alternative fuels and CCS technologies. The Asia-Pacific Partnership has a Cement Task Force22 with similar goals.
The industry has a relatively low profile and has not attracted widespread criticism from environmental pressure groups to date, except for isolated criticism at individual plants (for example, when proposals to produce heat from waste are announced). This could reflect the progress that has been made within the industry to date, although the industry as a contributor to emissions is still relatively minor compared to the energy industries. Nonetheless the initiatives identified by industry groups should ensure that the industry continues to improve and lead in reducing its impact, and CCS technologies will likely have a key role to play in achieving this.
_________________________ 19 http://eippcb.jrc.es/reference/ 20 http://www.cement.org/smreport09/sec_page3_1.htm 21 http://www.wbcsdcement.org/ 22 http://www.asiapacificpartnership.org/english/tf_cement.aspx
276986/PNC/RGF/01/D 27 August 2010 276986/Final
37
Global Technology Roadmap for CCS in Industry
6�� ��� ���" �
This section addresses the following question:
� What are the major gaps and barriers to CCS deployment in the cement sector?
This section will be the basis of the actions and milestones of different actors and stakeholders in the sections of the roadmap. The following areas have been considered when addressing this:
� Technical, � Policy, � Legal, � Financial, � Market, and � Organisational requirements.
6�� 3��� �������'�� �� �����'����*$ ����� ��������% �����������$ ��������� �
LEK (2009) concluded that overall the main bottleneck to CO2 capture in the cement industry is the cost of such a system. In a globally traded commodity, producers may consider locating new cement plants in countries with no carbon constraints, if there is no framework to support the industry in countries with stricter carbon abatement regulation.
The IEA and WBSCD (2009) made the following important points regarding deployment of CCS in the cement sector:
� From a technical point of view, carbon capture technologies in the cement industry are not likely to be available before 2020.
� Due to higher specific costs, it is expected that kilns with a capacity of less than 4,000 – 5,000 tonnes per day will not be equipped with CCS technology and that retrofits will be uncommon.
� As CCS requires CO2 transport infrastructure and access to storage sites, cement kilns in industrialised regions could be connected more easily to grids, compared to plants in non-industrialised areas.
� Cement kilns are usually located near large limestone quarries, which may or may not be near suitable CO2 storage sites. It is also likely that CCS clusters will be influenced by proximity to much larger CO2 sources such as major coal-fired power plants. This is exemplified in the UK where a number of the largest cement plants are situated inland at some distance from the coast and potentially suitable storage sites, and are located outside of identified potential CCS cluster regions (Element Energy, 2010).
� The economic framework will be decisive for future applications of CCS in the cement industry. Although it is expected that the cost of CCS will decrease in the future the current estimated costs for CO2 capture are high.
9. Major gaps and barriers to implementation
276986/PNC/RGF/01/D 27 August 2010 276986/Final
38
Global Technology Roadmap for CCS in Industry
� CCS could be applied in the cement industry only if the political framework effectively limits the risk of carbon leakage (relocation of cement production into countries or regions with fewer constraints). As the cost of CCS implementation will be lower for new installations than for retrofitting existing facilities, and as the majority of future demand will be in regions with no current carbon constraints, incentives must be in place to encourage the early deployment of CCS in all regions.
Other gaps and barriers identified within the expert workshop conducted in Abu Dhabi in June/July 2010 included:
� The relatively long lifetime of cement kilns of between 30 and 50 years means that there is a slow turnover of stock.
� Lack of financing mechanisms for up-scaling from lab-scale to pilot and consequently to FOAK commercial scale application.
� Increased water demand (for the CCS process itself or for cooling) may represent a significant challenge for sites that have limited options for increased water use.
� The CO2 gas purity specification for the transportation network is required in order to design the capture process although it is recognised that this may depend on the final use for the CO2.
� Public acceptance of CCS. This is clearly an issue generic to all CCS schemes.
� Reluctance of cement plant operating companies to take on non-core business operations; the perception being that the operation of a CCS plant is akin to a chemical plant and cement plant operating companies do not have the skills or personnel to operate these type of plants.
� Reliance on technology providers to undertake R&D on CCS rather than the cement producers.
� Potentially intermittent operation of the cement plant due to market demand, forced or planned outages may result in an intermittent supply of CO2 from the plant. This would need to managed within the transportation network. However, it is recognised that this should not be an issue as the operators of oil and gas distribution networks have extensive experience of this issue and are able to manage the seasonal difference in demand (Element Energy, 2010).
� Legal certainty regarding the long term liabilities for the CO2; it is not clear at present whether the liabilities will rest with the CO2 transportation and storage operator or with the cement producer.
� There is reputational issue regarding how cement plant operating companies would manage the public perception of their product with CO2 capture, transport and storage.
� The technical and financial implications of capture ready cement plants are still largely not understood although cement companies should be planning now to avoid potential carbon lock-in in the future.
276986/PNC/RGF/01/D 27 August 2010 276986/Final
39
Global Technology Roadmap for CCS in Industry
The 2009 roadmap for the cement industry (IEA and WBSCD) recommended that the following would be required in order to implement CCS technologies to the cement industry:
� Development of regulatory frameworks for CCS and international collaboration on CCS regulation.
� Government support for funding of cement industry pilot and demonstration projects, leading to commercial-scale demonstration plants and storage site accessibility.
� Identify and demonstrate transport networks and storage sites near cement plants.
� Coordination of CO2 transport networks on a regional, national and international level to optimise infrastructure development and to lower costs.
� Investigate linkages into existing or integrated networks and opportunities for cluster activities in industrial zones.
� Government and industry significantly expanding efforts to educate and inform key stakeholders about CCS.
6�� 3����'�� �� �����'����*$ ����� �����)��$ �%�������������% �����������$ ��������� �
The following gaps and barriers to deployment of post-combustion CO2 capture in the cement industry have been reported:
� Post-combustion capture at cement plants using amine solvents would be technically and
commercially favourable when applied at cement plants with low SO2 and low NO2 concentrations in the flue gas as this will reduce the costs associated with desulphurisation and deNOx (IEA GHG, 2008)
� Overall process integration (LEK, 2009). � Low-pressure steam requirement for the regeneration of the absorbent requires an auxiliary power
block (LEK, 2009). However, it should be noted that cement companies operating in countries with an unreliable electricity supply, such as India, often install their own captive power plants with high efficiency boilers (IEA/WBSCD, 2009). This may mean that a suitable steam supply could be available at some cement plants.
� The additional steam requirements for post-combustion CO2 capture will result in additional CO2 emissions which require capture themselves. This indicates that post-combustion capture will be most effective if the cement plant is co-located near a pre-existing readily available steam supply (IEA GHG, 2008).
Other gaps and barriers identified in the expert workshop that are specific to the post-combustion capture option include:
� Increased requirements for land area due to the large footprint of post-combustion CCS systems may represent a significant challenge for retrofit sites that have limited options for increasing their size.
276986/PNC/RGF/01/D 27 August 2010 276986/Final
40
Global Technology Roadmap for CCS in Industry
6�& 3����'�� �� �����'����*$ ����� ���* %����������% �����������$ ��������� �
The following gaps and barriers to deployment of oxyfuel CO2 capture in the cement industry have been reported:
� Overall process integration (LEK, 2009) � Air tightness of pre-heater, pre-calciner and flue gas recirculation (LEK, 2009) � Re-carbonation of product due to very high CO2 concentration in the process environment (LEK,
2009) although it should be noted that ECRA (2009b) showed that the clinker burnt under a CO2 atmosphere did not react with CO2 in the cooling gas.
� Combustion management due to the use of pure O2 in the pre-calciner burner (LEK, 2009) � The influence of the O2/CO2 atmosphere on the design and operation of the preheater, precalciner
and kiln (IEA GHG, 2008).
Other gaps and barriers identified in the expert workshop that are specific to the oxyfuel capture option include:
� Oxyfuel technology may interfere with final product quality. More R&D is required. � Reliability issues (e.g. increased refractory failures) due to changes in combustion characteristics.
276986/PNC/RGF/01/D 27 August 2010 276986/Final
41
Global Technology Roadmap for CCS in Industry
ADB (2007). Proposed Loan – Republic of Indonesia: PT Semen Andalas Indonesia for the Reconstruction of the Cement Production Facility in Aceh. Project Number: 39932. March 2007.
Anhui Conch Cement Co. Ltd. (2009), 2009 Annual Report Available from: http://www.conch.cn//news_file/201041732437349.pdf
Anhui Conch Cement Co. Ltd. (2010), Company Website – About Conch, Company Profile Available from: http://english.conch.cn/sm2111111234.asp
Baumert, K.A., Herzog, T., Pershing, J. (2005). Navigating the Numbers: Greenhouse Gas Data and International Climate Policy, [e-book] USA, World Resource Institute. Available from: http://pdf.wri.org/navigating_numbers.pdf
Bosoaga, A., Masek, O. and Oakey, J.E. (2009). ‘CO2 capture technologies for cement industry’, Energy Procedia, Volume 1. Issue 1, pp133-140.
CEMBUREAU (2010). Cement industry – main characteristics Available from: http://www.cembureau.be/about-cement/cement-industry-main-characteristics
CEMEX (2010). Company Website – Our History Available from: http://www.cemex.com/tc/tc_oh.asp
CemWeek (2009). China to eliminate backward production capacity, 2nd November 2009 Available from: http://www.cemweek.com/index.php/news/markets-a-competition/3006-china-to-eliminate-backward-production-capacity
China Cement Industry Report, 2009 (Abstract) (2009). Research In China, December 2009 Available from: http://www.researchinchina.com/htmls/report/2009/5803.html
China Daily (2009). ‘Aggressive M&A policy sees CNBM cement its future’, 14th April 2009 Available from: http://www.chinadaily.com.cn/cndy/2009-04/14/content_7673836.htm
CNBM (2010a) Company Website – Cement Segment Available from: http://www.cnbmltd.com/english/ywbk/sn.htm
CNBM (2010b) Company Website – About Us Available from: http://www.cnbmltd.com/english/zgjc/index.htm
CSI (2010). Global Cement Database on CO2 and Energy Information. Available from: http://wbcsdcement.org/index.php?option=com_content&task=view&id=57&Itemid=118
The Economist (2007). ‘Concrete Plans – Will Germany’s HeidelbergCement make a bid for Hanson?’, 10th May 2007, Berlin, Germany. Available from: http://www.economist.com/node/9153638
ECRA (2007). Carbon Capture Technology – Options and Potentials for the Cement Industry. Technical Report TR 044/2007. ECRA, Dusseldorf, Germany.
10. References
276986/PNC/RGF/01/D 27 August 2010 276986/Final
42
Global Technology Roadmap for CCS in Industry
ECRA (2009a). Development of State of the Art-Techniques in Cement Manufacturing: Trying to Look Ahead. ECRA-CSI, Dusseldorf, Germany and Geneva, Switzerland.
ECRA (2009b). ECRA CCS Project – Report about Phase II. ECRA, Dusseldorf, Germany.
Element Energy (2010). Potential for the application of CCS to UK industry and natural gas power generation for Committee on Climate Change. Final Report, issue 3, 28/06/2010.
FLSmidth (2009), Annual Report 2009 Available from: http://hugin.info/2106/R/1388393/346622.pdf
Global Cement Report (2009). 8th edition, International Cement Review. Published April 2009.
Hegerland, G., Pande, J.O., Haugen, H.A., Eldrup, N., Tokheim, L. and Hatlevik, L. (2006). Capture of CO2 from a Cement Plant – Technical Possibilities and Economic Estimates in Greenhouse Gas Control Technologies 8, Trondheim, Norway: Elsevier.
HeidelbergCement (2010). Company Website – History, 1993 to today Available from: http://www.heidelbergcement.com/global/en/company/about_us/history/1993_till_today.htm
Hendriks, C.A., Worrell, E., de Jager, D., Blok, K. and Reimer, P. (1998). Emission Reduction of Greenhouse Gases from the Cement Industry, presented at the 4th International Conference on Greenhouse Gas Control Technologies, 30 August – 2 September 1998, Interlaken, Switzerland.
Holcim (2010). Company Website – History Available from: http://www.holcim.com/CORP/EN/id/-1610627438/mod/2_1_4_0/page/faq_list.html
India Brand Equity Foundation (IBEF) (2010). Cement, April 2010 Available from: http://www.ibef.org/industry/cement.aspx
Intercem (2010). India – ACC Ambuja and Ultratech in Race to Retain Market Share Available from: http://www.intercem.com/INDIA-ACC-AMBUJA-AND-ULTRATECH-IN-RACE-TO-RETAIN-MARKET-SHARE-intercem-cement-conferences-news-5942.aspx
IEA (2007). Tracking Industrial Energy Efficiency and CO2 Emissions. International Energy Agency, Paris, France.
IEA (2008). Energy Technology Perspectives 2008. OECD/IEA, Paris, France.
IEA (2009). Energy Technology Transitions for Industry. OECD/International Energy Agency, Paris, France.
IEA (2010). Energy Technology Perspectives 2010. OECD/International Energy Agency, Paris, France.
IEA & WBSCD (2009). Cement technology roadmap 2009 – Carbon emission reductions up to 2050. OECD/IEA and The World Business Council for Sustainable Development.
IEA GHG (2008). CO2 Capture in the Cement Industry. International Energy Agency Greenhouse Gas R&D Programme, Technical Study, Report Number 2008/3.
276986/PNC/RGF/01/D 27 August 2010 276986/Final
43
Global Technology Roadmap for CCS in Industry
Indocement (2010). Company Website – Production Facilities Available from: http://www.indocement.co.id/new/production.asp
Italcementi (2010). Company Website – Research and Innovation Available from: http://www.italcementigroup.com/ENG/Research+and+Innovation/
Kennett, S. (2010). ‘Lafarge to up China capacity by 7 million tonnes this year’, Building, 15th June 2010. Available from: http://www.building.co.uk/lafarge-to-up-china-capacity-by-7-million-tonnes-this-year/5001099.article
Lafarge (2009). 2009 Sustainability Report.
Lafarge (2010a). Company Website – Research and Innovation, Key Figures Available from: http://www.lafarge.com/wps/portal/3_2_2-Chiffres-cles
Lafarge (2010b). Company Website – History, Key Dates Available from: http://www.lafarge.com/wps/portal/1_6_1-Dates-cles
LEK (2009). ‘An ideal Portfolio of CCS Projects and Rationale for Supporting Projects’ APPENDIX.
Mahasenan, N., Dahowski, R.T. and Davidson, C.L. (2005). The Role of Carbon Dioxide Capture and Storage in Reducing Emissions from Cement Plants in North America, in Greenhouse Gas Control Technologies, Volume I, eds. E.S.Rubin, D.W. Keith and C.F. Gilboy. Elsevier Science, 2005.
Maps of India (2009) Top 10 Cement Companies in India, September 2009 Available from: http://business.mapsofindia.com/cement/top-10-cement-companies.html
Maps of India (2010) Cement Industry in India, April 2010 Available from: http://business.mapsofindia.com/cement/
McKinsey & Company (2009). Version 2 of the Global Greenhouse Gas Abatement Cost Curve.
Parrott, L. (2002). Cement, Concrete & Sustainability – A report on the Progress of the UK Cement and Concrete Industry Towards Sustainability. BCA.
Provis, J., Duxson, P., van Deventer, J. (2008). Concrete Evidence, The Chemical Engineer Magazine, November 2008
OECD & IEA (2008). CO2 Capture and Storage: A Key Carbon Abatement Option.
Sarlis, J. and Shaw, D. (2008). Cansolv Activities & Technology Focus for CO2 Capture. Presentation at the 11th Meeting of the International Post-Combustion CO2 Capture Network, 21-22 May 2008, Vienna.
Skyonic (2010). DOE Awards Skyonic $25M to Build Largest Carbon Mineralization Plant, press release from Skyonic Corporation dated 29 July 2010.
Tsinghua University of China (2008). Assisting Developing Country Climate Negotiators through Analysis and Dialogue: Report of Energy Saving and CO2 Emission Reduction Analysis in China Cement Industry, November 13, 2008.
276986/PNC/RGF/01/D 27 August 2010 276986/Final
44
Global Technology Roadmap for CCS in Industry
USGS (2005). Mineral Commodity Summaries, USGS, Reston, Virginia, United States.
USGS (2008). Minerals Yearbook, USGS, Reston, Virginia, United States.
USGS (2010). Mineral Commodity Summaries, USGS, Reston, Virginia, United States.
Zeman, F. and Lackner, K. (2008). The Reduced Emission Oxygen Kiln. A White Paper Report for the Cement Sustainability Initiative of the World Business Council on Sustainable Development. Lenfest Center for Sustainable Energy, Columbia University in New York, Report No. 2008.01.
276986/PNC/RGF/01/D 27 August 2010 276986/Final
45
Global Technology Roadmap for CCS in Industry
���� Associated Cement Companies Limited
�,� Asian Development Bank
���( � American Society for Testing and Materials
,��� Best Available Technology
,��� British Cement Association
,�#7� BAT reference documents
��8(#�� Canada Centre for Mineral and Energy Technology
���� CO2 Capture and Storage
�( � Clean Development Mechanism
�#��� Certified Emissions Reductions
�8,( � The Chinese National Building Material Company
������� Cooperative Research Centre for Greenhouse Gas Technologies
��1� Cement Sustainability Initiative
��1�� Consejo Superior De Investigaciones Cientificas
�9��� China United Cement Group Corporation Ltd
�#� Department of Energy
::� German Combustion Research Association
#���� European Cement Research Academy
#1�� Environmental Impact Assessment
#8#��� Empresa Nacional de Electricidad
#��� Environmental Protection Agency
#�#� Entreprises pour l’Environment
#��� Emissions Trading Scheme
#9� European Union
#9�� European Union Allowance
7��;� First of a Kind
343� Greenhouse Gas
38�� Getting the Numbers Right
1,#7� India Brand Equity Foundation
1�1� Institut du développement durable et des relations internationales
1#�� International Energy Association
1#��343� International Energy Association Greenhouse Gas Programme
17�� International Finance Corporation
1���� Intergovernmental Panel on Climate Change
<1� Joint Implementation
(#�� Mono-ethanol amine
((.� Mott MacDonald Limited
Glossary
276986/PNC/RGF/01/D 27 August 2010 276986/Final
46
Global Technology Roadmap for CCS in Industry
(��� Mineral Products Association
8��� North Cement Company
8#�� New Entrants’ Reserve
8��;� Nth of a Kind
8=1�� New York Institute of Technology
�#�� Organisation for Economic Co-operation and Development
��#�� Organisation of the Petroleum Exporting Countries
���� Portland Cement Association
�:� Photovoltaic
�>� Research and Development
�#�� Reduced Emission Oxygen
�331� Regional Greenhouse Gas Initiative
���� South Cement Company
98#���� United Nations Educational, Scientific and Cultural Organisation
981�� United Nations Industrial Development Organisation
9�3�� United States Geological Survey
:?� German Cement Works Association
! ,��� World Business Council for Sustainable Development
! ! 7� World Wildlife Fund