Embed Size (px)
Citation preview

ENHANCED ROADMAP PLASTICS INDUSTRY
i

ENHANCED ROADMAP PLASTICS INDUSTRY
ii
TABLE OF CONTENTS FOREWORD
I. PERSPECTIVE OF THE ROADMAP ........................................................................................1
II. VISION & MISSION/ GOALS & TARGETS ...........................................................................3
A.VISION & MISSION ..............................................................................................................3
B. GOALS & TARGETS ........................................................................................................... 3 C. STRATEGIES & TIMELINES ............................................................................................. 7
III. STATE OF THE INDUSTRY ............................................................................................... 10
A. STRUCTURE … ................................................................................................................. 10
1. Sectoral Coverage........................................................................................................... 11 2. Supply Chain and Industry Linkages ............................................................................. 13
3. Industry Players and Associations ................................................................................. 14
4. Factors Affecting Supply and Demand ......................................................................... 15
B. ECONOMIC PERFORMANCE 1. Manufacturing Output, Value Added, & GDP Share ................................................... 17
2. Trade ................................................................................................................................ 20
3. Investments ..................................................................................................................... 21
4. Financial ........................................................................................................................... 22
5. Employment .................................................................................................................... 25 6. Multiplier Effects ............................................................................................................. 26
C. OUTLOOK AND CHALLENGES ..................................................................................... 34
IV. POLICY ENVIRONMENT FOR INDUSTRY DEVELOPMENT ....................................... 37 A.HISTORY OF GOVERNMENT PROGRAMS ................................................................... 37
B. CURRENT POLICIES ......................................................................................................... 37
C. REGULATORY AGENCIES ............................................................................................. 38
V. GREENING THE ROADMAP ............................................................................................. 41
VI. SWOT ANALYSIS ................................................................................................................ 51 VII. RECOMMENDATIONS....................................................................................................... 54
A. POLICY MATTERS ............................................................................................................ 54
B.ENHANCING THE MARKET FOR THE PLASTICS INDUSTRY .................................. 55
REFERENCES .............................................................................................................................. 57 APPENDIX .................................................................................................................................. 57

ENHANCED ROADMAP PLASTICS INDUSTRY
iii
ACRONYMS
AFTA ASEAN Free Trade Agreement
AKFTA ASEAN-Korea Free Trade Agreement
APMP Association of Petrochemical Manufacturers of the Philippines
ASEAN Association of South East Asian Nations
ASPBI Annual Survey of Philippine Business and Industry
BOC Bureau of Customs
BOI Board of Investments
BTX Benzene, Toluene, Mixed Xylenes
CALABARZON Cavite, Laguna, Batangas, Rizal, Quezon
CAMANAVA Caloocan, Malabon, Navotas, Valenzuela
CEMAP Cement Manufacturers Association of the Philippines
CHED Commission on Higher Education
DENR Department of Environment and Natural Resources
DOE Department of Energy
DOF Department of Finance
DOST Department of Science and Technology
DOTC Department of Transportation and Communication
DPWH Department of Public Works and Highways
DTI Department of Trade and Industry
DTI-BETP Department of Trade and Industry-Bureau of Export Trade Promotions
EDC Ethylene Dichloride
EO Executive Order
EPPS Expandable Polystyrene
ETBE Ethyl-Tert-Butyl-Ether
FCC Fluidized Catalytic Cracker
FOB Freight on Board
FPI Federation of Philippine Industries
GDP Gross Domestic Product
GHG Greenhouse Gases
GPPS General Purpose Polystyrene
HDPE High Density Polyethylene
HIPS High Impact Polystyrene
ICP Integrated Chemists of the Philippines
IFC International Finance Corporation
IFM Inward Forward Manifest
IPA Investment Promotions Agency
IPP Investment Priority Program
JGSPC JG Summit Petrochemical Corporation
kTA Kilo Tons per Annum
LCA Life Cycle Assessment
LGU Local Government Unit
LLDE Linear Low Density Polyethylene
MPRAI Metro Plastics Recyclers Association, Inc.
MFN Most Favored Nation

ENHANCED ROADMAP PLASTICS INDUSTRY
iv
MIDA Malaysia Industrial Development Authority
MMDA Metropolitan Manila Development Authority
MTBE Methyl-Tert-Butyl-Ether
NEC National Ecology Center
NEDA National Economic and Development Authority
NPC National Power Corporation
NSCB National Statistics Coordination Board
NSO National Statistics Office
NSWMC National Solid Waste Management Council
PAGASA Philippine Atmospheric, Geophysical, and Astronomical Services Administration
PCCI Philippine Chamber of Commerce and Industry
PE Polyethylene
PEZA Philippine Economic Zone Authority
PICHE Philippine Institute of Chemical Engineers, Inc.
PP Polypropylene
PPCP Polystyrene Packaging Council of the Philippines
PRA Philippine Retirement Authority
PRII Philippine Resins Industries, Inc.
PSA Philippine Statistics Authority
PS Polystyrene
PTMAPI Pipes and Tubes Manufacturers Association of the Philippines, Inc.
PVC Polyvinyl Chloride
PWA Philippine Weavers Association
SPIK Samahan Sa Pilipinas ng mga Industriyang Kimika
TCC Tax Credit Certificate
TESDA Technical Education and Skills Development Authority
VCM Vinyl Chloride Monomer

ENHANCED ROADMAP PLASTICS INDUSTRY
5
I. PERSPECTIVE OF THE ROADMAP
Plastics have come a long way from their humble beginnings well over 100 years ago. The existence of
natural polymers was known in the 19th century, such as amber, tortoise shell, and horn. The late
1850's saw the occurrence of cellulose nitrate, which Alexander Parkes exhibited as the very first
plastic in 1862. The English inventor's creation of Parkesine ushered in more man-made materials such
as Xylonite made by Parkes' associate, Daniel Spill.
The Belgian inventor Leo Baekeland created and patented the first synthetic plastic in 1907, which he
called Bakelite. This material's non-conductivity and heat resistance made it useful in a number of
electrical and kitchen apparatuses. Soon after in 1913, Dr. Jacques Edwin Brandenberger created
cellophane as a non-staining cloth.
Soon, plastics were being used in everyday life in larger and larger scales, thus requiring the steady
manufacturing of such materials. 1921 saw the first injection molding machine design grace the world.
It was not long before more familiar plastic materials, such as those made from petroleum- polystyrene,
acrylic polymers, and polyvinyl chloride- were being manufactured by the 1930's.
Some decades later, the invention of polypropylene saw plastics enter the living spaces of the common
man in the form of home decor. From 1960 to the 1970's, plastics were already playing an increasing
“behind the scenes” role in technological advancements. By this time, so-called super polymers were
already starting to replace metals in some industries. Plastics were also noted for their hygienic nature,
leading them to be increasingly utilized by healthcare facilities worldwide.
The 90's saw an increased emphasis in environmental concerns, leading to the development of new
techniques for recovery and recycling of end-of-life products for the now well-established global
plastics industry. Its full integration into daily living now meeting new challenges, plastics moved into
the new century with a lot riding on its shoulders.
Plastic is a widespread and pervasive material that can be used by a multitude of industries in the
production of innumerable products. Industries such as the construction, automotive, industrial
manufacturing equipment, mechanical engineering industry rely heavily on plastic parts in their
businesses. While these strong linkages are a definite edge and foundation to drive the plastic industry,
the recent years have not been without setbacks and difficulties. Widespread use of plastic also means
that the decline of a large number of industries under recession could cripple the plastic manufacturers
even more.
This 50 year old local industry faced one of its toughest challenges from 2004 to 2009 due to a
distortive tariff structure. The same period also saw a decline in plastic manufacturing and an increase
in the imports of primary, secondary and finished products that are packaged in plastics. It was only in

ENHANCED ROADMAP PLASTICS INDUSTRY
6
2010 when the ASEAN tariffs for raw materials and finish goods leveled off which provided a reprieve
for the domestic industry resulting in an overall increase of 30%.
In the mid-2010 and 2011, the plastic industry faced yet a new type of challenge in the form of banning
of plastics and polystyrene (otherwise known by DOW chemical’s brand name “Styrofoam”) materials.
Citing flooding, improper waste disposal leading to clogging of our waterways and waste disposal issues
as major reasons for implementing such acts, over 59 municipalities have passed local ordinances that
regulate and even eliminate the use of plastic bags. The local governments of Los Banos, Calamba,
Cabuyao and many more in Laguna; Carmona in Cavite; Lucban in Quezon, Tanay in Rizal, Bacolod
and Davao in the Visayas and Minadanao Region; and Metro Manila Cities like Muntinlupa, Las Piñas,
Marikina, Quezon City and Makati to name a few, have supported and implemented its independent
versions of the regulation or ban. Not only does this ban affect the industry sectors’ manufacturing
output (a decrease of 20 to 30 percent is already palpable), but threatens the livelihood of the workers
of the plastic bag and polystyrene manufacturing workforce.
The local plastic industry is dominated by small to medium, family owned and controlled enterprises.
The plastic bag and polystyrene sectors are considered the strongest and most resilient players least
affected by imports as players have maintained its quality with low production costs. With globalization,
ASEAN+4 and ASEAN 2015 just around the corner, and global players continuing to shift its
production base to low cost Asian countries and given the fact that the applications for plastics are
increasing, from building and infrastructure, transport, automotive field, rail, defense and aerospace,
healthcare, telecommunication, up to electrical and electronics, the global demand for plastics seems
to be inexhaustible. The only thing left to do would be to ride the wave so to speak, and capture the
global market to take advantage of this great opportunity for growth.
It is with this in mind that the Philippine Plastics Industry Association (PPIA) is attempting to prepare
the plastics industry of the Philippines for competition with other markets in the Asia-Pacific region,
and hopefully capture the global market in the long run. The task is arduous and the goals would
definitely not be met without any external help.
The purpose of the Downstream Plastics Industry’s Competitiveness Roadmap is to present a
comprehensive and definitive analysis of the current state of the plastics industry and from this,
formulate possible courses of action which could benefit the industry. Ultimately, the aim is to ensure
the viability, sustainability, and competitiveness of the industry and its different sectors. The
information and statistics used in this paper were provided by the PPIA, Polystyrene Packaging Council
of the Philippines (PPCP), Pipes and Tubes Manufacturers Association of the Philippines Inc. (PTMAPI),
PVC Pipes Manufacturers and Dealers Association, Metro Plastics Recyclers Association Inc. (MPRAI),
PET Manufacturers’ Association, Flexibles Group, Philippine Weavers Association (PWA), with

ENHANCED ROADMAP PLASTICS INDUSTRY
7
representatives from the academe, and national government agencies led by the Department of Trade
and Industry-Board of Investments (DTI-BOI).
II. VISION & MISSION / GOALS & TARGETS
The downstream plastics industry is confident that its plans for future development will not only allow
the industry to recover from setbacks faced in the past, but flourish along with the rest of the Asia-
Pacific region. In providing the market with locally produced products and gearing to capture the
international market, the plastics industry hopes that the government will aid them in their endeavor
to bring about a healthy future for plastics in the Philippines.
A. VISION & MISSION
A proactively adaptive downstream plastic industry that is able to fully supply the growing and changing
demands of the domestic and export market, create employment opportunities with a positive well-
informed on the environmental image and perception.
B. GOALS & TARGETS1
1. Satisfy domestic demand and be a leading contributor to the Philippine export
basket.
2. Promote a high level of workforce productivity.
3. Be innovative in process.
4. Develop a sustainable industry mindful of our limited/finite resources.
5. Promote/ develop / strengthen the plastics recycling industry.
6. Create a wide range of innovative products with the best consumer value
For our first goal, “Satisfy domestic demand and be a leading contributor to the Philippine export
basket”, the industry needs to secure and monitor the information on domestic plastics demand and
requirements. This will enable the industry to tap these markets and adapt its operations to meet their
needs. A strong domestic demand allows manufacturers to improve their economies of scale and
increase their potential to be export competitive. By 2016, the plastics industry should be able to
develop the local market, venture towards the ASEAN market by 2022, and the global market by 2030
through trade promotions. Creating a One Stop Shop to minimize if not totally eliminate red tape will
encourage plastic manufacturers to venture into tapping export markets thereby providing the industry
with a sustainable export growth.
1 Adopted from the SPIK Chemicals Industry Master Plan

ENHANCED ROADMAP PLASTICS INDUSTRY
8
Our second goal aims to “Promote a high level workforce productivity”, stresses the need to retain
the industry’s technical workforce to stay competitive. Most of the skilled workers trained by the
industry get “pirated” by plastic manufacturers abroad because of higher compensation. The industry
needs to develop a program that will first attract, train and then retain workers to improve workforce
productivity. Aligned with this is that the industry needs to work with academic institutions for
technical development. Unions form an integral part of our local workforce and promoting social
dialogue with them is essential for industrial peace. The industry aims to promote the integration of
the values of innovation in the primary and secondary level of education into the academic curricula
to prepare them to work for the industry after the government’s K+12 program, or pursue tertiary
education through applied chemical courses integrated with the formal curricula related to Science
and Technology and hopefully produce a pool of MS/PhD in the field of plastics by 2022 and have
trained Filipino scientists for the plastics industry by 2030.
The third goal strives to, “Be innovative in process”. To achieve this, a Research and Development
Center for the plastics needs to be set-up. Developing partnerships with academic institutions and
private groups for the development of innovative process technology and in the future, forge
partnerships with foreign institutions for the further development of process technologies. By 2030
the Philippines’ plastics industry should be at least at par with the ASEAN +4 in terms of product and
process innovation.
The fourth goal, “Develop the industry sustainably mindful of finite/limited resources”, the industry
needs to promote the value and principle of 3R within its manufacturers. The industry should be lobby
for legislative policies and regulations in support of the recycling industry. To avert the negative
perception by the general populous on plastics and environment here in the Philippines fueled by false
information from non-government environmental organizations, enhancing the industry’s image as an
industry that contributes to sustainability would be a priority. By 2022, the plastics industry should be
a leader in innovative products that addresses climate change and green products and processes should
also have a significant development at this point of time.
To “Promote/develop/strengthen the plastics recycling industry” is the fifth goal. The further
development of the plastics recycling industry not only complements the preceding goal, but, more
importantly, also significantly contributes to the development of the entire industry. Recovery for
recycling of material inputs must be strengthened and institutionalized. By 2016 there should be a 20%
recovery and recycling of disposable input and by 2022, a further increase of 20% and achieve a total
of 60% by 2030. There must be a drive towards keeping recyclable resources locally in lieu of the
current practice of profit oriented, backyard/underground traders in the practice of exporting.
Providing incentives such as Income Tax Holidays and Value Added Tax Exemption for this industry

ENHANCED ROADMAP PLASTICS INDUSTRY
9
sector for both existing and pioneering recycling companies would enhance activities and encourage
players to modernize their equipment and further improve existing waste management facilities to fully
comply with existing environmental laws. By 2022 the plastics industry should develop and promote
products with high recycled content, and by 2030, the consuming public would fully patronize recycled
products with the local industry’s commitment to quality and performance through research.
Innovation on products is essential for an industry to strive and prosper. With this comes our last goal,
“Create a wide range of innovative products with the best consumer value”. Essential to this goal is
Research and Development. To achieve this, partnerships must be forged with both local and
international institutions to aiming to conceptualize and design products that aim to improve
performance and functionality – whether it is for packaging, construction, agriculture, automotive, food,
etc... Both incentives and safety nets must be in place to ensure its viability and cost recovery to
enhance this activity. Joint government and private efforts should also be made to market to both local
and overseas markets.
Table 1. Goals of the Philippine Plastics Industry
GOALS OBJECTIVES/OUTCOMES INDICATORS
Satisfy domestic demand and be a leading contributor to
the Philippine export basket
Increased utilization and patronage of locally produced
plastic products
Sustainable growth for
increased export performance
Increased domestic outputs
Decreased imports of plastic finished
products and products where plastics
is a major cost component by
ensuring a rational, non-distortive
tariff structure for raw materials and
finished products
Sustainable export sales
Promote a high level of
workforce productivity
To have a pool of skilled,
trained and motivated
workforce for levels of
productivity
Labor productivity: Unit Output/Man
Hours
Innovative processes Improved production efficiency and productivity
New technology produced
Number of new processes introduced
Develop the industry
sustainably mindful of
finite/limited resources
Responsible utilization of
resources
Reduce production waste
Reduce power consumption
Utilization of recycled/
recyclables materials
Number of products adopting the
principles of 3R (REDUCE by down
gauging, REUSE by developing reusable
products, and RECYCLE by increasing
percentage of recycled materials and
developing dependable recyclable
products)
Promote/develop/strengthen
the plastics recycling
industry
Positive environmental image
for the industry
Increased recovery of recyclable
plastics from waste stream
Create more job opportunities
for marginalized sector waste
picker
Market patronizing recycled products
Improved recycling rate
Improved employment in the recycling
industry including marginalized sector
(informal waste pickers)

ENHANCED ROADMAP PLASTICS INDUSTRY
10
GOALS OBJECTIVES/OUTCOMES INDICATORS
Create a wide range of
innovative products with the
best consumer value.
New product offerings that:
Are competitive in price, quality
and service.
Develop new applications and
innovations that promotes/leads
to improved product/packaging
performance.
Are environmentally acceptable
Are diversified and
differentiated.
Number of products introduced for
specific market, uses and comparative
advantage
Number of patents and trademarks
applied for
C. STRATEGIES & TIMELINES
To streamline its efforts, the industry has crafted specific action points or strategies with short-term
(2016), medium-term (2022), and long-term (2013) goals, which was adopted following the
Chemicals Industry Master Plan strategies and timelines.
2016 (Strong Philippines) - established competitiveness of chemical industry in price,
quality, service and delivery and becoming a regional player in the chemical industry
2022 (Enter ASEAN + 4 Doors)- marks the chemical industry as an export
industry and innovative in addressing climate change
2030 (Global Market Capture) - marks the chemical industry as the 3rd largest
export industry and also lead the country in climate change
The goals and strategies with timelines presented in Table 2 provide a clear direction for the domestic
plastics manufacturing industry. The participation, cooperation and commitment of both the private
sector and the government are key components to achieving its objectives.

ENHANCED ROADMAP PLASTICS INDUSTRY
11
Table 2. Goals and Targets of the Plastics Industry
Goal 2016
Strong Philippines
2022
Enter ASEAN + 4
Doors
2030
Global Market
Capture
Responsibilities
Satisfy domestic
demand and be
a leading
contributor to
the Philippine
export basket
Secure and monitor
information for
domestic plastics
requirements
Push for the removal of
existing Tariff Distortion
in the form of duty free
access to raw materials
(both MFN and ASEAN)
Develop markets
through trade
promotion
Creation of a One Stop
Shop to help local
plastic exporters
minimize red tape
Sustainable export
growth
Supply domestic
requirements with
plastic products
Developed ASEAN
market through trade
promotion
Developed global
market through
trade promotion
Government
DTI, DTI-BETP,
DOF
Private Sector
PPIA, FPI &
FFCCCII (Buy
Pinoy Movement),
PRA, PASI,
PAGASA
Promote a high
level of
workforce
productivity
Attract, develop and
retain the workforce so
that the industry can be
forefront of process and
product innovation
Develop a steady
stream of technically
highly skilled manpower
and trainors.
Continuing education
and training programs
Coordinate with
academic institutions for
technical development.
Continued promotion
of social dialogue and
industrial peace.
Develop pool of
MS/PhD graduates in
the field of plastics
Promote value of
innovation in the
primary and secondary
level
Develop industry work
preparedness in
secondary level
Applied chemical
courses integrated
with the formal
curriculum related to
Science & Technology
(e.g. chemistry,
chemical engineering,
material science)
Trained Filipino
scientists
(chemist/ chemical
engineers) for
developing
patented products
and services.
Government
TESDA, CHED,
PICHE, ICP
Innovative
processes
Set-up R&D Center
for plastics
Develop partnership
with academic
institutions and private
groups (e.g. TESDA,
CHEd, DOST, Filipino
Inventors, ICP, PICHE)
for development of
innovative process
technology
Forge partnerships
with foreign
institutions for
development/adoption
of process
technologies.
At par with
ASEAN +4 in
terms of product
and process
innovation
Government
DOST
Private Sector
PPIA
Academic
Institutions
Develop the
industry
sustainably
mindful of
finite/limited
resources
Increased number of
companies practicing
3Rs
Enhanced industry
image as an industry
that contribute to
sustainability
Lobby for legislative
policies and regulations
in support of the
RECYCLING to the
industry (e.g.
RECYCLING LAW)
Leading industry in
innovative products
addressing climate
change
Development of more
green processes and
products
Leading industry
in innovative
products
addressing climate
change
Government
Congress, DENR-
NSWMC, DOST-
ITDI
Industry Groups
Chemical Industry,
Academic
Institutions and
Research Centers

ENHANCED ROADMAP PLASTICS INDUSTRY
12
Goal 2016
Strong Philippines
2022
Enter ASEAN + 4
Doors
2030
Global Market
Capture
Responsibilities
Promote/
develop/
strengthen the
plastics
recycling
industry
Recover and Recycle
20% of material inputs
Development of
Recycling Industry
Specific Incentives (e.g.
ITH and VAT
exemption) for existing
& new recycling
companies to improve
facilities and conform to
RA 9003 and other
related environmental
laws.
Develop new and
improve/ /modernize
existing recycling
facilities.
Develop alternative
recycling technologies
for low value
recyclables (e.g. waste
to innovative products/
waste to fuel/ waste to
energy)
Policy support
regulating export of
scrap plastics to protect
the local recycling
industry.
Integration of Informal
Sector Waste Pickers to
the solid waste
management stream.
Improve recovery
systems for plastic
waste
Recover and Recycle
40% of material inputs
Develop technologies
to improve recycling
efficiency
Improve recycling
technologies.
Develop & promote
products with high
recycled content
Develop eco-parks
utilizing recycled
plastics/ recyclable
materials.
Promote government
procurement
preference on recycled
products or products
with recycled contents.
Improve alternative
recycling technologies.
Recover and
Recycle 60% of
material inputs
Promotion to
market to
patronize/give
premium to
recycled products
or products with
recycled contents.
Improve physical
and mechanical of
recycling
technologies/prod
ucts through R&D
Adopt alternative
recycling
technologies
nationwide.
Put up recycling
and production
facilities in major
cities and
provinces/municip
alities
Government
DENR-NSWMC,
DOST-ITDI, DILG-
LGUs, MMDA,
DTI-BOI
Private Sector
PPIA, MPRAI, PRA,
PASI, PAGASA
Create a wide
range of
innovative
products with
the best
consumer
value.
Increased R & D for
innovative plastic
products
Full integration of
petrochemical industry.
Create applicable plastic
products for
agri/fisheries, furniture
food use, packaging,
medical & health care,
automotive,
construction
Develop incentives for
innovative/pioneer
product
Develop safety nets to
products from changing
government policies.
Forge partnerships with
international institutions
to help develop
innovative products
Develop innovative
plastic products for
ASEAN market
Expansion of capacity
and production of
plastic products.
Develop incentives for
innovative/pioneer
products
Develop
innovative plastic
products for
Global market
Expansion of
capacity and
production of
plastic products
Develop
incentives for
innovative/pioneer
products
Government
DTI (BOI/ BPS/
BETP), DOST, DA.
DOH, DPWH,
DOF, PSA, NEDA,
DOF
Private Sector
PPIA, APMP, SPIK,
PIP, PCCI/ FPI,
CIAP, PACCI (local
auto assemblers),
Philexport, PRA,
PASI, PAGASA
Academe
Inventors Assn

ENHANCED ROADMAP PLASTICS INDUSTRY
13
III. STATE OF THE INDUSTRY
A. STRUCTURE
I. Sectoral Coverage
The Philippine downstream plastics industry refers to the plastic fabricators and manufacturers which
convert plastic resins to industrial and consumer finished products. It serves as an allied industry with
strong linkages to:
Automotive and Transportation
Home Appliances
Food, Drug, and Cosmetics
Soap and Detergent
Fiber and Textiles
Electrical and Electronics
Buildings and Construction
Healthcare
The PPIA has also categorized its subsectors as such based on their finished products:
Flexible plastics
Net, twine and sack
Pipes and fittings
Plastic bags
PVC products
Recycled plastics
Rigid plastics
Styro products
Tapes and Others
While there are a few large companies, the industry is mainly comprised of small to medium scale
enterprises with varying and wide degrees of equipment sophistication. Majority of the companies are
situated in the CAMANAVA (Caloocan, Malabon, Navotas, Valenzuela) area, while others are from
Manila, Pasig and the CALABARZON (Cavite, Laguna, Batangas, Rizal and Quezon).
Main production processes include film and sheet extrusion; injection moulding; compression
moulding; extrusion blow moulding: injection blow moulding; injection stretch blow moulding; pipe
and profile extrusion; net and twine extrusion; woven sack extrusion and weaving; sheet
thermoforming, printing, lamination, slitting and bag forming; and recycling. A survey conducted by
PPIA in May 2012 reveals that most companies adapt top of the line, state of the art technologies from
Europe for their operations, especially large scale industries with high quality and volume demands.
On the other hand, companies using old, outdated and cheap equipment still remain, for small scale
industries where volume requirements are low. The strength of these smaller companies is that they
keep their overhead low and are capable of modifying and retrofitting their machines to improve their
efficiency. For this, the industry is given an internal overall medium rating for their operations.

ENHANCED ROADMAP PLASTICS INDUSTRY
14
2. Supply Chain and Industry Linkages
Figure 1. Backward and Forward Linkages of the Plastics Industry
The Philippine plastics industry can be categorized according to the following manufacturing stages:
Upstream manufactures the basic raw materials called monomers from naphtha which is an
oil refinery by-product.
Midstream produces the plastic resins or polymers from monomers represented by the
Association of Petrochemical Manufacturers of the Philippines (APMP). However,
developments took over with the production capacities of the midstream industries. The NPC
Alliance Corporation (formerly Bataan Polyethylene) produces 275,000 MTPY of Polyethylene
(PE), the Petron Corporation (formerly Philippine Polypropylene Inc.) utilizing its Fluidized

ENHANCED ROADMAP PLASTICS INDUSTRY
15
Bed Catalytic Converter boosted its Polypropylene (PP) production capacity to 160,000
MTPY, and JG Summit Petrochemical Corporation with its Naphtha Cracker Plant Project is
set to increase its production of PE to 380,000 MTPY and PP to 190,000 MTPY. The supply
of Polyvinyl Chloride (PVC) from the Philippine Resins Industries Inc. (PRII) at the current
capacity is 160,000 MTPY and Polystyrene (PS) by Chemrez Technologies at 30,000 MTPY
would likewise remain stable. The Polyethylene Terephthalate (PET) supply would continue
to be imported.
Downstream represents the local plastic fabricators and converters who use the plastic resins
to manufacture packaging, industrial and consumers’ plastic products. There are only a few
large downstream facilities. Majority are small and medium scale enterprises with varying and
wide degrees of equipment sophistication. The industry is categorized into subsectors based
on their finished products such as: Flexible plastics, Net, twine and sack, Pipes and fittings,
Plastic bags, PVC products, Recycled plastics, Rigid plastics, Styro products, Tapes and Others.
Based on industry survey, there are more than 1,000 plastic fabricators and converters
nationwide. The labor force in the industry is estimated at 600,000 direct and indirect workers
as production of plastic products have to go through many labor-intensive stages. These
include the preparation of the plastic resins i.e. mixing with additives/colorants or
compounding before extruding, molding, forming or laminating the plastic products, and
additional workers or cutting, printing, labeling, packing and warehousing stages. The raw
materials consumed by the downstream plastic industry are mostly imported as local
midstream petrochemical companies still has to meet this requirement.
The industry lacks an upstream sector to provide the midstream with ethylene and propylene. The
midstream which manufactures synthetic resins (polyvinyl chloride (PVC), polystyrene (PS),
polypropylene (PP) and polyethylene (PE) for the downstream sector, had to import and are vulnerable
to foreign exchange fluctuations and tariff rates. This part of the industry has not grown very large due
to the insufficient supply of inputs from its upstream sector. The current shape of the industry is
central to the downstream industry. There are 1,600 companies in the downstream industry. Some
of the companies, particularly the small ones, have encountered problems that force them to close
and sell their business to larger plastic manufacturing companies

ENHANCED ROADMAP PLASTICS INDUSTRY
16

ENHANCED ROADMAP PLASTICS INDUSTRY
17
3. Industry Players and Associations
The Philippine Plastics Industry Association, Inc. (PPIA) is the country’s premiere association of plastic
fabricators with members engaged in molding, extrusion, weaving, lamination, recycling, and more. It
was formed on 18 January 1970 with its office building located at 122 A Del Mundo St, between 10th
and 11th Avenues, Caloocan City, Metro Manila, Philippines. Its leadership in 2014 consists of 51
officers, of whom 49 are men and 2 are women.
The PPIA began as an organization dedicated to the promotion of cooperation and understanding
among plastic product manufacturers in the country. It has built a reputation as the “Voice of the
Philippine Petrochemical Downstream Plastics Industry”, effectively representing the industry in
resolving significant issues and concerns affecting competitiveness, interests in key policies and
legislation – particularly on tariffs, environmental laws, customs rules and regulations, and product
standards, among others.
The PPIA is actively involved in addressing environmental issues. In May 2003, it converged with the
major plastics sector groups and allied industries in the country to carry out a uniform advocacy and
information and educational campaign on proper plastic waste management, recovery, and recycling
by convening an ad hoc group called the Multi-Sectoral Committee on Plastics and the Environment.2
PPIA co-organizes trade exhibitions to promote business opportunities for locally produced products
and enhance linkages to the latest plastics manufacturing technologies from around the world.
The PPIA maintains active affiliations with local organizations such as the Federation of Filipino Chinese
Chamber of Commerce and Industry (FFCCCII), the Philippine Chamber of Commerce and Industry
(PCCI), the Federation of Philippine Industries (FPI), the Exporters Confederation of the Philippines
(PhilExport), the Philippine Employers & Labor Social Partnership, Incorporated (PELSPI), Samahan sa
Pilipinas ng mga Industriyang Kimika (SPIK) and the Solid Waste Management Association of the
Philippines (SWMAP). Internationally, PPIA co-organized and has been the country's representative
in the ASEAN Federation of Plastic Industries (AFPI) since its establishment in 1981 and the Asian
Plastics Forum (APF), a regional grouping formed to discuss and address environmental issues on
plastics. It is also a member of the Council of International Plastic Associations Directors (CIPAD) and
the Global Plastic Litter Group where PPIA is the country’s signatory to the Declaration for Solutions
on Marine Litter.3
2 Members include PNOC Alternative Fuels Corporation (PNOC-AFC), formerly Petrochemical Development
Corporation of the Philippine National Oil Corporation (PNOC-PPDC), Association of Petrochemical Manufacturers of
the Philippines (APMP), Polystyrene Packaging Council of the Philippines (PPCP), Metro Plastics Recyclers Association Inc.
(MPRAI), PET Manufacturers’ Association (PETMA), Flexibles Group, Packaging Institute of the Philippines (PIP), Soap and
Detergents Association of the Philippines (SDAP), among others. 3 http://www.marinedebrissolutions.com/Global

ENHANCED ROADMAP PLASTICS INDUSTRY
18
4. Factors Affecting Supply and Demand
Supply. The raw materials consumed by the downstream industry are mainly imported since the local
midstream petrochemical companies have yet to meet its requirements. With recent developments,
including the recent takeover of NPC Alliance Corporation (formerly Bataan Polyethylene) and
Philippine Polypropylene Inc. (PPI now under Petron Corporation, formerly Petrocorp), and upstream
movements, including Petron’s Fluidized Bed Catalytic Converter for Propylene to boost PPI’s
operations and JG Summit Olefins Corporation’s Naphtha Cracker Plant Project set to be on stream
by 2014 to boost JG Summit Petrochemical Corporation’s operations, there is confidence that there
would be stable, consistent and competitively priced supply of polymer resins from the domestic
market to fulfill the needs of local plastic manufacturers for Polyethylene (PE – HD & LD) and
Polypropylene (PP) materials. The supply of Polyvinyl Chloride (PVC) from Philippine Resins Industries
Inc. (PRII) who controls the market and Polystyrene (PS) from Chemrez Technologies, both local
manufacturers, on the other hand, remains stable. Polyethylene Terephthalate (PET) is 100% imported.
Chart 1 illustrates the consumption of major raw materials by the domestic downstream industry. It
shows that PE dominates consumption from 2001 to 2011, followed by PP, PVC and PS. PET is slowly
gaining ground with a relatively consistent growth rate.

ENHANCED ROADMAP PLASTICS INDUSTRY
19
Chart 1. Philippine Plastic Raw Material Consumption
Demand. The plastics industry mostly caters to the local market, and with an official population data
of 100 million Filipinos released by the NSO in 2015, there is a big potential market. Unfortunately,
local consumers tend to patronize cheap products, particularly imported goods that do not conform
to safety and quality standards. Furthermore, countries like China have economies of scale with its
large domestic and export base, while other ASEAN countries might be enjoying have government
support to encourage exports
Export opportunities are present, although tapping the same is challenging due to cost competitiveness
(high cost of electricity, labor and raw materials). Local documentary and red tape as well as delays in
recovering tax credits contribute to its additional challenges. With ASEAN economic integration in
2015 and more and more global players shifting their operations out of China, there is a need to
review and assess opportunities that would allow not only foreign investments to come to the
Philippines but also encourage exports among local players.
A review of the free trade agreements entered by the Philippines is in order. Placing plastic raw
materials under sensitive and highly sensitive list to protect the midstream petrochemical industry
curtails the growth of the downstream plastic manufacturing industry since most of the raw materials
used are imported. Thus, the removal of potential distortive tariff policies would “level the playing
field” and allow local manufacturers to compete and fulfill the demand of the local market.
Programs like “Buy Pinoy” should be actively promoted to shift the behavior of the market.
Government agencies should also strictly implement RA 9184 or the Government Procurement
Reform Act and plug loopholes that allow imported materials to be sold in the guise of local products.\
0
200,000
400,000
600,000
800,000
1,000,000
1,200,000
2001
2002
2003
2004
2005
2006
2007
2008
2009
2010
2011
2012
2013
2014
2015
Qu
anti
ty in
Met
ric
Ton
s
Year
Philippine Plastic Raw Material Consumption
Polyethylene Terepthalate
Polyvinyl Chloride
POLYSTYRENE
POLYPROPYLENE
POLYETHYLENE

ENHANCED ROADMAP PLASTICS INDUSTRY
20
Table 3. Consumption of the Plastics Industry (2015)
Polymer Approximate Percentage
Consumption of the downstream
industry
Polyethylene 49.12%
Polypropylene 35.61%
Polyvinylchloride 9.21%%
Polystyrene 6.06%
Polyethylene
Terephthalate (PET)
8.07%
Only polyvinylchloride and polystyrene are produced locally. The remaining 75% of inputs are
imported. Meanwhile, the main products for the plastic industry includes Polybags (woven sacks,
regular film bags, PVC pipes, Industrial crates, bottles and housewares). Hence, the main markets of
plastics include the manufacturers and producers of sugar and rice, millers and supermarkets,
contractors, hardwares, restaurants, fish dealers, bakeries, soft drink manufactures, cosmetics, health
care, food and pharmaceutical industries and consumers, wholesalers and retailers.
The demand determinants vary depending on the market. Industrial clients mainly look for
quality rather than price. For the mass consumer market, price is a critical factor.
B. ECONOMIC PERFORMANCE
According to the World Economic Forum on global competitiveness, the Philippines is being left
behind compared with its neighbors in ASEAN. However in the recent WEF survey, the Philippines
has improved its economic position while rising its rankings from 70th to 59th in 2013-2014, and is now
ahead of Cambodia, Vietnam, Lao PDR, and Myanmar in terms of competitiveness. ASEAN countries’
level of competitiveness are as follows (competitiveness ranking in parenthesis): Singapore (2), Malaysia
(24), Brunei Darussalam (26), Thailand (37), Indonesia (38), Philippines (59), Vietnam (70), Cambodia
(88), and Myanmar (139). Among the original five ASEAN countries, only the Philippines has been left
behind as a factor-driven economy while, Indonesia, Malaysia, and Thailand are classified as efficiency
driven and Singapore as innovation driven economies. The competitiveness of the Philippines is
weighed down by five major problematic factors in doing business, namely: corruption, inefficient
government bureaucracy, inadequate supply of infrastructure, policy instability and tax regulations.
ENHANCED ROADMAP PLASTICS INDUSTRY
21
Figure 3. Global Competitiveness Report, 2013-2014
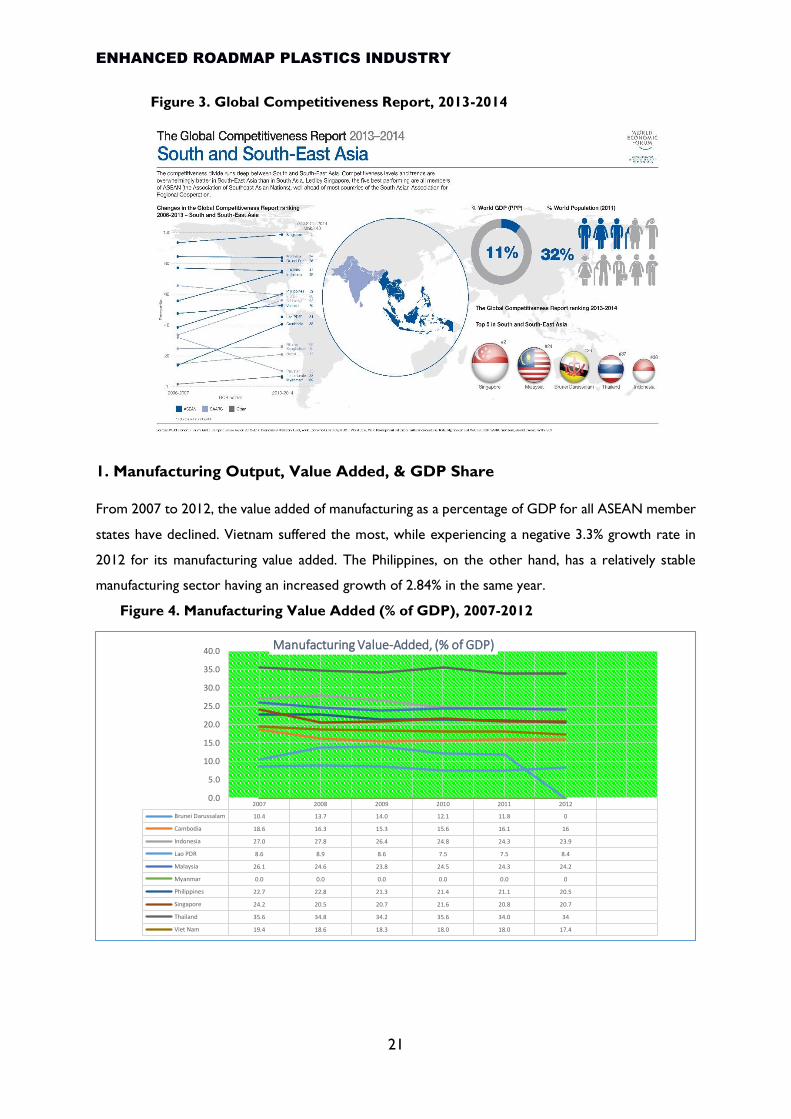
1. Manufacturing Output, Value Added, & GDP Share
From 2007 to 2012, the value added of manufacturing as a percentage of GDP for all ASEAN member
states have declined. Vietnam suffered the most, while experiencing a negative 3.3% growth rate in
2012 for its manufacturing value added. The Philippines, on the other hand, has a relatively stable
manufacturing sector having an increased growth of 2.84% in the same year.
Figure 4. Manufacturing Value Added (% of GDP), 2007-2012
2007 2008 2009 2010 2011 2012
Brunei Darussalam 10.4 13.7 14.0 12.1 11.8 0
Cambodia 18.6 16.3 15.3 15.6 16.1 16
Indonesia 27.0 27.8 26.4 24.8 24.3 23.9
Lao PDR 8.6 8.9 8.6 7.5 7.5 8.4
Malaysia 26.1 24.6 23.8 24.5 24.3 24.2
Myanmar 0.0 0.0 0.0 0.0 0.0 0
Philippines 22.7 22.8 21.3 21.4 21.1 20.5
Singapore 24.2 20.5 20.7 21.6 20.8 20.7
Thailand 35.6 34.8 34.2 35.6 34.0 34
Viet Nam 19.4 18.6 18.3 18.0 18.0 17.4
0.0
5.0
10.0
15.0
20.0
25.0
30.0
35.0
40.0Manufacturing Value-Added, (% of GDP)

ENHANCED ROADMAP PLASTICS INDUSTRY
22
Table 4 shows the highest and lowest value-added4 of plastics sub-industries in 2014. Among the
eight plastics sub-industries, the plastic articles for packing goods obtained the highest value-added,
having almost half the value for the entire plastics industry in the country. The manufacture of plastic
window, etc., on the other hand, gets the lowest value added due to very minimal difference
between value of output and the intermediate cost.
Table 4. Value Added of the Plastics Industry, 2014
Plastics Sub-Industries Value of
Output
Intermediate
Cost
Value-Added
plastic articles for packing goods (e.g. boxes, bags,
sacks, etc.) 54,242,715 41,625,441 10,550,481
plastic household wares 6,602,309 5,502,337 987,399
plastic and furniture fittings 15,884 10,766 3,765
plastic pipes and tubes 13,351,261 9,903,168 2,727,321
other plastic, industrial/office/school supplies 13,340,983 8,956,059 3,718,540
primary plastic products (e.g sheets, films, plates,
etc.) 3,446,570 2,926,225 394,965
plastic window and door screen, shades, and
venetian blinds 1,555,173 1,168,538 310,744
plastic products, n.e.c 10,368,118 7,039,177 2,778,733
Plastics Industry Total 102,923,013 77,131,711 21,471,948
Manufacturing Industry Total 4,505,501,799 3,040,550,408 1,162,565,558
Source: ASPBI, 2014
Figure 5 represents the major raw materials consumed by the domestic downstream industry. PE
dominates consumption from 2001 to 2015, followed by PP, PVC and PS, while PET is slowly gaining
ground with a relatively consistent growth rate. Data reveals that the sharp decline from 2003 to
2006 is attributed to tariff distortion where raw materials were imposed a duty rate of 15% (for
ASEAN-CEPT), while tariff of imported plastics finished goods is only 5%. With a slight correction of
the tariff structure, domestic resin consumption recovered from the period of 2007 to 2009 and
showed full recovery when tariffs for ASEAN-CEPT were eliminated in 2010. However, PPIA
maintains that tariff distortion still persists since the industry continues to import 55% its resin needs
from MFN countries (tariff adjusted from 15% to 10% per EO 61 in 2011) since ASEAN suppliers
cannot meet the local demand. Likewise, the PE consumption demand declined in 2011 due to the
banning of plastic bags by local government units but in 2015 its consumption reaches new heights.
4 Value added4 is the net output of a sector after adding up all outputs and subtracting intermediate inputs. It is calculated
without making deductions for depreciation of fabricated assets or depletion and degradation of natural resources.

ENHANCED ROADMAP PLASTICS INDUSTRY
23
Figure 5. Philippine Plastic Resins Consumption
Source: PSA
2. Trade
Chart 2 shows the import and export volume of plastic finished goods and clearly shows a trade deficit.
Over the past seven years, from 2006-2015, the average growth rate for imported finished plastic
products is 6.7%. In 2013, the year-to-year import volume of finished goods marginally increased by
4.60%, from 403,413,759 MT in 2012 to 422,074,562 MT in 2013.
In 2009, the country imported mostly raw materials of plastics since there are no domestic factories
of such products. Top imported raw materials of plastics in 2009 include ethylene (US$ 126.2 million),
polyether, expoxide (US$ 104.38 million), other olefin primary (US$ 74.5 million), silicone, primary
form (US$ 66.7 million), and self-adhesive materials (US$ 56.43 million). On the other hand, the
finished plastic materials that the Philippines imported were box, bag, closures (US$ 89.98 million),
plate and sheets (US$ 83.65 million), tube, pipes and hoses (US$ 38.81 million), and tableware and
housewares (US$ 20.9 million). Top importing countries include Japan, China, Indonesia, Taiwan and
Vietnam. The country also exported to Thailand box, bag, closures, etc. and other articles of plastics.
From 2006-2015, the exports of finished plastics has a declining average growth rate of -2.3%. For
2013 alone, the year-to-year export volume of these finished goods slightly grew from 88,659,000 MT
in 2012 to 90,083,294 MT in 2013. The top export plastic products include finished product such as
box, bag , closure, etc. (US$ 73.06 million), plate, sheet, etc. (US$ 27.82 million), waste, parings, scrap
(US$ 25.58 million), raw materials such as ethylene, primary form (US$ 66.96 million), other articles
of plastic (US$ 56.78 million), and self-adhesive materials (US$ 25.58 million). Top exporting countries
include Singapore, Thailand, Korea, Japan, USA and China.
0
100,000
200,000
300,000
400,000
500,00020
01
2002
2003
2004
2005
2006
2007
2008
2009
2010
2011
2012
2013
2014
2015
Qu
anti
ty in
Met
ric
Ton
s
Year
Philippine Plastic Raw Material Consumption
POLYETHYLENE
POLYPROPYLENE
POLYSTYRENE
Polyvinyl Chloride
Polyethylene Terepthalate

ENHANCED ROADMAP PLASTICS INDUSTRY
24
However, the major factors affecting supply include the oil prices increases of ethylene and propylene.
Since these raw materials are imported from abroad and prices are subject to currency changes,
currency fluctuations adversely affect the downstream industry because of the limited purchasing
power of their market. Most multinationals, such as Procter & Gamble and Colgate, now outsource
manufacturing operations to Thailand, Vietnam and other countries, because of their cheaper cost of
production. Wholesale clients are diminishing. As for the consumer market, downstream firms are
having difficulty in managing their costs due to the limited budget of consumers. Overall, the import
to export ratio has grown by 7.15% over the years (2006-2013). In 2013, year-to-year import-export
ratio slightly increased by 2.8%, with 4.55 in 2012 to 468 in 2013.
Chart 2. Import and Export of Finished Goods
Source: PSA
Table 5. Imports and Exports of Plastic Products
Source: PSA
3. Investment
-
50,000
100,000
150,000
200,000
250,000
300,000
350,000
400,000
450,000
PHIPPINE PLASTICS FINISHED GOODS IMPORT-EXPORT (2001 TO 2015)
Import Export
In M
etri
c

ENHANCED ROADMAP PLASTICS INDUSTRY
25
Industry estimates downstream investments cost at Php 600 billion. The major components of the
cost are plant, property and equipment, coupled with raw materials, power cost and workers’ salary
(see Box 1). Total employment in the industry is estimated to be around 650,000 workers.
Box 1. PPIA Total Downstream Plastics Industry Investments Cost
Box 2. Investment Opportunity for the Plastics Industry
Parameters
A- 120,000- Cost of machinery per or one (1) metric ton of product
B -120,000- Cost of equipment and auxiliaries (not limited to molds, compressors, chillers, etc.)
C -240,000- Total A + B
D -703,672- 2012 Total Resin Consumption in MT
Computation
1. Estimated cost of machinery, equipment and auxiliaries (C * D) - PHP 168,881,280,000 28.15% per
resin consumption
The other major investments:
2 RM inventory and Working Capital - 149,718,700,000 25.00%
3 Building, Land and Electrical - 221,400,020,000 36.90%
4 Transport Vehicles - 60,000,000,000 0.00%
Total Investment - PHP 600,000,000,000 100%
or $13,953,488,372

ENHANCED ROADMAP PLASTICS INDUSTRY
26
Case Study: OPPORTUNITIES OF THAI COMPANIES TO EXPAND AND PENETRATE INTO THE
PHILIPPINE MARKET OF PLASTICS
Based on the previous data, Thailand has already penetrated the Philippine market of plastics
specifically on raw materials such as ethylene, primary form, polyether, expoxide, other olefin primary, silicone
primary, etc. Hence, finished products that the country imported from Thailand are box, bag, closure, other
plate and sheets, tubes, pipe, hoses and fit. Philippines has a greater advantage to import from Thailand
because the country can avail of the ASEAN CEPT rate which is “0%” and the cost of transportation will be
cheaper.
Meanwhile, Thai Companies can invest in the Philippines particularly the “upstream and midstream
industries” for the Plastic Industry since they can avail of the Foreign Investments Incentives from the Board
of Investments in the Philippines. Likewise, there are no government regulations for this kind of industry.
Thai companies deciding to invest in the Philippines should consider the naphtha crackling plant which supply
ethylene and propylene, to set up a synthetic resin manufacturing plant, and to act as one group in the
international market to be able to capture transactions that require bigger volumes.

ENHANCED ROADMAP PLASTICS INDUSTRY
27
4. Financial
Table 6 shows the sub-plastic industries revenue in 2010. The total revenue for the industry is about
1.93% of the manufacturing sector. Of the three major sources of revenues in the industry, the value
of products and by-products has the largest share to revenue with 98.08% of the plastics industry and
1.89% of the manufacturing sector. Of the eight sub-industries, the following recorded an above plastic
industry revenue average: plastic articles for packing goods; plastic pipes and tubes; and other
industrial/office/school supplies. Overall, the plastics industry revenue average is less than the
manufacturing sector revenue average.
Table 6. Revenue by Plastics Sub-Industry, 2010
Plastics Sub-Industries Total Revenue per
Establishment
Value of
Products and
by-Products
Value of
Industrial
Services
Done for
others
Value of
Non-
industrial
Services
Done for
others
plastic articles for packing
goods (e.g. boxes, bags, sacks) 40,021,945 138,007 39,493,494 23,391 106,830
plastic household wares 3,787,781 64,200 3,760,886 11,692
plastic and furniture fittings S S S S S
plastic pipes and tubes 8,215,246 195,601 8,137,220 7,365
other plastic,
industrial/office/school supplies 10,550,252 131,878 10,420,013 5,567
primary plastic products (e.g
sheets, films, plates, etc.) 2,265,012 87,116 2,223,064 8,226 4,286
plastic window and door
screen, shades, and venetian
blinds 585,609 39,041 546,329
plastic products, n.e.c 4,637,757 51,531 4,142,263 377,833
Plastics Industry Total 70,063,602 116,385 68,723,269 409,450 135,740
Manufacturing Industry
Total 3,623,370,280 222,716 3,494,109,288 36,305,231 9,079,935
"s" denotes suppressed data to avoid disclosure of individual establishment’s data.
Source: ASPBI, 2010
Table 7, on the other hand, shows the computed cost per establishment of the Philippine plastics
industry in 2010. The manufacture of plastic articles for packing goods, and plastic pipes and tubes
again top the list for having the highest and more than the plastics industry average cost. Raw materials
account for the largest cost component with about one-third of the plastics total cost; and with less
than 1% of the entire manufacturing cost. The least share to cost, on the other hand, is relegated to
fuels and lubricants with a mere 0.13% share to total plastics industry cost. The other expenses
component, which comprises at least 2.5% share to industry, is an aggregate of: 1) goods purchased
for resale; 2) interest expense; 3) taxes on products and production; 4) research and experimental
development; 5) environmental protection expense; 6) royalty fee; 7) franchise fee; 8) foreign exchange
losses; 9) bad and doubtful debts; 10) depreciation of fixed assets; and 11) other costs.

ENHANCED ROADMAP PLASTICS INDUSTRY
28
Table 7. Cost by Plastics Sub-Industry, 2010
Plastics Sub-Industries
Cost per Establishment
Raw Materials Fuels,
Lubricants Electricity and Water
Industrial Services Done by Others
Non-Industrial Services Done by Others
Other Expenses
plastic articles for packing goods (e.g. boxes, bags, sacks, etc.)
116,616 23,760,995 283,157 3,412,748 904,817 2,602,058 984,180
plastic household wares
56,892 2,518,831 27,157 515,958 96,520 52,138 79,339
plastic and furniture fittings
S S S S S S S
plastic pipes and tubes
164,693 5,382,193 68,371 578,812 66,975 320,113 120,194
other plastic, industrial/office/school supplies
93,459 4,966,998 38,151 875,792 145,256 681,784 115,807
primary plastic products (e.g sheets, films, plates,etc.)
66,228 1,315,334 46,717 143,130 31,314 84,359 19,049
plastic window and door screen, shades, and venetian blinds
32,944 374,876 12,020 31,562 8,529 30,080 32,439
plastic products, n.e.c
40,619 2,456,555 74,734 313,351 76,868 321,838 95,060
Plastics Industry Total
95, 417 17,014,787 550,307 5,871,353 1,330,279 4,092,370 1,446,068
Manufacturing Industry Total
172,870 1,952,181,832 182,657,685 85,260,697 79,358,216 204,939,609 89,026,884
s" denotes suppressed data to avoid disclosure of individual establishment’s data.
Source: ASPBI, 2010
Table 8 shows the computed profit (total expenses less total revenue) for the eight plastics sub-industries in the country in 2010. The manufacture of other plastic (industrial/office/supplies)
registered the highest profit average with 1.41 pesos earned for every peso spent. This is opposite the
plastic household wares which only generate a mere 1.13 pesos revenue for every peso spent.
Table 8. Profit by Plastics Sub-Industry, 2010
Plastics Sub-Industries Revenue Cost Profit
Revenue
per Cost
plastic articles for packing goods (e.g. boxes,
bags, sacks, etc.) 40,021,945 33,818,905 21,389
1.18
plastic household wares 3,787,781 3,356,672 7,306 1.13
plastic and furniture fittings S S S S
plastic pipes and tubes 8,215,246 6,917,142 30,907 1.19
other plastic, industrial/office/school supplies 10,550,252 7,476,779 38,418 1.41

ENHANCED ROADMAP PLASTICS INDUSTRY
29
primary plastic products (e.g sheets, films, plates, etc.) 2,265,012 1,721,944 20,887
1.32
plastic window and door screen, shades, and
venetian blinds 585,609 494,169 6,096
1.19
plastic products, n.e.c 4,637,757 3,655,726 1,091 1.27
Plastics Industry Average 116,384 95,417 20,967 1.22
Manufacturing Industry Average 222,716 172,870 49,846 1.29
s" denotes suppressed data to avoid disclosure of individual establishment’s data. Source: ASPBI, 2010
5. Employment
Table 9 shows the eight plastics sub-industries in 2010. Total employment generated by all
manufacturing establishments reached 978,027 in 2010. Of this, 968,671 (99%) were paid employees
while the rest were working owners and unpaid workers (Annual Survey of Philippine Business &
Industry, 2010). Only three industries under plastics have this above employment average than the
manufacturing average of 60 workers per establishment. Of the total 37,345 workers employed by the
plastics industry, about 64% were men and 36%, women. About 8 of 10 male workers and 7 of 10
female workers are in production lines. As in other sub-industries of the chemicals industry, women
workers are in administrative or support offices. It is also interesting to note that all the plastic
industries have a compensation level that is less than the manufacturing average of Php 210,700 per
year. The highest and the lowest paid are in the manufacture of primary plastic products and in the
manufacture of plastic window and door screen, respectively.
The plastic industry in the Philippines is vital to the growth of the national economy. Allied industries
such as electronics, construction, food, cosmetics, packaging, automotive and many others depend on
its viability to strengthen its individual growths. Having a local source benefits all sectors with its
adaptive just in time delivery capabilities, and more importantly softens the impact brought about by
dollar and import requirements.
Table 9. Employment in the Plastics Industry, 2014
Plastic Sub-Industries Employment per
Establishment (PhP. 1,000)
Annual Compensation
per Paid Employee
(PhP. 1,000)
Value Added per Total
Employment (PhP. 1,000)
plastic articles for packing goods (e.g. boxes, bags, sacks, etc.) 68 181 415
plastic household wares 45 140 254
plastic and furniture fittings 8 135 157
plastic pipes and tubes 63 265 574
other plastic, industrial/office/school supplies 118 193 367
primary plastic products (e.g sheets, films, plates,etc.) 54 198 336
plastic window and door screen, shades, and venetian blinds 27 161 346
plastic products, n.e.c 39 265 448
Plastic Industry Average 422 1,538 2,897
Manufacturing Industry Total 49 258 950 Source: ASPBI, 2014

ENHANCED ROADMAP PLASTICS INDUSTRY
30
This manufacturing sector also contributes to the much needed employment for Filipinos and their
families. It allows the hiring of both skilled and unskilled personnel where they could eventually hone
their skills and move up the ladder. Most of its current supervisors rose from the ranks and with the skills training currently provided in-house (and this could eventually be improved and institutionalized
with the help of the K+12 and TESDA programs), it allows the trained workforce to eventually seek
better-paying job opportunities overseas. Most of the workforce in the predominantly family owned
companies for the industry is second generation, or children of existing employees. While labor unions are present, most of them are non-adversarial and PPIA continues to promote industrial peace through
social dialogue with the help of the Philippine Employers-Labor Social Partners Inc. (PELSPI), an
association composed of employers, labor and the academe with core principles revolving around the
three pillars of decent work, productivity and competitiveness.
6. Multiplier Effects
Multiplier effects are used to explain the effect of one subsector of the economy on other subsectors
as well as on household income and employment. This section was completed through an Input-
Output (I-O) analysis of the 2000 and 2006 I-O Accounts of the Philippines of the Philippine Statistical Authority5 using a semi-closed model.6
For the plastics industry, the 2000 and 2006 I-O tables provided by the NSO do not contain the same
set of sub-industries (see below). Note that in 2006, all the plastic sub-industries are re-grouped and
re-classified such that manufacture of synthetic resins, plastic materials, and other man-made fiber except glass, for instance, was divided into two industries: 1) manufacture of plastic products; and 2)
manufacture of plastic products in primary forms and of synthetic rubber.
Sub-industries in the 2000 I-O Table
Manufacture of plastic furniture, plastic
footwear, and other fabricated plastic products
Manufacture of synthetic resins, plastic materials,
and other man-made fiber except glass
Sub-industries in the 2006 I-O Table
Manufacture of plastic products
Manufacture of plastics in primary
forms and of synthetic rubber
Manufacture of plastic furniture
Global Total Output Multiplier and Multiplier Effects. Using the 2006 I-O Accounts of 240 industries, the
global total output multiplier for the plastic-related industries are 3.58 (plastic furniture), 3.46 (plastic
products), and 3.15 (plastics and synthetic rubber) respectively, which means that a one-peso increase
in final demand accordingly generates a corresponding potential increase of output in the economy.
Among these plastic sub-industries, the manufacture of plastic furniture7 ranks the highest at 71st. This
industry climbed from its previous ranking in 2000 (142nd) when it only had a multiplier of 3.113679.
5 PSA Input-Output Tables of the Philippines, 2014. http://www.nscb.gov.ph/io/DataCharts.asp. 6 The semi-closed input-output model treat both final demand and value-added flows as endogenous. In the semi-closed
input-output model, household activities (as reflected by the use of labor inputs by industries) and the purchase of different
goods and services by households are taken into account. 7 In the 2000 Input-Output Account, the manufacture of plastics furniture was then classified as manufacture plastics
furniture, plastic footwear, and other fabricated plastic products.

ENHANCED ROADMAP PLASTICS INDUSTRY
31
Table 10. Global Total Output Multiplier and Multiplier Effects
Rank Industry Global
Total
Output
Multiplier
Assumed
Increase in
Demand
(in pesos)
Total
Multiplier
Effects
(in pesos)
002 Manufacture of semi-conductor devices and other
electronic components
4.80542 100,000,000 480,542,000
004 Manufacture of Office, Accounting and Computing
Machinery
4.54647 100,000,000 454,647,000
006 Building and repairing of ships and boats 4.38619 100,000,000 438,619,000
007 Postal and courier activities 4.26725 100,000,000 426,725,000
008 Manufacture of other wearing apparel n.e.c 4.21325 100,000,000 421,325,000
009 Railway transport 4.17015 100,000,000 417,015,000
010 Agricultural, Forestry and Fishing Activities and
Services
4.12392 100,000,000 412,329,000
071 Manufacture of plastic furniture 3.58091 100,000,000 358,091,000
097 Manufacture of plastic products 3.46477 100,000,000 346,477,000
153 Manufacture of plastics in primary forms and of
synthetic rubber
3.15848 100,000,000 315,848,000
Table 11. Global Total Output Multiplier Comparison, 2000 and 2006
Industry
2000 2006
Multiplier Multiplier
Effects
Multiplier Multiplier
Effects
Plastic products 3.113679 311,367,900 3.46477 346,477,000
Plastic furniture 3.58091 358,091,000
Plastic resins 2.930925 293,092,500 3.15848 315,848,000
Domestic Total Output Multiplier and Multiplier Effects. When accounting only for domestic
inputs, the rankings of all the three plastic-related industries fell to 145th (plastic furniture, from 71st),
168th (plastic products, from 97th), and 169th (plastic & synthetic rubber, from 153rd) when compared
its global multiplier rankings. Table 12 shows that a one-peso increase in final demand in the plastics
furniture, for instance, would produce a 2.19 increase in output for the economy. Compared to the
2000 I-O result, this industry was at a lower ranking at 203rd, with a multiplier of 2.01.
Table 12. Domestic Total Output Multiplier and Multiplier Effects
Rank Industry Domestic
Total
Output
Multiplier
Assumed
Increase in
Demand
(in pesos)
Total
Multiplier
Effects
(in pesos)
004 Agricultural, Forestry and Fishing Activities and
Services
3.246345 100,000,000 324,634,500
005 Slaughtering and meat packing 3.207384 100,000,000 320,738,400
006 Railway transport 3.163985 100,000,000 316,398,500
007 Production, processing and preserving of meat and
meat products
3.046025 100,000,000 304,602,500
008 Postal and courier activities 3.026159 100,000,000 302,615,900
009 Production of prepared animal feeds 2.987544 100,000,000 298,754,400
010 Other animal including dairy production 2.976871 100,000,000 297,687,100
145 Manufacture of plastic furniture 2.190953 100,000,000 219,095,300
168 Manufacture of plastic products 2.084212 100,000,000 208,421,200

ENHANCED ROADMAP PLASTICS INDUSTRY
32
169 Manufacture of plastics in primary forms and of synthetic rubber
2.082086 100,000,000 208,208,600
Table 13. Domestic Total Output Multiplier Comparison, 2000 and 2006
Industry
2000 2006
Multiplier Multiplier
Effects
Multiplier Multiplier
Effects
Plastic products 2.013069 201,306,900 2.084212 208,421,200
Plastic furniture 2.190953 219,095,300
Plastic resins 2.025805 202,580,500 2.082086 208,208,600
Table 14 shows the global linkages for the Philippine plastic-related industries.8 The manufacture of
plastic furniture has a strong backward linkage but weak forward linkage. Similarly, the manufacture of
plastics in primary forms and synthetic rubber has weak backward linkage but strong forward linkage. A
strong backward linkage signifies that the industry induces demand for products of other industries. A
strong forward linkage, on the other hand, indicates that the industry stimulates production to other
industries with lower inputs.
Table 14. Global Backward and Forward Linkages Rankings
Global Backward Linkage Global Forward Linkage
Rank Industry Index Rank Industry Index
002
Manufacture of semi-conductor
devices and other electronic
components 1.4761 002 Wholesale and retail trade 20.4340
004
Manufacture of Office,
Accounting and Computing
Machinery 1.3965 003
Manufacture of refined
petroleum products 9.9722
006
Building and repairing of ships
and boats 1.3473 004 Crude oil and natural gas 7.1742
007 Postal and courier activities 1.3107 005
Generation, collection and
distribution of electricity 5.4308
008
Manufacture of other wearing
apparel n.e.c 1.2942 006 Real Estate Activities 3.1907
009 Railway transport 1.2809 007 Banking Institutions 3.1153
010
Agricultural, Forestry and Fishing
Activities and Services 1.2667 008
Manufacture of basic chemicals
except fertilizers and nitrogen
compounds 2.9262
71 Manufacture of plastic furniture 1.0999 009 Rice/corn milling 2.8007
97 Manufacture of plastic products 1.0643 25
Manufacture of plastics in
primary forms and of synthetic
rubber 1.5604
153
Manufacture of plastics in primary
forms and of synthetic rubber 0.9702 37 Manufacture of plastic products 1.1825
110 Manufacture of plastic furniture 0.5449
8 The relative strength of production linkages is measured by backward and forward linkage indexes. An index greater than
1 indicates relatively strong forward or backward linkage while an index less than 1 indicates relatively weak forward or
backward linkage. Meanwhile, the dispersion of the backward and forward linkages of the selected industries is measured
using the coefficient of variation. If the coefficient of variation of an industry is greater than the average coefficient of variation
for all industries, production linkages are deemed less evenly dispersed. If the coefficient of variation of an industry is less
than the average coefficient of variation for all industries, production linkages are deemed more evenly dispersed.

ENHANCED ROADMAP PLASTICS INDUSTRY
33
Table 15. Global Backward and Forward Linkages Rankings Comparison, 2000 and 2006
Industry
2000 2006
Backward
Linkage
Forward
Linkage
Backward
Linkage
Forward
Linkage
Plastic products 0.9820 Weak 1.5711 Strong
1.0643 Strong 1.1825 Strong
Plastic furniture 1.0999 Strong 0.5449 Weak
Plastic resins 9.9244 Weak 1.7870 Strong 0.9702 Weak 1.5604 Strong
All the plastics sub-industries have an evenly dispersed linkages, suggesting that these industries benefit
more other industries, both in their backward and forward linkages.
Table 16. Global Backward and Forward Linkages Coefficients of Variation
Industry Backward
Linkage
Coefficient of
Variation
Dispersion Forward
Linkage
Coefficient of
Variation
Dispersion
Manufacture of plastic furniture 2.2258 Even 2.9602 Even
Manufacture of plastic products 2.3650 Even 2.1011 Even
Manufacture of plastics in primary
form and of synthetic rubber
2.5763 Even 2.9602 Even
Table 17. Global Backward and Forward Linkages Coefficients of Variation, 2000 and 2006
Industry
2000 2006
Backward
Coefficient
Forward
Coefficient
Backward
Coefficient
Forward
Coefficient
Plastic products 2.4051 Uneven 1.8397 Even
2.3650 Even 2.9602 Even
Plastic furniture 2.2258 Even 2.1011 Even
Plastic resins 2.4149 Uneven 1.7257 Even 2.5763 Even 2.9602 Even
All the plastic-related industries have weak domestic backward and forward linkages. This is because
these industries produce final finished goods and consider imported inputs as a major component of
production.

ENHANCED ROADMAP PLASTICS INDUSTRY
34
Table 18. Domestic Backward and Forward Linkages Rankings
Domestic Backward Linkage Domestic Forward Linkage
Rank Industry Index Rank Industry Index
004
Agricultural, Forestry and Fishing
Activities and Services 1.4136 002 Wholesale and retail trade 20.5426
005 Slaughtering and meat packing 1.3966 003
Generation, collection and
distribution of electricity 5.5673
006 Railway transport 1.3777 004
Manufacture of refined
petroleum products 5.5255
007
Production, processing and
preserving of meat and meat
products 1.3264 005 Real Estate Activities 3.5961
008 Postal and courier activities 1.3177 006 Banking Institutions 3.4470
009
Production of prepared animal
feeds 1.3009 007 Palay 2.8237
145 Manufacture of plastic furniture 0.9540 008 Rice/corn milling 2.7736
168 Manufacture of plastic products 0.9076 009 Ownership of Dwellings 2.7273
169
Manufacture of plastics in primary
forms and of synthetic rubber 0.9066 47
Manufacture of plastic
products 0.9435
156
Manufacture of plastic
furniture 0.5133
195
Manufacture of plastics in
primary forms and of
synthetic rubber 0.4803

ENHANCED ROADMAP PLASTICS INDUSTRY
35
Table 19. Domestic Backward and Forward Linkages Rankings Comparison, 2000 and 2006
Industry
2000 2006
Backward
Linkage
Forward
Linkage
Backward
Linkage
Forward
Linkage
Plastic products 0.8533 Weak 0.9930 Weak
0.9067 Weak 0.9435 Weak
Plastic furniture 0.9540 Weak 0.5133 Weak
Plastic resins 0.8587 Weak 0.7660 Weak 0.9066 Weak 0.4803 Weak
With the exception of the manufacture of plastics and synthetic fiber, all the plastics sub-industries
have evenly dispersed linkages, which means these industries benefit more other industries in terms of
its backward linkages. The same is true with these industries’ domestic forward linkages which are all
evenly dispersed.
Table 20. Domestic Backward and Forward Linkages Coefficients of Variation
Industry Backward
Linkage
Coefficient of
Variation
Dispersion Forward
Linkage
Coefficient of
Variation
Dispersion
Manufacture of plastic furniture 2.2258 Even 2.9602 Even
Manufacture of plastic products 2.3650 Even 2.1011 Even
Manufacture of plastics in primary
forms and of synthetic fiber
2.5763 Uneven 2.9602 Even
Table 21. Domestic Backward and Forward Linkages Coefficients of Variation, 2000 and 2006
Industry
2000 2006
Backward
Coefficient
Forward
Coefficient
Backward
Coefficient
Forward
Coefficient
Plastic products 2.8567 Uneven 2.6103 Even
2.3650 Even 2.011 Even
Plastic furniture 2.2258 Even 2.9602 Even
Plastic resins 2.8216 Uneven 2.9365 Even 2.5763 Uneven 2.9602 Even
Global Total Household Income Multipliers. The global total household income multiplier
represents the effect of an industry on household incomes. Accounting for domestic and imported
inputs, the global total household income multiplier for the manufacture of plastic furniture is
0.390606, where this amount means the potential increase in the household income after a one peso
increase in final demand to this industry. Among the 240 industries, the industry occupies the 94th
spot. This same industry also topped the list in the 2000 I-O results, although with a lower ranking at
181st and a multiplier of 0.329881.

ENHANCED ROADMAP PLASTICS INDUSTRY
36
Table 22. Global Total Household Income Multiplier and Multiplier Effects
Rank Industry Global Total
Household
Income
Multiplier
Assumed
Increase in
Demand
(in pesos)
Total
Multiplier
Effects
005 Agricultural, Forestry and Fishing Activities and
Services
0.904719 100,000,000 90,471,900
006 Postal and courier activities 0.832204 100,000,000 83,220,400
007 Rubber 0.785083 100,000,000 78,508,300
008 Railway transport 0.714274 100,000,000 71,427,400
009 Private education services 0.704302 100,000,000 70,430,200
010 Labor recruitment and provision of personnel 0.683302 100,000,000 68,330,200
094 Manufacture of plastic furniture 0.390606 100,000,000 39,060,600
172 Manufacture of plastics in primary forms and of
synthetic rubber
0.310118 100,000,000 31,011,800
207 Manufacture of plastic products 0.262572 100,000,000 26,257,200
Table 23. Global Total Household Income Multiplier Comparison, 2000 and 2006
Industry
2000 2006
Multiplier Multiplier
Effects
Multiplier Multiplier
Effects
Plastic products 0.329881 32,988,1000 0.262572 26,257.200
Plastic furniture 0.39606 39,060,600
Plastic resins 0.304228 30,422,800 0.310118 31,011,800
Domestic Total Household Income Multipliers. Without the imported inputs, the domestic total
household income multiplier for the manufacture of plastic furniture 0.25. This suggests that a one-
peso increase in final demand would generate a corresponding 0.25 increase in household income.
Compared its global ranking, the plastic furniture went down from 94th to 141st spot. And with respect
to the 2000 I-O results, the industry had a further lower multiplier (0.210768) and ranking (201st).
Table 24. Domestic Total Household Income Multiplier and Multiplier Effects
Rank Industry Global Total
Household
Income
Multiplier
Assumed
Increase in
Demand
(in pesos)
Total
Multiplier
Effects
004 Agricultural, Forestry and Fishing Activities
and Services
0.820506 100,000,000 82,050,600
006 Postal and courier activities 0.719670 100,000,000 71,967,000
007 Rubber 0.705578 100,000,000 70,557,800
008 Railway transport 0.627910 100,000,000 62,791,000
009 Private education services 0.618353 100,000,000 61,835,300
010 Labor recruitment and provision of personnel 0.611125 100,000,000 61,112,500
141 Manufacture of plastic furniture 0.255869 100,000,000 25,586,900
176 Manufacture of plastics in primary forms and of
synthetic rubber
0.214673 100,000,000 21,467,300
218 Manufacture of plastic products 0.149307 100,000,000 14,930,700
Table 25. Domestic Total Household Income Multiplier Comparison, 2000 and 2006

ENHANCED ROADMAP PLASTICS INDUSTRY
37
Industry
2000 2006
Multiplier Multiplier
Effects
Multiplier Multiplier
Effects
Plastic products 0.210768 21,076,800
0.149307 14.930,700
Plastic furniture 0.255869 25,586,900
Plastic resins 0.202189 20,218,900 0.214673 21,467,300
Global Employment Multiplier Effects. Employment multiplier effects refer to the additional direct,
indirect, and induced employment generated in the economy due to a one-peso change in final demand.
Table 26 shows the employment effect or the number of potential workers plastic-related industries
and the entire plastic industry after a one-peso increase in its final demand. The plastics industry ranks
185th among the 240 industries analyzed, thus a peso increase in final demand for plastic products
accordingly generates a 1,411 jobs. The manufacture of plastics furniture, meanwhile, has the highest
employment effect among the three plastics sub-industries.
Table 26. Global Employment Multiplier Effect Rankings
Rank Industry
Employment
Effect
094 Manufacture of plastic furniture 1,999
172 Manufacture of plastics in primary forms and of synthetic rubber 1,588
207 Manufacture of plastic products 1,344
Table 27. Global Employment Multiplier Effect Comparison, 2000 and 2006
Industry 2000 2006
Employment Effect Employment Effect
Plastic products 2,232
1,344
Plastic furniture 1,588
Plastic resins 2,058 1,999
Domestic Employment Multiplier Effects. Table 28 shows the employment effect or the number of
potential workers for the plastics-related industries after a one-peso increase in final demand. The
plastics industry further lowered in ranking from 185th to 191st. As such, a one-peso increase in final
demand for plastic products would now only generate a total of 929 jobs.
Table 28. Domestic Employment Multiplier Effect Rankings
Rank Industry
Employment
Effect
141 Manufacture of plastic furniture 1,310
176 Manufacture of plastics in primary forms and of synthetic rubber 1,099
218 Manufacture of plastic products 764
Table 29. Domestic Employment Multiplier Effect Comparison, 2000 and 2006

ENHANCED ROADMAP PLASTICS INDUSTRY
38
Industry 2000 2006
Employment Effect Employment Effect
Plastic products 1,426
764
Plastic furniture 1,310
Plastic resins 1,368 1,099
The manufacture of plastic furniture topped the lists for all the multiplier categories. Currently, most
of the plastic companies in the Philippines are engaged in the manufacture of plastic packaging (e.g.
plastic bags), which is why the industry is greatly affected by any plastic ban.
C. OUTLOOK AND CHALLENGES
Industry Cost. Numerous concerns arise when looking at the cost of doing business here in the
Philippines as far as the plastics industry is concerned. High production costs are bad for
competitiveness. The cost of electricity in the Philippines is reported to be the highest in Southeast
Asia, and 2nd highest in Asia. The availability of local raw materials is also unstable, and its pricing,
being a commodity item, is volatile. Labor cost is also considered high vis-à-vis competitor countries,
with the average industry sector compensation at Php 14,000.0.
Technical. Standards are available for some plastic products (e.g. PVC pipes, chairs, etc.) and having
the PS (product standard) mark safeguards consumers against substandard goods whether local or
imported. It not only creates a level playing field for manufacturers, but could also be considered as a
non-tariff barrier against cheap goods from overseas. The standards should be enhanced to cover
more locally manufactured products and a mechanism must be in place to assist small manufacturers
to avail of the PS mark to remain competitive. More importantly, approved standards in the form of
a PS Mark or an ICC (Industry Commodity Clearance) for imported goods in the market must be
strictly implemented. Heavier penalties should be assessed to products that do not comply.
Research and Development for new products is a key component to finding niche markets through
innovation. For example, the Ministry of Commerce in Thailand and Chulalongkorn University is
currently embarking on extensive studies on converting feedstock commodities to value added
products such as Polylactic Acid (PLA) for bioplastics to benefit its national economy and stimulate
technological process advancements. Although the Philippines has a similar program through the
Department of Science and Technology’s Industrial Technology Development Institute, Material
Science Department (DOST-ITDI-MSD), the involvement of the academic community coupled with
partnerships with the industry could strengthen this.
Market. While the local market could be considered big with Philippine population at 92.3 million,
Filipino purchasing power remains low. Smuggled products proliferate in the market and authorities

ENHANCED ROADMAP PLASTICS INDUSTRY
39
tend to just look the other way. Local manufacturers find themselves crowding and fighting for specific
segments.
The industry estimates that the plastic bag and polystyrene paper (PSP) manufacturing sector accounts
for around 30% of domestic activities. Current regulations or banning of plastic bags and PS “Styro”
food packaging materials had led to a shift to paper bags and coated or laminated paper alternatives
by large fastfood chains or quick service restaurants, department stores, supermarkets and other
commercial establishments. The local paper manufacturing industry was not prepared for the increased
demand and this resulted to an increase in paper and paper products under Tariff headings 4819 and
4823. Data from the International Trade Department of the NSO show a 45% increase from 25,007
metric tons to 36,196 metric tons from 2010 to 2011. The increased cost is eventually passed on to
the consuming public, thus affecting their purchasing power.
The ban had resulted to a significant reduction in the industry’s contracted workers and the
replacement of a typical 6-day, 12 hour work week to a 4 to 5-day 6 to 8-hour work week rotation
for its regular workers from these sectors. Local plastic bans run inconsistent with national laws on
banning of non-environmentally acceptable products under RA 9003 or the Ecological Solid Waste
Management Act of 2000 in which scientific, fact-based approach is required before a product could
be considered as an environmental threat. Unfounded and inconsistent policies like these would
eventually lead to massive layoffs and plant closures that may jeopardize up to 175,000 employees
belonging to this local industry’s sub-sectors. Unless a national bill is enacted to supersede these local
ordinances, these industry groups may collapse leading to irreparable damages.
PPIA maintains that the right approach should be towards creating a recovery for recycling system
that would lead to proper waste management. The group looks forward to address the policy gaps
brought about by local ordinances with the help of government agencies through this roadmap. A
recovery for recycling system coupled with incentives would surely enhance the plastics recycling
sector, providing jobs and much needed government revenues.
Export opportunities await the sector as more and more global players are shifting their operations
out of China due to increasing costs. Aside from improving our country’s cost competitiveness and
creating a one-stop shop to eliminate, if not minimize, red tape to encourage more players, the
establishment of a forward purchase system for US dollars may be considered and established to
protect exporters from fluctuating currencies.
Institutional. Government support for existing industries is lacking in the Philippines to allow
expansion and growth. Incentives provided to exporters by the country’s various investment
promotion agencies (BOI, PEZA, et.al.) should be reviewed, promoted and enhanced to minimize red
tape that leads to corruption.

ENHANCED ROADMAP PLASTICS INDUSTRY
40
Smuggling remains a main issue to local manufacturers, including plastics. While efforts are being
instituted to curb this, smuggled goods remain rampant in the local market. Unless this concern is
addressed, it would continually pose challenges to the local industries.
Taxation is another main concern. In a joint report released by the Doing Business Initiative of the
World Bank, International Finance Corporation (IFC) and PricewaterhouseCoopers (PwC), the
Philippines ranked 143rd out of 185 economies in terms of “Paying Taxes”. The report also cited high
tax cost and burden of compliance based on three indicators namely total tax rate, time needed to
comply with major taxes and the number of tax payments. On the average, local companies pay a tax
rate of 46.6% of their commercial profit, higher than the global average of 44.7%. Taxpayers also have
to process payments 47 times a year, more than the global average of 27.2 payments. Businessmen
also cited instances of redundant taxation with provisions on local government taxation under the
Local Government Code (RA 7160), such as the capital equipment taxes imposed on machinery and
equipment, making it more costly to invest and expand business operations. It was also reported that
an average business would need to go through 47 tax payments taking a total of 195 hours.
Graft and Corruption, although minimized to a certain extent, remains prevalent.
Box 3. Competition in the Plastics Industry
Competition starts in the midstream and downstream sectors since no Philippine firm operates in the upstream
industry. Only JG Summit Petrochemical Corporation exists in the midstream industry, and it faces severe competition
from Thailand, Vietnam and Sri Lanka in the supply of synthetic resins.
Companies in the downstream industry compete very stiffly when it comes to price. Pirating staff from competitors
is being done. When a company is unable to meet the requirements of its clients, enterprises engage in “competition.”
Big companies sometimes outsource smaller companies and small companies group together to deliver the output
required by big companies.
On the other hand, even with the decreased tariff rates, the Philippines will have a difficult time competing with its
ASEAN neighbors. Variable costs are too high especially when it comes to electricity. In other countries such as
Vietnam and China, a 50%discount is given for electricity use when operations are continued in the evening. In the
Philippines, none of these incentives are available. In terms of wages, the Philippines can provide cheap labor. Wages
in the Philippines are lower compared to wages in Malaysia, South Korea, and Singapore.
The Philippines may have a competitive edge in labor cost but its production costs are higher than those of ASEAN
countries. Thus local business people find it difficult to match international prices.

ENHANCED ROADMAP PLASTICS INDUSTRY
41
IV. POLICY ENVIRONMENT FOR INDUSTRY
DEVELOPMENT
A. HISTORY OF GOVERNMENT PROGRAMS
The plastics industry is an important contributor to employment in the country, with an estimated
total employment of 650,000. The industry then becomes a strategic sector for employment
generation. But because of inconsistencies in our laws and policies, the industry is losing its stature.
The plastics banning by LGUs, for instance, which is unfounded and inconsistent with our national
laws, has been negatively affecting the industry, shrinking industry employment by about 40%.
Until now, there are no government programs specifically targeted to assist the local plastics industry.
Through the BOI’s strategy towards integrating allied industries, the plastics industry is now included
under the Chemicals Industry Cluster. BOI facilitates the technical working group (TWG) for this
cluster in order to allow industry players discuss their issues and concerns and work together and
with government to resolve them.
B. CURRENT POLICIES
At present, there is not enough government support programs designed for existing industries to
promote expansion of manufacturing operations, particularly that of the plastics industry. While a lot
of promotions are geared towards attracting foreign investments, the Board of Investments should
look into dedicated programs for expanding manufacturing industries in the plastics sector, apart from
existing capital equipment tax incentives.
Present Industry Activities. The plastics industry wants to cultivate and grow the recycling industry.
Fiscal and non-fiscal incentives could and would help in many ways to strengthen the local plastics
recycling industry, and allow it to modernize their manufacturing capabilities and waste treatment
facilities, which would not only benefit the plastics industry, but as well as the solid waste programs as
well. It would also allow an increased availability of recycled materials for plastic manufacturers. In a
report made by Plastics Europe entitled “Plastics: Too valuable to be thrown away, Recovery, Recycling
and Resource conservation,” it discusses plastics as a high commodity item that needs to be recycled

ENHANCED ROADMAP PLASTICS INDUSTRY
42
in any way possible. Some basic facts include: Recycling a ton of plastic bottles can save about 3.8
barrels of oil and two soft drink bottles can be made into fiber that will be able to produce a baseball
cap. There are what industry refers to as low value recyclables such as plastic bags and PS “Styro”
products where the challenge is that of recovery and transportation to existing recycling facilities.
Technical Working Group (TWGs) for the Chemicals Cluster. The Board of Investments (BOI)
facilitated the establishment of sectoral TWGs as a coordinating mechanism through which industry
concerns could be addressed. To address the issues being faced by the different chemical sub-
industries (including the plastics industry) under the chemicals industry core TWG group, four action
task groups have been further organized, namely:
FOR TRADE & INVESTMENT MATTERS – the issues regarding industry clustering, tariff
concerns, smuggling, and trade and investment promotions.
FOR TALENT DEVELOPMENT & INNOVATION – the issues on skills development and
introduction of innovation and process.
FOR EASE OF DOING BUSINESS – the issue on the assistance that the government could
provide the industry on streamlining the permit and documentary requirements which
overlaps among various agencies.
FOR ENVIRONMENTAL PRACTICES – the issue on plastic banning, life cycle assessment
(LCA) and the use of the same as basis of scientific and technological studies in crafting laws
that would affect the industries which are deemed should be institutionalized.
C. REGULATORY AGENCIES
A number of agencies have policies and programs that provide support to the plastics industry. These
agencies and programs include the following:
Department of Trade and Industry (DTI) - Bureau of Product Standards (BPS). The BPS is
responsible for implementing measures to ensure products in the market comply with government
standards. Monobloc chairs, stools and tables are among the products that require certification from
DTI before being sold. Also, DTI has listed 16 companies with their addresses and brand names of
monobloc chairs, stools and tables to guide the public in buying products that are certified to have
passed quality and safety standards (PPIA, 2014). In this way, the local plastics industry and consumers
would be protected against cheaper, but substandard plastic products – mostly coming from China –
from penetrating the market. The flow of these low quality plastic products from other countries have
adversely affected the local plastics industry.
Board of Investments. (BOI) The BOI annually releases the Investments Priorities Plan (IPP) through
which identified economic activities by eligible firms could avail of fiscal and non-fiscal incentives.

ENHANCED ROADMAP PLASTICS INDUSTRY
43
Tariff Commission. By virtue of Republic Act 911, the Tariff Commission was created in June 1953
under the Office of the President with the following duties9:
To investigate the administration, fiscal and industrial effects of tariff laws of the country;
To investigate tariff relations between the Philippines and foreign countries, commercial
treaties, preferential provisions, economic alliances, the effect of export bounties, and
the volume of importation compared to domestic production; and
To undertake a thorough study of the Philippine tariff system and submit its
recommendation for its revision.
The removal of tariffs on plastic finished goods in 2010 put the plastics industry at a
disadvantage compared to other countries which have cheaper goods to sell in the market. In
order to level the playing field, PPIA is currently discussing with the government to also lower
tariffs for their raw materials, such as for PE and PP.
National Solid Waste Management Commission (NSWMC) The industry stands firm that the
cause of the clogging and flooding in the country is not the use of plastics, but because of the improper
implementation of the Ecological Solid Waste Management Act of 2000. Thus, the banning of plastic
use is not the solution, but the stricter implementation of laws on anti-littering, waste disposal, and
recycling. PPIA has been calling for the establishment of National Ecology Center to enforce science-
based legislation.
Local Government Units (LGUs). At least 15 cities and municipalities are implementing the plastic
ban, which continues to paralyze the local plastics industry. These include Makati, Quezon City, Las
Piñas, Marikina, and Pasig, among others.
V. GREENING THE PHILIPPINE DOWNSTREAM
PLASTICS INDUSTRY ROADMAP
1. STATEMENT
Greening the roadmap will be a strategic element in modernizing and strengthening the competitiveness
of the Philippine downstream plastics industry in the national, regional and global levels. This will be
done thru technological and product innovation, developing and tapping new markets, and improving
cost performance from higher resource productivity, with improved resilience in meeting the challenges
of the climate change impacts. Economic growth will not be an obstacle in protecting the environment
but will serve as a major pillar to deliver sustainable and inclusive growth.
9 Retrieved from http://www.apeccp.org.tw/doc/Philippines/Organization/phorg1.html, dated 29 September 2014.

ENHANCED ROADMAP PLASTICS INDUSTRY
44
2. STRATEGIES
The industry will adopt the following strategic greening elements in strengthening our sectors
competitiveness, namely:
2.1 Energy-Efficiency: in improving efficiency with reasonable investments while reducing the
operational cost and mitigating GHG emissions.
2.2 Resource Use-Efficiency: by reducing operational wastes, efficient utilization of water resources,
installing catch basins rainwater and recycling and waste treatment of these resources.
2.3 Promoting international standards: in production and process by adoption of an integrated ISO
Environmental and Energy Management Systems i.
2.4 Fostering innovations: in developing capacities like designs of green plastic products and
processes.
2.5 Attracting foreign investments: not only as key driver in gaining competitiveness but also in tapping
our renewable natural resources.
2.6 Fostering cooperation: with R & D Institutes on inter and intra plastics industry for cooperation
including the ASEAN Federation of Plastics Inc, (or AFPI in the ASEAN region) and the world’s plastics
associations.ii.
3. SUSTAINABLE LIFE CYCLE THINKING
PPIA: Sustainable Life Cycle Thinking
Nowadays, plastic packaging has been ignored and otherwise frowned as a reverse in the field of
environmental solutions because of its perceived negative impact on solid waste, water pollution, and
the like. The Philippine Plastics Industry Association (PPIA) hopes to change this view.

ENHANCED ROADMAP PLASTICS INDUSTRY
45
In our environmental policy, we believe that looking into and understanding the bigger picture of this
issue will help the businesses of our members the beneficial impact of our products in the environment.
The enlightenment of this issue requires the involvement of all sectors- the government, the producers,
the retailers, and the consumers.
Toward this end, we have geared our initiatives in the promotion of Life Cycle Assessment (LCA) Model.
We have been enforcing its tenets throughout our association. By going beyond the means of
production, our member companies surveyed, where and how their raw materials were gathered, and
how their various products were used and disposed of.
The adoption and subsequent promotion of this model, influences positive and environmentally
conscious responses to our member manufacturers and stakeholders. It would ensure that even before
our products are made, their entire life cycle, from their resource until they reach the dumpsite, they
would be carefully planned out, so that all possible negative impacts to the environment will be largely
reduced or totally eliminated.
Though the Life Cycle Assessment model, we take its Core, and its Gears. By anchoring all our activities
to these four gears, our industry association will not only become a vehicle in promoting environmentally
friendly practices, but also as a medium of promoting corporate social responsibility to our members,
while striving to the gears of becoming more competitive as an industry.
As the LCA model goes, each of our members has become a part of a bigger process that first looks
at their inputs, and processes, towards sustainable output. This is not only about improvement, but
more so about survival. On this end, our association members have initiated and participated in a wide
array of undertakings in line with the LCA model- keeping the integrity of the entire life cycle in mind.
Since the plastics industry uses large amounts of energy, collaborations with power companies in
conducting forums on power cost reduction programs, time-on-use and direct connections, were made
to enlighten members how to streamline the use of electricity in their businesses and on effective ways
to save power consumptions.
Taking resource saving a step further, we have been promoting with frugality the use of other resources
such as water to our members. A model we promoted on this is the rain collection pond of Manly
Plastics, Inc.'s in Malabon City. This reservoir is made from their own plastic liners that saves water in
their recycling processes e.g. in running the cooling tower.
When it comes to emissions, the plastic industry is primarily limited to heating and melting processes
which have no air emissions. Even with the production of materials such as Styrofoam, all our member
companies have stopped using CFCs in their manufacturing since 1992 (under the Kyoto-protocol).

ENHANCED ROADMAP PLASTICS INDUSTRY
46
To showcase the Social gear, our association has been abiding not only with environmental laws, but
also with others such as the Labour Laws, including the strict adherence to minimum wage. This is
further extended by conducting reach out activities like medical and dental mission projects.
When survival was mentioned earlier, it was referring to the Economic gear as embodied by our
association's partnership with SPIK, with the making the “Philippine Chemical Master Plan” road map
for the better of all the concerned industries in the country. Economic growth following the
With different industry organizations, the PPIA hosted, promoted, and joined, to put together a slew of
projects, in line with Blass' LCA model, which helped the industry achieve in its advocacy on anti-
smuggling efforts and campaigns on the removal of tariff distortion.
The first R&D stage is represented in a number of events and seminars, and one event was the hosting
of the Ecolabelling Programme of the Philippines (ELP) that helped disseminate information on
ecolabelling standards for plastic packaging.
A second R & D event ties in to the next stage of the LCA is on raw materials. The PPIA collaborated
with the ICIS (international monitoring entity) on the overlook of the resin market trends in Asia so that
the member companies would have better formulate their products. A separate seminar detailing Oxo-
biodegradable master batches was also conducted to give our members more information on the proper
acquisition of raw materials.
The production stage of the LCA is integral to the plastics industry, as generation of quality products is
an important aspect of the life cycle. A partner of PPIA on this front is the Global-Link MP Events
International, Inc. that organize the yearly plastic exhibitions called “Plastics Philippines” and in tying
up the industry’s product showcase with other international events such as machinery, technology and
services. Keeping product information up to date is an important element in the cycle, especially in an
industry such as this.
For the stages of use and end of life, which are crucial to the plastic industry, the PPIA put heavy
emphasis on cleaning drives and recycling campaigns. To tackle the use stage, we conducted a number
of Information and Education Campaigns (IEC), partnering with non-government organizations, church
organizations, the academe, and government under the banner of RA 9003 (Ecological Solid Waste
Management Act of 2003).
Drastically reducing the amount of solid waste the plastic industry produces a major and constant goal
for our association. It is very important for us to get our members behind this model. While the industry
still has a long way to go in terms of sustainable development, the PPIA believes that by following the
Life Cycle Assessment model and providing guidance and outlets for our member manufacturers to

ENHANCED ROADMAP PLASTICS INDUSTRY
47
align their company policies with this model, we will continue to see a vast improvement in the quality
and environmental integrity of production, more reductions in waste output, and a better standard of
living in the Philippines.
4. EXPECTED MILESTONES
4.1. Initiate or support policy framework consistently in line with green modernization process and the
effective implementation of this as well as the provision of comprehensive:
Incentive/subsidies scheme for resource efficiency, fostering green modernization that
develops green jobs
Establishments of Eco-Industrial Zones and not plainly Eco-Zones
Promote green procurement particularly for government offices
4.2. The Plastic Industry of the Philippines follows the principles of Responsible Care:
4.2.1 Following the global chemical industry’s environmental, health and safety (EHS) initiative
to go beyond legislative and regulatory compliance adopting cooperative and voluntary
initiatives with government and other stakeholders.
4.2.2 Significantly adopt process and resources optimization and technological innovations to
strengthen resource productivity that will reduce the volume and cost from wastage and
production costs, decrease emissions and effluents, and increase efficiency in waste
management that affects air, soil and water.
4.2.2.1 30% solid waste reduction of business-to-business transactions by reusing
packaging materials i.e. using plastic crates for delivery of goods
4.2.2.2 Promote a proper delivery management system that should make deliveries
more efficient thus creating savings and less usage of resources like fuel
4.2.3 Advocate for a Life Cycle Approach that includes GHG emissions from both production
and consumption of products and materials, supported by LCA methodologies to assess the
environmental impacts of products produced and technologies adopted.

ENHANCED ROADMAP PLASTICS INDUSTRY
48
4.2.4 The industry brings successfully into practice the product stewardship by integrating
health, safety and environmental protection as an integral part of the LCA.
4.2.5 To seek for strong cooperation to reduce physical and environmental risks of domestic
and foreign investments.
4.2.6 Development of infrastructure that decreases vulnerability of productions site and logistics
4.2.6.1 Government incentives for companies to install rainwater collection or any
“green” technology facilities all over the metro.
4.2.7 Strongly promote and urge government support on the development of the “green sector”
and its strong proactive practice and policy of re-use and recycling.
4.2.8 Integrating tools such as LCA, Carbon and Water Foot Prints into its business practices.
4.2.8.1 Reduce of raw material consumption through correct product sizing based on
results coming from scientific methods like the Life Cycle Assessment (LCA)
4.2.9 Encourage government to promote a level playing field for diverse energy sources,
particularly the use of renewable energy, as well as and streamline procedures.
4.2.10 The government should assure the representation of the industry’s voice in
environmental policies that hamper the growth and competitiveness particularly the compliance
of SMEs in the plastics industry.
4.2.11 The Department of Trade and Industry (DTI) should encourage source suppliers to go
into ISO certification 9001/14001/50001.
4.2.11.1 There should be at least 3 member companies of PPIA getting accredited of
any certifications mentioned above every year
4.2.11.2 2% savings in power cost through the implementation of any management
systems mentioned above yearly
4.2.11.3 In line with ISO 14001 and 50001, PPIA members should have applicable
knowledge on how to reduce GHG emissions.
4.2.11.4 PPIA members should be well educated and would be able to adapt to any
environmental risk i.e. climate change
4.2.11.5 Promote and educate members of PPIA on the proper disposal of any kind of
waste

ENHANCED ROADMAP PLASTICS INDUSTRY
49
4.2.12. Fully tap skills training (TESDA), R &D recycling tech and product development (DOST)
and strengthen the involvement of the Academe on this.
5. PEER RECOGNITION
In view of the cognizance of the Philippine Plastics Industry Association (PPIA) in the practice and
advocacy of greening the industry, the PPIA for three (3) consecutive years (2012, 2013 & 2014) is a
recipient of the Annual Sustainable Development Awards for Outstanding Sustainable Practices in the
industry association category for its sustainable development initiatives, as conferred by the Federation
of Philippine Industries (FPI), in recognition to the ff: categories:
-Most Outstanding Industry Association for the Optimum Use of Resources in 2012
-Most Outstanding Industry Association for Implementing Corporate Social Responsibility (CSR)
Programs in 2013, and
-Most Outstanding Industry Association for the Practice of Waste Management in 2014.
The panels of jurors of this award are composed of the following: the DENR Secretary (Chair) with Earth
ay Network Philippines (EDNP), Solid Waste Management Association of the Philippines (SWAPP) and
other environmental partners and private associations.
i The PPIA in partnership with the Board of Investments conducted the ISO 14001 (Environmental
Management System) and ISO 50001 (Energy Management System) Training for the downstream
plastics industry last 26 to 28 August 2015 and the Internal Management System Audit on 16 to 17
June 2015.
ii In fact, The Philippine Plastics Industry Association (PPIA) hosted the 5th annual meeting on Plastics
and Sustainability on 08 to 10 December 2014 participated by 34 country signatories like : Australia,
Belgium, Brazil, Bulgaria, Canada, Croatia, Denmark, Finland, Germany, Hungary, India, Italy,
Japan, Malaysia, Mexico, Netherlands, Philippines, Portugal, So. Africa, Spain, Switzerland, USA,
United Arab Emirates, United Kingdom, others with the American Chemistry Council Vice Pres and
Exec. Director Plastics Europe, to foster commitments particularly on anti-marine litter. "The plastics
industry is firmly committed to the principle that plastics do not belong in the world’s oceans and
should not be littered -- plastics should be responsibly used, reused, recycled and finally recovered
for their energy value. Another is the Operation Clean Sweep (OCS), is a product stewardship
program of the ACC and SPI the goal of which is to help every plastic resin handling operation
implement good housekeeping and pellet containment practices to work towards achieving zero
pellet loss.

ENHANCED ROADMAP PLASTICS INDUSTRY
50
V. SWOT ANALYSIS
Table 30. SWOT matrix of the Philippine Plastics Industry10
Strength Weaknesses
Large production capacities
Fast and reliable product delivery
Superior product quality
Easy adaptation to new technology
advancements/updates
Availability of manpower and competent
technical labor force
High cost of inputs: raw materials/power/labor
Difficulty of access to financing and working
capital
Disruption of operation due to high
manpower turnover
Opportunities Threats
Improving local demand
Potential export thru free trade agreements
Proliferation of sub-standard/low-cost
imported products in the market.
Preference to imported products
Violation of IPR
Lack of government specific policies to
support/develop the plastics industry
High logistical cost
Distorted tariff policies
Negative perception on plastics on health and
environment
Poor credit rating by financial institutions
Actions for Addressing Issues Arising from the SWOT Analysis
Strategies for tapping into strengths to realize opportunities (S-O). The local plastics industry is
known to be manufacturing only the products of superior quality, as most member-companies are
ISO-certified. Thus, being at par with the global standard for plastic products, the Philippine plastics
industry could take advantage of ASEAN integration in 2015 and other FTAs to find new markets for
their products.
Most of the plastics manufacturers in the country are very flexible and could tailor-fit their production
(eg. quantity, designs, etc) according to their customers’ wants and needs. Because of this capacity,
the industry are at an advantage to be able to attract customers. Strategies for overcoming weaknesses to realize opportunities (W-O). The industry is capital-
intensive, where the energy cost’s share to over-all production ranges at about 30%-50%. It is then
crucial to support initiatives that could lower energy cost, such as by providing incentives for the use
of renewable energy, open access to transmission service, the establishment of power ecozones,
10 Through industry consultation with over the 200 members of PPIA, the industry was able to identify their common
experiences. The result of their discussion is reflected in the SWOT analysis.

ENHANCED ROADMAP PLASTICS INDUSTRY
51
among others. Also, there is a need to invest in R&D and develop machineries and processes to lower
production costs. The plastics industry is a small to medium enterprise (SMEs), so it would be easier to put up such kind
of business if only there is less difficulty in financing and accessing capital in the country. Thus, there
must be an appropriate mechanism to be able to tap the potential of these SMEs.
Strategies for tapping into strengths to minimize vulnerability to threats (S-T). Many industries
have been complaining about the tremendous number of permits they have to comply with, with some
merely redundant and unnecessary. There is an issue on the overlapping of government agencies
requiring the chemicals industry with permits (PNP Explosive Division, PDEA, FDA, EMB), which
ranges from 3 to 5 permits for one chemical, where processing of these permits would take 3 to 6
months. To address this concern, there is an ongoing TWG on the “Ease of Doing Business” which
aims to streamline the issuance of permits among and between agencies, as well as possibly setting up
a “one-go-center.”
In addition, reviewing EO 61 (or the Act of Modifying the Nomenclature and the Rates of Import Duty
on Various Products under the Section 104 of the Tariff and Customs Code of 1978 (Presidential
Decree No. 1464), as Amended) could be done by expanding the product scope of the CNLA scheme.
Strategies for preventing weaknesses from raising vulnerability to external threats (W-T). The
plastics industry has been greatly affected by the LGUs’ plastics ban. As a result, some plastics
companies have downsized their operations and have opted for the rotation of workers and have
lesser days of operation. At present, there are already 250 cities and municipalities banning the use of
plastic bags. PPIA is seeking assistance of either BOI or DOLE in order for Congress and the Senate
to fast-track the approval of the bill seeking to establish a National Ecology Center.
The industry also supports a Science and Technology-based legislation policy through: (1) use of
scientific studies and methodologies to guide legislative processes in Congress and local councils; (2)
presence of technocrats as part of standing committees to craft policies and legislation for the industry;
(3) legislate information dissemination programs for the public to fully understand the use and disposal
of chemical products; and curb and eliminate tax evasion and smuggling through proper and strict
implementation of laws.
Policy reforms to lower shipping cost is also an important strategy. Under the Constitution,
international cargo vessels are not allowed to domestically transport imported products. A possible
resolution to this is to lift cabotage in the country. DTI is currently coordinating with BOC, DOTC,
and the private sector as to how to immediately address this issue.

ENHANCED ROADMAP PLASTICS INDUSTRY
52
PPIA expressed its concern about the government’s policy on procurement that seems to favor
imported products rather than those locally manufactured. Based on the IRR of the Procurement Law,
a company’s bid could be favorably accepted if its cost is lower by 20%. However, there is also a
provision that local produced products should meet the lowest price of the imported ones. PPIA is of
the view that this is unfair to local producers considering that they are the ones contributing to the
Philippine economy, and not foreign suppliers. PPIA is requesting that government add other criteria
on imported products to favor those locally produced.
VI. RECOMMENDATIONS
Given the strengths, weaknesses, opportunities, and threats of the plastics industry while keeping in
mind its state and strategic vision, mission, goals, and targets, the plastics industry could be more
competitive with the following recommendations:
A. POLICY MATTERS
Establishment of the National Ecology Center. Implement the provisions of the Ecological Sold
Waste Management Act of 2000 (RA 9003) on the establishment of the National Ecology Center
(NEC), establishment of the LGU Material Recover Facility (MRF), Mandatory Segregation of Solid
Wastes, and other important sections of the law.
Creation of a One-Stop Shop to help local plastic exporters streamline documentary and logistics
requirements and minimize red tape.
Strengthen laws and policy to aid the stoppage of smuggling and proliferation of imported substandard plastic
products in the domestic market.
Review tariffs and non-tariff barriers on FTAs, ASEAN and MFN on plastic products and raw materials to avoid
tariff distortion and promotion of export facilitation.
Promote domestic market through the industry’s (Federation of Filipino Chinese Chamber of
Commerce and Industry Inc. and Federation of Philippine Industry) “Buy-Pinoy Program” and putting
safeguards in place to ensure the procurement of local products by government through RA 9184 or
the Government Procurement Reform Act.
Institute a mechanism for US Dollar Forward Purchase to protect exporters from currency fluctuation

ENHANCED ROADMAP PLASTICS INDUSTRY
53
Specific Industry Programs:
Representing industry to push for a National Legislation on Plastic Bag Regulation.
Co-organizing annual exhibits and events to promote members’ products (Plastics Philippines,
Green Philippines, Eco-Products, SWAPP).
Working with the DTI-BPS Technical Committees to develop standards for plastics, plastic
products and biodegradable plastic bags.
Development and Promotion of Recycling Technologies
o Plastic Bag and PS “Styro” Melting Oven developed by DOST-ITDI
o Mixed Plastic Waste for Asphalt Roads developed by DOST-ITDI
o Waste to Fuel Project, a local invention by POLYGREEN Industries with existing facilities
in Montalban, Rizal
o Small Scale Waste to Fuel Systems, a local invention by SUKI Trading located at Cebu City
o Mixed Plastic Residual Waste as Refuse Derived Fuel (RDF) by Cement Kilns in
coordination with the Cement Manufacturers’ Association of the Philippines (CEMAP)
o Mixed Plastic Waste for School Chairs and Profiles developed by Envirotech Waster
Recycling Inc. from Davao City
Information and Education Campaign and Recovery Programs
o Organizing forums and giving presentations on Recycling and Proper Waste Management
of Plastics to both public and private audiences
o Waste Markets Programs (e.g. SM “Trash for Cash”, Ayala “Recyclables Fair”, Greenhills
Shopping Center “Cash for Scrap”)
o Partnership with Community Groups such as the Archdioceses of Manila, Cubao and
Novaliches; Home Owners’ Associations;
o Plastic Bag and PS Styro Recovery Program with the Archdiocese of Manila (ARCAM)
o Organizing and supporting programs on Plastic Bag and PS “Styro” recovery (i.e. Plastic
Mo Bigas Ko Program of the Rotary Club and City Government of Pangasinan; Krus na
Ligas waste exchange programs with the Archdiocese of Cubao
Livelihood Programs
o Invisible Sisters’ Social Enterprise to recover waste plastic bags and converting them into
crocheted fashionable items

ENHANCED ROADMAP PLASTICS INDUSTRY
54
B. ENHANCING THE MARKET FOR THE PLASTICS INDUSTRY
Grant fiscal and non-fiscal incentives for the development of the plastics recycling industry.
Improve/strengthen linkages on supply chain (recycling loop) including low value recyclable waste
plastics from consumers/in-store-recovery-collectors-junkshops/ waste consolidators to recyclers
and product processors.
Develop and promote technologies for efficient recycling processes and facilities.
Promotion of sustainable life cycle thinking – with emphasis on utilization of resources, reduction
of production wastes, reduction of power consumption, and utilization of recycled/recyclable
materials.
Send male and female engineers and science graduates to Masteral and PhD programs in other
countries.
Develop technology and skills preparedness program for male and female high school graduates
and industry specific training programs to enhance skills and acquire expertise/knowledge needed
in the downstream plastic industry. Thus, the industry must develop skills for applied technology
for new application products/indigenous materials/green products.
Forge partnership with local and international institutions (public/private/academe) in the
development of the plastic industry on skills training, product, molds and process/technology.
REFERENCES Global Competitiveness Report 2010-2011. (2011). World Economic Forum retrieved from
http://www3.weforum.org/docs/WEF_GlobalCompetitivenessReport_2010-11.pdf on June
29, 2011.
International Labor Organization. (2012). Decent Work Country Profiles in the Philippines. Geneva,
Switzerland: International Labour Office.
NSCB (http://www.nscb.gov.ph)
NSO (http://www.census.gov.ph/)
Philippine Statistical Authority. (2010). Annual Survey of Philippine Business & Industry. Quezon City:
PSA.
PPIA. (2014, September 19). DTI-Guimaras monitors sale of products with required certification.
Philippine Information Agency.
Samahan sa Pilipinas ng mga Industriyang Kimika. (2012) Proposed Philippine Chemicals Industry
Master Plan Brief.

ENHANCED ROADMAP PLASTICS INDUSTRY
55
APPENDIX
Finished Goods Imports from Top 3 Countries
Imported Finished Goods AHTN 3916 to 3926
Largest Finished Goods Import Value (US$) per Country of Origin: 2015 Import Data
Product Group Countries Value (US$)
39.16 - Monofilament: as adhesive, used for making ready articles by molding,
founding, or compressing, nylon strings for sports goods, etc. 1- USA 2,360,413.00
2- China 570,629.00
3- Japan 486,181.00
39.17 - Tubes, pipes and hoses, and fittings- use for agriculture, food processing,
etc. 1- Spain 23,560,474.00
2- USA 19,456,122.00
3 China 19,157,650.00
39.18 - Floor coverings of plastics e.g. plastic tiles 1- China 7,393,285.00
2- S. Korea 2,022,400.00
3- USA 1,800,498.00
39.19 - Self-adhesive plates, sheets, film, foil, tape, strip, tapes for telephonic or
electric wires, cellophane adhesive tape 1- Japan 34,603,765.00
2- .S Korea 15,723,650.00
3- China 13,766,562.00
39.20 - Other plates, sheets, film, foil and strip-tapes for telephonic or electric
wires, cellophane film, BOPP film, adhesive by melting, for safety glass,
bakelite/corrugated sheets and plates, tapes for telephonic or electric wire, etc.
1- China 34,068,751.00
2- Thailand 21,370,925.00
3- Malaysia 13,570,696
39.21 - Other plates, sheets, film, foil and strip of plastics- tapes for telephonic or
electric wire, plates and sheets, cellophane for adhesive tape. 1- Malaysia 24,643,878.00
2- China 21,370,925.00
3- Japan 18,584,749.00
39.22 - Baths, shower-baths, sinks and wash-basins including covers,
lavatory/urinals pans. 1- China 2,755,831.00
2-Thailand 588,172.00
3- USA 172,782.00
39.23 - Boxes used for cinematographic films, tapes, disc, septic bags, toothpaste
tubes container, sewing machines, textile mills, products for sewing, caps, etc. 1- China 21,927,914.00
2-Japan 15,828,335.00
3- Thailand 5,253,417.00
39.24 - Tableware and kitchenware, bed pans, urinals (portable type) and chamber-
pots. 1- China 29,736,019.00
2-Taiwan 1,647,753.00
3- USA 1,299,009.00
39.25 - Reservoirs, tanks, vats and similar containers, doors, windows and their
frames and thresholds for doors, shutters, blinds and similar articles and parts
thereof.
1- China 8,376,472.00
2-Thailand 5,375,529.00
3- Taiwan 3,114,875.00
39.26 - School supplies, plastic erasers. loose leaf binders and dividers, index tabs
and similar, raincoats, gloves, aprons and other articles of apparel, articles of
1- China 28,501,875.00
2-Japan 3,310,522.00

ENHANCED ROADMAP PLASTICS INDUSTRY
56
Imported Finished Goods AHTN 3916 to 3926
Largest Finished Goods Import Value (US$) per Country of Origin: 2015 Import Data
Product Group Countries Value (US$)
protective mask and apparel, including belts, fittings for furniture, coachwork or
the like, statuettes and other ornamental articles, floats for fishing nets, for fans
and hand screens, frames and handles, products for medical/dental purposes,
lifesaving cushions for protection for falling persons, reflectorized road signaling
and pavement marking, pipe or thread sealing tape, transmission or conveyor
belts or belting, other articles used in machinery, plastic J-hooks and bunch
blocks for detonators, plastic nursing system, items for apparel or clothing
accessories, poultry feeders, cards for jewelry or small objects of personal
adornment; beads, shoe lasts, for jewelry or small objects of personal, racket
strings, grain storage, accessories and parts, n.e.s., for electronic data, handbag
frames and handles, articles for laboratory use, sheets to cut.
3-Taiwan
31,046,121.00
Source: PSA
Finished Goods Exports to Top 3 Countries of Destination (2015)
Imported Finished Goods AHTN 3916 to 3926
Largest Finished Goods Export Value (US$) per Country of Destination: 2015 Export
Data
Product Group Countries Value (US$)
39.16 - Monofilament: as adhesive, used for making ready articles by molding,
founding, or compressing, nylon strings for sports goods, etc.
1- Japan 1,535.00
39.17 - Tubes, pipes and hoses, and fittings- use for agriculture, food processing,
etc. 1-Japan 870,253.00
2- Korea 171,083.00
3-Indonesia 132,408.00
39.18 - Floor coverings of plastics e.g. plastic tiles 1- India 4,620.00
39.19 - Self-adhesive plates, sheets, film, foil, tape, strip, tapes for telephonic or
electric wires, cellophane adhesive tape 1- Germany 271,857.00
2-Singapore 260,345.00
3-Thailand 125,374.00
39.20 - Other plates, sheets, film, foil and strip-tapes for telephonic or electric
wires, cellophane film, BOPP film, adhesive by melting, for safety glass,
bakelite/corrugated sheets and plates, tapes for telephonic or electric wire,
etc.
1- Japan 457,646.00
2- Hongkong 97,533.00
3- Singapore 79,703.00
39.21 - Other plates, sheets, film, foil and strip of plastics- tapes for telephonic
or electric wire, plates and sheets, cellophane for adhesive tape.
1- Taiwan, China 163,730.00
2-Singapore 54,994.00
3-Egypt, Arab Rep. 17,978.00
39.22 - Baths, shower-baths, sinks and wash-basins including covers,
lavatory/urinals pans. 1- Japan 177,949.00
2- China 1,186.00
39.23 - Boxes used for cinematographic films, tapes, disc, septic bags, toothpaste
tubes container, sewing machines, textile mills, products for sewing, caps, etc. 1- Japan 2,304,932.00
2- USA 1,555,462.00
3-Indonesia 1,177,760
39.24 - Tableware and kitchenware, bed pans, urinals (portable type) and
chamber-pots.
1-Japan 830,548.00
2- USA 375,250.00
3- New Zealand 266,927

ENHANCED ROADMAP PLASTICS INDUSTRY
57
Imported Finished Goods AHTN 3916 to 3926
Largest Finished Goods Export Value (US$) per Country of Destination: 2015 Export
Data
Product Group Countries Value (US$)
39.25 - Reservoirs, tanks, vats and similar containers, doors, windows and their
frames and thresholds for doors, shutters, blinds and similar articles and parts
thereof.
1- Japan 830,548.00
2-Taiwan 54,543.00
3-Ireland 3,000.00
39.26 - School supplies, plastic erasers. loose leaf binders and dividers, index
tabs and similar, raincoats, gloves, aprons and other articles of apparel,
articles of protective mask and apparel, including belts, fittings for furniture,
coachwork or the like, statuettes and other ornamental articles, floats for
fishing nets, for fans and hand screens, frames and handles, products for
medical/dental purposes, lifesaving cushions for protection for falling persons,
reflectorized road signaling and pavement marking, pipe or thread sealing
tape, transmission or conveyor belts or belting, other articles used in
machinery, plastic J-hooks and bunch blocks for detonators, plastic nursing
system, items for apparel or clothing accessories, poultry feeders, cards for
jewelry or small objects of personal adornment; beads, shoe lasts, for
jewelry or small objects of personal, racket strings, grain storage, accessories
and parts, n.e.s., for electronic data, handbag frames and handles, articles for
laboratory use, sheets to cut.
1- Japan 3,480,037.00
2- USA 956,314.00