Embed Size (px)
Citation preview

Global studies of stratospheric gravity wave activity using COSMIC GPS ROactivity using COSMIC GPS-RO
Simon Alexander1, Toshitaka Tsuda2,Simon Alexander , Toshitaka Tsuda , Andrew Klekociuk1, Yoshio Kawatani3,
and Masaaki Takahasi4
1Australian Antarctic Division, Hobart, Australia, ,2Research Institute for Sustainable Humanosphere (RISH),
Kyoto University, Japan3 Japan Agency for Marine-Earth Science and Technology (JAMSTEC),
Yokohama, Japan4 Center for Climate System Research (CCSR),
University of Tokyo, Japan

Outline
• Temperature profiles from GPS RO are used to study the behavior of atmospheric gravity waves (GW) in the stratosphere.
• Data analysis procedure of GW energy (Ep: potential energy) CHAMP: from May 2001 to December 2005COSMIC: from July 2006COSMIC: from July 2006 –
• Generation of GW’s due to convection in the tropics and their interaction with background mean winds (QBO)interaction with background mean winds (QBO).
• Distribution of Ep in the Antarctic and Arctic regions Geostrophic adjustment of polar night jet p j p g jOrographic effectsDoppler shifting
Comparison of temperature profiles between COSMIC
#49Kuching
between COSMIC GPS RO and radiosonde at Kuching, Malaysia.
#50AQUA-AIRS
SABER
Radio-sonde
COSMIC
g, y
HIRDLS
AQUA AIRS
Radio-
Temperature profiles around the cold point tropopause, 26 Dec 2006・ COSMIC GPS RO (Green)
Radio Holography
sonde
・ COSMIC GPS RO (Green)(4.1N, 110.4E, 11:32UTC)
・ Radiosonde at Bintulu, Malaysia
(Orange) (3 1N 113 0E
Basic analysis (GO) with 1-1.5 km height resolution
analysis (FSI)
Profiles are shifted by 5K each.
(Orange) (3.1N, 113.0E, 11:34UTC)・ HIRDLS (Blue,-solid)
(3.4N, 118.6E, 16:38UTC)SABER (Blue dotted)SABER (Blue-dotted)(3.8N, 108.6E, 10:39UTC)
・ AQUA-AIRS (Red)(3.9N, 115.3E, 17:55UTC)

A global distribution of gravity wave energy
Th GPS RO d t h i d h i ht l ti id i• The GPS RO data having a very good height resolution provides a unique opportunity to study a global morphology of atmospheric gravity waves in the stratosphere.
• CHAMP and COSMIC GPS RO data are used to derive the potential energy p gy(PE) from gravity waves in an appropriate vertical wavelengths bands (1-7, 15 km) and to study longitudinal and latitudinal variations.
Atmospheric Gravity Wave Energy (Ep) in the Stratosphere by Using CHAMP and COSMIC GPS RO Temperature (T) data
Wave potential energy, Ep=1/2(g/N)2(T’/T0)2p gy, p (g ) ( 0)
g; acceleration of gravity, N; Brunt-Vaisala frequency, T’; temperature perturbation, T0; background temperature
Grid cell size (variable)CHAMP: 20o (lon) x 10o(lat) x 1-3 monthsCOSMIC
Tropics 20o(lon)x5o(lat)x7 days stepped forward by one dayTropics 20o(lon)x5o(lat)x7 days, stepped forward by one dayPolar regions 30o-180ox (lon) x 5o(lat) x 5 days (constant grid cell area)

Temperature profile from GPS RO with CHAMP
2NTT T T T
[K] [K] [rad/s]2
(1) Obtain all available GPS RO data in individual cells, and calculate the(1) Obtain all available GPS RO data in individual cells, and calculate the mean T profile, then apply a low-pass filter with a cutoff at 7 or 15km. Then, the mean T profile (T0) is determined.
(2) Calculate T ’=T-T0 for individual GPS RO profiles, and apply FFT along ltit d th t t th fl t ti t (T ’) ith ti laltitude, then, extract the fluctuating components (T ’) with vertical wave
lengths of 2-7 km or 2-15 km. Finally, Ep is determined by integrating the spectral density.

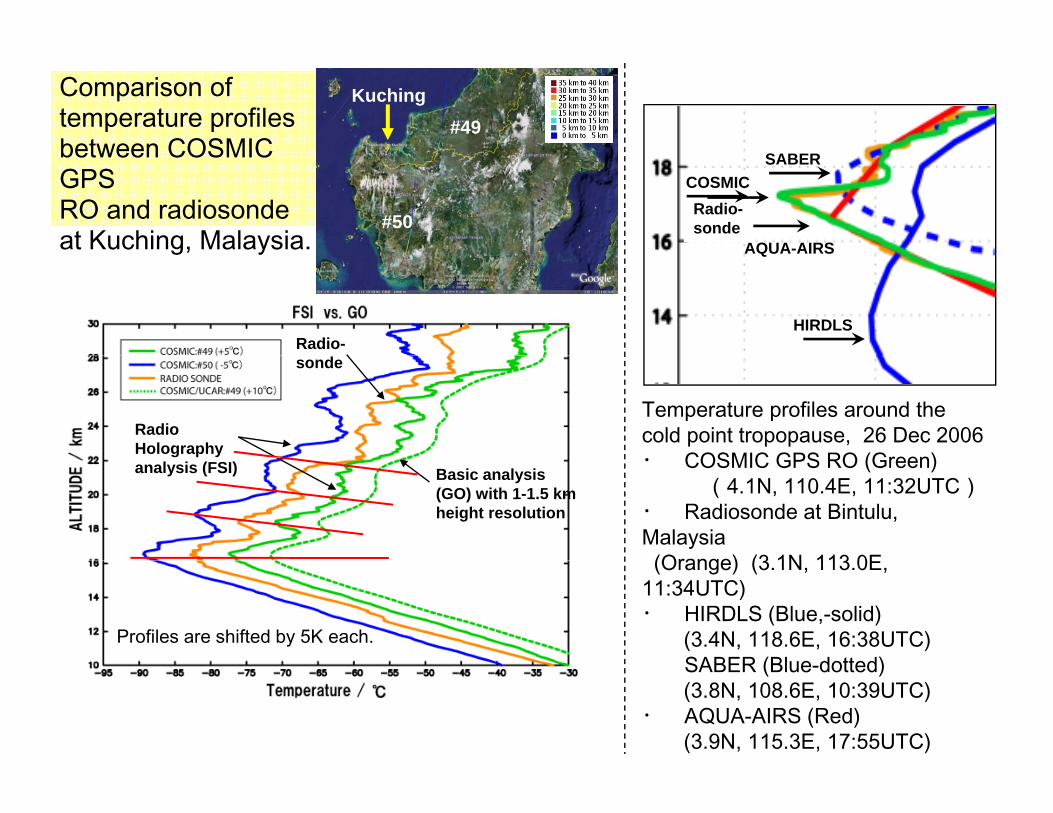
(Dissipation)(Dissipation)Generation, Propagation and
Dissipation of Atmospheric Waves i th E t i l R i The waves dissipate through various
instability processes, and deposit the momentum to the background winds, playing a key role to maintain
The waves dissipate through various instability processes, and deposit the momentum to the background winds, playing a key role to maintain
in the Equatorial Region
the dynamical structure of the equatorial middle atmosphere. the dynamical structure of the equatorial middle atmosphere.
(Propagation)(Propagation)The atmospheric waves grow the amplitudes during upward propagation in the middle atmosphere (15-100 km).
The atmospheric waves grow the amplitudes during upward propagation in the middle atmosphere (15-100 km). Energy and momentum are transported both horizontally and vertically by these waves.
Energy and momentum are transported both horizontally and vertically by these waves.
(Generation)Active convection in the tropics generates various atmospheric waves (equatorial Kelvin
(Generation)Active convection in the tropics generates various atmospheric waves (equatorial Kelvin ( qwave, atmospheric tide, gravity waves, etc).
( qwave, atmospheric tide, gravity waves, etc).
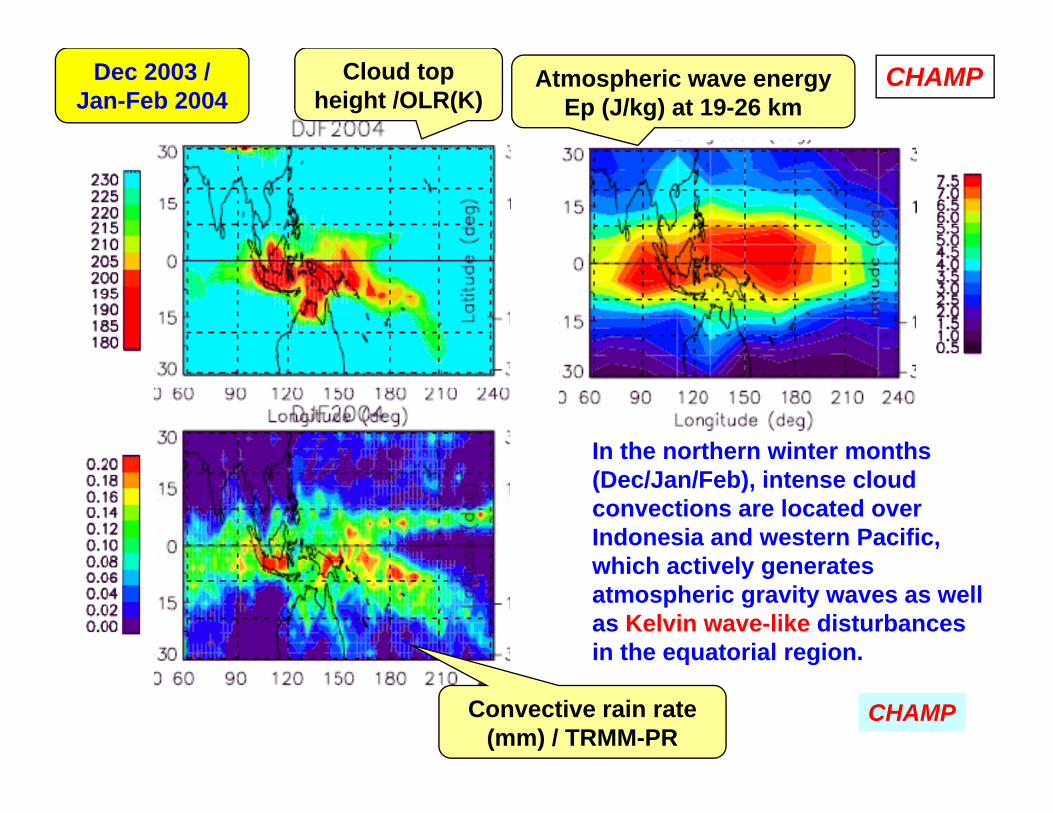
Cloud top height /OLR(K)
Atmospheric wave energy Ep (J/kg) at 19-26 km
Dec 2003 / Jan-Feb 2004
CHAMP
In the northern winter monthsIn the northern winter months (Dec/Jan/Feb), intense cloud convections are located over Indonesia and western Pacific,
hi h ti l twhich actively generates atmospheric gravity waves as well as Kelvin wave-like disturbances in the equatorial region.
Convective rain rate (mm) / TRMM-PR
q g
CHAMP

Jun-Jul-Aug, 2001
Sep-Oct-Nov, 2001
Dec, 2001 –Jan-Feb, 2002
CHAMP
EpStrato-sphericpgravity wave energy
OLRCloud top heightheight
TRMMPR-PR
Convective rain
trate

Year-to-year variations of wave energy (Ep), OLR and convective rain rate in Dec/Jan/Feb in 2001-2005
CHAMP
Black: Ep (0-10 J/kg), Blue: OLR (300-150K), Blue: Rain rate (0-0.25 mm)

JJA2001 JJA2002 JJA2003 JJA2004 JJA2005
CHAMP
SON SON SON SONSON
DJF DJF DJF DJF DJF
MAM MAM MAM MAM MAM
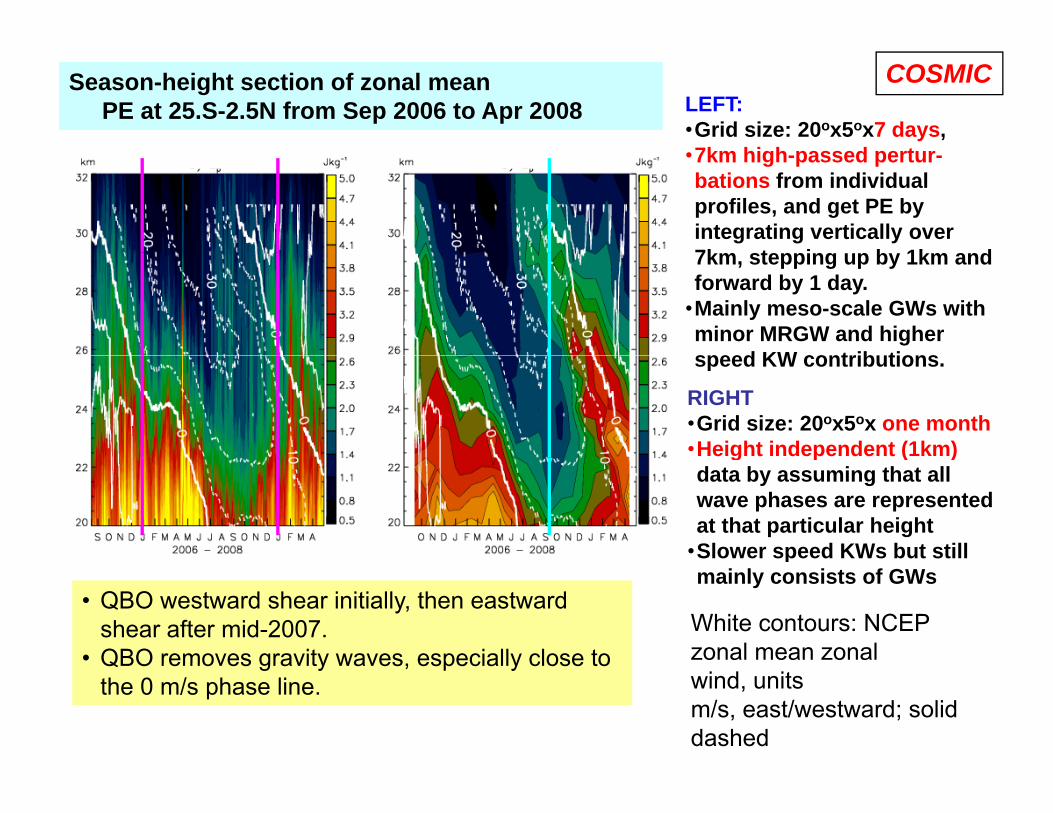
LEFT: •Grid size: 20ox5ox7 days, 7k hi h d t
Season-height section of zonal mean PE at 25.S-2.5N from Sep 2006 to Apr 2008
Season-height section of zonal mean PE at 25.S-2.5N from Sep 2006 to Apr 2008
COSMIC
•7km high-passed pertur-bations from individual profiles, and get PE by integrating vertically over 7k t i b 1k d7km, stepping up by 1km and forward by 1 day.
•Mainly meso-scale GWs with minor MRGW and higher speed KW contrib tionsspeed KW contributions.
RIGHT•Grid size: 20ox5ox one month•Height independent (1km)g p ( )data by assuming that all wave phases are represented at that particular height
•Slower speed KWs but still pmainly consists of GWs
• QBO westward shear initially, then eastward shear after mid-2007.
• QBO removes gravity waves especially close toWhite contours: NCEP zonal mean zonal QBO removes gravity waves, especially close to
the 0 m/s phase line. wind, units m/s, east/westward; solid dashed

(a) Longitude-latitude distribution of Ep at 19–26 km by averaging Ep
(b) In each year residual of Ep from global average in (a) is calculated then they
CHAMP
Jun-
Results in (a) indicate a climatological pattern of the temperature disturbances in the
y g g pin 2001–2006.
(a) is calculated, then, they are averaged for 5 years
Jun-Jul-Aug
disturbances in the sratosphere, including Kelvin waves, GW, etc.
While, (b) shows Sep-Oct-Nov
regional wave activity, esp. GW is dominant
GW energy seems to be larger over the
Dec-Jan-Feb
be larger over the Asian monsoon region,Indonesia-western Pacific by convection,
d S t th A i
Mar-Apr-
and Sotuth America (Andes) due to orographic waves
pMay
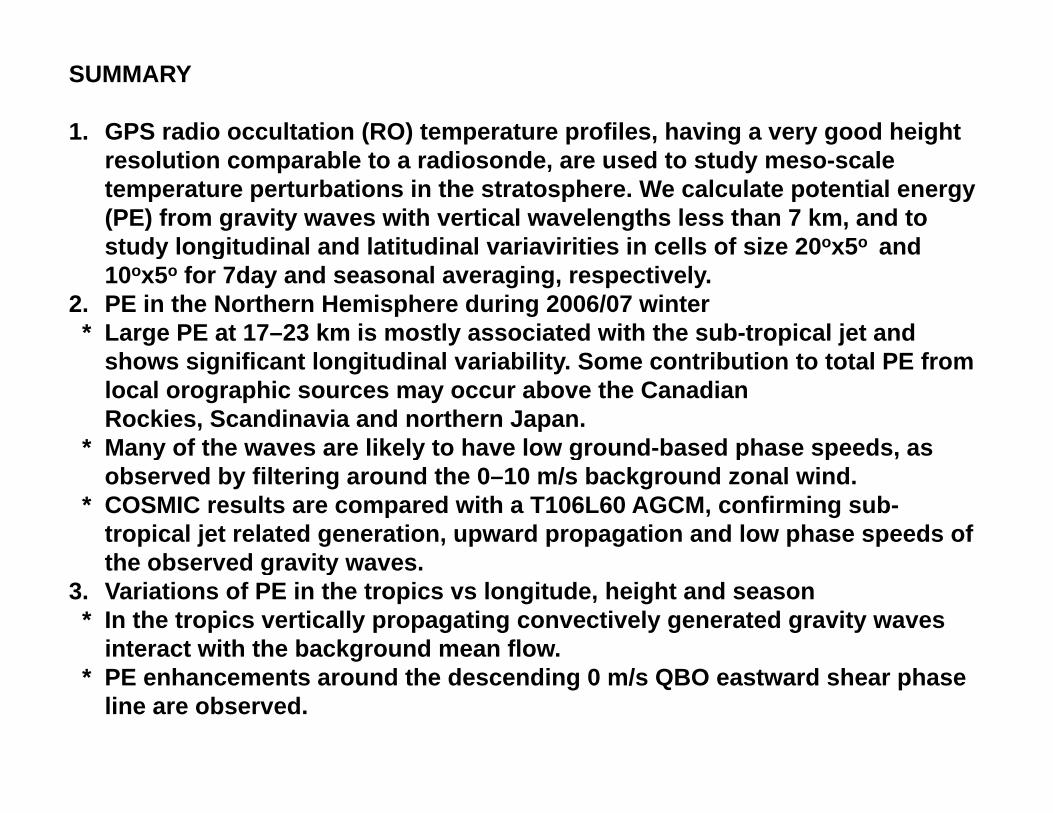
SUMMARY
1. GPS radio occultation (RO) temperature profiles, having a very good height resolution comparable to a radiosonde, are used to study meso-scale temperature perturbations in the stratosphere. We calculate potential energy (PE) from gravity waves with vertical wavelengths less than 7 km, and to study longitudinal and latitudinal variavirities in cells of size 20ox5o andstudy longitudinal and latitudinal variavirities in cells of size 20 x5 and 10ox5o for 7day and seasonal averaging, respectively.
2. PE in the Northern Hemisphere during 2006/07 winter* Large PE at 17–23 km is mostly associated with the sub-tropical jet and
h i ifi t l it di l i bilit S t ib ti t t t l PE fshows significant longitudinal variability. Some contribution to total PE from local orographic sources may occur above the Canadian Rockies, Scandinavia and northern Japan.
* Many of the waves are likely to have low ground-based phase speeds, as y y g p p ,observed by filtering around the 0–10 m/s background zonal wind.
* COSMIC results are compared with a T106L60 AGCM, confirming sub-tropical jet related generation, upward propagation and low phase speeds of the observed gravity wavesthe observed gravity waves.
3. Variations of PE in the tropics vs longitude, height and season * In the tropics vertically propagating convectively generated gravity waves
interact with the background mean flow. * PE enhancements around the descending 0 m/s QBO eastward shear phase
line are observed.

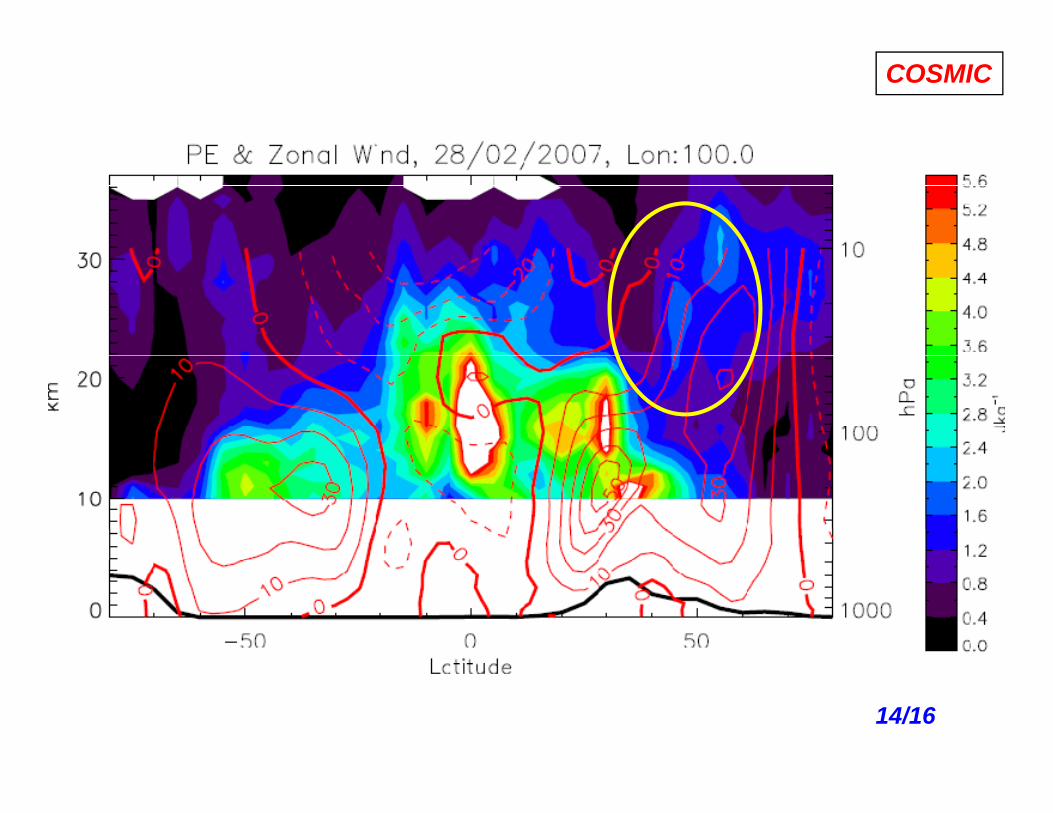
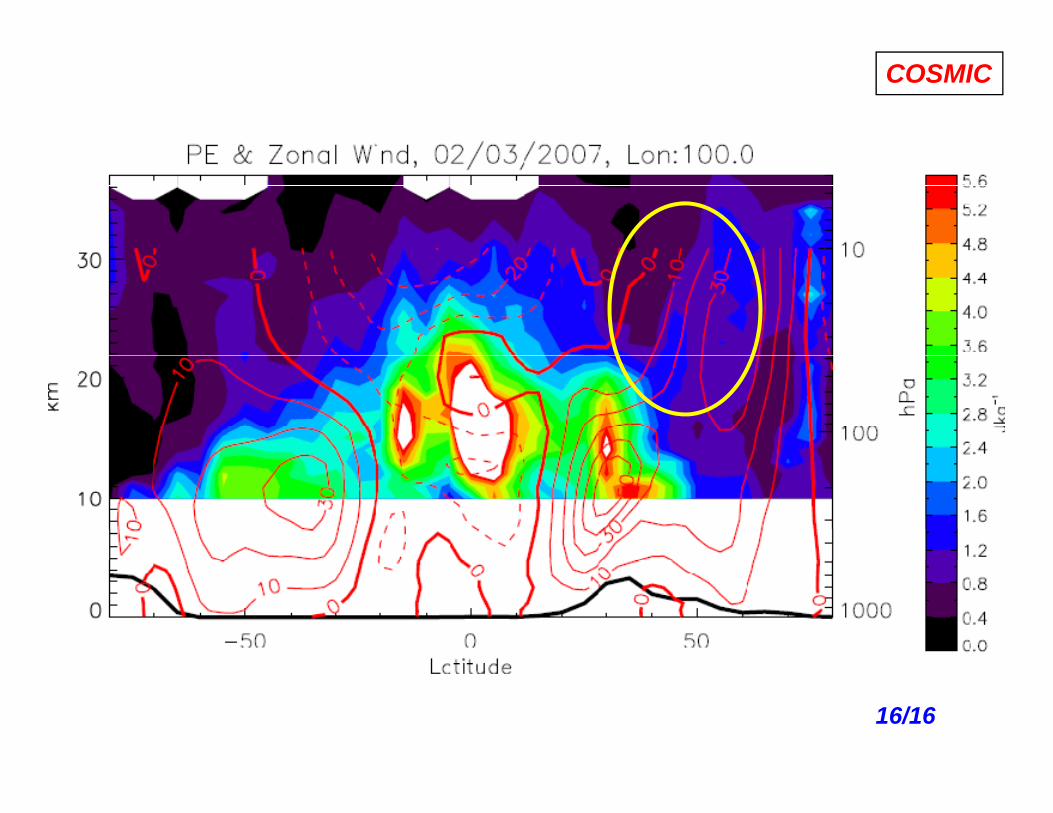
Geostrophic adjustment of polar night jet stream,Wave mean flowRed: NCEP 7
Latitude-height section of PE at 140E (130-150E) during 12-18 Dec 2006 from COSMIC GPS RO temperature dataLatitude-height section of PE at 140E (130-150E) during 12-18 Dec 2006 from COSMIC GPS RO temperature data
COSMIC
polar night jet stream, planetary waves, Doppler shifting of tropospheric wasve
Wave – mean flow interactions
Red: NCEP 7-day averaged u, with solid eastward anddashed
Meteorological
dashed westward
disturbances
Orographicsources
Cloud convection in the tropics
Wind shear aro nd jet
Topography
Tropopause
the tropics around jet
• N-H mid-latitude sub-tropical jet has maximum eastward winds at 10 km and 35N.• Large PE above the jet core are distributed upward/poleward along the u contour lines.Large PE above the jet core are distributed upward/poleward along the u contour lines.• These waves seem to have small ground based phase velocities, and are critically filtered
out by the westward wind shear. (Note: large decrease between 10 m/s and 0 m/s lines.) • Large PE extends up to the edge of the polar stratospheric jet.
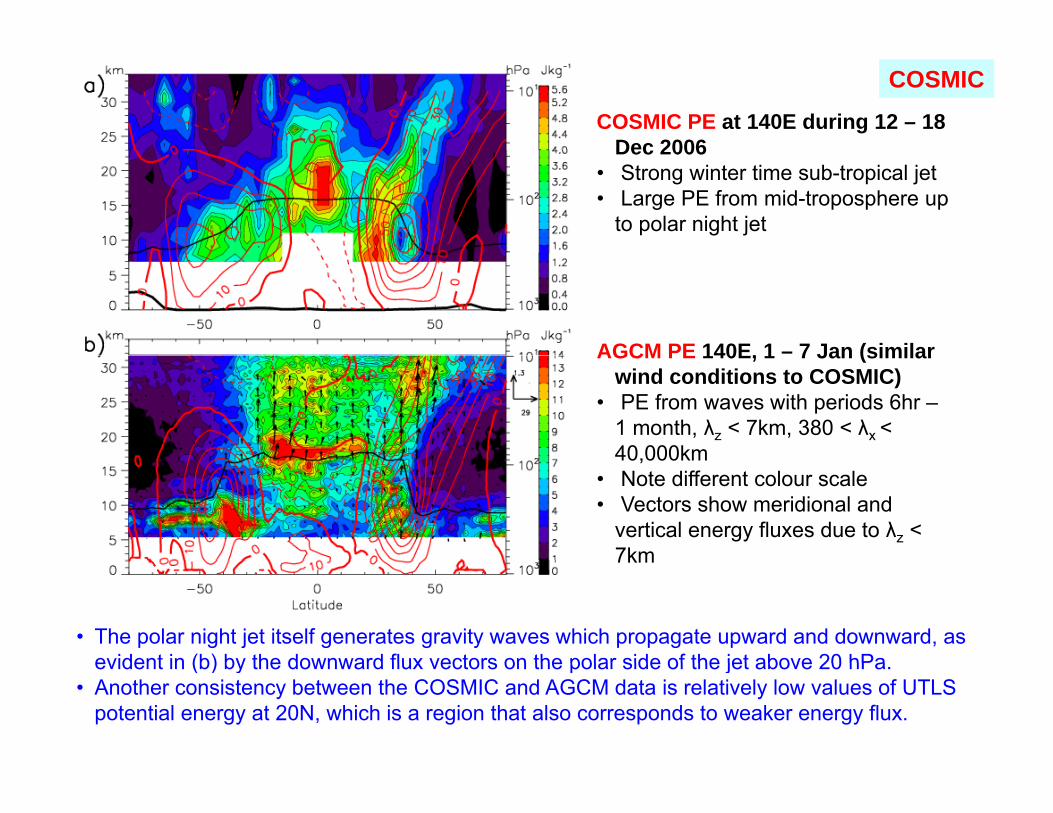
COSMIC PE at 140E during 12 – 18 Dec 2006
COSMIC
Dec 2006• Strong winter time sub-tropical jet• Large PE from mid-troposphere up
to polar night jet
AGCM PE 140E, 1 – 7 Jan (similarAGCM PE 140E, 1 7 Jan (similar wind conditions to COSMIC)
• PE from waves with periods 6hr –1 month, λz < 7km, 380 < λx < 40 000km40,000km
• Note different colour scale• Vectors show meridional and
vertical energy fluxes due to λz < 7km7km
• Large tropical PE above about 30 hPa are not detected by COSMIC, because the associated gravity waves seem to have short periods and short λz
• As with COSMIC, larger PE is located equatorward of the sub-tropical jet and is also di t ib t d d d l d l th l i d t li
• The polar night jet itself generates gravity waves which propagate upward and downward, as evident in (b) by the downward flux vectors on the polar side of the jet above 20 hPagravity waves seem to have short periods and short λz. distributed upward and poleward along the zonal wind contour lines.
• Large PE at 30–10 hPa at 40N are mostly due to gravity waves generated in the vicinity of the sub-tropical jet, propagating upward as indicated by the the vertical energy flux vectors.
evident in (b) by the downward flux vectors on the polar side of the jet above 20 hPa.• Another consistency between the COSMIC and AGCM data is relatively low values of UTLS
potential energy at 20N, which is a region that also corresponds to weaker energy flux.

COSMIC
1/16
COSMIC
2/16

3/16
COSMIC
4/16

COSMIC
5/16

COSMIC
6/16

COSMIC
7/16

COSMIC
8/16

COSMIC
9/16

COSMIC
10/16

COSMIC
11/16
COSMIC
12/16

COSMIC
13/16
COSMIC
14/16

COSMIC
15/16
COSMIC
16/16

• By using routine radiosonde data at Antarctic bases, GW energy is found
Earlier studies of gravity waves (GW) in Antarctic region
By using routine radiosonde data at Antarctic bases, GW energy is found to be large in October-November. [Yoshiki and Sato., 2000]
• The intensity of background mean winds (polar night jet) seem to be related to a generation mechanism of GW.GW h d h th l i ht j t h d th• GW energy was enhanced when the polar night jet approached over the station during its dissipating phase in spring. [Yoshiki et al., 2004]
• Rantnam et al. [2004] reported enhancement of GW at around the polar vortex during the major stratospheric sudden warming in 2002 by using g j g y gCHAMP GPS RO data.
Seasonal variation of the mean square of temperature fluctuations averaged at 15 20kmaveraged at 15-20km at the Antarctic stations [Yoshiki and Sato, 2000].
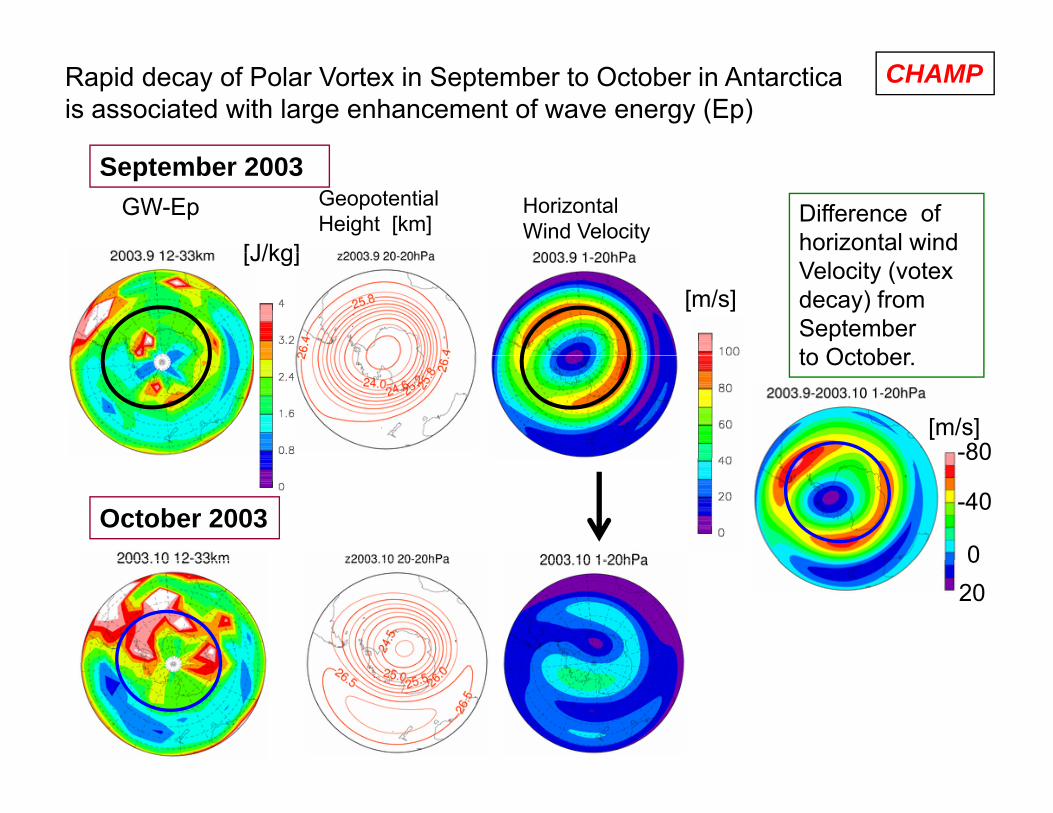
CHAMPRapid decay of Polar Vortex in September to October in Antarctica is associated with large enhancement of wave energy (Ep)
September 2003GeopotentialHeight [km]
GW-Ep HorizontalWind Velocity
Difference of horizontal wind [J/kg]
[m/s]Velocity (votexdecay) from September to October
[J/kg]
to October.
[m/s]-80
October 2003
80
-40
0020

Horizontal distribution of Ep (12-33km), Geopotential height (250-7HPa) and Horizontal winds (250-7HPa)in September and
CHAMP
Horizontal winds (250 7HPa)in September and October 2003

Wave Energry (monthly mean rms T’) is cloasedly realted with E-P flux divergence (DF) in both Antarctic and Arctic regions CHAMP
ARCTICANTARCTIC
In Antarctic during the vortex decay in While in Arctic region, vortex decay does not
SSW
In Antarctic during the vortex decay in spring (September- October) GW activity is considerably enhanced.
effectively emit GW, but SSW (sudden stratospheric Warming) events are closely related to GW energy increase.
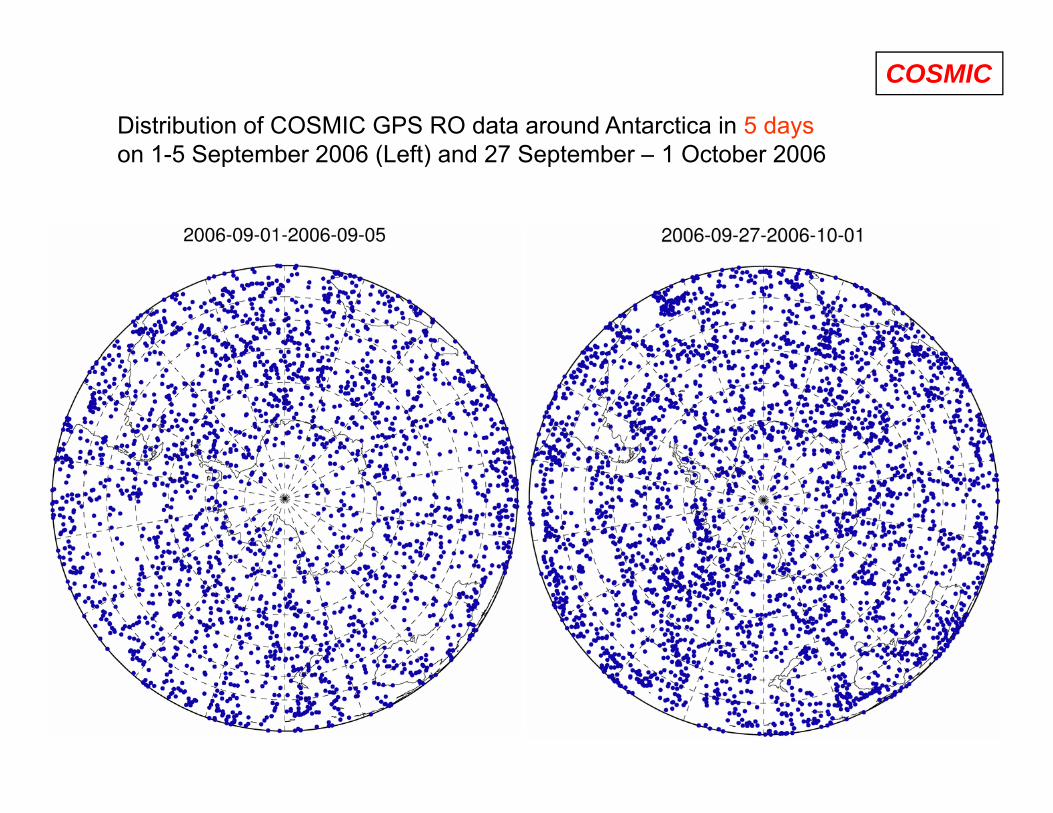
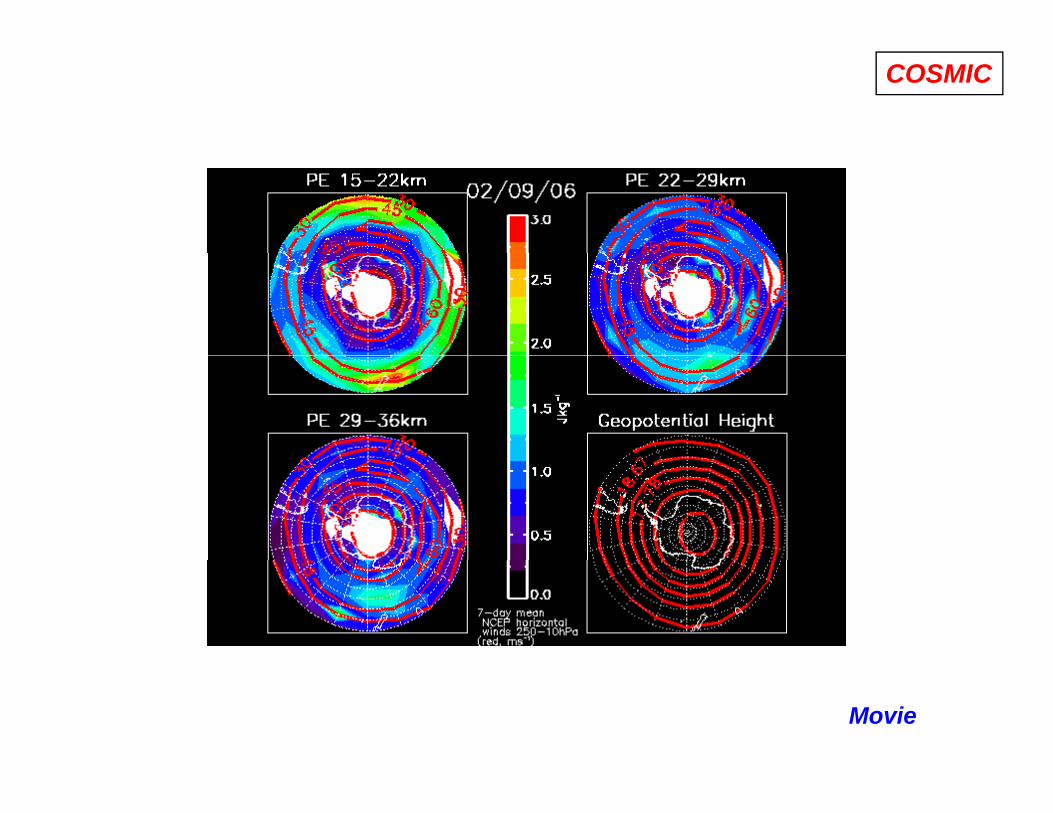
Distribution of COSMIC GPS RO data around Antarctica in 5 dayson 1 5 September 2006 (Left) and 27 September 1 October 2006
COSMIC
on 1-5 September 2006 (Left) and 27 September – 1 October 2006

COSMIC
COSMIC
Movie

COSMIC
5/10

Longitude variation of Ep in 2002-2006,Baumgaertner and McDonald (2007)
Wave activity enhancements
CHAMP
ywere also found around the edge of the polar vortex, which was attributed to reduced critical level filtering and Dopplerlevel filtering and Doppler shifting. Additional wave sources, such as geostrophic adjustment or shear associated with the jet, were not necessary to explain this enhancement. A l i ith CHAMP GPS ROAnalysis with CHAMP GPS-RO and balloon soundings suggest that wave enhancement outside the Antarctic continent is related to structure of the polar vortex. Esp large Ep was found near
Antarctic continent
Esp. , large Ep was found near the edge of the vortex. (e.g., Yoshiki and Sato, 2000; Ratnam et al., 2004)

Longitude variation of Ep in 2003, averaged over 60-90S,Baumgaertner and McDonald (2007)
CHAMP
Topography is an important source of gravity waves in the two regions.The relation is less pronounced at
Syowa base (69S, 39.6E) The relation is less pronounced at
23-27 km probably due to the filtering effects.
Yoshiki and Sato (2000) reported that the gravity wave activity at 15-20km over Syowa has a weak ycorrelation with troposphericwinds, so, they suggested stratospheric sources for wave generationgeneration.
Antarctic Peninsula (60-70W)
Trans-antarctic Mountains (about 160E)

Numerical model results for orographic generation of gravity waves
Oragraphic waves areOragraphic waves are generated near west coast of RASS sea
S. Watanabe et al., JGR, 2006
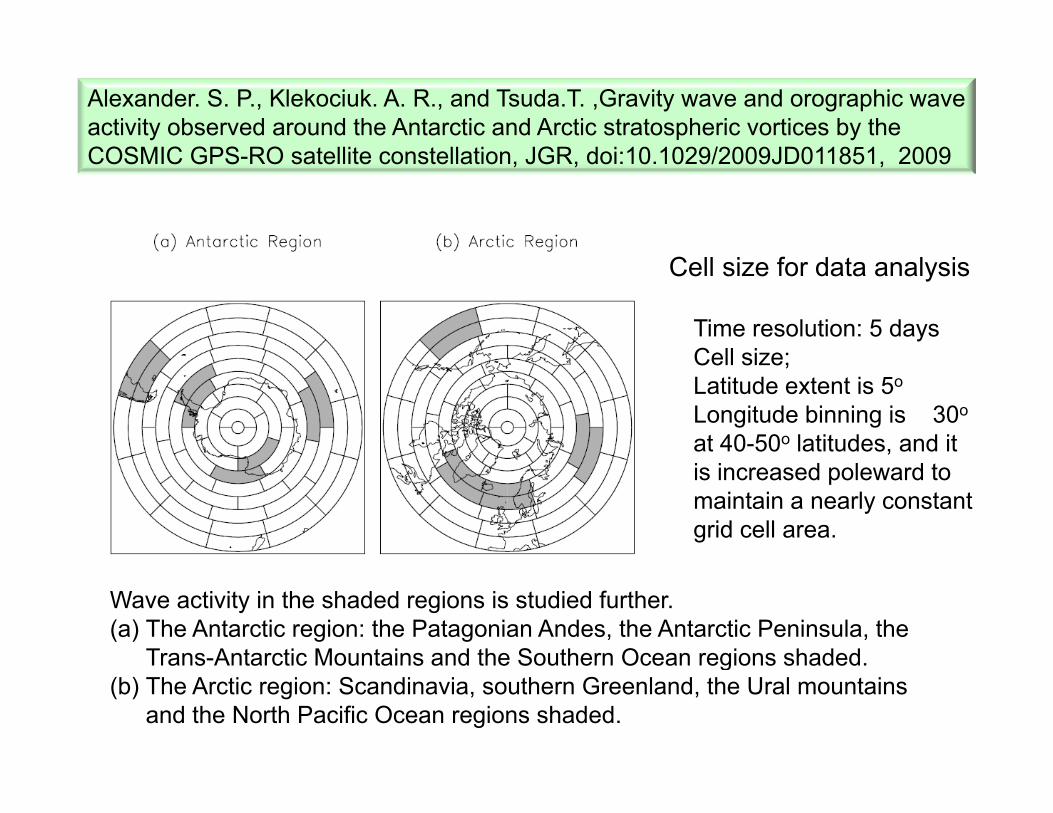
Alexander. S. P., Klekociuk. A. R., and Tsuda.T. ,Gravity wave and orographic wave activity observed around the Antarctic and Arctic stratospheric vortices by the COSMIC GPS RO t llit t ll ti JGR d i 10 1029/2009JD011851 2009COSMIC GPS-RO satellite constellation, JGR, doi:10.1029/2009JD011851, 2009
Time resolution: 5 daysCell size;
Cell size for data analysis
Cell size; Latitude extent is 5o
Longitude binning is 30o
at 40-50o latitudes, and it is increased poleward to maintain a nearly constant grid cell area.
Wave activity in the shaded regions is studied further. (a) The Antarctic region: the Patagonian Andes, the Antarctic Peninsula, the
Trans-Antarctic Mountains and the Southern Ocean regions shaded.Trans Antarctic Mountains and the Southern Ocean regions shaded.(b) The Arctic region: Scandinavia, southern Greenland, the Ural mountains
and the North Pacific Ocean regions shaded.

COSMICStructure of the polar vortex and wave variance (Ep) distribution
D i i dMay-December 2007 in Antarctica at 500 K (about 19-20 km)
During winds decreased from 60m/s to 40 m/s in late-Sep to Oct (spring), large
May December 2007 in Antarctica at 500 K (about 19 20 km)
Vortex boundary
V t d to Oct (spring), large wave variance is observed inside the vortex boundary with s mmetric distrib tion
Vortex edge
symmetric distribution
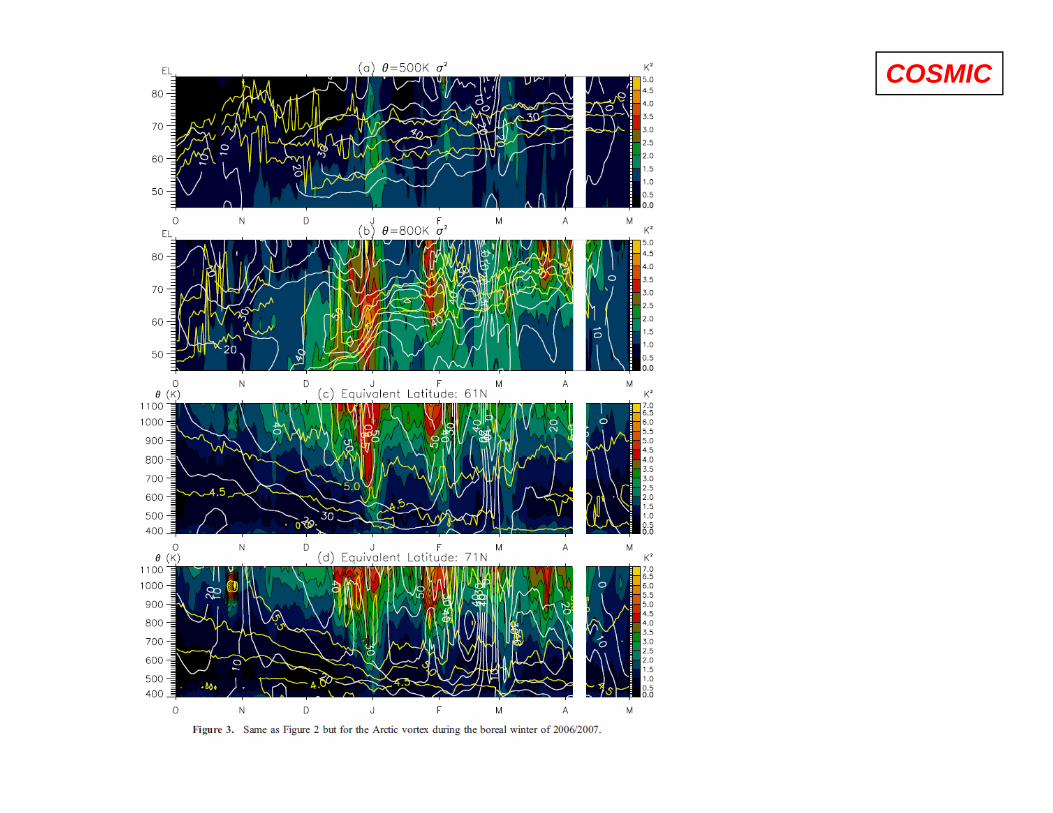
October-May 2006/7 for the Arctic vortex at 500 KEnhancement of Epdoes not occur duringdoes not occur during the vortex decay phase.But, large Ep in early Jan, Feb and March
Contour: Ep White line: 5-day smoothed UKMO zonal
coincides with SSW (sudden stratospheric warming)
Contour: Ep, White line: 5 day smoothed UKMO zonal mean zonal winds (m/s, eastward solid),
Yellow line: vortex edge (thick) and vortex boundary region (between the thin yellow lines).

COSMICTime-height section of wave variance (Ep) in Antarctica
Region of increased EpRegion of increased Epdescends in concert with decreasing winds (from 80 to 40 m/s) and
d d f i
34km
29km
At 71 S (outside of the
a descend of a region of increased stability.19-20m
vortex), the behavior of Ep is similar, but with smaller magnitude. Epis 1 5 times larger at 61
Contour: Ep at (c) 61 S and (d) 71
is 1.5 times larger at 61 S (inside the vortex boundary) than at 71S.
Contour: Ep at (c) 61 S and (d) 71 S.
White line: 5-day smoothed UKMO zonal mean zonal winds
At 800 K, Ep exceeds 2.5 K2 for certain short intervals in early July, mid September and early October, which is
(m/s, eastward solid)Yellow: Brunt-Vaisala frequency from
COSMIC
likely due to orographic source.
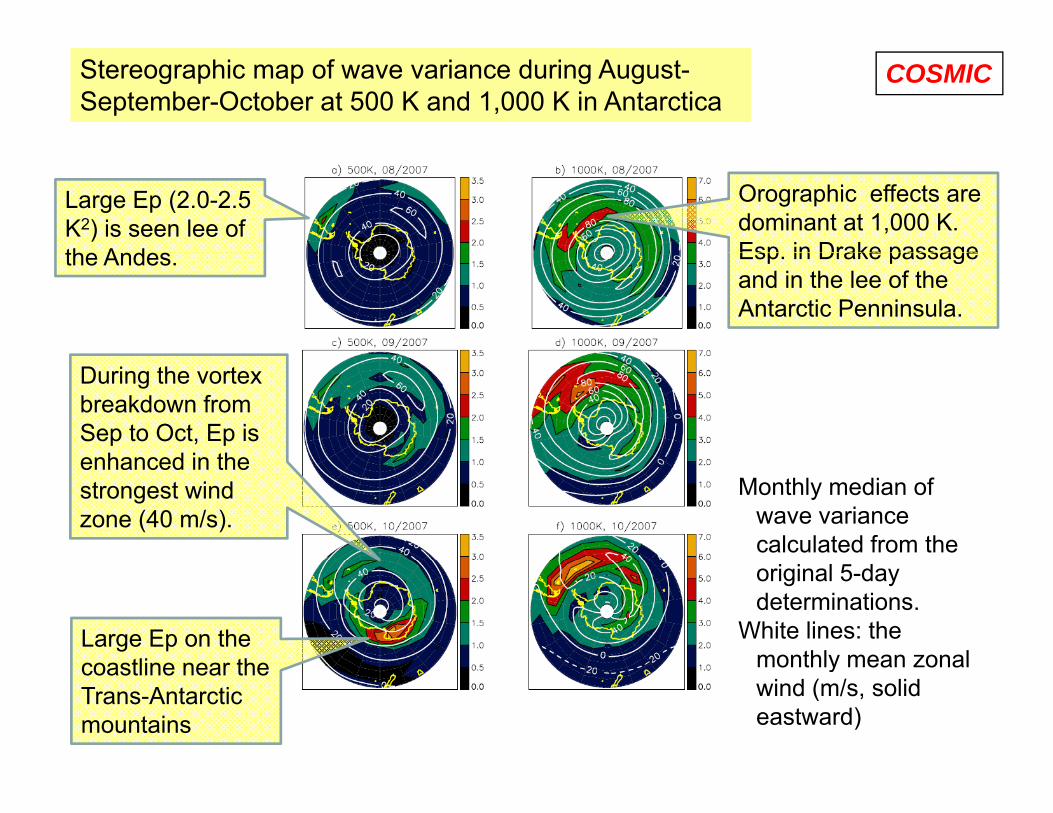
Stereographic map of wave variance during August-September-October at 500 K and 1,000 K in Antarctica
COSMIC
Large Ep (2.0-2.5 K2) is seen lee of the Andes
Orographic effects are dominant at 1,000 K.Esp in Drake passagethe Andes. Esp. in Drake passage and in the lee of the Antarctic Penninsula.
During the vortex breakdown from Sep to Oct, Ep is enhanced in the
Monthly median of wave variance calculated from the
enhanced in the strongest wind zone (40 m/s).
original 5-day determinations.
White lines: the monthly mean zonal
Large Ep on the coastline near the monthly mean zonal
wind (m/s, solid eastward)
coastline near the Trans-Antarctic mountains

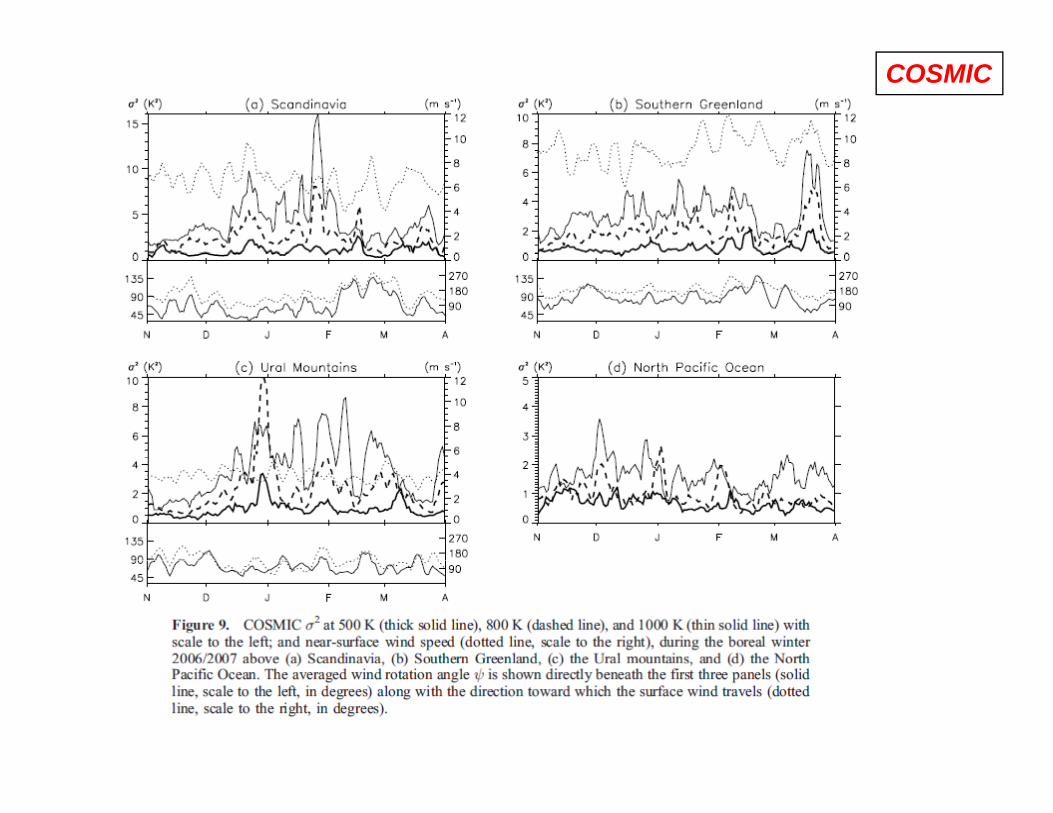
COSMICShort-term wave variability in Antarctica
Near-surface wind speed (dotted line, scale to the right)right)
Rotation angle of mean winds
Ep at 500 K: thick
solid 800 K:800 K:
dashed1000 K: thin
solid ) Intermittent peaks of Ep occur with 5-10 day duration, with larger values over Andes and Antarctic Peninsula than the Trans-Antarctic mountains. Orographic waves are not continuously generated, but they depend on the mean wind conditions.
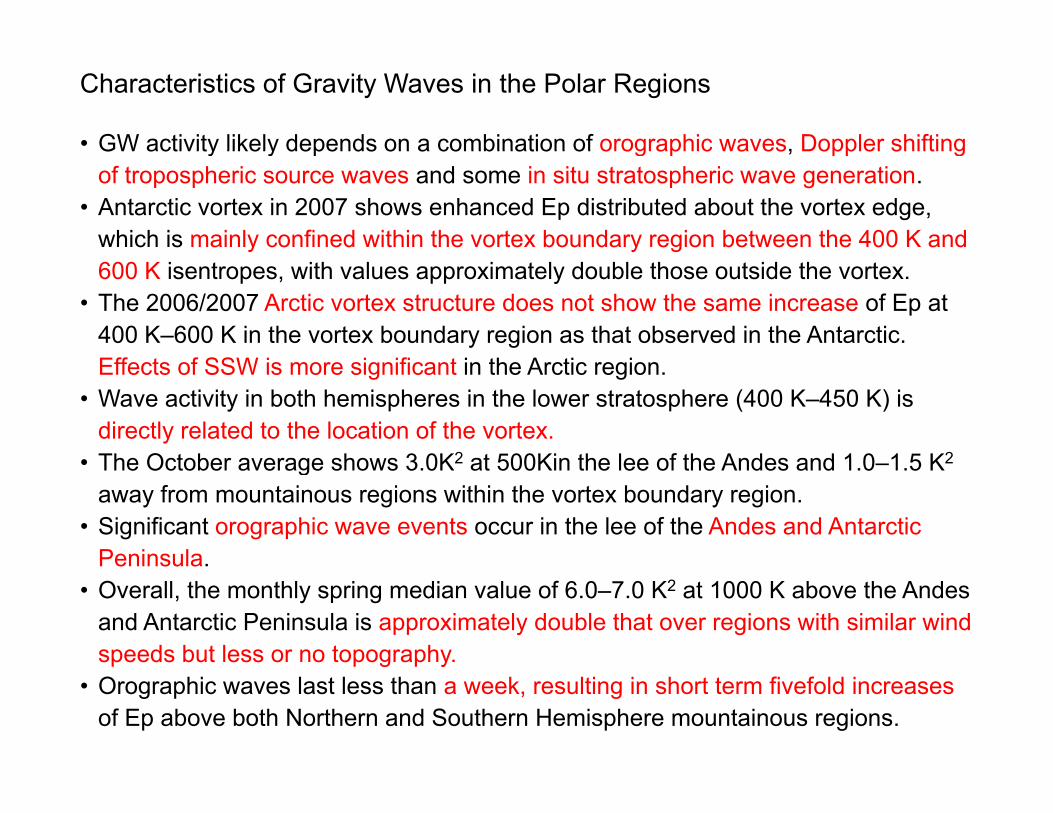
Characteristics of Gravity Waves in the Polar Regions
• GW activity likely depends on a combination of orographic waves, Doppler shiftingGW activity likely depends on a combination of orographic waves, Doppler shifting of tropospheric source waves and some in situ stratospheric wave generation.
• Antarctic vortex in 2007 shows enhanced Ep distributed about the vortex edge, which is mainly confined within the vortex boundary region between the 400 K and 600 K isentropes, with values approximately double those outside the vortex.
• The 2006/2007 Arctic vortex structure does not show the same increase of Ep at 400 K–600 K in the vortex boundary region as that observed in the Antarctic. Effects of SSW is more significant in the Arctic region.
• Wave activity in both hemispheres in the lower stratosphere (400 K–450 K) is directly related to the location of the vortex.The October a erage sho s 3 0K2 at 500Kin the lee of the Andes and 1 0 1 5 K2• The October average shows 3.0K2 at 500Kin the lee of the Andes and 1.0–1.5 K2
away from mountainous regions within the vortex boundary region.• Significant orographic wave events occur in the lee of the Andes and Antarctic
PeninsulaPeninsula. • Overall, the monthly spring median value of 6.0–7.0 K2 at 1000 K above the Andes
and Antarctic Peninsula is approximately double that over regions with similar wind speeds but less or no topography. p p g p y
• Orographic waves last less than a week, resulting in short term fivefold increases of Ep above both Northern and Southern Hemisphere mountainous regions.

SUMMARY• Temperature profiles obtained from GPS-RO are used to analyse the
behaviour of atmospheric gravity wave (GW)behaviour of atmospheric gravity wave (GW). COSMIC GPS-RO data have resulted in a more detailed
understanding of global and regional scale GW activity on shorter time intervals in the lower stratosphere than previously possible. p p y p
Specifically, the data allow the resolution of waves with vertical wavelengths of abut 2–7 and 15km on time scales of 5-7 days.
• In the tropics, We have studied convectively generated GW, and found hemispheric
and regional scale changes in wave energy which are related to the convective source as well as background wind (QBO) conditions.
I th l i• In the polar regions, We have determined the latitudinal extent of enhanced gravity wave
activity around the stratospheric vortex edge. We revealed the symmetric presence of increased gravity waveWe revealed the symmetric presence of increased gravity wave
activity near the vortex edge around the 500K isentrope during Antarctic springtime decay.
Most of the wave energy observed above various mountainous Most of the wave energy observed above various mountainous regions in the polar and sub-polar regions can be attributed to the presence of orographically generated waves.
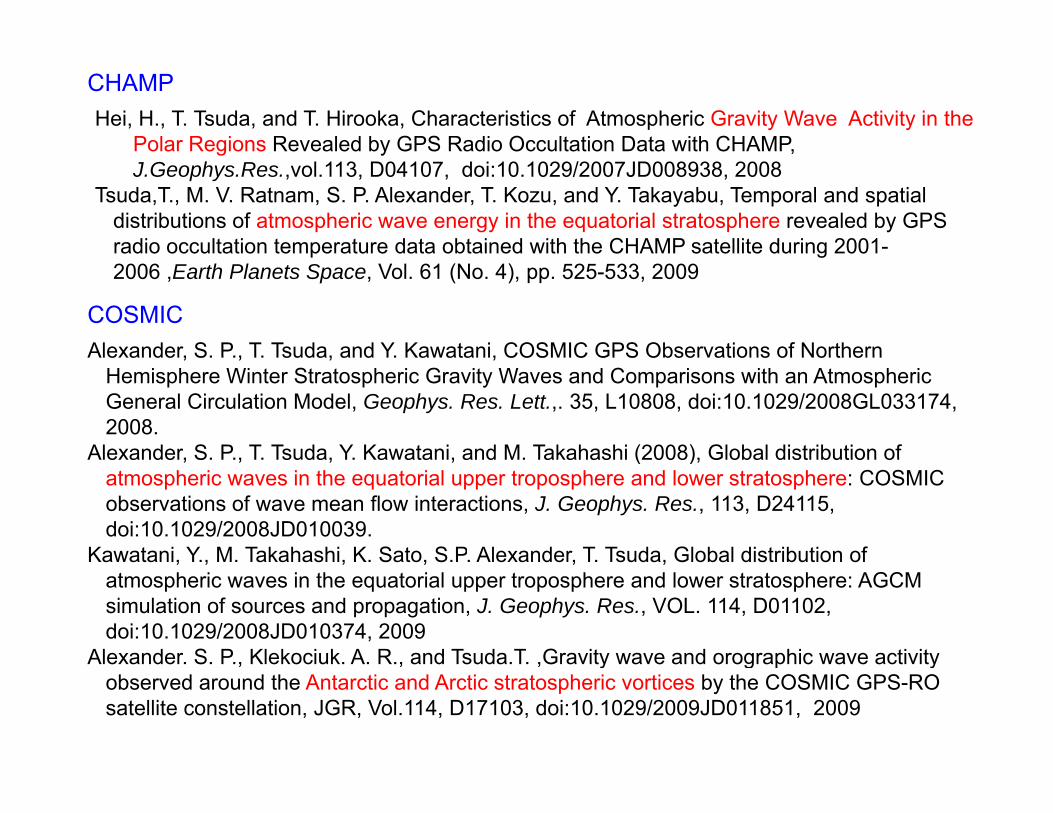
Hei, H., T. Tsuda, and T. Hirooka, Characteristics of Atmospheric Gravity Wave Activity in the Polar Regions Revealed by GPS Radio Occultation Data with CHAMP,
CHAMP
Polar Regions Revealed by GPS Radio Occultation Data with CHAMP, J.Geophys.Res.,vol.113, D04107, doi:10.1029/2007JD008938, 2008
Tsuda,T., M. V. Ratnam, S. P. Alexander, T. Kozu, and Y. Takayabu, Temporal and spatial distributions of atmospheric wave energy in the equatorial stratosphere revealed by GPS radio occultation temperature data obtained with the CHAMP satellite during 2001-radio occultation temperature data obtained with the CHAMP satellite during 20012006 ,Earth Planets Space, Vol. 61 (No. 4), pp. 525-533, 2009
Alexander S P T Tsuda and Y Kawatani COSMIC GPS Observations of NorthernCOSMICAlexander, S. P., T. Tsuda, and Y. Kawatani, COSMIC GPS Observations of Northern
Hemisphere Winter Stratospheric Gravity Waves and Comparisons with an Atmospheric General Circulation Model, Geophys. Res. Lett.,. 35, L10808, doi:10.1029/2008GL033174, 2008.
Alexander, S. P., T. Tsuda, Y. Kawatani, and M. Takahashi (2008), Global distribution ofAlexander, S. P., T. Tsuda, Y. Kawatani, and M. Takahashi (2008), Global distribution of atmospheric waves in the equatorial upper troposphere and lower stratosphere: COSMIC observations of wave mean flow interactions, J. Geophys. Res., 113, D24115, doi:10.1029/2008JD010039.
Kawatani, Y., M. Takahashi, K. Sato, S.P. Alexander, T. Tsuda, Global distribution ofKawatani, Y., M. Takahashi, K. Sato, S.P. Alexander, T. Tsuda, Global distribution of atmospheric waves in the equatorial upper troposphere and lower stratosphere: AGCM simulation of sources and propagation, J. Geophys. Res., VOL. 114, D01102, doi:10.1029/2008JD010374, 2009
Alexander. S. P., Klekociuk. A. R., and Tsuda.T. ,Gravity wave and orographic wave activityAlexander. S. P., Klekociuk. A. R., and Tsuda.T. ,Gravity wave and orographic wave activity observed around the Antarctic and Arctic stratospheric vortices by the COSMIC GPS-RO satellite constellation, JGR, Vol.114, D17103, doi:10.1029/2009JD011851, 2009


Characteristics of Gravity Waves in the Polar Regions
• GW activity likely depends on a combination of orographic waves, Doppler shiftingGW activity likely depends on a combination of orographic waves, Doppler shifting of tropospheric source waves and some in situ stratospheric wave generation.
• Antarctic vortex in 2007 shows enhanced Ep distributed about the vortex edge, which is mainly confined within the vortex boundary region between the 400 K and 600 K isentropes ith al es appro imatel do ble those o tside theK and 600 K isentropes, with values approximately double those outside the vortex.
• The 2006/2007 Arctic vortex structure does not show the same increase of Ep at 400 K–600 K in the vortex boundary region as that observed in the Antarctic. y gEffects of SSW is more significant in the Arctic region.
• Wave activity in both hemispheres in the lower stratosphere (400 K–450 K) is directly related to the location of the vortex.
• The October average shows 3 0K2 at 500Kin the lee of the Andes and 1 0 1 5 K2• The October average shows 3.0K2 at 500Kin the lee of the Andes and 1.0–1.5 K2
away from mountainous regions within the vortex boundary region.• Significant orographic wave events occur in the lee of the Andes and Antarctic
Peninsula, based on relatively low wind rotation angles from the surface to 400 K. • Overall, the monthly spring median value of 6.0–7.0 K2 at 1000 K above the Andes
and Antarctic Peninsula is approximately double that over regions with similar wind speeds but less or no topography.
• Orographic waves last less than a week resulting in short term fivefold increasesOrographic waves last less than a week, resulting in short term fivefold increases of Ep above both Northern and Southern Hemisphere mountainous regions.
• Increases in Ep above the Southern Ocean during October 2007 coincides with strong wind speeds, which are conducive to Doppler shifting of tropospheric

COSMIC
COSMIC

COSMIC


COSMIC
COSMIC