Embed Size (px)
Citation preview
European Biomass Industry Association
World Energy Forum 2012
25th October 2012
Dubai, United Arab Emirates
Giuliano Grassi
EUBIA
Rue d’Arlon 63-65 B-1040 Brussels Belgium
T. +32 (0) 2 400 10 20 F. +32 (0) 2 400 10 21
[email protected] www.eubia.org
European Biomass Industry Association
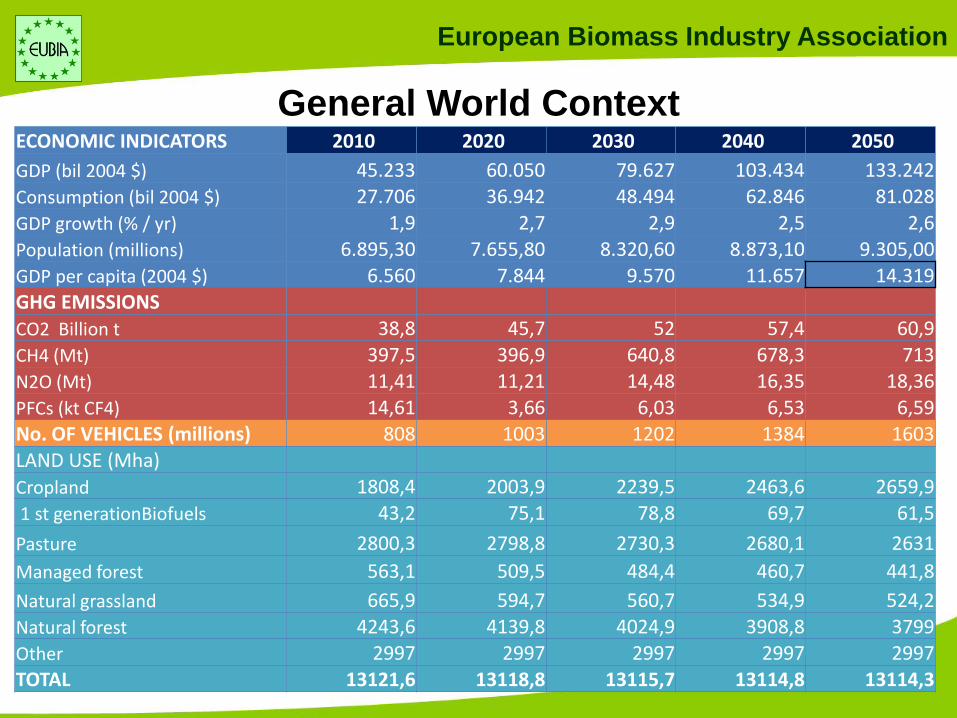
ECONOMIC INDICATORS 2010 2020 2030 2040 2050
GDP (bil 2004 $) 45.233 60.050 79.627 103.434 133.242
Consumption (bil 2004 $) 27.706 36.942 48.494 62.846 81.028
GDP growth (% / yr) 1,9 2,7 2,9 2,5 2,6
Population (millions) 6.895,30 7.655,80 8.320,60 8.873,10 9.305,00
GDP per capita (2004 $) 6.560 7.844 9.570 11.657 14.319 GHG EMISSIONS
CO2 Billion t 38,8 45,7 52 57,4 60,9
CH4 (Mt) 397,5 396,9 640,8 678,3 713
N2O (Mt) 11,41 11,21 14,48 16,35 18,36
PFCs (kt CF4) 14,61 3,66 6,03 6,53 6,59 No. OF VEHICLES (millions) 808 1003 1202 1384 1603 LAND USE (Mha)
Cropland 1808,4 2003,9 2239,5 2463,6 2659,9
1 st generationBiofuels 43,2 75,1 78,8 69,7 61,5
Pasture 2800,3 2798,8 2730,3 2680,1 2631
Managed forest 563,1 509,5 484,4 460,7 441,8
Natural grassland 665,9 594,7 560,7 534,9 524,2
Natural forest 4243,6 4139,8 4024,9 3908,8 3799
Other 2997 2997 2997 2997 2997 TOTAL 13121,6 13118,8 13115,7 13114,8 13114,3
General World Context
European Biomass Industry Association
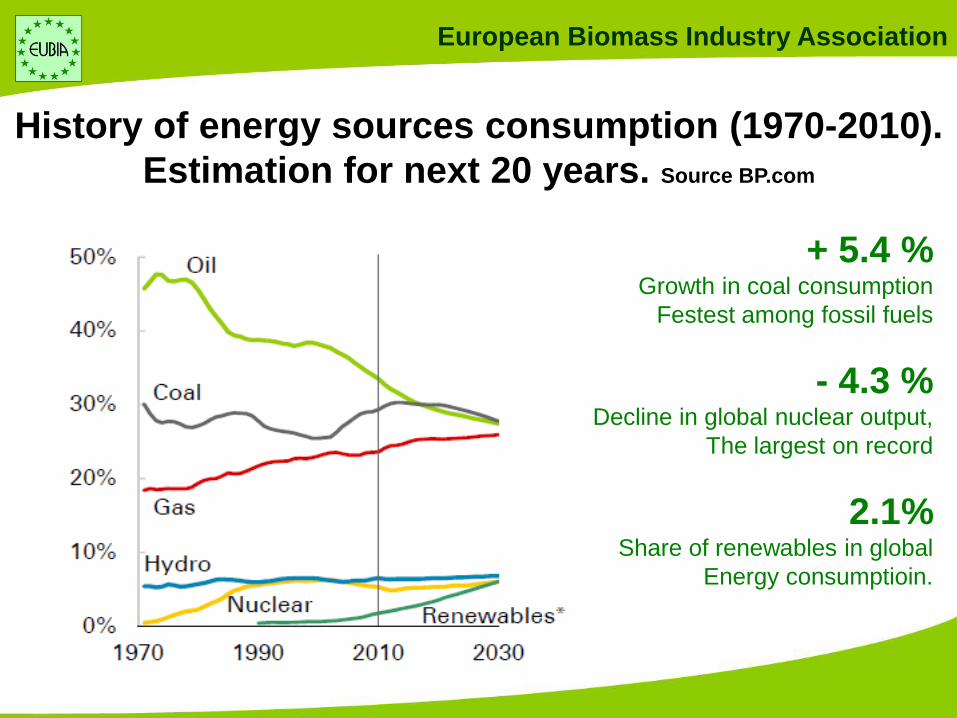
History of energy sources consumption (1970-2010).
Estimation for next 20 years. Source BP.com
+ 5.4 % Growth in coal consumption
Festest among fossil fuels
- 4.3 % Decline in global nuclear output,
The largest on record
2.1% Share of renewables in global
Energy consumptioin.
European Biomass Industry Association
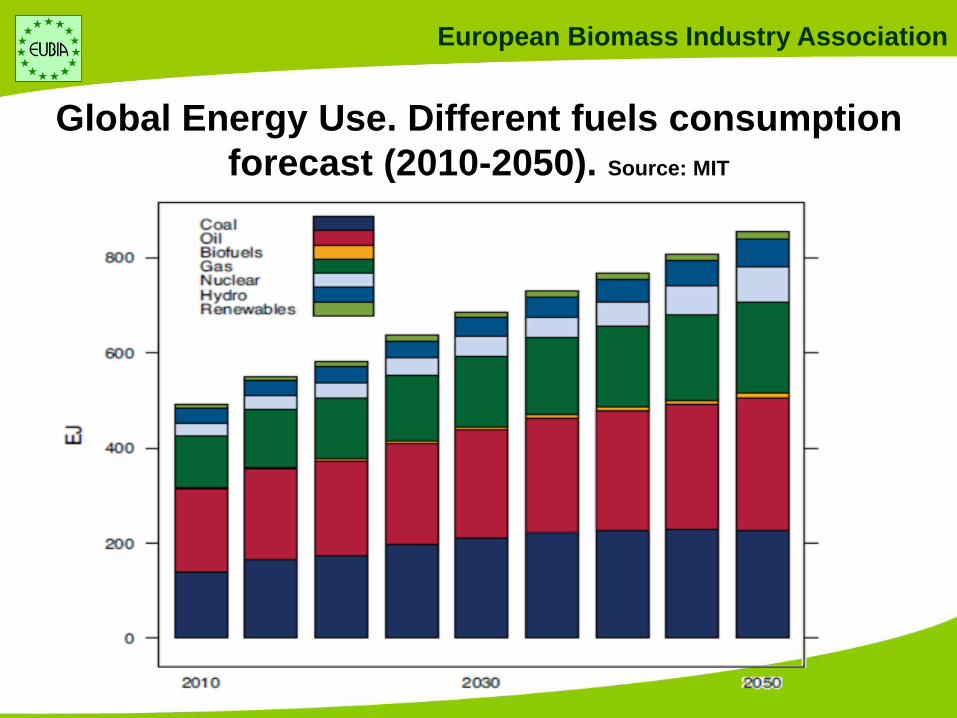
Global Energy Use. Different fuels consumption
forecast (2010-2050). Source: MIT

European Biomass Industry Association
Energy consumption in different world areas from
year 2010 to 2050
European Biomass Industry Association
Renewable biomass
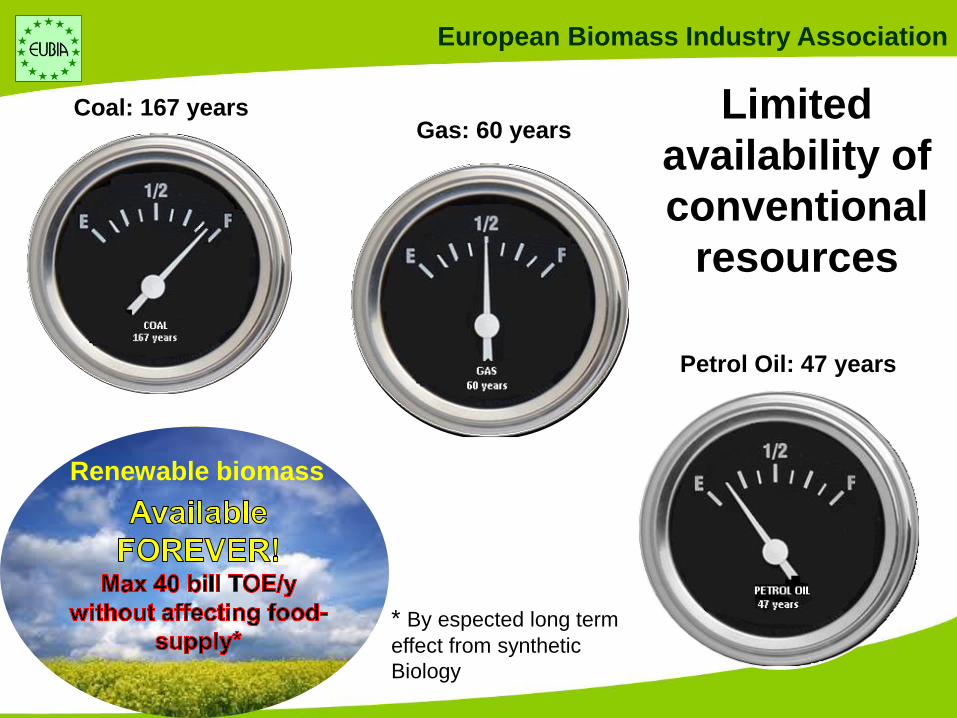
Limited
availability of
conventional
resources
Petrol Oil: 47 years
Gas: 60 years Coal: 167 years
* By espected long term
effect from synthetic
Biology
European Biomass Industry Association
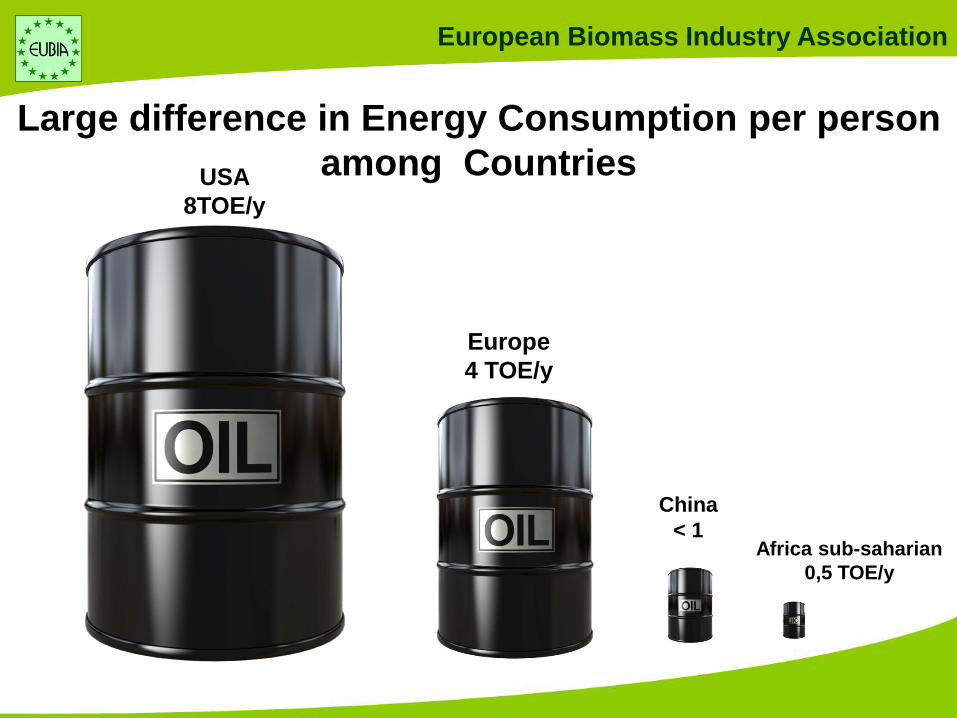
USA
8TOE/y
Europe
4 TOE/y
China
< 1 Africa sub-saharian
0,5 TOE/y
Large difference in Energy Consumption per person
among Countries
European Biomass Industry Association
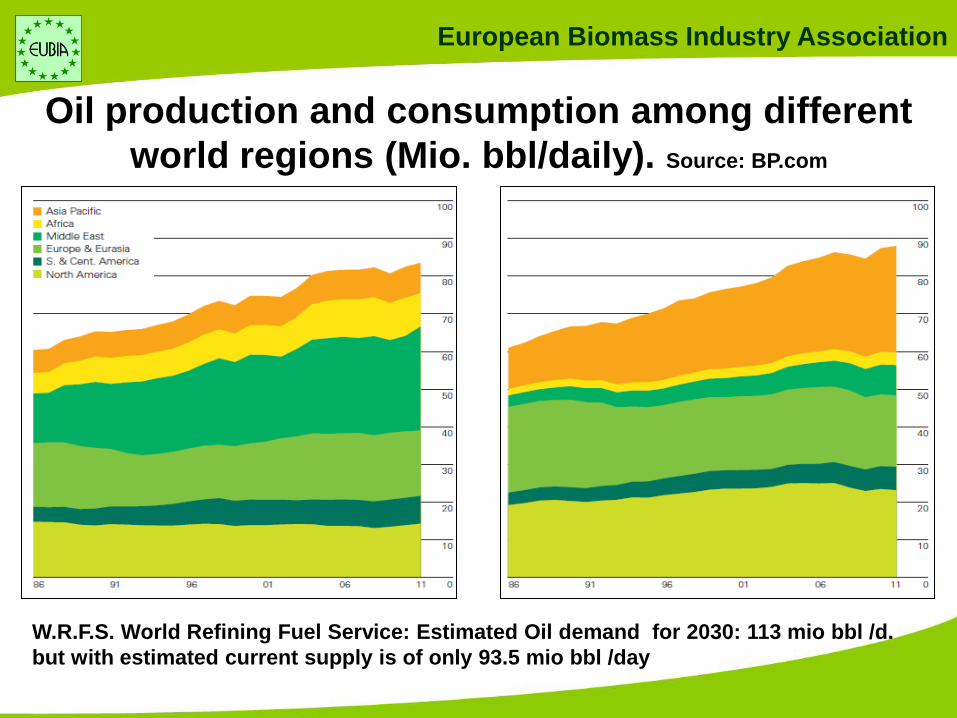
Oil production and consumption among different
world regions (Mio. bbl/daily). Source: BP.com
W.R.F.S. World Refining Fuel Service: Estimated Oil demand for 2030: 113 mio bbl /d.
but with estimated current supply is of only 93.5 mio bbl /day
European Biomass Industry Association
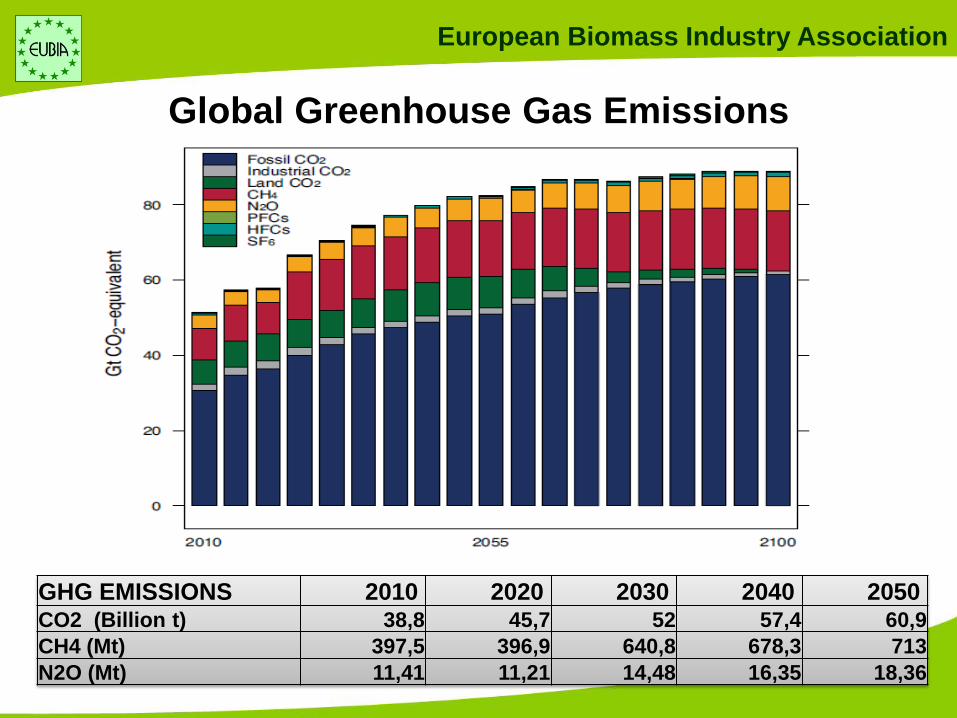
GHG EMISSIONS 2010 2020 2030 2040 2050 CO2 (Billion t) 38,8 45,7 52 57,4 60,9
CH4 (Mt) 397,5 396,9 640,8 678,3 713
N2O (Mt) 11,41 11,21 14,48 16,35 18,36
Global Greenhouse Gas Emissions
European Biomass Industry Association
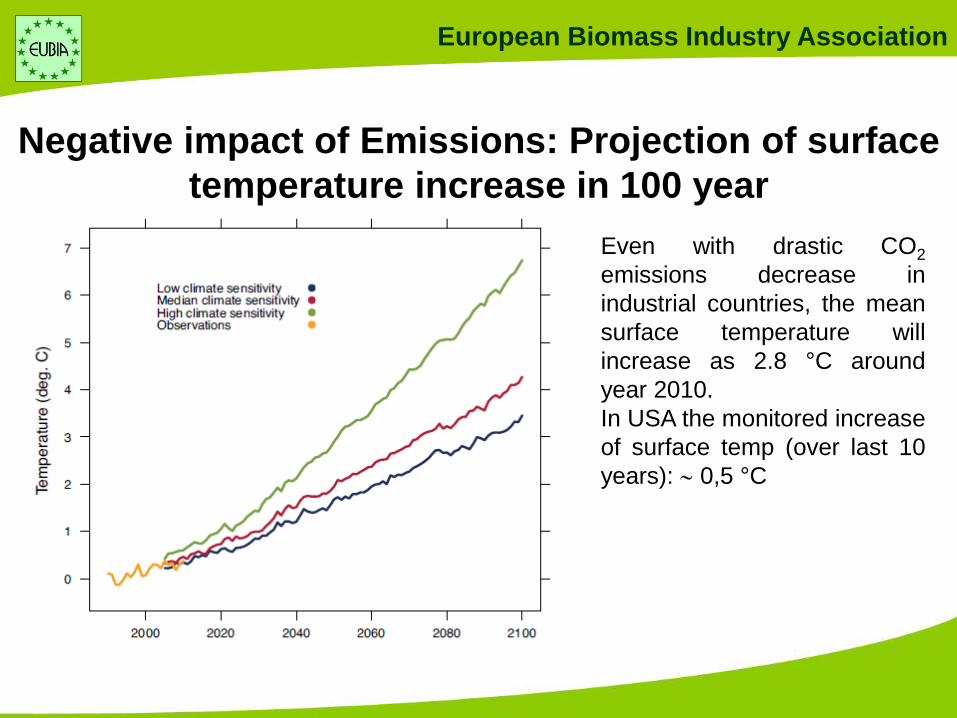
Negative impact of Emissions: Projection of surface
temperature increase in 100 year
Even with drastic CO2
emissions decrease in
industrial countries, the mean
surface temperature will
increase as 2.8 °C around
year 2010.
In USA the monitored increase
of surface temp (over last 10
years): 0,5 °C
European Biomass Industry Association
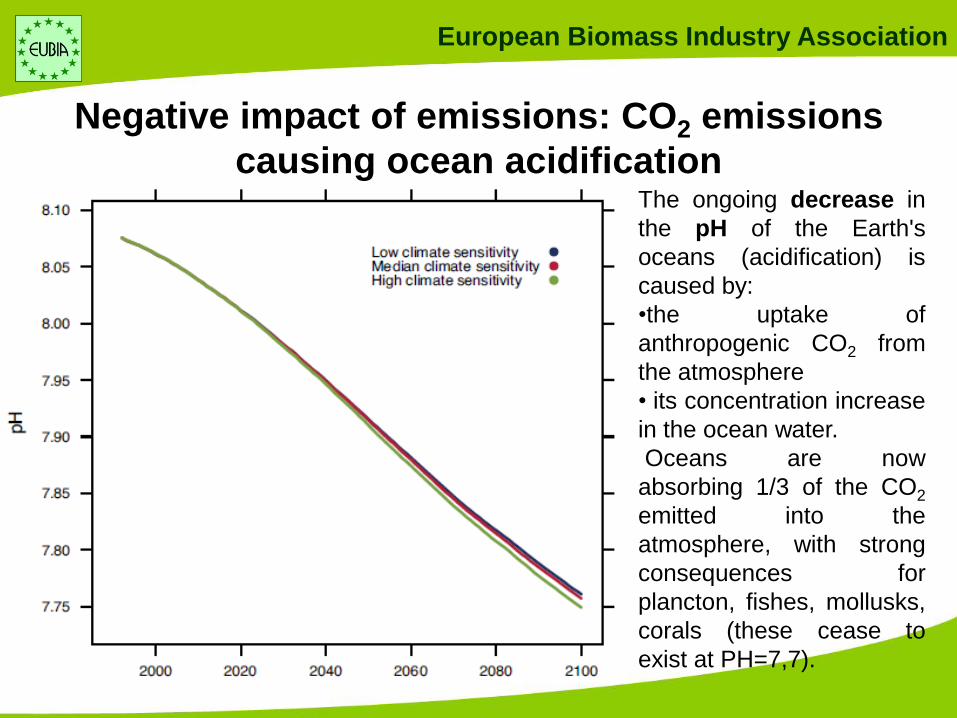
Negative impact of emissions: CO2 emissions
causing ocean acidification The ongoing decrease in
the pH of the Earth's
oceans (acidification) is
caused by:
•the uptake of
anthropogenic CO2 from
the atmosphere
• its concentration increase
in the ocean water.
Oceans are now
absorbing 1/3 of the CO2
emitted into the
atmosphere, with strong
consequences for
plancton, fishes, mollusks,
corals (these cease to
exist at PH=7,7).
European Biomass Industry Association
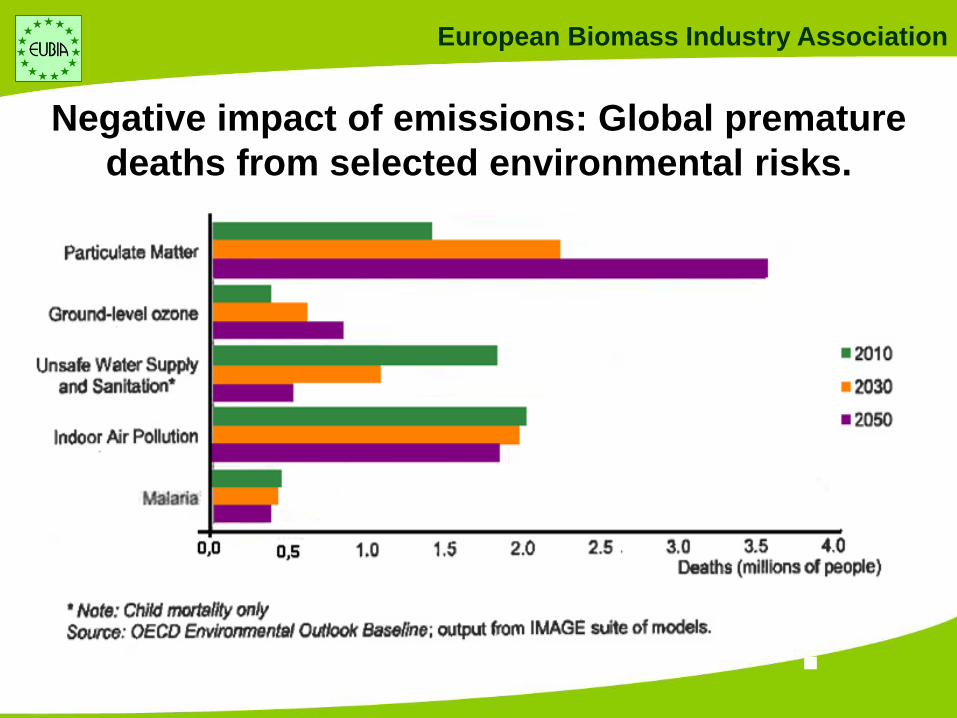
Negative impact of emissions: Global premature
deaths from selected environmental risks.
European Biomass Industry Association
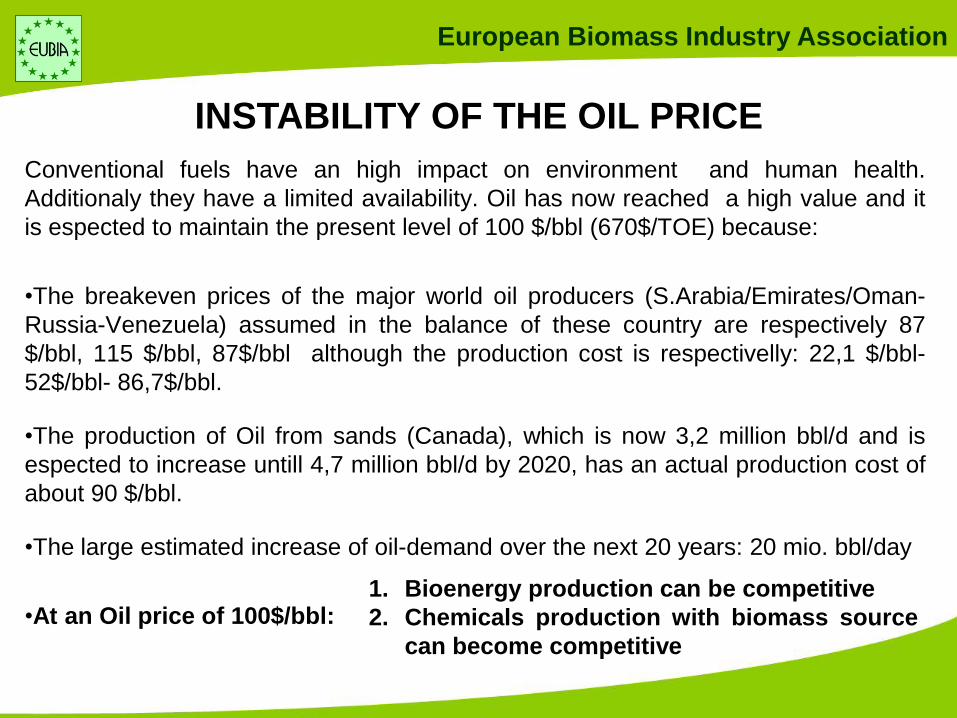
Conventional fuels have an high impact on environment and human health.
Additionaly they have a limited availability. Oil has now reached a high value and it
is espected to maintain the present level of 100 $/bbl (670$/TOE) because:
•The breakeven prices of the major world oil producers (S.Arabia/Emirates/Oman-
Russia-Venezuela) assumed in the balance of these country are respectively 87
$/bbl, 115 $/bbl, 87$/bbl although the production cost is respectivelly: 22,1 $/bbl-
52$/bbl- 86,7$/bbl.
•The production of Oil from sands (Canada), which is now 3,2 million bbl/d and is
espected to increase untill 4,7 million bbl/d by 2020, has an actual production cost of
about 90 $/bbl.
•The large estimated increase of oil-demand over the next 20 years: 20 mio. bbl/day
•At an Oil price of 100$/bbl: 1. Bioenergy production can be competitive
2. Chemicals production with biomass source
can become competitive
INSTABILITY OF THE OIL PRICE
European Biomass Industry Association
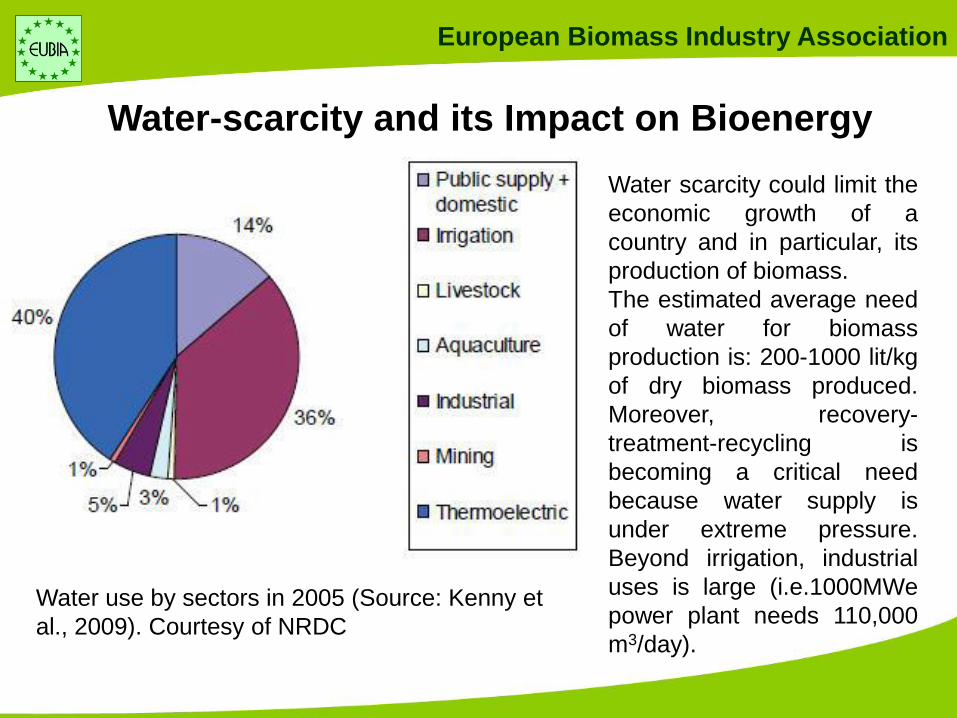
Water use by sectors in 2005 (Source: Kenny et
al., 2009). Courtesy of NRDC
Water scarcity could limit the
economic growth of a
country and in particular, its
production of biomass.
The estimated average need
of water for biomass
production is: 200-1000 lit/kg
of dry biomass produced.
Moreover, recovery-
treatment-recycling is
becoming a critical need
because water supply is
under extreme pressure.
Beyond irrigation, industrial
uses is large (i.e.1000MWe
power plant needs 110,000
m3/day).
Water-scarcity and its Impact on Bioenergy
European Biomass Industry Association
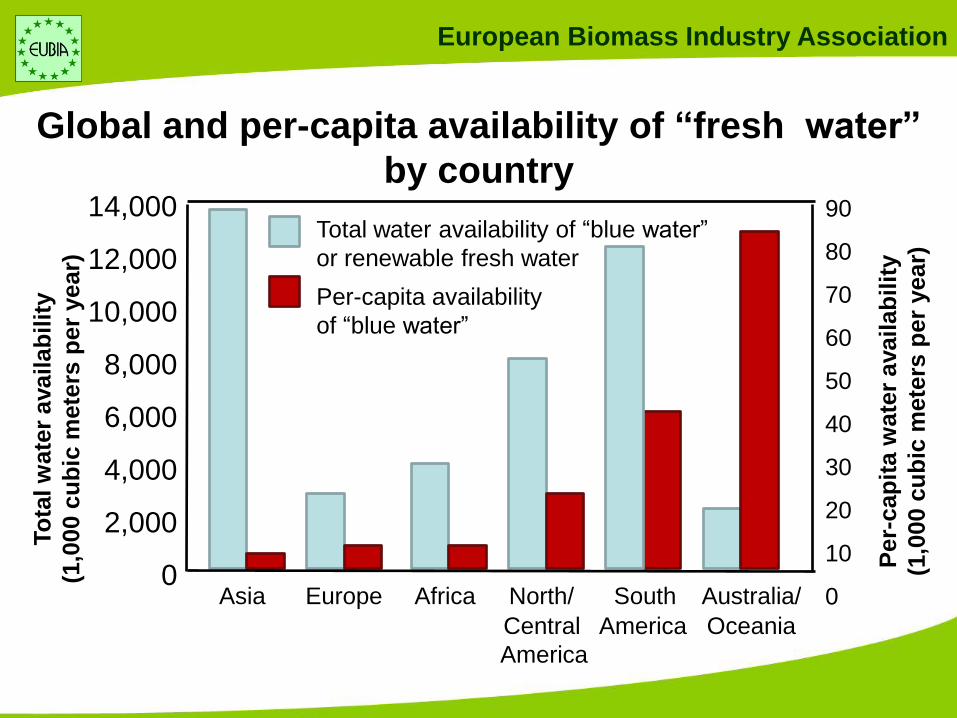
Global and per-capita availability of “fresh water”
by country 14,000
12,000
10,000
8,000
6,000
4,000
2,000
0
To
tal w
ate
r ava
ilab
ilit
y
(1,0
00 c
ub
ic m
ete
rs p
er
year)
Asia Europe Africa North/ South Australia/
Central America Oceania
America
90
80
70
60
50
40
30
20
10
0
Per-
cap
ita w
ate
r availab
ilit
y
(1,0
00 c
ub
ic m
ete
rs p
er
year)
Per-capita availability
of “blue water”
Total water availability of “blue water”
or renewable fresh water
European Biomass Industry Association
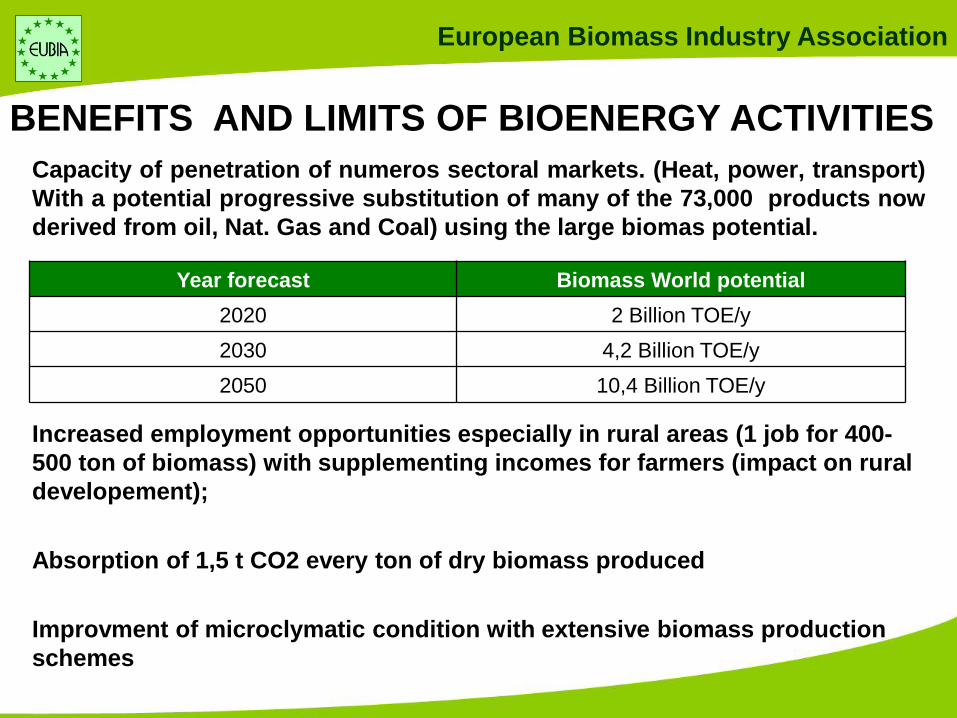
Capacity of penetration of numeros sectoral markets. (Heat, power, transport)
With a potential progressive substitution of many of the 73,000 products now
derived from oil, Nat. Gas and Coal) using the large biomas potential.
Increased employment opportunities especially in rural areas (1 job for 400-
500 ton of biomass) with supplementing incomes for farmers (impact on rural
developement);
Absorption of 1,5 t CO2 every ton of dry biomass produced
Improvment of microclymatic condition with extensive biomass production
schemes
BENEFITS AND LIMITS OF BIOENERGY ACTIVITIES
Year forecast Biomass World potential
2020 2 Billion TOE/y
2030 4,2 Billion TOE/y
2050 10,4 Billion TOE/y
European Biomass Industry Association
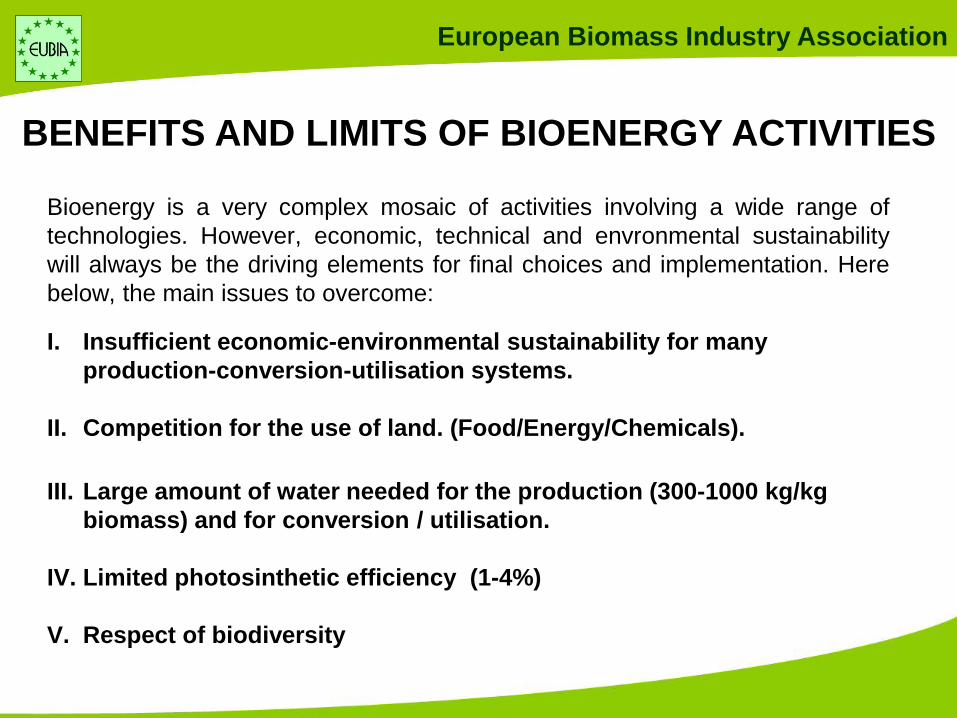
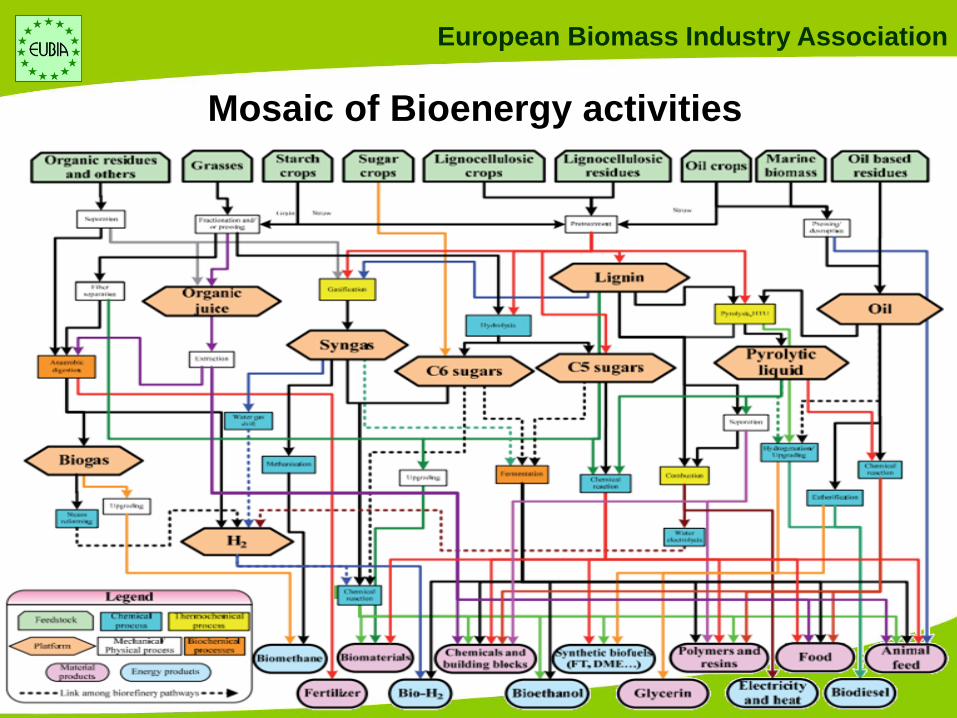
Bioenergy is a very complex mosaic of activities involving a wide range of
technologies. However, economic, technical and envronmental sustainability
will always be the driving elements for final choices and implementation. Here
below, the main issues to overcome:
I. Insufficient economic-environmental sustainability for many
production-conversion-utilisation systems.
II. Competition for the use of land. (Food/Energy/Chemicals).
III. Large amount of water needed for the production (300-1000 kg/kg
biomass) and for conversion / utilisation.
IV. Limited photosinthetic efficiency (1-4%)
V. Respect of biodiversity
BENEFITS AND LIMITS OF BIOENERGY ACTIVITIES
European Biomass Industry Association
Mosaic of Bioenergy activities
European Biomass Industry Association
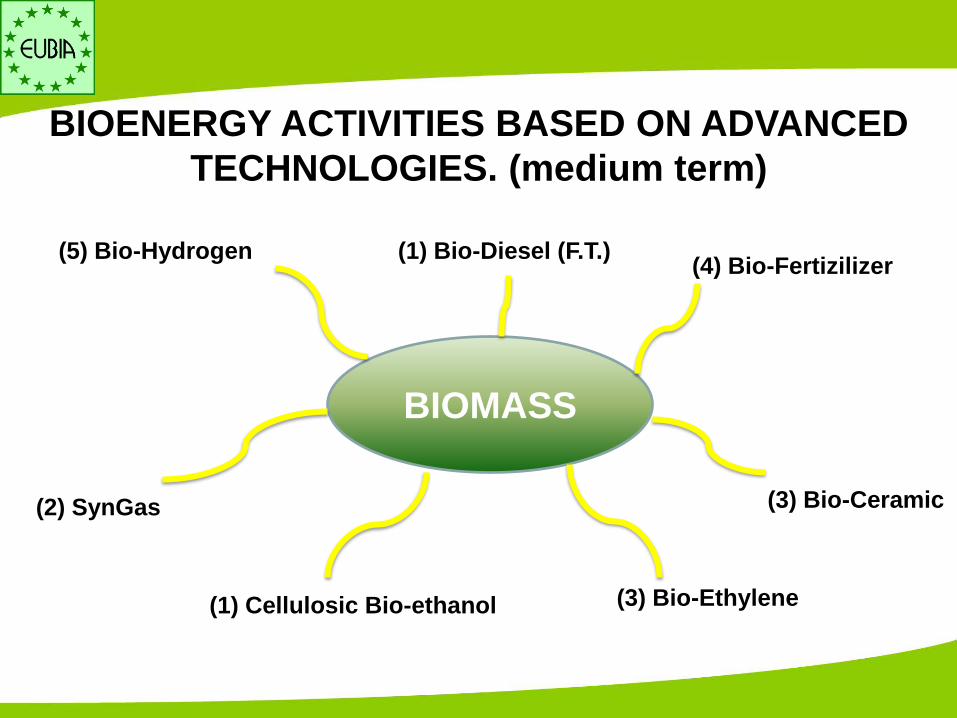
BIOENERGY ACTIVITIES BASED ON ADVANCED
TECHNOLOGIES. (medium term)
BIOMASS
(1) Cellulosic Bio-ethanol
(2) SynGas
(5) Bio-Hydrogen (1) Bio-Diesel (F.T.) (4) Bio-Fertizilizer
(3) Bio-Ceramic
(3) Bio-Ethylene

European Biomass Industry Association
SIGNIFICATIVE COMMERCIAL BIOENERGY
ACTIVITIES AT WORLD LEVEL
Bioethanol: 90 million/year
Biodiesel: 35 million m3/y vegetable oil
Bioelectricity: 400 TWhe /year (Total: 20,000 TWhe/y)
Heating with pellets: 15 million ton/y
Biogas production: 8,3 million TOE/y
Charcoal (p.i.g. iron production): 30 million m3/y
The total of this energy utilization represents only the 1.5% of the total present
world final energy consumption
European Biomass Industry Association
2,20%2,60%
1,90%
1,10%
3,20%
2,30%
0,00%
1,00%
2,00%
3,00%
4,00%
% Annual
Increase
Total primary
En.Consumption
Liquid fuels Nat.Gas
Coal Electricity Co2 Emission
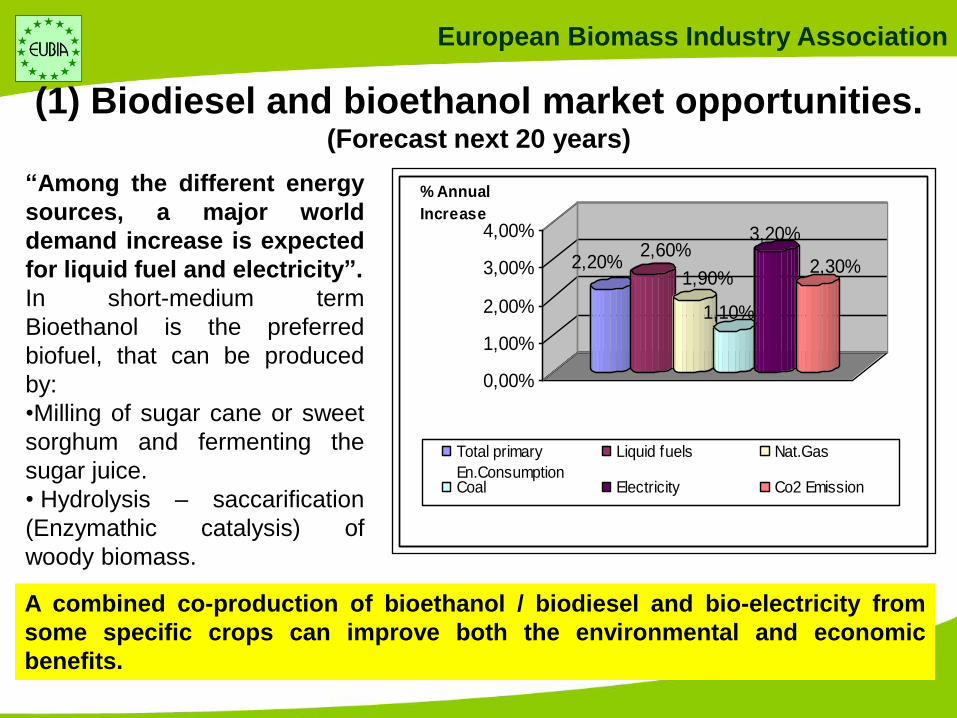
“Among the different energy
sources, a major world
demand increase is expected
for liquid fuel and electricity”.
In short-medium term
Bioethanol is the preferred
biofuel, that can be produced
by:
•Milling of sugar cane or sweet
sorghum and fermenting the
sugar juice.
• Hydrolysis – saccarification
(Enzymathic catalysis) of
woody biomass.
(1) Biodiesel and bioethanol market opportunities. (Forecast next 20 years)
A combined co-production of bioethanol / biodiesel and bio-electricity from
some specific crops can improve both the environmental and economic
benefits.
European Biomass Industry Association
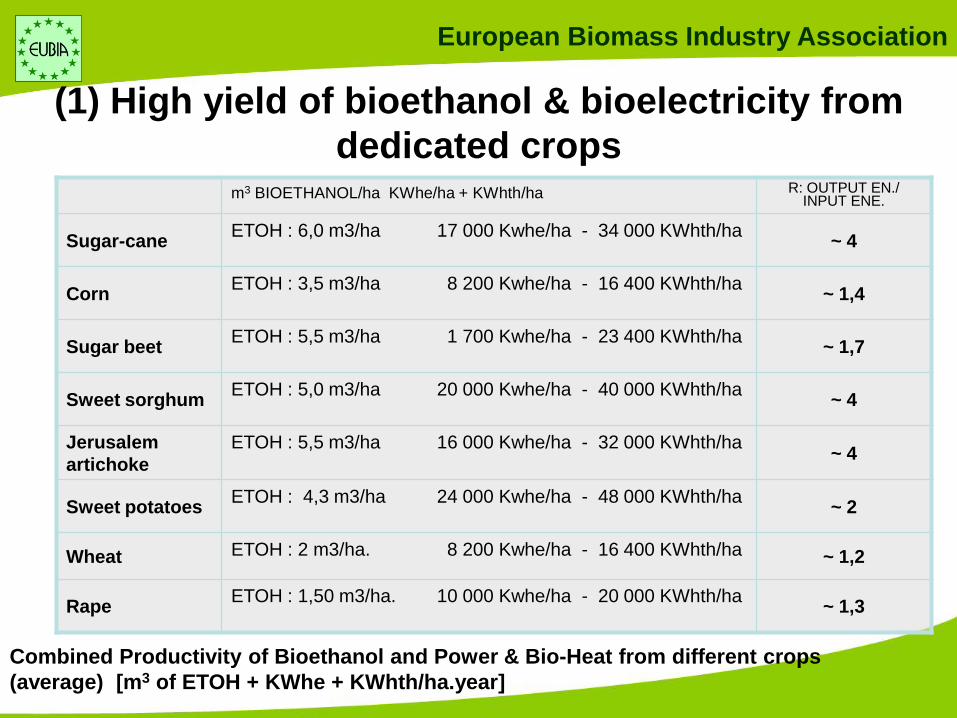
(1) High yield of bioethanol & bioelectricity from
dedicated crops
Combined Productivity of Bioethanol and Power & Bio-Heat from different crops
(average) [m3 of ETOH + KWhe + KWhth/ha.year]
m3 BIOETHANOL/ha KWhe/ha + KWhth/ha R: OUTPUT EN./ INPUT ENE.
Sugar-cane ETOH : 6,0 m3/ha 17 000 Kwhe/ha - 34 000 KWhth/ha
~ 4
Corn ETOH : 3,5 m3/ha 8 200 Kwhe/ha - 16 400 KWhth/ha
~ 1,4
Sugar beet ETOH : 5,5 m3/ha 1 700 Kwhe/ha - 23 400 KWhth/ha
~ 1,7
Sweet sorghum ETOH : 5,0 m3/ha 20 000 Kwhe/ha - 40 000 KWhth/ha
~ 4
Jerusalem
artichoke
ETOH : 5,5 m3/ha 16 000 Kwhe/ha - 32 000 KWhth/ha ~ 4
Sweet potatoes ETOH : 4,3 m3/ha 24 000 Kwhe/ha - 48 000 KWhth/ha
~ 2
Wheat ETOH : 2 m3/ha. 8 200 Kwhe/ha - 16 400 KWhth/ha ~ 1,2
Rape ETOH : 1,50 m3/ha. 10 000 Kwhe/ha - 20 000 KWhth/ha
~ 1,3
European Biomass Industry Association
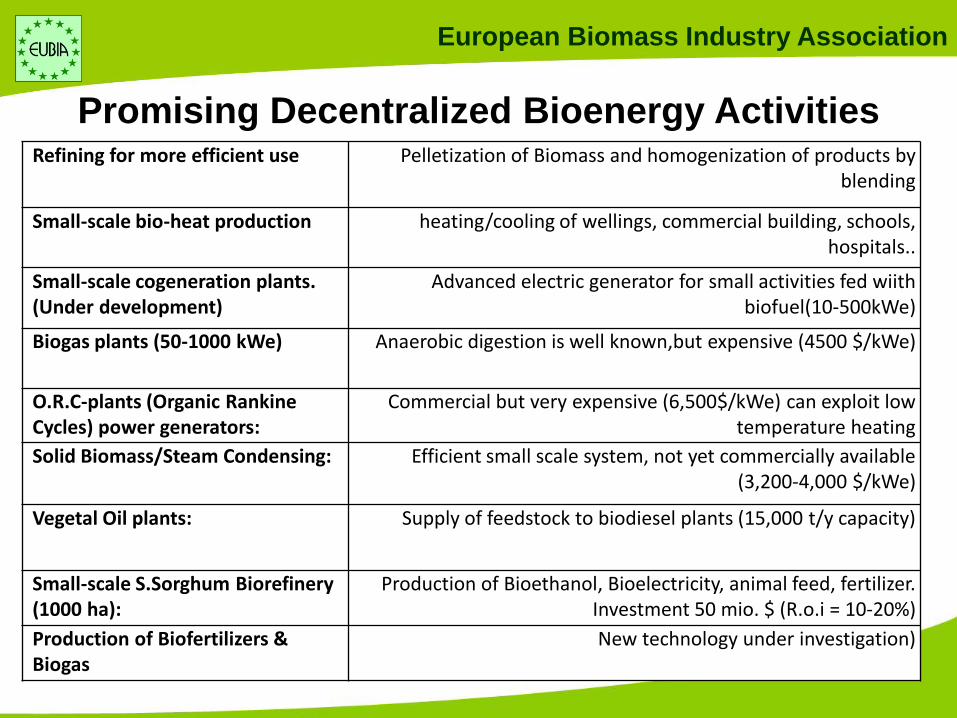
Promising Decentralized Bioenergy Activities Refining for more efficient use Pelletization of Biomass and homogenization of products by
blending
Small-scale bio-heat production heating/cooling of wellings, commercial building, schools, hospitals..
Small-scale cogeneration plants. (Under development)
Advanced electric generator for small activities fed wiith biofuel(10-500kWe)
Biogas plants (50-1000 kWe) Anaerobic digestion is well known,but expensive (4500 $/kWe)
O.R.C-plants (Organic Rankine Cycles) power generators:
Commercial but very expensive (6,500$/kWe) can exploit low temperature heating
Solid Biomass/Steam Condensing: Efficient small scale system, not yet commercially available (3,200-4,000 $/kWe)
Vegetal Oil plants: Supply of feedstock to biodiesel plants (15,000 t/y capacity)
Small-scale S.Sorghum Biorefinery (1000 ha):
Production of Bioethanol, Bioelectricity, animal feed, fertilizer. Investment 50 mio. $ (R.o.i = 10-20%)
Production of Biofertilizers & Biogas
New technology under investigation)
European Biomass Industry Association
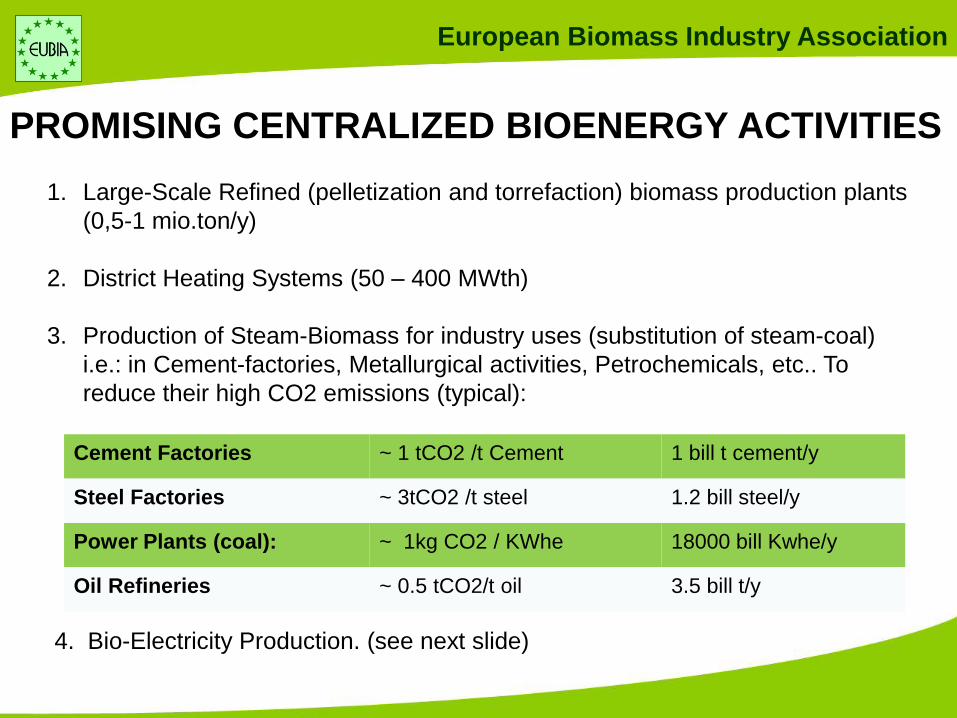
1. Large-Scale Refined (pelletization and torrefaction) biomass production plants
(0,5-1 mio.ton/y)
2. District Heating Systems (50 – 400 MWth)
3. Production of Steam-Biomass for industry uses (substitution of steam-coal)
i.e.: in Cement-factories, Metallurgical activities, Petrochemicals, etc.. To
reduce their high CO2 emissions (typical):
Cement Factories ~ 1 tCO2 /t Cement 1 bill t cement/y
Steel Factories ~ 3tCO2 /t steel 1.2 bill steel/y
Power Plants (coal): ~ 1kg CO2 / KWhe 18000 bill Kwhe/y
Oil Refineries ~ 0.5 tCO2/t oil 3.5 bill t/y
4. Bio-Electricity Production. (see next slide)
PROMISING CENTRALIZED BIOENERGY ACTIVITIES
European Biomass Industry Association
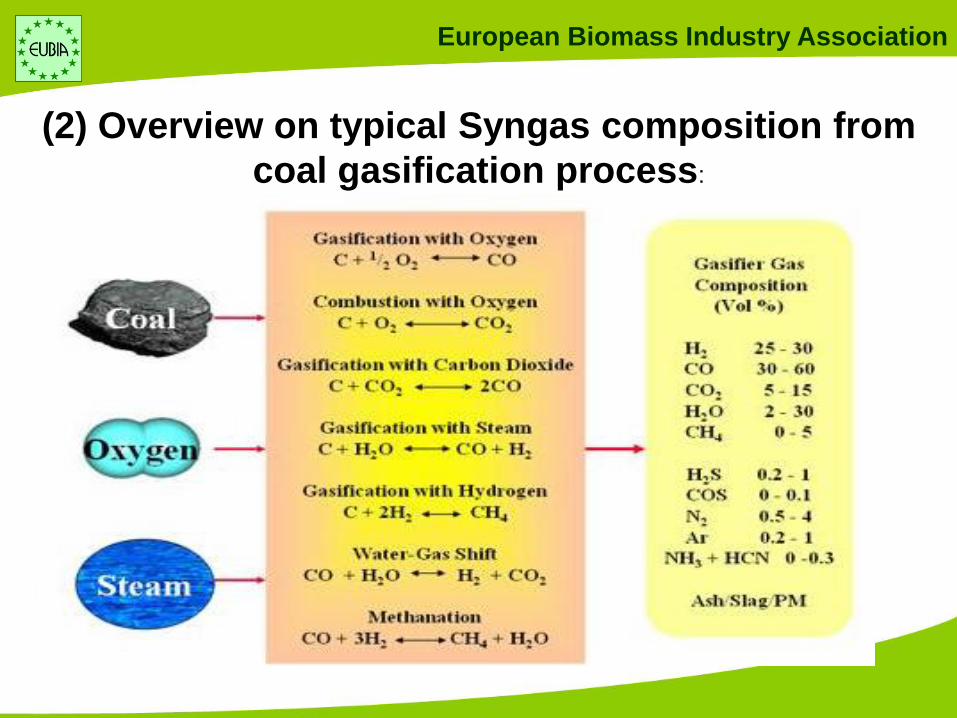
(2) Overview on typical Syngas composition from
coal gasification process:
European Biomass Industry Association
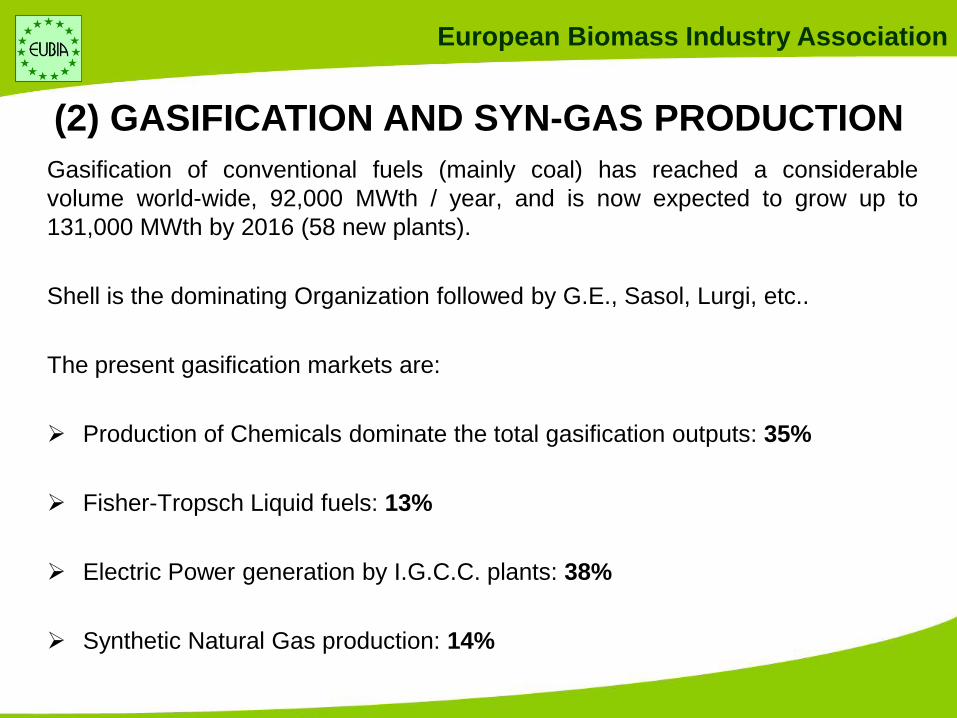
Gasification of conventional fuels (mainly coal) has reached a considerable
volume world-wide, 92,000 MWth / year, and is now expected to grow up to
131,000 MWth by 2016 (58 new plants).
Shell is the dominating Organization followed by G.E., Sasol, Lurgi, etc..
The present gasification markets are:
Production of Chemicals dominate the total gasification outputs: 35%
Fisher-Tropsch Liquid fuels: 13%
Electric Power generation by I.G.C.C. plants: 38%
Synthetic Natural Gas production: 14%
(2) GASIFICATION AND SYN-GAS PRODUCTION

European Biomass Industry Association
China: Dominates market. 29% of world capacity and 56 operating plants (coal)
North America: Capacity of 34,450 MWth (38% of world total). Largest planned
capacity increase (27 plants in 2016) utilising coal, natural gas, for the production of
chemicals, power, fertilizers(ammonia), synthetic Nat.Gas
Central-south America: 648 MWth syngas capacity (1%) in S. Domingo for
chemicals and gaseous fuel production
Asia-Australia: Syngas capacity of 20,810 MWth (23%)
Europe: 11,422 MWth of capacity (6%). 42 operating plants:
Africa/Middle East: 25,138 MWth Syngas capacity (36%)
• Shell has 18 gasification plants for 10,938 MWth
• Sasol produces Fisher Tropsch fuels & chemicals
(2) MAJOR WORLD SYNGAS PRODUCING
COUNTRIES:
5 petroleum
3 coal IGCC plants
25 chemicals (Nat. Gas)
9 Biomass/waste
European Biomass Industry Association
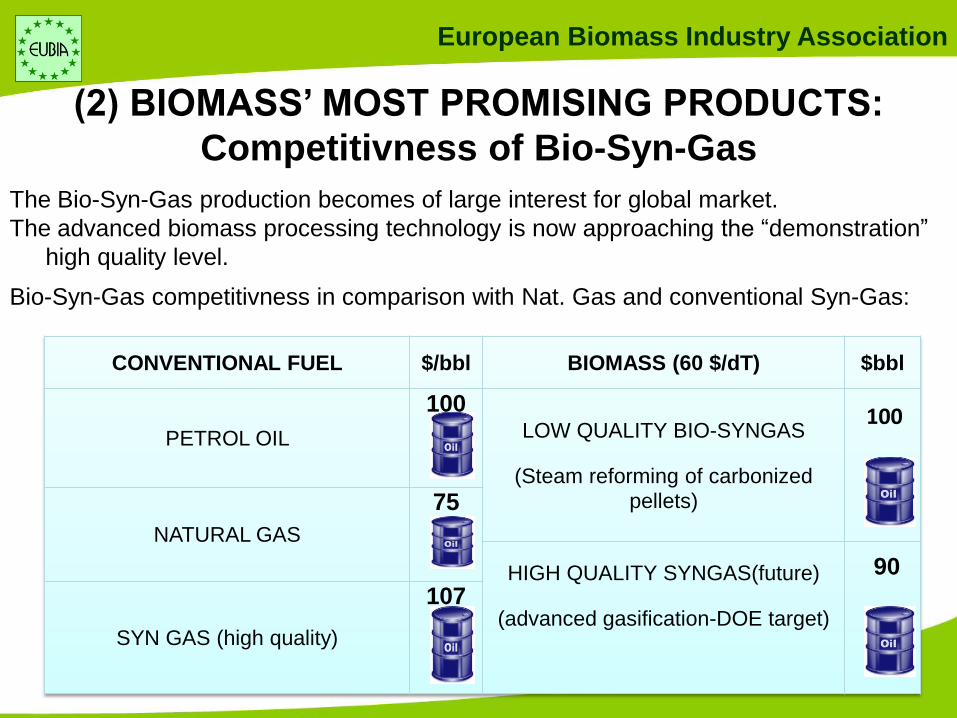
(2) BIOMASS’ MOST PROMISING PRODUCTS:
Competitivness of Bio-Syn-Gas
The Bio-Syn-Gas production becomes of large interest for global market.
The advanced biomass processing technology is now approaching the “demonstration”
high quality level.
Bio-Syn-Gas competitivness in comparison with Nat. Gas and conventional Syn-Gas:
CONVENTIONAL FUEL $/bbl BIOMASS (60 $/dT) $bbl
PETROL OIL
100 LOW QUALITY BIO-SYNGAS
(Steam reforming of carbonized
pellets)
NATURAL GAS
75
HIGH QUALITY SYNGAS(future)
(advanced gasification-DOE target)
SYN GAS (high quality)
107 90
100

European Biomass Industry Association
(2) BIOMASS GASIFICATION AND BIO-SYN-GAS
PRODUCTION Gasification of biomass is of great future interest for the production of:
1. Green-power (combustion for steam and gas turbines combined cycles))
2. Bio-chemicals (cathalytic craking, producing Ethane, Ethylene, etc..)
3. Biofuels (transportation)
4. Sythetic Gas (Reforming, other energetic processes )
5. H2 (Petrochemical process, energy markets..)
Gasification of solid biomass is more difficult than gasification of
conventional fuels (coal).
The progress of technology has still not reached the commercial level, but
thanks to its numerous potential markets, bio-synthetic-gas could become
one of the most promising 1° conversion bio-product bio-economy
activities for the future
European Biomass Industry Association
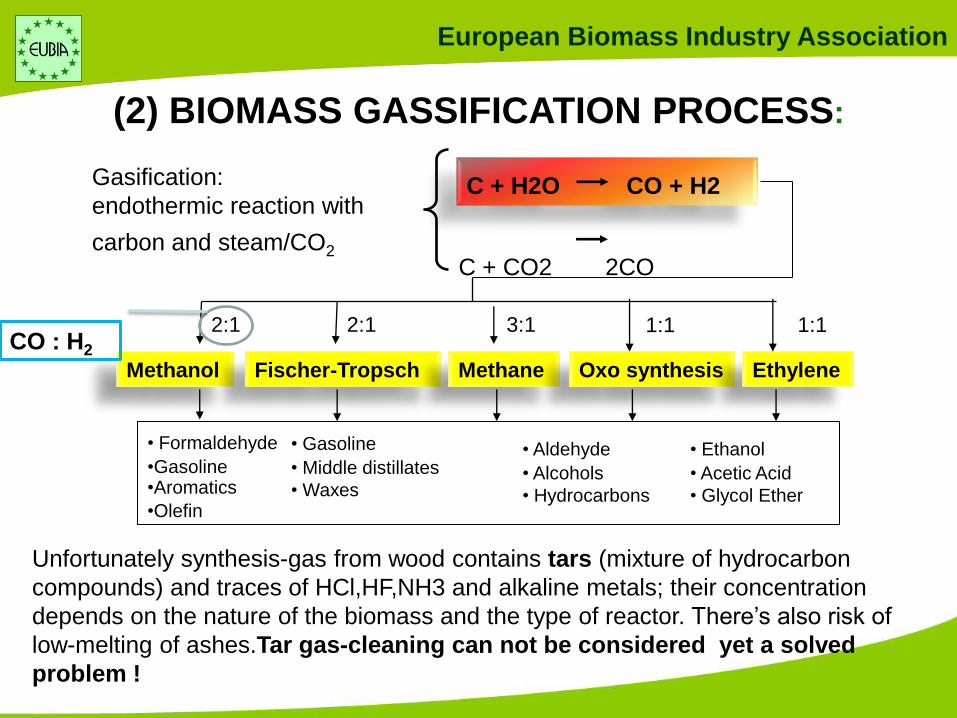
(2) BIOMASS GASSIFICATION PROCESS:
Gasification:
endothermic reaction with
carbon and steam/CO2
C + H2O CO + H2
C + CO2 2CO
Unfortunately synthesis-gas from wood contains tars (mixture of hydrocarbon
compounds) and traces of HCl,HF,NH3 and alkaline metals; their concentration
depends on the nature of the biomass and the type of reactor. There’s also risk of
low-melting of ashes.Tar gas-cleaning can not be considered yet a solved
problem !
Methanol Fischer-Tropsch Methane Oxo synthesis Ethylene
2:1 2:1 3:1 1:1
• Formaldehyde
•Gasoline •Aromatics
•Olefin
• Gasoline
• Middle distillates
• Waxes
• Aldehyde
• Alcohols
• Hydrocarbons
• Ethanol
• Acetic Acid
• Glycol Ether
1:1 CO : H2
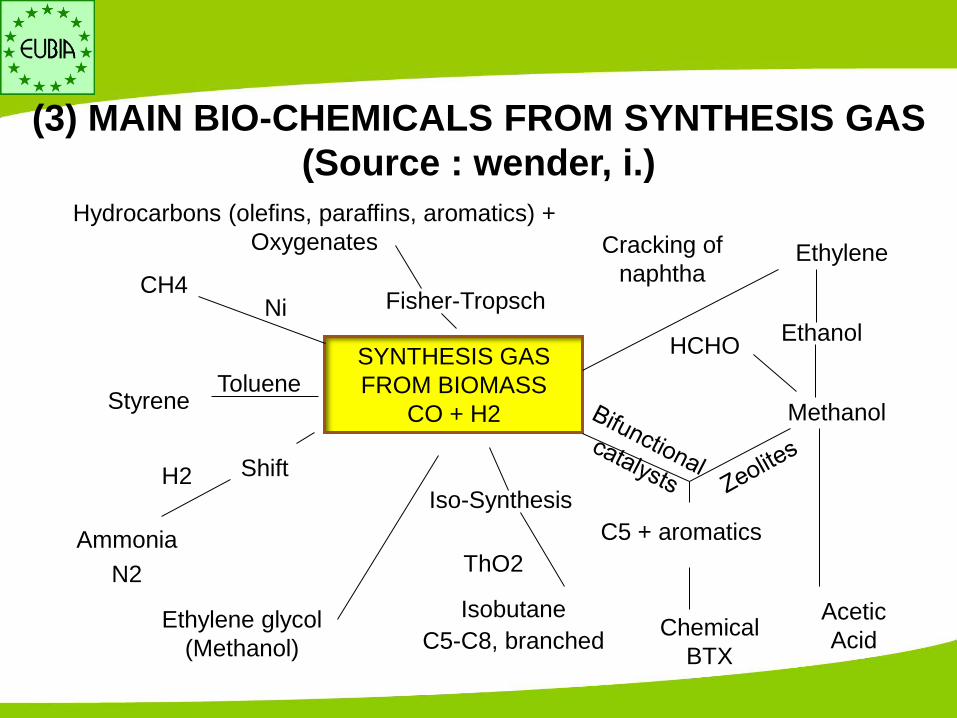
European Biomass Industry Association
SYNTHESIS GAS
FROM BIOMASS
CO + H2
CH4 Ni
Styrene Toluene
Ammonia
N2
Shift H2
Fisher-Tropsch
Hydrocarbons (olefins, paraffins, aromatics) +
Oxygenates Cracking of
naphtha Ethylene
Ethanol
Methanol
HCHO
Acetic
Acid
C5 + aromatics
Chemical
BTX
Iso-Synthesis
ThO2
Isobutane
C5-C8, branched Ethylene glycol
(Methanol)
(3) MAIN BIO-CHEMICALS FROM SYNTHESIS GAS
(Source : wender, i.)
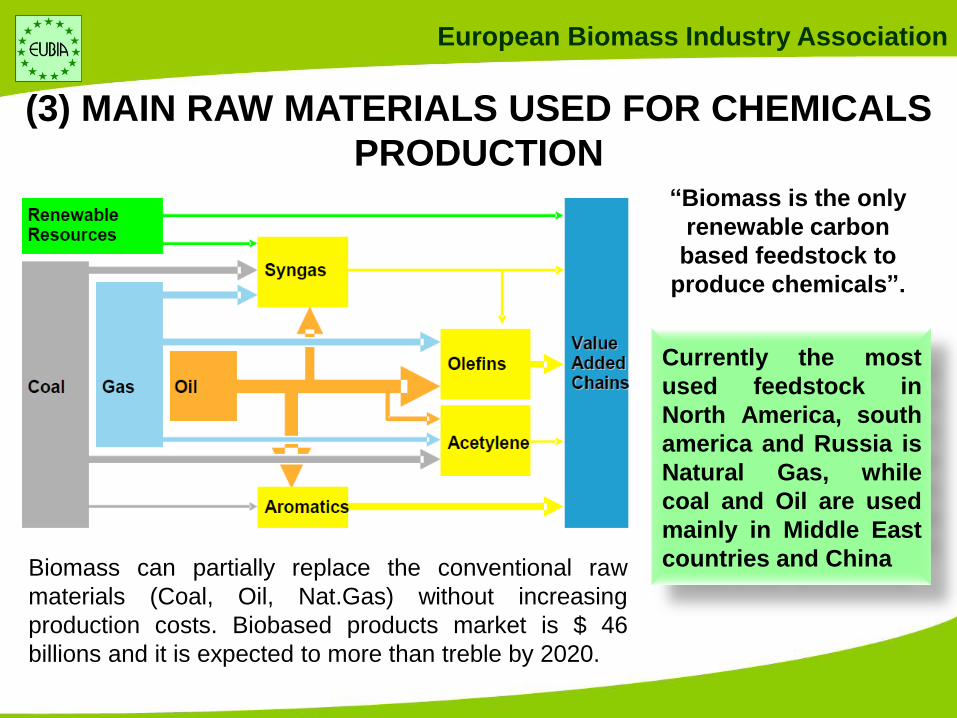
European Biomass Industry Association
Currently the most
used feedstock in
North America, south
america and Russia is
Natural Gas, while
coal and Oil are used
mainly in Middle East
countries and China
“Biomass is the only
renewable carbon
based feedstock to
produce chemicals”.
(3) MAIN RAW MATERIALS USED FOR CHEMICALS
PRODUCTION
Biomass can partially replace the conventional raw
materials (Coal, Oil, Nat.Gas) without increasing
production costs. Biobased products market is $ 46
billions and it is expected to more than treble by 2020.
European Biomass Industry Association
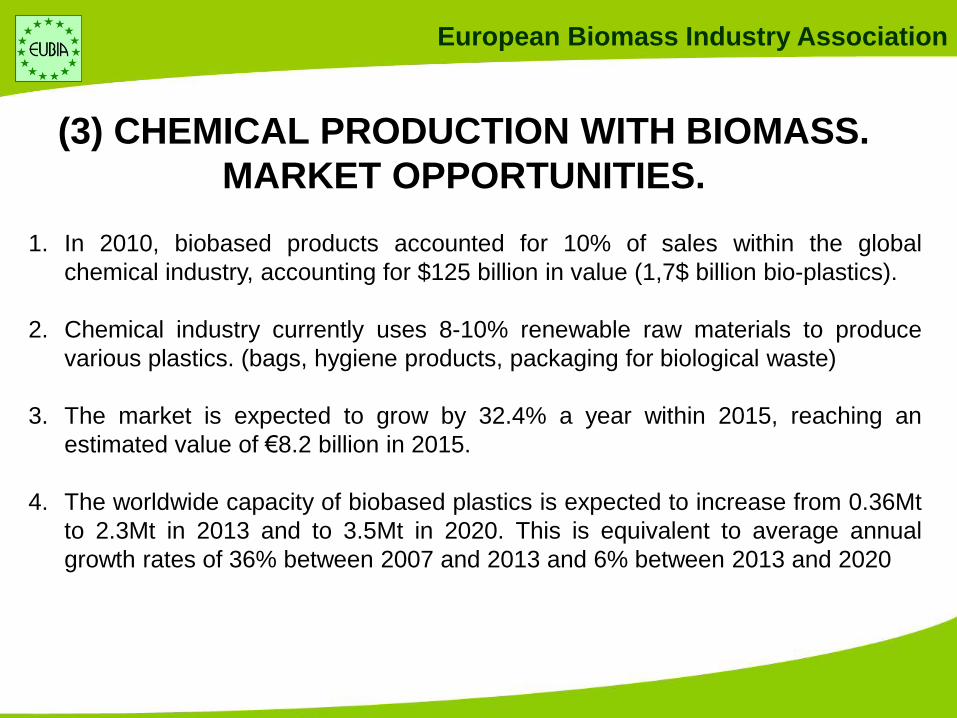
(3) CHEMICAL PRODUCTION WITH BIOMASS.
MARKET OPPORTUNITIES.
1. In 2010, biobased products accounted for 10% of sales within the global
chemical industry, accounting for $125 billion in value (1,7$ billion bio-plastics).
2. Chemical industry currently uses 8-10% renewable raw materials to produce
various plastics. (bags, hygiene products, packaging for biological waste)
3. The market is expected to grow by 32.4% a year within 2015, reaching an
estimated value of €8.2 billion in 2015.
4. The worldwide capacity of biobased plastics is expected to increase from 0.36Mt
to 2.3Mt in 2013 and to 3.5Mt in 2020. This is equivalent to average annual
growth rates of 36% between 2007 and 2013 and 6% between 2013 and 2020

European Biomass Industry Association
(4) BIOMASS FOR SUSTAINABLE BIO-FERTILIZER
PRODUCTION
Currently the most used artificial fertilizers are UREA and AMMONIA. These
fertilizers are now mainly produced with Natural Gas refining system:
• High energy consumption
• High emissions
The present fertilizer price is nearly 500$/ton. But this price is going to
grow hard in the next 20 years, reaching probably the 1,500 -2000 $/ton
Thanks to the advanced present technologies, (Anaerobic Digestion, Thermophilic
digestion) biomass can be now treated to produce gas and biofertilizers.
The next years development is aimed at producing high value and
environmental sustainable bio-fertilizers with competitive market price
European Biomass Industry Association
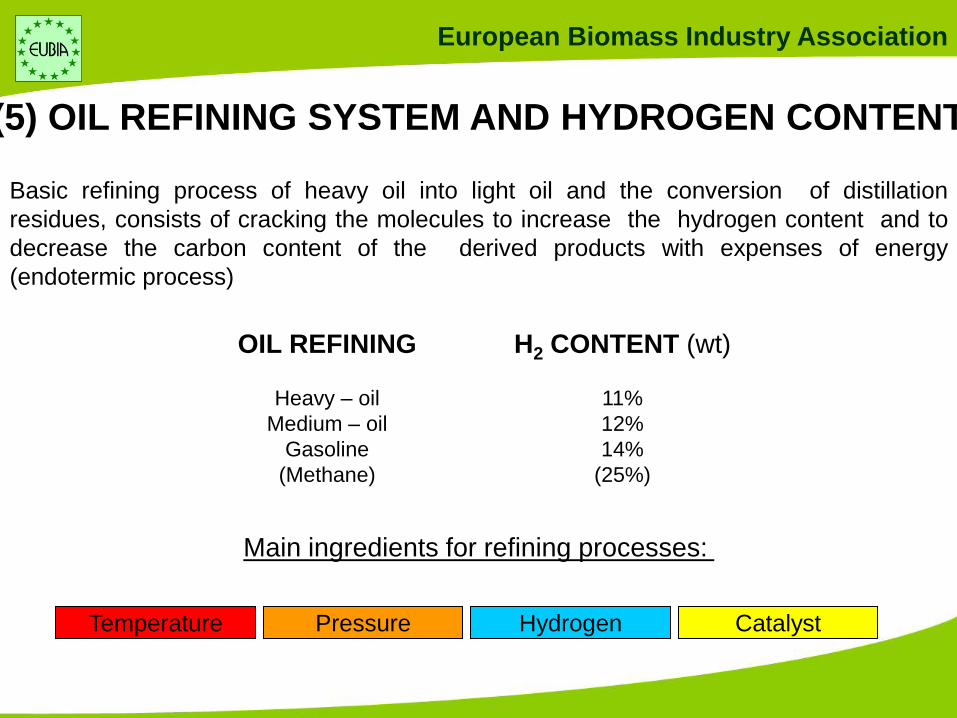
(5) OIL REFINING SYSTEM AND HYDROGEN CONTENT
Basic refining process of heavy oil into light oil and the conversion of distillation
residues, consists of cracking the molecules to increase the hydrogen content and to
decrease the carbon content of the derived products with expenses of energy
(endotermic process)
OIL REFINING
Heavy – oil
Medium – oil
Gasoline
(Methane)
H2 CONTENT (wt)
11%
12%
14%
(25%)
Main ingredients for refining processes:
Temperature Pressure Hydrogen Catalyst
European Biomass Industry Association
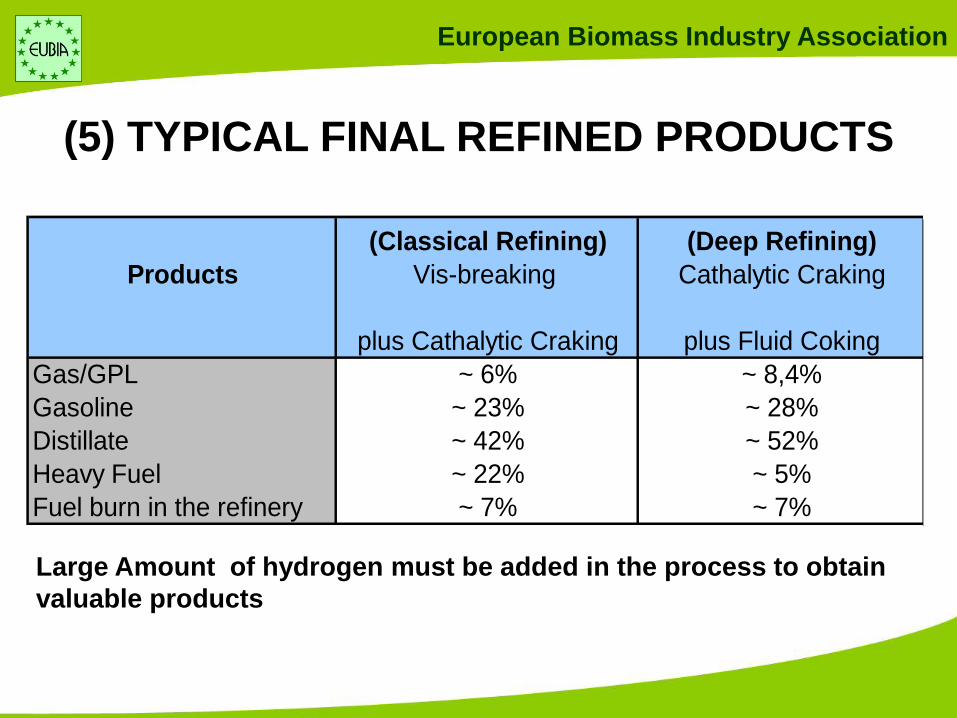
Large Amount of hydrogen must be added in the process to obtain
valuable products
(5) TYPICAL FINAL REFINED PRODUCTS
(Classical Refining) (Deep Refining)
Products Vis-breaking Cathalytic Craking
plus Cathalytic Craking plus Fluid Coking
Gas/GPL ~ 6% ~ 8,4%
Gasoline ~ 23% ~ 28%
Distillate ~ 42% ~ 52%
Heavy Fuel ~ 22% ~ 5%
Fuel burn in the refinery ~ 7% ~ 7%
European Biomass Industry Association
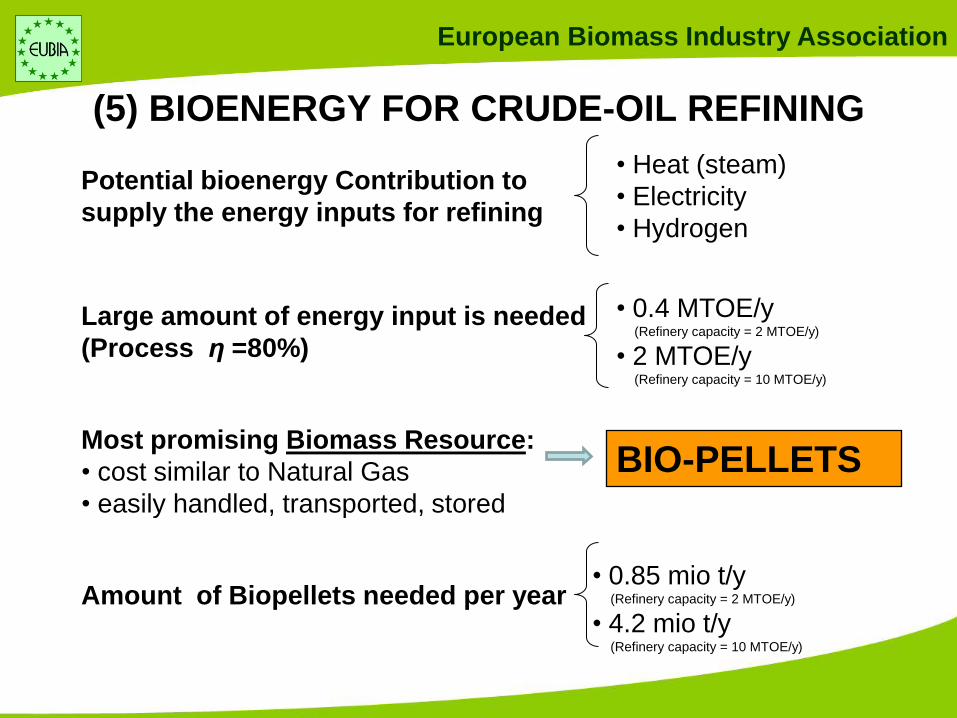
(5) BIOENERGY FOR CRUDE-OIL REFINING
Potential bioenergy Contribution to
supply the energy inputs for refining
Large amount of energy input is needed
(Process η =80%)
Most promising Biomass Resource:
• cost similar to Natural Gas
• easily handled, transported, stored
Amount of Biopellets needed per year
• Heat (steam)
• Electricity
• Hydrogen
• 0.4 MTOE/y (Refinery capacity = 2 MTOE/y)
• 2 MTOE/y (Refinery capacity = 10 MTOE/y)
• 0.85 mio t/y (Refinery capacity = 2 MTOE/y)
• 4.2 mio t/y (Refinery capacity = 10 MTOE/y)
BIO-PELLETS
European Biomass Industry Association
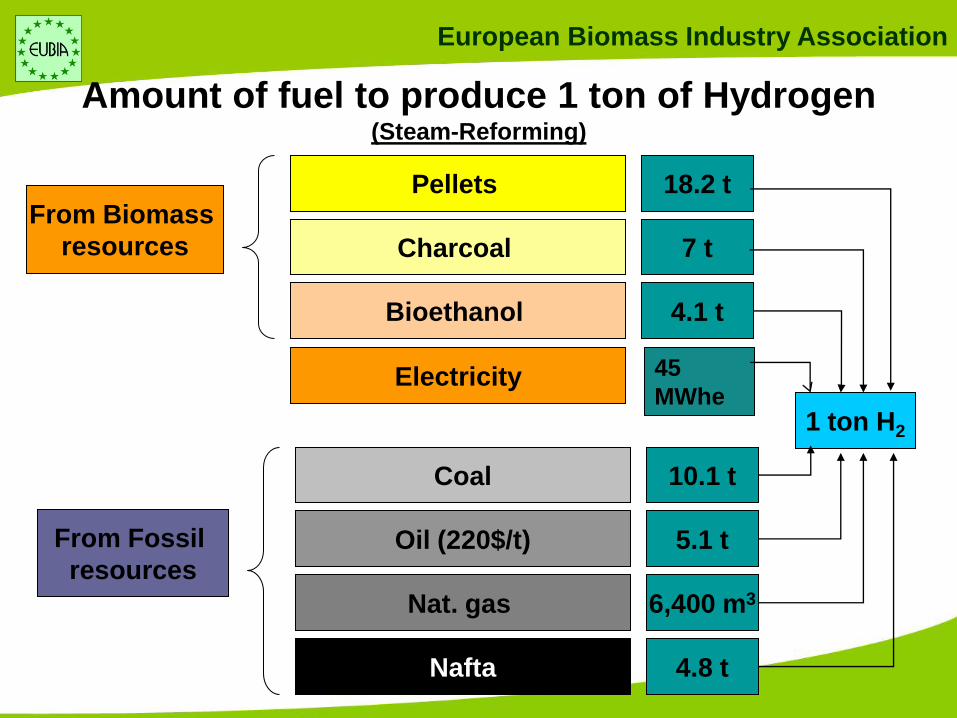
Amount of fuel to produce 1 ton of Hydrogen (Steam-Reforming)
Pellets
Charcoal
Bioethanol
Coal
Oil (220$/t)
Nat. gas
Nafta
From Biomass
resources
From Fossil
resources
18.2 t
7 t
4.1 t
10.1 t
5.1 t
6,400 m3
4.8 t
1 ton H2
Electricity 45
MWhe
European Biomass Industry Association
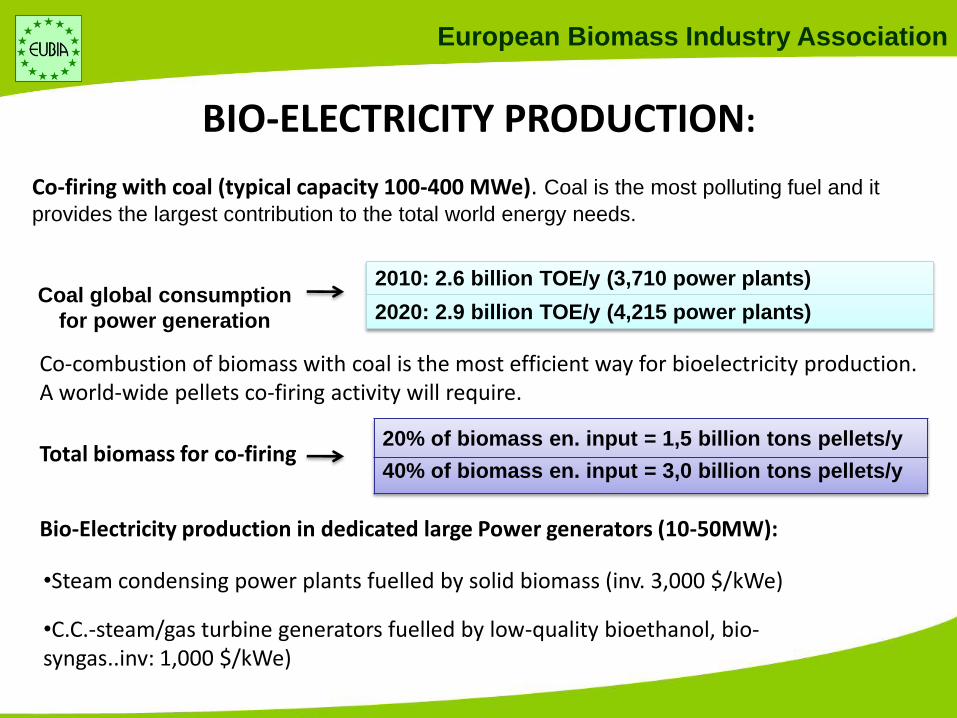
BIO-ELECTRICITY PRODUCTION: Co-firing with coal (typical capacity 100-400 MWe). Coal is the most polluting fuel and it
provides the largest contribution to the total world energy needs.
20% of biomass en. input = 1,5 billion tons pellets/y
40% of biomass en. input = 3,0 billion tons pellets/y
2010: 2.6 billion TOE/y (3,710 power plants)
2020: 2.9 billion TOE/y (4,215 power plants)
Co-combustion of biomass with coal is the most efficient way for bioelectricity production. A world-wide pellets co-firing activity will require.
Bio-Electricity production in dedicated large Power generators (10-50MW):
•Steam condensing power plants fuelled by solid biomass (inv. 3,000 $/kWe)
•C.C.-steam/gas turbine generators fuelled by low-quality bioethanol, bio-syngas..inv: 1,000 $/kWe)
Coal global consumption
for power generation
Total biomass for co-firing
European Biomass Industry Association
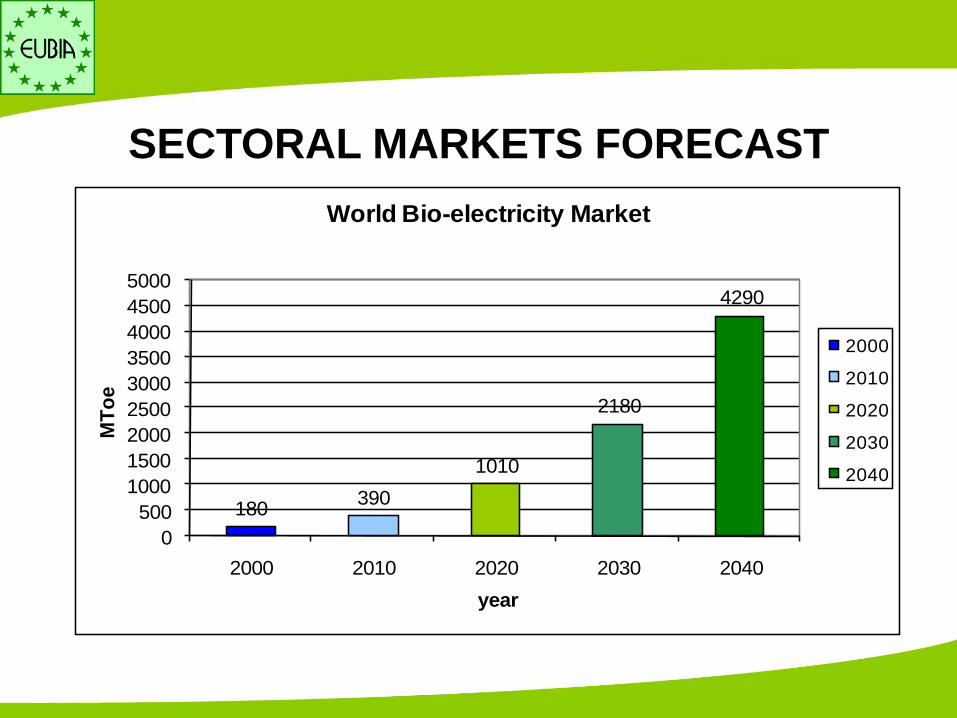
180390
1010
2180
4290
0
500
1000
1500
2000
2500
3000
3500
4000
4500
5000
2000 2010 2020 2030 2040
MT
oe
year
World Bio-electricity Market
2000
2010
2020
2030
2040
SECTORAL MARKETS FORECAST
European Biomass Industry Association
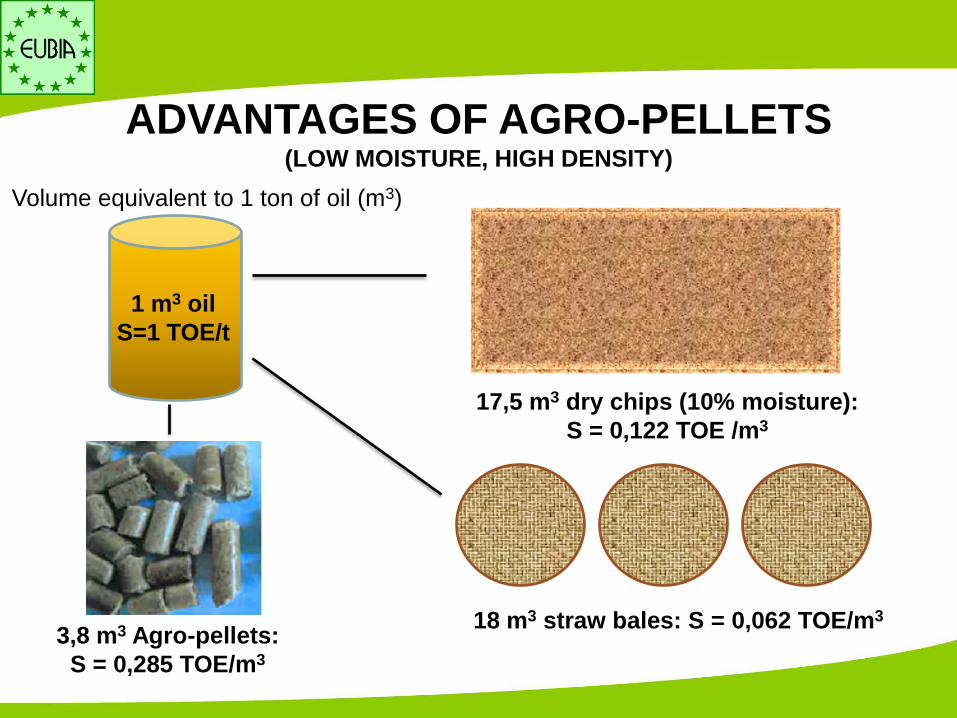
ADVANTAGES OF AGRO-PELLETS (LOW MOISTURE, HIGH DENSITY)
1 m3 oil
S=1 TOE/t
Volume equivalent to 1 ton of oil (m3)
17,5 m3 dry chips (10% moisture):
S = 0,122 TOE /m3
3,8 m3 Agro-pellets:
S = 0,285 TOE/m3
18 m3 straw bales: S = 0,062 TOE/m3
European Biomass Industry Association
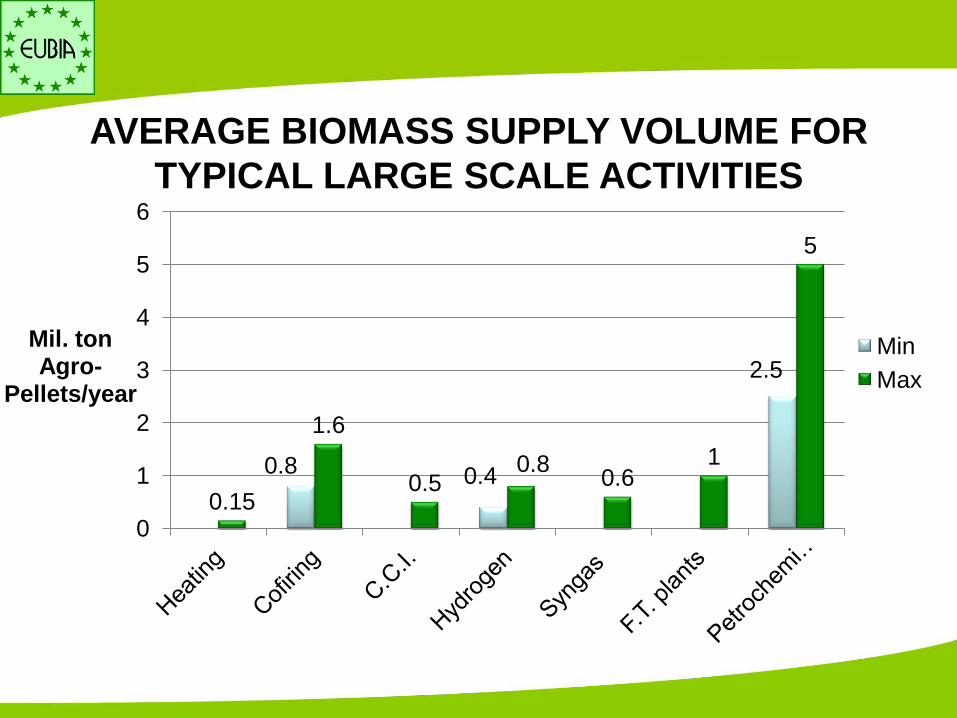
0.8 0.4
2.5
0.15
1.6
0.5 0.8
0.6 1
5
0
1
2
3
4
5
6
Mil. ton Agro-
Pellets/year
Min
Max
AVERAGE BIOMASS SUPPLY VOLUME FOR
TYPICAL LARGE SCALE ACTIVITIES
European Biomass Industry Association
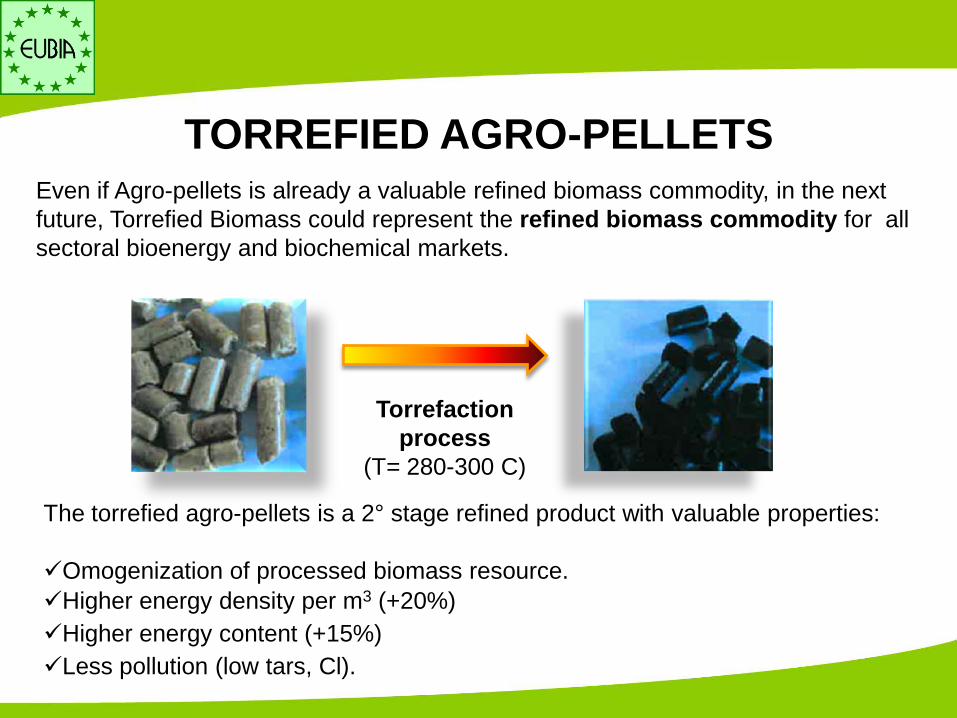
TORREFIED AGRO-PELLETS Even if Agro-pellets is already a valuable refined biomass commodity, in the next
future, Torrefied Biomass could represent the refined biomass commodity for all
sectoral bioenergy and biochemical markets.
Torrefaction
process
(T= 280-300 C)
The torrefied agro-pellets is a 2° stage refined product with valuable properties:
Omogenization of processed biomass resource.
Higher energy density per m3 (+20%)
Higher energy content (+15%)
Less pollution (low tars, Cl).
European Biomass Industry Association
“Why torrefied Agro-pellets are such a promising
commodity?” This commodity can penetrate all sectoral energy and chemichal markets
Resonable investment and processing costs
Reduction of transport and handling costs due to:
High energy density facilitates transport logistic and storage.
Hygroscopicity allows outside long-term storage, without losing its
characteristics.
More efficient utilisation/conversion.
Promoting large scale biomass trading among continents.
Impact on the infrastructures for the biomass supply
European Biomass Industry Association
European Biomass Industry Association
BIOMASS NEW TECHNOLOGIES:
Solutions to Overcome the Present difficulties
I) A wide range of more efficient and environmental friendly technologies &
integrated systems (i.e. biorefinery) will be available.
II) Biology research progress, by OMG and MAS (market assisted selection)
methods to improve the yield and quality of biomass as a result of
development and selection of new seeds. (as the new Monsanto ‘s corn seeds
requiring 30% less of water!)
III) The progress expected in the sector of genetic engineering and in particular in
the “synthetic biology” (based on the assembling of genes from different
organisms – rather than simple genes transfer - and being able to generate
complete new organisms to modify the methabolism of plants) could amon
others be able to increase the photosynthetic efficiency up to 30%. The
potential of biomass resources could therefore become huge.
European Biomass Industry Association
BIOMASS NEW TECHNOLOGIES:
Solutions to Overcome the Present difficulties
IV) Respect of biodiversity will be facilitated by the progress of genetic
engineering.
V) The drastic reduction of biological processes i.e. the genoma sequencing
cost:
• Human genome sequencing reduced of 10 000 times during the last 20 years
from 100 Mio. $ to 12,000 $ with an anticipated supplementary reduction of
1000 times over the next 20 years.
• The high speed computing systems will accelerate the progress on biomass
resources availability: the cost will be reduced more than 1000 times over the
next 20 years

European Biomass Industry Association
Thank you for your
attention! Giuliano Grassi.
EUBIA Rue d’Arlon 63-65
B-1040 Brussels,
Belgium
www.eubia.org