Embed Size (px)
Citation preview
8/3/2019 Technical Report 25th January 2012
http://slidepdf.com/reader/full/technical-report-25th-january-2012 1/5
For Private Circulation Only | 1
Technical Research | January 25, 2012
Yesterday, we witnessed an optimistic opening and Indices
traded with extreme volatility before the announcement of
RBI Monetary policy. However, post the announcement of a
higher than expected CRR cut, buying momentum resumed
and indices closed well above 5100 mark. On the sectoral
front, Capital Goods, Banking and Metal counters
contributed heavily in yesterday’s gain. There was no sector
in the negative territory. The advance to decline ratio was in
favor of advancing counters. (A= 1592 D= 1207) (Source -
www.bseindia.com)
Formation:
• We are witnessing a positive crossover on weekly “RSI –
Smoothened” oscillator.
• Indices are nearing a “Downward Sloping Trend Line”
joining July 8, 2011 high of 19132 / 5740 and October20, 2011 high of 17908 / 5400
• The 200-day SMA is now placed around 17356 / 5210
level.
Trading strategy:
Benchmark Indices opened with an upside gap and traded
with a strong positive momentum post announcement of RBI
Monetary policy. Subsequently, indices surged significantly
higher to register a close well above 5100 mark for the first
time after November 14, 2011. We are now observing that
indices have closed near the “Downward Sloping Trend
Line” joining July 8, 2011 high of 19132 / 5740 and
October 20, 2011 high of 17908 / 5400. Hence, a move
beyond yesterday’s high of 17050 / 5141 may reinforce
positive momentum and then indices may rally towards the
200-day SMA level of 17356 / 5210. On the downside, the
16670 / 5049 level may provide decent support in coming
trading session.
Daily Technical Report
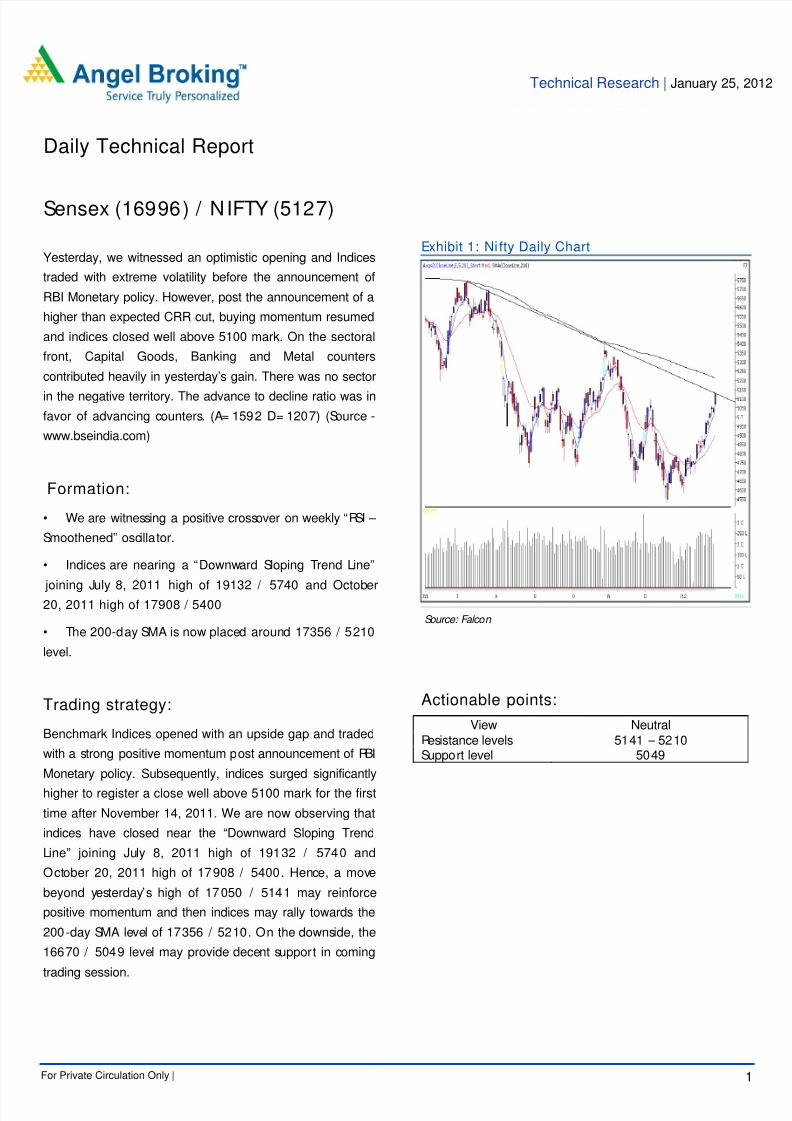
Sensex (16996) / NIFTY (5127)
Exhibit 1: Ni fty Daily Chart
Source: Falcon
Actionable points:
View Neutral
Resistance levels 5141 – 5210Support level 5049
8/3/2019 Technical Report 25th January 2012
http://slidepdf.com/reader/full/technical-report-25th-january-2012 2/5
Technical Research | January 25, 2012
For Private Circulation Only | 2
Yesterday, Bank Nifty opened on a flat note and gained
momentum post RBI monetary policy and tested 9900 level.
The “Shooting Star” candle stick pattern mentioned in our
previous report has been negated as the index managed to
close above 9659 level. Going forward if the index manages
to sustain above yesterday’s high of 9885 then it is likely to
test 9976 - 10017 levels. At present, the momentum
indicators suggest that the index is extremely overbought and
a small correction cannot be ruled out. In such a scenario
Bank Nifty is likely to find support near 9670 - 9548 levels incoming trading session.
Actionable points:
View Neutral
Resistance levelsSupport Levels
9885 – 9976 – 100179670 – 9548
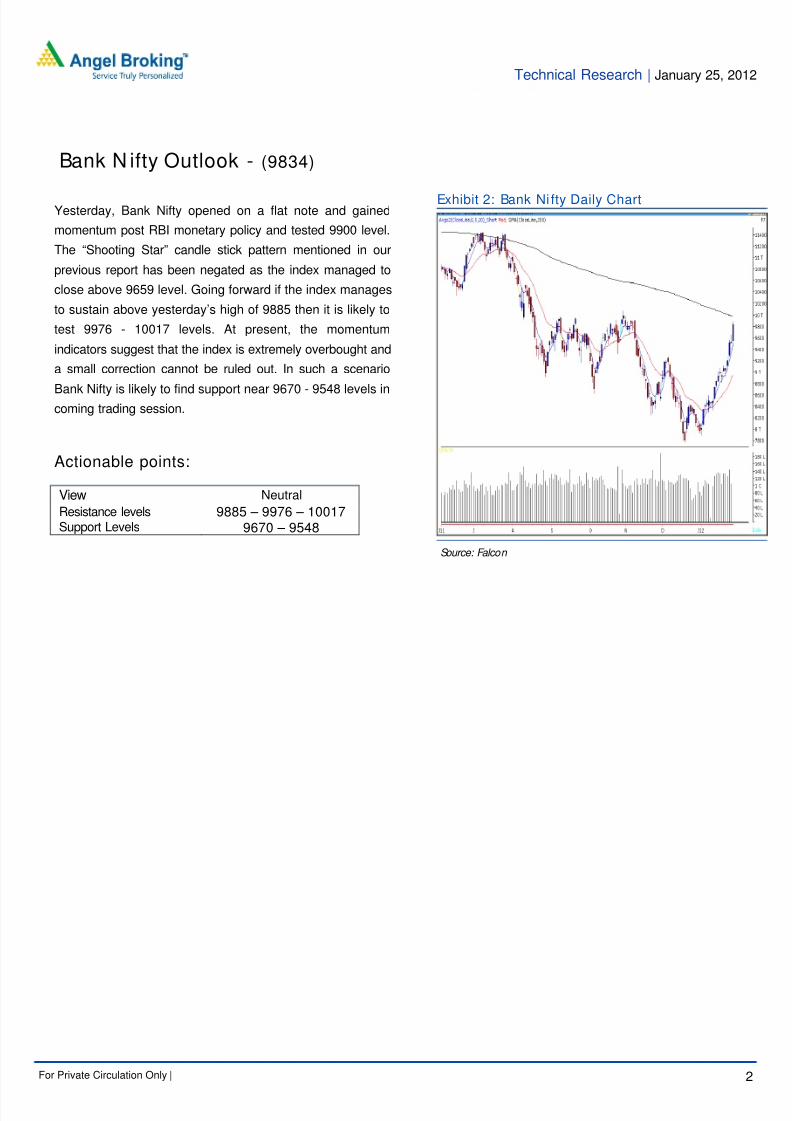
Bank N ifty Outlook - (9834)
Exhibit 2: Bank Ni fty Daily Chart
Source: Falcon
8/3/2019 Technical Report 25th January 2012
http://slidepdf.com/reader/full/technical-report-25th-january-2012 3/5
Technical Research | January 25, 2012
For Private Circulation Only | 3
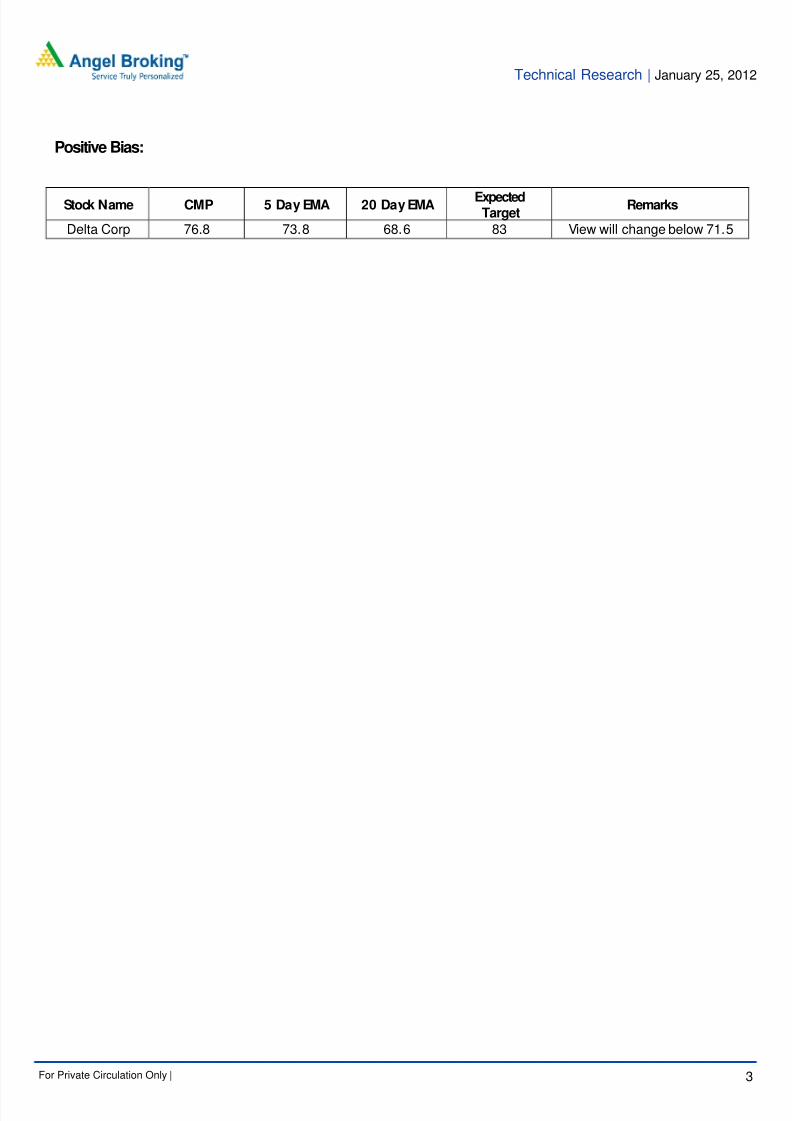
Positive Bias:
Stock Name CMP 5 Day EMA 20 Day EMA ExpectedTarget
Remarks
Delta Corp 76.8 73.8 68.6 83 View will change below 71.5
8/3/2019 Technical Report 25th January 2012
http://slidepdf.com/reader/full/technical-report-25th-january-2012 4/5
Technical Research | January 25, 2012
For Private Circulation Only | 4
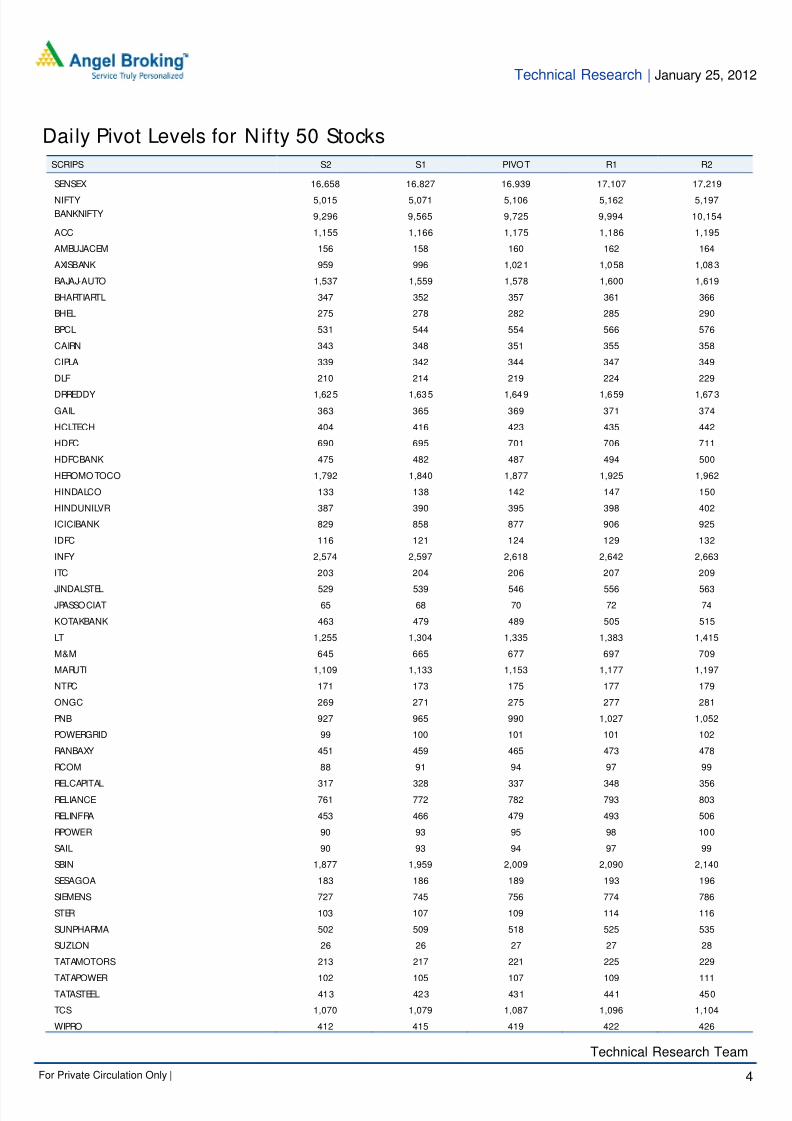
SCRIPS S2 S1 PIVOT R1 R2
SENSEX 16,658 16,827 16,939 17,107 17,219
NIFTY 5,015 5,071 5,106 5,162 5,197
BANKNIFTY 9,296 9,565 9,725 9,994 10,154
ACC 1,155 1,166 1,175 1,186 1,195
AMBUJACEM 156 158 160 162 164
AXISBANK 959 996 1,021 1,058 1,083
BAJAJ-AUTO 1,537 1,559 1,578 1,600 1,619
BHARTIARTL 347 352 357 361 366
BHEL 275 278 282 285 290
BPCL 531 544 554 566 576
CAIRN 343 348 351 355 358
CIPLA 339 342 344 347 349
DLF 210 214 219 224 229
DRREDDY 1,625 1,635 1,649 1,659 1,673
GAIL 363 365 369 371 374
HCLTECH 404 416 423 435 442
HDFC 690 695 701 706 711
HDFCBANK 475 482 487 494 500
HEROMOTOCO 1,792 1,840 1,877 1,925 1,962
HINDALCO 133 138 142 147 150
HINDUNILVR 387 390 395 398 402
ICICIBANK 829 858 877 906 925
IDFC 116 121 124 129 132
INFY 2,574 2,597 2,618 2,642 2,663
ITC 203 204 206 207 209
JINDALSTEL 529 539 546 556 563
JPASSOCIAT 65 68 70 72 74
KOTAKBANK 463 479 489 505 515
LT 1,255 1,304 1,335 1,383 1,415
M&M 645 665 677 697 709
MARUTI 1,109 1,133 1,153 1,177 1,197
NTPC 171 173 175 177 179
ONGC 269 271 275 277 281
PNB 927 965 990 1,027 1,052
POWERGRID 99 100 101 101 102
RANBAXY 451 459 465 473 478
RCOM 88 91 94 97 99
RELCAPITAL 317 328 337 348 356RELIANCE 761 772 782 793 803
RELINFRA 453 466 479 493 506
RPOWER 90 93 95 98 100
SAIL 90 93 94 97 99
SBIN 1,877 1,959 2,009 2,090 2,140
SESAGOA 183 186 189 193 196
SIEMENS 727 745 756 774 786
STER 103 107 109 114 116
SUNPHARMA 502 509 518 525 535
SUZLON 26 26 27 27 28
TATAMOTORS 213 217 221 225 229
TATAPOWER 102 105 107 109 111TATASTEEL 413 423 431 441 450
TCS 1,070 1,079 1,087 1,096 1,104
WIPRO 412 415 419 422 426
Technical Research Team
Daily Pivot Levels for Nifty 50 Stocks
8/3/2019 Technical Report 25th January 2012
http://slidepdf.com/reader/full/technical-report-25th-january-2012 5/5
Technical Research | January 25, 2012
For Private Circulation Only | 5
Technical Report
RESEARCH TEAM
Shardul Kulkarni Head - Technicals
Sameet Chavan Technical Analyst
Sacchitanand Uttekar Technical Analyst
Mehul Kothari Technical Analyst
Ankur Lakhotia Technical Analyst
For any Queries, Suggestions and Feedback kindly mail to [email protected]
Research Team: 022-3952 6600 Website: www.angelbroking.com
DISCLAIMER: This document is not for public distribution and has been furnished to you solely for your information and must not
be reproduced or redistributed to any other person. Persons into whose possession this document may come are required to observe
these restrictions.
Opinion expressed is our current opinion as of the date appearing on this material only. While we endeavor to update on a
reasonable basis the information discussed in this material, there may be regulatory, compliance, or other reasons that prevent us
from doing so. Prospective investors and others are cautioned that any forward-looking statements are not predictions and may be
subject to change without notice. Our proprietary trading and investment businesses may make investment decisions that are
inconsistent with the recommendations expressed herein.
The information in this document has been printed on the basis of publicly available information, internal data and other reliable
sources believed to be true and are for general guidance only. While every effort is made to ensure the accuracy and completeness of
information contained, the company takes no guarantee and assumes no liability for any errors or omissions of the information. No
one can use the information as the basis for any claim, demand or cause of action.
Recipients of this material should rely on their own investigations and take their own professional advice. Each recipient of this
document should make such investigations as it deems necessary to arrive at an independent evaluation of an investment in the
securities of companies referred to in this document (including the merits and risks involved), and should consult their own advisors to
determine the merits and risks of such an investment. Price and value of the investments referred to in this material may go up or
down. Past performance is not a guide for future performance. Certain transactions - futures, options and other derivatives as well as
non- investment grade securities - involve substantial risks and are not suitable for all investors. Reports based on technical analysis
centers on studying charts of a stock's price movement and trading volume, as opposed to focusing on a company's fundamentals
and as such, may not match with a report on a company's fundamentals.
We do not undertake to advise you as to any change of our views expressed in this document. While we would endeavor to update
the information herein on a reasonable basis, Angel Broking, its subsidiaries and associated companies, their directors and
employees are under no obligation to update or keep the information current. Also there may be regulatory, compliance, or other
reasons that may prevent Angel Broking and affiliates from doing so. Prospective investors and others are cautioned that any
forward-looking statements are not predictions and may be subject to change without notice.
Angel Broking Limited and affiliates, including the analyst who has issued this report, may, on the date of this report, and from time
to time, have long or short positions in, and buy or sell the securities of the companies mentioned herein or engage in any other
transaction involving such securities and earn brokerage or compensation or act as advisor or have other potential conflict of interest
with respect to company/ies mentioned herein or inconsistent with any recommendation and related information and opinions.
Angel Broking Limited and affiliates may seek to provide or have engaged in providing corporate finance, investment banking or
other advisory services in a merger or specific transaction to the companies referred to in this report, as on the date of this report or
in the past.
Sebi Registration No : INB 010996539