Embed Size (px)
Citation preview

16-05-2013
1
Geospatial Information in Public Health: Using GIS
to Model the Spread of Tuberculosis
OLOYEDE-KOSOKO S.O.A
DEPARTMENT OF GEOINFORMATICS
FEDERAL SCHOOL OF SURVEYING
P.M.B 1024 OYO
&
AKINGBOGUN, AYOOLA AKINOLA
Pointmile Geotech,Lagos
The Influence of Spatial Structure on Disease Transmission, Prevalence and Treatment
INTRODUCTION
Infectious diseases remain a major cause of death worldwide.
Tuberculosis is the most frequent cause of death from a single
infectious disease in persons aged 15 – 49 years, causing a total of 2
– 3 million deaths annually (Enarson and Chretien, 1999).
Tuberculosis (TB) is humanities greatest killer which is out of control
in many parts of the world. The disease is preventable but it has
been grossly neglected and no country worldwide is immune to it
(Shrestha, et. al., 2005). It is still a major health concern worldwide
and the disease spreads more easily in overcrowded settings and in
the conditions of malnutrition and poverty (Mycal, et. al., 2005).

16-05-2013
2
• Currently, Nigeria is ranked fourth among the countries ofthe world with the highest burden of tuberculosis (TB) andnew perspectives and ways of addressing TB treatmentand control are needed as the disease continuesunabated.
New technology, such as geographical informationsystems, may be useful in this process. This studytherefore focused on identifying geographical areas whereon-going tuberculosis transmission is occurring by linkingGeographic Information Systems technology withtuberculosis diagnosis in communities in Ibadan, Nigeria
Study Area
The study covers Ibadan metropolitan city,
which is the largest indigenous city in Africa, is
the capital of Oyo state. It is made up of eleven
local government areas five of which are within
the inner city-
North
North-West
North-East
South-East
South-West

16-05-2013
3
Diagram showing the location of the study area
DATA AQUISITION
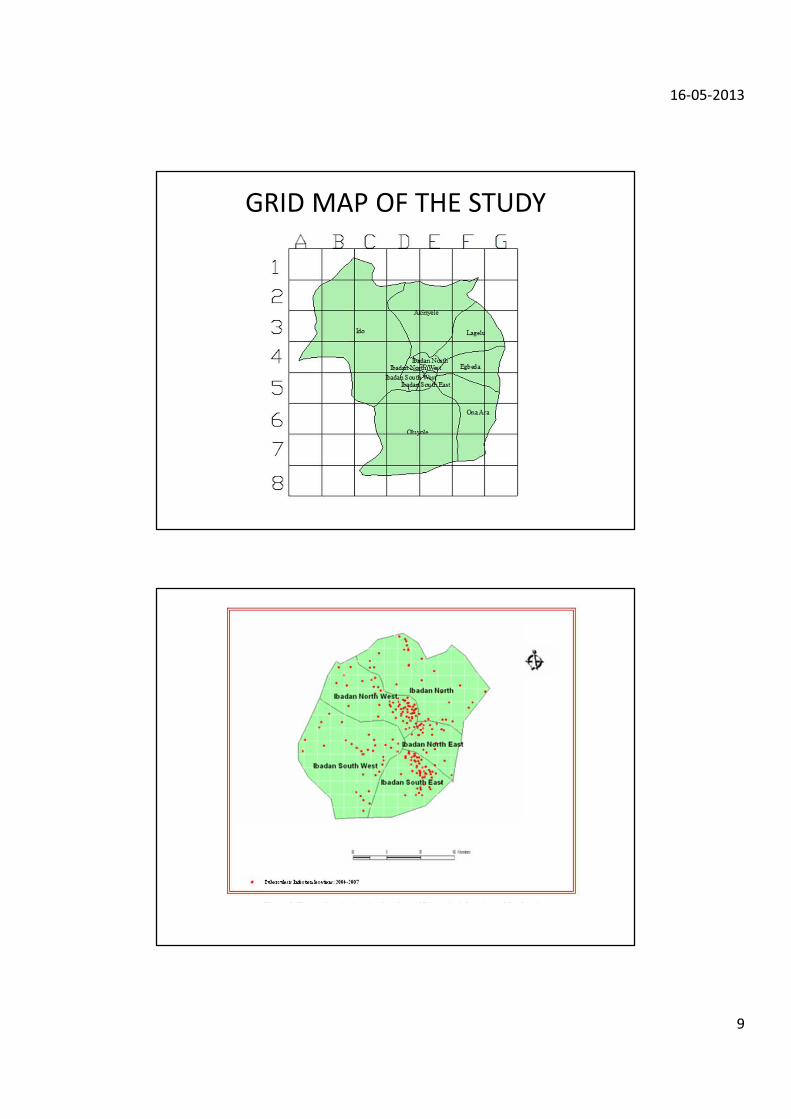
• Data of TB incidence between 2004 and 2007
from five Health centers in Ibadan were
cartographically mapped to show current trends
in the spread of the disease and its geographic
dispersion among those infected using ArcGIS
software, Satscan software and Global
Positioning System (GPS)
16-05-2013
4
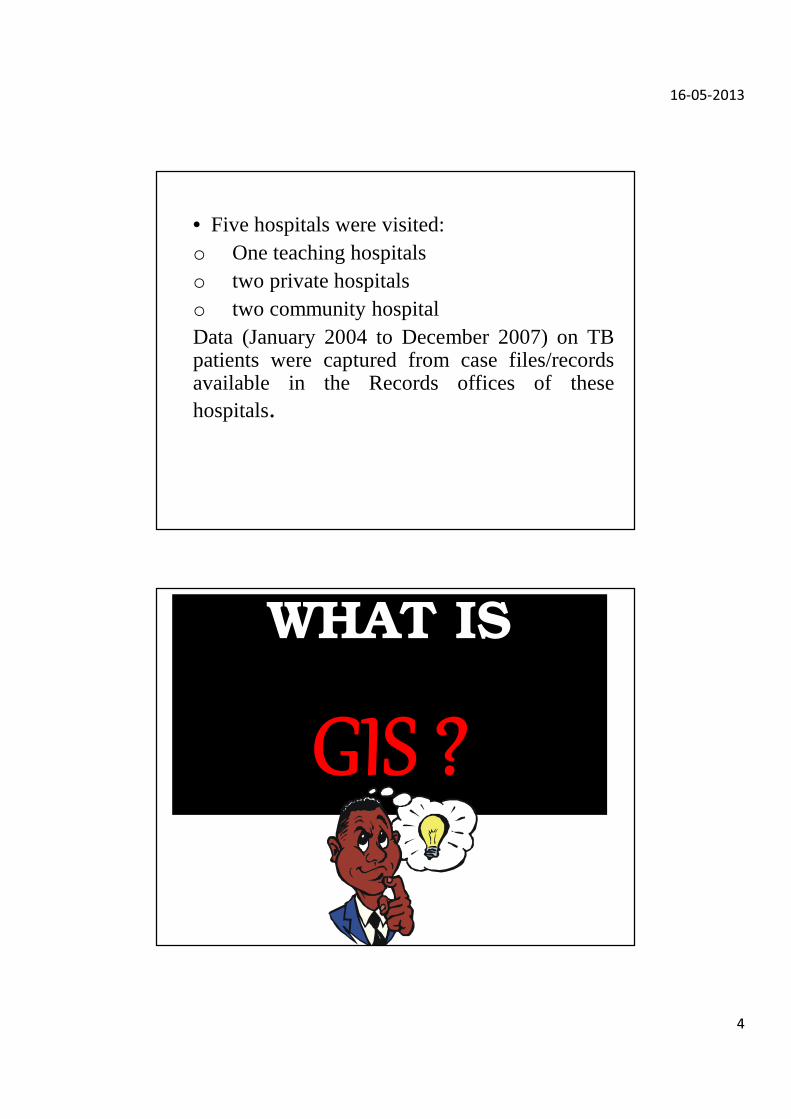
• Five hospitals were visited:o One teaching hospitalso two private hospitalso two community hospitalData (January 2004 to December 2007) on TBpatients were captured from case files/recordsavailable in the Records offices of thesehospitals.
WHAT IS
GIS ?

16-05-2013
5
GEOGRAPHIC
INFORMATION
SYSTEM
ASSEMBLY OF COMPUTER
HARDWARE AND
SOFTWARE DESIGNED TO
CAPTURE, STORE,
MANIPULATE, ANALYZE AND
DISPLAY DATA THAT ARE
REFRENCED TO A SPECIFIC
PART OF THE EARTH
SURFACE.

16-05-2013
6
Three types of Models
• Real World
• Computer representations
• Visualizations
FEDERAL SCHOOL OF SURVEYING OYO
Real World

16-05-2013
7
DATA ACQUISITION FOR GIS* Land Surveying
* Photogrammetry
* Remote Sensing
* Cartography
- Scanning
- Digitizing

16-05-2013
8
Data in Information out
retrieve
store
retrieve
SelectionAnalysis
GIS Capabilities
–Measurements, retrieval and
classification
–Overlay functions
–Neighborhood functions
–Connectivity functions
Some GIS Capabilities
16-05-2013
9
GRID MAP OF THE STUDY
16-05-2013
10
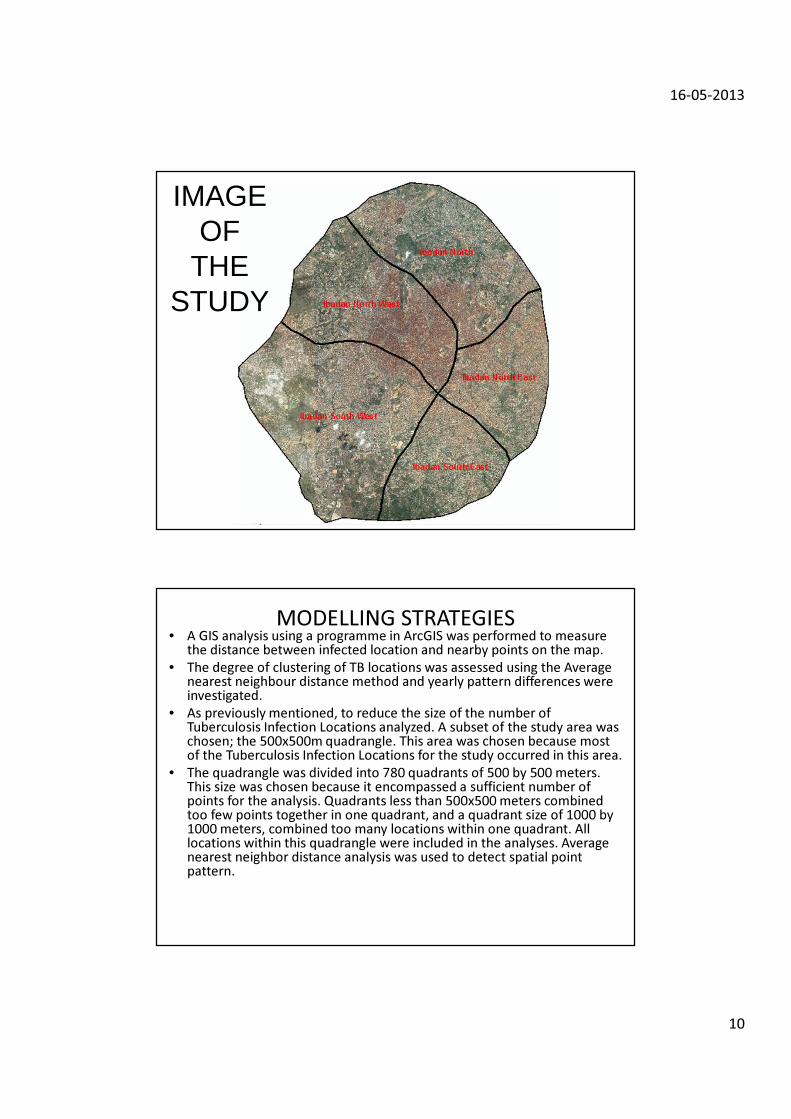
IMAGE OF
THE STUDY
MODELLING STRATEGIES• A GIS analysis using a programme in ArcGIS was performed to measure
the distance between infected location and nearby points on the map.
• The degree of clustering of TB locations was assessed using the Average nearest neighbour distance method and yearly pattern differences were investigated.
• As previously mentioned, to reduce the size of the number of Tuberculosis Infection Locations analyzed. A subset of the study area was chosen; the 500x500m quadrangle. This area was chosen because most of the Tuberculosis Infection Locations for the study occurred in this area.
• The quadrangle was divided into 780 quadrants of 500 by 500 meters. This size was chosen because it encompassed a sufficient number of points for the analysis. Quadrants less than 500x500 meters combined too few points together in one quadrant, and a quadrant size of 1000 by 1000 meters, combined too many locations within one quadrant. All locations within this quadrangle were included in the analyses. Average nearest neighbor distance analysis was used to detect spatial point pattern.

16-05-2013
11
Current Spatial TB research in
Ibadan• Geographic disparities in TB spatial trends• TB testing center locations • Spatial reach of TB interventions • GIS aids in faster and better health mapping and analysis than
the conventional methods. It gives health professionals quick and easy access to large volumes of data. It provides a variety of dynamic analysis tools and display techniques for monitoring and management of epidemics.GIS has a vital role to play in the future. The possibilities that can be explored are limitless, depending on the skill and imaginative use of the researchers and the willingness of health sector management to resource its implementation. Health administrators, professionals and researchers need training and user support in GIS technology, data and epidemiological methods in order to use GIS properly and effectively.
DATA CONVERSION

16-05-2013
12
Mapping Geographic Patterns
• Identifying clustered cases within poor
housing conditions, low socio-economic
status, high unemployment rate and high drug
use.
• calculate distances and areas of communities
to health centres and to indicate densities of
incidence of Tuberculosis with the population
in the area covered by the cluster.
Geographic Patterns of Tuberculosis Transmission
in Ibadan
• Map populations at risk and stratify risk factors at level of contact. To evaluate residential addresses of the patients in the study area to determine if there are neighborhoods that are associated with Tuberculosis transmission and also to evaluate the spatial distribution of the patients in thee study which will be assigned a geographic location.
• Statistical analysis using GIS and Satscan to determine cluster in relation with proportion of population and incidence falling within a certain radius of a health centre, and to locate the nearest health facility to the cluster. Also to calculate distances and areas of communities to a health centre to indicate densities of incidence of Tuberculosis with the population in the area covered by the cluster.
16-05-2013
13
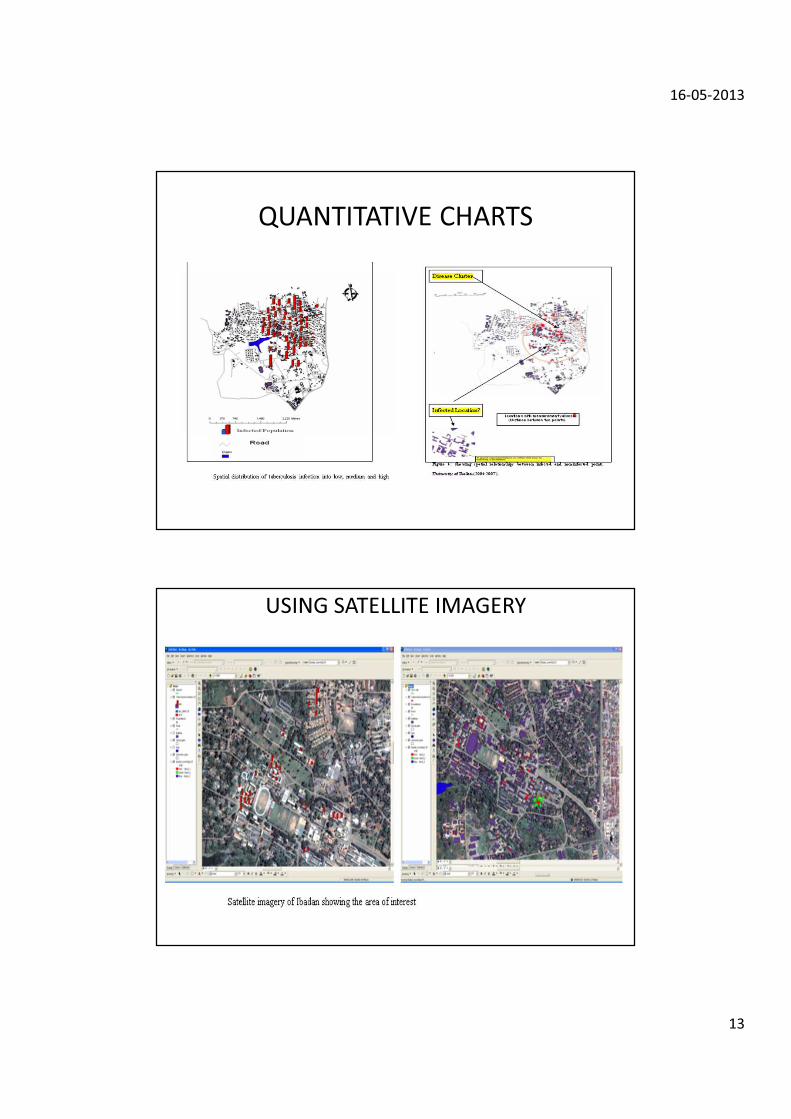
QUANTITATIVE CHARTS
USING SATELLITE IMAGERY
16-05-2013
14
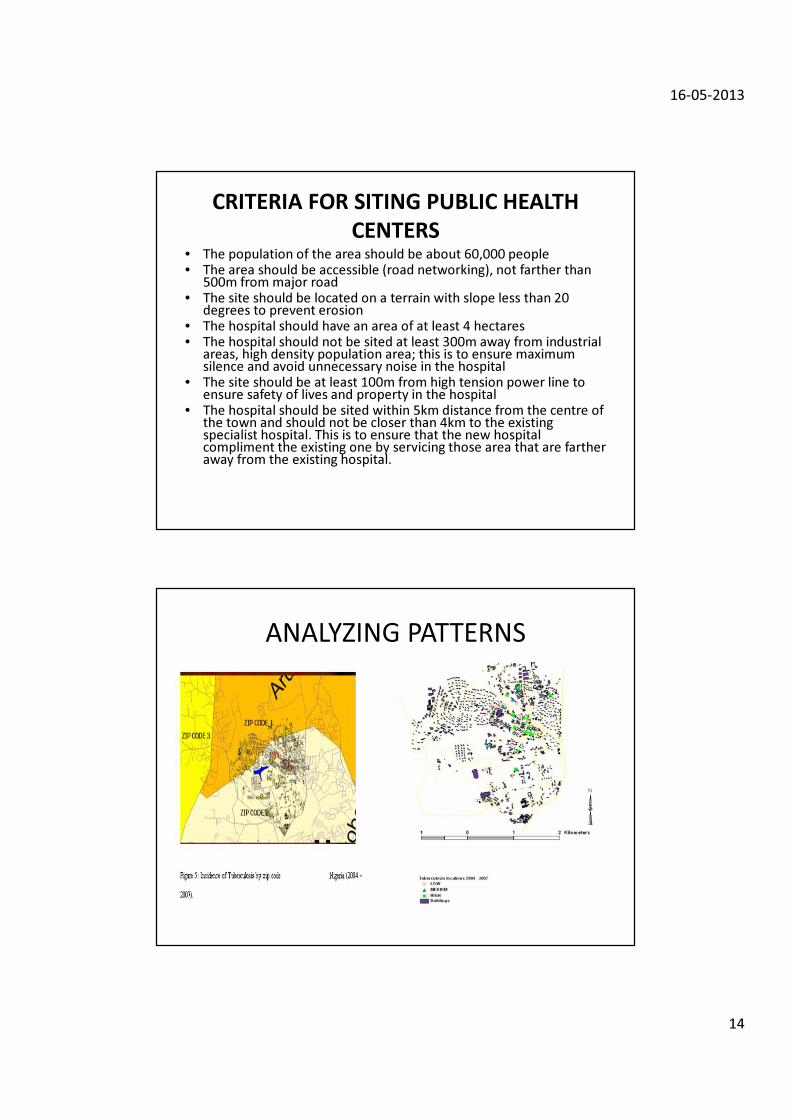
CRITERIA FOR SITING PUBLIC HEALTH
CENTERS• The population of the area should be about 60,000 people• The area should be accessible (road networking), not farther than
500m from major road• The site should be located on a terrain with slope less than 20
degrees to prevent erosion• The hospital should have an area of at least 4 hectares• The hospital should not be sited at least 300m away from industrial
areas, high density population area; this is to ensure maximum silence and avoid unnecessary noise in the hospital
• The site should be at least 100m from high tension power line to ensure safety of lives and property in the hospital
• The hospital should be sited within 5km distance from the centre of the town and should not be closer than 4km to the existing specialist hospital. This is to ensure that the new hospital compliment the existing one by servicing those area that are farther away from the existing hospital.
ANALYZING PATTERNS

16-05-2013
15
SPATIAL PATTERNS FROM 2004-2007
Spatial distribution of TB in low, medium
and high zones

16-05-2013
16
Distance analysis
Spatial distribution parameters

16-05-2013
17
STATISTICAL AND SPATIAL ANALYSIS� GIS Data Analysis and Evaluation
SaTScan™ statistics software would be used to estimate spatial clusters of tb casesidentified.
� Identification of associated risk factors of rabies
Satellite Imagery of Ibadan was was used on Arc GIS to recognize land use areas andactivities present at locations of TB clusters.
� Statistical Analysis
STATA statistical software was used to test for association.

16-05-2013
18
Satscan Software
Cluster -spatial Analysis

16-05-2013
19

16-05-2013
20
POPULATION PERCENT CHANGE

16-05-2013
21
RESULTS• A total of 5579 cases were detected over the study period. The
mean age for the entire affected population was 27.76 ± 8.46 (SD);5400 (78.87%) patients were Adults while 179 (21.13%) wereyouth. The ‘nearest neighbour distance analysis’ indicated aclustered pattern of locations with Ibadan North West, South East,South West and North East characterized by overcrowding andpoor quality housing conditions having increased likelihood of on-going transmission. This study therefore provides a preliminarysynopsis of the uses of the Geographical Information Systems inthe control of TB in Nigeria.
DISCUSSION• Furthermore, spatial distribution of tuberculosis infection was
analyzed into zones (Figure 6).the result of the affected areas weregrouped into low (0- 0.9%) medium (0.9%-1.8%) and high (1.8%-2.8%) areas.
• The highest proportion of points with clustered TB occurred in theIbadan North West, South East, South West and North East with thehighest incidence. These areas; such as Gege, Orita Merin, Agbeni,Foko, Ogunpa, Idi arere, Popo-Iyemoja, Ayeye, Beere, Opoyeosa,Labiran, Adeoyo and Idiobi were characterized by overcrowdingand poor quality housing conditions.
• The distance between infected points and non-infectedpoints are as shown in Table 5, 6, 7, 8 and 9. Field Survey of 100 TBpatients were carried out to determine the average movement ofpatients to and from Home, market and farm with commercialcenters and residential quarters within the nearest distance (Table10).
• In order to monitor the spread in the city, a population percentchange analysis was performed to determine the extent of landcover change over time (Figure 7).

16-05-2013
22
ConclusionThe case study of five Ibadan local governments which
are within the inner city Ibadan North-West, Ibadan
North-East, Ibadan South-East, Ibadan North and
Ibadan South-West was thus an extremely small
coverage of national records. Quantitatively, the
model adequately describes the general spatial
patterns of affected locations, but does not describe
the interactions with environmental variables, or
explicitly define terms of neighborhood effects.
The use of GIS has not been fully integrated into thepublic health sector. Availability of data would go a longway to encourage researchers to fully delve intoproblems experienced within this sector because data isthe bedrock of any analysis done with a GIS.
Our result shows that GIS can be used to classify thespread of tuberculosis; therefore, providing clues for itscontrol measures particularly as it concerns pointdistribution of the disease in relation to the locationand population density. Simultaneous use of GISanalysis and epidemiological surveillance will be aneffective method for identifying instances of localtransmission. Finally, further studies using GIStechniques will be required.

16-05-2013
23
Thanks
For Your Attention
Questions