Embed Size (px)
Citation preview
Geologic Resources: Nonrenewable Mineral and Energy Resources
Geologic Resources: Nonrenewable Mineral and Energy Resources
Chapter 15
G. Tyler Miller’sLiving in the Environment
13th Edition
Chapter 15
G. Tyler Miller’sLiving in the Environment
13th Edition
Key ConceptsKey Concepts
• Types of mineral resourcesTypes of mineral resources• Formation and location of mineral Formation and location of mineral
resourcesresources• Extraction and processing of Extraction and processing of
mineral resourcesmineral resources• Increasing supplies of mineral Increasing supplies of mineral
resourcesresources• Major types, acquisition, Major types, acquisition,
advantages, and disadvantages of advantages, and disadvantages of fuel resourcesfuel resources
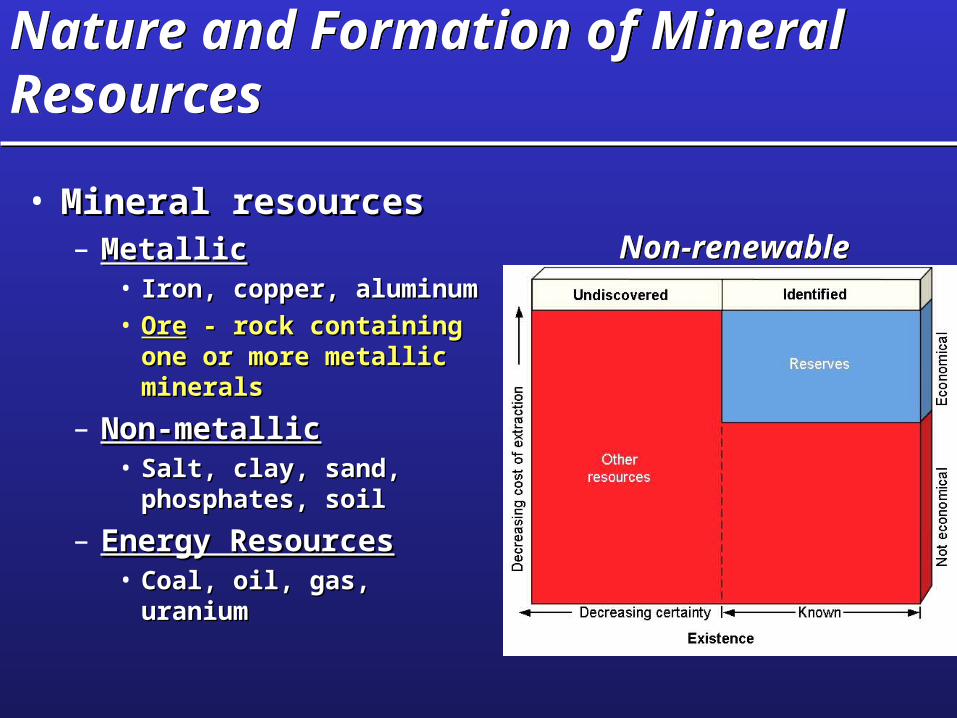
Nature and Formation of Mineral ResourcesNature and Formation of Mineral Resources
• Mineral resourcesMineral resources– MetallicMetallic
• Iron, copper, Iron, copper, aluminumaluminum
• OreOre - rock containing - rock containing one or more metallic one or more metallic mineralsminerals
– Non-metallicNon-metallic• Salt, clay, sand, Salt, clay, sand,
phosphates, soilphosphates, soil
– Energy ResourcesEnergy Resources• Coal, oil, gas, Coal, oil, gas,
uraniumuranium
Non-renewableNon-renewable
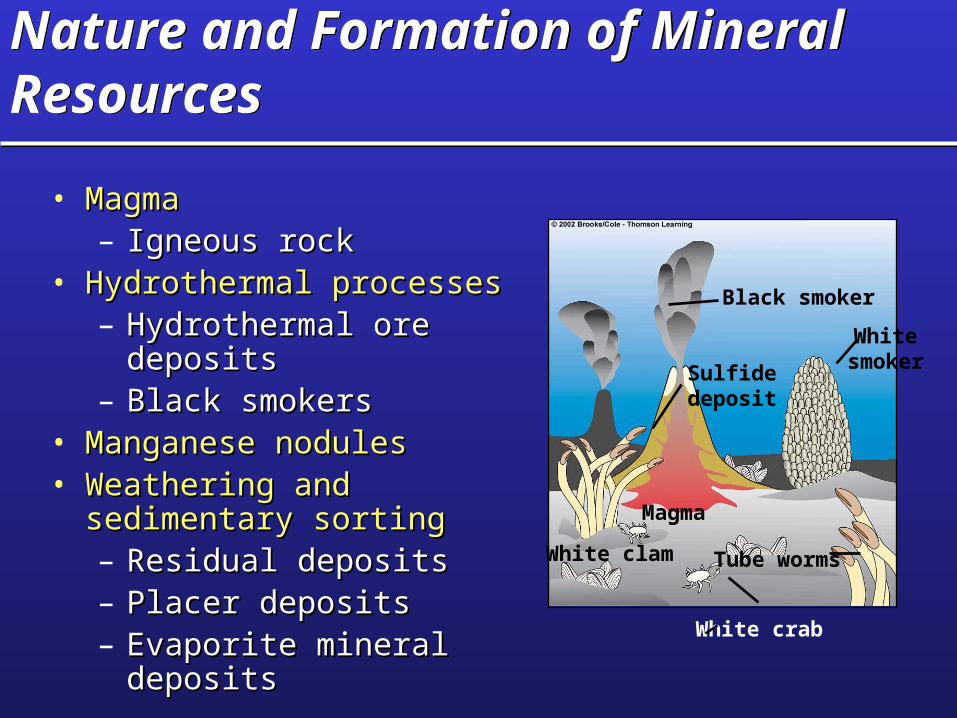
Nature and Formation of Mineral ResourcesNature and Formation of Mineral Resources
• MagmaMagma– Igneous rockIgneous rock
• Hydrothermal processesHydrothermal processes– Hydrothermal ore Hydrothermal ore
depositsdeposits– Black smokersBlack smokers
• Manganese nodulesManganese nodules• Weathering and Weathering and
sedimentary sortingsedimentary sorting– Residual depositsResidual deposits– Placer depositsPlacer deposits– Evaporite mineral Evaporite mineral
depositsdeposits
Magma
Black smoker
Sulfidedeposit
White crab
White clam Tube worms
Whitesmoker
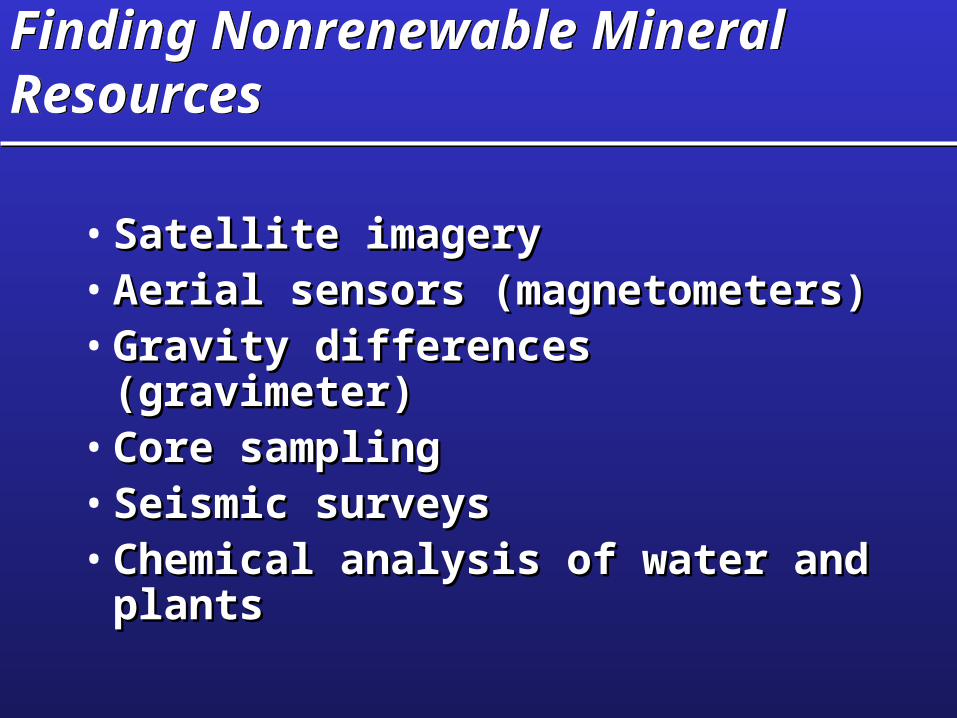
Finding Nonrenewable Mineral ResourcesFinding Nonrenewable Mineral Resources
• Satellite imagerySatellite imagery• Aerial sensors (magnetometers)Aerial sensors (magnetometers)• Gravity differences (gravimeter)Gravity differences (gravimeter)• Core samplingCore sampling• Seismic surveysSeismic surveys• Chemical analysis of water and Chemical analysis of water and
plantsplants
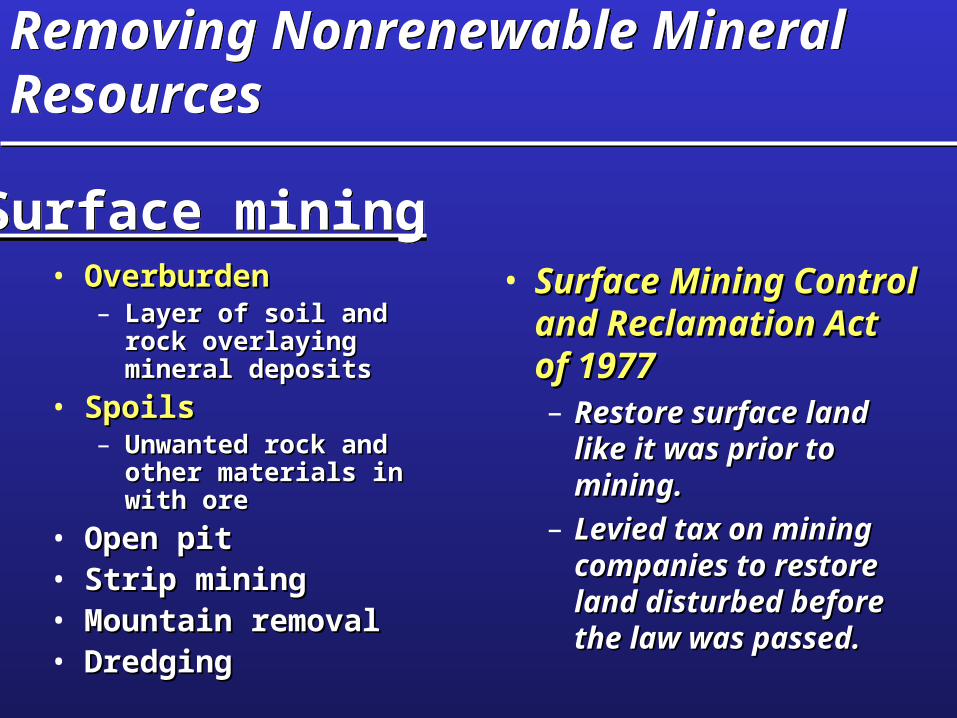
Removing Nonrenewable Mineral ResourcesRemoving Nonrenewable Mineral Resources
• OverburdenOverburden– Layer of soil and Layer of soil and
rock overlaying rock overlaying mineral depositsmineral deposits
• SpoilsSpoils– Unwanted rock and Unwanted rock and
other materials in other materials in with orewith ore
• Open pitOpen pit• Strip miningStrip mining• Mountain removalMountain removal• DredgingDredging
• Surface Mining Control Surface Mining Control and Reclamation Act of and Reclamation Act of 19771977– Restore surface land like Restore surface land like
it was prior to mining.it was prior to mining.
– Levied tax on mining Levied tax on mining companies to restore land companies to restore land disturbed before the law disturbed before the law was passed.was passed.
Surface miningSurface mining
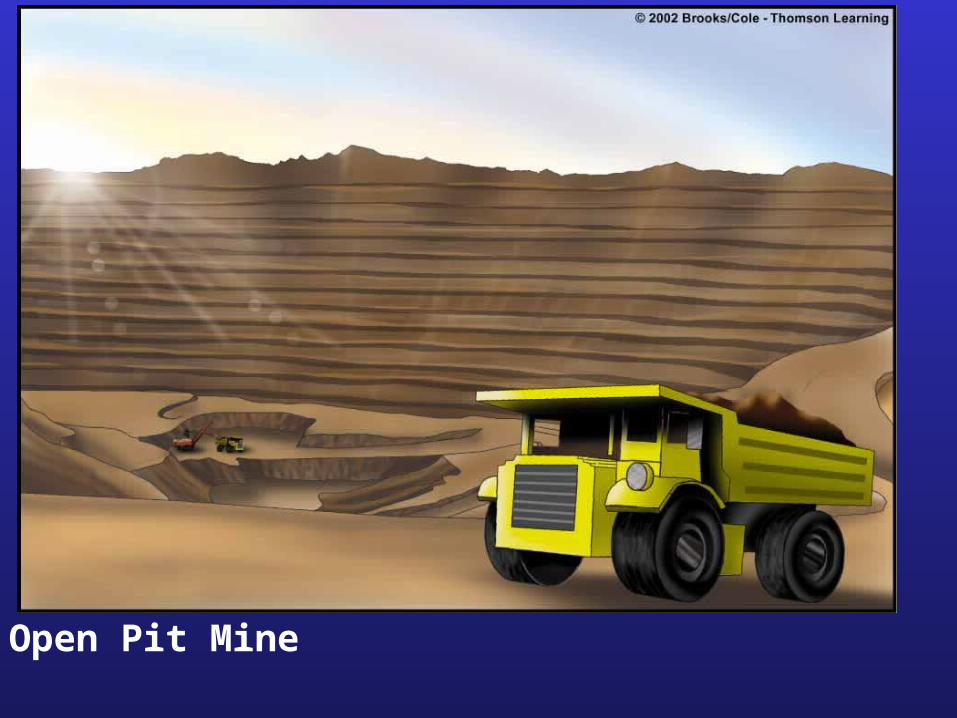
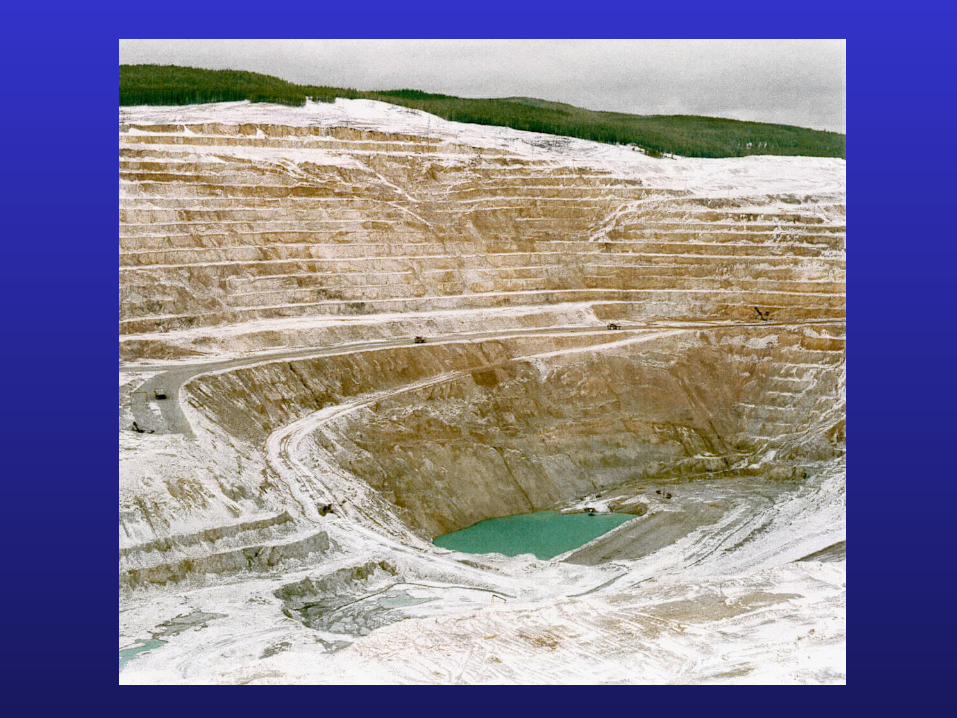
Open Pit Mine
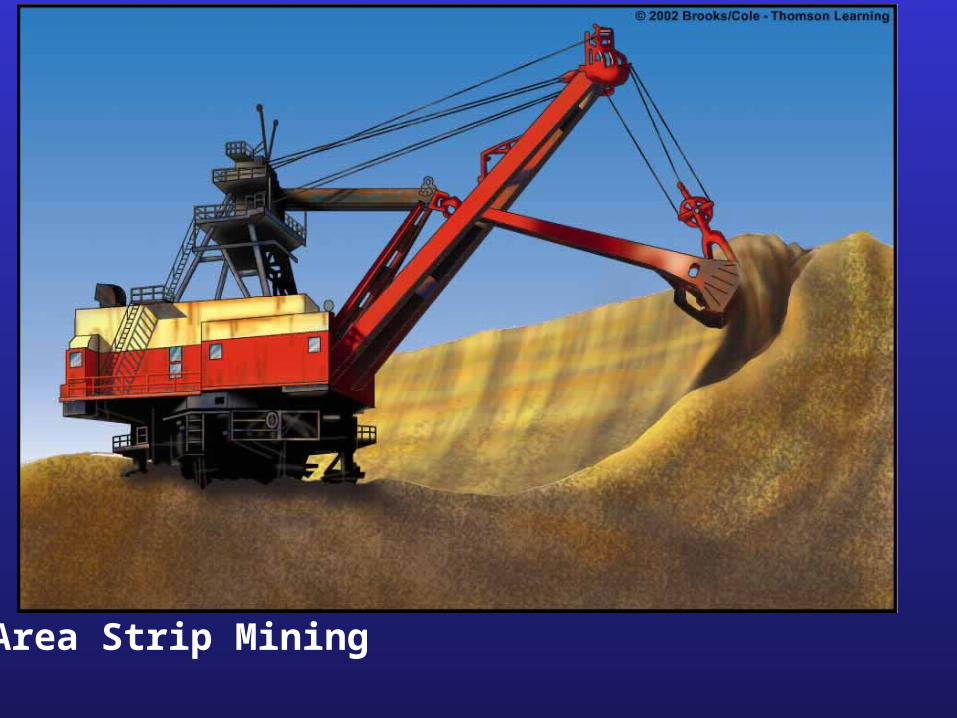
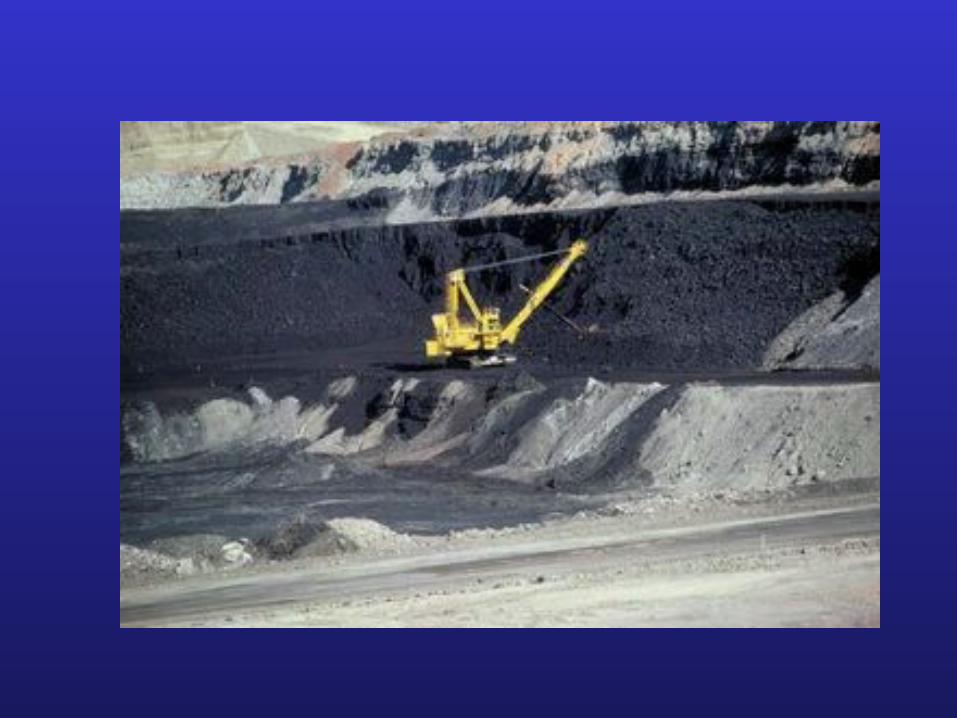
Area Strip Mining
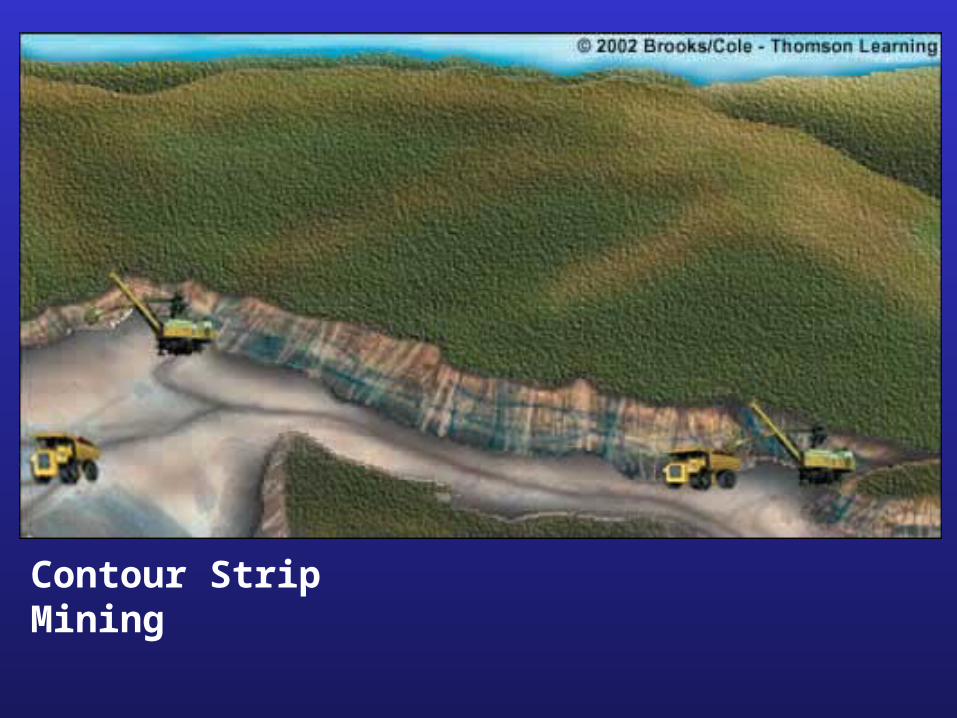
Contour Strip Mining
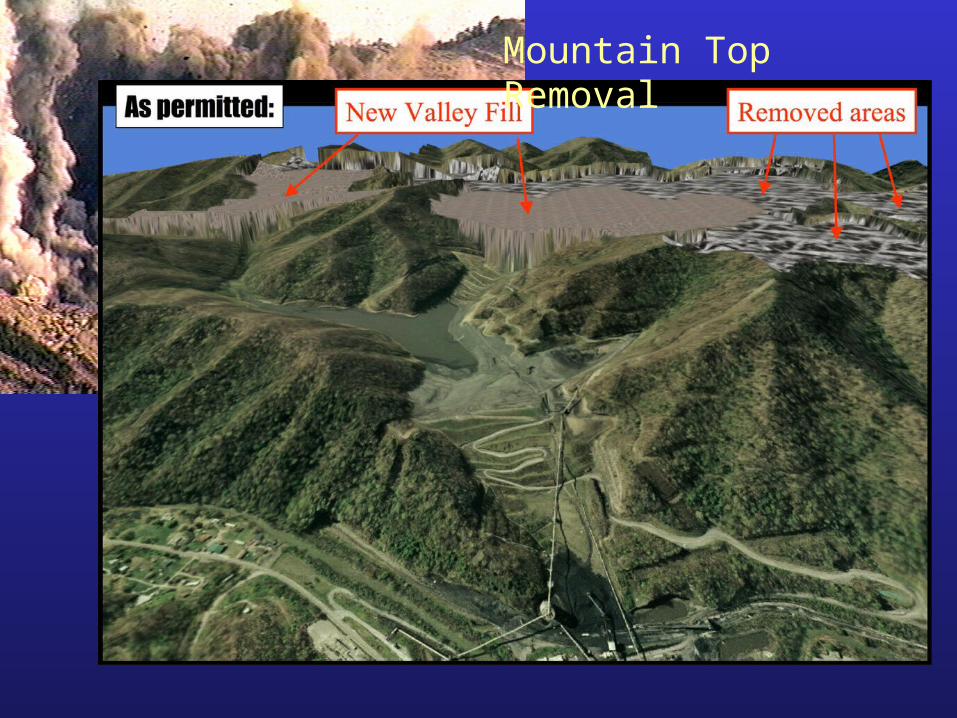
Mountain Top Removal

Removing Nonrenewable Mineral ResourcesRemoving Nonrenewable Mineral Resources
– Room and Room and pillarpillar
– LongwallLongwall• Disturbs less Disturbs less
land arealand area• Produces less Produces less
wastewaste• More More
dangerousdangerous and and expensiveexpensive
Subsurface miningSubsurface mining
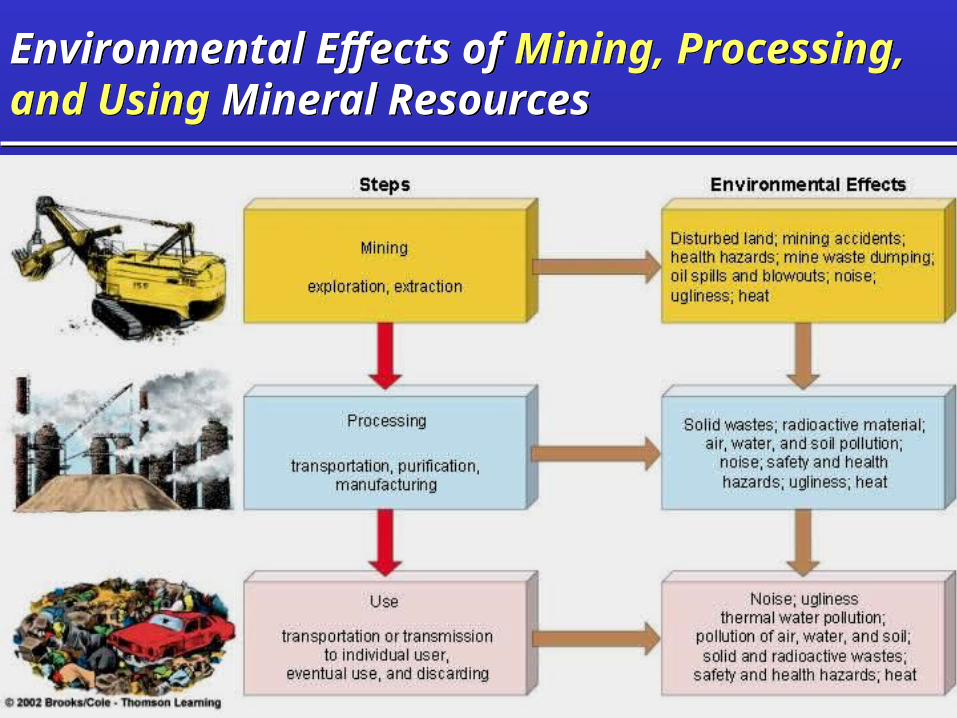
Environmental Effects of Mining, Processing, and Using Mineral Resources
Environmental Effects of Mining, Processing, and Using Mineral Resources
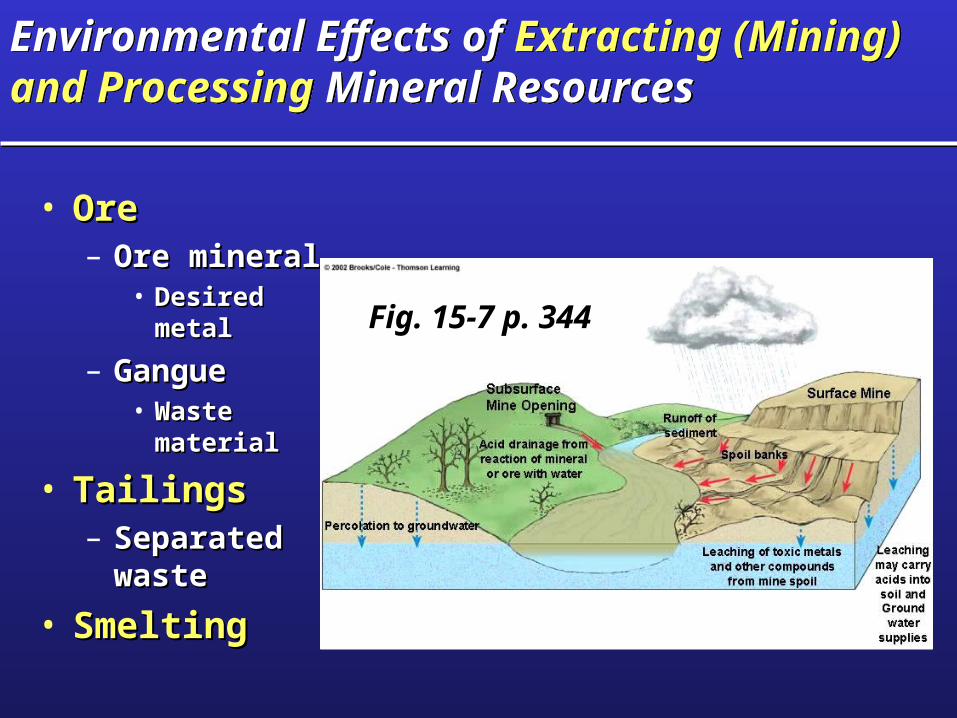
Environmental Effects of Extracting (Mining) and Processing Mineral Resources
Environmental Effects of Extracting (Mining) and Processing Mineral Resources
• OreOre– Ore Ore
mineralmineral• Desired Desired
metalmetal
– GangueGangue• Waste Waste
materialmaterial
• TailingsTailings– Separated Separated
wastewaste
• SmeltingSmelting
Fig. 15-7 p. 344
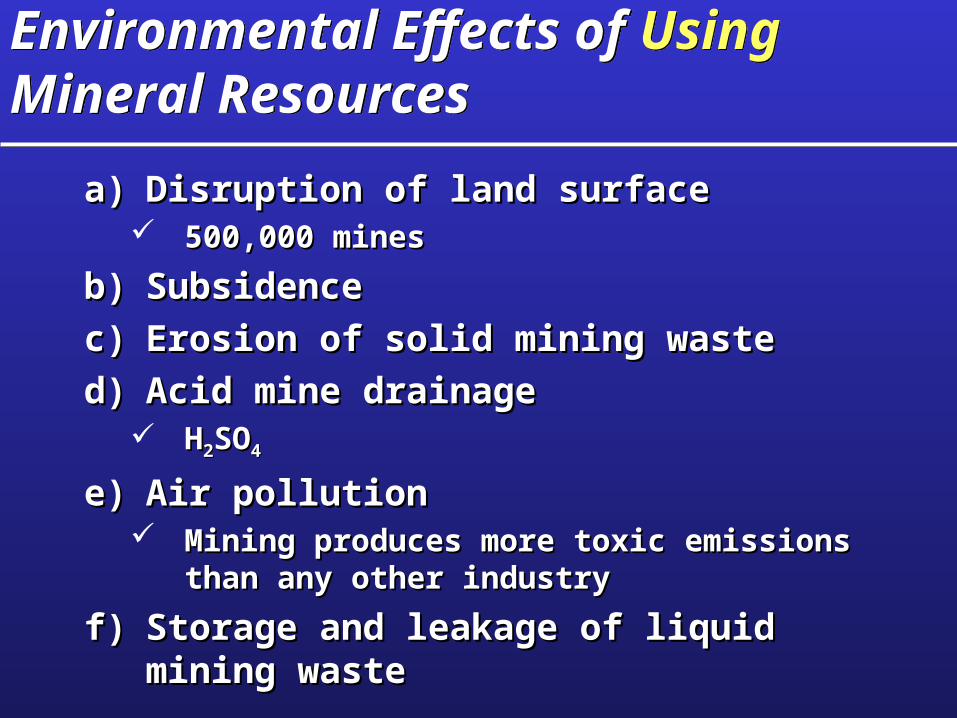
Environmental Effects of Using Mineral ResourcesEnvironmental Effects of Using Mineral Resources
a)a) Disruption of land surfaceDisruption of land surface 500,000 mines500,000 mines
b)b) SubsidenceSubsidence
c)c) Erosion of solid mining wasteErosion of solid mining waste
d)d) Acid mine drainageAcid mine drainage HH22SOSO44
e)e) Air pollutionAir pollution Mining produces more toxic emissions Mining produces more toxic emissions
than any other industrythan any other industry
f)f) Storage and leakage of liquid Storage and leakage of liquid mining wastemining waste

Supplies of Mineral ResourcesSupplies of Mineral Resources
• Economic Economic depletiondepletion– Costs more to find, Costs more to find,
extract, transport, extract, transport, and process the and process the remaining deposit remaining deposit than it is worth than it is worth (10%)(10%)
– OptionsOptions• Recycle or reuse Recycle or reuse • Waste lessWaste less• Use lessUse less• Find a substituteFind a substitute• Do withoutDo without Fig. 15-9 p. 346Fig. 15-9 p. 346
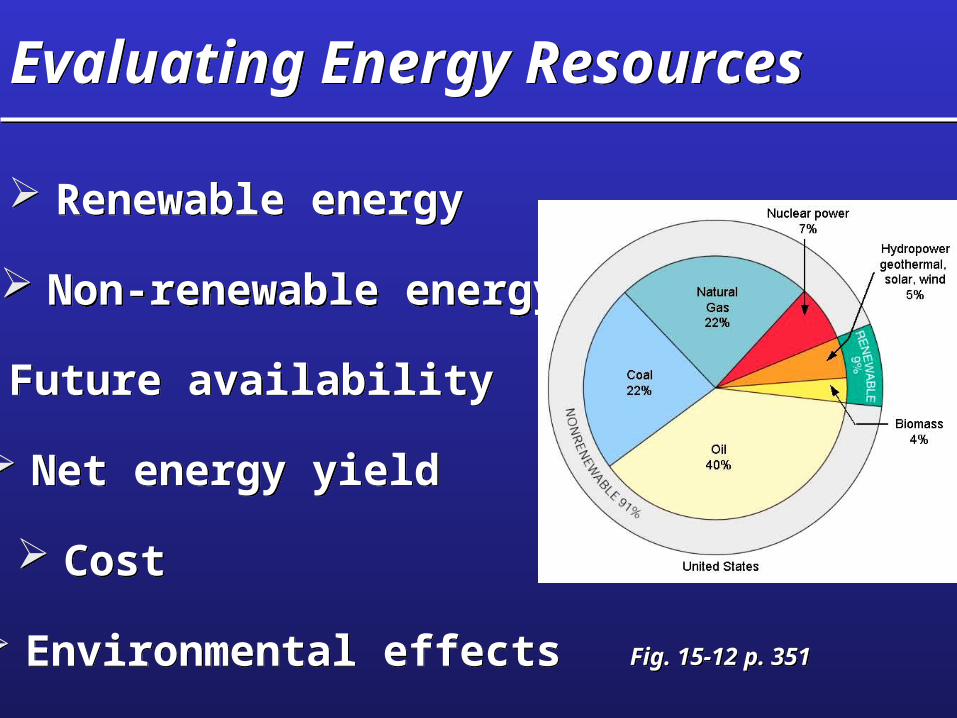
Evaluating Energy ResourcesEvaluating Energy Resources
Renewable energy Renewable energy
Non-renewable energy Non-renewable energy
Future availability Future availability
Net energy yield Net energy yield
Cost Cost
Environmental effects Environmental effects Fig. 15-12 p. 351Fig. 15-12 p. 351

Important Nonrenewable Energy SourcesImportant Nonrenewable Energy Sources
Fig. 15-10 p. 350Fig. 15-10 p. 350
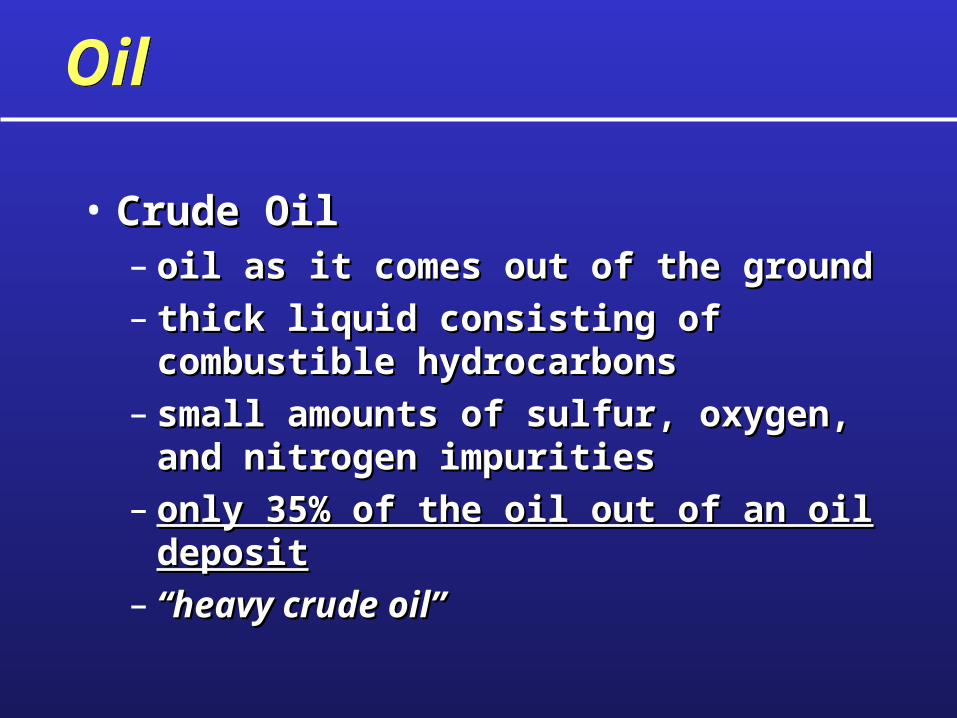
OilOil
• Crude OilCrude Oil– oil as it comes out of the groundoil as it comes out of the ground– thick liquid consisting of thick liquid consisting of
combustible hydrocarbonscombustible hydrocarbons– small amounts of sulfur, oxygen, small amounts of sulfur, oxygen,
and nitrogen impuritiesand nitrogen impurities– only 35% of the oil out of an oil only 35% of the oil out of an oil
depositdeposit– ““heavy crude oil”heavy crude oil”
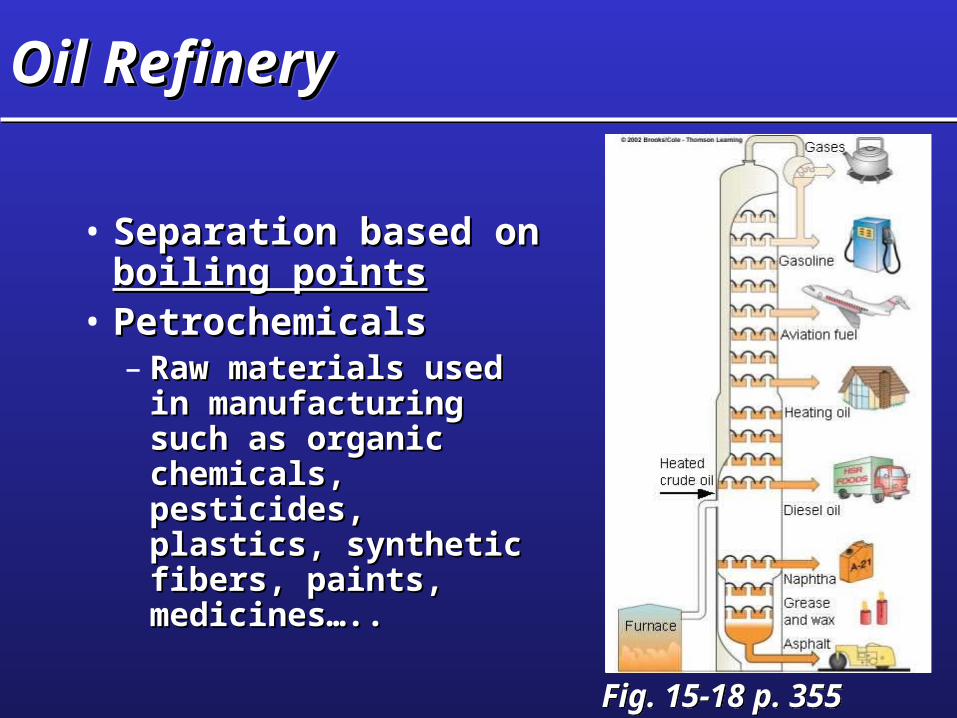
Oil RefineryOil RefineryOil RefineryOil Refinery
• Separation based Separation based on on boiling pointsboiling points
• PetrochemicalsPetrochemicals– Raw materials used Raw materials used
in manufacturing in manufacturing such as organic such as organic chemicals, chemicals, pesticides, plastics, pesticides, plastics, synthetic fibers, synthetic fibers, paints, medicines…..paints, medicines…..
Fig. 15-18 p. 355Fig. 15-18 p. 355
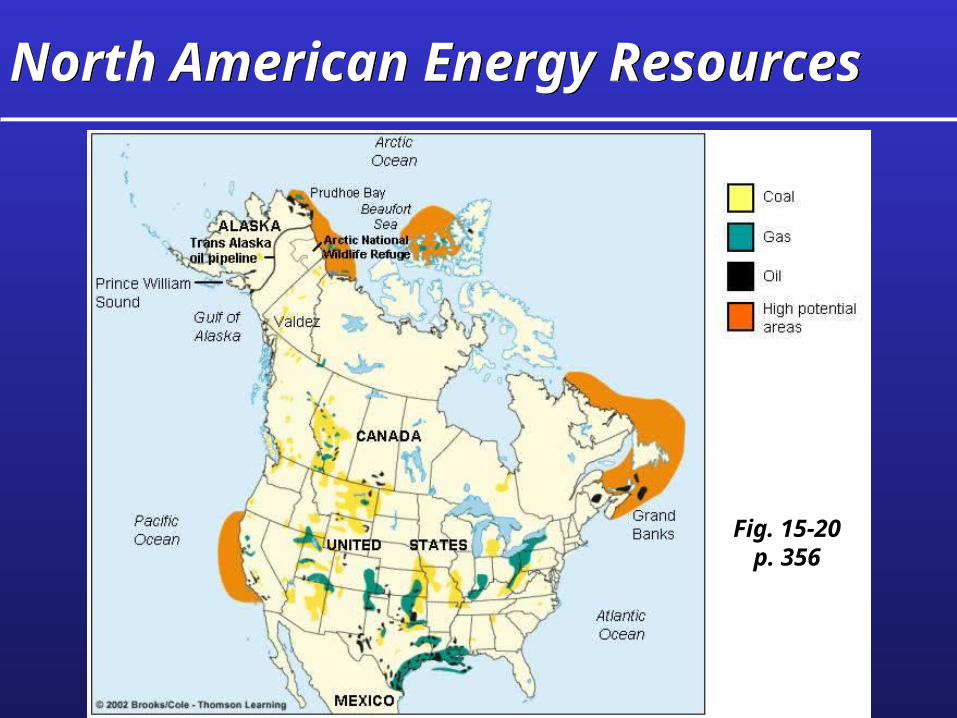
North American Energy ResourcesNorth American Energy Resources
Fig. 15-20p. 356
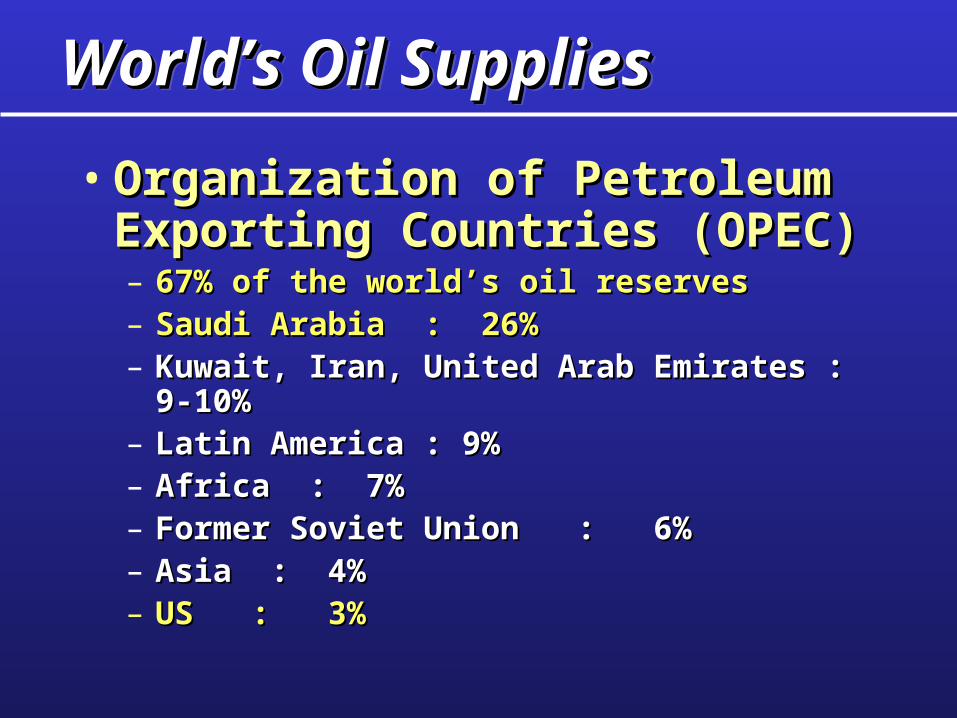
World’s Oil SuppliesWorld’s Oil SuppliesWorld’s Oil SuppliesWorld’s Oil Supplies
• Organization of Petroleum Organization of Petroleum Exporting Countries (OPEC)Exporting Countries (OPEC)– 67% of the world’s oil reserves67% of the world’s oil reserves– Saudi Arabia : 26%Saudi Arabia : 26%– Kuwait, Iran, United Arab Emirates : 9-Kuwait, Iran, United Arab Emirates : 9-
10%10%– Latin America : 9%Latin America : 9%– Africa : 7%Africa : 7%– Former Soviet Union : 6%Former Soviet Union : 6%– Asia : 4%Asia : 4%– US : 3%US : 3%
Oil
(mill
ion
bar
rels
pe r
da y
)60
50
30
20
10
1970 1980 1990 2000 2010
Year
40
2020
History Projections
0
History Projections
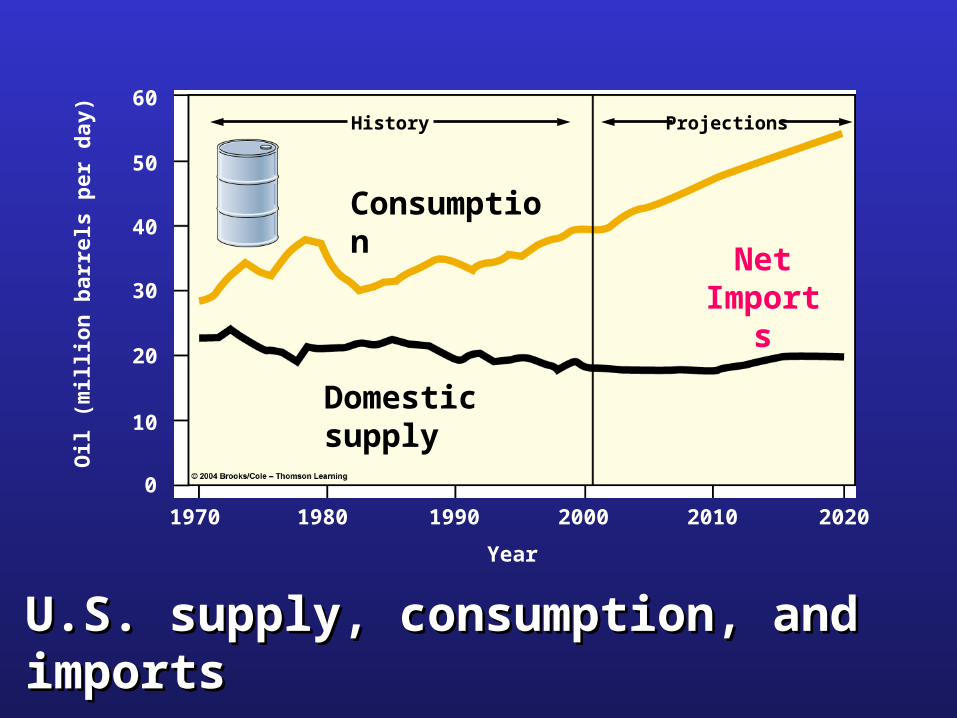
U.S. supply, consumption, and U.S. supply, consumption, and importsimports
Consumption
Domestic supply
Net Imports
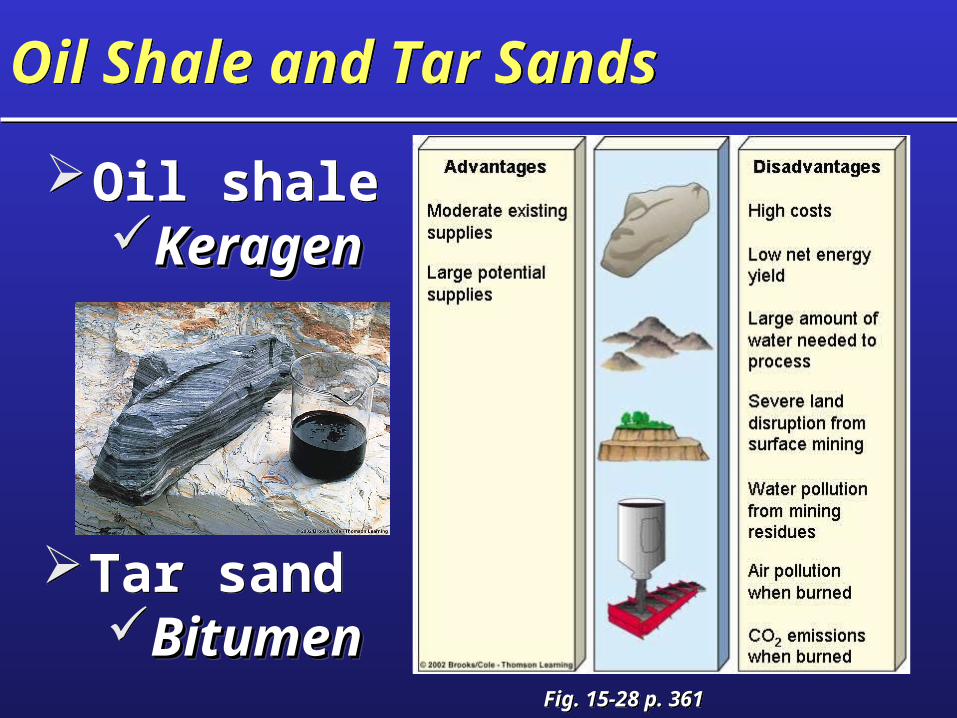
Oil Shale and Tar SandsOil Shale and Tar Sands
Oil shaleKeragen Keragen
Oil shaleKeragen Keragen
Tar sand BitumenBitumen
Tar sand BitumenBitumen
Fig. 15-28 p. 361Fig. 15-28 p. 361

Natural GasNatural Gas
• 50-90% Methane50-90% Methane• Conventional Conventional
natural gasnatural gas– Lies above crude Lies above crude
oil reservoirsoil reservoirs• Unconventional Unconventional
natural gasnatural gas– Found by itselfFound by itself– Methyl hydrateMethyl hydrate
• 200 year supply200 year supply
Fig. 15-29 p. 362Fig. 15-29 p. 362
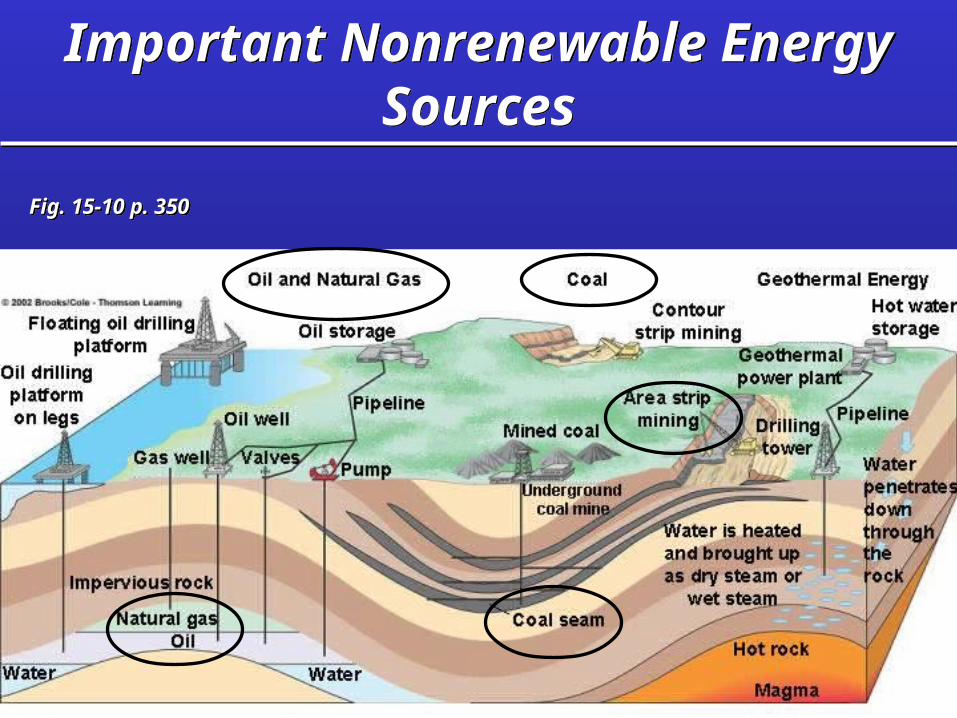
Important Nonrenewable Energy Sources
Important Nonrenewable Energy Sources
Fig. 15-10 p. 350Fig. 15-10 p. 350

CoalCoal
• Stages of coal formationStages of coal formation
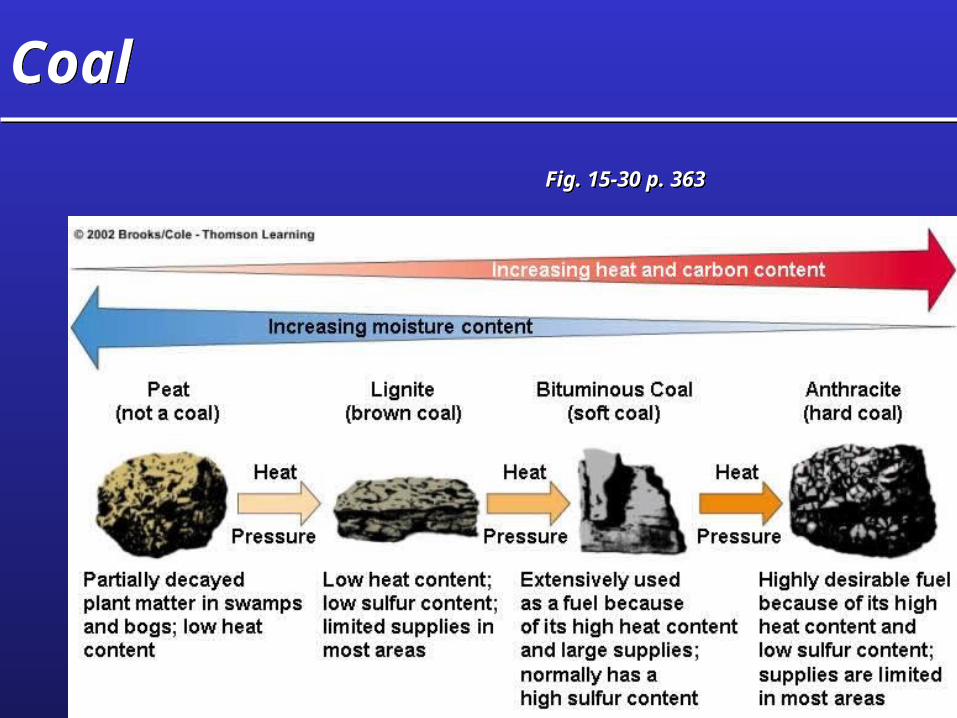
Fig. 15-30 p. 363Fig. 15-30 p. 363
CoalCoal
CoalCoal
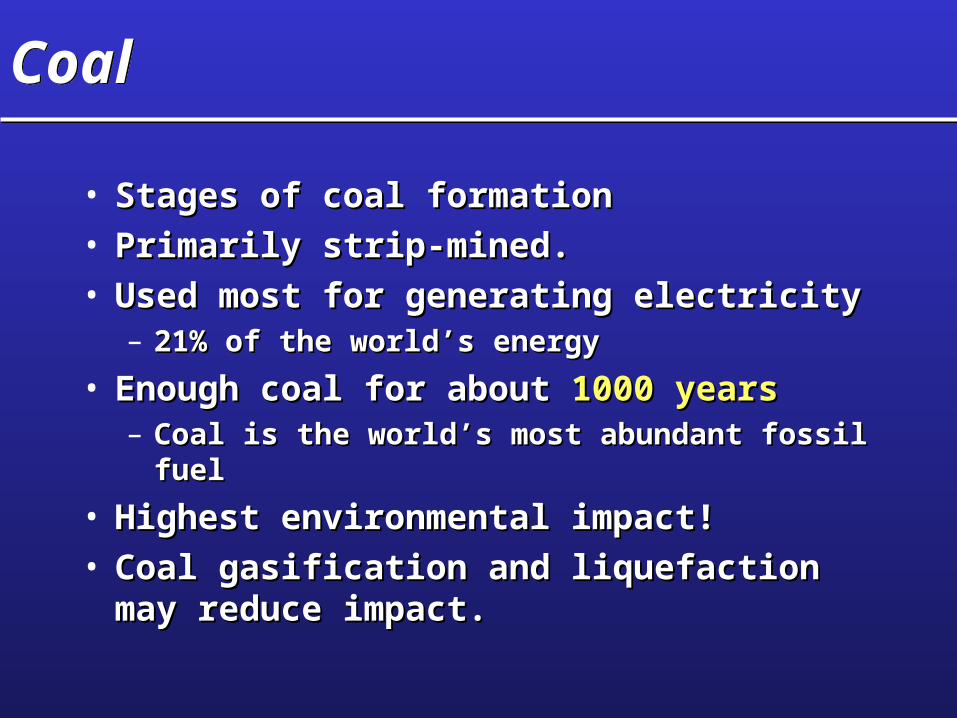
• Stages of coal formationStages of coal formation• Primarily strip-mined.Primarily strip-mined.• Used most for generating electricityUsed most for generating electricity
– 21% of the world’s energy21% of the world’s energy
• Enough coal for about Enough coal for about 1000 years1000 years– Coal is the world’s most abundant fossil Coal is the world’s most abundant fossil
fuelfuel
• Highest environmental impact!Highest environmental impact!• Coal gasification and liquefaction may Coal gasification and liquefaction may
reduce impact.reduce impact.
Burning Coal More CleanlyBurning Coal More Cleanly
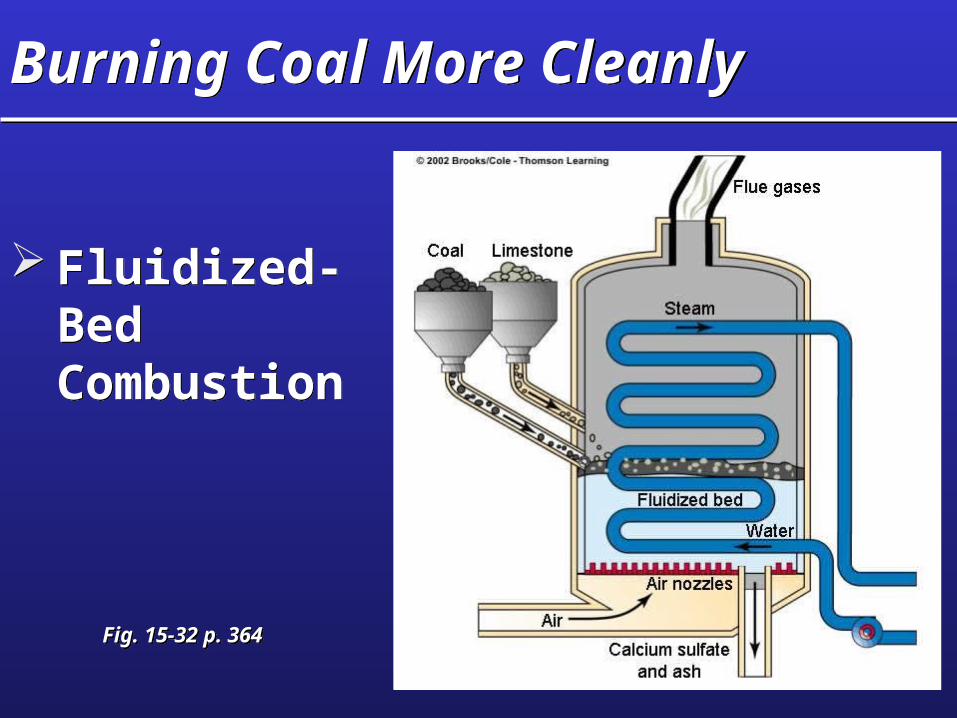
Fluidized-Bed Combustion
Fluidized-Bed Combustion
Fig. 15-32 p. 364Fig. 15-32 p. 364


NUCLEAR POWERNUCLEAR POWER
• President Dwight Eisenhower, 1953, “Atoms for Peace”speech.– Nuclear-powered electrical generators
would provide power “too cheap to meter.”• Between 1970 and 1974, American utilities
ordered 140 new reactors for power plants.
Nuclear PowerNuclear Power
• After 1975, only 13 orders were placed for new nuclear reactors, and all of those were subsequently cancelled.– In all, 100 of 140 reactors on order in 1975
were cancelled.• Construction costs, declining demand for
electrical power, safety fears• Electricity from nuclear power plants was
about half the price of coal in 1970, but twice as much in 1990.

Nuclear Power Plant HistoryNuclear Power Plant History
How Do Nuclear Reactors WorkHow Do Nuclear Reactors Work
• Most commonly used fuel is U235, a naturally occurring radioactive isotope of uranium.
• Occurs naturally at 0.7% of uranium, but must be enriched to about of 3%.
• Formed in cylindrical pellets (1.5 cm long) and stacked in hollow metal rods (4 m long).– About 100 rods and bundled together to make a
fuel assembly.– Thousands of fuel assemblies bundled in reactor
core.

How Do Nuclear Reactors WorkHow Do Nuclear Reactors Work
• When struck by neutrons, radioactive uranium atoms undergo nuclear fission (splitting) releasing energy and more neutrons.– Triggers nuclear chain reaction.

Nuclear FissionNuclear Fission

How Do Nuclear Reactors WorkHow Do Nuclear Reactors Work
• Reaction is moderated in a power plant by neutron-absorbing solution (Moderator).– In addition, Control Rods composed of
neutron-absorbing material are inserted into spaces between fuel assemblies to control reaction rate.• Cadmium or boron
– Water or other coolant is circulated between the fuel rods to remove excess heat.
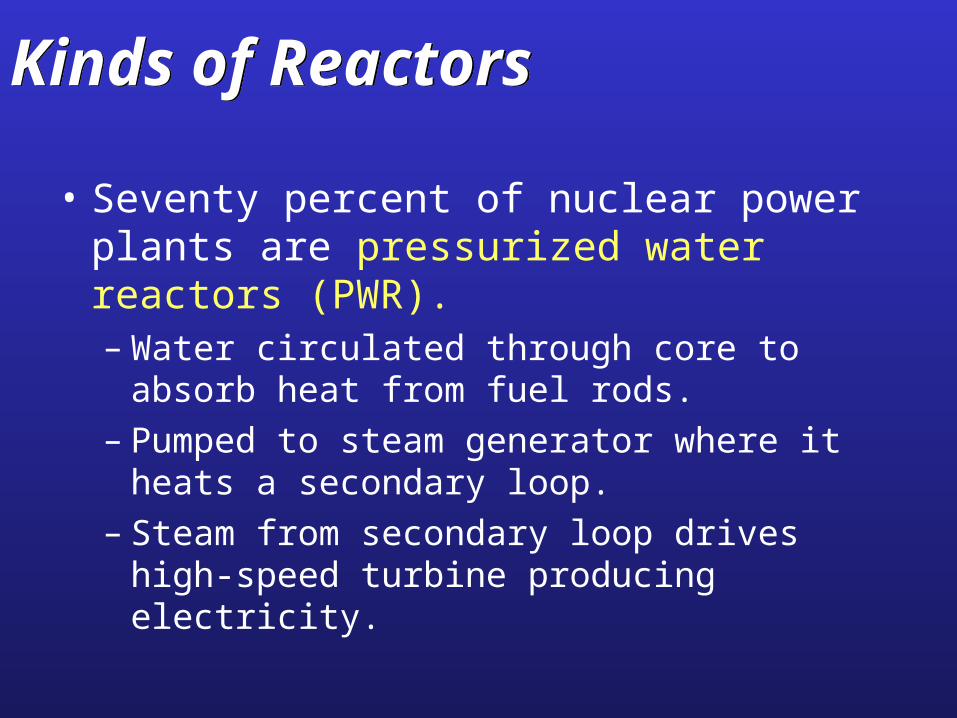
Kinds of ReactorsKinds of Reactors
• Seventy percent of nuclear power plants are pressurized water reactors (PWR).– Water circulated through core to absorb
heat from fuel rods.– Pumped to steam generator where it
heats a secondary loop.– Steam from secondary loop drives high-
speed turbine producing electricity.
Kinds of ReactorsKinds of Reactors
• Both reactor vessel and steam generator are housed in a special containment building preventing radiation from escaping, and providing extra security in case of accidents.– Under normal operating conditions, a
PWR releases very little radioactivity.
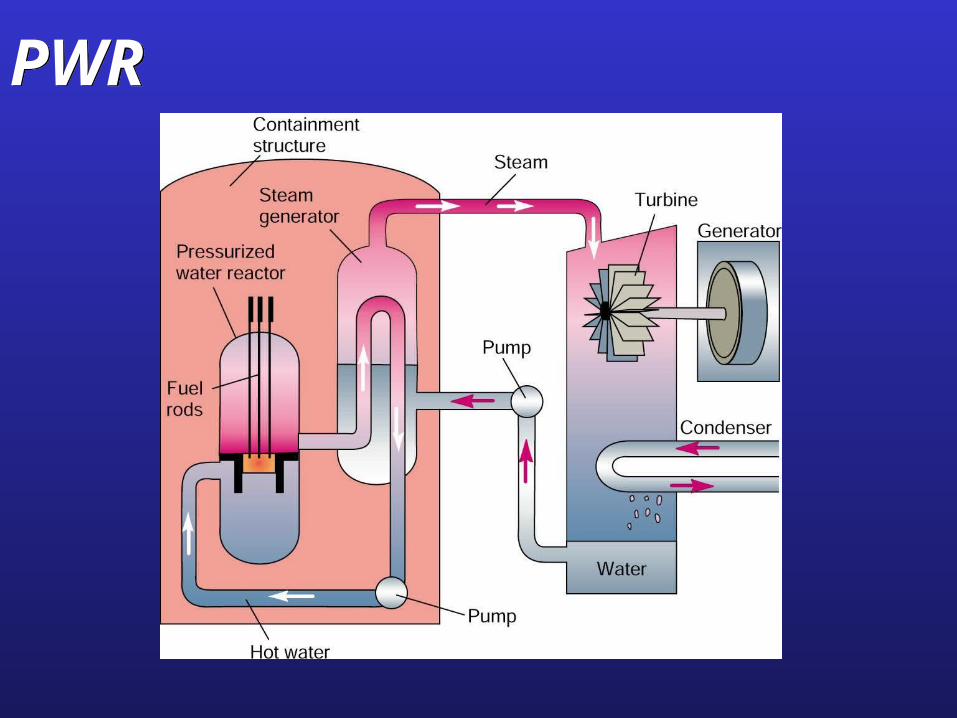
PWRPWR
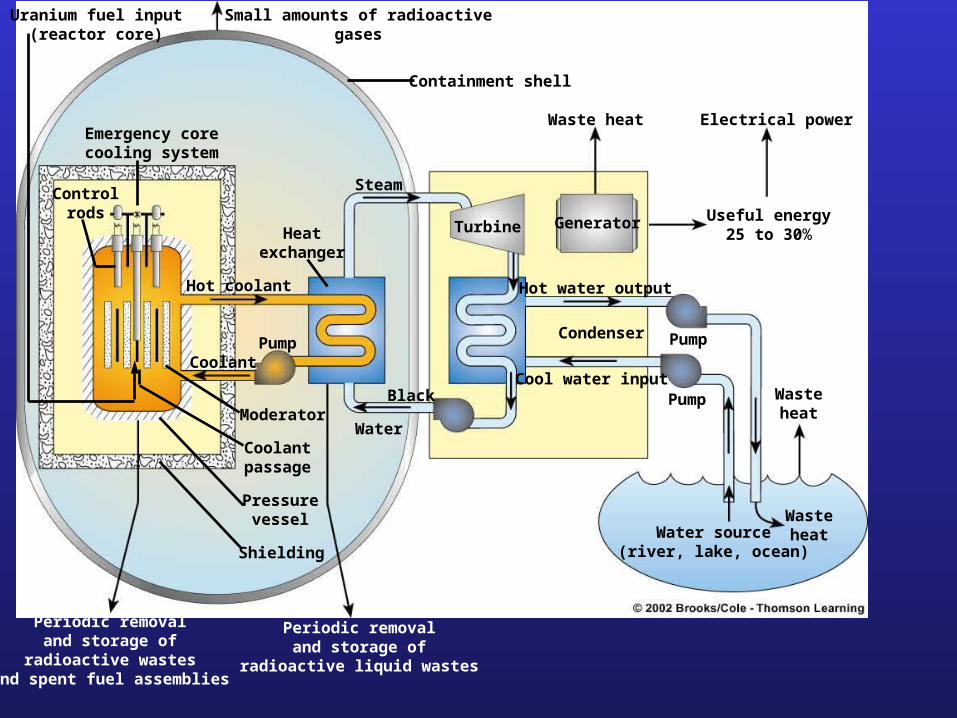
Periodic removaland storage of
radioactive wastesand spent fuel assemblies
Periodic removaland storage of
radioactive liquid wastes
Pump
Steam
Small amounts of radioactive gases
Water
Black
Turbine Generator
Waste heat Electrical power
Hot water output
Condenser
Cool water input
Pump
Pump Wasteheat
Useful energy25 to 30%
WasteheatWater source
(river, lake, ocean)
Heatexchanger
Containment shell
Uranium fuel input(reactor core)
Emergency corecooling system
Controlrods
Moderator
Pressurevessel
Shielding
Coolantpassage
CoolantCoolant
Hot coolantHot coolant
Kinds of ReactorsKinds of Reactors
• Simpler, but more dangerous design is a boiling water reactor (BWR).– Water from core boils to make steam, directly
driving turbine generators.– Highly radioactive water and steam leave
containment structure.
• Canadian deuterium reactors - Operate with natural, un-concentrated uranium.
• Graphite moderator reactors - Operate with a solid moderator instead of a liquid.
Alternative Reactor DesignsAlternative Reactor Designs
• High-Temperature, Gas-Cooled Reactors– Uranium encased in tiny ceramic-coated
pellets.
• Process-Inherent Ultimate Safety Reactors– Reactor core submerged in large pool of
boron-containing water within a massive pressure vessel.

Breeder ReactorsBreeder Reactors
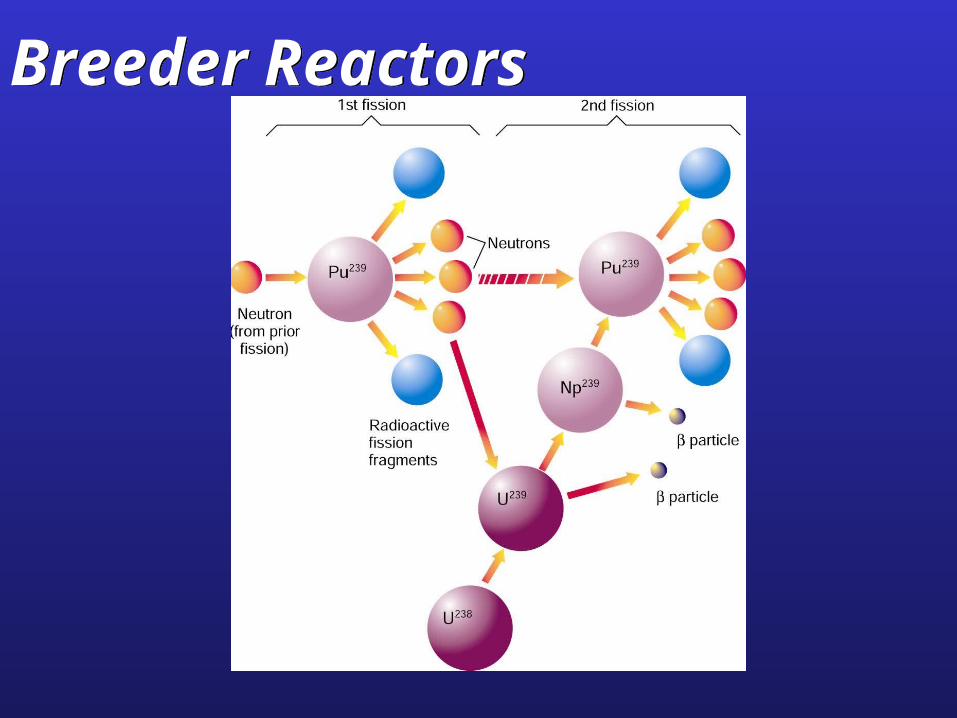
• Breeder reactors create fissionable plutonium and thorium isotopes from stable forms of uranium.– Uses plutonium reclaimed from spent
fuel from conventional fission reactors as starting material.
Breeder ReactorsBreeder Reactors

Breeder Reactor DrawbacksBreeder Reactor Drawbacks
• Reactor core must be at very high density, thus liquid sodium used as a coolant.– Corrosive and difficult to handle.
• Core will self-destruct within a few seconds if primary coolant is lost.
• Produces weapons-grade plutonium.
RADIOACTIVE WASTE MANAGEMENTRADIOACTIVE WASTE MANAGEMENT
• Until 1970, the US, Britain, France, and Japan disposed of radioactive waste in the ocean.
• Production of 1,000 tons of uranium fuel typically generates 100,000 tons of tailings and 3.5 million liters of liquid waste.– Now approximately 200 million tons of
radioactive waste in piles around mines and processing plants in the US.
Radioactive Waste ManagementRadioactive Waste Management
• About 100,000 tons of low-level waste (clothing) and about 15,000 tons of high-level (spent-fuel) waste in the US.– For past 20 years, spent fuel assemblies
have been stored in deep water-filled pools at the power plants. (Designed to be “temporary”.)• Many internal pools are now filled and a
number plants are storing nuclear waste in metal dry casks outside.

Radioactive Waste ManagementRadioactive Waste Management
• US Department of Energy announced plans to build a high-level waste repository near Yucca Mountain Nevada in 1987.– Facility may cost
between $10 and 35 billion, and will not open until at least 2015.
Decommissioning Old Nuclear PlantsDecommissioning Old Nuclear Plants
• Most plants are designed for a 30 year operating life.– Only a few plants have thus far been
decommissioned.– General estimates are costs will be 2-10
times more than original construction costs.
CHANGING FORTUNESCHANGING FORTUNES
• Public opinion has fluctuated over the years.– When Chernobyl exploded in 1985, less
than one-third of Americans favored nuclear power.• Now, half of all Americans support nuclear-
energy.
• Currently, 103 nuclear reactors produce about 20% of all electricity consumed in the US.

Changing FortunesChanging Fortunes
• With natural gas prices soaring, and electrical shortages looming, many sectors are once again promoting nuclear reactors.– Over the past 50 years, the US
government has provided $150 billion in nuclear subsidies, but less than $5 billion to renewable energy research.

NUCLEAR FUSIONNUCLEAR FUSION• Nuclear Fusion - Energy released when two
smaller atomic nuclei fuse into one large nucleus. (Sun)
– Duterium and tritium, two heavy isotopes of H
– Temperatures must be raised to 100,000,000o C and pressure must reach several billion atmospheres.
– Advantages:• Production of few radioactive wastes• Elimination of products that could be made into bombs• Fuel supply that is larger and less hazardous than
uranium.
NUCLEAR FUSIONNUCLEAR FUSION
Despite 50 years and $25 billion, fusion reactors have never produced more energy than they consume!
US Energy PolicyUS Energy Policy
• Oil, coal, and natural gas remain the United States’ primary energy resources.
• Support the use of nuclear power as an environmentally friendly way to increase energy supplies.

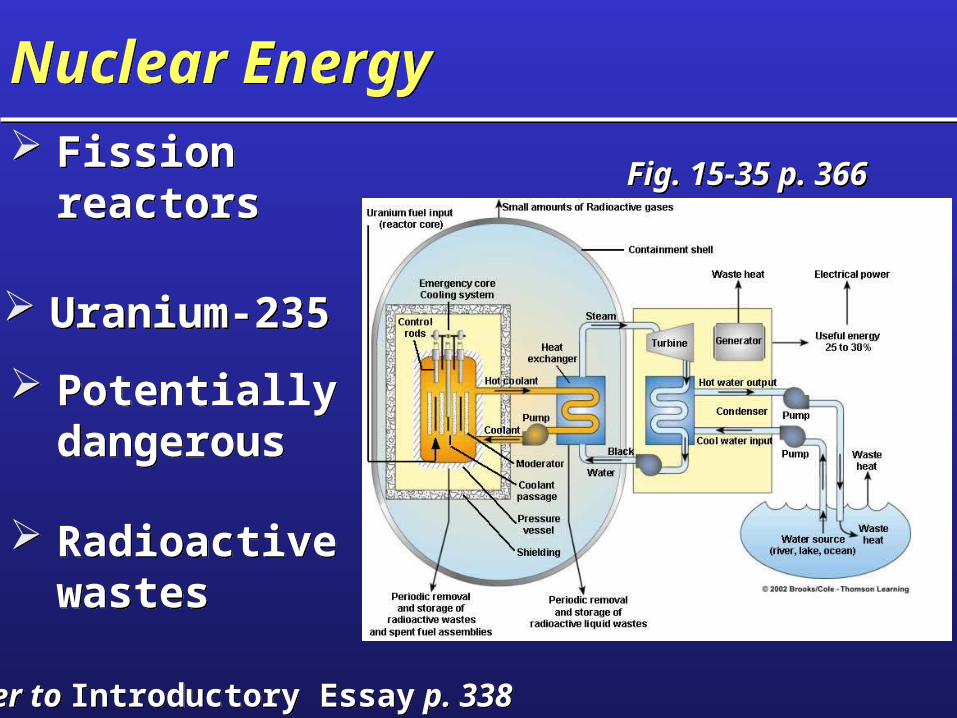
Nuclear EnergyNuclear Energy Fission
reactors Fission
reactors
Uranium-235 Uranium-235
Potentially dangerous
Potentially dangerous
Radioactive wastes
Radioactive wastes
Refer to Introductory Essay p. 338Refer to Introductory Essay p. 338
Fig. 15-35 p. 366Fig. 15-35 p. 366
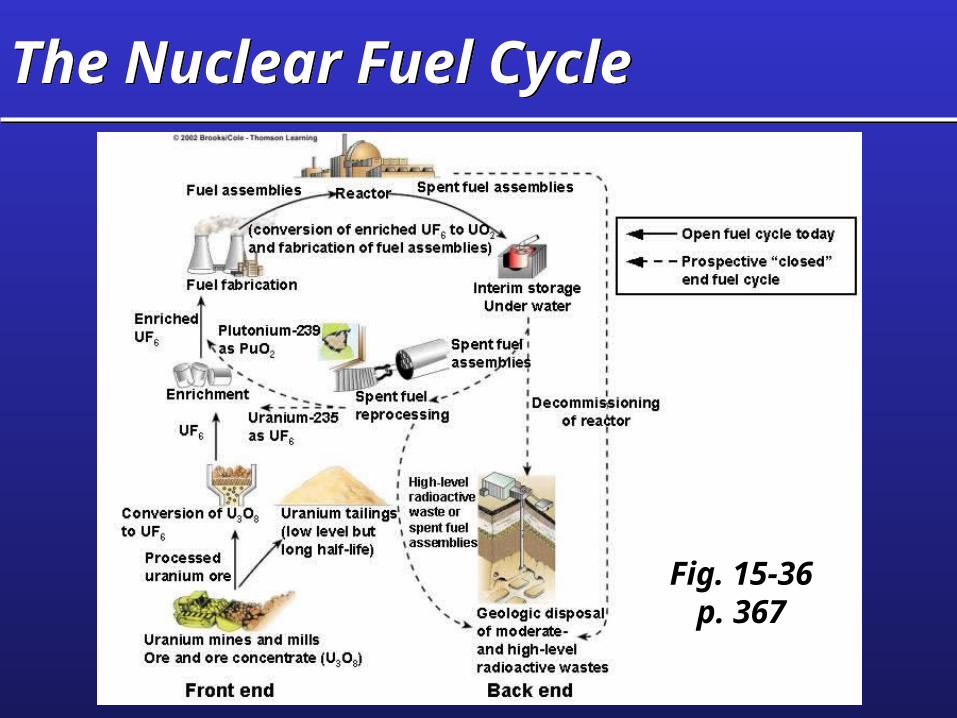
The Nuclear Fuel CycleThe Nuclear Fuel Cycle
Fig. 15-36p. 367

Dealing with Nuclear WasteDealing with Nuclear Waste
• Low-level wasteLow-level waste• High-level wasteHigh-level waste• Underground Underground
burialburial• Disposal in spaceDisposal in space• Burial in ice sheetsBurial in ice sheets• Dumping into Dumping into
subduction zonessubduction zones• Burial in ocean mudBurial in ocean mud• Conversion into Conversion into
harmless materialsharmless materials
Fig. 15-40p. 370

Nuclear AlternativesNuclear Alternatives
Breeder nuclear fission reactors
Breeder nuclear fission reactors
Nuclear fusion
Nuclear fusion New reactor designs
New reactor designsStorage Containers
Fuel rod
Primary canister
Overpackcontainersealed
Underground
Buried and capped
Ground Level
Unloaded from train
Lowered down shaft
Personnal elevatorAir shaft
Nuclear waste shaft
Fig. 15-42p. 376
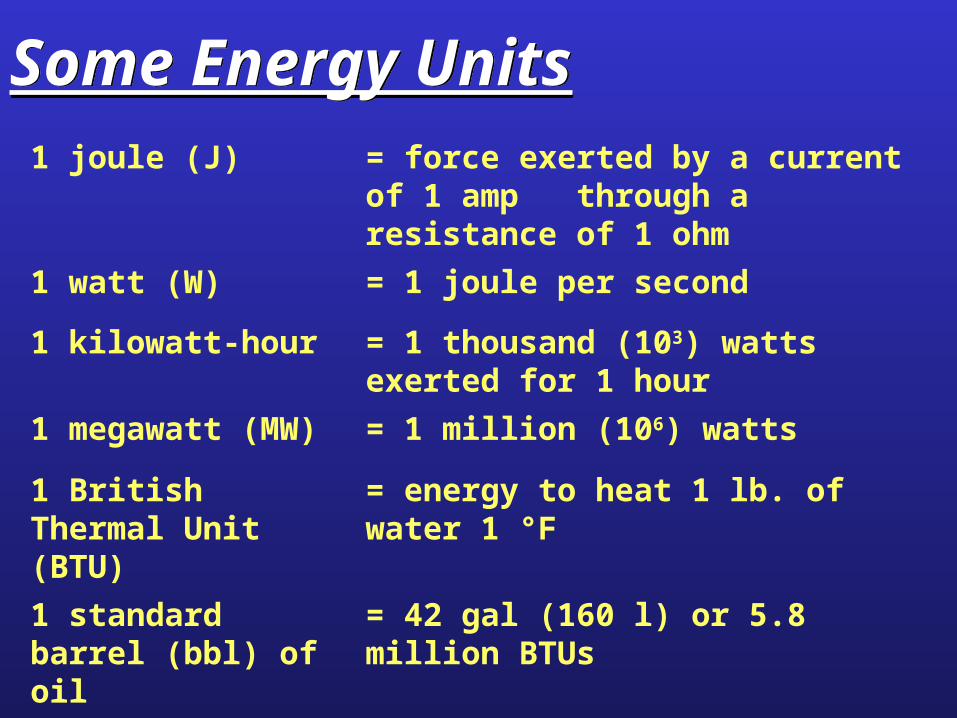
Some Energy UnitsSome Energy Units1 joule (J) = force exerted by a current of
1 amp through a resistance of 1 ohm
1 watt (W) = 1 joule per second
1 kilowatt-hour = 1 thousand (103) watts exerted for 1 hour
1 megawatt (MW)
= 1 million (106) watts
1 British Thermal Unit (BTU)
= energy to heat 1 lb. of water 1 °F
1 standard barrel (bbl) of oil
= 42 gal (160 l) or 5.8 million BTUs
1 metric ton of coal
= 27.8 million BTU or 4.8 bbl oil