Embed Size (px)
Citation preview
Air and Air PollutionAir and Air Pollution
G. Tyler Miller’sLiving in the Environment
13th Edition
Chapter 17
G. Tyler Miller’sLiving in the Environment
13th Edition
Chapter 17
INDICATOR SPECIESINDICATOR SPECIES
• Lichens are PIONEER ORGANISMS
• Lichens are a good example of MUTUALISM
• Lichens are good indicators of air pollution because they:– Are long lived– Are found in almost every ecosystem– Are non-motile– Absorb air
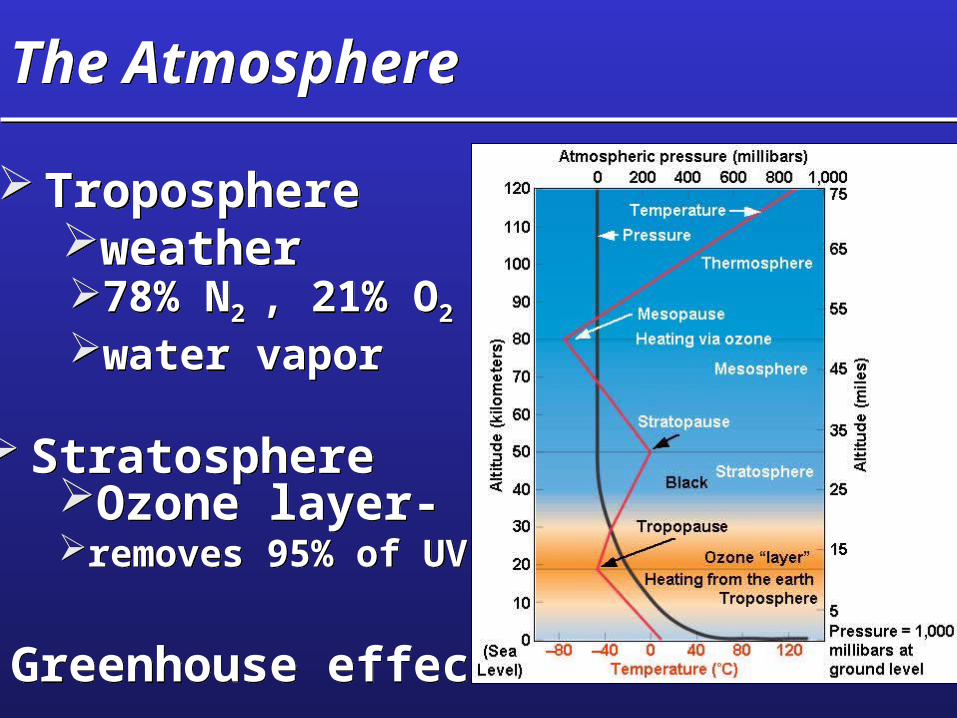
The AtmosphereThe Atmosphere
Troposphereweather
Troposphereweather
Stratosphere Stratosphere
78% N2 , 21% O2
water vapor
78% N2 , 21% O2
water vapor
Ozone layer-removes 95% of UV
Ozone layer-removes 95% of UV
Greenhouse effect Greenhouse effect
Alt
itu
de
(k
ilom
ete
rs)
Ozone concentration (ppm)
Alt
itu
de
(m
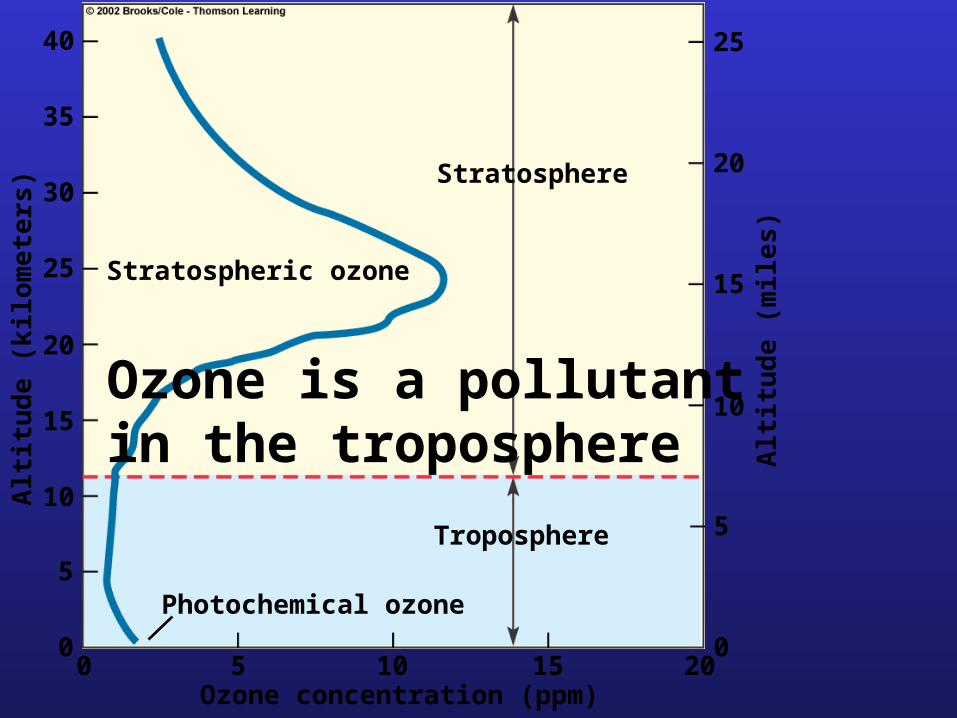
iles)Stratospheric ozone
Stratosphere
Troposphere
40
35
30
25
20
15
10
5
00 5 10 15 20
0
5
10
15
20
25
Photochemical ozone
Ozone is a pollutant in the troposphere
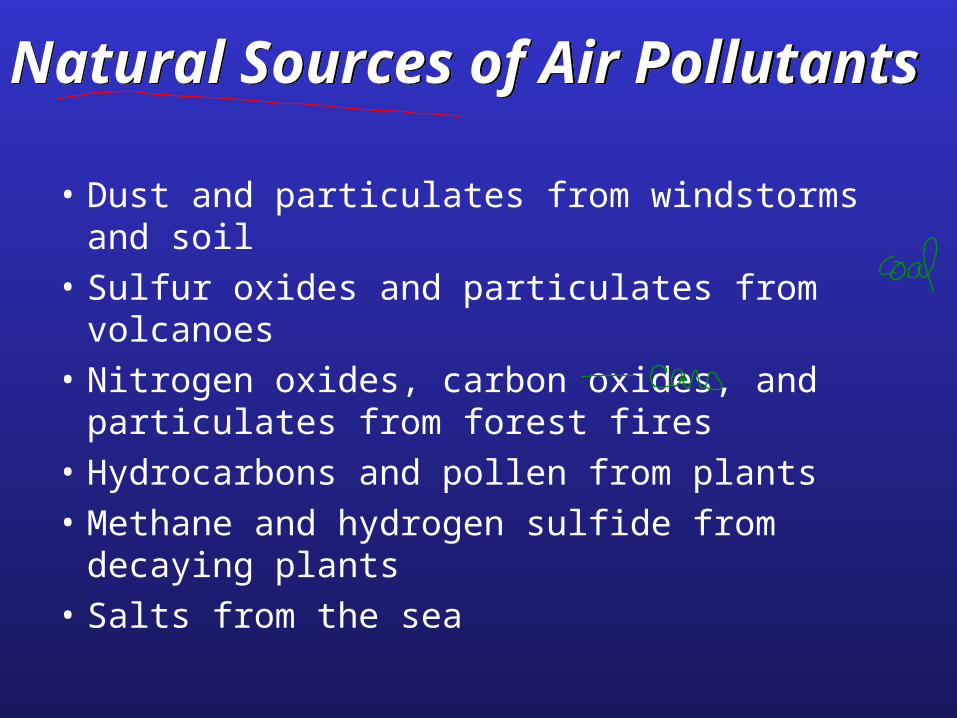
Natural Sources of Air PollutantsNatural Sources of Air Pollutants
• Dust and particulates from windstorms and soil
• Sulfur oxides and particulates from volcanoes
• Nitrogen oxides, carbon oxides, and particulates from forest fires
• Hydrocarbons and pollen from plants
• Methane and hydrogen sulfide from decaying plants
• Salts from the sea
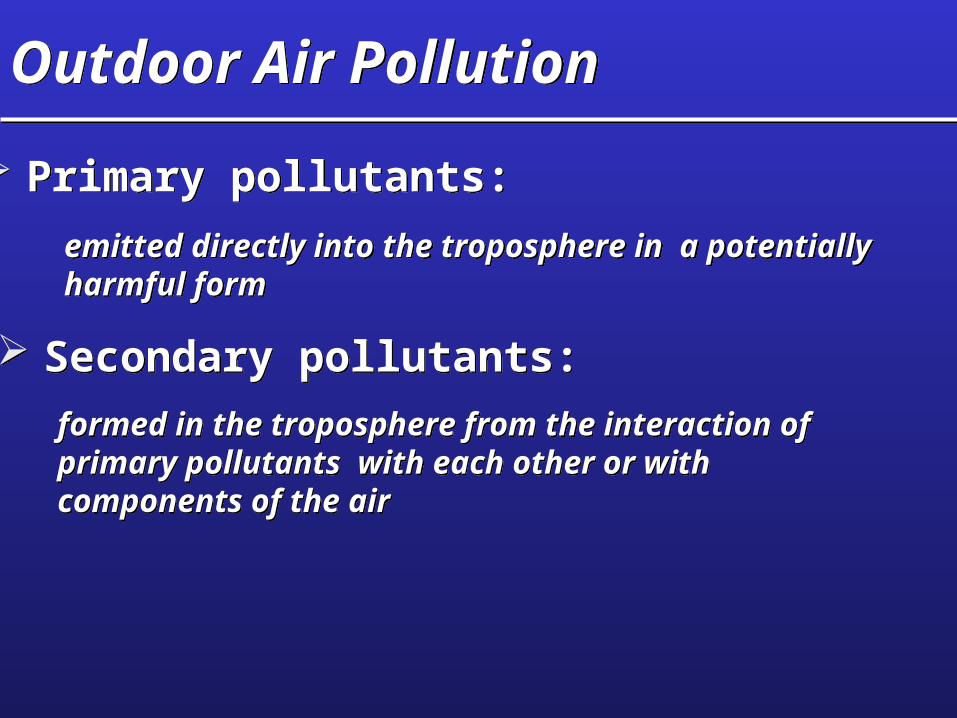
Outdoor Air PollutionOutdoor Air Pollution
Primary pollutants: Primary pollutants:
Secondary pollutants: Secondary pollutants:
emitted directly into the troposphere in a potentially harmful formemitted directly into the troposphere in a potentially harmful form
formed in the troposphere from the interaction of primary pollutants with each other or with components of the air
formed in the troposphere from the interaction of primary pollutants with each other or with components of the air
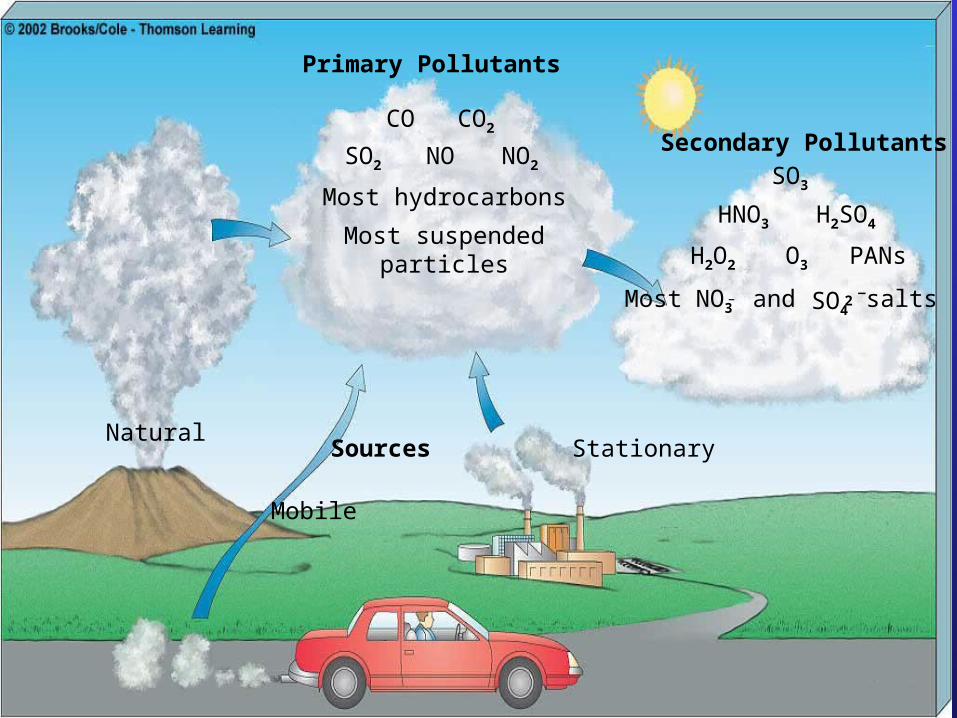
Primary Pollutants
Secondary Pollutants
SourcesNatural
Stationary
CO CO2
SO2 NO NO2
Most hydrocarbons
Most suspendedparticles
SO3
HNO3 H2SO4
H2O2 O3 PANs
Most and saltsNO3–
Mobile
SO42 –
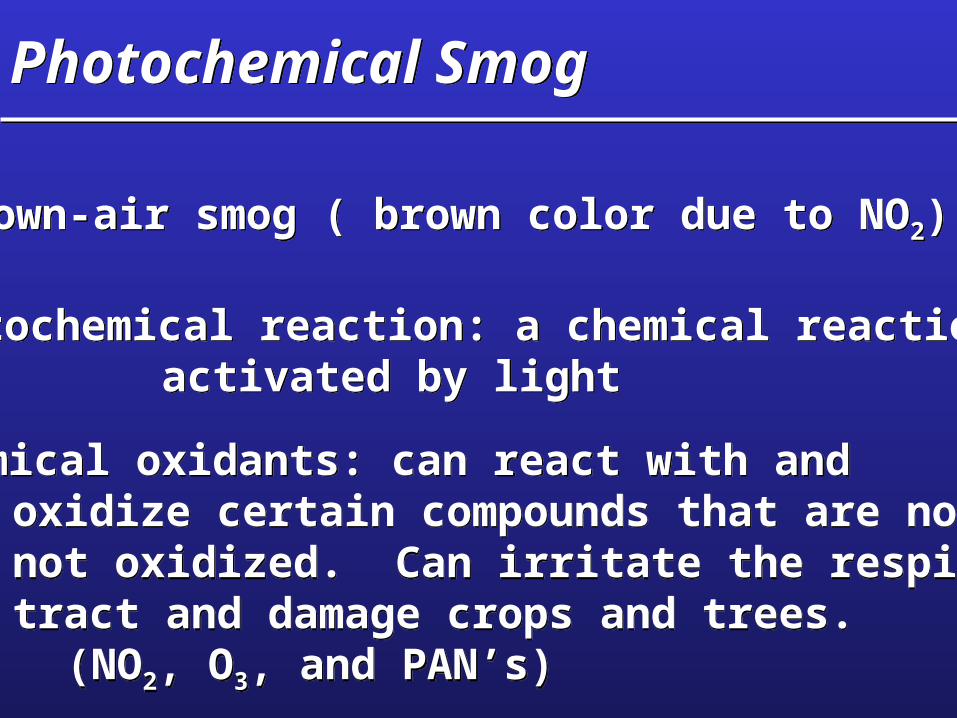
Photochemical SmogPhotochemical Smog
Brown-air smog ( brown color due to NO2) Brown-air smog ( brown color due to NO2)
Photochemical reaction: a chemical reaction activated by light
Photochemical reaction: a chemical reaction activated by light
Photochemical oxidants: can react with and oxidize certain compounds that are normally not oxidized. Can irritate the respiratory tract and damage crops and trees.
(NO2, O3, and PAN’s)
Photochemical oxidants: can react with and oxidize certain compounds that are normally not oxidized. Can irritate the respiratory tract and damage crops and trees.
(NO2, O3, and PAN’s)

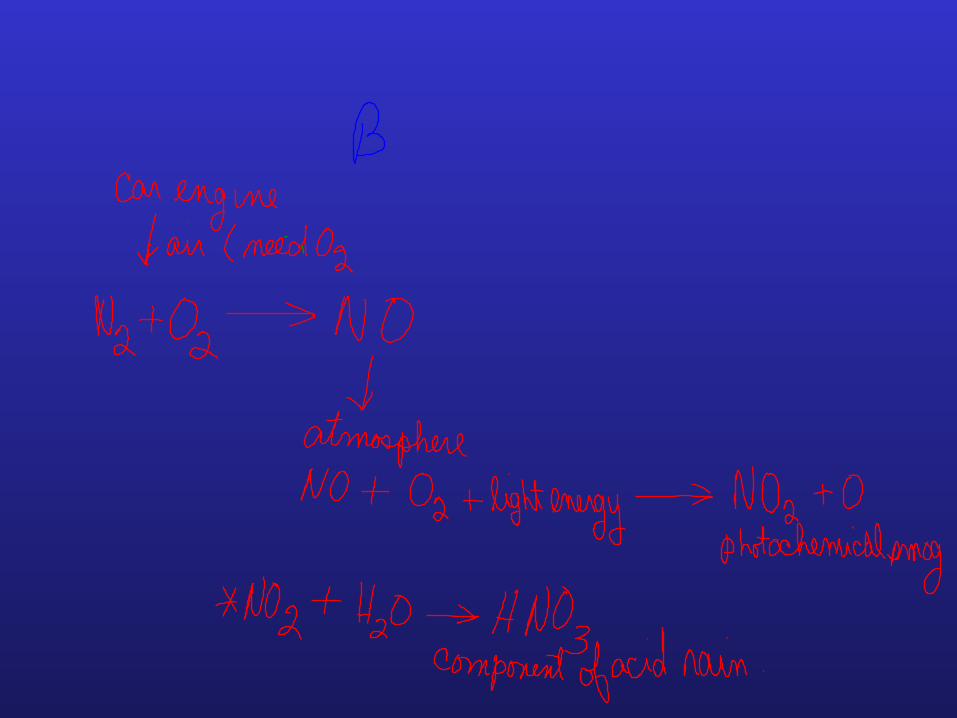
Photochemical SmogPhotochemical Smog• N2 + O2 2NO (colorless gas formed from the
combustion of N2 within an engine or boiler)• 2NO + O2 2NO2 (noxious yellowish-brown gas
formed in the troposphere in the presence of sunlight)• 3NO2 + H2O 2HNO3 (acid rain) + NO• NO2 + UV radiation NO + O• O + O2 O3 (in troposphere is a pollutant)• Aldehydes and PAN’s (peroxyacyl nitrates) are
formed from the interaction of several primary and secondary pollutants
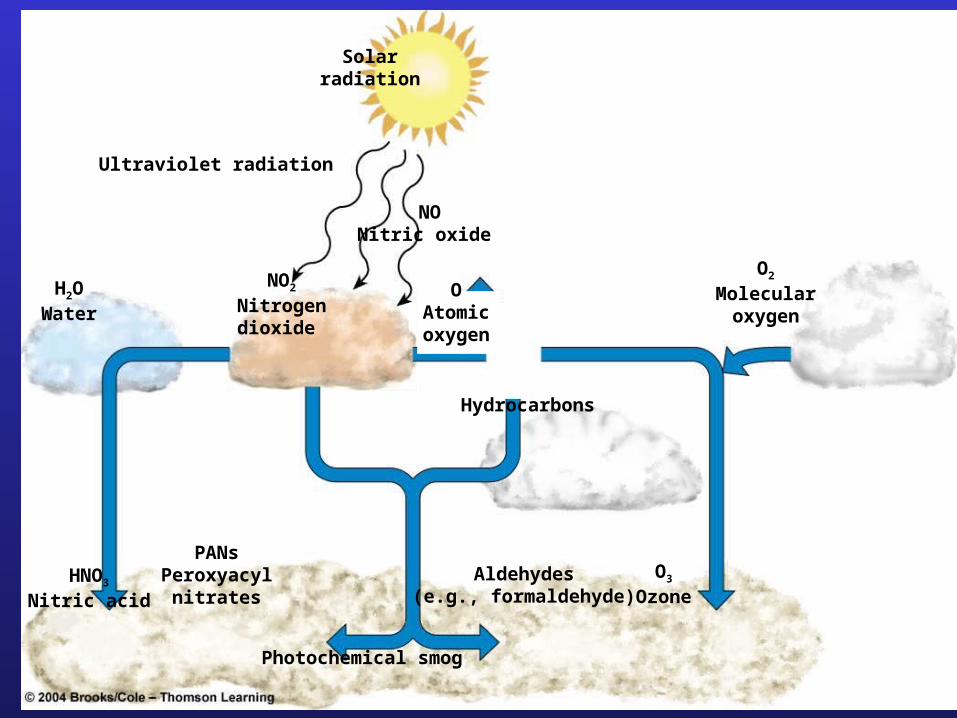
Solarradiation
Ultraviolet radiation
NONitric oxide
Photochemical smog
H2OWater
NO2
Nitrogendioxide
Hydrocarbons
O2
Molecularoxygen
HNO3
Nitric acid
PANsPeroxyacyl
nitratesAldehydes
(e.g., formaldehyde)O3
Ozone
OAtomicoxygen
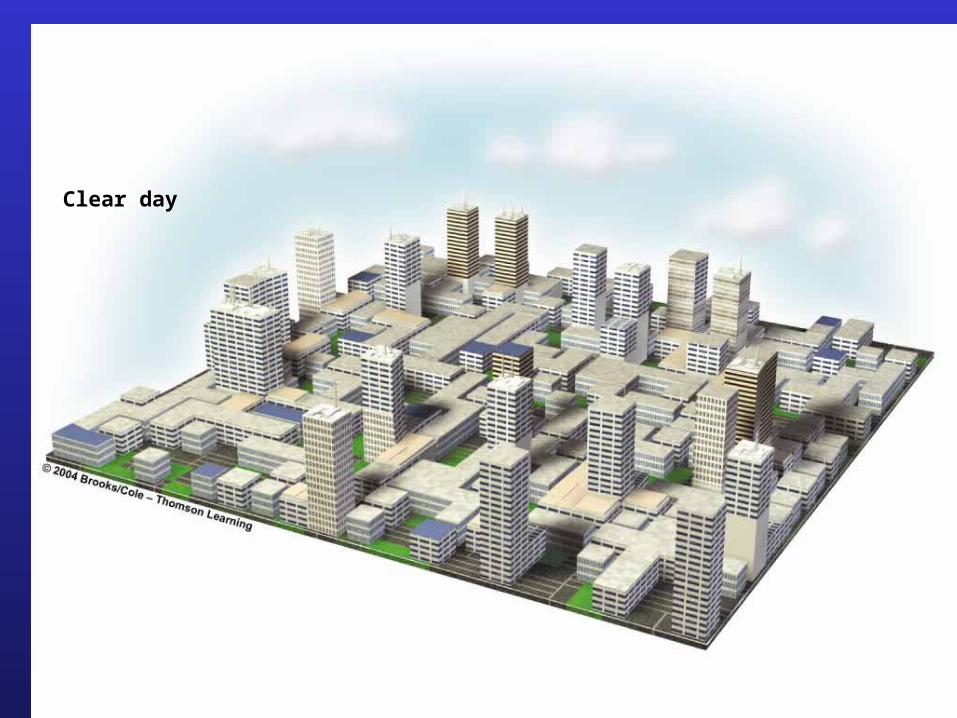
Clear day
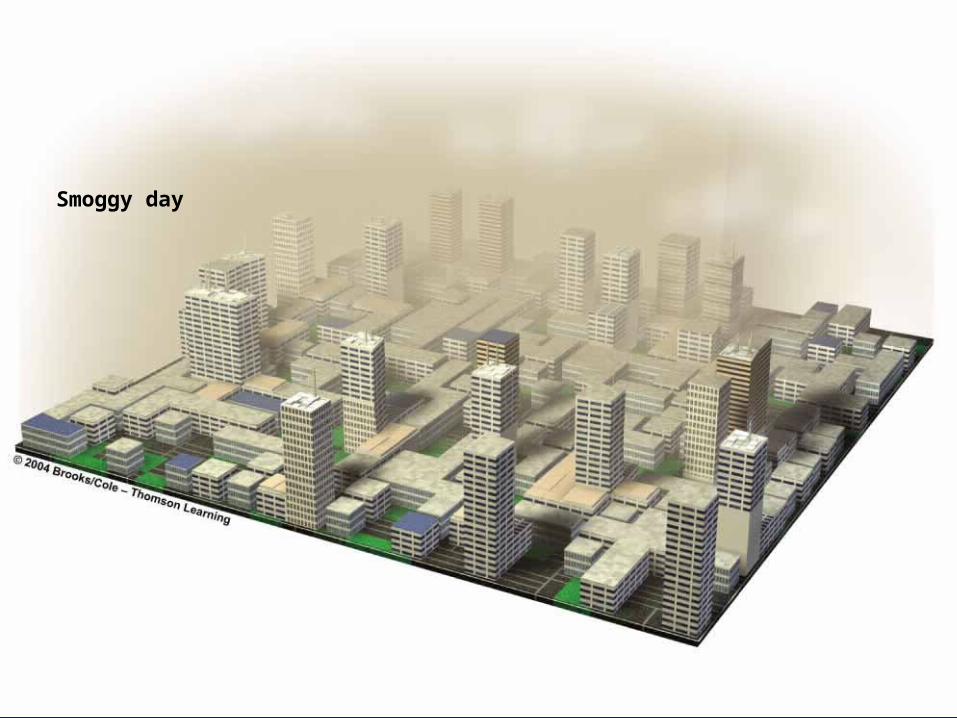
Smoggy day
Photochemical SmogPhotochemical Smog
• Worse in afternoon when sun is strongest
• Worse in warm sunny climates
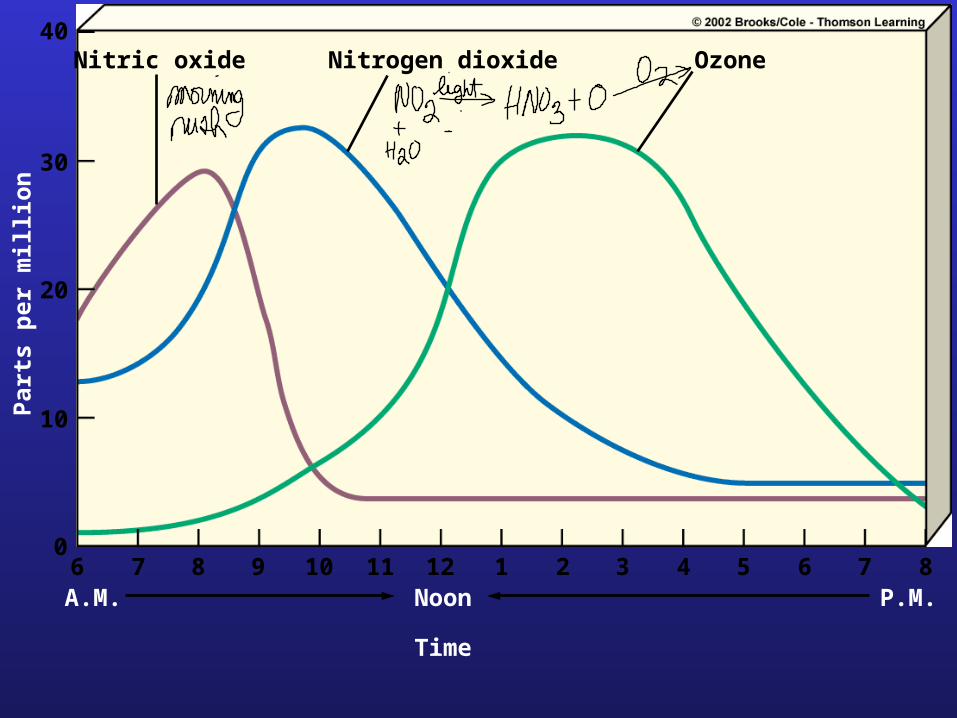
Nitric oxide Nitrogen dioxide Ozone40
30
20
10
06 7 8 9 10 11 12 1 2 3 4 5 6 7 8A.M. Noon P.M.
Time
Par
ts p
er m
illi
on
Industrial Smog (burning coal)Industrial Smog (burning coal)
Gray-air smogGray-air smog
Industrial smogIndustrial smog
Sulfuric acidSulfuric acid
Sulfur dioxideSulfur dioxide
ParticulatesParticulates
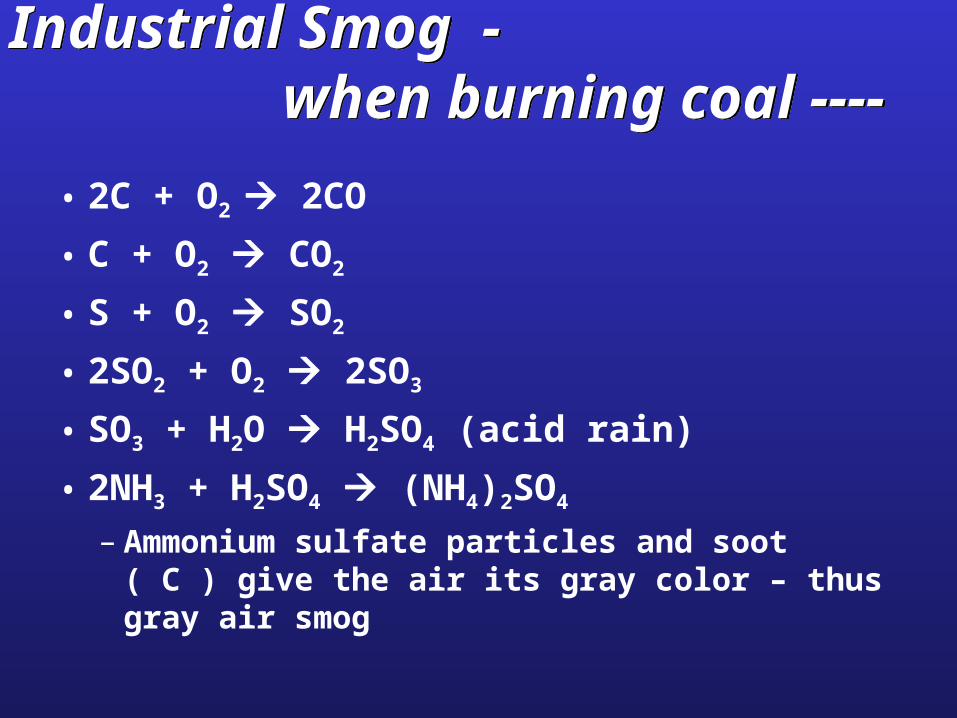
Industrial Smog - when burning coal ----Industrial Smog - when burning coal ----
• 2C + O2 2CO
• C + O2 CO2
• S + O2 SO2
• 2SO2 + O2 2SO3
• SO3 + H2O H2SO4 (acid rain)
• 2NH3 + H2SO4 (NH4)2SO4
– Ammonium sulfate particles and soot ( C ) give the air its gray color – thus gray air smog
Industrial Smog Industrial Smog
• Is a problem in urban industrialized areas where coal is burned– China– India– Ukraine
Smog Frequency and SeveritySmog Frequency and Severity
• Depend upon:– Local climate and topography– Population density– Amount of industry– Type of fuels used
Precipitation and wind clean the air.
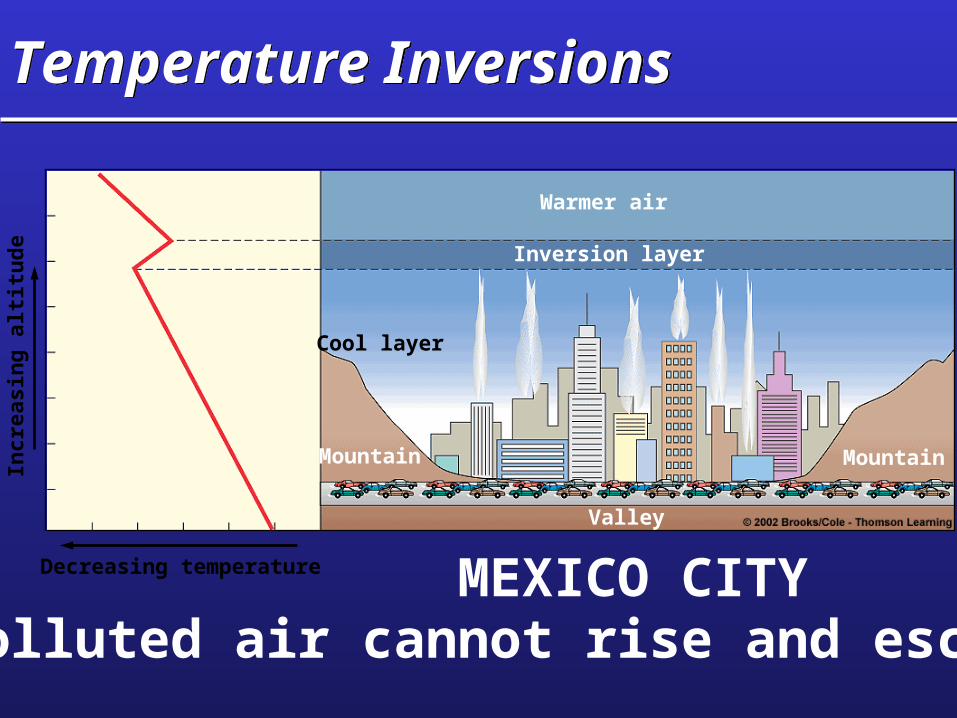
Temperature InversionsTemperature Inversions
Warmer air
Inversion layer
Cool layer
MountainMountain
Valley
Decreasing temperature
Incr
easi
ng
alt
itu
de
Polluted air cannot rise and escapeMEXICO CITY
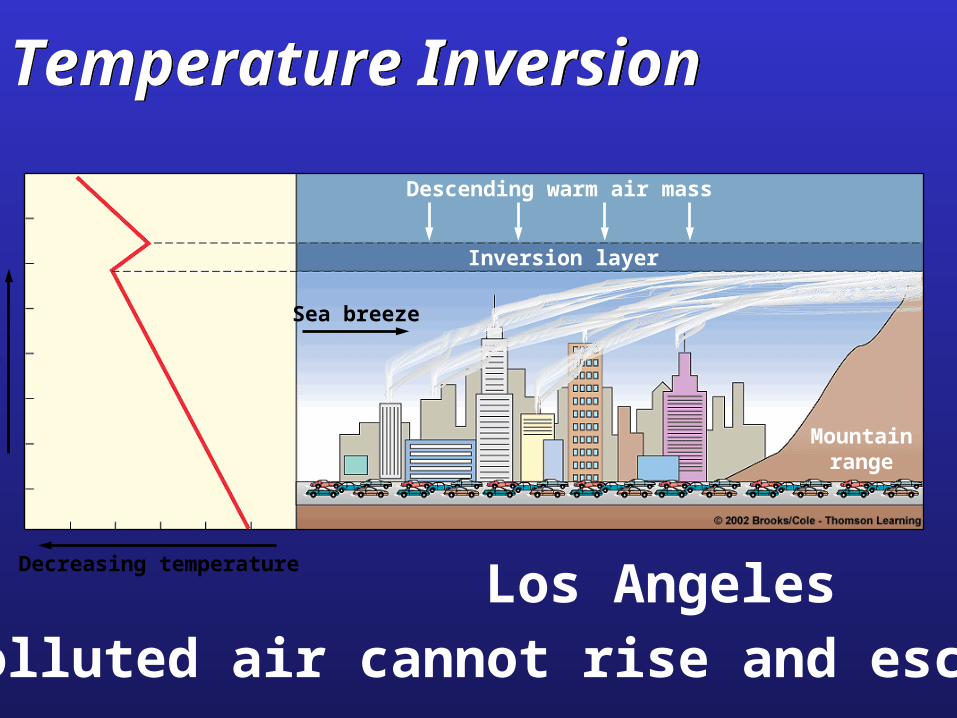
Temperature InversionTemperature Inversion
Inversion layer
Mountainrange
Sea breeze
Descending warm air mass
Decreasing temperature
Incr
easi
ng
alt
itu
de
Polluted air cannot rise and escape
Los Angeles
Regional Outdoor Air Pollution from Acid DepositionRegional Outdoor Air Pollution from Acid Deposition
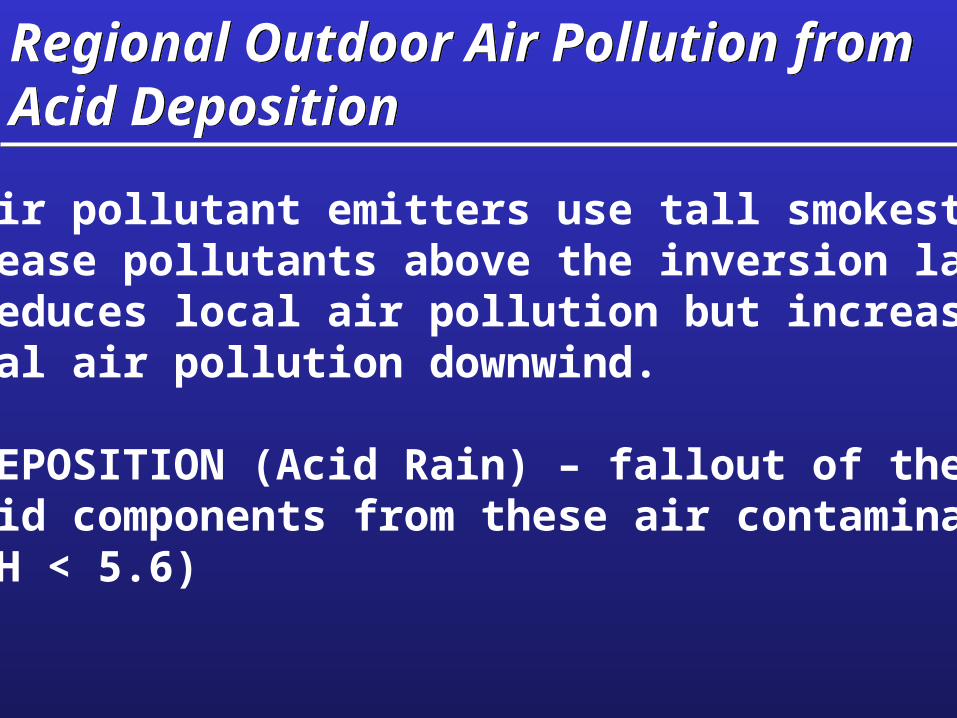
Most air pollutant emitters use tall smokestacks to release pollutants above the inversion layer. This reduces local air pollution but increases regional air pollution downwind.
ACID DEPOSITION (Acid Rain) – fallout of the acid components from these air contaminants. (pH < 5.6)
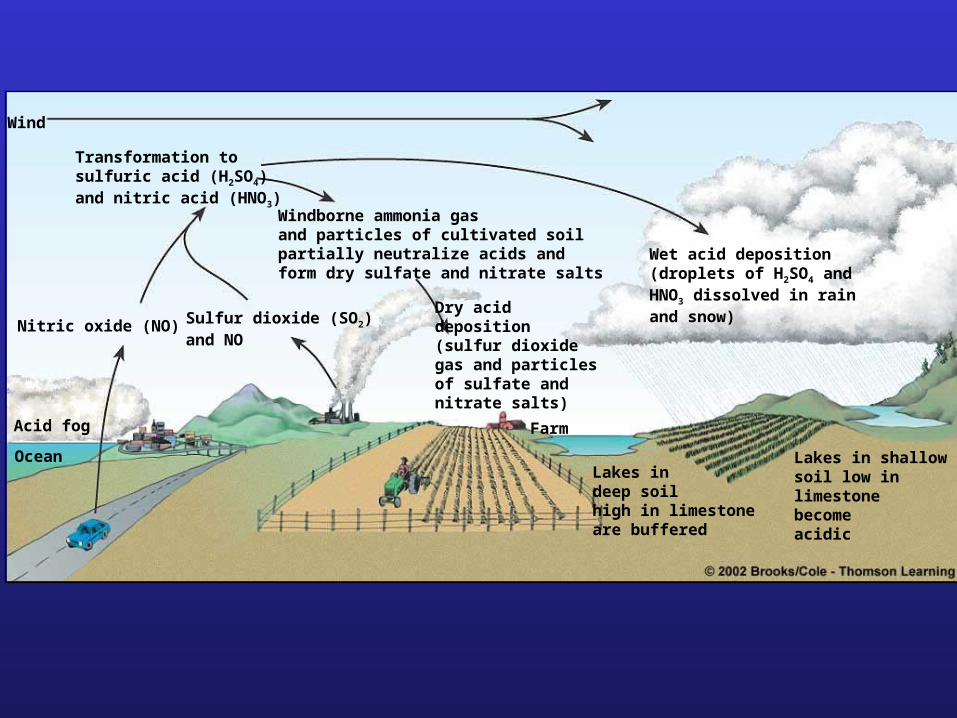
Wind
Transformation tosulfuric acid (H2SO4)and nitric acid (HNO3)
Nitric oxide (NO)
Acid fog
Ocean
Sulfur dioxide (SO2)and NO
Windborne ammonia gasand particles of cultivated soilpartially neutralize acids andform dry sulfate and nitrate salts
Dry aciddeposition(sulfur dioxidegas and particlesof sulfate andnitrate salts)
Farm
Lakes indeep soilhigh in limestoneare buffered
Lakes in shallowsoil low inlimestonebecomeacidic
Wet acid deposition(droplets of H2SO4 andHNO3 dissolved in rainand snow)
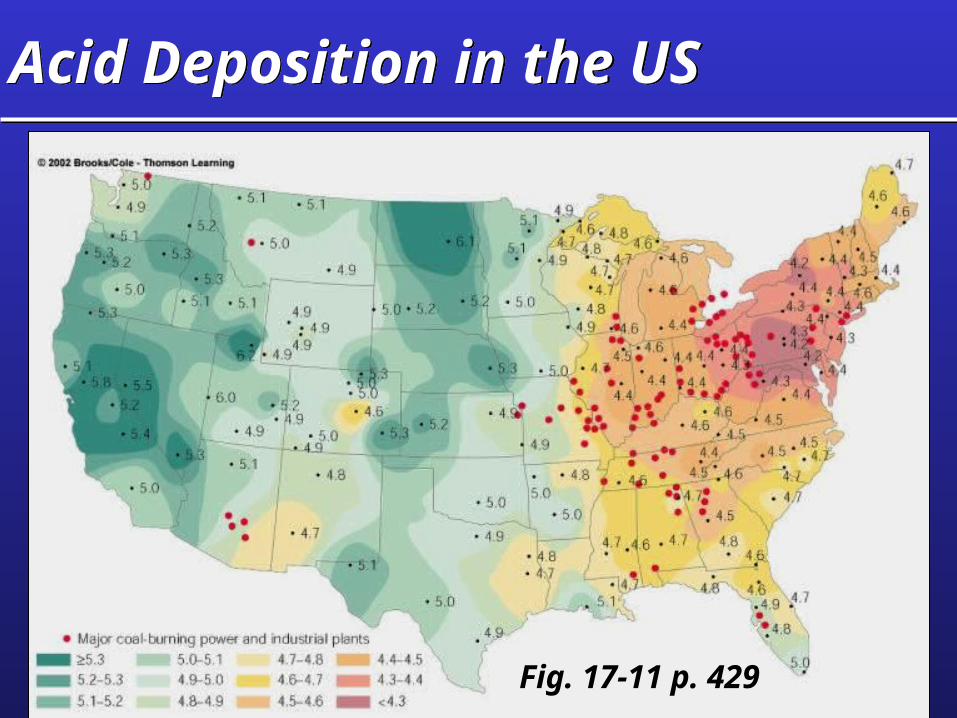
Acid Deposition in the USAcid Deposition in the US
Fig. 17-11 p. 429
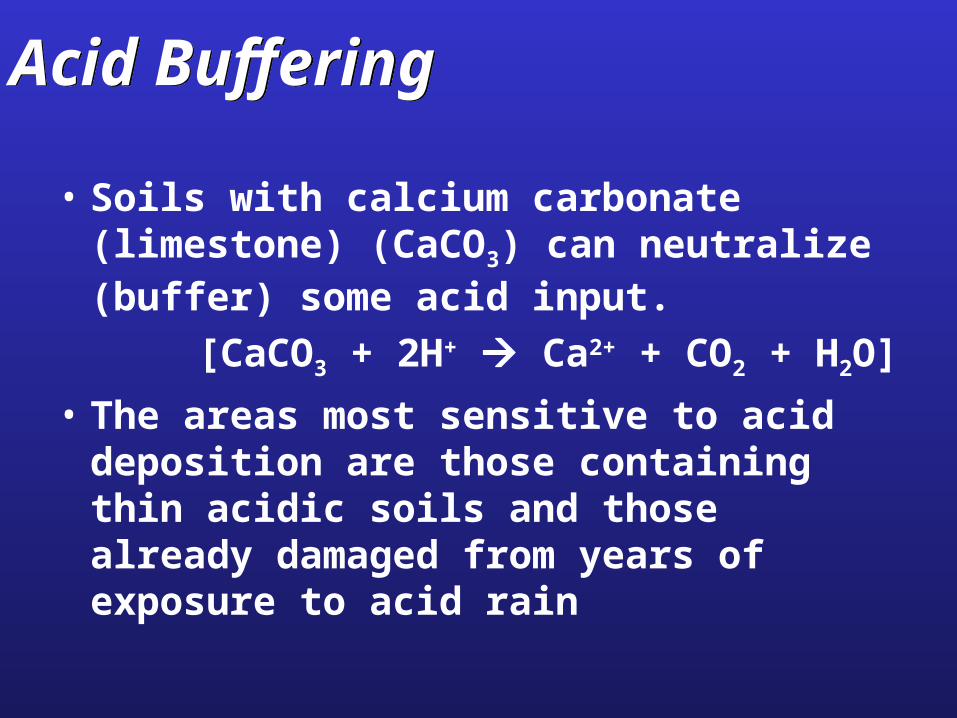
Acid BufferingAcid Buffering
• Soils with calcium carbonate (limestone) (CaCO3) can neutralize (buffer) some acid input.
[CaCO3 + 2H+ Ca2+ + CO2 + H2O]
• The areas most sensitive to acid deposition are those containing thin acidic soils and those already damaged from years of exposure to acid rain
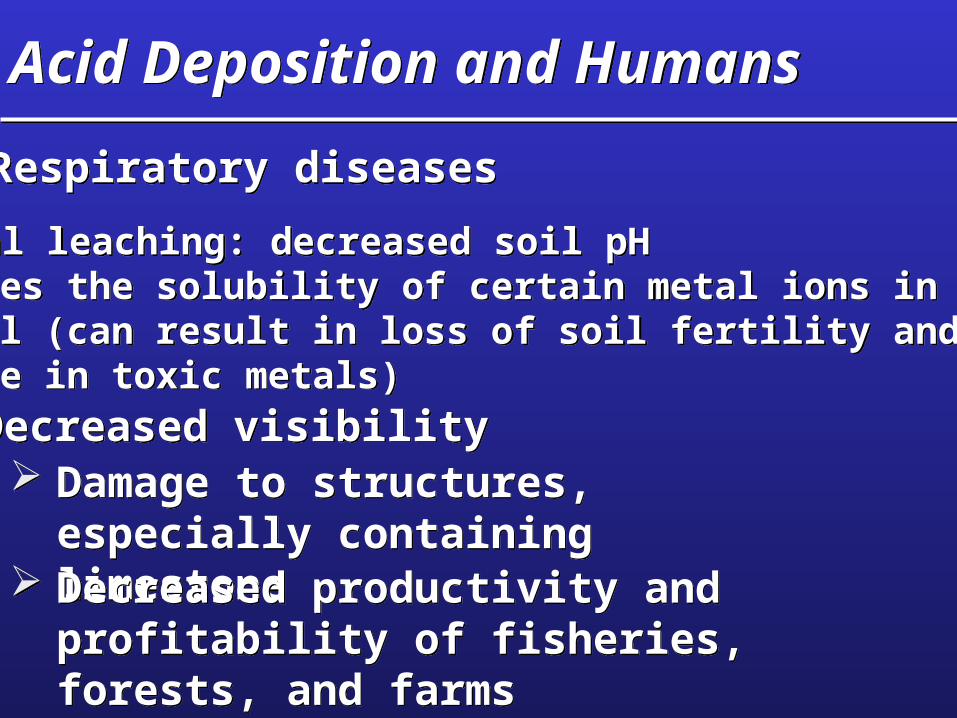
Acid Deposition and HumansAcid Deposition and Humans
Respiratory diseases Respiratory diseases
Toxic metal leaching: decreased soil pH increases the solubility of certain metal ions in the soil (can result in loss of soil fertility and increase in toxic metals)
Toxic metal leaching: decreased soil pH increases the solubility of certain metal ions in the soil (can result in loss of soil fertility and increase in toxic metals)
Decreased visibility Decreased visibility Damage to structures, especially
containing limestone
Damage to structures, especially containing limestone
Decreased productivity and profitability of fisheries, forests, and farms
Decreased productivity and profitability of fisheries, forests, and farms
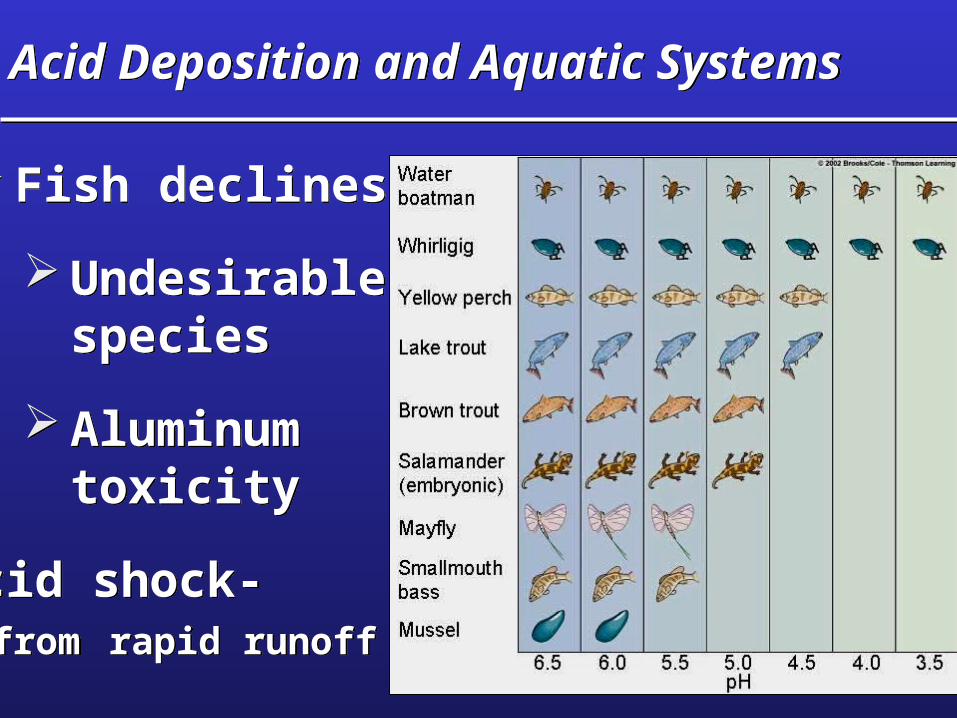
Acid Deposition and Aquatic SystemsAcid Deposition and Aquatic Systems
Fish declines Fish declines
Undesirable species
Undesirable species
Aluminum toxicity
Aluminum toxicity
Acid shock- from rapid runoff
Acid shock- from rapid runoff
Aluminum ToxicityAluminum Toxicity
• Lake acidification can result in the solubilizing of aluminum from the surrounding soil and underlying rock. Increased levels of aluminum in the water can stimulate the overproduction of mucus in the gills of certain fish, clogging their gills and asphyxiating them.
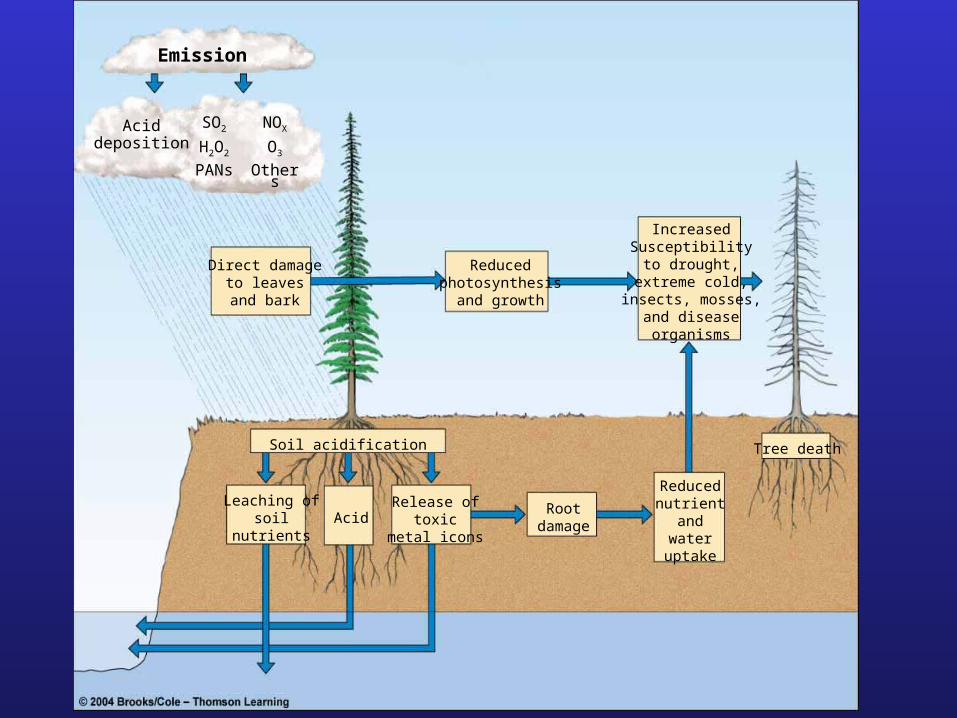
Acid Deposition, Plants, and SoilAcid Deposition, Plants, and Soil
Nutrient leaching
Nutrient leaching
Heavy metal release
Heavy metal release
Weakens trees Weakens trees
Emission
Aciddeposition
SO2
H2O2
PANs
NOX
O3
Others
Direct damageto leavesand bark
Reducedphotosynthesis
and growth
IncreasedSusceptibilityto drought,
extreme cold,insects, mosses,
and diseaseorganisms
Soil acidification
Leaching ofsoil
nutrientsAcid
Release oftoxic
metal icons
Rootdamage
Reducednutrient
andwater
uptake
Tree death
• The 1990 amendments to the Clean Air Act have helped to reduce some of the harmful impacts of acid deposition in the United States.
• However, there is still a long way to go.
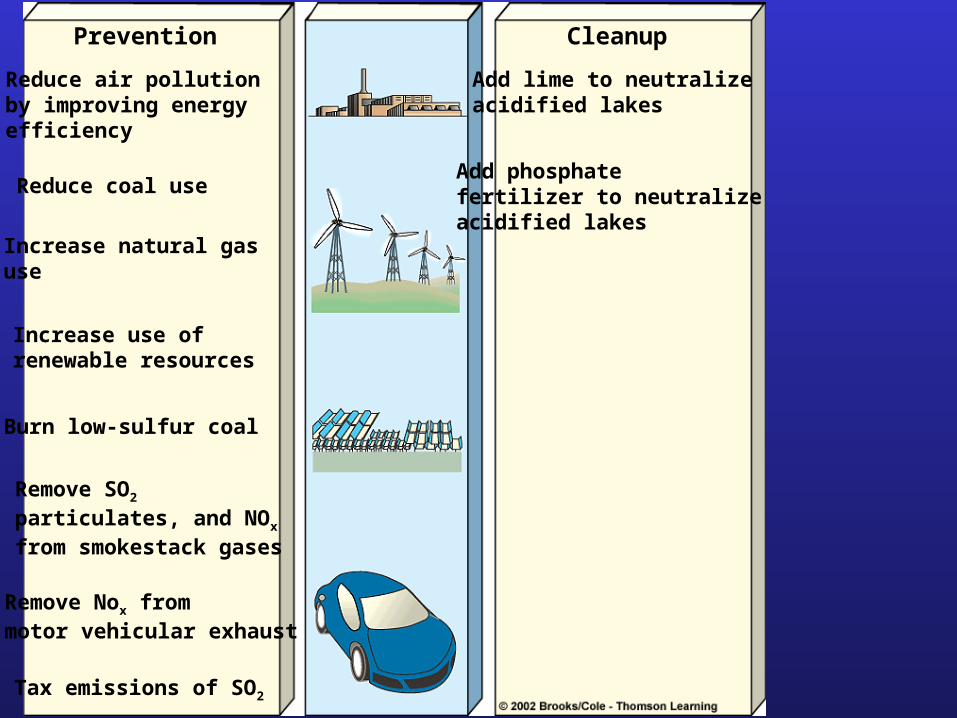
Prevention Cleanup
Reduce air pollutionby improving energyefficiency
Reduce coal use
Increase natural gasuse
Increase use of renewable resources
Burn low-sulfur coal
Remove SO2 particulates, and NOx
from smokestack gases
Remove Nox frommotor vehicular exhaust
Tax emissions of SO2
Add lime to neutralizeacidified lakes
Add phosphatefertilizer to neutralizeacidified lakes
Indoor Air PollutionIndoor Air Pollution
• Levels of common pollutants are generally 2 – 5 times higher inside homes and buildings than outside.
• Levels of particulates can be up to 60% higher indoors than outdoors.
• Pesticides approved for outdoor use only, were 10 times higher inside than outside monitored homes.
• Pollution levels inside cars in traffic-clogged areas can be up to 18 times higher than outside the vehicle.
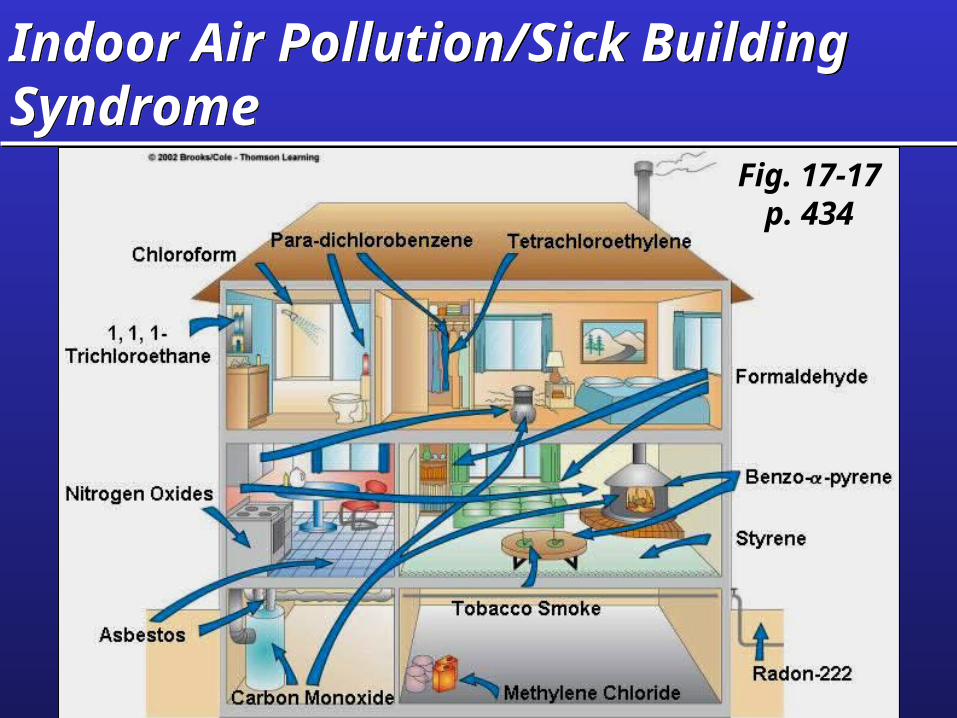
Indoor Air Pollution/Sick Building SyndromeIndoor Air Pollution/Sick Building Syndrome
Fig. 17-17p. 434
RadonRadon
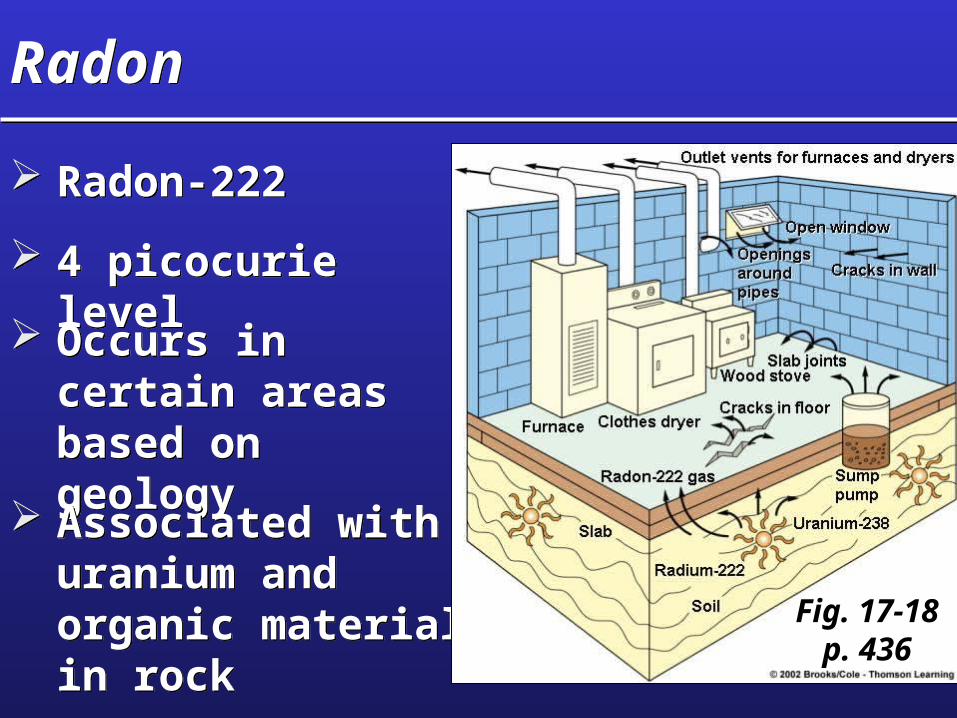
Radon-222 Radon-222
4 picocurie level 4 picocurie level
Occurs in certain areas based on geology
Occurs in certain areas based on geology
Associated with uranium and organic material in rock
Associated with uranium and organic material in rock Fig. 17-18
p. 436
Effects of Air Pollution on Living Organisms and MaterialsEffects of Air Pollution on Living Organisms and Materials
Damage to mucous membranesDamage to mucous membranes
Respiratory diseases (see Fig. 17-19 p. 438)Respiratory diseases (see Fig. 17-19 p. 438)
Damage to plant leaves and rootsDamage to plant leaves and roots
Reduction in primary productivityReduction in primary productivity
Deterioration of materials (See Table 17-3 p. 440)
Deterioration of materials (See Table 17-3 p. 440)
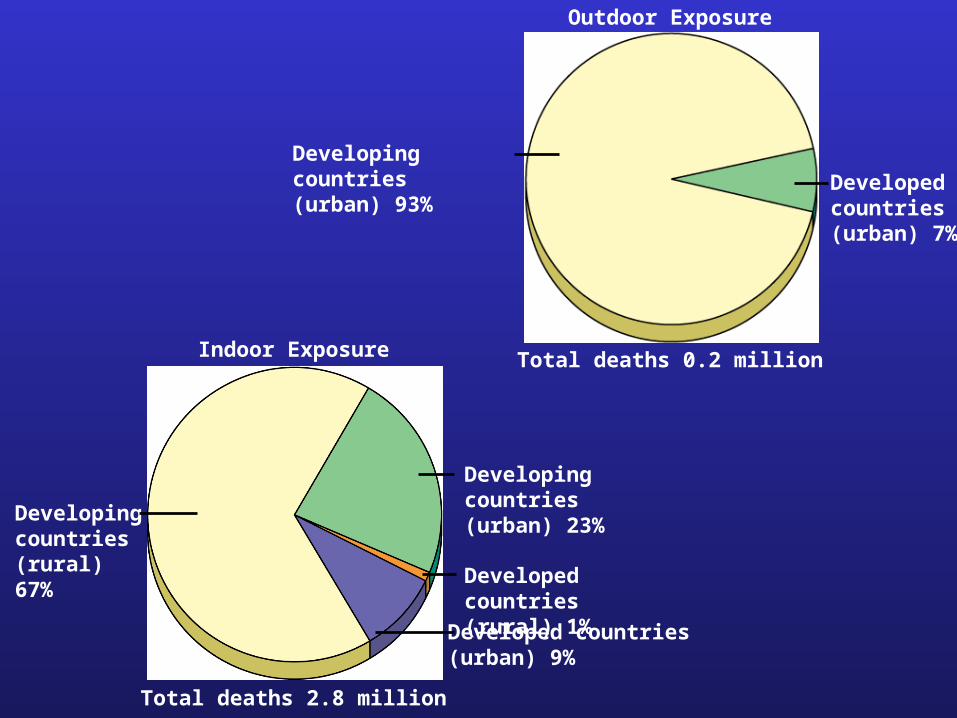
Indoor Exposure
Developingcountries(rural) 67%
Developing countries(urban) 23%
Developed countries(rural) 1%
Total deaths 2.8 million
Developed countries(urban) 9%
Outdoor Exposure
Developing countries(urban) 93% Developed
countries(urban) 7%
Total deaths 0.2 million
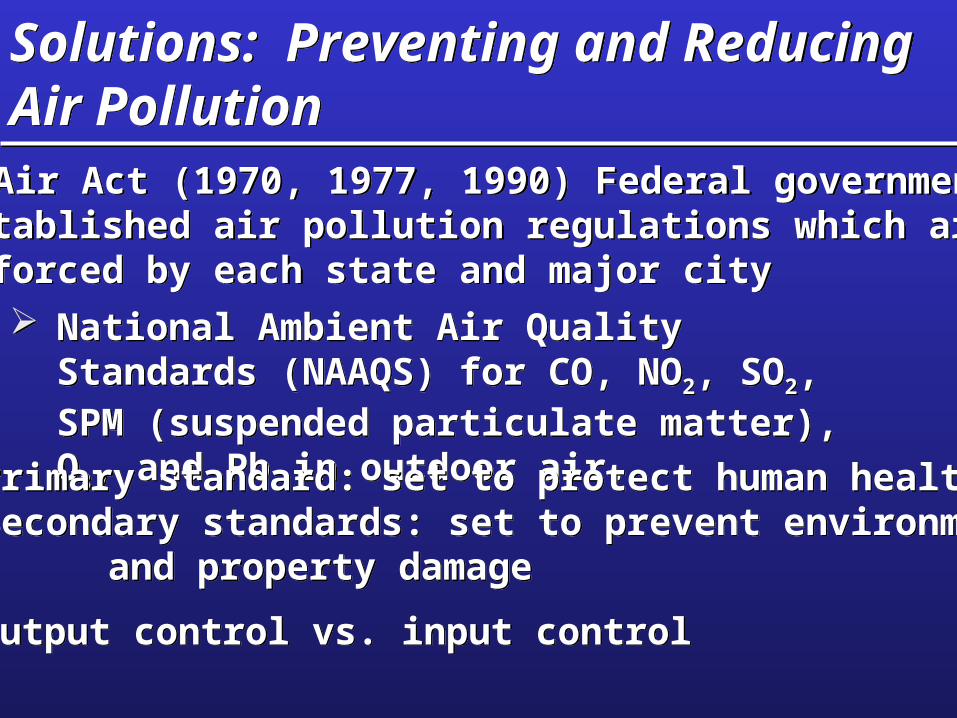
Solutions: Preventing and Reducing Air PollutionSolutions: Preventing and Reducing Air Pollution Clean Air Act (1970, 1977, 1990) Federal government established air pollution regulations which are enforced by each state and major city
Clean Air Act (1970, 1977, 1990) Federal government established air pollution regulations which are enforced by each state and major city
National Ambient Air Quality Standards (NAAQS) for CO, NO2, SO2, SPM (suspended particulate matter), O3, and Pb in outdoor air.
National Ambient Air Quality Standards (NAAQS) for CO, NO2, SO2, SPM (suspended particulate matter), O3, and Pb in outdoor air.
Primary standard: set to protect human healthSecondary standards: set to prevent environmental
and property damage
Primary standard: set to protect human healthSecondary standards: set to prevent environmental
and property damage
Output control vs. input control Output control vs. input control
Emissions Trading PolicyEmissions Trading Policy
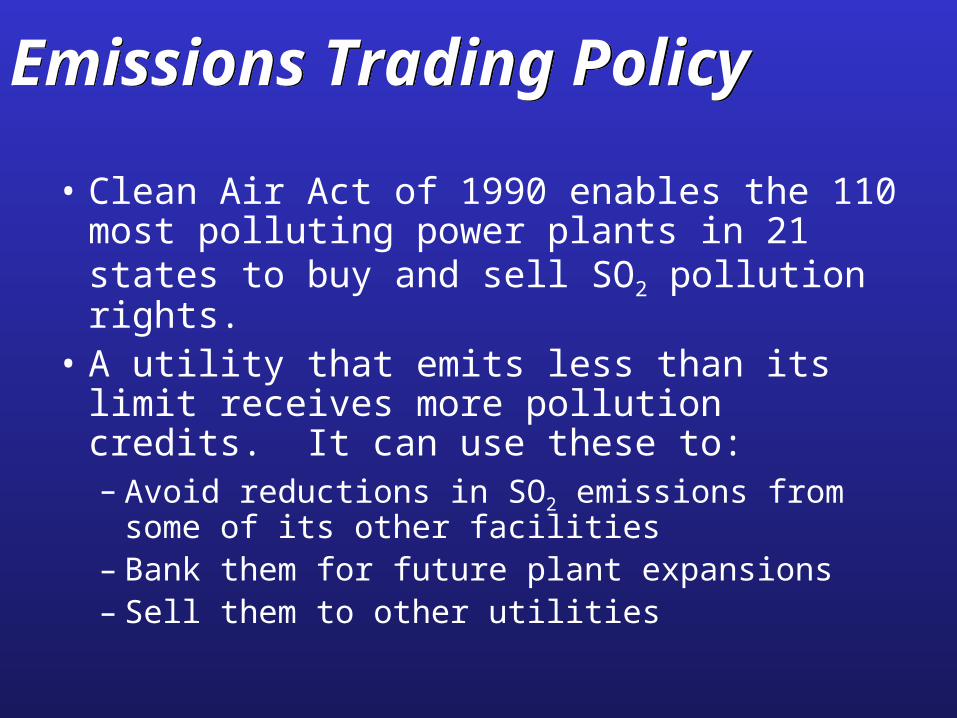
• Clean Air Act of 1990 enables the 110 most polluting power plants in 21 states to buy and sell SO2 pollution rights.
• A utility that emits less than its limit receives more pollution credits. It can use these to:– Avoid reductions in SO2 emissions from some of
its other facilities– Bank them for future plant expansions– Sell them to other utilities
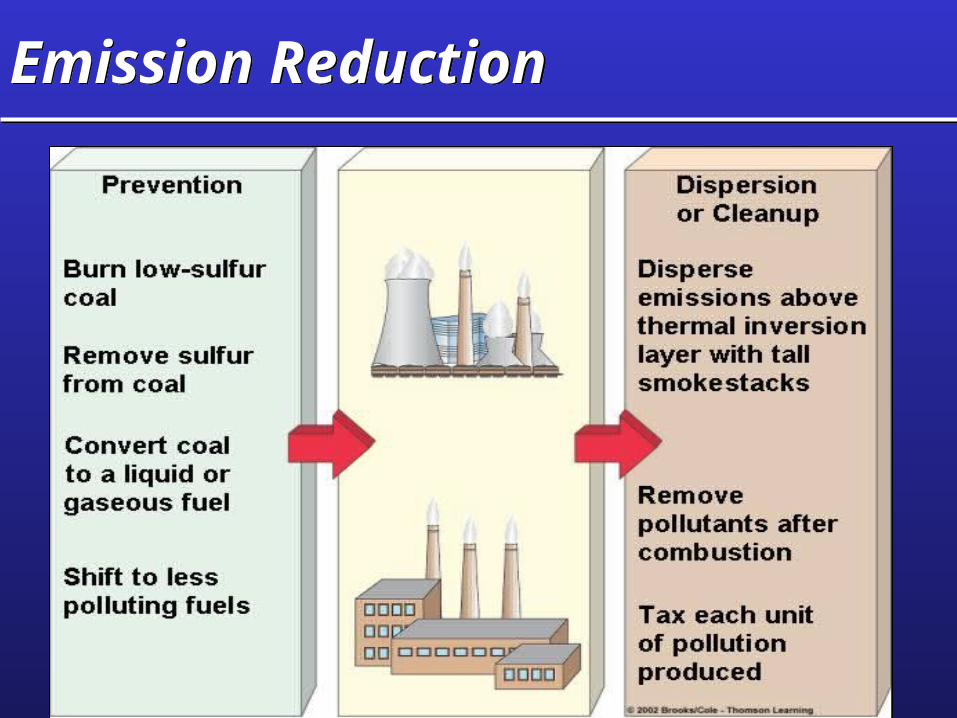
Emission ReductionEmission Reduction

Electrostatic Precipitator
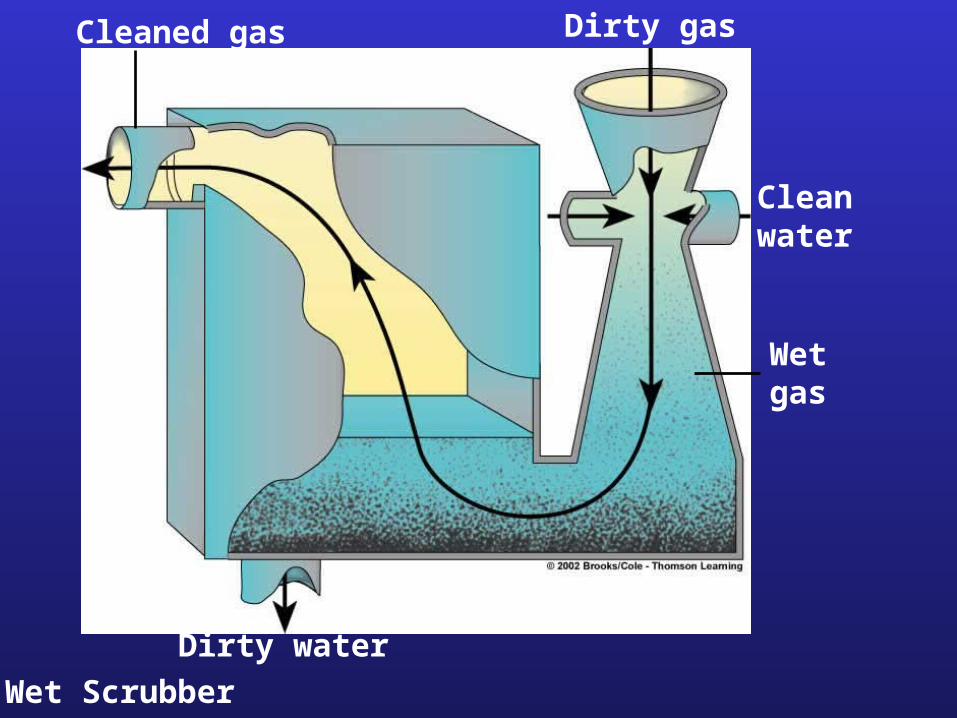
Dirty gas
Dust discharge
ElectrodesCleaned gas
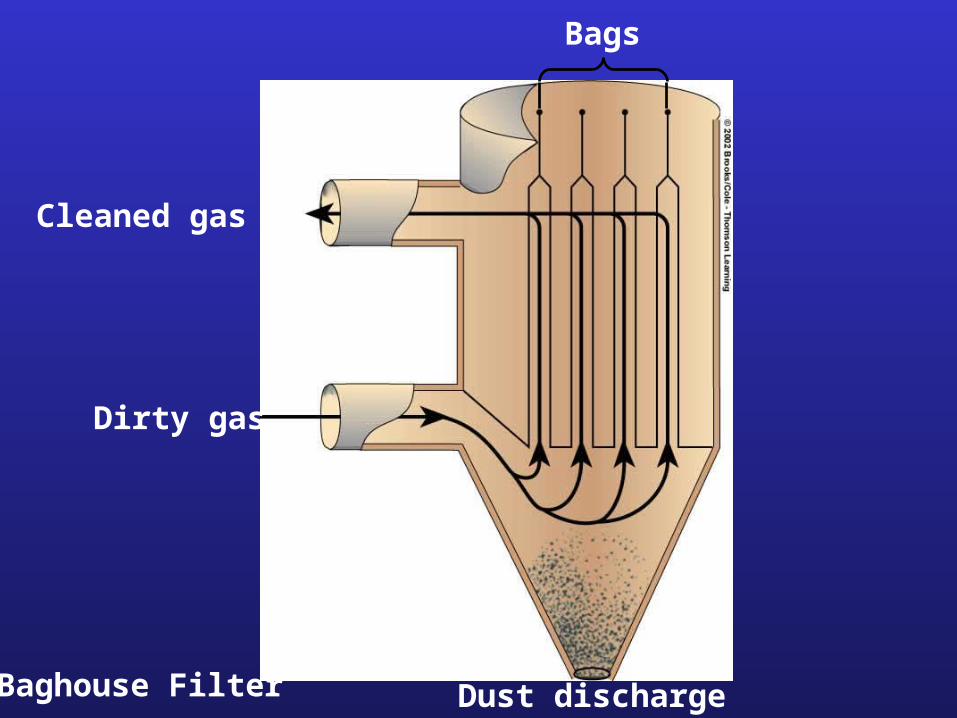
Cleaned gas
Dirty gas
Baghouse Filter Dust discharge
Bags
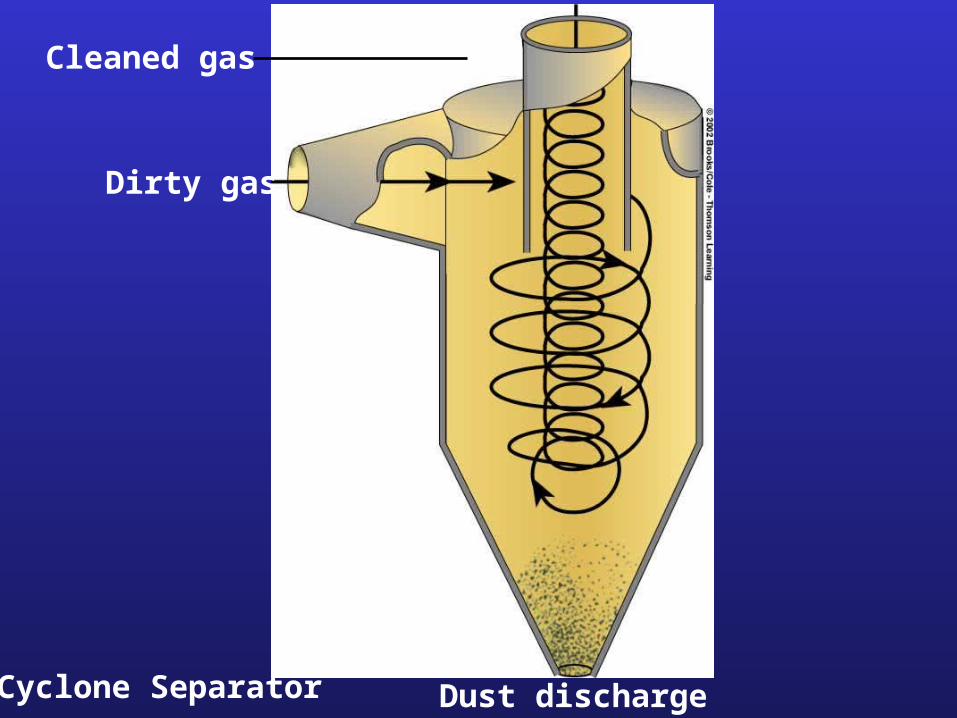
Cyclone Separator
Dirty gas
Dust discharge
Cleaned gas
Dirty gas
Dirty water
Cleanwater
Wet Scrubber
Wetgas
Cleaned gas
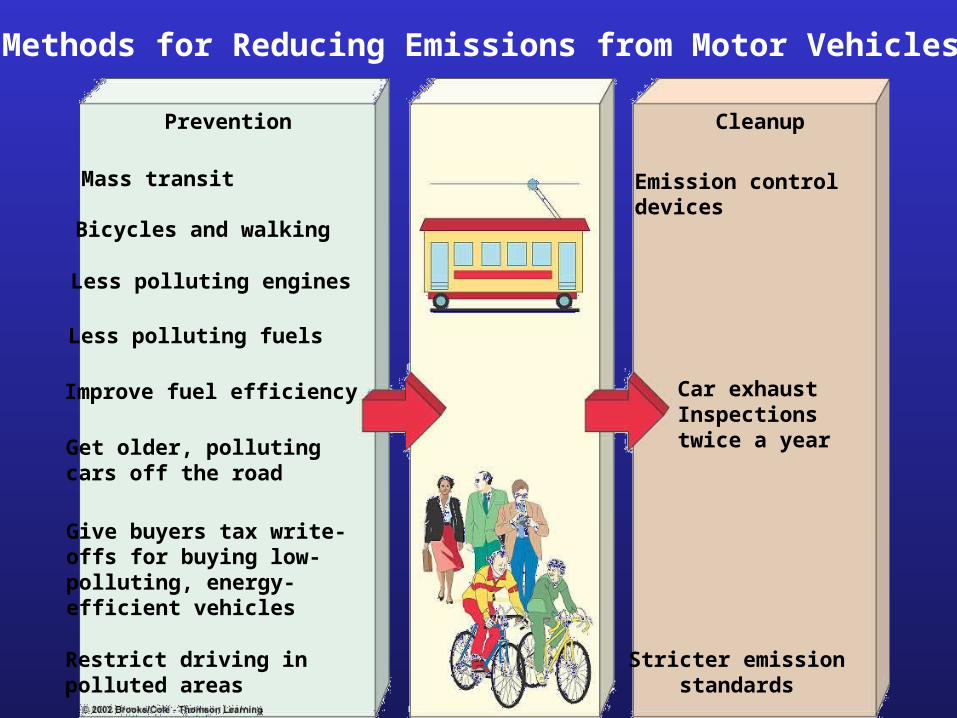
Prevention Cleanup
Mass transit
Bicycles and walking
Less polluting engines
Less polluting fuels
Improve fuel efficiency
Get older, pollutingcars off the road
Give buyers tax write-offs for buying low-polluting, energy-efficient vehicles
Restrict driving inpolluted areas
Emission controldevices
Car exhaustInspectionstwice a year
Stricter emissionstandards
Methods for Reducing Emissions from Motor Vehicles
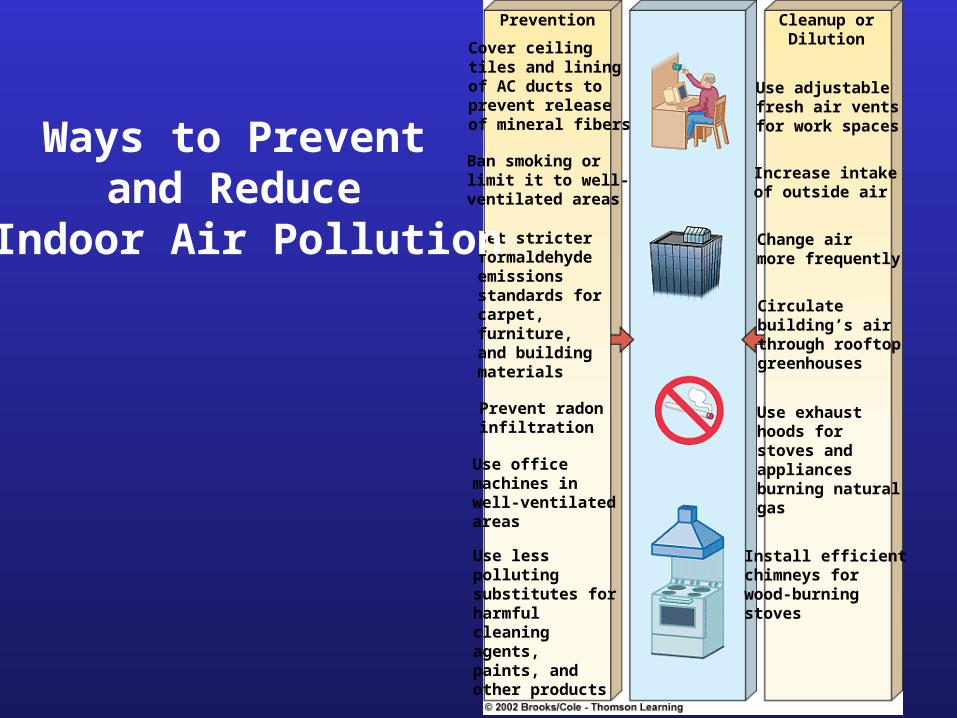
Prevention Cleanup orDilutionCover ceiling
tiles and liningof AC ducts toprevent releaseof mineral fibers
Ban smoking orlimit it to well-ventilated areas
Set stricterformaldehydeemissionsstandards forcarpet,furniture,and buildingmaterials
Prevent radoninfiltration
Use officemachines inwell-ventilatedareas
Use lesspollutingsubstitutes forharmfulcleaningagents, paints, and other products
Use adjustablefresh air ventsfor work spaces
Increase intakeof outside air
Change airmore frequently
Circulate building’s airthrough rooftopgreenhouses
Use exhausthoods for stoves andappliances burning naturalgas
Install efficientchimneys forwood-burningstoves
Ways to Prevent and Reduce
Indoor Air Pollution