Embed Size (px)
Citation preview
Genetic Determinants of Major Blood Lipids in PakistanisCompared With Europeans
Danish Saleheen, MBBS, MPhil; Nicole Soranzo, BSc, PhD; Asif Rasheed, MBBS;Hubert Scharnagl, PhD; Rhian Gwilliam, PhD; Myriam Alexander, MSc, MPhil; Michael Inouye, PhD;Moazzam Zaidi, MBBS; Simon Potter, PhD; Philip Haycock, MSc, MPhil; Suzanna Bumpstead, BSc;
Stephen Kaptoge, PhD; Emanuele Di Angelantonio, MD, MSc, PhD;Nadeem Sarwar, MRPharmS, PhD; Sarah E. Hunt, PhD; Nasir Sheikh, MSc; Nabi Shah, B-Pharmacy;
Maria Samuel, BSc, MSc; Shajjia Razi Haider, MSc; Muhammed Murtaza, MBBS;Alexander Thompson, PhD; Reeta Gobin, MBBS, MPhil; Adam Butterworth, PhD, MSc;
Usman Ahmad, MBBS; Abdul Hakeem, MBBS; Khan Shah Zaman, MBBS, MRCP, FRCP, MRCS;Assadullah Kundi, MBBS, FCPS; Zia Yaqoob, MBBS, FACC; Liaquat Ali Cheema, MBBS, PhD;
Nadeem Qamar, MBBS, FACC; Azhar Faruqui, FACC, FRCP, FCPS, FAHA;Nadeem Hayat Mallick, MBBS, MRCP; Muhammad Azhar, MBBS, MRCP; Abdus Samad, MD, FACC;
Muhammad Ishaq, MBBS, MRCP, FRCP, FACC; Syed Zahed Rasheed, MD, FESC, FRCP;Rashid Jooma, MBBS; Jawaid Hassan Niazi, MBBS, FCPS; Ali Raza Gardezi, MBBS, MRCP;
Nazir Ahmed Memon, MBBS, FRCP, FACC, FACVS; Abdul Ghaffar, MBBS, FCPS;Fazal-ur Rehman, MBBS; Michael Marcus Hoffmann, PhD; Wilfried Renner, PhD; Marcus E. Kleber, PhD;
Tanja B. Grammer, MD; Jonathon Stephens, BSc; Anthony Attwood; Kerstin Koch, PhD;Mustafa Hussain, MBBS; Kishore Kumar, MBBS; Asim Saleem, MBBS; Kishwar Kumar, MBBS;
Muhammad Salman Daood, MBBS; Aftab Alam Gul, MBBS; Shahid Abbas, MBBS; Junaid Zafar, MBBS;Faisal Shahid, MBBS; Shahzad Majeed Bhatti, MBBS; Syed Saadat Ali, MBBS;
Muhammad Fahim, MBBS; Gurdeep Sagoo, BSc, MSc, PhD; Sarah Bray, MA, PhD;Ralph McGinnis, PhD; Frank Dudbridge, PhD; Bernhard R. Winkelmann, PhD; Bernhard Boehm, MD, PhD;
Simon Thompson, DSc; Willem Ouwehand, MD, PhD, FRCPath; Winfried Marz, MD;Philippe Frossard, PhD, DSc; John Danesh, DPhil, FRCP, FFPH; Panos Deloukas, PhD
Background—Evidence is sparse about the genetic determinants of major lipids in Pakistanis.Methods and Results—Variants (n�45 000) across 2000 genes were assessed in 3200 Pakistanis and compared with 2450
Germans using the same gene array and similar lipid assays. We also did a meta-analysis of selected lipid-relatedvariants in Europeans. Pakistani genetic architecture was distinct from that of several ethnic groups represented ininternational reference samples. Forty-one variants at 14 loci were significantly associated with levels of HDL-C,
Received September 3, 2009; accepted May 5, 2010.From the Center for Non-Communicable Diseases (D.S., A.F., M.Z., N.Shah, M.S., S.R.H., M.M., U.A., K.Kumar, A.H., M.H., A.S., Kishore Kumar,
Kishwar Kumar, M.S.D., A.A.G., S.S., J.Z., F.S., S.M.B., S.S.A., S.M.B., S.S.Ali, M.F., P.F.) Karachi, Pakistan; Department of Public Health and PrimaryCare (D.S., M.A., P.H., S.K., E.D.A., N.Sarwar, N.Sheikh, A.T., R.G., A.B., J.D.), University of Cambridge, United Kingdom; Wellcome Trust SangerInstitute (N.S., R.G., M.I., S.P., S.B., P.D., S.E.H., R.G.), Hinxton, Cambridge, United Kingdom; Department of Twin Research and GeneticEpidemiology (N.S., W.O.), King’s College London, St Thomas’ Hospital Campus, London, United Kingdom; Clinical Institute of Medical and ChemicalLaboratory Diagnostics (H.S., W.R.), Medical University Graz, Graz, Austria; National Institute of Cardiovascular Diseases (K.S.Z., A.K., Z.Y., L.A.C.,N.Q., A.F.), Karachi, Pakistan; Punjab Institute of Cardiology (N.H., M.A.), Lahore, Pakistan; Karachi Institute of Heart Diseases (A.S., M.I., S.Z.R.),Karachi, Pakistan; Jinnah Postgraduate Medical Centre (R.J., J.H.N.), Karachi, Pakistan; Multan Institute of Cardiology (A.R.G.), Multan, Pakistan; CivilHospital (N.A.M., A.G.), Hyderabad, Pakistan; Red Crescent Institute of Cardiology (F.u.R.), Hyderabad, Pakistan; Division of Clinical Chemistry(M.M.H.), Department of Medicine, Albert Ludwig University, Freiburg Germany; LURIC Nonprofit LLC (M.E.K.), Freiburg, Germany; Synlab Centerof Laboratory Diagnostics Heidelberg (T.B.G., W.M.), Heidelberg, Germany; Department of Haematology (J.S., A.A., W.O., K.Koch), University ofCambridge and NHS Blood and Transplant, Cambridge, United Kingdom; PHG Foundation (G.S.), Strangeways Research Laboratories, United Kingdom;MRC Biostatistics Unit (S.B., F.D., S.T.), Cambridge, United Kingdom; Division of Endocrinology and Diabetes and Institute of Public Health (B.R.W.,W.M.), Social Medicine and Epidemiology, Medical Faculty Mannheim, University of Heidelberg, Germany, Graduate School Molecular Endocrinologyand Diabetes, University of Ulm, Ulm Germany; and Cardiology Group Frankfurt (B.B.), Frankfurt, Germany.
Drs Saleheen, Soranzo, Danesh, and Deloukas contributed equally to this work.The online-only Data Supplement is available at http://circgenetics.ahajournals.org/cgi/content/full/CIRCGENETICS.109.906180/DC1.Correspondence to Danish Saleheen, MBBS, Center for Non-Communicable Diseases (CNCD), Karachi, Pakistan, and Department of Public Health
and Primary Care, University of Cambridge, Strangeways Research Laboratory, Cambridge CB1 8RN, UK. E-mail [email protected]© 2010 American Heart Association, Inc.
Circ Cardiovasc Genet is available at http://circgenetics.ahajournals.org DOI: 10.1161/CIRCGENETICS.109.906180
348
by guest on May 27, 2018
http://circgenetics.ahajournals.org/D
ownloaded from
by guest on M
ay 27, 2018http://circgenetics.ahajournals.org/
Dow
nloaded from
by guest on May 27, 2018
http://circgenetics.ahajournals.org/D
ownloaded from
by guest on M
ay 27, 2018http://circgenetics.ahajournals.org/
Dow
nloaded from
by guest on May 27, 2018
http://circgenetics.ahajournals.org/D
ownloaded from
by guest on M
ay 27, 2018http://circgenetics.ahajournals.org/
Dow
nloaded from
by guest on May 27, 2018
http://circgenetics.ahajournals.org/D
ownloaded from
by guest on M
ay 27, 2018http://circgenetics.ahajournals.org/
Dow
nloaded from
by guest on May 27, 2018
http://circgenetics.ahajournals.org/D
ownloaded from
by guest on M
ay 27, 2018http://circgenetics.ahajournals.org/
Dow
nloaded from
by guest on May 27, 2018
http://circgenetics.ahajournals.org/D
ownloaded from
by guest on M
ay 27, 2018http://circgenetics.ahajournals.org/
Dow
nloaded from
by guest on May 27, 2018
http://circgenetics.ahajournals.org/D
ownloaded from
by guest on M
ay 27, 2018http://circgenetics.ahajournals.org/
Dow
nloaded from
by guest on May 27, 2018
http://circgenetics.ahajournals.org/D
ownloaded from
by guest on M
ay 27, 2018http://circgenetics.ahajournals.org/
Dow
nloaded from
by guest on May 27, 2018
http://circgenetics.ahajournals.org/D
ownloaded from
by guest on M
ay 27, 2018http://circgenetics.ahajournals.org/
Dow
nloaded from
by guest on May 27, 2018
http://circgenetics.ahajournals.org/D
ownloaded from
by guest on M
ay 27, 2018http://circgenetics.ahajournals.org/
Dow
nloaded from
by guest on May 27, 2018
http://circgenetics.ahajournals.org/D
ownloaded from
by guest on M
ay 27, 2018http://circgenetics.ahajournals.org/
Dow
nloaded from
by guest on May 27, 2018
http://circgenetics.ahajournals.org/D
ownloaded from
by guest on M
ay 27, 2018http://circgenetics.ahajournals.org/
Dow
nloaded from
by guest on May 27, 2018
http://circgenetics.ahajournals.org/D
ownloaded from
by guest on M
ay 27, 2018http://circgenetics.ahajournals.org/
Dow
nloaded from
by guest on May 27, 2018
http://circgenetics.ahajournals.org/D
ownloaded from
by guest on M
ay 27, 2018http://circgenetics.ahajournals.org/
Dow
nloaded from
by guest on May 27, 2018
http://circgenetics.ahajournals.org/D
ownloaded from
by guest on M
ay 27, 2018http://circgenetics.ahajournals.org/
Dow
nloaded from
triglyceride, or LDL-C. The most significant lipid-related variants identified among Pakistanis corresponded to genespreviously shown to be relevant to Europeans, such as CETP associated with HDL-C levels (rs711752; P�10�13),APOA5/ZNF259 (rs651821; P�10�13) and GCKR (rs1260326; P�10�13) with triglyceride levels; and CELSR2 variantswith LDL-C levels (rs646776; P�10�9). For Pakistanis, these 41 variants explained 6.2%, 7.1%, and 0.9% of thevariation in HDL-C, triglyceride, and LDL-C, respectively. Compared with Europeans, the allele frequency of rs662799in APOA5 among Pakistanis was higher and its impact on triglyceride concentration was greater (P-value for difference�10�4).
Conclusions—Several lipid-related genetic variants are common to Pakistanis and Europeans, though they explain only amodest proportion of population variation in lipid concentration. Allelic frequencies and effect sizes of lipid-relatedvariants can differ between Pakistanis and Europeans. (Circ Cardiovasc Genet. 2010;3:348-357.)
Key Words: lipids � HDL-C � LDL-C � triglyceride � Pakistan � gene � population structure � GWAS� IBC-array � meta-analysis
Levels of major blood lipids—that is, concentrations oflow- and high-density lipoprotein cholesterol (LDL-C and
HDL-C) and triglyceride—are each strongly, log-linearly, andpositively (or, in the case of HDL-C, inversely) associated withthe risk of coronary heart disease (CHD).1,2 Linkage and twinbased studies suggest that more than 50% of the variation inthese circulating lipids is determined by genetic factors.3–5
Several genetic variants have been established in the regula-tion of lipid metabolism in people of European continentalancestry, including 40 genomic loci (represented by 152SNPs) identified in genome-wide association studies.5–16 Incontrast with considerable evidence available on people ofEuropean ancestry, data on genetic regulation of major bloodlipids in Pakistanis are limited. For example, the previouslargest relevant study reported on 5 genetic markers inrelation to a few hundred participants.17
Clinical Perspective on p 357We report the first large-scale study of the genetic deter-
minants of LDL-C, HDL-C and triglyceride concentrations inpeople living in Pakistan, a country of �180 million peoplewith a high burden of cardiovascular disease. We haveassayed over 45 000 single nucleotide polymorphisms (SNPs)across 2000 candidate genes using the ITMAT-Broad-CARe(IBC) array18 in 3200 participants from the Pakistan Risk ofMyocardial Infarction Study (PROMIS).19 We comparedassociation signals observed in PROMIS with those in 2450participants of German ancestry from the Ludwigshafen Riskand Cardiovascular Health (LURIC) prospective study, whichused the same gene array.20 To place the German findings inthe context of data from other populations of Europeanancestry, we did a meta-analysis of published studies.
Materials and MethodsParticipantsThis report follows the reporting recommendations of STREGA.21
PROMIS is a case-control study of acute myocardial infarction (MI)in 6 centers in urban Pakistan.20 MI cases had symptoms within 24hours of hospital presentation, typical ECG changes, and a positivetroponin-I test. Control subjects were individuals without a history ofcardiovascular disease. They were frequency-matched to cases bysex and age (in 5-year bands) and concurrently identified in the samehospitals as index cases because they were either (1) visitors ofpatients attending the outpatient department, (2) patients attendingthe outpatient department for routine noncardiac complaints, or (3)
non–blood-related visitors of index MI cases. People with recentillnesses or infections were not eligible. Information was recorded onpersonal and parental ethnicity, spoken language, dietary intake,lifestyle factors, and other characteristics. Nonfasting blood samples(with the time since last meal recorded) were drawn from eachparticipant and centrifuged within 45 minutes of venepuncture.Serum samples were stored at �80°C. Total cholesterol, HDL-C,and triglyceride concentrations were measured using enzymaticmethods (Roche Diagnostics, USA) at the Center for Non-Communicable Diseases, Pakistan. LDL-C concentration was calcu-lated using the Friedewald formula.22
LURIC is a prospective study of cardiovascular death in individ-uals of German ancestry resident in southwest Germany whounderwent elective coronary angiography and left ventriculographybetween June 1997 and January 2000.21 CHD in the current analyseswas defined by troponin-confirmed MI (ie, acute ST- or non–ST elevation MI or based on past medical records) or presence ofvisible luminal narrowing of �50% in at least 1 coronary vessel.Individuals with �20% but �50% stenosis were excluded from theanalyses. Individuals with stenosis �20% were regarded as controlsubjects. Fasting blood samples collected before angiography werekept frozen at �80°C between the day of blood draw and the day ofanalysis for total cholesterol, HDL-C and triglycerides (alldetermined enzymatically).
The studies were approved by relevant ethics committees, andparticipants gave informed consent.
GenotypingAll genotyping was performed at the Wellcome Trust SangerInstitute using the “IBC” array of about 2000 candidate genes.18
Variants on the array were selected on the basis of (1) genes withknown associations for various cardiovascular, pulmonary, and sleeprelated disorders, (2) information from pathway-based tools for theidentification of biologically plausible candidate genes, (3) unpub-lished functional experiments in mice, (4) findings from variousgenome-wide scans, and (5) priority SNPs identified by IBC con-sortium investigators.18 SNPs (n�45 237) in version 1 of this arraywere genotyped in the PROMIS participants and were called usingthe Illuminus algorithm.23 Markers were excluded from analysis ifthe call rate was �95% (372 SNPs); there was evidence of departurefrom Hardy-Weinberg Equilibrium at a probability value of �10�3
(1750 SNPs); or the minor allele frequency (MAF) was �1%(11 931 SNPs, with most such omissions due to genetic markersrelevant in Africans being uninformative in Pakistanis and Europe-ans). LURIC participants were typed with version 2 of the IBC arrayand underwent the same calling and quality control procedures.Because version 2 has 4050 additional SNPs, these SNPs wereexcluded from the current analysis. After quality control, 31 883SNPs in 3197 Pakistanis and 35 533 SNPs in 2452 Germans wereavailable for analyses.
Statistical MethodsTo compare the genetic structure of Pakistanis with that of severalmajor ethnic groups, we received permission from HapMap3 inves-
Saleheen et al Genetic Loci for Major Lipids in Pakistan 349
by guest on May 27, 2018
http://circgenetics.ahajournals.org/D
ownloaded from
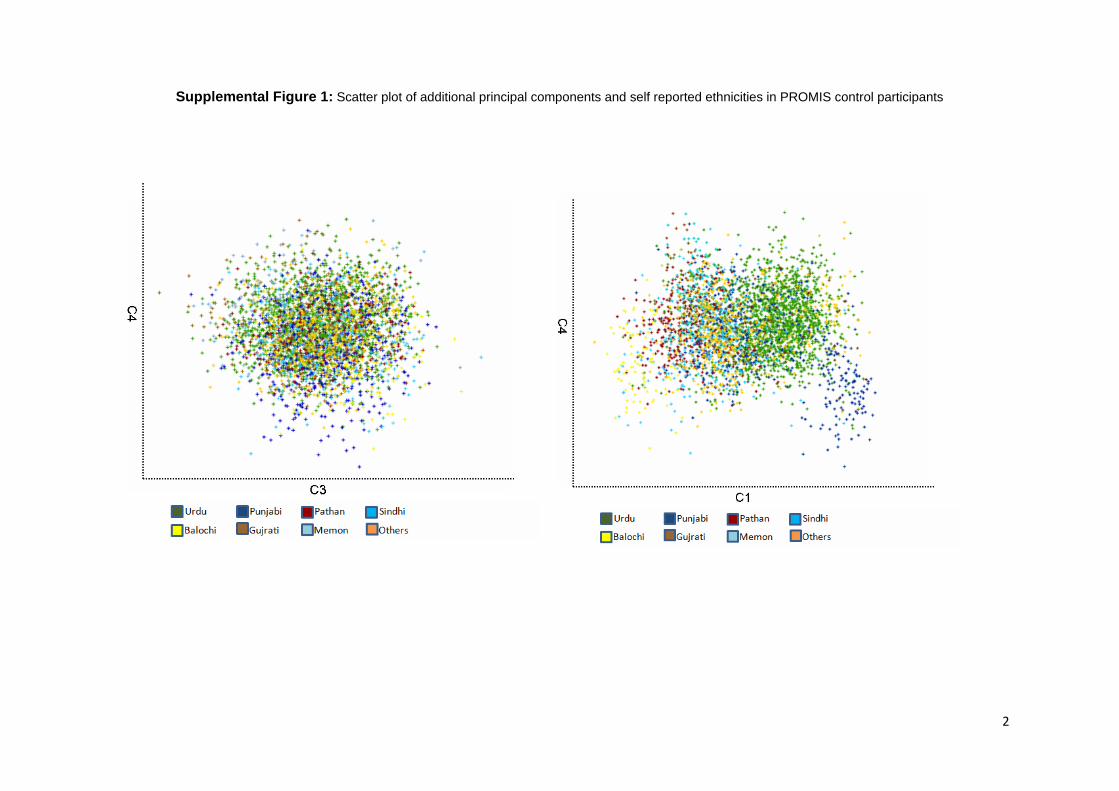
tigators to conduct principal components analyses on 1124 partici-pants in HapMap3. We selected 19 931 SNPs in common with thePROMIS sample, and excluded 11 952 A/T and C/G SNPs to avoidpossible strand alignment bias because it is difficult to infer theminor allele for A/T or C/G SNPs for non-HapMap populations.8 Toinvestigate genetic substructure, we classified Pakistani participantsinto 8 self-identified ethnic and linguistic groups and calculatedprincipal components on the matrix of identity-by-state sharing of allpairs of individuals. Quantile-quantile plots were produced byplotting the observed �log10 probability value for each lipid againstthe expected �log10 probability value. The association between eachlipid measure and genetic variants was tested using linear regression.
Additive models calculated the change in lipid level per copy of theminor allele. �-coefficients have been reported using the commonallele as the reference allele in PROMIS. All analyses were doneusing models adjusting for age and sex, the first 2 principalcomponents and case-control status. Effect estimates in LURIC werereported for the same allele taken as reference in PROMIS.
The Bonferroni correction for the 32 000 SNPs for 3 traits is 10�7,assuming 96 000 independent tests with no prior information. Wechose a cutoff 10�6 owing to the likely higher prior odds ofassociation because the array involves candidate genes and becausethere is a high degree of correlation between the tested SNPs. Toreduce potential biases, lipid analyses were stratified by case-controlstatus and excluded participants on lipid-lowering medication at thetime of baseline examination. Analyses used PLINK 1.06, R version2.9.1, and STATA 10.0.
Meta-AnalysisWe sought genetic association studies of lipid-related variants inpeople of European ancestry published between January 1970 andJanuary 2009. We focused on SNPs (ie, rs1800775, rs708272,rs646776, and rs662799) identified as top signals in the Pakistanstudy to enable comparison of their impact in Europeans (with theexception of rs780093, for which there was minimal previous data,owing to its completely recent discovery). Electronic searchesinvolved MEDLINE, EMBASE, BIOSIS, and Science Citation indexand combined search terms related to genes (eg, cholesteryl estertransfer protein [CETP]) and lipids (eg, HDL-C) without languagerestriction. These searches were supplemented by scanning referencelists, hand-searching relevant journals, and correspondence withauthors. Two investigators independently extracted the followinginformation: mean and SD of lipid levels by genotype; proportion ofmales; fasting status; and assay methods. Analyses involved onlywithin-study comparisons. Mean levels of lipids (and differences inmean levels in comparison with the common homozygotes) werecalculated using both fixed and random-effects models (as the latter
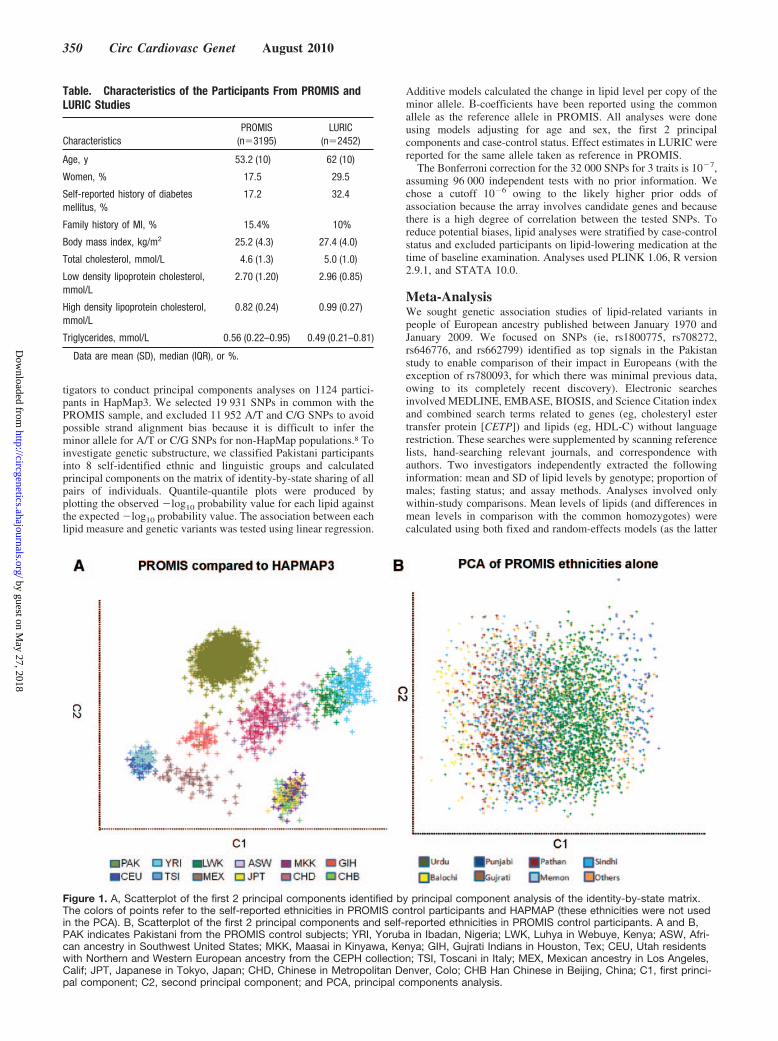
Figure 1. A, Scatterplot of the first 2 principal components identified by principal component analysis of the identity-by-state matrix.The colors of points refer to the self-reported ethnicities in PROMIS control participants and HAPMAP (these ethnicities were not usedin the PCA). B, Scatterplot of the first 2 principal components and self-reported ethnicities in PROMIS control participants. A and B,PAK indicates Pakistani from the PROMIS control subjects; YRI, Yoruba in Ibadan, Nigeria; LWK, Luhya in Webuye, Kenya; ASW, Afri-can ancestry in Southwest United States; MKK, Maasai in Kinyawa, Kenya; GIH, Gujrati Indians in Houston, Tex; CEU, Utah residentswith Northern and Western European ancestry from the CEPH collection; TSI, Toscani in Italy; MEX, Mexican ancestry in Los Angeles,Calif; JPT, Japanese in Tokyo, Japan; CHD, Chinese in Metropolitan Denver, Colo; CHB Han Chinese in Beijing, China; C1, first princi-pal component; C2, second principal component; and PCA, principal components analysis.
Table. Characteristics of the Participants From PROMIS andLURIC Studies
CharacteristicsPROMIS
(n�3195)LURIC
(n�2452)
Age, y 53.2 (10) 62 (10)
Women, % 17.5 29.5
Self-reported history of diabetesmellitus, %
17.2 32.4
Family history of MI, % 15.4% 10%
Body mass index, kg/m2 25.2 (4.3) 27.4 (4.0)
Total cholesterol, mmol/L 4.6 (1.3) 5.0 (1.0)
Low density lipoprotein cholesterol,mmol/L
2.70 (1.20) 2.96 (0.85)
High density lipoprotein cholesterol,mmol/L
0.82 (0.24) 0.99 (0.27)
Triglycerides, mmol/L 0.56 (0.22–0.95) 0.49 (0.21–0.81)
Data are mean (SD), median (IQR), or %.
350 Circ Cardiovasc Genet August 2010
by guest on May 27, 2018
http://circgenetics.ahajournals.org/D
ownloaded from
makes allowances for between-study heterogeneity). Probabilityvalues for difference between the effect estimates obtained inPROMIS and European participants were calculated through a �2 testof heterogeneity.
ResultsThe main characteristics of the Pakistani and German partic-ipants in this study are summarized in the Table. Comparisonwith HapMap3 population panels shows that the Pakistanipopulation clustered distinctly from 11 other major ethnicgroups, indicated by the separate clustering on the scatterplotof principal components (Figure 1). Pakistanis appear genet-ically closest to, but still clearly distinct from, GujaratiIndians living in the United States, a group that is known todiffer genetically from Indians living in India.24 Analysis ofthe 8 ethnic and linguistic groups in the Pakistani studysuggested the possibility of relatively minor population sub-structure; the different ethnicities could not be demarcateddiscretely on the scatter plots involving different principalcomponents (Figure 1 and the online-only Data SupplementFigure 1). Compared with Germans, the Pakistani participantswere about a decade younger and had broadly similar LDL-Cand triglyceride values but lower HDL-C (Table).
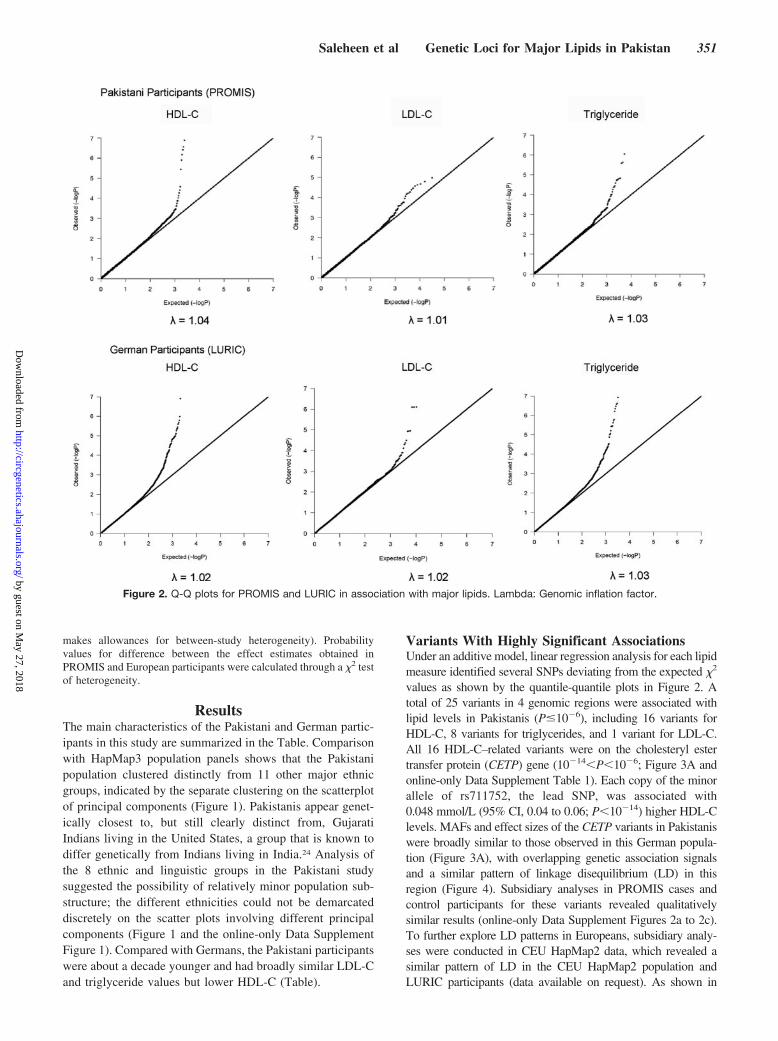
Variants With Highly Significant AssociationsUnder an additive model, linear regression analysis for each lipidmeasure identified several SNPs deviating from the expected �2
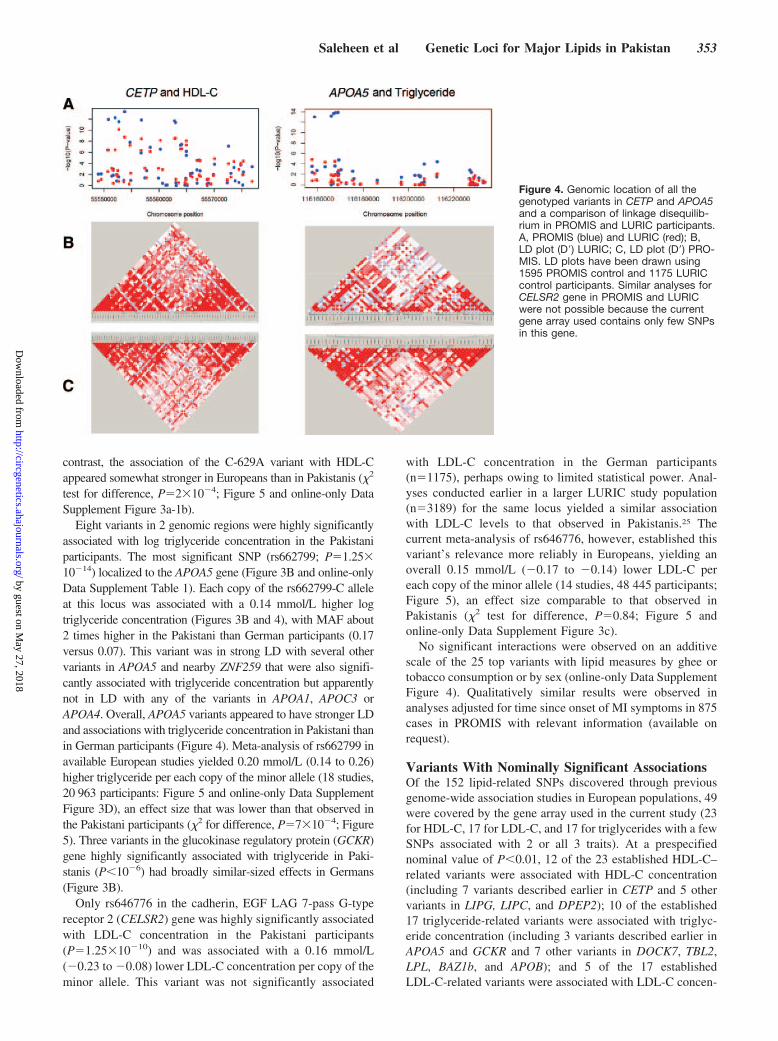
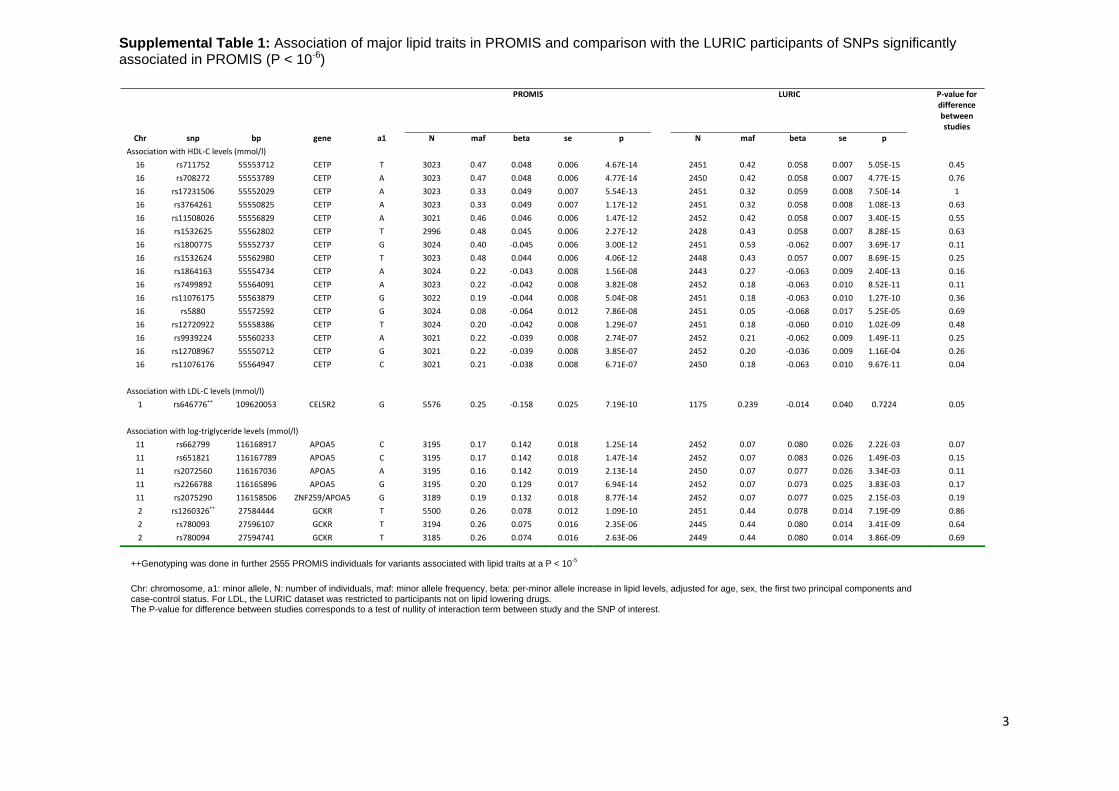
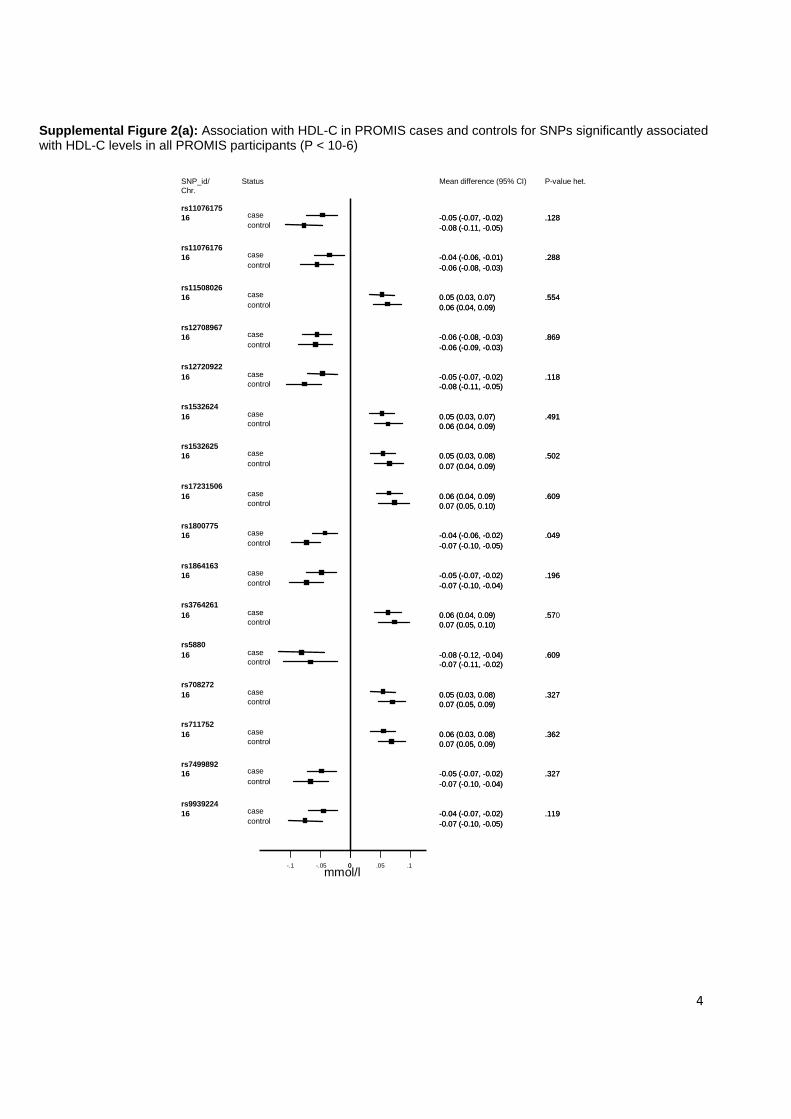
values as shown by the quantile-quantile plots in Figure 2. Atotal of 25 variants in 4 genomic regions were associated withlipid levels in Pakistanis (P�10�6), including 16 variants forHDL-C, 8 variants for triglycerides, and 1 variant for LDL-C.All 16 HDL-C–related variants were on the cholesteryl estertransfer protein (CETP) gene (10�14�P�10�6; Figure 3A andonline-only Data Supplement Table 1). Each copy of the minorallele of rs711752, the lead SNP, was associated with0.048 mmol/L (95% CI, 0.04 to 0.06; P�10�14) higher HDL-Clevels. MAFs and effect sizes of the CETP variants in Pakistaniswere broadly similar to those observed in this German popula-tion (Figure 3A), with overlapping genetic association signalsand a similar pattern of linkage disequilibrium (LD) in thisregion (Figure 4). Subsidiary analyses in PROMIS cases andcontrol participants for these variants revealed qualitativelysimilar results (online-only Data Supplement Figures 2a to 2c).To further explore LD patterns in Europeans, subsidiary analy-ses were conducted in CEU HapMap2 data, which revealed asimilar pattern of LD in the CEU HapMap2 population andLURIC participants (data available on request). As shown in
Figure 2. Q-Q plots for PROMIS and LURIC in association with major lipids. Lambda: Genomic inflation factor.
Saleheen et al Genetic Loci for Major Lipids in Pakistan 351
by guest on May 27, 2018
http://circgenetics.ahajournals.org/D
ownloaded from
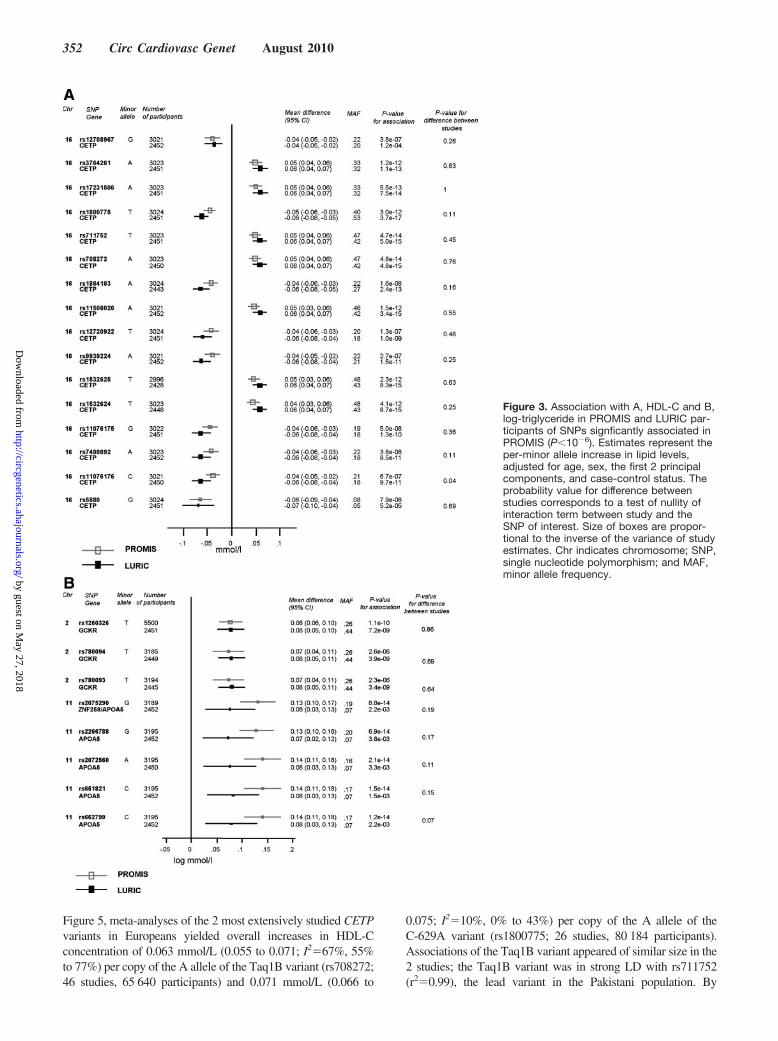
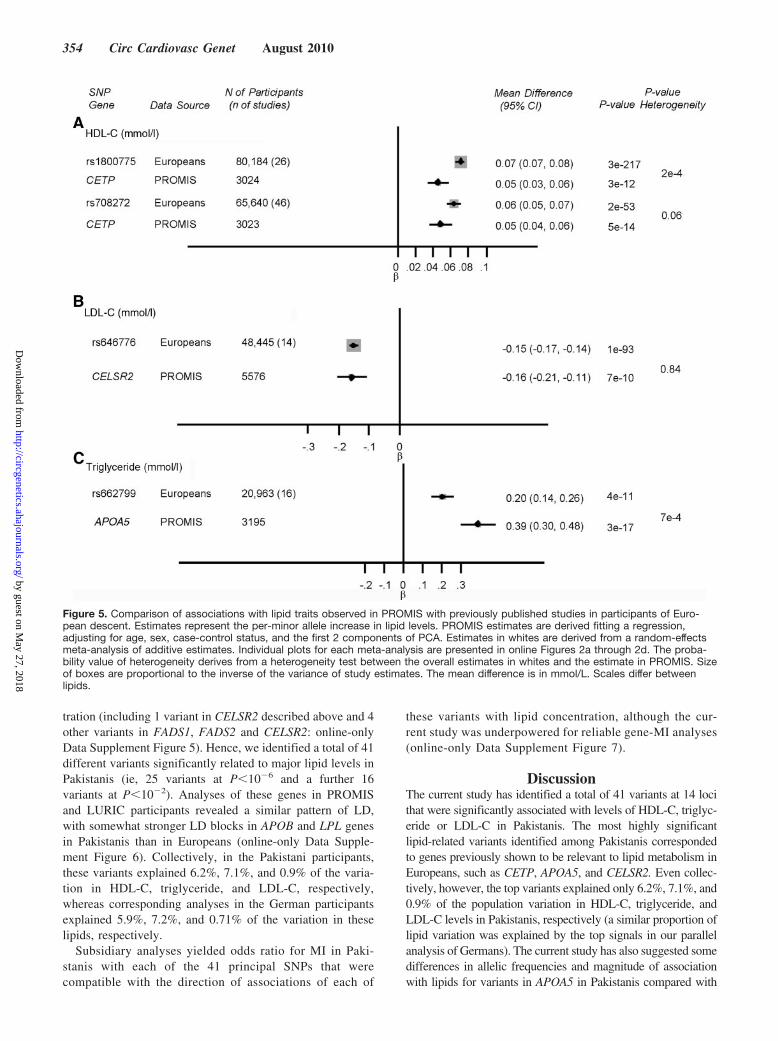
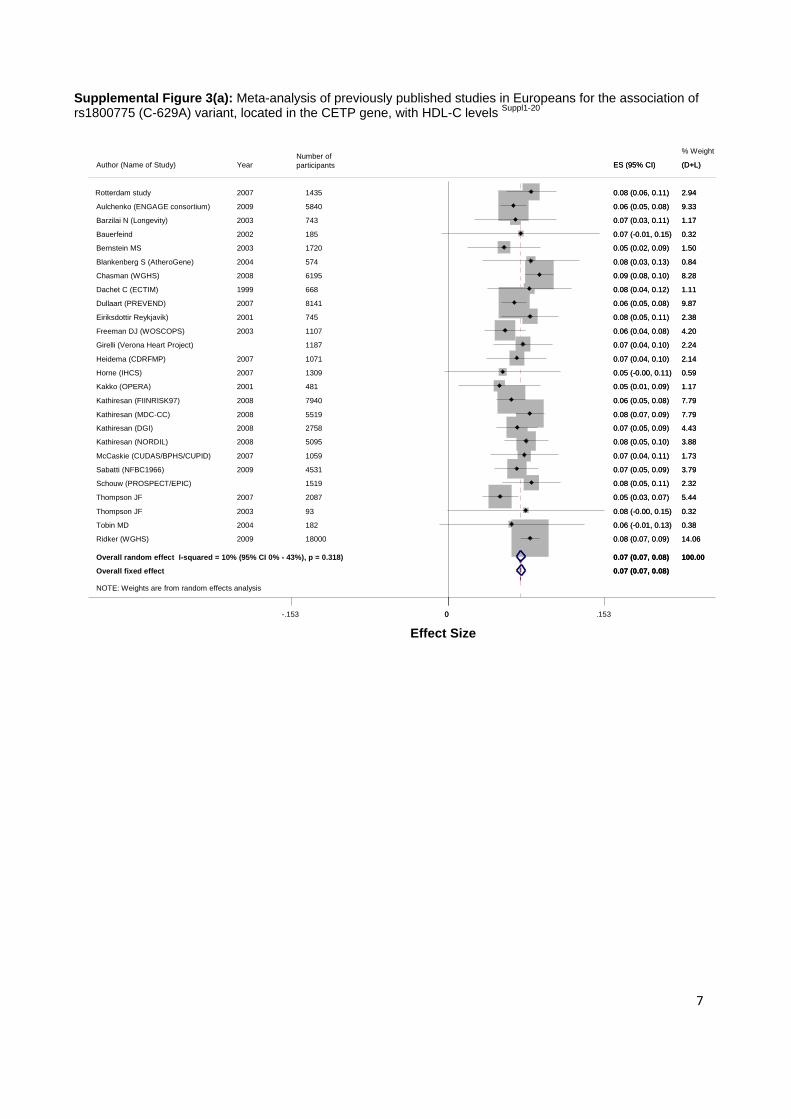
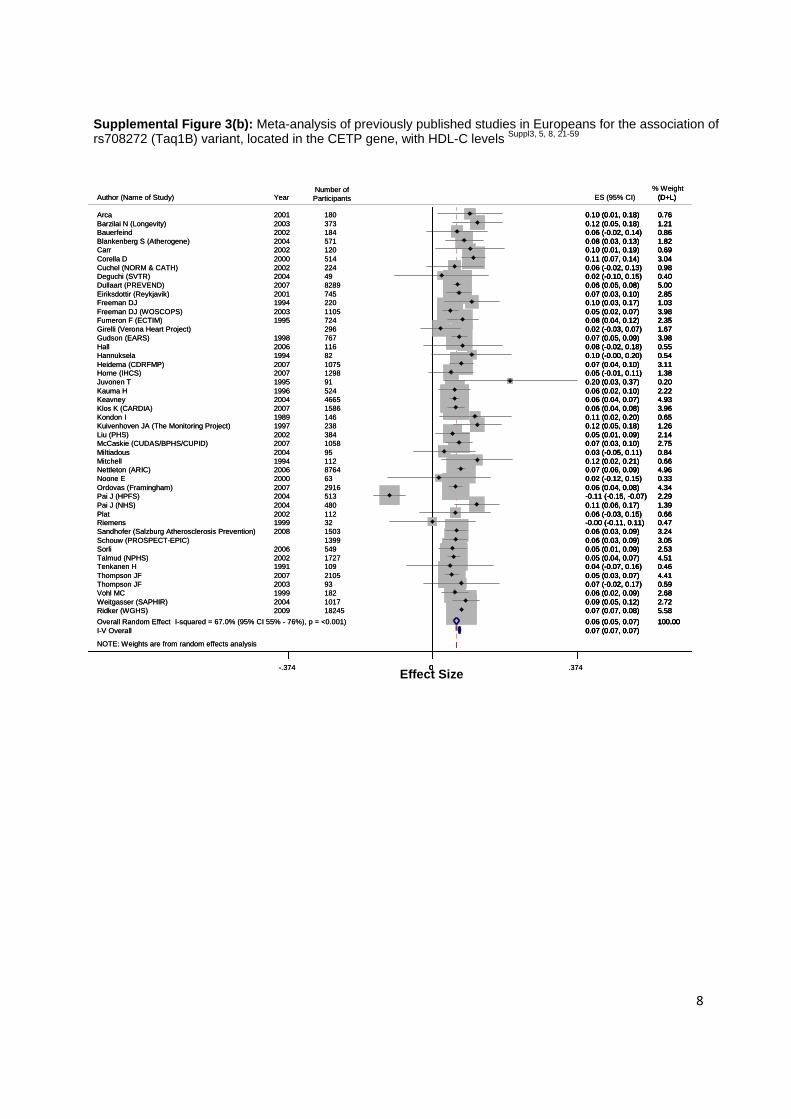
Figure 5, meta-analyses of the 2 most extensively studied CETPvariants in Europeans yielded overall increases in HDL-Cconcentration of 0.063 mmol/L (0.055 to 0.071; I2�67%, 55%to 77%) per copy of the A allele of the Taq1B variant (rs708272;46 studies, 65 640 participants) and 0.071 mmol/L (0.066 to
0.075; I2�10%, 0% to 43%) per copy of the A allele of theC-629A variant (rs1800775; 26 studies, 80 184 participants).Associations of the Taq1B variant appeared of similar size in the2 studies; the Taq1B variant was in strong LD with rs711752(r2�0.99), the lead variant in the Pakistani population. By
Figure 3. Association with A, HDL-C and B,log-triglyceride in PROMIS and LURIC par-ticipants of SNPs signficantly associated inPROMIS (P�10�6). Estimates represent theper-minor allele increase in lipid levels,adjusted for age, sex, the first 2 principalcomponents, and case-control status. Theprobability value for difference betweenstudies corresponds to a test of nullity ofinteraction term between study and theSNP of interest. Size of boxes are propor-tional to the inverse of the variance of studyestimates. Chr indicates chromosome; SNP,single nucleotide polymorphism; and MAF,minor allele frequency.
352 Circ Cardiovasc Genet August 2010
by guest on May 27, 2018
http://circgenetics.ahajournals.org/D
ownloaded from
contrast, the association of the C-629A variant with HDL-Cappeared somewhat stronger in Europeans than in Pakistanis (�2
test for difference, P�2�10�4; Figure 5 and online-only DataSupplement Figure 3a-1b).
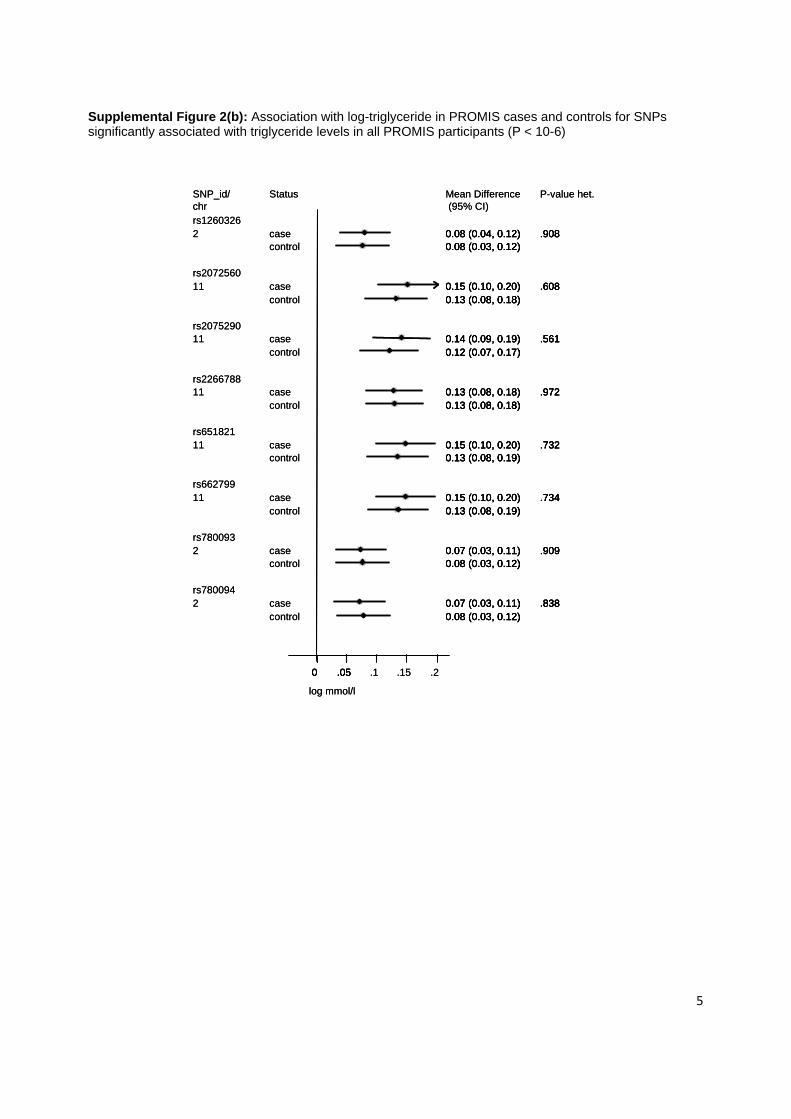
Eight variants in 2 genomic regions were highly significantlyassociated with log triglyceride concentration in the Pakistaniparticipants. The most significant SNP (rs662799; P�1.25�10�14) localized to the APOA5 gene (Figure 3B and online-onlyData Supplement Table 1). Each copy of the rs662799-C alleleat this locus was associated with a 0.14 mmol/L higher logtriglyceride concentration (Figures 3B and 4), with MAF about2 times higher in the Pakistani than German participants (0.17versus 0.07). This variant was in strong LD with several othervariants in APOA5 and nearby ZNF259 that were also signifi-cantly associated with triglyceride concentration but apparentlynot in LD with any of the variants in APOA1, APOC3 orAPOA4. Overall, APOA5 variants appeared to have stronger LDand associations with triglyceride concentration in Pakistani thanin German participants (Figure 4). Meta-analysis of rs662799 inavailable European studies yielded 0.20 mmol/L (0.14 to 0.26)higher triglyceride per each copy of the minor allele (18 studies,20 963 participants: Figure 5 and online-only Data SupplementFigure 3D), an effect size that was lower than that observed inthe Pakistani participants (�2 for difference, P�7�10�4; Figure5). Three variants in the glucokinase regulatory protein (GCKR)gene highly significantly associated with triglyceride in Paki-stanis (P�10�6) had broadly similar-sized effects in Germans(Figure 3B).
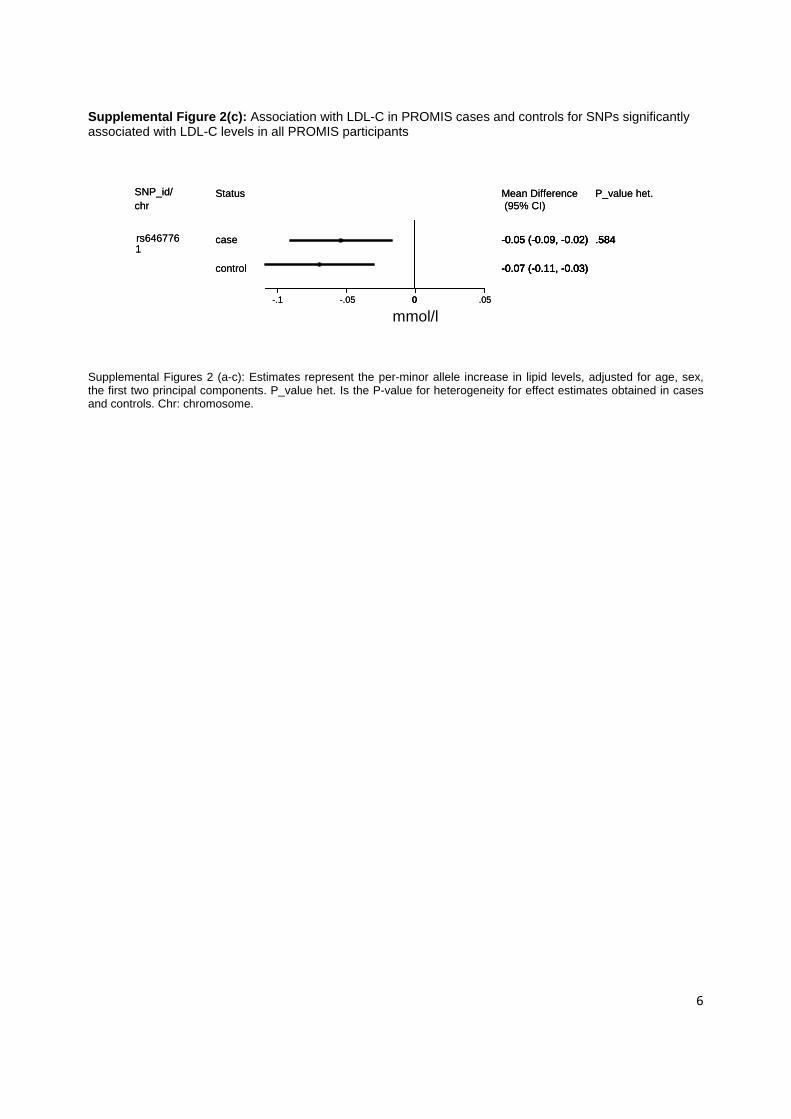
Only rs646776 in the cadherin, EGF LAG 7-pass G-typereceptor 2 (CELSR2) gene was highly significantly associatedwith LDL-C concentration in the Pakistani participants(P�1.25�10�10) and was associated with a 0.16 mmol/L(�0.23 to �0.08) lower LDL-C concentration per copy of theminor allele. This variant was not significantly associated
with LDL-C concentration in the German participants(n�1175), perhaps owing to limited statistical power. Anal-yses conducted earlier in a larger LURIC study population(n�3189) for the same locus yielded a similar associationwith LDL-C levels to that observed in Pakistanis.25 Thecurrent meta-analysis of rs646776, however, established thisvariant’s relevance more reliably in Europeans, yielding anoverall 0.15 mmol/L (�0.17 to �0.14) lower LDL-C pereach copy of the minor allele (14 studies, 48 445 participants;Figure 5), an effect size comparable to that observed inPakistanis (�2 test for difference, P�0.84; Figure 5 andonline-only Data Supplement Figure 3c).
No significant interactions were observed on an additivescale of the 25 top variants with lipid measures by ghee ortobacco consumption or by sex (online-only Data SupplementFigure 4). Qualitatively similar results were observed inanalyses adjusted for time since onset of MI symptoms in 875cases in PROMIS with relevant information (available onrequest).
Variants With Nominally Significant AssociationsOf the 152 lipid-related SNPs discovered through previousgenome-wide association studies in European populations, 49were covered by the gene array used in the current study (23for HDL-C, 17 for LDL-C, and 17 for triglycerides with a fewSNPs associated with 2 or all 3 traits). At a prespecifiednominal value of P�0.01, 12 of the 23 established HDL-C–related variants were associated with HDL-C concentration(including 7 variants described earlier in CETP and 5 othervariants in LIPG, LIPC, and DPEP2); 10 of the established17 triglyceride-related variants were associated with triglyc-eride concentration (including 3 variants described earlier inAPOA5 and GCKR and 7 other variants in DOCK7, TBL2,LPL, BAZ1b, and APOB); and 5 of the 17 establishedLDL-C-related variants were associated with LDL-C concen-
Figure 4. Genomic location of all thegenotyped variants in CETP and APOA5and a comparison of linkage disequilib-rium in PROMIS and LURIC participants.A, PROMIS (blue) and LURIC (red); B,LD plot (D�) LURIC; C, LD plot (D�) PRO-MIS. LD plots have been drawn using1595 PROMIS control and 1175 LURICcontrol participants. Similar analyses forCELSR2 gene in PROMIS and LURICwere not possible because the currentgene array used contains only few SNPsin this gene.
Saleheen et al Genetic Loci for Major Lipids in Pakistan 353
by guest on May 27, 2018
http://circgenetics.ahajournals.org/D
ownloaded from
tration (including 1 variant in CELSR2 described above and 4other variants in FADS1, FADS2 and CELSR2: online-onlyData Supplement Figure 5). Hence, we identified a total of 41different variants significantly related to major lipid levels inPakistanis (ie, 25 variants at P�10�6 and a further 16variants at P�10�2). Analyses of these genes in PROMISand LURIC participants revealed a similar pattern of LD,with somewhat stronger LD blocks in APOB and LPL genesin Pakistanis than in Europeans (online-only Data Supple-ment Figure 6). Collectively, in the Pakistani participants,these variants explained 6.2%, 7.1%, and 0.9% of the varia-tion in HDL-C, triglyceride, and LDL-C, respectively,whereas corresponding analyses in the German participantsexplained 5.9%, 7.2%, and 0.71% of the variation in theselipids, respectively.
Subsidiary analyses yielded odds ratio for MI in Paki-stanis with each of the 41 principal SNPs that werecompatible with the direction of associations of each of
these variants with lipid concentration, although the cur-rent study was underpowered for reliable gene-MI analyses(online-only Data Supplement Figure 7).
DiscussionThe current study has identified a total of 41 variants at 14 locithat were significantly associated with levels of HDL-C, triglyc-eride or LDL-C in Pakistanis. The most highly significantlipid-related variants identified among Pakistanis correspondedto genes previously shown to be relevant to lipid metabolism inEuropeans, such as CETP, APOA5, and CELSR2. Even collec-tively, however, the top variants explained only 6.2%, 7.1%, and0.9% of the population variation in HDL-C, triglyceride, andLDL-C levels in Pakistanis, respectively (a similar proportion oflipid variation was explained by the top signals in our parallelanalysis of Germans). The current study has also suggested somedifferences in allelic frequencies and magnitude of associationwith lipids for variants in APOA5 in Pakistanis compared with
Figure 5. Comparison of associations with lipid traits observed in PROMIS with previously published studies in participants of Euro-pean descent. Estimates represent the per-minor allele increase in lipid levels. PROMIS estimates are derived fitting a regression,adjusting for age, sex, case-control status, and the first 2 components of PCA. Estimates in whites are derived from a random-effectsmeta-analysis of additive estimates. Individual plots for each meta-analysis are presented in online Figures 2a through 2d. The proba-bility value of heterogeneity derives from a heterogeneity test between the overall estimates in whites and the estimate in PROMIS. Sizeof boxes are proportional to the inverse of the variance of study estimates. The mean difference is in mmol/L. Scales differ betweenlipids.
354 Circ Cardiovasc Genet August 2010
by guest on May 27, 2018
http://circgenetics.ahajournals.org/D
ownloaded from
Europeans. As discussed below, however, further studies areneeded to confirm whether such differences are mainly related toethnicity rather than other characteristics.
Most of the highly significant lipid-related loci identifiedin Pakistani participants were related to HDL-C and triglyc-eride rather than LDL-C concentration, a finding that isconsistent with a lower yield of genetic loci associated withLDL-C in previous GWA studies in Europeans.5–16 ForHDL-C, our most highly significant findings related to theCETP gene.26 HDL is believed to exert atheroprotectiveeffects through several mechanisms, including transfer ofcholesterol from peripheral tissues to liver.26,27 CETP facili-tates this process by exchanging cholesterol esters from HDLwith triglyceride in apolipoprotein B–containing particles.26
Deficiency of this protein leads to higher HDL-C levels andother lipoprotein abnormalities.25,26 Our meta-analysis fo-cused on the Taq1B and C-629A variants in CETP, whichalter CETP mass and activity and, consequently, increaseHDL-C concentration.27
For triglyceride, our most highly significant findings related tovariants in APOA5, which is part of the APOA1/C3/A4/A5 genecluster localized to chromosome 11q23.28,29 It has been proposedthat APOAV regulates lipoprotein lipase-mediated hydrolysis oftriglycerides contained in VLDL particles.28 Further triglycer-ide-related variants were found in GCKR,30 which regulatesactivity of glucokinase, a key enzyme responsible for the firstrate-limiting step in the glycolysis pathway, deficiency of whichalters glucose and lipoprotein metabolism.31 For LDL-C, thesole highly significant finding related to a variant in CELSR2,32
a gene that expresses itself along with PSRC1 and SORT1 withina transcriptional network proposed to regulate metabolic profileand atherosclerosis,32,33 although precise mechanisms remainunknown.
Compared with the German participants we studied, thefrequency of the rs662799-C allele in the APOA5 locus washigher in Pakistanis and appeared to have a greater impact ontriglyceride concentration. However, as at least part of thesedifferences could have been due to nonethnic factors (eg,differences in sample size and/or population sampling frame-works used), further study is needed. Evidence of ethnic-relateddifferences is emerging from other contexts, such as suggestionsthat total cholesterol is a stronger risk factor among South Asiansthan Europeans34 and that the LTA4H haplotype has higher oddsratios for myocardial infarction in Africans than Europeans.35
The value of large ethnic-specific studies has also been illus-trated by the discovery of the strongest common susceptibilitylocus (KCNQ1) yet for T2D,36–38 identified in East Asians butnot initially in Europeans because the allele frequency in EastAsians is much higher (40% versus 5%) despite similar oddsratios in both populations.36–38
For reasons of feasibility, we used existing genetic tools basedon catalogues of genetic variation mostly discovered in Europe-ans, East Asians, and West Africans, even though we wereaware that these tools may not adequately capture geneticvariation in Pakistanis (or other South Asians).39,40 For example,the recent discovery of a 7-fold relative risk for heart failure withthe 25-bp deletion allele in the MYBPC3 gene would haveremained undetected using conventional platforms because thisvariant is present only in South Asians.41 Further study in
Pakistanis is therefore needed involving better population-specific tools for genetic mapping. Larger replication studiesshould also help to quantify and control any overestimation inhypothesis-generating estimates. Such studies should aim toinvolve fine-mapping of relevant loci (eg, APOA5) and func-tional studies.42 Future studies may also yield stronger (or novel)genetic signals by direct assay of LDL-C rather than, as in thecurrent study, calculation of LDL-C using the Friedewaldformula. However, as a large prospective study has shown thatassociations of major lipids with CHD risk are at least asextreme in nonfasted participants as in fasted participants,41 useof nonfasting samples in the current study seems unlikely tohave influenced materially the findings here.
Sources of FundingEpidemiological field work in PROMIS was supported by unre-stricted grants to investigators at the University of Cambridge and inPakistan. Genotyping for this study was funded by the WellcomeTrust and the EU Framework 6–funded Bloodomics IntegratedProject (LSHM-CT-2004-503485). The British Heart Foundation hassupported some biochemical assays. The Yousef Jameel Foundationsupports Dr Saleheen. The cardiovascular disease epidemiologygroup of Dr Danesh is underpinned by programme grants from theBritish Heart Foundation and the UK Medical Research Council.
DisclosuresDr Saleheen received research funding from the Fogarty Interna-tional Center, National Heart, Lung and Blood Institute, NationalInstitute of Neurological Disorders and Stroke, and the WellcomeTrust. Dr Danesh reports having received research funding from theBritish Heart Foundation, BUPA Foundation, diaDexus, EuropeanUnion, Evelyn Trust, Fogarty International Center, GlaxoSmithKline,Medical Research Council, Merck, National Heart, Lung and BloodInstitute, National Institute of Neurological Disorders and Stroke,Novartis, Pfizer, Roche, UK Biobank, and the Wellcome Trust.
References1. Emerging Risk Factors Collaboration. Major lipids, apolipoproteins, and
risk of vascular disease. JAMA. 2009;302:1993–2000.2. Sarwar N, Danesh J, Eiriksdottir G, Sigurdsson G, Wareham N, Bingham
S, Boekholdt SM, Khaw KT, Gudnason V. Triglycerides and the risk ofcoronary heart disease: 10,158 incident cases among 262,525 participantsin 29 Western prospective studies. Circulation. 2007;115:450–458.
3. Namboodiri KK, Kaplan EB, Heuch I, Elston RC, Green PP, Rao DC,Laskarzewski P, Glueck CJ, Rifkind BM. The Collaborative LipidResearch Clinics Family Study: biological and cultural determinants offamilial resemblance for plasma lipids and lipoproteins. Genet Epidemiol.1985;2:227–254.
4. Weiss LA, Pan L, Abney M, Ober C. The sex-specific genetic archi-tecture of quantitative traits in humans. Nat Genet. 2006;38:218–222.
5. Kathiresan S, Musunuru K, Orho-Melander M. Defining the spectrum ofalleles that contribute to blood lipid concentrations in humans. Curr OpinLipidol. 2008;19:122–127.
6. Hegele RA. Plasma lipoproteins: genetic influences and clinical impli-cations. Nat Rev Genet. 2009;10:109–121.
7. Manolio TA. Cohort studies and the genetics of complex disease. NatGenet. 2009;41:5–6.
8. Aulchenko YS, Ripatti S, Lindqvist I, Boomsma D, Heid IM, PramstallerPP, Penninx BW, Janssens AC, Wilson JF, Spector T, Martin NG,Pedersen NL, Kyvik KO, Kaprio J, Hofman A, Freimer NB, Jarvelin MR,Gyllensten U, Campbell H, Rudan I, Johansson A, Marroni F, HaywardC, Vitart V, Jonasson I, Pattaro C, Wright A, Hastie N, Pichler I, HicksAA, Falchi M, Willemsen G, Hottenga JJ, de Geus EJ, Montgomery GW,Whitfield J, Magnusson P, Saharinen J, Perola M, Silander K, IsaacsA, Sijbrands EJ, Uitterlinden AG, Witteman JC, Oostra BA, Elliott P,Ruokonen A, Sabatti C, Gieger C, Meitinger T, Kronenberg F, Doring A,Wichmann HE, Smit JH, McCarthy MI, van Duijn CM, Peltonen L. Lociinfluencing lipid levels and coronary heart disease risk in 16 Europeanpopulation cohorts. Nat Genet. 2009;41:47–55.
Saleheen et al Genetic Loci for Major Lipids in Pakistan 355
by guest on May 27, 2018
http://circgenetics.ahajournals.org/D
ownloaded from
9. Kathiresan S, Willer CJ, Peloso GM, Demissie S, Musunuru K, SchadtEE, Kaplan L, Bennett D, Li Y, Tanaka T, Voight BF, Bonnycastle LL,Jackson AU, Crawford G, Surti A, Guiducci C, Burtt NP, Parish S, ClarkeR, Zelenika D, Kubalanza KA, Morken MA, Scott LJ, Stringham HM,Galan P, Swift AJ, Kuusisto J, Bergman RN, Sundvall J, Laakso M,Ferrucci L, Scheet P, Sanna S, Uda M, Yang Q, Lunetta KL, Dupuis J, deBakker PI, O’Donnell CJ, Chambers JC, Kooner JS, Hercberg S, MenetonP, Lakatta EG, Scuteri A, Schlessinger D, Tuomilehto J, Collins FS,Groop L, Altshuler D, Collins R, Lathrop GM, Melander O, Salomaa V,Peltonen L, Orho-Melander M, Ordovas JM, Boehnke M, Abecasis GR,Mohlke KL, Cupples LA. Common variants at 30 loci contribute topolygenic dyslipidemia. Nat Genet. 2009;41:56–65.
10. Sabatti C, Service SK, Hartikainen AL, Pouta A, Ripatti S, Brodsky J,Jones CG, Zaitlen NA, Varilo T, Kaakinen M, Sovio U, Ruokonen A,Laitinen J, Jakkula E, Coin L, Hoggart C, Collins A, Turunen H, GabrielS, Elliot P, McCarthy MI, Daly MJ, Jarvelin MR, Freimer NB, PeltonenL. Genome-wide association analysis of metabolic traits in a birth cohortfrom a founder population. Nat Genet. 2009;41:35–46.
11. Sandhu MS, Waterworth DM, Debenham SL, Wheeler E, Papadakis K,Zhao JH, Song K, Yuan X, Johnson T, Ashford S, Inouye M, Luben R,Sims M, Hadley D, McArdle W, Barter P, Kesaniemi YA, MahleyRW, McPherson R, Grundy SM, Bingham SA, Khaw KT, Loos RJ,Waeber G, Barroso I, Strachan DP, Deloukas P, Vollenweider P,Wareham NJ, Mooser V. LDL-cholesterol concentrations: agenome-wide association study. Lancet. 2008;371:483–491.
12. Burkhardt R, Kenny EE, Lowe JK, Birkeland A, Josowitz R, Noel M,Salit J, Maller JB, Pe’er I, Daly MJ, Altshuler D, Stoffel M, Friedman JM,Breslow JL. Common SNPs in HMGCR in Micronesians and whitesassociated with LDL-cholesterol levels affect alternative splicing ofexon13. Arterioscler Thromb Vasc Biol. 2008;28:2078–2084.
13. Kathiresan S, Melander O, Anevski D, Guiducci C, Burtt NP, Roos C,Hirschhorn JN, Berglund G, Hedblad B, Groop L, Altshuler DM,Newton-Cheh C, Orho-Melander M. Polymorphisms associated with cho-lesterol and risk of cardiovascular events. N Engl J Med. 2008;358:1240–1249.
14. Kathiresan S, Melander O, Guiducci C, Surti A, Burtt NP, Rieder MJ,Cooper GM, Roos C, Voight BF, Havulinna AS, Wahlstrand B, HednerT, Corella D, Tai ES, Ordovas JM, Berglund G, Vartiainen E, JousilahtiP, Hedblad B, Taskinen MR, Newton-Cheh C, Salomaa V, Peltonen L,Groop L, Altshuler DM, Orho-Melander M. Six new loci associated withblood low-density lipoprotein cholesterol, high-density lipoprotein cho-lesterol or triglycerides in humans. Nat Genet. 2008;40:189–197.
15. Willer CJ, Sanna S, Jackson AU, Scuteri A, Bonnycastle LL, Clarke R,Heath SC, Timpson NJ, Najjar SS, Stringham HM, Strait J, Duren WL,Maschio A, Busonero F, Mulas A, Albai G, Swift AJ, Morken MA,Narisu N, Bennett D, Parish S, Shen H, Galan P, Meneton P, HercbergS, Zelenika D, Chen WM, Li Y, Scott LJ, Scheet PA, Sundvall J,Watanabe RM, Nagaraja R, Ebrahim S, Lawlor DA, Ben-Shlomo Y,Vey-Smith G, Shuldiner AR, Collins R, Bergman RN, Uda M, Tuom-ilehto J, Cao A, Collins FS, Lakatta E, Lathrop GM, Boehnke M,Schlessinger D, Mohlke KL, Abecasis GR. Newly identified loci thatinfluence lipid concentrations and risk of coronary artery disease. NatGenet. 2008;40:161–169.
16. Saxena R, Voight BF, Lyssenko V, Burtt NP, de Bakker PI, Chen H, RoixJJ, Kathiresan S, Hirschhorn JN, Daly MJ, Hughes TE, Groop L, Alt-shuler D, Almgren P, Florez JC, Meyer J, Ardlie K, Bengtsson BK,Isomaa B, Lettre G, Lindblad U, Lyon HN, Melander O, Newton-ChehC, Nilsson P, Orho-Melander M, Rastam L, Speliotes EK, Taskinen MR,Tuomi T, Guiducci C, Berglund A, Carlson J, Gianniny L, Hackett R,Hall L, Holmkvist J, Laurila E, Sjogren M, Sterner M, Surti A, SvenssonM, Svensson M, Tewhey R, Blumenstiel B, Parkin M, Defelice M, BarryR, Brodeur W, Camarata J, Chia N, Fava M, Gibbons J, Handsaker B,Healy C, Nguyen K, Gates C, Sougnez C, Gage D, Nizzari M, GabrielSB, Chirn GW, Ma Q, Parikh H, Richardson D, Ricke D, Purcell S.Genome-wide association analysis identifies loci for type 2 diabetes andtriglyceride levels. Science. 2007;316:1331–1336.
17. Saleheen D, Khanum S, Haider SR, Nazir A, Ahmad U, Khalid H,Hussain I, Shuja F, Shahid K, Habib A, Frossard PM. A novel haplotypein ABCA1 gene effects plasma HDL-C concentration. Int J Cardiol.2007;115:7–13.
18. Keating BJ, Tischfield S, Murray SS, Bhangale T, Price TS, Glessner JT,Galver L, Barrett JC, Grant SF, Farlow DN, Chandrupatla HR, Hansen M,Ajmal S, Papanicolaou GJ, Guo Y, Li M, Derohannessian S, de BakkerPI, Bailey SD, Montpetit A, Edmondson AC, Taylor K, Gai X, Wang SS,Fornage M, Shaikh T, Groop L, Boehnke M, Hall AS, Hattersley AT,
Frackelton E, Patterson N, Chiang CW, Kim CE, Fabsitz RR, OuwehandW, Price AL, Munroe P, Caulfield M, Drake T, Boerwinkle E, Reich D,Whitehead AS, Cappola TP, Samani NJ, Lusis AJ, Schadt E, Wilson JG,Koenig W, McCarthy MI, Kathiresan S, Gabriel SB, Hakonarson H,Anand SS, Reilly M, Engert JC, Nickerson DA, Rader DJ, HirschhornJN, Fitzgerald GA. Concept, design and implementation of a cardiovas-cular gene-centric 50k SNP array for large-scale genomic associationstudies. PLoS One. 2008;3:e3583.
19. Saleheen D, Zaidi M, Rasheed A, Ahmad U, Hakeem A, Murtaza M, KayaniW, Faruqui A, Kundi A, Zaman KS, Yaqoob Z, Cheema LA, Samad A,Rasheed SZ, Mallick NH, Azhar M, Jooma R, Gardezi AR, Memon N,Ghaffar A, Fazal UR, Khan N, Shah N, Ali SA, Samuel M, Hanif F, YameenM, Naz S, Sultana A, Nazir A, Raza S, Shazad M, Nasim S, Javed MA, AliSS, Jafree M, Nisar MI, Daood MS, Hussain A, Sarwar N, Kamal A,Deloukas P, Ishaq M, Frossard P, Danesh J. The Pakistan Risk of MyocardialInfarction Study: a resource for the study of genetic, lifestyle and otherdeterminants of myocardial infarction in South Asia. Eur J Epidemiol. 2009;24:329–338.
20. Winkelmann BR, Marz W, Boehm BO, Zotz R, Hager J, Hellstern P,Senges J. Rationale and design of the LURIC study–a resource forfunctional genomics, pharmacogenomics and long-term prognosis of car-diovascular disease. Pharmacogenomics. 2001;2:S1–S73.
21. Little J, Higgins JP, Ioannidis JP, Moher D, Gagnon F, von EE, KhouryMJ, Cohen B, vey-Smith G, Grimshaw J, Scheet P, Gwinn M, WilliamsonRE, Zou GY, Hutchings K, Johnson CY, Tait V, Wiens M, Golding J, vanDC, McLaughlin J, Paterson A, Wells G, Fortier I, Freedman M, ZecevicM, King R, Infante-Rivard C, Stewart A, Birkett N. STrengthening theREporting of Genetic Association studies (STREGA): an extension of theSTROBE statement. Eur J Clin Invest. 2009;39:247–266.
22. Friedewald WT, Levy RI, Fredrickson DS. Estimation of the concen-tration of low-density lipoprotein cholesterol in plasma, without use of thepreparative ultracentrifuge. Clin Chem. 1972;18:499–502.
23. Teo YY, Inouye M, Small KS, Gwilliam R, Deloukas P, KwiatkowskiDP, Clark TG. A genotype calling algorithm for the Illumina BeadArrayplatform. Bioinformatics. 2007;23:2741–2746.
24. Reich D, Thangaraj K, Patterson N, Price AL, Singh L. ReconstructingIndian population history. Nature. 2009;461:489–494.
25. Kleber ME, Renner W, Grammer TB, Linsel-Nitschke P, Boehm BO,Winkelmann BR, Bugert P, Hoffmann MM, Marz W. Association of thesingle nucleotide polymorphism rs599839 in the vicinity of the sortilin 1gene with LDL and triglyceride metabolism, coronary heart disease andmyocardial infarction: The Ludwigshafen Risk and CardiovascularHealth Study. Atherosclerosis. 2010;209:492–497.
26. de Grooth GJ, Klerkx AH, Stroes ES, Stalenhoef AF, Kastelein JJ,Kuivenhoven JA. A review of CETP and its relation to atherosclerosis.J Lipid Res. 2004;45:1967–1974.
27. Thompson A, Di Angenlantonio E, Sarwar N, Erqou S, Saleheen D,Dullaart RP, Keavney B, Ye Z, Danesh J. Association of cholesteryl estertransfer protein genotypes with CETP mass and activity, lipid levels, andcoronary risk. JAMA. 2008;299:2777–2788.
28. Kluger M, Heeren J, Merkel M. Apoprotein A-V: An important regulatorof triglyceride metabolism. J Inherit Metab Dis. 2008.
29. Lai CQ, Parnell LD, Ordovas JM. The APOA1/C3/A4/A5 gene cluster,lipid metabolism and cardiovascular disease risk. Curr Opin Lipidol.2005;16:153–166.
30. Ferre T, Riu E, Franckhauser S, Agudo J, Bosch F. Long-term overex-pression of glucokinase in the liver of transgenic mice leads to insulinresistance. Diabetologia. 2003;46:1662–1668.
31. O’Doherty RM, Lehman DL, Telemaque-Potts S, Newgard CB. Meta-bolic impact of glucokinase overexpression in liver: lowering of bloodglucose in fed rats is accompanied by hyperlipidemia. Diabetes. 1999;48:2022–2027.
32. Samani NJ, Braund PS, Erdmann J, Gotz A, Tomaszewski M, Linsel-Nitschke P, Hajat C, Mangino M, Hengstenberg C, Stark K, Ziegler A,Caulfield M, Burton PR, Schunkert H, Tobin MD. The novel geneticvariant predisposing to coronary artery disease in the region of the PSRC1and CELSR2 genes on chromosome 1 associates with serum cholesterol.J Mol Med. 2008;86:1233–1241.
33. Schadt EE, Molony C, Chudin E, Hao K, Yang X, Lum PY, KasarskisA, Zhang B, Wang S, Suver C, Zhu J, Millstein J, Sieberts S, Lamb J,GuhaThakurta D, Derry J, Storey JD, Vila-Campillo I, Kruger MJ,Johnson JM, Rohl CA, van NA, Mehrabian M, Drake TA, Lusis AJ,Smith RC, Guengerich FP, Strom SC, Schuetz E, Rushmore TH, UlrichR. Mapping the genetic architecture of gene expression in human liver.PLoS Biol. 2008;6:e107.
356 Circ Cardiovasc Genet August 2010
by guest on May 27, 2018
http://circgenetics.ahajournals.org/D
ownloaded from
34. Karthikeyan G, Teo KK, Islam S, McQueen MJ, Pais P, Wang X, Sato H,Lang CC, Sitthi-Amorn C, Pandey MR, Kazmi K, Sanderson JE, YusufS. Lipid profile, plasma apolipoproteins, and risk of a first myocardialinfarction among Asians: an analysis from the INTERHEART Study.J Am Coll Cardiol. 2009;53:244–253.
35. Helgadottir A, Manolescu A, Helgason A, Thorleifsson G, Thorsteins-dottir U, Gudbjartsson DF, Gretarsdottir S, Magnusson KP, Gud-mundsson G, Hicks A, Jonsson T, Grant SF, Sainz J, O’Brien SJ, Svein-bjornsdottir S, Valdimarsson EM, Matthiasson SE, Levey AI, AbramsonJL, Reilly MP, Vaccarino V, Wolfe ML, Gudnason V, Quyyumi AA,Topol EJ, Rader DJ, Thorgeirsson G, Gulcher JR, Hakonarson H, KongA, Stefansson K. A variant of the gene encoding leukotriene A4 hydrolaseconfers ethnicity-specific risk of myocardial infarction. Nat Genet. 2006;38:68–74.
36. Yasuda K, Miyake K, Horikawa Y, Hara K, Osawa H, Furuta H, HirotaY, Mori H, Jonsson A, Sato Y, Yamagata K, Hinokio Y, Wang HY,Tanahashi T, Nakamura N, Oka Y, Iwasaki N, Iwamoto Y, Yamada Y,Seino Y, Maegawa H, Kashiwagi A, Takeda J, Maeda E, Shin HD, ChoYM, Park KS, Lee HK, Ng MC, Ma RC, So WY, Chan JC, Lyssenko V,Tuomi T, Nilsson P, Groop L, Kamatani N, Sekine A, Nakamura Y,Yamamoto K, Yoshida T, Tokunaga K, Itakura M, Makino H, NanjoK, Kadowaki T, Kasuga M. Variants in KCNQ1 are associated withsusceptibility to type 2 diabetes mellitus. Nat Genet. 2008;40:1092–1097.
37. Unoki H, Takahashi A, Kawaguchi T, Hara K, Horikoshi M, Andersen G,Ng DP, Holmkvist J, Borch-Johnsen K, Jorgensen T, Sandbaek A, Lau-ritzen T, Hansen T, Nurbaya S, Tsunoda T, Kubo M, Babazono T, HiroseH, Hayashi M, Iwamoto Y, Kashiwagi A, Kaku K, Kawamori R, Tai ES,Pedersen O, Kamatani N, Kadowaki T, Kikkawa R, Nakamura Y, MaedaS. SNPs in KCNQ1 are associated with susceptibility to type 2 diabetesin East Asian and European populations. Nat Genet. 2008;40:1098–1102.
38. McCarthy MI, Abecasis GR, Cardon LR, Goldstein DB, Little J,Ioannidis JP, Hirschhorn JN. Genome-wide association studies forcomplex traits: consensus, uncertainty and challenges. Nat Rev Genet.2008;9:356–369.
39. McCarthy MI. Casting a wider net for diabetes susceptibility genes. NatGenet. 2008;40:1039–1040.
40. Ioannidis JP, Thomas G, Daly MJ. Validating, augmenting and refininggenome-wide association signals. Nat Rev Genet. 2009;10:318–329.
41. Dhandapany PS, Sadayappan S, Xue Y, Powell GT, Rani DS, Nallari P,Rai TS, Khullar M, Soares P, Bahl A, Tharkan JM, Vaideeswar P,Rathinavel A, Narasimhan C, Ayapati DR, Ayub Q, Mehdi SQ, Oppen-heimer S, Richards MB, Price AL, Patterson N, Reich D, Singh L,Tyler-Smith C, Thangaraj K. A common MYBPC3 (cardiac myosinbinding protein C) variant associated with cardiomyopathies in SouthAsia. Nat Genet. 2009;41:187–191.
42. Ioannidis JP, Thomas G, Daly MJ. Validating, augmenting and refininggenome-wide association signals. Nat Rev Genet. 2009;10:318–329.
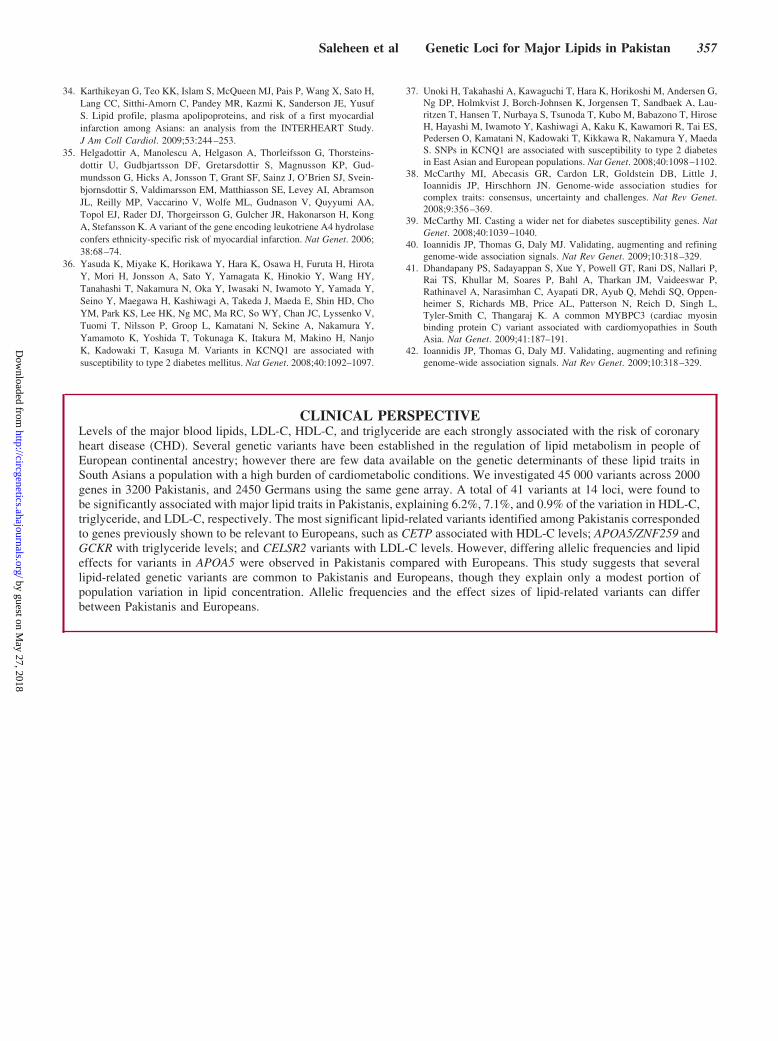
CLINICAL PERSPECTIVELevels of the major blood lipids, LDL-C, HDL-C, and triglyceride are each strongly associated with the risk of coronaryheart disease (CHD). Several genetic variants have been established in the regulation of lipid metabolism in people ofEuropean continental ancestry; however there are few data available on the genetic determinants of these lipid traits inSouth Asians a population with a high burden of cardiometabolic conditions. We investigated 45 000 variants across 2000genes in 3200 Pakistanis, and 2450 Germans using the same gene array. A total of 41 variants at 14 loci, were found tobe significantly associated with major lipid traits in Pakistanis, explaining 6.2%, 7.1%, and 0.9% of the variation in HDL-C,triglyceride, and LDL-C, respectively. The most significant lipid-related variants identified among Pakistanis correspondedto genes previously shown to be relevant to Europeans, such as CETP associated with HDL-C levels; APOA5/ZNF259 andGCKR with triglyceride levels; and CELSR2 variants with LDL-C levels. However, differing allelic frequencies and lipideffects for variants in APOA5 were observed in Pakistanis compared with Europeans. This study suggests that severallipid-related genetic variants are common to Pakistanis and Europeans, though they explain only a modest portion ofpopulation variation in lipid concentration. Allelic frequencies and the effect sizes of lipid-related variants can differbetween Pakistanis and Europeans.
Saleheen et al Genetic Loci for Major Lipids in Pakistan 357
by guest on May 27, 2018
http://circgenetics.ahajournals.org/D
ownloaded from
Frossard, John Danesh and Panos DeloukasPhilippeWinkelmann, Bernhard Böehm, Simon Thompson, Willem Ouwehand, Winfried März,
Muhammad, Gurdeep Sagoo, Sarah Bray, Ralph McGinnis, Frank Dudbridge, Bernhard R.Shahid Abbas, Junaid Zafar, Faisal Shahid, Shahzad Majeed Bhatti, Syed Saadat Ali, Fahim
Kishore Kumar, Asim Saleem, Kishwar Kumar, Muhammad Salman Daood, Aftab Alam Gul,Tanja B. Grammer, Jonathon Stephens, Anthony Attwood, Kerstin Koch, Mustafa Hussain, Ghaffar, Fazal-ur Rehman, Michael Marcus Hoffmann, Wilfried Renner, Marcus E. Kleber,
Rasheed, Rashid Jooma, Jawaid Hassan Niazi, Ali Raza Gardezi, Nazir Ahmed Memon, Abdul Nadeem Hayat Mallick, Muhammad Azhar, Abdus Samad, Muhammad Ishaq, Syed Zahed
Zaman, Assadullah Kundi, Zia Yaqoob, Liaquat Ali Cheema, Nadeem Qamar, Azhar Faruqui, Thompson, Reeta Gobin, Adam Butterworth, Usman Ahmad, Abdul Hakeem, Khan Shah
Nasir Sheikh, Nabi Shah, Maria Samuel, Shajjia Razi Haider, Muhammed Murtaza, Alexander Bumpstead, Stephen Kaptoge, Emanuele Di Angelantonio, Nadeem Sarwar, Sarah E. Hunt,
Alexander, Michael Inouye, Moazzam Zaidi, Simon Potter, Philip Haycock, Suzanna Danish Saleheen, Nicole Soranzo, Asif Rasheed, Hubert Scharnagl, Rhian Gwilliam, MyriamGenetic Determinants of Major Blood Lipids in Pakistanis Compared With Europeans
Print ISSN: 1942-325X. Online ISSN: 1942-3268 Copyright © 2010 American Heart Association, Inc. All rights reserved.
Dallas, TX 75231is published by the American Heart Association, 7272 Greenville Avenue,Circulation: Cardiovascular Genetics
doi: 10.1161/CIRCGENETICS.109.9061802010;3:348-357; originally published online June 22, 2010;Circ Cardiovasc Genet.
http://circgenetics.ahajournals.org/content/3/4/348World Wide Web at:
The online version of this article, along with updated information and services, is located on the
http://circgenetics.ahajournals.org//subscriptions/
is online at: Circulation: Cardiovascular Genetics Information about subscribing to Subscriptions:
http://www.lww.com/reprints Information about reprints can be found online at: Reprints:
document. Permissions and Rights Question and Answer information about this process is available in the
requested is located, click Request Permissions in the middle column of the Web page under Services. FurtherCenter, not the Editorial Office. Once the online version of the published article for which permission is being
can be obtained via RightsLink, a service of the Copyright ClearanceCirculation: Cardiovascular Geneticsin Requests for permissions to reproduce figures, tables, or portions of articles originally publishedPermissions:
by guest on May 27, 2018
http://circgenetics.ahajournals.org/D
ownloaded from

http://circgenetics.ahajournals.org/content/suppl/2010/06/22/CIRCGENETICS.109.906180.DC1Data Supplement (unedited) at:
http://circgenetics.ahajournals.org//subscriptions/
is online at: Circulation: Cardiovascular Genetics Information about subscribing to Subscriptions:
http://www.lww.com/reprints Information about reprints can be found online at: Reprints:
document. Permissions and Rights Question and Answer information about this process is available in the
requested is located, click Request Permissions in the middle column of the Web page under Services. FurtherCenter, not the Editorial Office. Once the online version of the published article for which permission is being
can be obtained via RightsLink, a service of the Copyright ClearanceCirculation: Cardiovascular Geneticsin Requests for permissions to reproduce figures, tables, or portions of articles originally publishedPermissions:
by guest on May 27, 2018
http://circgenetics.ahajournals.org/D
ownloaded from

1
"SUPPLEMENTAL MATERIAL."
2
Supplemental Figure 1: Scatter plot of additional principal components and self reported ethnicities in PROMIS control participants
3
PROMIS LURIC P‐value for difference between studies
Chr snp bp gene a1 N maf beta se p N maf beta se p
Association with HDL‐C levels (mmol/l)
16 rs711752 55553712 CETP T 3023 0.47 0.048 0.006 4.67E‐14 2451 0.42 0.058 0.007 5.05E‐15 0.45
16 rs708272 55553789 CETP A 3023 0.47 0.048 0.006 4.77E‐14 2450 0.42 0.058 0.007 4.77E‐15 0.76
16 rs17231506 55552029 CETP A 3023 0.33 0.049 0.007 5.54E‐13 2451 0.32 0.059 0.008 7.50E‐14 1
16 rs3764261 55550825 CETP A 3023 0.33 0.049 0.007 1.17E‐12 2451 0.32 0.058 0.008 1.08E‐13 0.63
16 rs11508026 55556829 CETP A 3021 0.46 0.046 0.006 1.47E‐12 2452 0.42 0.058 0.007 3.40E‐15 0.55
16 rs1532625 55562802 CETP T 2996 0.48 0.045 0.006 2.27E‐12 2428 0.43 0.058 0.007 8.28E‐15 0.63
16 rs1800775 55552737 CETP G 3024 0.40 ‐0.045 0.006 3.00E‐12 2451 0.53 ‐0.062 0.007 3.69E‐17 0.11
16 rs1532624 55562980 CETP T 3023 0.48 0.044 0.006 4.06E‐12 2448 0.43 0.057 0.007 8.69E‐15 0.25
16 rs1864163 55554734 CETP A 3024 0.22 ‐0.043 0.008 1.56E‐08 2443 0.27 ‐0.063 0.009 2.40E‐13 0.16
16 rs7499892 55564091 CETP A 3023 0.22 ‐0.042 0.008 3.82E‐08 2452 0.18 ‐0.063 0.010 8.52E‐11 0.11
16 rs11076175 55563879 CETP G 3022 0.19 ‐0.044 0.008 5.04E‐08 2451 0.18 ‐0.063 0.010 1.27E‐10 0.36
16 rs5880 55572592 CETP G 3024 0.08 ‐0.064 0.012 7.86E‐08 2451 0.05 ‐0.068 0.017 5.25E‐05 0.69
16 rs12720922 55558386 CETP T 3024 0.20 ‐0.042 0.008 1.29E‐07 2451 0.18 ‐0.060 0.010 1.02E‐09 0.48
16 rs9939224 55560233 CETP A 3021 0.22 ‐0.039 0.008 2.74E‐07 2452 0.21 ‐0.062 0.009 1.49E‐11 0.25
16 rs12708967 55550712 CETP G 3021 0.22 ‐0.039 0.008 3.85E‐07 2452 0.20 ‐0.036 0.009 1.16E‐04 0.26
16 rs11076176 55564947 CETP C 3021 0.21 ‐0.038 0.008 6.71E‐07 2450 0.18 ‐0.063 0.010 9.67E‐11 0.04
Association with LDL‐C levels (mmol/l)
1 rs646776++ 109620053 CELSR2 G 5576 0.25 ‐0.158 0.025 7.19E‐10 1175 0.239 ‐0.014 0.040 0.7224 0.05
Association with log‐triglyceride levels (mmol/l)
11 rs662799 116168917 APOA5 C 3195 0.17 0.142 0.018 1.25E‐14 2452 0.07 0.080 0.026 2.22E‐03 0.07
11 rs651821 116167789 APOA5 C 3195 0.17 0.142 0.018 1.47E‐14 2452 0.07 0.083 0.026 1.49E‐03 0.15
11 rs2072560 116167036 APOA5 A 3195 0.16 0.142 0.019 2.13E‐14 2450 0.07 0.077 0.026 3.34E‐03 0.11
11 rs2266788 116165896 APOA5 G 3195 0.20 0.129 0.017 6.94E‐14 2452 0.07 0.073 0.025 3.83E‐03 0.17
11 rs2075290 116158506 ZNF259/APOA5 G 3189 0.19 0.132 0.018 8.77E‐14 2452 0.07 0.077 0.025 2.15E‐03 0.19
2 rs1260326++ 27584444 GCKR T 5500 0.26 0.078 0.012 1.09E‐10 2451 0.44 0.078 0.014 7.19E‐09 0.86
2 rs780093 27596107 GCKR T 3194 0.26 0.075 0.016 2.35E‐06 2445 0.44 0.080 0.014 3.41E‐09 0.64
2 rs780094 27594741 GCKR T 3185 0.26 0.074 0.016 2.63E‐06 2449 0.44 0.080 0.014 3.86E‐09 0.69
Supplemental Table 1: Association of major lipid traits in PROMIS and comparison with the LURIC participants of SNPs significantly associated in PROMIS (P < 10-6)
++Genotyping was done in further 2555 PROMIS individuals for variants associated with lipid traits at a P < 10-5
Chr: chromosome, a1: minor allele, N: number of individuals, maf: minor allele frequency, beta: per-minor allele increase in lipid levels, adjusted for age, sex, the first two principal components and case-control status. For LDL, the LURIC dataset was restricted to participants not on lipid lowering drugs. The P-value for difference between studies corresponds to a test of nullity of interaction term between study and the SNP of interest.
4
rs1107617516
rs1107617616
rs1150802616
rs1270896716
rs1272092216
rs153262416
rs153262516
rs1723150616
rs180077516
rs186416316
rs376426116
rs588016
rs70827216
rs71175216
rs749989216
rs993922416
SNP_id/Chr.
Status
-0.05 (-0.07, -0.02)-0.08 (-0.11, -0.05)
-0.04 (-0.06, -0.01)-0.06 (-0.08, -0.03)
0.05 (0.03, 0.07)0.06 (0.04, 0.09)
-0.06 (-0.08, -0.03)-0.06 (-0.09, -0.03)
-0.05 (-0.07, -0.02)-0.08 (-0.11, -0.05)
0.05 (0.03, 0.07)0.06 (0.04, 0.09)
0.05 (0.03, 0.08)0.07 (0.04, 0.09)
0.06 (0.04, 0.09)0.07 (0.05, 0.10)
-0.04 (-0.06, -0.02)-0.07 (-0.10, -0.05)
-0.05 (-0.07, -0.02)-0.07 (-0.10, -0.04)
0.06 (0.04, 0.09)0.07 (0.05, 0.10)
-0.08 (-0.12, -0.04)-0.07 (-0.11, -0.02)
0.05 (0.03, 0.08)0.07 (0.05, 0.09)
0.06 (0.03, 0.08)0.07 (0.05, 0.09)
-0.05 (-0.07, -0.02)-0.07 (-0.10, -0.04)
-0.04 (-0.07, -0.02)-0.07 (-0.10, -0.05)
Mean difference (95% CI)
.128
.288
.554
.869
.118
.491
.502
.609
.049
.196
.57
.609
.327
.362
.327
.119
P-value het.
-0.05 (-0.07, -0.02)-0.08 (-0.11, -0.05)
-0.04 (-0.06, -0.01)-0.06 (-0.08, -0.03)
0.05 (0.03, 0.07)0.06 (0.04, 0.09)
-0.06 (-0.08, -0.03)-0.06 (-0.09, -0.03)
-0.05 (-0.07, -0.02)-0.08 (-0.11, -0.05)
0.05 (0.03, 0.07)0.06 (0.04, 0.09)
0.05 (0.03, 0.08)0.07 (0.04, 0.09)
0.06 (0.04, 0.09)0.07 (0.05, 0.10)
-0.04 (-0.06, -0.02)-0.07 (-0.10, -0.05)
-0.05 (-0.07, -0.02)-0.07 (-0.10, -0.04)
0.06 (0.04, 0.09)0.07 (0.05, 0.10)
-0.08 (-0.12, -0.04)-0.07 (-0.11, -0.02)
0.05 (0.03, 0.08)0.07 (0.05, 0.09)
0.06 (0.03, 0.08)0.07 (0.05, 0.09)
-0.05 (-0.07, -0.02)-0.07 (-0.10, -0.04)
-0.04 (-0.07, -0.02)-0.07 (-0.10, -0.05)
.128
.288
.554
.869
.118
.491
.502
.609
.049
.196
.570
.609
.327
.362
.327
.119
0-.1 -.05 0 .05 .1
casecontrol
casecontrol
casecontrol
casecontrol
casecontrol
casecontrol
casecontrol
casecontrol
casecontrol
casecontrol
casecontrol
casecontrol
casecontrol
casecontrol
casecontrol
casecontrol
mmol/l
Supplemental Figure 2(a): Association with HDL-C in PROMIS cases and controls for SNPs significantly associated with HDL-C levels in all PROMIS participants (P < 10-6)
5
Supplemental Figure 2(b): Association with log-triglyceride in PROMIS cases and controls for SNPs significantly associated with triglyceride levels in all PROMIS participants (P < 10-6)
rs12603262
rs207256011
rs207529011
rs226678811
rs65182111
rs66279911
rs7800932
rs7800942
SNP_id/chr
casecontrol
casecontrol
casecontrol
casecontrol
casecontrol
casecontrol
casecontrol
casecontrol
Status
0.08 (0.04, 0.12)0.08 (0.03, 0.12)
0.15 (0.10, 0.20)0.13 (0.08, 0.18)
0.14 (0.09, 0.19)0.12 (0.07, 0.17)
0.13 (0.08, 0.18)0.13 (0.08, 0.18)
0.15 (0.10, 0.20)0.13 (0.08, 0.19)
0.15 (0.10, 0.20)0.13 (0.08, 0.19)
0.07 (0.03, 0.11)0.08 (0.03, 0.12)
0.07 (0.03, 0.11)0.08 (0.03, 0.12)
Mean Difference(95% CI)
.908
.608
.561
.972
.732
.734
.909
.838
P-value het.
0.08 (0.04, 0.12)0.08 (0.03, 0.12)
0.15 (0.10, 0.20)0.13 (0.08, 0.18)
0.14 (0.09, 0.19)0.12 (0.07, 0.17)
0.13 (0.08, 0.18)0.13 (0.08, 0.18)
0.15 (0.10, 0.20)0.13 (0.08, 0.19)
0.15 (0.10, 0.20)0.13 (0.08, 0.19)
0.07 (0.03, 0.11)0.08 (0.03, 0.12)
0.07 (0.03, 0.11)0.08 (0.03, 0.12)
.908
.608
.561
.972
.732
.734
.909
.838
0 .050 .05 .1 .15 .2
log mmol/l
6
Supplemental Figure 2(c): Association with LDL-C in PROMIS cases and controls for SNPs significantly associated with LDL-C levels in all PROMIS participants
Supplemental Figures 2 (a-c): Estimates represent the per-minor allele increase in lipid levels, adjusted for age, sex, the first two principal components. P_value het. Is the P-value for heterogeneity for effect estimates obtained in cases and controls. Chr: chromosome.
rs6467761
chr
case
control
Status
-0.05 (-0.09, -0.02)
-0.07 (-0.11, -0.03)
Mean Difference(95% CI)
.584
P_value het.
-0.05 (-0.09, -0.02)
-0.07 (-0.11, -0.03)
.584
0-.1 -.05 0 .05
SNP_id/
rs6467761
chr
case
control
Status
-0.05 (-0.09, -0.02)
-0.07 (-0.11, -0.03)
Mean Difference(95% CI)
.584
P_value het.
-0.05 (-0.09, -0.02)
-0.07 (-0.11, -0.03)
.584
0-.1 -.05 0 .05
SNP_id/
mmol/l
7
Supplemental Figure 3(a): Meta-analysis of previously published studies in Europeans for the association of rs1800775 (C-629A) variant, located in the CETP gene, with HDL-C levels Suppl1-20
% Weight
NOTE: Weights are from random effects analysis
Overall random effect I-squared = 10% (95% CI 0% - 43%), p = 0.318)
Blankenberg S (AtheroGene)
Thompson JF
Ridker (WGHS)
Eiriksdottir Reykjavik)
Thompson JF
Overall fixed effect
Dullaart (PREVEND)
Schouw (PROSPECT/EPIC)
Bernstein MS
Sabatti (NFBC1966)
Kathiresan (NORDIL)
Girelli (Verona Heart Project)
Kathiresan (FIINRISK97)
Kathiresan (MDC-CC)
Kakko (OPERA)
Tobin MD
Aulchenko (ENGAGE consortium)
Bauerfeind
Freeman DJ (WOSCOPS)
Kathiresan (DGI)
Horne (IHCS)
Dachet C (ECTIM)
Author (Name of Study)
Heidema (CDRFMP)
Chasman (WGHS)
Barzilai N (Longevity)
McCaskie (CUDAS/BPHS/CUPID)
Rotterdam study
2004
2007
2009
2001
2003
2007
2003
2009
2008
2008
2008
2001
2004
2009
2002
2003
2008
2007
1999
Year
2007
2008
2003
2007
2007
574
2087
18000
745
93
8141
1519
1720
4531
5095
1187
7940
5519
481
182
5840
185
1107
2758
1309
668
Number ofparticipants
1071
6195
743
1059
1435
0.07 (0.07, 0.08)
0.08 (0.03, 0.13)
0.05 (0.03, 0.07)
0.08 (0.07, 0.09)
0.08 (0.05, 0.11)
0.08 (-0.00, 0.15)
0.07 (0.07, 0.08)
0.06 (0.05, 0.08)
0.08 (0.05, 0.11)
0.05 (0.02, 0.09)
0.07 (0.05, 0.09)
0.08 (0.05, 0.10)
0.07 (0.04, 0.10)
0.06 (0.05, 0.08)
0.08 (0.07, 0.09)
0.05 (0.01, 0.09)
0.06 (-0.01, 0.13)
0.06 (0.05, 0.08)
0.07 (-0.01, 0.15)
0.06 (0.04, 0.08)
0.07 (0.05, 0.09)
0.05 (-0.00, 0.11)
0.08 (0.04, 0.12)
ES (95% CI)
0.07 (0.04, 0.10)
0.09 (0.08, 0.10)
0.07 (0.03, 0.11)
0.07 (0.04, 0.11)
0.08 (0.06, 0.11)
100.00
0.84
5.44
14.06
2.38
0.32
9.87
2.32
1.50
3.79
3.88
2.24
7.79
7.79
1.17
0.38
9.33
0.32
4.20
4.43
0.59
1.11
(D+L)
2.14
8.28
1.17
1.73
2.94
0.07 (0.07, 0.08)
0.08 (0.03, 0.13)
0.05 (0.03, 0.07)
0.08 (0.07, 0.09)
0.08 (0.05, 0.11)
0.08 (-0.00, 0.15)
0.07 (0.07, 0.08)
0.06 (0.05, 0.08)
0.08 (0.05, 0.11)
0.05 (0.02, 0.09)
0.07 (0.05, 0.09)
0.08 (0.05, 0.10)
0.07 (0.04, 0.10)
0.06 (0.05, 0.08)
0.08 (0.07, 0.09)
0.05 (0.01, 0.09)
0.06 (-0.01, 0.13)
0.06 (0.05, 0.08)
0.07 (-0.01, 0.15)
0.06 (0.04, 0.08)
0.07 (0.05, 0.09)
0.05 (-0.00, 0.11)
0.08 (0.04, 0.12)
ES (95% CI)
0.07 (0.04, 0.10)
0.09 (0.08, 0.10)
0.07 (0.03, 0.11)
0.07 (0.04, 0.11)
0.08 (0.06, 0.11)
100.00
0.84
5.44
14.06
2.38
0.32
9.87
2.32
1.50
3.79
3.88
2.24
7.79
7.79
1.17
0.38
9.33
0.32
4.20
4.43
0.59
1.11
(D+L)
2.14
8.28
1.17
1.73
2.94
0-.153 0 .153
Effect Size
8
Supplemental Figure 3(b): Meta-analysis of previously published studies in Europeans for the association of rs708272 (Taq1B) variant, located in the CETP gene, with HDL-C levels Suppl3, 5, 8, 21-59
% Weight
NOTE: Weights are from random effects analysis
Overall Random Effect I-squared = 67.0% (95% CI 55% - 76%), p = <0.001)
Mitchell
Pai J (NHS)
Gudson (EARS)
Corella D
Eiriksdottir (Reykjavik)
Klos K (CARDIA)
Girelli (Verona Heart Project)
Noone EOrdovas (Framingham)
Schouw (PROSPECT-EPIC)Sorli
Hall
Cuchel (NORM & CATH)
Horne (IHCS)
Miltiadous
Ridker (WGHS)
I-V Overall
Plat
Vohl MC
Barzilai N (Longevity)
Dullaart (PREVEND)
Liu (PHS)Kuivenhoven JA (The Monitoring Project)
Riemens
Talmud (NPHS)
Deguchi (SVTR)
Freeman DJ
Kondon I
Tenkanen H
Heidema (CDRFMP)
Juvonen T
Thompson JF
Blankenberg S (Atherogene)
Thompson JF
Hannuksela
Freeman DJ (WOSCOPS)
Kauma H
Pai J (HPFS)
Nettleton (ARIC)
Keavney
Carr
McCaskie (CUDAS/BPHS/CUPID)
Fumeron F (ECTIM)
Bauerfeind
Author (Name of Study)
Sandhofer (Salzburg Atherosclerosis Prevention)
Arca
Weitgasser (SAPHIR)
1994
2004
1998
2000
2001
2007
20002007
2006
2006
2002
2007
2004
2009
2002
1999
2003
2007
20021997
1999
2002
2004
1994
1989
1991
2007
1995
2007
2004
2003
1994
2003
1996
2004
2006
2004
2002
2007
1995
2002
Year
2008
2001
2004
112
480
767
514
745
1586
296
632916
1399549
116
224
1298
95
18245
112
182
373
8289
384238
32
1727
49
220
146
109
1075
91
2105
571
93
82
1105
524
513
8764
4665
120
1058
724
184
Number ofParticipants
1503
180
1017
0.06 (0.05, 0.07)
0.12 (0.02, 0.21)
0.11 (0.06, 0.17)
0.07 (0.05, 0.09)
0.11 (0.07, 0.14)
0.07 (0.03, 0.10)
0.06 (0.04, 0.08)
0.02 (-0.03, 0.07)
0.02 (-0.12, 0.15)0.06 (0.04, 0.08)
0.06 (0.03, 0.09)0.05 (0.01, 0.09)
0.08 (-0.02, 0.18)
0.06 (-0.02, 0.13)
0.05 (-0.01, 0.11)
0.03 (-0.05, 0.11)
0.07 (0.07, 0.08)
0.07 (0.07, 0.07)
0.06 (-0.03, 0.15)
0.06 (0.02, 0.09)
0.12 (0.05, 0.18)
0.06 (0.05, 0.08)
0.05 (0.01, 0.09)0.12 (0.05, 0.18)
-0.00 (-0.11, 0.11)
0.05 (0.04, 0.07)
0.02 (-0.10, 0.15)
0.10 (0.03, 0.17)
0.11 (0.02, 0.20)
0.04 (-0.07, 0.16)
0.07 (0.04, 0.10)
0.20 (0.03, 0.37)
0.05 (0.03, 0.07)
0.08 (0.03, 0.13)
0.07 (-0.02, 0.17)
0.10 (-0.00, 0.20)
0.05 (0.02, 0.07)
0.06 (0.02, 0.10)
-0.11 (-0.15, -0.07)
0.07 (0.06, 0.09)
0.06 (0.04, 0.07)
0.10 (0.01, 0.19)
0.07 (0.03, 0.10)
0.08 (0.04, 0.12)
0.06 (-0.02, 0.14)
0.06 (0.03, 0.09)
0.10 (0.01, 0.18)
0.09 (0.05, 0.12)
100.00
0.66
1.39
3.98
3.04
2.85
3.96
1.67
0.334.34
3.052.53
0.55
0.98
1.38
0.84
5.58
0.66
2.68
1.21
5.00
2.141.26
0.47
4.51
0.40
1.03
0.65
0.46
3.11
0.20
4.41
1.82
0.59
0.54
3.98
2.22
2.29
4.96
4.93
0.69
2.75
2.35
0.86
(D+L)
3.24
0.76
2.72
0.06 (0.05, 0.07)
0.12 (0.02, 0.21)
0.11 (0.06, 0.17)
0.07 (0.05, 0.09)
0.11 (0.07, 0.14)
0.07 (0.03, 0.10)
0.06 (0.04, 0.08)
0.02 (-0.03, 0.07)
0.02 (-0.12, 0.15)0.06 (0.04, 0.08)
0.06 (0.03, 0.09)0.05 (0.01, 0.09)
0.08 (-0.02, 0.18)
0.06 (-0.02, 0.13)
0.05 (-0.01, 0.11)
0.03 (-0.05, 0.11)
0.07 (0.07, 0.08)
0.07 (0.07, 0.07)
0.06 (-0.03, 0.15)
0.06 (0.02, 0.09)
0.12 (0.05, 0.18)
0.06 (0.05, 0.08)
0.05 (0.01, 0.09)0.12 (0.05, 0.18)
-0.00 (-0.11, 0.11)
0.05 (0.04, 0.07)
0.02 (-0.10, 0.15)
0.10 (0.03, 0.17)
0.11 (0.02, 0.20)
0.04 (-0.07, 0.16)
0.07 (0.04, 0.10)
0.20 (0.03, 0.37)
0.05 (0.03, 0.07)
0.08 (0.03, 0.13)
0.07 (-0.02, 0.17)
0.10 (-0.00, 0.20)
0.05 (0.02, 0.07)
0.06 (0.02, 0.10)
-0.11 (-0.15, -0.07)
0.07 (0.06, 0.09)
0.06 (0.04, 0.07)
0.10 (0.01, 0.19)
0.07 (0.03, 0.10)
0.08 (0.04, 0.12)
0.06 (-0.02, 0.14)
ES (95% CI)
0.06 (0.03, 0.09)
0.10 (0.01, 0.18)
0.09 (0.05, 0.12)
100.00
0.66
1.39
3.98
3.04
2.85
3.96
1.67
0.334.34
3.052.53
0.55
0.98
1.38
0.84
5.58
0.66
2.68
1.21
5.00
2.141.26
0.47
4.51
0.40
1.03
0.65
0.46
3.11
0.20
4.41
1.82
0.59
0.54
3.98
2.22
2.29
4.96
4.93
0.69
2.75
2.35
0.86
(D+L)
3.24
0.76
2.72
0-.374 0 .374
% Weight
NOTE: Weights are from random effects analysis
Overall Random Effect I-squared = 67.0% (95% CI 55% - 76%), p = <0.001)
Mitchell
Pai J (NHS)
Gudson (EARS)
Corella D
Eiriksdottir (Reykjavik)
Klos K (CARDIA)
Girelli (Verona Heart Project)
Noone EOrdovas (Framingham)
Schouw (PROSPECT-EPIC)Sorli
Hall
Cuchel (NORM & CATH)
Horne (IHCS)
Miltiadous
Ridker (WGHS)
I-V Overall
Plat
Vohl MC
Barzilai N (Longevity)
Dullaart (PREVEND)
Liu (PHS)Kuivenhoven JA (The Monitoring Project)
Riemens
Talmud (NPHS)
Deguchi (SVTR)
Freeman DJ
Kondon I
Tenkanen H
Heidema (CDRFMP)
Juvonen T
Thompson JF
Blankenberg S (Atherogene)
Thompson JF
Hannuksela
Freeman DJ (WOSCOPS)
Kauma H
Pai J (HPFS)
Nettleton (ARIC)
Keavney
Carr
McCaskie (CUDAS/BPHS/CUPID)
Fumeron F (ECTIM)
Bauerfeind
Author (Name of Study)
Sandhofer (Salzburg Atherosclerosis Prevention)
Arca
Weitgasser (SAPHIR)
1994
2004
1998
2000
2001
2007
20002007
2006
2006
2002
2007
2004
2009
2002
1999
2003
2007
20021997
1999
2002
2004
1994
1989
1991
2007
1995
2007
2004
2003
1994
2003
1996
2004
2006
2004
2002
2007
1995
2002
Year
2008
2001
2004
112
480
767
514
745
1586
296
632916
1399549
116
224
1298
95
18245
112
182
373
8289
384238
32
1727
49
220
146
109
1075
91
2105
571
93
82
1105
524
513
8764
4665
120
1058
724
184
Number ofParticipants
1503
180
1017
0.06 (0.05, 0.07)
0.12 (0.02, 0.21)
0.11 (0.06, 0.17)
0.07 (0.05, 0.09)
0.11 (0.07, 0.14)
0.07 (0.03, 0.10)
0.06 (0.04, 0.08)
0.02 (-0.03, 0.07)
0.02 (-0.12, 0.15)0.06 (0.04, 0.08)
0.06 (0.03, 0.09)0.05 (0.01, 0.09)
0.08 (-0.02, 0.18)
0.06 (-0.02, 0.13)
0.05 (-0.01, 0.11)
0.03 (-0.05, 0.11)
0.07 (0.07, 0.08)
0.07 (0.07, 0.07)
0.06 (-0.03, 0.15)
0.06 (0.02, 0.09)
0.12 (0.05, 0.18)
0.06 (0.05, 0.08)
0.05 (0.01, 0.09)0.12 (0.05, 0.18)
-0.00 (-0.11, 0.11)
0.05 (0.04, 0.07)
0.02 (-0.10, 0.15)
0.10 (0.03, 0.17)
0.11 (0.02, 0.20)
0.04 (-0.07, 0.16)
0.07 (0.04, 0.10)
0.20 (0.03, 0.37)
0.05 (0.03, 0.07)
0.08 (0.03, 0.13)
0.07 (-0.02, 0.17)
0.10 (-0.00, 0.20)
0.05 (0.02, 0.07)
0.06 (0.02, 0.10)
-0.11 (-0.15, -0.07)
0.07 (0.06, 0.09)
0.06 (0.04, 0.07)
0.10 (0.01, 0.19)
0.07 (0.03, 0.10)
0.08 (0.04, 0.12)
0.06 (-0.02, 0.14)
0.06 (0.03, 0.09)
0.10 (0.01, 0.18)
0.09 (0.05, 0.12)
100.00
0.66
1.39
3.98
3.04
2.85
3.96
1.67
0.334.34
3.052.53
0.55
0.98
1.38
0.84
5.58
0.66
2.68
1.21
5.00
2.141.26
0.47
4.51
0.40
1.03
0.65
0.46
3.11
0.20
4.41
1.82
0.59
0.54
3.98
2.22
2.29
4.96
4.93
0.69
2.75
2.35
0.86
(D+L)
3.24
0.76
2.72
0.06 (0.05, 0.07)
0.12 (0.02, 0.21)
0.11 (0.06, 0.17)
0.07 (0.05, 0.09)
0.11 (0.07, 0.14)
0.07 (0.03, 0.10)
0.06 (0.04, 0.08)
0.02 (-0.03, 0.07)
0.02 (-0.12, 0.15)0.06 (0.04, 0.08)
0.06 (0.03, 0.09)0.05 (0.01, 0.09)
0.08 (-0.02, 0.18)
0.06 (-0.02, 0.13)
0.05 (-0.01, 0.11)
0.03 (-0.05, 0.11)
0.07 (0.07, 0.08)
0.07 (0.07, 0.07)
0.06 (-0.03, 0.15)
0.06 (0.02, 0.09)
0.12 (0.05, 0.18)
0.06 (0.05, 0.08)
0.05 (0.01, 0.09)0.12 (0.05, 0.18)
-0.00 (-0.11, 0.11)
0.05 (0.04, 0.07)
0.02 (-0.10, 0.15)
0.10 (0.03, 0.17)
0.11 (0.02, 0.20)
0.04 (-0.07, 0.16)
0.07 (0.04, 0.10)
0.20 (0.03, 0.37)
0.05 (0.03, 0.07)
0.08 (0.03, 0.13)
0.07 (-0.02, 0.17)
0.10 (-0.00, 0.20)
0.05 (0.02, 0.07)
0.06 (0.02, 0.10)
-0.11 (-0.15, -0.07)
0.07 (0.06, 0.09)
0.06 (0.04, 0.07)
0.10 (0.01, 0.19)
0.07 (0.03, 0.10)
0.08 (0.04, 0.12)
0.06 (-0.02, 0.14)
ES (95% CI)
0.06 (0.03, 0.09)
0.10 (0.01, 0.18)
0.09 (0.05, 0.12)
100.00
0.66
1.39
3.98
3.04
2.85
3.96
1.67
0.334.34
3.052.53
0.55
0.98
1.38
0.84
5.58
0.66
2.68
1.21
5.00
2.141.26
0.47
4.51
0.40
1.03
0.65
0.46
3.11
0.20
4.41
1.82
0.59
0.54
3.98
2.22
2.29
4.96
4.93
0.69
2.75
2.35
0.86
(D+L)
3.24
0.76
2.72
0-.374 0 .374Effect Size
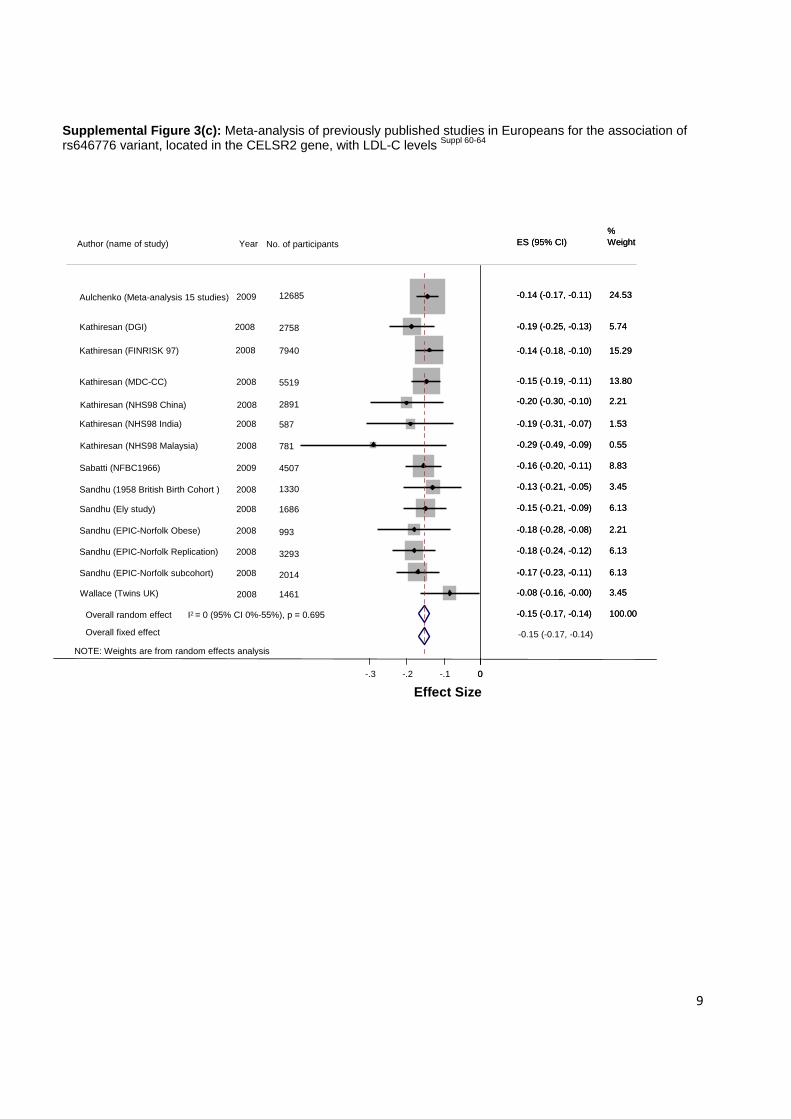
9
Supplemental Figure 3(c): Meta-analysis of previously published studies in Europeans for the association of rs646776 variant, located in the CELSR2 gene, with LDL-C levels Suppl 60-64
NOTE: Weights are from random effects analysis
12685
1461
3293
781
4507
587
1686
993
2891
2014
5519
1330
2758
7940
-0.15 (-0.17, -0.14)
-0.14 (-0.17, -0.11)
-0.08 (-0.16, -0.00)
-0.18 (-0.24, -0.12)
-0.29 (-0.49, -0.09)
-0.16 (-0.20, -0.11)
-0.19 (-0.31, -0.07)
-0.15 (-0.21, -0.09)
-0.18 (-0.28, -0.08)
-0.20 (-0.30, -0.10)
-0.17 (-0.23, -0.11)
-0.15 (-0.19, -0.11)
-0.13 (-0.21, -0.05)
-0.19 (-0.25, -0.13)
-0.14 (-0.18, -0.10)
100.00
24.53
3.45
6.13
0.55
8.83
1.53
6.13
2.21
2.21
6.13
13.80
3.45
5.74
15.29
0-.3 -.2 -.1 0
Overall random effect
2008
2009
2008
2008
2008
2008
2008
2008
2008
2008
2008
2009
2008
Kathiresan (FINRISK 97)
Sabatti (NFBC1966)
Wallace (Twins UK)
Sandhu (EPIC-Norfolk Obese)
Sandhu (EPIC-Norfolk Replication)
Sandhu (Ely study)
Kathiresan (MDC-CC)
Kathiresan (NHS98 Malaysia)
Sandhu (1958 British Birth Cohort )
Kathiresan (NHS98 India)
Sandhu (EPIC-Norfolk subcohort)
Aulchenko (Meta-analysis 15 studies)
Kathiresan (DGI)
2008Kathiresan (NHS98 China)
ES (95% CI)%WeightES (95% CI)%WeightNo. of participantsYearAuthor (name of study)
-0.15 (-0.17, -0.14)Overall fixed effect
I2 = 0 (95% CI 0%-55%), p = 0.695
Effect Size
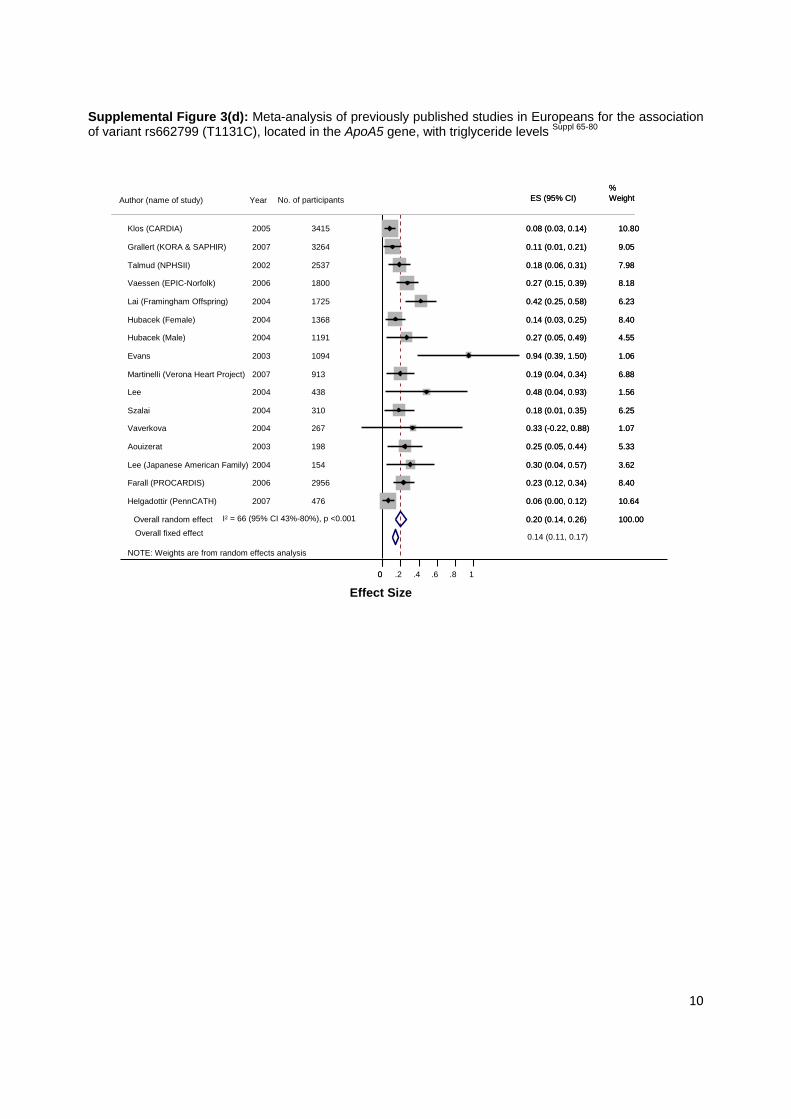
10
Supplemental Figure 3(d): Meta-analysis of previously published studies in Europeans for the association of variant rs662799 (T1131C), located in the ApoA5 gene, with triglyceride levels Suppl 65-80
NOTE: Weights are from random effects analysis
Overall random effect
Hubacek (Male)
Hubacek (Female)
Helgadottir (PennCATH)
Lee (Japanese American Family)
Talmud (NPHSII)
Grallert (KORA & SAPHIR)
Szalai
Martinelli (Verona Heart Project)
Lee
Vaessen (EPIC-Norfolk)
Aouizerat
Farall (PROCARDIS)
Lai (Framingham Offspring)
Klos (CARDIA)
Evans
Vaverkova
1191
1368
476
154
2537
3264
310
913
438
1800
198
2956
1725
3415
1094
267
0.20 (0.14, 0.26)
0.27 (0.05, 0.49)
0.14 (0.03, 0.25)
0.06 (0.00, 0.12)
0.30 (0.04, 0.57)
0.18 (0.06, 0.31)
0.11 (0.01, 0.21)
0.18 (0.01, 0.35)
0.19 (0.04, 0.34)
0.48 (0.04, 0.93)
0.27 (0.15, 0.39)
0.25 (0.05, 0.44)
0.23 (0.12, 0.34)
0.42 (0.25, 0.58)
0.08 (0.03, 0.14)
0.94 (0.39, 1.50)
0.33 (-0.22, 0.88)
100.00
4.55
8.40
10.64
3.62
7.98
9.05
6.25
6.88
1.56
8.18
5.33
8.40
6.23
10.80
1.06
1.07
00 .2 .4 .6 .8 1
ES (95% CI)%WeightES (95% CI)%WeightNo. of participantsYearAuthor (name of study)
2004
2004
2007
2004
2002
2007
2004
2007
2004
2006
2003
2006
2004
2005
2003
2004
0.14 (0.11, 0.17)Overall fixed effect
I2 = 66 (95% CI 43%-80%), p <0.001
Effect Size
11
References for Supplemental figures 3a-3d
Supplementary references for the SNP rs1800775 (C-629A) and SNP rs708272 (Taq1B)
1. Aulchenko YS, Ripatti S, Lindqvist I, Boomsma D, Heid IM, Pramstaller PP, Penninx BW, Janssens AC, Wilson JF, Spector T, Martin NG, Pedersen NL, Kyvik KO, Kaprio J, Hofman A, Freimer NB, Jarvelin MR, Gyllensten U, Campbell H, Rudan I, Johansson A, Marroni F, Hayward C, Vitart V, Jonasson I, Pattaro C, Wright A, Hastie N, Pichler I, Hicks AA, Falchi M, Willemsen G, Hottenga JJ, De Geus EJ, Montgomery GW, Whitfield J, Magnusson P, Saharinen J, Perola M, Silander K, Isaacs A, Sijbrands EJ, Uitterlinden AG, Witteman JC, Oostra BA, Elliott P, Ruokonen A, Sabatti C, Gieger C, Meitinger T, Kronenberg F, Doring A, Wichmann HE, Smit JH, McCarthy MI, van Duijn CM, Peltonen L. Loci influencing lipid levels and coronary heart disease risk in 16 European population cohorts. Nat Genet 2009;41:47-55.
2. Barzilai N, Atzmon G, Schechter C, Schaefer EJ, Cupples AL, Lipton R, Cheng S, Shuldiner AR. Unique lipoprotein phenotype and genotype associated with exceptional longevity. JAMA 2003;290:2030-40.
3. Bauerfeind A, Knoblauch H, Schuster H, Luft FC, Reich JG. Single nucleotide polymorphism haplotypes in the cholesteryl-ester transfer protein (CETP) gene and lipid phenotypes. Hum Hered 2002;54:166-73.
4. Bernstein MS, Costanza MC, James RW, Morris MA, Cambien F, Raoux S, Morabia A. No physical activity x CETP 1b.-629 interaction effects on lipid profile. Med Sci Sports Exerc 2003;35:1124-9.
5. Blankenberg S, Tiret L, Bickel C, Schlitt A, Jungmair W, Genth-Zotz S, Lubos E, Espinola-Klein C, Rupprecht HJ. [Genetic variation of the cholesterol ester transfer protein gene and the prevalence of coronary artery disease. The AtheroGene case control study]. Z Kardiol 2004;93 Suppl 4:IV16-IV23.
6. Chasman DI, Pare G, Zee RYL, Parker AN, Cook NR, Buring JE, Kwiatkowski DJ, Rose LM, Smith JD, Williams PT, Rieder MJ, Rotter JI, Nickerson DA, Krauss RM, Miletich JP, Ridker PM. Genetic Loci Associated With Plasma Concentration of Low-Density Lipoprotein Cholesterol, High-Density Lipoprotein Cholesterol, Triglycerides, Apolipoprotein A1, and Apolipoprotein B Among 6382 White Women in Genome-Wide Analysis With Replication. Circ Cardiovasc Genet 2008;1:21-30.
7. Dachet C, Poirier O, Cambien F, Chapman J, Rouis M. New functional promoter polymorphism, CETP/-629, in cholesteryl ester transfer protein (CETP) gene related to CETP mass and high density lipoprotein cholesterol levels: role of Sp1/Sp3 in transcriptional regulation. Arterioscler Thromb Vasc Biol 2000;20:507-15.
8. Dullaart RP, Borggreve SE, Hillege HL, Dallinga-Thie GM. The association of HDL cholesterol concentration with the -629C>A CETP promoter polymorphism is not fully explained by its relationship with plasma cholesteryl ester transfer. Scand. J Clin.Lab Invest 67: 2007.
9. Eiriksdottir G, Bolla MK, Thorsson B, Sigurdsson G, Humphries SE, Gudnason V. The -629C>A polymorphism in the CETP gene does not explain the association of TaqIB polymorphism with risk and age of myocardial infarction in Icelandic men. Atherosclerosis 2001;159:187-92.
10. Freeman DJ, Griffin BA, Holmes AP, Lindsay GM, Gaffney D, Packard CJ, Shepherd J. Regulation of plasma HDL cholesterol and subfraction distribution by genetic and environmental factors. Associations between the TaqI B RFLP in the CETP gene and smoking and obesity. Arterioscler Thromb 1994;14:336-44.
11. Heidema AG, Feskens EJ, Doevendans PA, Ruven HJ, van Houwelingen HC, Mariman EC, Boer JM. Analysis of multiple SNPs in genetic association studies: comparison of three multi-locus methods to prioritize and select SNPs. Genet Epidemiol 2007.
12
12. Horne BD, Camp NJ, Anderson JL, Mower CP, Clarke JL, Kolek MJ, Carlquist JF. Multiple less common genetic variants explain the association of the cholesteryl ester transfer protein gene with coronary artery disease. J Am Coll Cardiol 2007;49:2053-60.
13. Kakko S, Tamminen M, Paivansalo M, Kauma H, Rantala AO, Lilja M, Reunanen A, Kesaniemi YA, Savolainen MJ. Variation at the cholesteryl ester transfer protein gene in relation to plasma high density lipoproteins cholesterol levels and carotid intima-media thickness. Eur J Clin Invest 2001;31:593-602.
14. Kathiresan S, Melander O, Guiducci C, Surti A, Burtt NP, Rieder MJ, Cooper GM, Roos C, Voight BF, Havulinna AS, Wahlstrand B, Hedner T, Corella D, Tai ES, Ordovas JM, Berglund G, Vartiainen E, Jousilahti P, Hedblad B, Taskinen MR, Newton-Cheh C, Salomaa V, Peltonen L, Groop L, Altshuler DM, Orho-Melander M. Six new loci associated with blood low-density lipoprotein cholesterol, high-density lipoprotein cholesterol or triglycerides in humans. Nat Genet 2008.
15. McCaskie PA, Beilby JP, Chapman CM, Hung J, McQuillan BM, Thompson PL, Palmer LJ. Cholesteryl ester transfer protein gene haplotypes, plasma high-density lipoprotein levels and the risk of coronary heart disease. Hum Genet 2007;121:401-11.
16. Ridker PM, Pare G, Parker AN, Zee RYL, Miletich JP, Chasman DI. Polymorphism in the CETP Gene Region, HDL Cholesterol, and Risk of Future Myocardial Infarction: Genomewide Analysis Among 18 245 Initially Healthy Women From the Women's Genome Health Study. Circ Cardiovasc Genet 2009;2:26-33.
17. Sabatti C, Service SK, Hartikainen AL, Pouta A, Ripatti S, Brodsky J, Jones CG, Zaitlen NA, Varilo T, Kaakinen M, Sovio U, Ruokonen A, Laitinen J, Jakkula E, Coin L, Hoggart C, Collins A, Turunen H, Gabriel S, Elliot P, McCarthy MI, Daly MJ, Jarvelin MR, Freimer NB, Peltonen L. Genome-wide association analysis of metabolic traits in a birth cohort from a founder population. Nat Genet 2009;41:35-46.
18. Thompson JF, Lira ME, Durham LK, Clark RW, Bamberger MJ, Milos PM. Polymorphisms in the CETP gene and association with CETP mass and HDL levels. Atherosclerosis 2003;167:195-204.
19. Thompson JF, Wood LS, Pickering EH, Dechairo B, Hyde CL. High-density genotyping and functional SNP localization in the CETP gene. J Lipid Res 2007;48:434-43.
20. Tobin MD, Braund PS, Burton PR, Thompson JR, Steeds R, Channer K, Cheng S, Lindpaintner K, Samani NJ. Genotypes and haplotypes predisposing to myocardial infarction: a multilocus case-control study. Eur Heart J 2004;25:459-67.
21. Arca M, Montali A, Ombres D, Battiloro E, Campagna F, Ricci G, Verna R. Lack of association of the common TaqIB polymorphism in the cholesteryl ester transfer protein gene with angiographically assessed coronary atherosclerosis. Clin Genet 2001;60:374-80.
22. Barzilai N, Atzmon G, Schechter C, Schaefer EJ, Cupples AL, Lipton R, Cheng S, Shuldiner AR. Unique lipoprotein phenotype and genotype associated with exceptional longevity. JAMA 2003;290:2030-40.
23. Carr MC, Ayyobi AF, Murdoch SJ, Deeb SS, Brunzell JD. Contribution of hepatic lipase, lipoprotein lipase, and cholesteryl ester transfer protein to LDL and HDL heterogeneity in healthy women. Arterioscler Thromb Vasc Biol 2002;22:667-73.
24. Corella D, Saiz C, Guillen M, Portoles O, Mulet F, Gonzalez JI, Ordovas JM. Association of TaqIB polymorphism in the cholesteryl ester transfer protein gene with plasma lipid levels in a healthy Spanish population. Atherosclerosis 2000;152:367-76.
13
25. Cuchel M, Wolfe ML, deLemos AS, Rader DJ. The frequency of the cholesteryl ester transfer protein-TaqI B2 allele is lower in African Americans than in Caucasians. Atherosclerosis 2002;163:169-74.
26. Deguchi H, Pecheniuk NM, Elias DJ, Averell PM, Griffin JH. High-density lipoprotein deficiency and dyslipoproteinemia associated with venous thrombosis in men. Circulation 2005;112:893-9.
27. Eiriksdottir G, Bolla MK, Thorsson B, Sigurdsson G, Humphries SE, Gudnason V. The -629C>A polymorphism in the CETP gene does not explain the association of TaqIB polymorphism with risk and age of myocardial infarction in Icelandic men. Atherosclerosis 2001;159:187-92.
28. Freeman DJ, Griffin BA, Holmes AP, Lindsay GM, Gaffney D, Packard CJ, Shepherd J. Regulation of plasma HDL cholesterol and subfraction distribution by genetic and environmental factors. Associations between the TaqI B RFLP in the CETP gene and smoking and obesity. Arterioscler Thromb 1994;14:336-44.
29. Freeman DJ, Samani NJ, Wilson V, McMahon AD, Braund PS, Cheng S, Caslake MJ, Packard CJ, Gaffney D. A polymorphism of the cholesteryl ester transfer protein gene predicts cardiovascular events in non-smokers in the West of Scotland Coronary Prevention Study. Eur Heart J 2003 ;24:1833-42.
30. Fumeron F, Betoulle D, Luc G, Behague I, Ricard S, Poirier O, Jemaa R, Evans A, Arveiler D, Marques-Vidal P, . Alcohol intake modulates the effect of a polymorphism of the cholesteryl ester transfer protein gene on plasma high density lipoprotein and the risk of myocardial infarction. J Clin Invest 1995;96:1664-71.
31. Gudnason V, Kakko S, Nicaud V, Savolainen MJ, Kesaniemi YA, Tahvanainen E, Humphries S. Cholesteryl ester transfer protein gene effect on CETP activity and plasma high-density lipoprotein in European populations. The EARS Group. Eur J Clin Invest 1999;29:116-28.
32. Hall WL, Vafeiadou K, Hallund J, Bugel S, Reimann M, Koebnick C, Zunft HJ, Ferrari M, Branca F, Dadd T, Talbot D, Powell J, Minihane AM, Cassidy A, Nilsson M, hlman-Wright K, Gustafsson JA, Williams CM. Soy-isoflavone-enriched foods and markers of lipid and glucose metabolism in postmenopausal women: interactions with genotype and equol production. Am J Clin Nutr 2006;83:592-600.
33. Hannuksela ML, Liinamaa MJ, Kesaniemi YA, Savolainen MJ. Relation of polymorphisms in the cholesteryl ester transfer protein gene to transfer protein activity and plasma lipoprotein levels in alcohol drinkers. Atherosclerosis 1994;110:35-44.
34. Heidema AG, Feskens EJ, Doevendans PA, Ruven HJ, van Houwelingen HC, Mariman EC, Boer JM. Analysis of multiple SNPs in genetic association studies: comparison of three multi-locus methods to prioritize and select SNPs. Genet Epidemiol 2007
35. Horne BD, Camp NJ, Anderson JL, Mower CP, Clarke JL, Kolek MJ, Carlquist JF. Multiple less common genetic variants explain the association of the cholesteryl ester transfer protein gene with coronary artery disease. J Am Coll Cardiol 2007;49:2053-60.
36. Juvonen T, Savolainen MJ, Kairaluoma MI, Lajunen LH, Humphries SE, Kesaniemi YA. Polymorphisms at the apoB, apoA-I, and cholesteryl ester transfer protein gene loci in patients with gallbladder disease. J Lipid Res 1995;36:804-12.
37. Kauma H, Savolainen MJ, Heikkila R, Rantala AO, Lilja M, Reunanen A, Kesaniemi YA. Sex difference in the regulation of plasma high density lipoprotein cholesterol by genetic and environmental factors. Hum Genet 1996;97:156-62.
38. Keavney B, Palmer A, Parish S, Clark S, Youngman L, Danesh J, McKenzie C, Delepine M, Lathrop M, Peto R, Collins R. Lipid-related genes and myocardial infarction in 4685 cases and
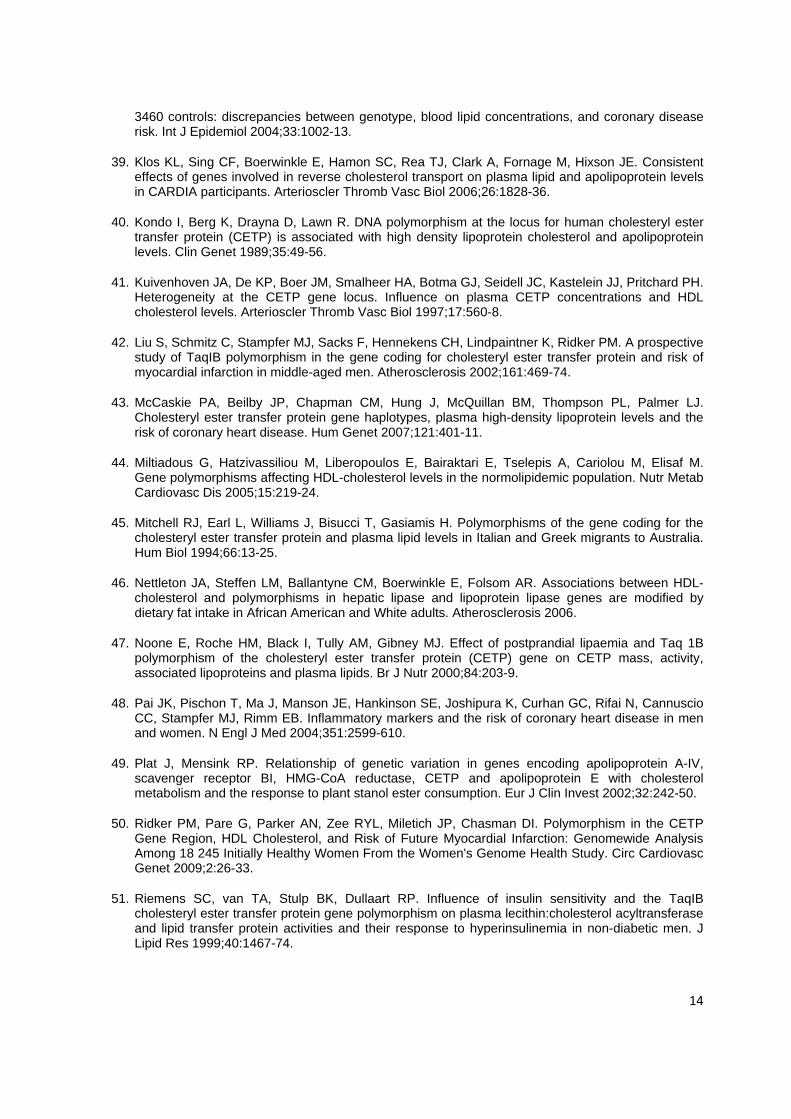
14
3460 controls: discrepancies between genotype, blood lipid concentrations, and coronary disease risk. Int J Epidemiol 2004;33:1002-13.
39. Klos KL, Sing CF, Boerwinkle E, Hamon SC, Rea TJ, Clark A, Fornage M, Hixson JE. Consistent effects of genes involved in reverse cholesterol transport on plasma lipid and apolipoprotein levels in CARDIA participants. Arterioscler Thromb Vasc Biol 2006;26:1828-36.
40. Kondo I, Berg K, Drayna D, Lawn R. DNA polymorphism at the locus for human cholesteryl ester transfer protein (CETP) is associated with high density lipoprotein cholesterol and apolipoprotein levels. Clin Genet 1989;35:49-56.
41. Kuivenhoven JA, De KP, Boer JM, Smalheer HA, Botma GJ, Seidell JC, Kastelein JJ, Pritchard PH. Heterogeneity at the CETP gene locus. Influence on plasma CETP concentrations and HDL cholesterol levels. Arterioscler Thromb Vasc Biol 1997;17:560-8.
42. Liu S, Schmitz C, Stampfer MJ, Sacks F, Hennekens CH, Lindpaintner K, Ridker PM. A prospective study of TaqIB polymorphism in the gene coding for cholesteryl ester transfer protein and risk of myocardial infarction in middle-aged men. Atherosclerosis 2002;161:469-74.
43. McCaskie PA, Beilby JP, Chapman CM, Hung J, McQuillan BM, Thompson PL, Palmer LJ. Cholesteryl ester transfer protein gene haplotypes, plasma high-density lipoprotein levels and the risk of coronary heart disease. Hum Genet 2007;121:401-11.
44. Miltiadous G, Hatzivassiliou M, Liberopoulos E, Bairaktari E, Tselepis A, Cariolou M, Elisaf M. Gene polymorphisms affecting HDL-cholesterol levels in the normolipidemic population. Nutr Metab Cardiovasc Dis 2005;15:219-24.
45. Mitchell RJ, Earl L, Williams J, Bisucci T, Gasiamis H. Polymorphisms of the gene coding for the cholesteryl ester transfer protein and plasma lipid levels in Italian and Greek migrants to Australia. Hum Biol 1994;66:13-25.
46. Nettleton JA, Steffen LM, Ballantyne CM, Boerwinkle E, Folsom AR. Associations between HDL-cholesterol and polymorphisms in hepatic lipase and lipoprotein lipase genes are modified by dietary fat intake in African American and White adults. Atherosclerosis 2006.
47. Noone E, Roche HM, Black I, Tully AM, Gibney MJ. Effect of postprandial lipaemia and Taq 1B polymorphism of the cholesteryl ester transfer protein (CETP) gene on CETP mass, activity, associated lipoproteins and plasma lipids. Br J Nutr 2000;84:203-9.
48. Pai JK, Pischon T, Ma J, Manson JE, Hankinson SE, Joshipura K, Curhan GC, Rifai N, Cannuscio CC, Stampfer MJ, Rimm EB. Inflammatory markers and the risk of coronary heart disease in men and women. N Engl J Med 2004;351:2599-610.
49. Plat J, Mensink RP. Relationship of genetic variation in genes encoding apolipoprotein A-IV, scavenger receptor BI, HMG-CoA reductase, CETP and apolipoprotein E with cholesterol metabolism and the response to plant stanol ester consumption. Eur J Clin Invest 2002;32:242-50.
50. Ridker PM, Pare G, Parker AN, Zee RYL, Miletich JP, Chasman DI. Polymorphism in the CETP Gene Region, HDL Cholesterol, and Risk of Future Myocardial Infarction: Genomewide Analysis Among 18 245 Initially Healthy Women From the Women's Genome Health Study. Circ Cardiovasc Genet 2009;2:26-33.
51. Riemens SC, van TA, Stulp BK, Dullaart RP. Influence of insulin sensitivity and the TaqIB cholesteryl ester transfer protein gene polymorphism on plasma lecithin:cholesterol acyltransferase and lipid transfer protein activities and their response to hyperinsulinemia in non-diabetic men. J Lipid Res 1999;40:1467-74.
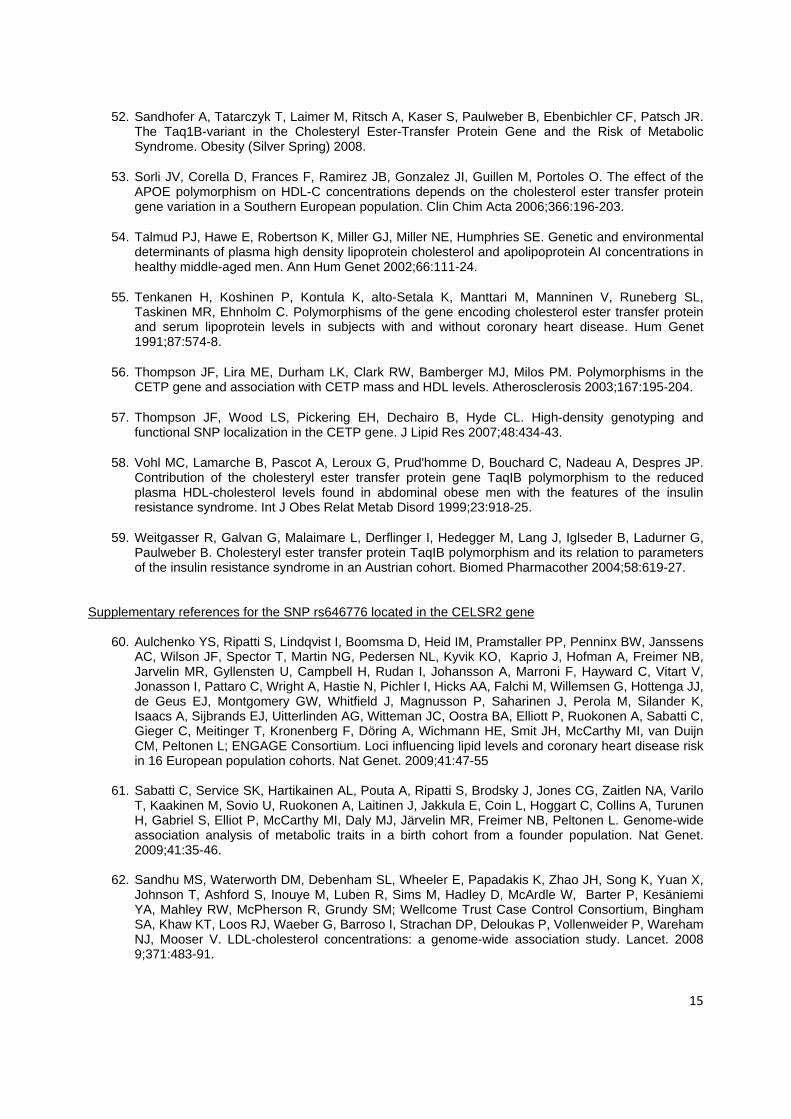
15
52. Sandhofer A, Tatarczyk T, Laimer M, Ritsch A, Kaser S, Paulweber B, Ebenbichler CF, Patsch JR. The Taq1B-variant in the Cholesteryl Ester-Transfer Protein Gene and the Risk of Metabolic Syndrome. Obesity (Silver Spring) 2008.
53. Sorli JV, Corella D, Frances F, Ramirez JB, Gonzalez JI, Guillen M, Portoles O. The effect of the APOE polymorphism on HDL-C concentrations depends on the cholesterol ester transfer protein gene variation in a Southern European population. Clin Chim Acta 2006;366:196-203.
54. Talmud PJ, Hawe E, Robertson K, Miller GJ, Miller NE, Humphries SE. Genetic and environmental determinants of plasma high density lipoprotein cholesterol and apolipoprotein AI concentrations in healthy middle-aged men. Ann Hum Genet 2002;66:111-24.
55. Tenkanen H, Koshinen P, Kontula K, alto-Setala K, Manttari M, Manninen V, Runeberg SL, Taskinen MR, Ehnholm C. Polymorphisms of the gene encoding cholesterol ester transfer protein and serum lipoprotein levels in subjects with and without coronary heart disease. Hum Genet 1991;87:574-8.
56. Thompson JF, Lira ME, Durham LK, Clark RW, Bamberger MJ, Milos PM. Polymorphisms in the CETP gene and association with CETP mass and HDL levels. Atherosclerosis 2003;167:195-204.
57. Thompson JF, Wood LS, Pickering EH, Dechairo B, Hyde CL. High-density genotyping and functional SNP localization in the CETP gene. J Lipid Res 2007;48:434-43.
58. Vohl MC, Lamarche B, Pascot A, Leroux G, Prud'homme D, Bouchard C, Nadeau A, Despres JP. Contribution of the cholesteryl ester transfer protein gene TaqIB polymorphism to the reduced plasma HDL-cholesterol levels found in abdominal obese men with the features of the insulin resistance syndrome. Int J Obes Relat Metab Disord 1999;23:918-25.
59. Weitgasser R, Galvan G, Malaimare L, Derflinger I, Hedegger M, Lang J, Iglseder B, Ladurner G, Paulweber B. Cholesteryl ester transfer protein TaqIB polymorphism and its relation to parameters of the insulin resistance syndrome in an Austrian cohort. Biomed Pharmacother 2004;58:619-27.
Supplementary references for the SNP rs646776 located in the CELSR2 gene
60. Aulchenko YS, Ripatti S, Lindqvist I, Boomsma D, Heid IM, Pramstaller PP, Penninx BW, Janssens AC, Wilson JF, Spector T, Martin NG, Pedersen NL, Kyvik KO, Kaprio J, Hofman A, Freimer NB, Jarvelin MR, Gyllensten U, Campbell H, Rudan I, Johansson A, Marroni F, Hayward C, Vitart V, Jonasson I, Pattaro C, Wright A, Hastie N, Pichler I, Hicks AA, Falchi M, Willemsen G, Hottenga JJ, de Geus EJ, Montgomery GW, Whitfield J, Magnusson P, Saharinen J, Perola M, Silander K, Isaacs A, Sijbrands EJ, Uitterlinden AG, Witteman JC, Oostra BA, Elliott P, Ruokonen A, Sabatti C, Gieger C, Meitinger T, Kronenberg F, Döring A, Wichmann HE, Smit JH, McCarthy MI, van Duijn CM, Peltonen L; ENGAGE Consortium. Loci influencing lipid levels and coronary heart disease risk in 16 European population cohorts. Nat Genet. 2009;41:47-55
61. Sabatti C, Service SK, Hartikainen AL, Pouta A, Ripatti S, Brodsky J, Jones CG, Zaitlen NA, Varilo
T, Kaakinen M, Sovio U, Ruokonen A, Laitinen J, Jakkula E, Coin L, Hoggart C, Collins A, Turunen H, Gabriel S, Elliot P, McCarthy MI, Daly MJ, Järvelin MR, Freimer NB, Peltonen L. Genome-wide association analysis of metabolic traits in a birth cohort from a founder population. Nat Genet. 2009;41:35-46.
62. Sandhu MS, Waterworth DM, Debenham SL, Wheeler E, Papadakis K, Zhao JH, Song K, Yuan X,
Johnson T, Ashford S, Inouye M, Luben R, Sims M, Hadley D, McArdle W, Barter P, Kesäniemi YA, Mahley RW, McPherson R, Grundy SM; Wellcome Trust Case Control Consortium, Bingham SA, Khaw KT, Loos RJ, Waeber G, Barroso I, Strachan DP, Deloukas P, Vollenweider P, Wareham NJ, Mooser V. LDL-cholesterol concentrations: a genome-wide association study. Lancet. 2008 9;371:483-91.
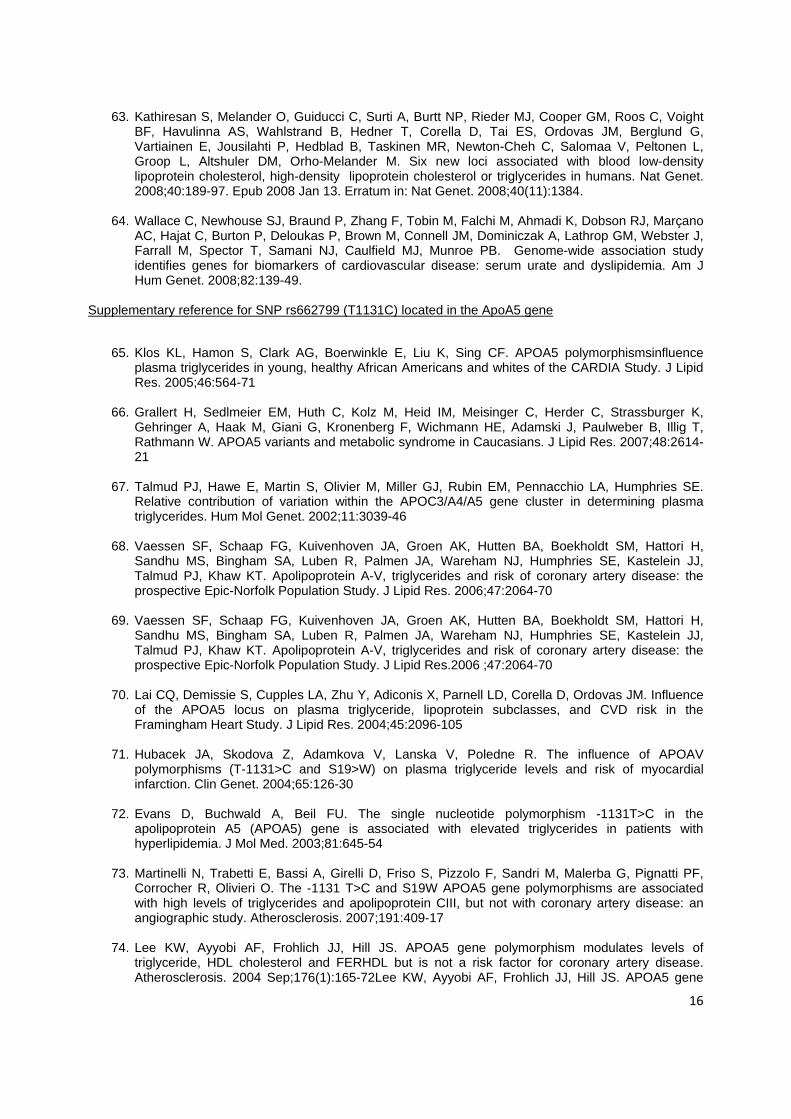
16
63. Kathiresan S, Melander O, Guiducci C, Surti A, Burtt NP, Rieder MJ, Cooper GM, Roos C, Voight BF, Havulinna AS, Wahlstrand B, Hedner T, Corella D, Tai ES, Ordovas JM, Berglund G, Vartiainen E, Jousilahti P, Hedblad B, Taskinen MR, Newton-Cheh C, Salomaa V, Peltonen L, Groop L, Altshuler DM, Orho-Melander M. Six new loci associated with blood low-density lipoprotein cholesterol, high-density lipoprotein cholesterol or triglycerides in humans. Nat Genet. 2008;40:189-97. Epub 2008 Jan 13. Erratum in: Nat Genet. 2008;40(11):1384.
64. Wallace C, Newhouse SJ, Braund P, Zhang F, Tobin M, Falchi M, Ahmadi K, Dobson RJ, Marçano
AC, Hajat C, Burton P, Deloukas P, Brown M, Connell JM, Dominiczak A, Lathrop GM, Webster J, Farrall M, Spector T, Samani NJ, Caulfield MJ, Munroe PB. Genome-wide association study identifies genes for biomarkers of cardiovascular disease: serum urate and dyslipidemia. Am J Hum Genet. 2008;82:139-49.
Supplementary reference for SNP rs662799 (T1131C) located in the ApoA5 gene
65. Klos KL, Hamon S, Clark AG, Boerwinkle E, Liu K, Sing CF. APOA5 polymorphismsinfluence
plasma triglycerides in young, healthy African Americans and whites of the CARDIA Study. J Lipid Res. 2005;46:564-71
66. Grallert H, Sedlmeier EM, Huth C, Kolz M, Heid IM, Meisinger C, Herder C, Strassburger K,
Gehringer A, Haak M, Giani G, Kronenberg F, Wichmann HE, Adamski J, Paulweber B, Illig T, Rathmann W. APOA5 variants and metabolic syndrome in Caucasians. J Lipid Res. 2007;48:2614-21
67. Talmud PJ, Hawe E, Martin S, Olivier M, Miller GJ, Rubin EM, Pennacchio LA, Humphries SE.
Relative contribution of variation within the APOC3/A4/A5 gene cluster in determining plasma triglycerides. Hum Mol Genet. 2002;11:3039-46
68. Vaessen SF, Schaap FG, Kuivenhoven JA, Groen AK, Hutten BA, Boekholdt SM, Hattori H,
Sandhu MS, Bingham SA, Luben R, Palmen JA, Wareham NJ, Humphries SE, Kastelein JJ, Talmud PJ, Khaw KT. Apolipoprotein A-V, triglycerides and risk of coronary artery disease: the prospective Epic-Norfolk Population Study. J Lipid Res. 2006;47:2064-70
69. Vaessen SF, Schaap FG, Kuivenhoven JA, Groen AK, Hutten BA, Boekholdt SM, Hattori H,
Sandhu MS, Bingham SA, Luben R, Palmen JA, Wareham NJ, Humphries SE, Kastelein JJ, Talmud PJ, Khaw KT. Apolipoprotein A-V, triglycerides and risk of coronary artery disease: the prospective Epic-Norfolk Population Study. J Lipid Res.2006 ;47:2064-70
70. Lai CQ, Demissie S, Cupples LA, Zhu Y, Adiconis X, Parnell LD, Corella D, Ordovas JM. Influence
of the APOA5 locus on plasma triglyceride, lipoprotein subclasses, and CVD risk in the Framingham Heart Study. J Lipid Res. 2004;45:2096-105
71. Hubacek JA, Skodova Z, Adamkova V, Lanska V, Poledne R. The influence of APOAV
polymorphisms (T-1131>C and S19>W) on plasma triglyceride levels and risk of myocardial infarction. Clin Genet. 2004;65:126-30
72. Evans D, Buchwald A, Beil FU. The single nucleotide polymorphism -1131T>C in the
apolipoprotein A5 (APOA5) gene is associated with elevated triglycerides in patients with hyperlipidemia. J Mol Med. 2003;81:645-54
73. Martinelli N, Trabetti E, Bassi A, Girelli D, Friso S, Pizzolo F, Sandri M, Malerba G, Pignatti PF,
Corrocher R, Olivieri O. The -1131 T>C and S19W APOA5 gene polymorphisms are associated with high levels of triglycerides and apolipoprotein CIII, but not with coronary artery disease: an angiographic study. Atherosclerosis. 2007;191:409-17
74. Lee KW, Ayyobi AF, Frohlich JJ, Hill JS. APOA5 gene polymorphism modulates levels of
triglyceride, HDL cholesterol and FERHDL but is not a risk factor for coronary artery disease. Atherosclerosis. 2004 Sep;176(1):165-72Lee KW, Ayyobi AF, Frohlich JJ, Hill JS. APOA5 gene
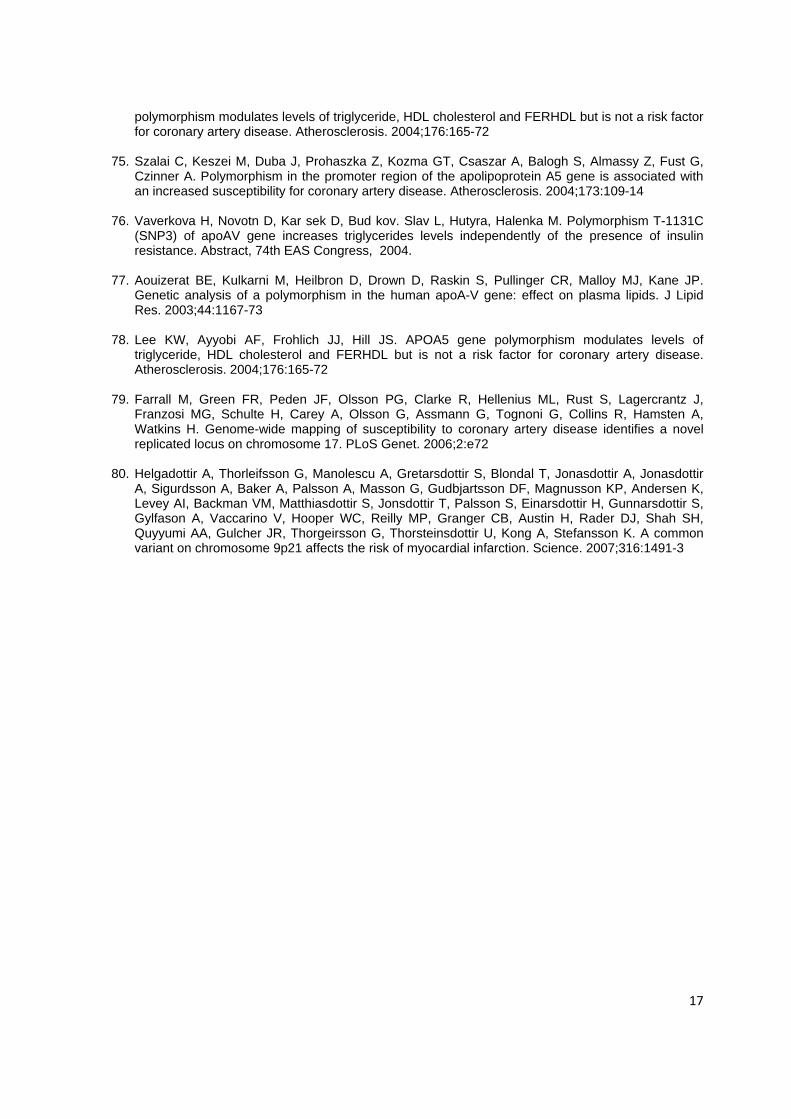
17
polymorphism modulates levels of triglyceride, HDL cholesterol and FERHDL but is not a risk factor for coronary artery disease. Atherosclerosis. 2004;176:165-72
75. Szalai C, Keszei M, Duba J, Prohaszka Z, Kozma GT, Csaszar A, Balogh S, Almassy Z, Fust G,
Czinner A. Polymorphism in the promoter region of the apolipoprotein A5 gene is associated with an increased susceptibility for coronary artery disease. Atherosclerosis. 2004;173:109-14
76. Vaverkova H, Novotn D, Kar sek D, Bud kov. Slav L, Hutyra, Halenka M. Polymorphism T-1131C
(SNP3) of apoAV gene increases triglycerides levels independently of the presence of insulin resistance. Abstract, 74th EAS Congress, 2004.
77. Aouizerat BE, Kulkarni M, Heilbron D, Drown D, Raskin S, Pullinger CR, Malloy MJ, Kane JP.
Genetic analysis of a polymorphism in the human apoA-V gene: effect on plasma lipids. J Lipid Res. 2003;44:1167-73
78. Lee KW, Ayyobi AF, Frohlich JJ, Hill JS. APOA5 gene polymorphism modulates levels of
triglyceride, HDL cholesterol and FERHDL but is not a risk factor for coronary artery disease. Atherosclerosis. 2004;176:165-72
79. Farrall M, Green FR, Peden JF, Olsson PG, Clarke R, Hellenius ML, Rust S, Lagercrantz J,
Franzosi MG, Schulte H, Carey A, Olsson G, Assmann G, Tognoni G, Collins R, Hamsten A, Watkins H. Genome-wide mapping of susceptibility to coronary artery disease identifies a novel replicated locus on chromosome 17. PLoS Genet. 2006;2:e72
80. Helgadottir A, Thorleifsson G, Manolescu A, Gretarsdottir S, Blondal T, Jonasdottir A, Jonasdottir
A, Sigurdsson A, Baker A, Palsson A, Masson G, Gudbjartsson DF, Magnusson KP, Andersen K, Levey AI, Backman VM, Matthiasdottir S, Jonsdottir T, Palsson S, Einarsdottir H, Gunnarsdottir S, Gylfason A, Vaccarino V, Hooper WC, Reilly MP, Granger CB, Austin H, Rader DJ, Shah SH, Quyyumi AA, Gulcher JR, Thorgeirsson G, Thorsteinsdottir U, Kong A, Stefansson K. A common variant on chromosome 9p21 affects the risk of myocardial infarction. Science. 2007;316:1491-3
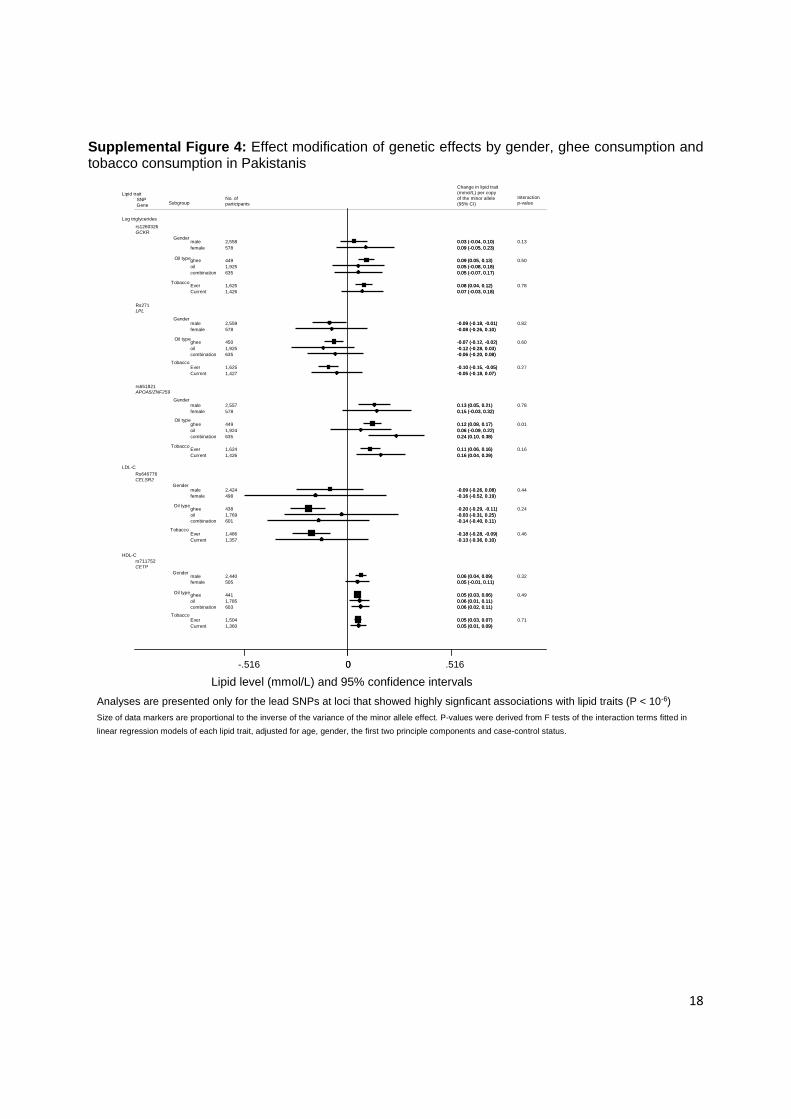
18
Supplemental Figure 4: Effect modification of genetic effects by gender, ghee consumption and tobacco consumption in Pakistanis
Log triglyceridesrs1260326GCKR
Rs271LPL
rs651821APOA5/ZNF259
LDL-CRs646776CELSR2
HDL-Crs711752CETP
Lipid traitSNPGene
Gender
Oil type
Tobacco
Gender
Oil type
Tobacco
Gender
Oil type
Tobacco
Gender
Oil type
Tobacco
Gender
Oil type
Tobacco
malefemale
gheeoilcombination
EverCurrent
malefemale
gheeoilcombination
EverCurrent
malefemale
gheeoilcombination
EverCurrent
malefemale
gheeoilcombination
EverCurrent
malefemale
gheeoilcombination
EverCurrent
Subgroup
2,558 578
4491,925635
1,625 1,426
2,559 578
4501,925635
1,625 1,427
2,557578
4491,924 635
1,624 1,426
2,424 498
4381,769601
1,486 1,357
2,440 505
4411,785603
1,504 1,360
No. of participants
0.03 (-0.04, 0.10)0.09 (-0.05, 0.23)
0.09 (0.05, 0.13)0.05 (-0.08, 0.18)0.05 (-0.07, 0.17)
0.08 (0.04, 0.12)0.07 (-0.03, 0.18)
-0.09 (-0.18, -0.01)-0.08 (-0.26, 0.10)
-0.07 (-0.12, -0.02)-0.12 (-0.28, 0.03)-0.06 (-0.20, 0.08)
-0.10 (-0.15, -0.05)-0.05 (-0.18, 0.07)
0.13 (0.05, 0.21)0.15 (-0.03, 0.32)
0.12 (0.08, 0.17)0.06 (-0.09, 0.22)0.24 (0.10, 0.38)
0.11 (0.06, 0.16)0.16 (0.04, 0.29)
-0.09 (-0.26, 0.08)-0.16 (-0.52, 0.19)
-0.20 (-0.29, -0.11)-0.03 (-0.31, 0.25)-0.14 (-0.40, 0.11)
-0.18 (-0.28, -0.09)-0.13 (-0.36, 0.10)
0.06 (0.04, 0.09)0.05 (-0.01, 0.11)
0.05 (0.03, 0.06)0.06 (0.01, 0.11)0.06 (0.02, 0.11)
0.05 (0.03, 0.07)0.05 (0.01, 0.09)
0.13
0.50
0.78
0.82
0.60
0.27
0.78
0.01
0.16
0.44
0.24
0.46
0.32
0.49
0.71
Interaction p-value
0.03 (-0.04, 0.10)0.09 (-0.05, 0.23)
0.09 (0.05, 0.13)0.05 (-0.08, 0.18)0.05 (-0.07, 0.17)
0.08 (0.04, 0.12)0.07 (-0.03, 0.18)
-0.09 (-0.18, -0.01)-0.08 (-0.26, 0.10)
-0.07 (-0.12, -0.02)-0.12 (-0.28, 0.03)-0.06 (-0.20, 0.08)
-0.10 (-0.15, -0.05)-0.05 (-0.18, 0.07)
0.13 (0.05, 0.21)0.15 (-0.03, 0.32)
0.12 (0.08, 0.17)0.06 (-0.09, 0.22)0.24 (0.10, 0.38)
0.11 (0.06, 0.16)0.16 (0.04, 0.29)
-0.09 (-0.26, 0.08)-0.16 (-0.52, 0.19)
-0.20 (-0.29, -0.11)-0.03 (-0.31, 0.25)-0.14 (-0.40, 0.11)
-0.18 (-0.28, -0.09)-0.13 (-0.36, 0.10)
0.06 (0.04, 0.09)0.05 (-0.01, 0.11)
0.05 (0.03, 0.06)0.06 (0.01, 0.11)0.06 (0.02, 0.11)
0.05 (0.03, 0.07)0.05 (0.01, 0.09)
Change in lipid trait (mmol/L) per copy of the minor allele (95% CI)
0-.516 0 .516
Lipid level (mmol/L) and 95% confidence intervalsAnalyses are presented only for the lead SNPs at loci that showed highly signficant associations with lipid traits (P < 10-6)Size of data markers are proportional to the inverse of the variance of the minor allele effect. P-values were derived from F tests of the interaction terms fitted in linear regression models of each lipid trait, adjusted for age, gender, the first two principle components and case-control status.
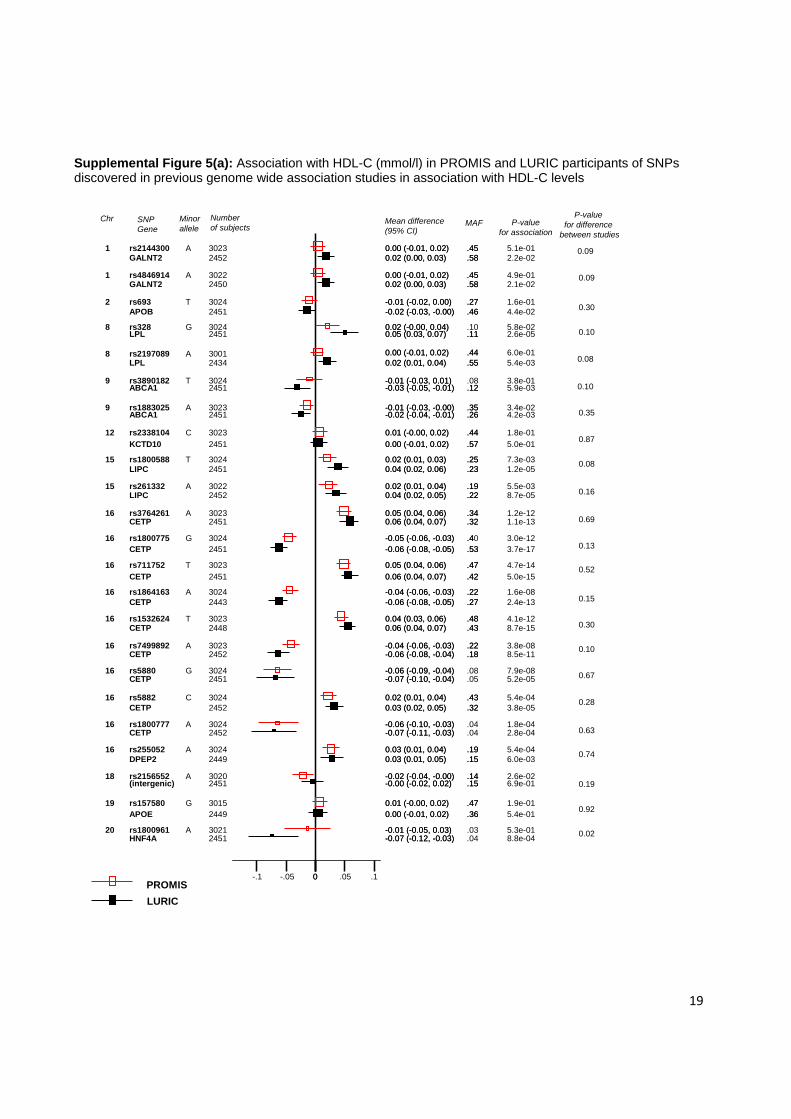
19
9
20
1
16
16
16
16
16
19
2
15
16
16
16
8
9
12
16
16
1
15
8
18
CETP
CETP
rs1883025
LPL
rs1800961
rs2144300
rs5882
rs1800775
APOB
rs1800777CETP
rs5880
APOE
HNF4A
rs255052
GALNT2
rs157580
LIPC
rs693
CETP
CETP
LPL
ABCA1
rs1800588
rs7499892
CETP
rs3764261
rs2197089
CETP
LIPC
rs3890182
DPEP2
rs2338104
rs1864163
KCTD10
rs711752
rs4846914
rs261332
CETP
ABCA1
rs328
rs1532624
rs2156552(intergenic)
GALNT2
CETP
A
A
A
C
G
A
G
A
G
T
T
A
A
A
T
C
A
T
A
A
G
T
A
2451
2451
3023
2434
3021
3023
3024
3024
2451
30242452
3024
2449
2451
3024
2450
3015
2452
3024
2443
2452
2451
2451
3024
3023
2448
3023
3001
2452
2451
3024
2449
3023
3024
2451
3023
3022
3022
2451
2451
3024
3023
30202451
2452
2451
0.06 (0.04, 0.07)
-0.07 (-0.10, -0.04)
-0.01 (-0.03, -0.00)
0.02 (0.01, 0.04)
-0.01 (-0.05, 0.03)
0.00 (-0.01, 0.02)
0.02 (0.01, 0.04)
-0.05 (-0.06, -0.03)
-0.02 (-0.03, -0.00)
-0.06 (-0.10, -0.03)-0.07 (-0.11, -0.03)
-0.06 (-0.09, -0.04)
0.00 (-0.01, 0.02)
-0.07 (-0.12, -0.03)
0.03 (0.01, 0.04)
0.02 (0.00, 0.03)
0.01 (-0.00, 0.02)
0.04 (0.02, 0.05)
-0.01 (-0.02, 0.00)
-0.06 (-0.08, -0.05)
0.03 (0.02, 0.05)
0.05 (0.03, 0.07)
-0.03 (-0.05, -0.01)
0.02 (0.01, 0.03)
-0.04 (-0.06, -0.03)
0.06 (0.04, 0.07)
0.05 (0.04, 0.06)
0.00 (-0.01, 0.02)
-0.06 (-0.08, -0.04)
0.04 (0.02, 0.06)
-0.01 (-0.03, 0.01)
0.03 (0.01, 0.05)
0.01 (-0.00, 0.02)
-0.04 (-0.06, -0.03)
0.00 (-0.01, 0.02)
0.05 (0.04, 0.06)
0.00 (-0.01, 0.02)
0.02 (0.01, 0.04)
-0.06 (-0.08, -0.05)
-0.02 (-0.04, -0.01)
0.02 (-0.00, 0.04)
0.04 (0.03, 0.06)
-0.02 (-0.04, -0.00)-0.00 (-0.02, 0.02)
0.02 (0.00, 0.03)
0.06 (0.04, 0.07)
.32
.05
.35
.55
.03
.45
.43
.4
.46
.04
.04
.08
.36
.04
.19
.58
.47
.22
.27
.27
.32
.11
.12
.25
.22
.43
.34
.44
.18
.23
.08
.15
.44
.22
.57
.47
.45
.19
.53
.26
.10
.48
.14
.15
.58
.42
1.1e-13
5.2e-05
3.4e-02
5.4e-03
5.3e-01
5.1e-01
5.4e-04
3.0e-12
4.4e-02
1.8e-042.8e-04
7.9e-08
5.4e-01
8.8e-04
5.4e-04
2.1e-02
1.9e-01
8.7e-05
1.6e-01
2.4e-13
3.8e-05
2.6e-05
5.9e-03
7.3e-03
3.8e-08
8.7e-15
1.2e-12
6.0e-01
8.5e-11
1.2e-05
3.8e-01
6.0e-03
1.8e-01
1.6e-08
5.0e-01
4.7e-14
4.9e-01
5.5e-03
3.7e-17
4.2e-03
5.8e-02
4.1e-12
2.6e-026.9e-01
2.2e-02
5.0e-15
0.06 (0.04, 0.07)
-0.07 (-0.10, -0.04)
-0.01 (-0.03, -0.00)
0.02 (0.01, 0.04)
-0.01 (-0.05, 0.03)
0.00 (-0.01, 0.02)
0.02 (0.01, 0.04)
-0.05 (-0.06, -0.03)
-0.02 (-0.03, -0.00)
-0.06 (-0.10, -0.03)-0.07 (-0.11, -0.03)
-0.06 (-0.09, -0.04)
0.00 (-0.01, 0.02)
-0.07 (-0.12, -0.03)
0.03 (0.01, 0.04)
0.02 (0.00, 0.03)
0.01 (-0.00, 0.02)
0.04 (0.02, 0.05)
-0.01 (-0.02, 0.00)
-0.06 (-0.08, -0.05)
0.03 (0.02, 0.05)
0.05 (0.03, 0.07)
-0.03 (-0.05, -0.01)
0.02 (0.01, 0.03)
-0.04 (-0.06, -0.03)
0.06 (0.04, 0.07)
0.05 (0.04, 0.06)
0.00 (-0.01, 0.02)
-0.06 (-0.08, -0.04)
0.04 (0.02, 0.06)
-0.01 (-0.03, 0.01)
0.03 (0.01, 0.05)
0.01 (-0.00, 0.02)
-0.04 (-0.06, -0.03)
0.00 (-0.01, 0.02)
0.05 (0.04, 0.06)
0.00 (-0.01, 0.02)
0.02 (0.01, 0.04)
-0.06 (-0.08, -0.05)
-0.02 (-0.04, -0.01)
0.02 (-0.00, 0.04)
0.04 (0.03, 0.06)
-0.02 (-0.04, -0.00)-0.00 (-0.02, 0.02)
0.02 (0.00, 0.03)
0.06 (0.04, 0.07)
.32
.35
.55
.45
.43
.40
.46
.36
.19
.58
.47
.22
.27
.27
.32
.11
.12
.25
.22
.43
.34
.44
.18
.23
.15
.44
.22
.57
.47
.45
.19
.53
.26
.48
.14
.15
.58
.42
0-.1 -.05 0 .05 .1
Minor allele
Number of subjects P-value
for associationMean difference(95% CI)
MAFSNPGene
Chr
PROMISLURIC
0.15
0.10
0.74
0.92
0.02
0.10
0.87
0.19
0.10
0.67
0.52
0.28
0.63
0.30
0.13
0.16
0.08
0.09
0.69
0.09
0.08
0.30
0.35
P-value for difference
between studies
genome wide association studies in association with HDL-C levels
Supplemental Figure 5(a): Association with HDL-C (mmol/l) in PROMIS and LURIC participants of SNPs discovered in previous genome wide association studies in association with HDL-C levels
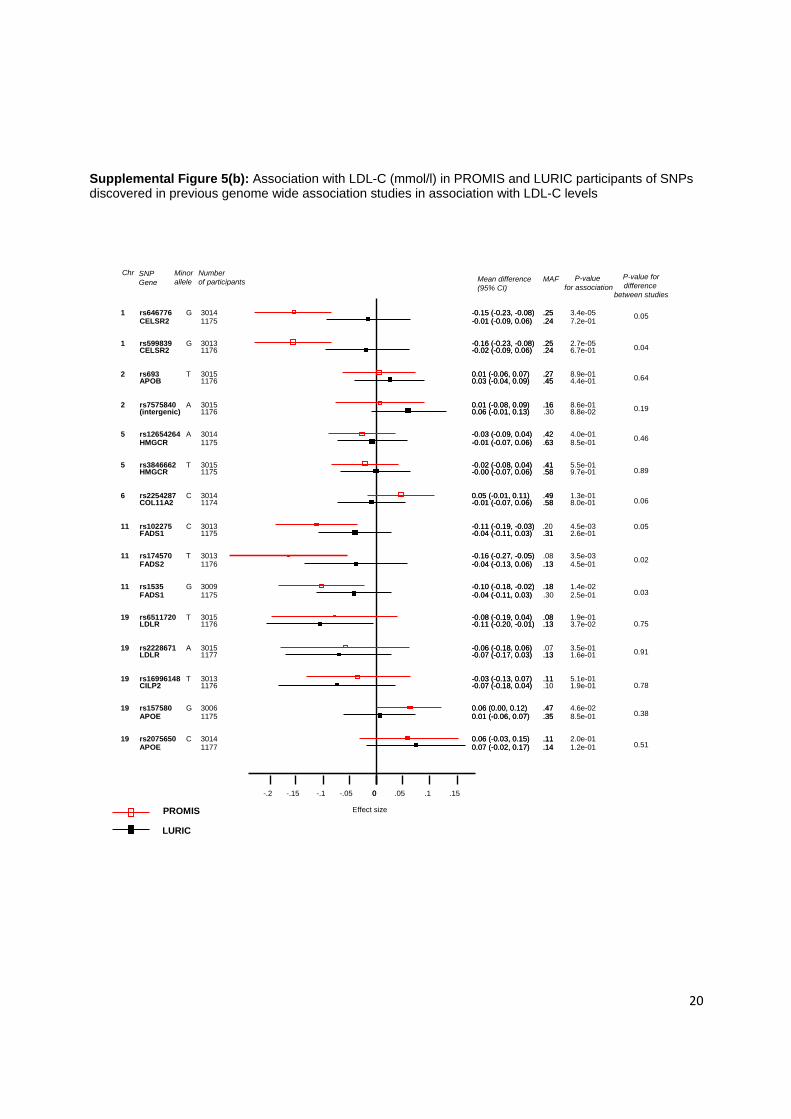
20
19
19
5
5
1
19
11
11
19
2
19
1
6
2
11
rs16996148
HMGCR
rs2228671
rs12654264
rs3846662
LDLR
FADS2
rs646776
APOE
rs6511720
rs102275
rs1535
HMGCR
rs2075650
rs7575840
rs157580
APOB
CELSR2
FADS1
APOE
LDLR
(intergenic)
rs599839
rs2254287
CILP2
FADS1
CELSR2
COL11A2
rs693
rs174570
T
A
A
T
G
T
C
G
C
A
G
G
C
T
T
3013
1175
3015
3014
3015
1177
1176
3014
1175
3015
3013
3009
1175
3014
3015
3006
1176
1175
1175
1177
1176
1176
3013
3014
1176
1175
1176
1174
3015
3013
-0.03 (-0.13, 0.07)
-0.01 (-0.07, 0.06)
-0.06 (-0.18, 0.06)
-0.03 (-0.09, 0.04)
-0.02 (-0.08, 0.04)
-0.07 (-0.17, 0.03)
-0.04 (-0.13, 0.06)
-0.15 (-0.23, -0.08)
0.01 (-0.06, 0.07)
-0.08 (-0.19, 0.04)
-0.11 (-0.19, -0.03)
-0.10 (-0.18, -0.02)
-0.00 (-0.07, 0.06)
0.06 (-0.03, 0.15)
0.01 (-0.08, 0.09)
0.06 (0.00, 0.12)
0.03 (-0.04, 0.09)
-0.01 (-0.09, 0.06)
-0.04 (-0.11, 0.03)
0.07 (-0.02, 0.17)
-0.11 (-0.20, -0.01)
0.06 (-0.01, 0.13)
-0.16 (-0.23, -0.08)
0.05 (-0.01, 0.11)
-0.07 (-0.18, 0.04)
-0.04 (-0.11, 0.03)
-0.02 (-0.09, 0.06)
-0.01 (-0.07, 0.06)
0.01 (-0.06, 0.07)
-0.16 (-0.27, -0.05)
.11
.63
.07
.42
.41
.13
.13
.25
.35
.08
.20
.18
.58
.11
.16
.47
.45
.24
.30
.14
.13
.25
.49
.10
.31
.24
.58
.27
.08
5.1e-01
8.5e-01
3.5e-01
4.0e-01
5.5e-01
1.6e-01
4.5e-01
3.4e-05
8.5e-01
1.9e-01
4.5e-03
1.4e-02
9.7e-01
2.0e-01
8.6e-01
4.6e-02
4.4e-01
7.2e-01
2.5e-01
1.2e-01
3.7e-02
8.8e-02
2.7e-05
1.3e-01
1.9e-01
2.6e-01
6.7e-01
8.0e-01
8.9e-01
3.5e-03
-0.03 (-0.13, 0.07)
-0.01 (-0.07, 0.06)
-0.06 (-0.18, 0.06)
-0.03 (-0.09, 0.04)
-0.02 (-0.08, 0.04)
-0.07 (-0.17, 0.03)
-0.04 (-0.13, 0.06)
-0.15 (-0.23, -0.08)
0.01 (-0.06, 0.07)
-0.08 (-0.19, 0.04)
-0.11 (-0.19, -0.03)
-0.10 (-0.18, -0.02)
-0.00 (-0.07, 0.06)
0.06 (-0.03, 0.15)
0.01 (-0.08, 0.09)
0.06 (0.00, 0.12)
0.03 (-0.04, 0.09)
-0.01 (-0.09, 0.06)
-0.04 (-0.11, 0.03)
0.07 (-0.02, 0.17)
-0.11 (-0.20, -0.01)
0.06 (-0.01, 0.13)
-0.16 (-0.23, -0.08)
0.05 (-0.01, 0.11)
-0.07 (-0.18, 0.04)
-0.04 (-0.11, 0.03)
-0.02 (-0.09, 0.06)
-0.01 (-0.07, 0.06)
0.01 (-0.06, 0.07)
-0.16 (-0.27, -0.05)
.11
.63
.42
.41
.13
.13
.25
.35
.08
.18
.58
.11
.16
.47
.45
.24
.14
.13
.30
.25
.49
.31
.24
.58
.27
Minor allele
Number of participants P-value
for associationMean difference(95% CI)
MAFSNPGene
Chr
PROMIS
LURIC
Effect size
0-.2 -.15 -.1 -.05 0 .05 .1 .15
0.04
0.75
0.64
0.03
0.02
0.19
0.89
0.05
0.06
0.91
0.46
0.78
0.51
0.38
0.05
P-value fordifference
between studies
Supplemental Figure 5(b): Association with LDL-C (mmol/l) in PROMIS and LURIC participants of SNPs discovered in previous genome wide association studies in association with LDL-C levels
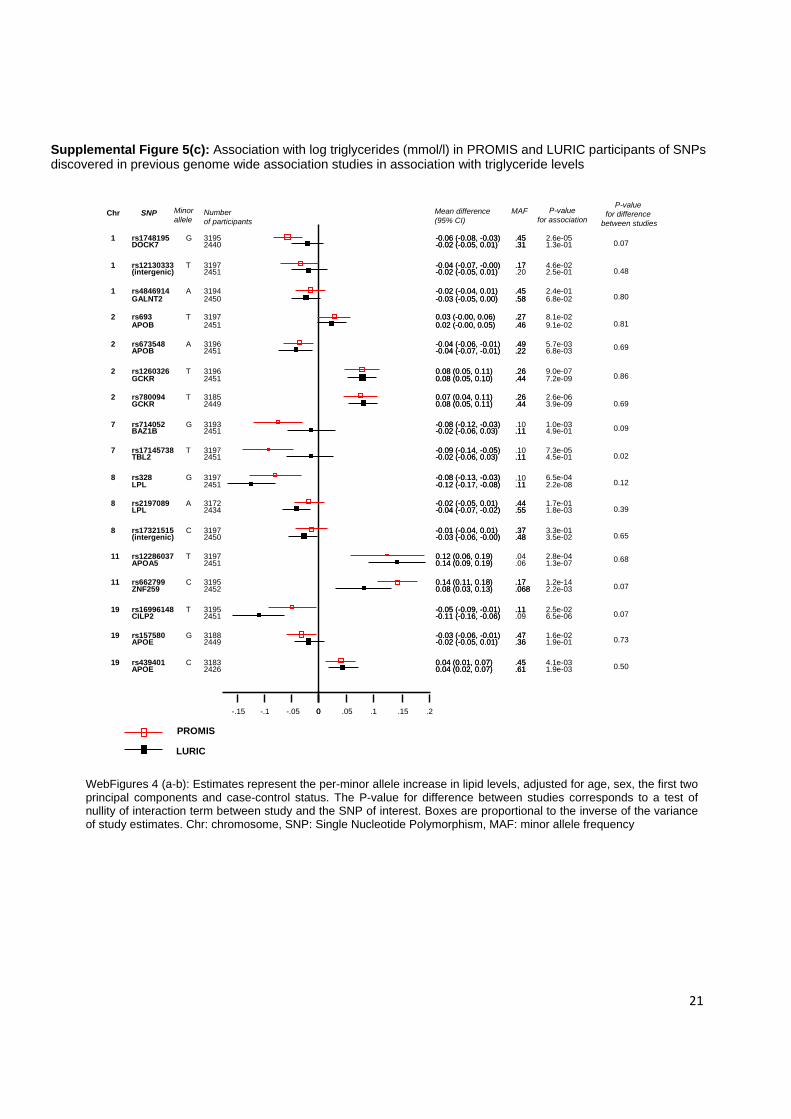
21
8
2
11
7
19
8
2
1
2
19
2
7
1
8
11
19
1
(intergenic)
GALNT2
DOCK7
CILP2
rs328
APOE
APOE
(intergenic)
rs780094
rs12286037
LPL
rs17145738
rs16996148
APOB
GCKR
GCKR
rs17321515
rs673548
rs4846914
rs1260326
rs439401
APOBrs693
rs714052
ZNF259
BAZ1B
rs12130333
APOA5
rs2197089
rs662799
rs157580
TBL2
rs1748195
LPL
G
T
T
T
T
C
A
A
T
C
T
G
T
A
C
G
G
2451
2450
2440
2451
3197
2449
2426
2450
3185
3197
2451
3197
3195
2451
2451
2449
3197
3196
3194
3196
3183
24513197
3193
2452
2451
3197
2451
3172
3195
3188
2451
3195
2434
-0.02 (-0.05, 0.01)
-0.03 (-0.05, 0.00)
-0.02 (-0.05, 0.01)
-0.11 (-0.16, -0.06)
-0.08 (-0.13, -0.03)
-0.02 (-0.05, 0.01)
0.04 (0.02, 0.07)
-0.03 (-0.06, -0.00)
0.07 (0.04, 0.11)
0.12 (0.06, 0.19)
-0.12 (-0.17, -0.08)
-0.09 (-0.14, -0.05)
-0.05 (-0.09, -0.01)
-0.04 (-0.07, -0.01)
0.08 (0.05, 0.10)
0.08 (0.05, 0.11)
-0.01 (-0.04, 0.01)
-0.04 (-0.06, -0.01)
-0.02 (-0.04, 0.01)
0.08 (0.05, 0.11)
0.04 (0.01, 0.07)
0.02 (-0.00, 0.05)0.03 (-0.00, 0.06)
-0.08 (-0.12, -0.03)
0.08 (0.03, 0.13)
-0.02 (-0.06, 0.03)
-0.04 (-0.07, -0.00)
0.14 (0.09, 0.19)
-0.02 (-0.05, 0.01)
0.14 (0.11, 0.18)
-0.03 (-0.06, -0.01)
-0.02 (-0.06, 0.03)
-0.06 (-0.08, -0.03)
-0.04 (-0.07, -0.02)
.20
.58
.31
.36
.61
.48
.26
.04
.11
.11
.22
.44
.44
.37
.49
.45
.26
.45
.46
.27
.10
.068
.11
.17
.06
.44
.17
.47
.11
.45
.55
2.5e-01
6.8e-02
1.3e-01
6.5e-06
6.5e-04
1.9e-01
1.9e-03
3.5e-02
2.6e-06
2.8e-04
2.2e-08
7.3e-05
2.5e-02
6.8e-03
7.2e-09
3.9e-09
3.3e-01
5.7e-03
2.4e-01
9.0e-07
4.1e-03
9.1e-028.1e-02
1.0e-03
2.2e-03
4.9e-01
4.6e-02
1.3e-07
1.7e-01
1.2e-14
1.6e-02
4.5e-01
2.6e-05
1.8e-03
-0.02 (-0.05, 0.01)
-0.03 (-0.05, 0.00)
-0.02 (-0.05, 0.01)
-0.11 (-0.16, -0.06)
-0.08 (-0.13, -0.03)
-0.02 (-0.05, 0.01)
0.04 (0.02, 0.07)
-0.03 (-0.06, -0.00)
0.07 (0.04, 0.11)
0.12 (0.06, 0.19)
-0.12 (-0.17, -0.08)
-0.09 (-0.14, -0.05)
-0.05 (-0.09, -0.01)
-0.04 (-0.07, -0.01)
0.08 (0.05, 0.10)
0.08 (0.05, 0.11)
-0.01 (-0.04, 0.01)
-0.04 (-0.06, -0.01)
-0.02 (-0.04, 0.01)
0.08 (0.05, 0.11)
0.04 (0.01, 0.07)
0.02 (-0.00, 0.05)0.03 (-0.00, 0.06)
-0.08 (-0.12, -0.03)
0.08 (0.03, 0.13)
-0.02 (-0.06, 0.03)
-0.04 (-0.07, -0.00)
0.14 (0.09, 0.19)
-0.02 (-0.05, 0.01)
0.14 (0.11, 0.18)
-0.03 (-0.06, -0.01)
-0.02 (-0.06, 0.03)
-0.06 (-0.08, -0.03)
-0.04 (-0.07, -0.02)
.58
.31
.09
.10
.36
.61
.48
.26
.11
.10
.11
.22
.44
.44
.37
.49
.45
.26
.45
.46
.27
.068
.11
.17
.44
.17
.47
.11
.45
.55
0-.15 -.1 -.05 0 .05 .1 .15 .2
Minor allele
Number of participants
P-valuefor association
Mean difference(95% CI)
MAFSNPChr
PROMIS
LURIC
0.81
0.07
0.73
0.07
0.07
0.02
0.68
0.80
0.50
0.12
0.69
0.69
0.39
0.65
0.48
0.86
0.09
P-value for difference
between studies
Supplemental Figure 5(c): Association with log triglycerides (mmol/l) in PROMIS and LURIC participants of SNPs discovered in previous genome wide association studies in association with triglyceride levels
WebFigures 4 (a-b): Estimates represent the per-minor allele increase in lipid levels, adjusted for age, sex, the first two principal components and case-control status. The P-value for difference between studies corresponds to a test of nullity of interaction term between study and the SNP of interest. Boxes are proportional to the inverse of the variance of study estimates. Chr: chromosome, SNP: Single Nucleotide Polymorphism, MAF: minor allele frequency
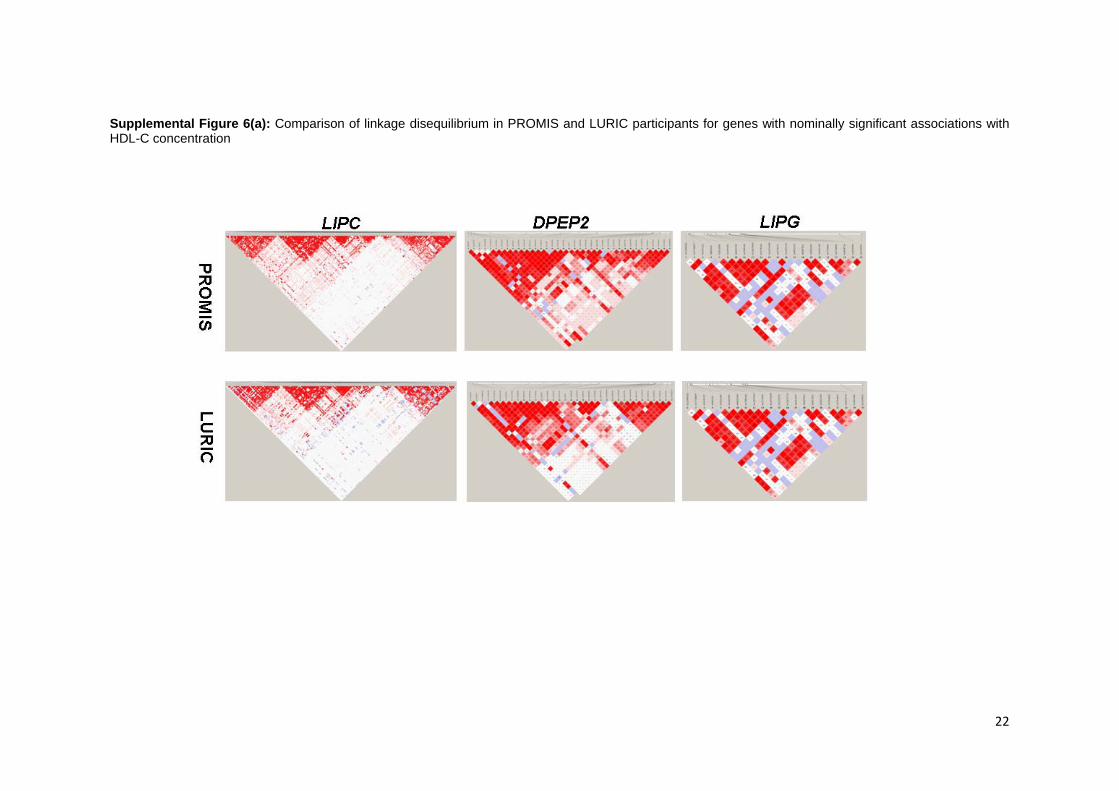
22
Supplemental Figure 6(a): Comparison of linkage disequilibrium in PROMIS and LURIC participants for genes with nominally significant associations with HDL-C concentration
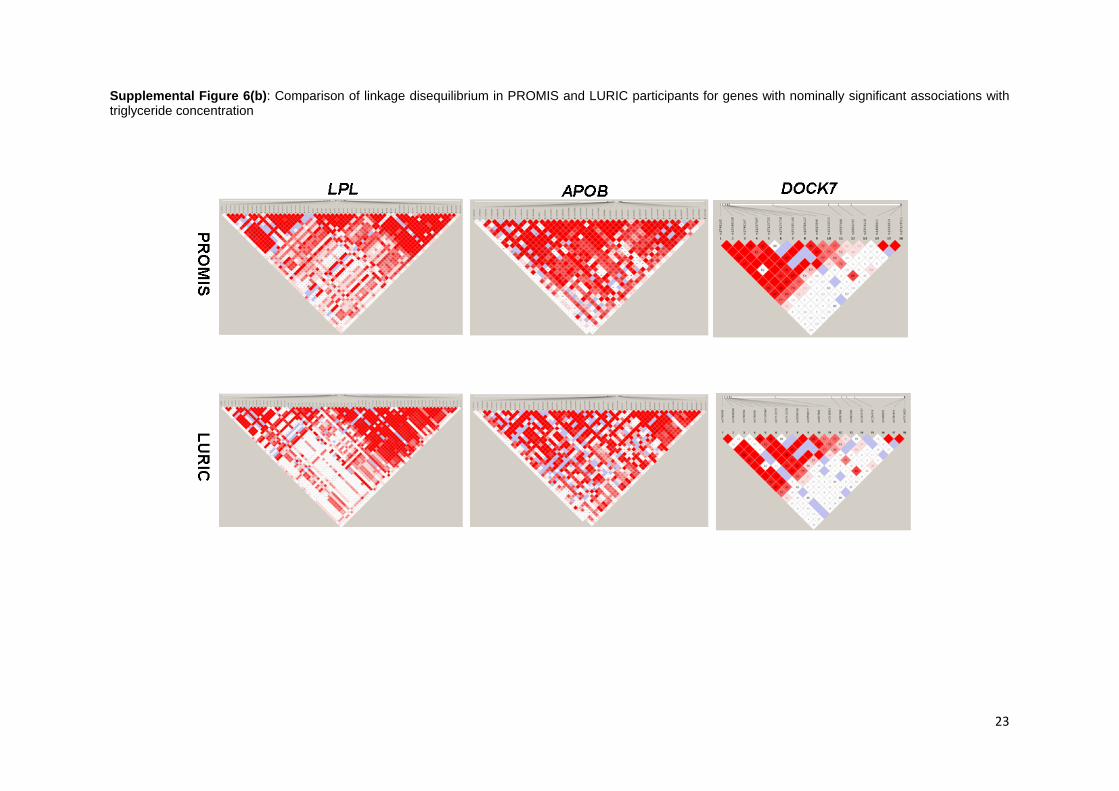
23
Supplemental Figure 6(b): Comparison of linkage disequilibrium in PROMIS and LURIC participants for genes with nominally significant associations with triglyceride concentration
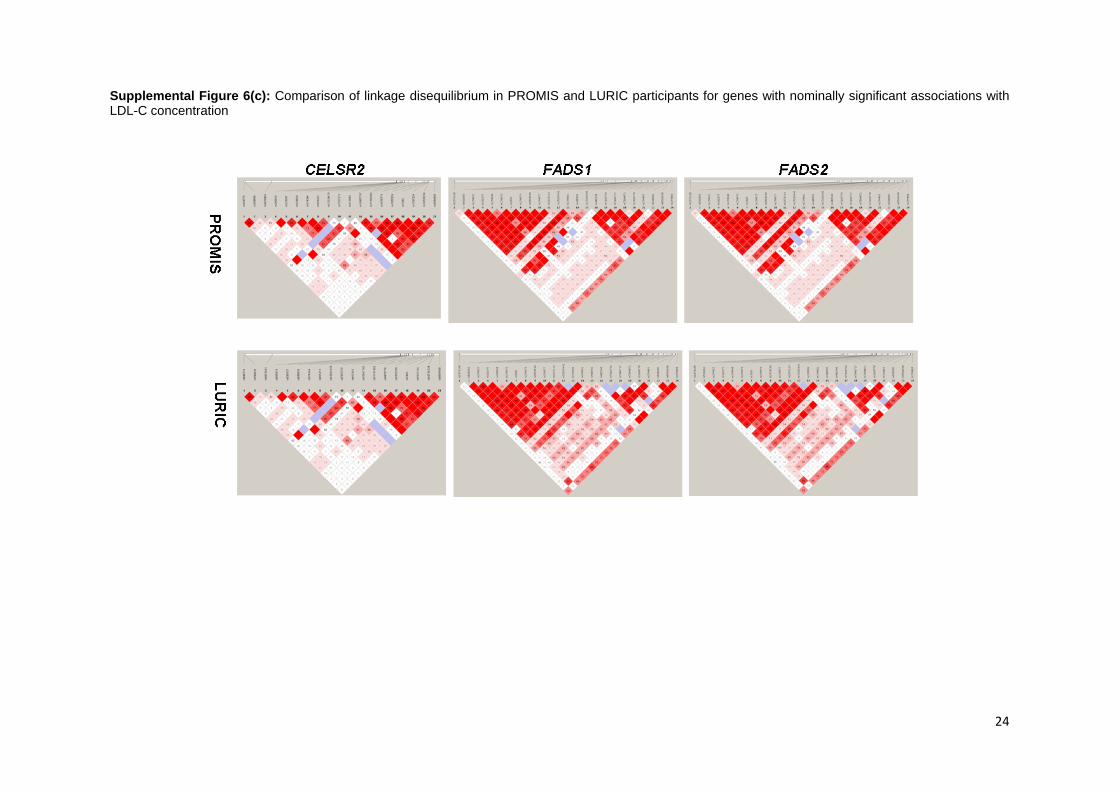
24
Supplemental Figure 6(c): Comparison of linkage disequilibrium in PROMIS and LURIC participants for genes with nominally significant associations with LDL-C concentration
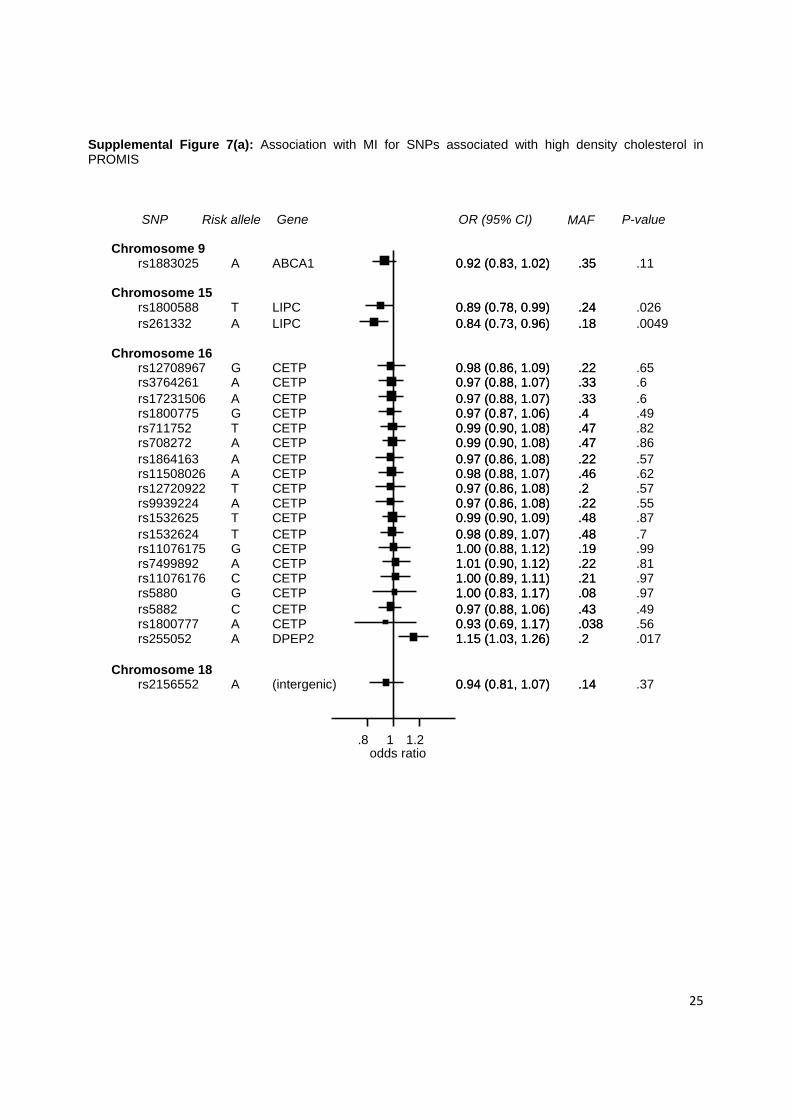
25
Supplemental Figure 7(a): Association with MI for SNPs associated with high density cholesterol in PROMIS
rs12708967
rs11508026
rs9939224
rs255052
rs17231506
rs1800777rs5882
rs2156552
rs1864163
rs261332
rs12720922
rs11076175
rs3764261
rs5880
rs711752
rs1883025
rs1532625
rs1800775
rs7499892rs11076176
rs1800588
rs708272
rs1532624
G
A
A
A
A
AC
A
A
A
T
G
A
G
T
A
T
G
AC
T
A
T
CETP
CETP
CETP
DPEP2
CETP
CETPCETP
(intergenic)
CETP
LIPC
CETP
CETP
CETP
CETP
CETP
ABCA1
CETP
CETP
CETPCETP
LIPC
CETP
CETP
0.98 (0.86, 1.09)
0.98 (0.88, 1.07)
0.97 (0.86, 1.08)
1.15 (1.03, 1.26)
0.97 (0.88, 1.07)
0.93 (0.69, 1.17)0.97 (0.88, 1.06)
0.94 (0.81, 1.07)
0.97 (0.86, 1.08)
0.84 (0.73, 0.96)
0.97 (0.86, 1.08)
1.00 (0.88, 1.12)
0.97 (0.88, 1.07)
1.00 (0.83, 1.17)
0.99 (0.90, 1.08)
0.92 (0.83, 1.02)
0.99 (0.90, 1.09)
0.97 (0.87, 1.06)
1.01 (0.90, 1.12)1.00 (0.89, 1.11)
0.89 (0.78, 0.99)
0.99 (0.90, 1.08)
0.98 (0.89, 1.07)
.22
.46
.22
.2
.33
.038
.43
.14
.22
.18
.2
.19
.33
.08
.47
.35
.48
.4
.22
.21
.24
.47
.48
.65
.62
.55
.017
.6
.56
.49
.37
.57
.0049
.57
.99
.6
.97
.82
.11
.87
.49
.81
.97
.026
.86
.7
0.98 (0.86, 1.09)
0.98 (0.88, 1.07)
0.97 (0.86, 1.08)
1.15 (1.03, 1.26)
0.97 (0.88, 1.07)
0.93 (0.69, 1.17)0.97 (0.88, 1.06)
0.94 (0.81, 1.07)
0.97 (0.86, 1.08)
0.84 (0.73, 0.96)
0.97 (0.86, 1.08)
1.00 (0.88, 1.12)
0.97 (0.88, 1.07)
1.00 (0.83, 1.17)
0.99 (0.90, 1.08)
0.92 (0.83, 1.02)
0.99 (0.90, 1.09)
0.97 (0.87, 1.06)
1.01 (0.90, 1.12)1.00 (0.89, 1.11)
0.89 (0.78, 0.99)
0.99 (0.90, 1.08)
0.98 (0.89, 1.07)
.22
.46
.22
.2
.33
.038
.43
.14
.22
.18
.2
.19
.33
.08
.47
.35
.48
.4
.22
.21
.24
.47
.48
.8 1 1.2
Chromosome 15
Chromosome 16
Chromosome 18
Chromosome 9
SNP Gene OR (95% CI) P-valueMAFRisk allele
odds ratio
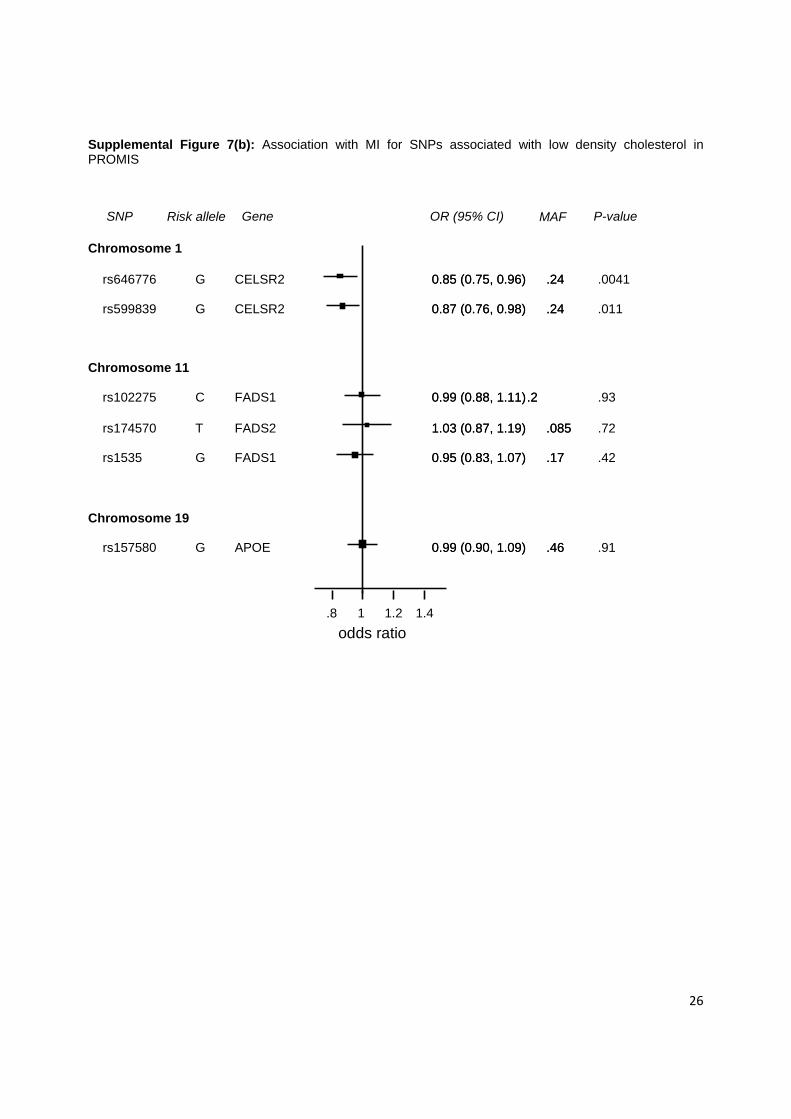
26
Supplemental Figure 7(b): Association with MI for SNPs associated with low density cholesterol in PROMIS
Chromosome 11
rs1535
rs174570
rs102275
rs599839
Chromosome 19
rs646776
rs157580
Chromosome 1
G
T
C
G
G
G
FADS1
FADS2
FADS1
CELSR2
CELSR2
APOE
0.95 (0.83, 1.07)
1.03 (0.87, 1.19)
0.99 (0.88, 1.11)
0.87 (0.76, 0.98)
0.85 (0.75, 0.96)
0.99 (0.90, 1.09)
.17
.085
.2
.24
.24
.46
.42
.72
.93
.011
.0041
.91
0.95 (0.83, 1.07)
1.03 (0.87, 1.19)
0.99 (0.88, 1.11)
0.87 (0.76, 0.98)
0.85 (0.75, 0.96)
0.99 (0.90, 1.09)
.17
.085
.2
.24
.24
.46
.8 1 1.2 1.4
SNP Gene OR (95% CI) P-valueMAFRisk allele
odds ratio
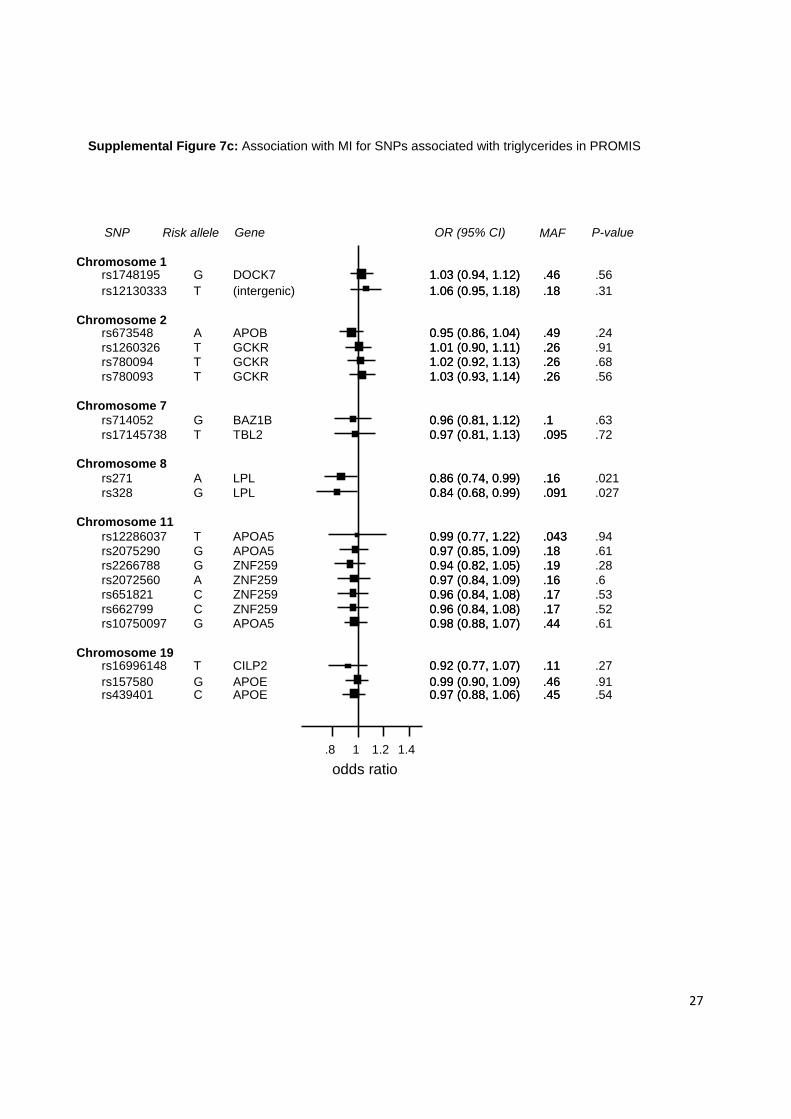
27
Supplemental Figure 7c: Association with MI for SNPs associated with triglycerides in PROMIS
rs12286037
rs1748195
rs10750097
rs157580
Chromosome 11
rs662799
Chromosome 19
rs1260326
rs16996148
Chromosome 7
rs2266788
rs271
rs780093
rs12130333
rs714052
Chromosome 8
Chromosome 2rs673548
rs2072560
Chromosome 1
rs780094
rs17145738
rs2075290
rs439401
rs651821
rs328
T
G
G
G
C
T
T
G
A
T
T
G
A
A
T
T
G
C
C
G
APOA5
DOCK7
APOA5
APOE
ZNF259
GCKR
CILP2
ZNF259
LPL
GCKR
(intergenic)
BAZ1B
APOB
ZNF259
GCKR
TBL2
APOA5
APOE
ZNF259
LPL
0.99 (0.77, 1.22)
1.03 (0.94, 1.12)
0.98 (0.88, 1.07)
0.99 (0.90, 1.09)
0.96 (0.84, 1.08)
1.01 (0.90, 1.11)
0.92 (0.77, 1.07)
0.94 (0.82, 1.05)
0.86 (0.74, 0.99)
1.03 (0.93, 1.14)
1.06 (0.95, 1.18)
0.96 (0.81, 1.12)
0.95 (0.86, 1.04)
0.97 (0.84, 1.09)
1.02 (0.92, 1.13)
0.97 (0.81, 1.13)
0.97 (0.85, 1.09)
0.97 (0.88, 1.06)
0.96 (0.84, 1.08)
0.84 (0.68, 0.99)
.043
.46
.44
.46
.17
.26
.11
.19
.16
.26
.18
.1
.49
.16
.26
.095
.18
.45
.17
.091
.94
.56
.61
.91
.52
.91
.27
.28
.021
.56
.31
.63
.24
.6
.68
.72
.61
.54
.53
.027
0.99 (0.77, 1.22)
1.03 (0.94, 1.12)
0.98 (0.88, 1.07)
0.99 (0.90, 1.09)
0.96 (0.84, 1.08)
1.01 (0.90, 1.11)
0.92 (0.77, 1.07)
0.94 (0.82, 1.05)
0.86 (0.74, 0.99)
1.03 (0.93, 1.14)
1.06 (0.95, 1.18)
0.96 (0.81, 1.12)
0.95 (0.86, 1.04)
0.97 (0.84, 1.09)
1.02 (0.92, 1.13)
0.97 (0.81, 1.13)
0.97 (0.85, 1.09)
0.97 (0.88, 1.06)
0.96 (0.84, 1.08)
0.84 (0.68, 0.99)
.043
.46
.44
.46
.17
.26
.11
.19
.16
.26
.18
.1
.49
.16
.26
.095
.18
.45
.17
.091
.8 1 1.2 1.4
SNP Gene OR (95% CI) P-valueMAFRisk allele
odds ratio
28
Acknowledgements
We would like to acknowledge the contributions of the following individuals: Epidemiological fieldwork in Pakistan: Zeeshan Ozair, Fahad Shuja, Mustafa Qadir Hameed, Imad Hussain, Hamza Khalid, Ali Memon, Kamran Shahid, Ali Kazmi, Sana Nasim, Muhammad Ahsan Javed, Zahir Hussain, Kanwal Aamir, Mazhar Khan, Muhammad Zuhair Yusuf, Muhammad Zafar, Faisal Majeed, Madiha Ishaq, Turkey Hussain Marmoos, Faud Khurshid, Farhat Abdul Muntaqim, Sarosh Fatima, Rehan Ahmed, Muhammad Nabeel, Mansoor Ahmed Khokar, Syed Shazad Hussain, Madad Ali Ujjan, Parveen Sultan, Asghar Ali, Ayaz Ali, Mir Alam, Hassan Zaib, Abdul Ghafoor, Saeed Ahmed, Muhammad Riazuddin, Muhammad Irshad Javed, Jabir Furqan, Abdul Ghaffar, Muhammad Shahid, Tanveer Baig Mirza, Muhammad Naeem, Afzal Hussain, Abdul Hakeem, Zahid Hussain, Tanveer Abbas, Muhammad Khurram Shahzad, Khowaja Muhammad Shoaib, Muhammad Imran Nisar, Altaf Hussain, Waleed Kayani, Muhammad Shazad, Mehmood Jafree and Ayeesha Kamal. Laboratory assays: Asad Ali Shah, Sobia Naz, Farina Hanif, Shaheen Khanum, Aisha Nazir, Aisha Sultana, Mehwish Jabar, Zahid Hussain, Madiha Yameen, Nadir Khan, Inosh Hasan, Jonathan Stephens, Pamela Whittaker, Radhi Ravindrarajah, Owen T McCann and the personnel of the WTSI Genotyping Facility Jackie Bryant, Sarah L. Clark, Jen S. Conquer, Thomas Dibling, Stephen Gamble, Clifford Hind, Michelle Ricketts, Claire R. Stribling, Sam Taylor, Alicja Wilk, Julia C. Wyatt, Silvia Behaim, Ursula Discher, Isolde Friedrich, Brigitte Haas, Gaby Herr and Brigitte Kreisel. Data management: Sarfaraz Sher Ali, Touqeer Ahmed, Fariha Nadeem, Matthew Walker, Sarah Watson and Mohammed J.R. Ghori. Epidemiological/statistical support: Nilesh Samani and Kausik Ray. Administration: Kashif Saleheen and Hannah Sneath.