Embed Size (px)
Citation preview
1
Genetic Association with Lipids in Filipinos: Waist Circumference Modifies an APOA5 effect on
Triglyceride Levels
Running title: Waist modifies an APOA5 effect on triglyceride level
Ying Wu*,1
, Amanda F. Marvelle*,1
, Jin Li*,†
, Damien C. Croteau-Chonka*, Alan B. Feranil
§, Christopher
W. Kuzawa**,††
, Yun Li*,§§,***
, Linda S. Adair†††
, Karen L. Mohlke*,2
* Department of Genetics, University of North Carolina, Chapel Hill, NC 27599
† Curriculum in Bioinformatics and Computational Biology, University of North Carolina, Chapel Hill,
NC 27599
§ USC-Office of Population Studies Foundation, University of San Carlos, Cebu City 6000, Philippines
** Department of Anthropology, Northwestern University, Evanston, IL 60208
†† Cells 2 Society: The Center for Social Disparities and Health at the Institute for Policy Research,
Northwestern University, Evanston, IL 60208
§§ Department of Biostatistics, University of North Carolina, Chapel Hill, NC 27599
*** Department of Computer Science, University of North Carolina, Chapel Hill, NC 27599
††† Department of Nutrition, University of North Carolina, Chapel Hill, NC 27599
1 These people contributed equally to this article.
2 Send correspondence to:
Karen L. Mohlke, Ph.D.
Department of Genetics
5096 Genetic Medicine
University of North Carolina
Chapel Hill, NC 27599-7264
Tel: (919) 966-2913
Fax: (919) 966-3630
Email: [email protected]
by guest, on March 28, 2018
ww
w.jlr.org
Dow
nloaded from
2
Abstract
Blood levels of lipoprotein cholesterol and triglycerides (TG) are highly heritable and are major
risk factors for cardiovascular disease (CVD). Approximately 100 lipid-associated loci have been
identified in populations of European ancestry. We performed a genome-wide association study of lipid
traits in 1,782 Filipino women from the Cebu Longitudinal Health and Nutrition Survey (CLHNS), and
tested for evidence of interactions with waist circumference. We conducted additional association and
interaction analyses in 1,719 of their young adult offspring. Genome-wide significant associations (P < 5
× 10-8
) were detected at APOE for low-density lipoprotein cholesterol (LDL-C) and total cholesterol (TC),
and at APOA5 for TG. Suggestive associations (P < 10-6
) were detected at GCKR for TG, and at CETP
and TOM1 for high-density lipoprotein cholesterol (HDL-C). Our data also supported the existence of
allelic heterogeneity at APOA5, CETP, LIPC and APOE. The secondary signal (Gly185Cys) at APOA5
exhibited a SNP-by-waist circumference interaction affecting TG (Pinteraction = 1.6 × 10⁻⁴
), manifested by
stronger SNP effects as waist circumference increased. These findings provide the first evidence that
central obesity may accentuate the effect of the TG-increasing allele of that APOA5 signal, emphasizing
that CVD risk could be reduced by central obesity control.
Key Words: genome-wide association, lipid traits, waist circumference, interaction, APOA5, Filipinos
by guest, on March 28, 2018
ww
w.jlr.org
Dow
nloaded from
3
Introduction
Blood concentrations of lipoprotein cholesterol and triglycerides are major risk factors for
cardiovascular disease (CVD), the current leading cause of mortality worldwide (1). The most rapid
increase in the prevalence of CVD is taking place in Asia, including the Philippines (1), although the
obesity-related anthropometric measures remain lower in these Asian populations compared to those in
populations of Europeans (2). Family-based studies have demonstrated that 40-50% of the total variation
in lipid traits is genetically determined (3). Genome-wide association (GWA) studies have identified
~100 loci associated with fasting levels of total cholesterol (TC), high-density lipoprotein cholesterol
(HDL-C), low-density lipoprotein cholesterol (LDL-C) and triglycerides (TG) in Europeans (4-9). Many
of these lipid-associated loci, including APOA5, LPL, GCKR, TRIB1, MLXIPL, CETP, LIPC and ABCA1,
were further confirmed in individuals of non-European ancestries (10-12). More recently, a large-scale
GWA study conducted in East Asians identified additional HDL-C signals near MYL2 and HECTD4
(C12orf51) (11). The full gene names corresponding to the locus symbols are listed in Table S1.
The GWA signals identified to date have only explained ~10% phenotypic variation in each lipid
trait, corresponding to ~25% of the trait heritability (8). Additional heritability may be explained by the
incomplete coverage of functional variants and by allelic heterogeneity (13, 14). Gene-by-environment
interactions may also account for some heritability (15) because the interactive effects of environmental
modifiers may hinder the detection of genetic associations (16). Earlier studies have demonstrated that
diet, alcohol, smoking and physical activity can modulate genetic effects on lipid levels (12, 17-19). In
addition, evidence exists that anthropometric traits, including body mass index (BMI), waist-hip ratio
(WHR) and body composition, modify the association between genetic variants and lipid traits (20).
In recent decades, the rising prevalence of CVD shows a positive link with the increasing
prevalence of central obesity (21, 22). Waist circumference is believed to be a stronger predictor of CVD
than BMI, particularly in Asians, who tend to have a higher risk of CVD at any given level of BMI
compared to Europeans (23). Intra-abdominal visceral fat accumulation has been shown to affect the lipid
levels either directly or via insulin resistance (24, 25). Despite considerable evidence that genetic variants
by guest, on March 28, 2018
ww
w.jlr.org
Dow
nloaded from
4
and obesity traits independently and jointly influence lipid levels, few studies have explicitly examined
the modifying effect of waist circumference on lipid associations identified by GWA studies.
To test the hypothesis that central obesity would influence the association between genetic
variation and lipid levels, we performed a GWA study to investigate SNP associations with lipoprotein
cholesterol and triglyceride levels in 1,782 Filipino mothers from the Cebu Longitudinal Health and
Nutrition Survey (CLHNS) and tested for interactions between lipid-associated variants and waist
circumference affecting lipid levels. We also conducted analyses in 1,719 young adult offspring of the
CLHNS mothers using Metabochip genotypes to confirm SNP associations and interactions with waist
circumference.
Methods and procedures
Study subjects and phenotypes
The Cebu Longitudinal Health and Nutrition Survey (CLHNS) is an ongoing population-based
birth cohort study that began in 1983. The original study population, study design and recruitment
protocols have been described in detail previously (26). Briefly, the baseline survey randomly recruited
3,327 pregnant women from the Metropolitan Cebu area, the Philippines in 1983-84 (3,080 singleton live
births), and since followed them and their offspring to the present. Trained field staff conducted in-home
interviews and collected anthropometric measurements at each visit. Overnight fasting plasma samples
for DNA extraction and biomarker measurements were obtained in 2005. Written informed consent was
obtained from all participants, and study protocols were approved by the University of North Carolina
Institute Review Board for the Protection of Human Subjects.
The current study used cross-sectional data from the 2005 survey available for 1,782 mothers and
1,719 male and female young adult offspring. Three measurements of waist circumference were taken to
the nearest 0.1 cm, placing a plastic tape about two inches above the navel, after normal exhalation (27).
The three measurements of waist circumference were taken at the same time and their average was used
for analyses. TC was measured using enzymatic methods on the Beckman Diagnostics CX5 chemistry
by guest, on March 28, 2018
ww
w.jlr.org
Dow
nloaded from
5
analyzer (Beckman Coulter Diagnostics, Fullerton, CA). HDL-C and LDL-C were determined using the
homogenous assays Direct HDL-C and Direct LDL-C (Equal Diagnostics, Exton, PA). TG was measured
with a glycerol blank as a 2-step reaction (28). Only one of the CLHNS mothers and one of the young
adult offspring were taking lipid-altering medication.
Genotyping and imputation
SNP genotyping of the CLHNS mothers was performed with the Affymetrix Genomewide
Human SNP Array 5.0 at the Vanderbilt Microarray Shared Resource at Vanderbilt University Medical
Center, Nashville, TN, USA, using the standard protocol recommended by the manufacturer. The quality
control procedures have been previously described (29). As the imputation using the 1000 Genomes
CEU+CHB+JPT reference panel (error rate 3.6%, and MACH r2 0.86) led to a better imputation quality
compared to that using the CHB+JPT panel (error rate 3.3%, and MACH r2 0.81), we applied MACH to
impute genotypes based on phased reference haplotypes from the 1000 Genomes Project CEU+CHB+JPT
samples (June 2010 release). After exclusion of SNPs with poor imputation quality (MACH r2 < 0.3),
~3.7 million imputed SNPs were tested for association with TC, HDL-C, LDL-C and TG. The candidate
SNP APOE rs7412 was not available in the genome-wide data and was genotyped using TaqMan allelic
discrimination (Applied Biosystems, Foster City, CA).
The 1,719 CLHNS offspring were genotyped by the UNC Mammalian Genotyping using the
Metabochip (Illumina, San Diego, CA), a custom high-density genotyping array of SNPs designed to
provide a high-density coverage for both overall SNPs and low frequency variants concentrated around
GWA loci and/or signals for cardiovascular and metabolic traits (30). The genotyping and quality control
of Metabochip SNPs in the CLHNS offspring were described previously (31).
In the CLHNS mothers, ~350,000 markers were directly genotyped, and imputation was
performed for all markers based on the 1000 Genomes Project; we used the imputed genotypes for all
markers (29). In the offspring, all variants for analyses were directly genotyped by Metabochip.
by guest, on March 28, 2018
ww
w.jlr.org
Dow
nloaded from
6
Statistical analysis
Values of TC and TG were natural log-transformed (ln) to approximate the normal distributions
of the traits. We applied multiple linear regression models and assumed an additive mode of inheritance
to test for the association between genotypes and HDL-C, LDL-C, ln TC and ln TG.
We constructed 10 principal components (PCs) of population substructure using EIGENSOFT
(32). In the CLHNS mothers, we applied MACH2QTL (http://www.sph.umich.edu/csg/yli/software.html)
to perform the GWA analyses, adjusting for age, age2, household assets (a score that counts the
possession of land, house and household amenities, such as a TV or refrigerator) (33), natural log-
transformed (ln) household income, and the first seven PCs. To control for the effects of other potential
factors that could confound the SNP-lipid associations, we also conducted additional analyses with
additional covariates, including menopausal status, current smoking and type 2 diabetes, in the CLHNS
mothers. In the CLHNS offspring, we used SAS version 9.2 (SAS Institute, Cary, NC) to test the
association between lipid traits and selected SNPs that were reported in previous GWA studies. As the
ages of all offspring were within two years of each other, only sex, household assets, ln household income,
and the first seven PCs were included as covariates. To examine the association in the combined cohort
of mothers and offspring, we applied a general linear mixed model that accounted for the correlation of
the outcome trait between mother-child pairs due to shared genetic and environmental exposures. Age,
age2, sex, household assets, ln transformed household income, the first seven PCs and generation
(mother/offspring) were used as covariates.
For each SNP that showed evidence of a main effect association with a lipid trait in the CLHNS
(P < 0.1 in both mothers and offspring analyzed separately), we further tested for a genotype interaction
with waist circumference by including a SNP-by-waist circumference interaction term in the linear
regression model or in the linear mixed model. The same sets of covariates used in the main effect
analyses were included in the interaction analyses. For each SNP that showed significant evidence of
interaction (Pinteraction < 0.05 in both mother and offspring cohorts), we conducted a stratified analysis by
by guest, on March 28, 2018
ww
w.jlr.org
Dow
nloaded from
7
categorizing the study samples based on quartiles of waist circumference and testing for the main effects
of the SNP on lipids within quartiles. All interaction analyses were conducted in SAS version 9.2.
Results
The general characteristics of the 1,782 mothers and 1,719 young adult offspring from the
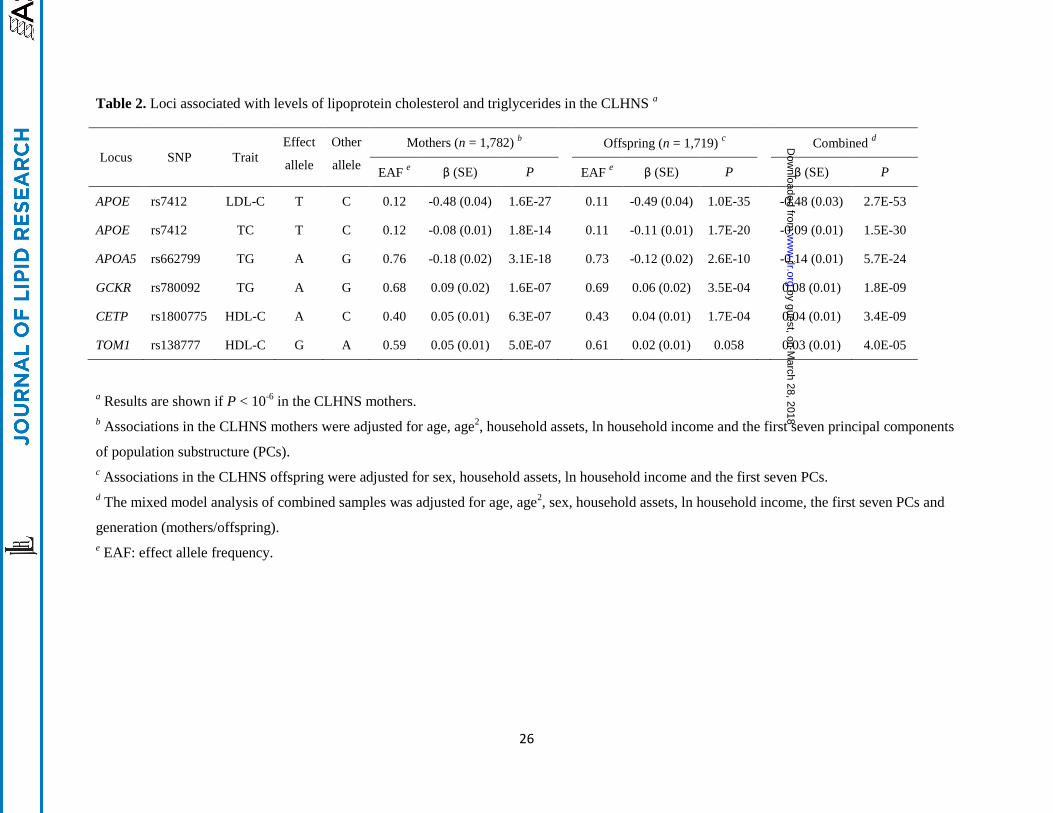
CLHNS studied in these genetic analyses are shown in Table 1. Association analyses revealed genome-
wide significant associations (P < 5 × 10⁻⁸
) at APOE for both LDL-C (rs7412, P = 1.6 × 10⁻²⁷
) and TC
(rs7412, P = 1.8 × 10⁻¹⁴
), and at APOA5 for TG (rs662799, P = 3.1 × 10⁻¹⁸
) in the CLHNS mothers (Table
2). Suggestive evidence of association at a less stringent threshold of P < 10-6
was detected at the TG
locus GCKR (rs780092, P = 1.6 × 10⁻⁷
) and the HDL-C locus CETP (rs1800775, P = 6.3 × 10⁻⁷
). In
addition, we observed that variants at TOM1, a new HDL-C locus recently identified in a large-scale
meta-analysis in individuals of European ancestry (9), also exhibited suggestive evidence of association in
the mothers (rs138777, P = 5.0 × 10⁻⁷
).
We further evaluated these SNP associations in the CLHNS young adult offspring genotyped
using the Metabochip (Table 2). We observed significant associations (P < 5 × 10⁻⁸
) for the variants at
APOE (P = 1.0 × 10⁻³⁵
for LDL-C and 1.7 × 10⁻²⁰
for TC) and APOA5 (P = 2.6 × 10⁻¹⁰
), and nominal
association for SNPs at GCKR (P = 3.5 × 10⁻⁴
) and CETP (P = 1.7 × 10⁻⁴
). For the SNP rs138777 at
TOM1, we found marginal association with HDL-C in the offspring (P = 0.058). In the combined
analysis including both mothers and offspring, all of these loci except TOM1 (P = 4.0 × 10⁻⁵
), reached
significance at P < 5 × 10⁻⁸
(Table 2).
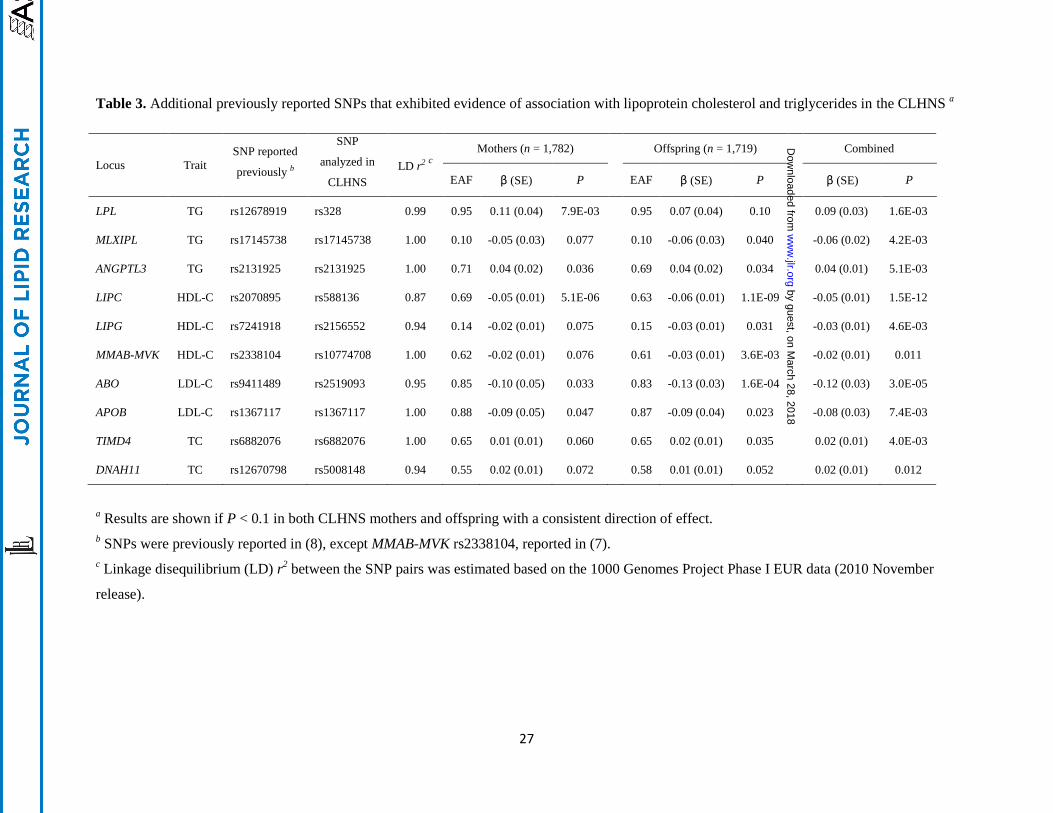
We next assessed whether additional SNP-lipid associations identified in previous GWA studies
could be extended to Filipino middle-aged and young adults, groups that have not been widely studied.
As all the loci were previously reported, we defined the evidence of association as P < 0.1 for the reported
GWA index SNPs or their proxies in both mothers and offspring with a consistent direction of effect.
Among the 95 previously reported lipid loci (8), 14 reached this threshold in the CLHNS. In addition to
by guest, on March 28, 2018
ww
w.jlr.org
Dow
nloaded from
8
the four loci (APOE, APOA5, GCKR, and CETP) described in Table 2, the additional loci included three
for TG (LPL, MLXIPL and ANGPTL3), three for HDL-C (LIPC, MMAB-MVK and LIPG), two for LDL-C
(ABO and APOB), and two for TC (TIMD4 and DNAH11) (Table 3). Analyses including both mothers
and offspring showed that the variant rs588136 at LIPC also exhibited genome-wide significant
association with HDL-C levels in the combined samples (P = 1.5 × 10⁻¹²
).
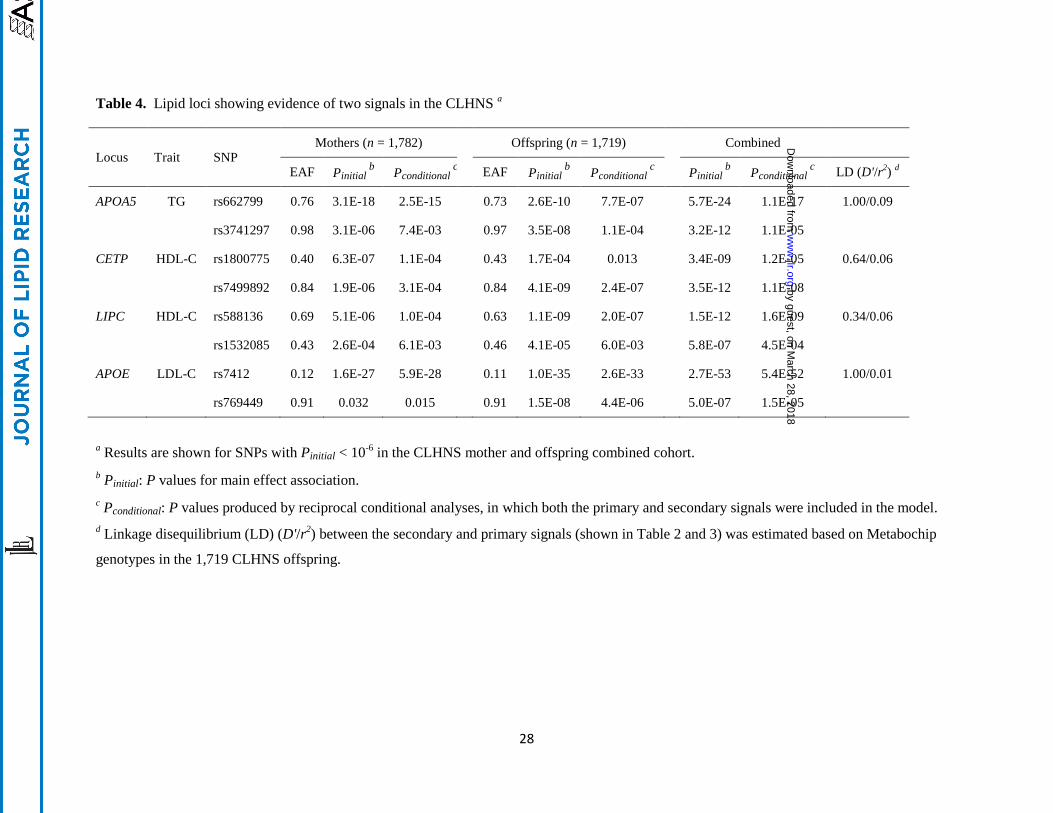
Given prior evidence that up to ten lipid-associated loci exhibited two or more signals (7, 8, 14),
and in particular, that at least four lipid loci have been reported to contain multiple signals in East Asians
(APOA5 for TG, CETP for HDL-C, and APOE and ABO for LDL-C) (14), we next tested for the
association with these additional variants in the CLHNS samples. We conditioned on the SNP genotype
of the initial signal and defined a secondary signal as the most strongly associated SNP with a Pconditional <
5 × 10⁻⁴
in combined mothers and offspring. After accounting for the effects of the most strongly
associated SNPs at each of the five loci that reached GWA significance in the combined mothers and
offspring, we confirmed the presence of secondary signals at four loci including the TG locus APOA5, the
HDL-C loci CETP and LIPC, and the LDL-C locus APOE (Table 4). Except at the LDL-C locus APOE,
the evidence of association of the second signals was attenuated when we conditioned on the first signals
at the corresponding loci (|∆(-log10P)| > 2), suggesting that these additional signals at APOA5, CETP and
LIPC were not completely independent of the first signals (Table 4). In further analyses adjusting for the
additional covariates of menopausal status, current smoking and type 2 diabetes status (Table S2), we
observed similar results for the SNPs described above (all |∆(-log10P)| < 1, Table S3).
As shown in Table S4, individuals with larger waist circumference have more atherogenic
lipoprotein profiles. To investigate whether the associations in Tables 2–4 were affected by measures of
waist circumference, a known predictor of CVD risk, we tested the SNP-lipid associations again while
also adjusting for waist circumference in addition to the covariates included in the initial model. Results
from analyses in the CLHNS mothers showed that the association evidence did not change substantially
for most of the loci (|∆(-log10P)| < 2) (Table S3). However, adjusting for waist circumference appeared to
by guest, on March 28, 2018
ww
w.jlr.org
Dow
nloaded from
9
influence the association of the APOA5 variant rs662799 with TG (unadjusted P = 3.1 × 10⁻¹⁸
; adjusted P
= 2.8 × 10⁻²¹
) (Table S3).
We next assessed whether the lipid-associated SNPs exhibited evidence of interaction with waist
circumference on lipid levels (Table S5). Among the 20 signals at 15 loci with main effect associations
shown in Tables 2–4, we observed SNP-by-waist circumference interactions (Pinteraction < 0.05) affecting
TG for APOA5 variants rs3741297 (Pinteraction = 9.6 × 10⁻³
) and rs662799 (Pinteraction = 0.032), and
affecting TC level for the APOE variant rs7412 (Pinteraction = 0.034) in CLHNS mothers. Additional
analyses in the offspring confirmed the interaction for APOA5 rs3741297 (Pinteraction = 7.4 × 10⁻³
). In a
mixed model that combined the mothers and offspring together, the interaction remained significant
(Pinteraction = 1.6 × 10⁻⁴
), even after a conservative Bonferroni correction for multiple testing (P < 8.3 × 10-
4, 0.05/60 tests).
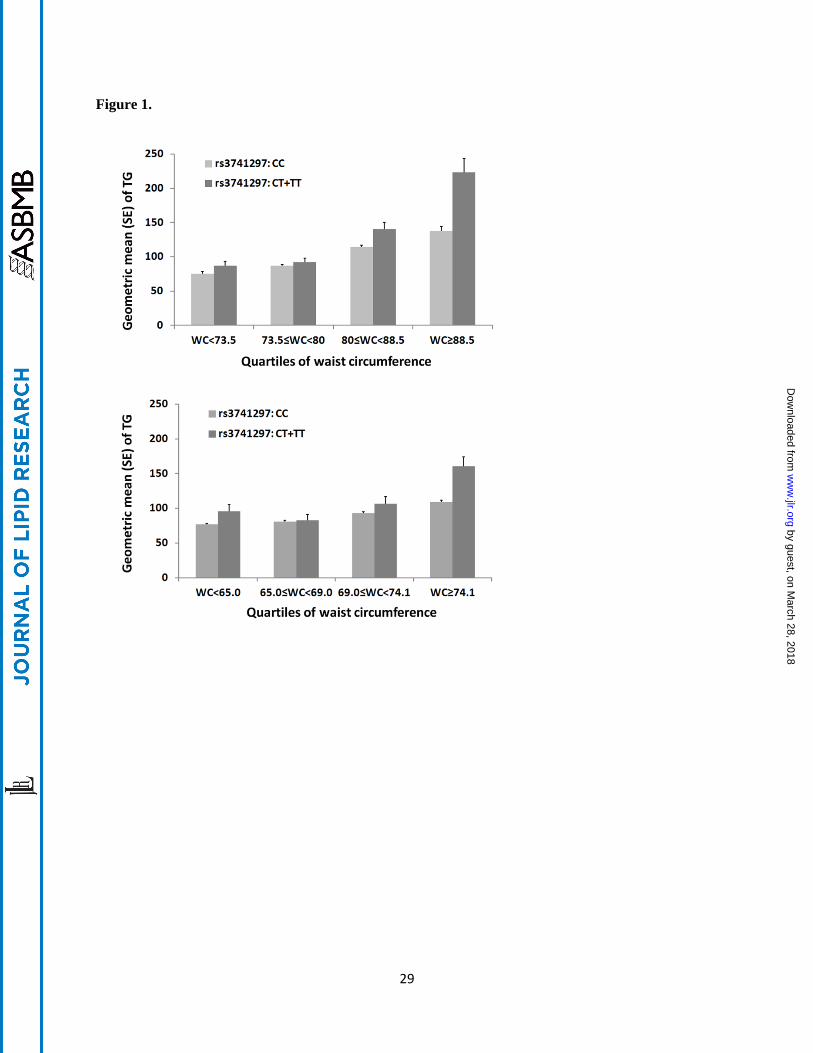
Further analyses stratified by quartiles of waist circumference supported the interaction between
APOA5 variant rs3741297 and waist circumference affecting TG levels. In the mothers, the SNP had no
effect on TG in the lowest quartile of waist circumference < 73.5 cm (Q1: geometric mean of TG level in
individuals carrying CC = 0.85 mmol/L and CT+TT = 0.98 mmol/L, P = 0.93, n = 440), but the minor
allele was significantly associated with higher TG level in higher quartiles of waist circumference (Q2:
CC = 0.98 mmol/L and CT+TT = 1.04 mmol/L, P = 0.047, n = 442; Q3: CC = 1.29 mmol/L and CT+TT
= 1.59 mmol/L, P = 2.6 × 10⁻³
, n = 444; Q4: CC = 1.56 mmol/L and CT+TT = 2.52 mmol/L, P = 4.5 × 10-
3, n = 443; Figure 1A). The magnitudes of the association became stronger as waist circumference
increased (Q1: β = -0.01, Q2: β = 0.24, Q3: β = 0.51 and Q4: β = 0.52). Notably, we observed a
consistent pattern of interaction in the offspring, with stronger SNP effects in individuals with higher
waist circumference (Q1: β = 0.21, n = 408; Q2: β = 0.04, n = 411; Q3: β = 0.14, n = 415 and Q4: β =
0.37, n = 415; Figure 1B). The mothers have a higher median waist circumference than the offspring, we
next stratified the samples using a threshold of 74.0 cm, the median of waist circumference in the
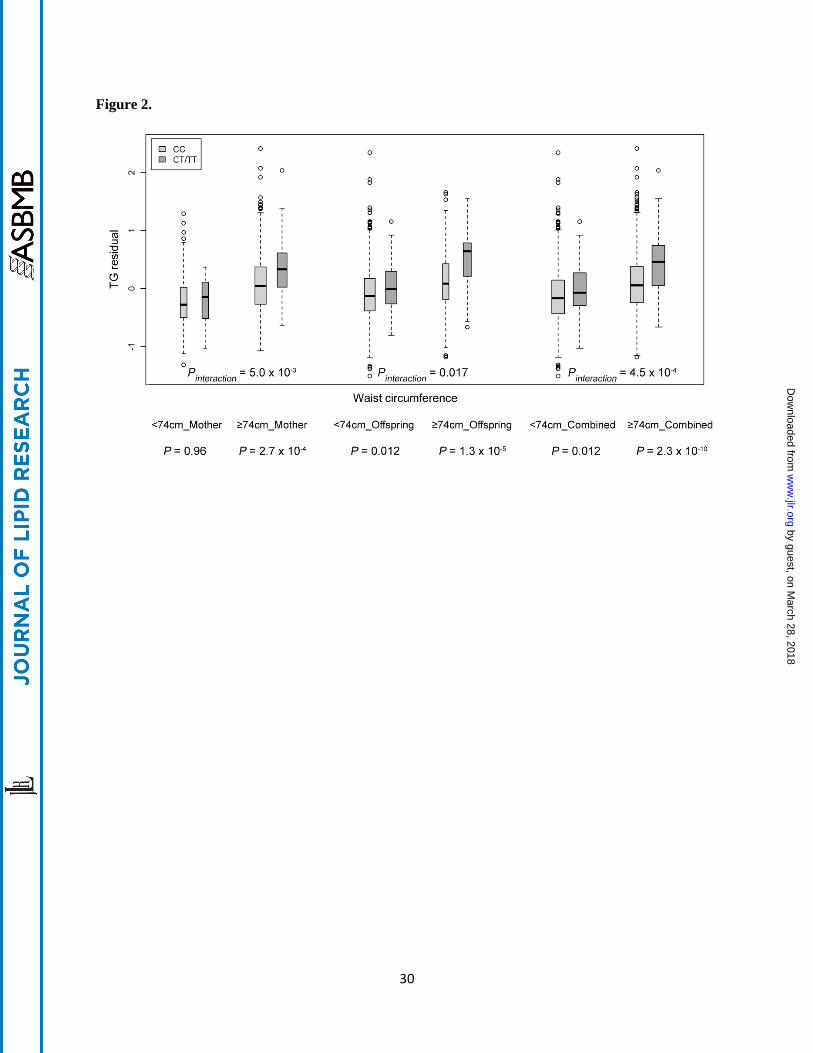
combined cohort. In the combined mothers and offspring, individuals carrying the T allele of rs3741297
by guest, on March 28, 2018
ww
w.jlr.org
Dow
nloaded from
10
had significantly higher TG levels compared to the CC carriers only in the larger waist circumference
group (≥ 74.0 cm; β = 0.41, 0.38 and 0.38 in mothers, offspring and combined cohorts), but not in the
smaller waist group (< 74.0 cm; β = -0.01, 0.14 and 0.12 in mothers, offspring and combined cohorts)
(Figure 2).
As sex may influence the SNP association with lipid traits, we further tested the evidence of sex
differences among the SNPs with main effect association. As shown in Table S6, all P values for SNP-
by-sex interaction were > 0.05, except for a variant rs7499892 at CETP, which exhibited suggestive
evidence of sexual dimorphic association for HDL-C level in CLHNS offspring (Pinteraction = 0.045,
without Bonferroni correction); a sex-stratified analysis showed a stronger genetic effect in women (β =
0.098, P = 1.4 × 10⁻⁶
) than in men (β = 0.051, P = 5.5 × 10⁻⁴
).
Discussion
In this study of genetic associations with lipoprotein and TG levels in Filipinos from the CLHNS,
we observed the associations at 15 loci, which accounted for 3.1%, 4.7%, 6.8% and 6.2% of the
phenotypic variation of TC, HDL-C, LDL-C and TG, respectively, in the mothers from the CLHNS.
Consistent with previous findings (7, 8), in particular those from populations of East Asians (14), our data
also supported the existence of allelic heterogeneity at APOA5, CETP, LIPC, and APOE; the four
secondary signals observed at these loci led to an average 23% increase in the amount of phenotypic
variance compared to that explained by the most strongly associated variants alone. In addition, the
findings of these consistent SNP-lipid associations in a young adult population aged ~20 years, who had
healthier lipid levels compared to middle-aged or elder individuals, suggests a shared genetic influence on
lipid levels across adulthood despite differing durations of environmental exposures. While we did not
confirm the other previously reported loci, this might reflect our modest power to detect the association,
differences in linkage disequilibrium (LD) between analyzed variants and underlying functional variants,
by guest, on March 28, 2018
ww
w.jlr.org
Dow
nloaded from
11
or population-specific loci. Furthermore, the modifying effects of environmental factors could have
impeded the detection of some associations (16).
A novel and important finding of this study is the evidence of a significant interaction between an
APOA5 (apolipoprotein A-V) variant and waist circumference affecting TG levels in both mother and
offspring cohorts in the CLHNS. Waist circumference, a measure of abdominal adiposity, may predict
CVD risk better than BMI (34). Waist circumference is strongly associated with CVD and its risk factors
including TG (35). The increasing difference in TG levels between rs3741297 CC and CT+TT carriers
with increasing waist circumference (Figure 1) suggests that a larger waist circumference augments the
genetic effect of the TG-elevating minor allele T. The range of the trait differed in the CLHNS mothers
and offspring (Table 1), reflecting the trend toward increasing waist circumference with age (36). We
observed that the associations were significant in the three higher quartiles of waist circumference in
mothers (≥ 73.5 cm) and appeared stronger in the highest quartile in offspring (≥ 74.1 cm). When we
stratified the individuals using a threshold of 74.0 cm, the median of waist circumference in the mothers
and offspring combined cohort, the pattern of interaction was consistent across analyses in the mothers,
the offspring and the combined cohort. As the offspring were ~20 years younger and had significantly
lower triglyceride levels and smaller waist circumference compared to those in their mothers, the
consistent pattern of interaction suggested that the modifying effect of waist circumference influencing
the APOA5-TG association was not affected by adult age. While the pattern of interaction was consistent
in both cohorts, a combined sample size of ~3,400 is still small, and further larger studies are needed to
confirm these findings and evaluate the effect of duration of larger waist circumference.
Notably, the APOA5 rs3741297 is in complete LD (D' = 1.0, r2 = 1.0 based on CLHNS
offspring genotype data) with a nonsynonymous variant rs2075291 (Gly185Cys), which has been shown
to regulate the activation of lipoprotein lipase (LPL) (37). Evidence from that study showed that the
185Cys substitution of APOA5 could cause reduced LPL-mediated hydrolysis leading to delayed TG
clearance and elevated TG levels in the bloodstream (37). The in vitro identification of a tertiary structure
by guest, on March 28, 2018
ww
w.jlr.org
Dow
nloaded from
12
change due to multimers of the 185Cys APOA5 protein further supports that residue 185 is critical in LPL
activation (38).
The association between Gly185Cys and TG was initially identified in a Chinese population (39)
and subsequently replicated in Japanese (40). The very low frequency of Gly185Cys in other populations
(MAF < 0.005 in Europeans and African Americans) compared to Asians (MAF ~ 0.03) may explain why
its association with TG has only been detected in Asians to date (14). As Gly185Cys was not present on
the GWA genotyping array or the 1000 Genomes Project reference panel (June 2010 release), the variant
was not directly genotyped or imputed in the CLHNS mothers; however, our results based on the
Metabochip genotyped data in the offspring showed the same significant main effect association on TG
level and interaction with waist circumference as for the tested proxy variant rs3741297. In the CLHNS
mothers, the ~4% individuals carrying the TG-increasing T allele of the proxy SNP rs3741297 (LD r2 =
1.0 with 185Cys), had significantly higher TG levels (geometric mean ± SE: 1.63 ± 0.09 mmol/L,
approximately to the upper limit of 1.70 mmol/L for normal TG levels) compared to non-risk allele
carriers (1.28 ± 0.01 mmol/L).
The modifying effect of waist circumference on the APOA5 association with TG is biologically
plausible. The APOA5 185Cys variant's role in reducing LPL activation may be exacerbated by the effect
of abdominal adiposity on LPL mass and activity. Intra-abdominal visceral fat accumulation has been
shown to affect LPL mass and activity either directly or via insulin resistance, thereby impairing the
hydrolysis of triglycerides (24, 25). Similarly, earlier studies demonstrated an interaction of the LPL-
HindIII genotype with abdominal obesity on TG levels (41, 42) and hypothesized that the presence of
central obesity exacerbates the alterations in LPL activity caused by genetic variation, thus preventing the
possible compensatory effects that may occur in non-obese individuals (42). Our identification of a SNP-
by-waist circumference interaction suggests that future studies should analyze genetic associations in
different strata of anthropometric, life style and other environmental factors.
In addition to the two APOA5 variants that we described in this study, many other variants at
APOA5 have been shown to exhibit significant association with TG levels in diverse populations (4-8, 12,
by guest, on March 28, 2018
ww
w.jlr.org
Dow
nloaded from
13
14). Among these reported SNPs, several variants including rs964184 (7, 8), rs3741298 (14) and
rs651821(12, 14) also showed genome-wide significant association (all P < 1× 10-11
) in the CLHNS
mothers; however, the significant level of these associations were substantially attenuated by conditioning
on the most strongly associated variant rs662799 (all Pconditional > 0.45), suggesting that these variants and
rs662799 would represent a same TG signal. Other variants, including rs12272004 (6), rs28927680 (5),
rs12286037 (4) and rs3135506 (14), which were common and significantly associated with TG in
European or African ancestry populations were found to be not variable in the 1000 Genomes Project
ASN samples.
A previous study in the CLHNS reported that compared to women from the US, the Filipino
women had significantly lower levels of HDL-C at all BMI levels and exhibited a higher prevalence of
isolated HDL-C phenotype, which is defined as a combination of low HDL-C (< 35mg/dL) but normal
triglycerides (< 200 mg/dL) (2). Although these findings suggested potentially different effects of genetic
variants across populations, we did not identify any additional loci/variants that were specific to Filipinos
or had substantially larger genetic effects in this population compared to those in Europeans (8, 14). Our
study may not have sufficient power to detect such association, but the unusually low HDL-C level in the
Filipinos is possibly due to the different lifestyle and/or environmental exposures across populations.
In conclusion, our findings emphasize the importance of central obesity prevention in public
health efforts to reduce CVD risk, particularly in individuals who are genetically susceptible to the
disease.
by guest, on March 28, 2018
ww
w.jlr.org
Dow
nloaded from
14
Acknowledgements
Conceived and designed the experiments: YW, AFM and KLM; Analyzed the data: YW, AFM,
JL, and YL; Sample genotyping: DCCC; Sample collection and phenotyping: ABF, CWK and LSA;
Drafted the manuscript: YW and AFM; Revised the manuscript: AFM, DCCC, CWK, YL, LSA and
KLM; Managed the study: ABF, CWK, LSA and KLM. All authors had final approval of the submitted
version.
This work was supported by National Institutes of Health grants (DK078150, TW05596,
HL085144), pilot funds (RR20649, ES10126, DK56350). AFM was supported by an Integrative
Vascular Biology Fellowship, NIH Grant HL69768.
We thank the USC-Office of Population Studies Foundation research and data collection teams
and the study participants who generously provided their time for this study.
Competing interests: the authors have no competing interests.
by guest, on March 28, 2018
ww
w.jlr.org
Dow
nloaded from
15
References
1. The World Health Organization. 2011. Fact sheet No.317: Cardiovascular diseases (CVDs). World
Health Organization (WHO).
2. Rutherford, J. N., T. W. McDade, A. B. Feranil, L. S. Adair, and C. W. Kuzawa. 2010. High
prevalence of low HDL-c in the Philippines compared to the US: population differences in
associations with diet and BMI. Asia Pac J Clin Nutr 19: 57-67.
3. Namboodiri, K. K., E. B. Kaplan, I. Heuch, R. C. Elston, P. P. Green, D. C. Rao, P. Laskarzewski, C.
J. Glueck, and B. M. Rifkind. 1985. The Collaborative Lipid Research Clinics Family Study:
biological and cultural determinants of familial resemblance for plasma lipids and lipoproteins. Genet
Epidemiol 2: 227-254.
4. Willer, C. J., S. Sanna, A. U. Jackson, A. Scuteri, L. L. Bonnycastle, R. Clarke, S. C. Heath, N. J.
Timpson, S. S. Najjar, H. M. Stringham, J. Strait, W. L. Duren, A. Maschio, F. Busonero, A. Mulas,
G. Albai, A. J. Swift, M. A. Morken, N. Narisu, D. Bennett, S. Parish, H. Shen, P. Galan, P. Meneton,
S. Hercberg, D. Zelenika, W. M. Chen, Y. Li, L. J. Scott, P. A. Scheet, J. Sundvall, R. M. Watanabe,
R. Nagaraja, S. Ebrahim, D. A. Lawlor, Y. Ben-Shlomo, G. Davey-Smith, A. R. Shuldiner, R. Collins,
R. N. Bergman, M. Uda, J. Tuomilehto, A. Cao, F. S. Collins, E. Lakatta, G. M. Lathrop, M. Boehnke,
D. Schlessinger, K. L. Mohlke, and G. R. Abecasis. 2008. Newly identified loci that influence lipid
concentrations and risk of coronary artery disease. Nat Genet 40: 161-169.
5. Kathiresan, S., O. Melander, C. Guiducci, A. Surti, N. P. Burtt, M. J. Rieder, G. M. Cooper, C. Roos,
B. F. Voight, A. S. Havulinna, B. Wahlstrand, T. Hedner, D. Corella, E. S. Tai, J. M. Ordovas, G.
Berglund, E. Vartiainen, P. Jousilahti, B. Hedblad, M. R. Taskinen, C. Newton-Cheh, V. Salomaa, L.
Peltonen, L. Groop, D. M. Altshuler, and M. Orho-Melander. 2008. Six new loci associated with
blood low-density lipoprotein cholesterol, high-density lipoprotein cholesterol or triglycerides in
humans. Nat Genet 40: 189-197.
6. Aulchenko, Y. S., S. Ripatti, I. Lindqvist, D. Boomsma, I. M. Heid, P. P. Pramstaller, B. W. Penninx,
A. C. Janssens, J. F. Wilson, T. Spector, N. G. Martin, N. L. Pedersen, K. O. Kyvik, J. Kaprio, A.
by guest, on March 28, 2018
ww
w.jlr.org
Dow
nloaded from
16
Hofman, N. B. Freimer, M. R. Jarvelin, U. Gyllensten, H. Campbell, I. Rudan, A. Johansson, F.
Marroni, C. Hayward, V. Vitart, I. Jonasson, C. Pattaro, A. Wright, N. Hastie, I. Pichler, A. A. Hicks,
M. Falchi, G. Willemsen, J. J. Hottenga, E. J. de Geus, G. W. Montgomery, J. Whitfield, P.
Magnusson, J. Saharinen, M. Perola, K. Silander, A. Isaacs, E. J. Sijbrands, A. G. Uitterlinden, J. C.
Witteman, B. A. Oostra, P. Elliott, A. Ruokonen, C. Sabatti, C. Gieger, T. Meitinger, F. Kronenberg,
A. Doring, H. E. Wichmann, J. H. Smit, M. I. McCarthy, C. M. van Duijn, and L. Peltonen. 2009.
Loci influencing lipid levels and coronary heart disease risk in 16 European population cohorts. Nat
Genet 41: 47-55.
7. Kathiresan, S., C. J. Willer, G. M. Peloso, S. Demissie, K. Musunuru, E. E. Schadt, L. Kaplan, D.
Bennett, Y. Li, T. Tanaka, B. F. Voight, L. L. Bonnycastle, A. U. Jackson, G. Crawford, A. Surti, C.
Guiducci, N. P. Burtt, S. Parish, R. Clarke, D. Zelenika, K. A. Kubalanza, M. A. Morken, L. J. Scott,
H. M. Stringham, P. Galan, A. J. Swift, J. Kuusisto, R. N. Bergman, J. Sundvall, M. Laakso, L.
Ferrucci, P. Scheet, S. Sanna, M. Uda, Q. Yang, K. L. Lunetta, J. Dupuis, P. I. de Bakker, C. J.
O'Donnell, J. C. Chambers, J. S. Kooner, S. Hercberg, P. Meneton, E. G. Lakatta, A. Scuteri, D.
Schlessinger, J. Tuomilehto, F. S. Collins, L. Groop, D. Altshuler, R. Collins, G. M. Lathrop, O.
Melander, V. Salomaa, L. Peltonen, M. Orho-Melander, J. M. Ordovas, M. Boehnke, G. R. Abecasis,
K. L. Mohlke, and L. A. Cupples. 2009. Common variants at 30 loci contribute to polygenic
dyslipidemia. Nat Genet 41: 56-65.
8. Teslovich, T. M., K. Musunuru, A. V. Smith, A. C. Edmondson, I. M. Stylianou, M. Koseki, J. P.
Pirruccello, S. Ripatti, D. I. Chasman, C. J. Willer, C. T. Johansen, S. W. Fouchier, A. Isaacs, G. M.
Peloso, M. Barbalic, S. L. Ricketts, J. C. Bis, Y. S. Aulchenko, G. Thorleifsson, M. F. Feitosa, J.
Chambers, M. Orho-Melander, O. Melander, T. Johnson, X. Li, X. Guo, M. Li, Y. Shin Cho, M. Jin
Go, Y. Jin Kim, J. Y. Lee, T. Park, K. Kim, X. Sim, R. Twee-Hee Ong, D. C. Croteau-Chonka, L. A.
Lange, J. D. Smith, K. Song, J. Hua Zhao, X. Yuan, J. Luan, C. Lamina, A. Ziegler, W. Zhang, R. Y.
Zee, A. F. Wright, J. C. Witteman, J. F. Wilson, G. Willemsen, H. E. Wichmann, J. B. Whitfield, D.
M. Waterworth, N. J. Wareham, G. Waeber, P. Vollenweider, B. F. Voight, V. Vitart, A. G.
by guest, on March 28, 2018
ww
w.jlr.org
Dow
nloaded from
17
Uitterlinden, M. Uda, J. Tuomilehto, J. R. Thompson, T. Tanaka, I. Surakka, H. M. Stringham, T. D.
Spector, N. Soranzo, J. H. Smit, J. Sinisalo, K. Silander, E. J. Sijbrands, A. Scuteri, J. Scott, D.
Schlessinger, S. Sanna, V. Salomaa, J. Saharinen, C. Sabatti, A. Ruokonen, I. Rudan, L. M. Rose, R.
Roberts, M. Rieder, B. M. Psaty, P. P. Pramstaller, I. Pichler, M. Perola, B. W. Penninx, N. L.
Pedersen, C. Pattaro, A. N. Parker, G. Pare, B. A. Oostra, C. J. O'Donnell, M. S. Nieminen, D. A.
Nickerson, G. W. Montgomery, T. Meitinger, R. McPherson, M. I. McCarthy, W. McArdle, D.
Masson, N. G. Martin, F. Marroni, M. Mangino, P. K. Magnusson, G. Lucas, R. Luben, R. J. Loos, M.
L. Lokki, G. Lettre, C. Langenberg, L. J. Launer, E. G. Lakatta, R. Laaksonen, K. O. Kyvik, F.
Kronenberg, I. R. Konig, K. T. Khaw, J. Kaprio, L. M. Kaplan, A. Johansson, M. R. Jarvelin, A. C.
Janssens, E. Ingelsson, W. Igl, G. Kees Hovingh, J. J. Hottenga, A. Hofman, A. A. Hicks, C.
Hengstenberg, I. M. Heid, C. Hayward, A. S. Havulinna, N. D. Hastie, T. B. Harris, T. Haritunians, A.
S. Hall, U. Gyllensten, C. Guiducci, L. C. Groop, E. Gonzalez, C. Gieger, N. B. Freimer, L. Ferrucci,
J. Erdmann, P. Elliott, K. G. Ejebe, A. Doring, A. F. Dominiczak, S. Demissie, P. Deloukas, E. J. de
Geus, U. de Faire, G. Crawford, F. S. Collins, Y. D. Chen, M. J. Caulfield, H. Campbell, N. P. Burtt,
L. L. Bonnycastle, D. I. Boomsma, S. M. Boekholdt, R. N. Bergman, I. Barroso, S. Bandinelli, C. M.
Ballantyne, T. L. Assimes, T. Quertermous, D. Altshuler, M. Seielstad, T. Y. Wong, E. S. Tai, A. B.
Feranil, C. W. Kuzawa, L. S. Adair, H. A. Taylor, Jr., I. B. Borecki, S. B. Gabriel, J. G. Wilson, H.
Holm, U. Thorsteinsdottir, V. Gudnason, R. M. Krauss, K. L. Mohlke, J. M. Ordovas, P. B. Munroe, J.
S. Kooner, A. R. Tall, R. A. Hegele, J. J. Kastelein, E. E. Schadt, J. I. Rotter, E. Boerwinkle, D. P.
Strachan, V. Mooser, K. Stefansson, M. P. Reilly, N. J. Samani, H. Schunkert, L. A. Cupples, M. S.
Sandhu, P. M. Ridker, D. J. Rader, C. M. van Duijn, L. Peltonen, G. R. Abecasis, M. Boehnke, and S.
Kathiresan. 2010. Biological, clinical and population relevance of 95 loci for blood lipids. Nature 466:
707-713.
9. Willer, C. J., E. M. Schmidt, and S. Senapati. 2013. Discovery and refinement of loci associated with
lipid levels. Submitted manuscript.
by guest, on March 28, 2018
ww
w.jlr.org
Dow
nloaded from
18
10. Keebler, M. E., R. C. Deo, A. Surti, D. Konieczkowski, C. Guiducci, N. Burtt, S. G. Buxbaum, D. F.
Sarpong, M. W. Steffes, J. G. Wilson, H. A. Taylor, and S. Kathiresan. 2010. Fine-mapping in
African Americans of 8 recently discovered genetic loci for plasma lipids: the Jackson Heart Study.
Circ Cardiovasc Genet 3: 358-364.
11. Kim, Y. J., M. J. Go, C. Hu, C. B. Hong, Y. K. Kim, J. Y. Lee, J. Y. Hwang, J. H. Oh, D. J. Kim, N.
H. Kim, S. Kim, E. J. Hong, J. H. Kim, H. Min, Y. Kim, R. Zhang, W. Jia, Y. Okada, A. Takahashi,
M. Kubo, T. Tanaka, N. Kamatani, K. Matsuda, T. Park, B. Oh, K. Kimm, D. Kang, C. Shin, N. H.
Cho, H. L. Kim, B. G. Han, and Y. S. Cho. 2011. Large-scale genome-wide association studies in
East Asians identify new genetic loci influencing metabolic traits. Nat Genet 43: 990-995.
12. Tan, A., J. Sun, N. Xia, X. Qin, Y. Hu, S. Zhang, S. Tao, Y. Gao, X. Yang, H. Zhang, S. T. Kim, T.
Peng, X. Lin, L. Li, L. Mo, Z. Liang, D. Shi, Z. Huang, X. Huang, M. Liu, Q. Ding, J. M. Trent, S. L.
Zheng, Z. Mo, and J. Xu. 2012. A genome-wide association and gene-environment interaction study
for serum triglycerides levels in a healthy Chinese male population. Hum Mol Genet 21: 1658-1664.
13. Sanna, S., B. Li, A. Mulas, C. Sidore, H. M. Kang, A. U. Jackson, M. G. Piras, G. Usala, G.
Maninchedda, A. Sassu, F. Serra, M. A. Palmas, W. H. Wood, 3rd, I. Njolstad, M. Laakso, K. Hveem,
J. Tuomilehto, T. A. Lakka, R. Rauramaa, M. Boehnke, F. Cucca, M. Uda, D. Schlessinger, R.
Nagaraja, and G. R. Abecasis. 2011. Fine mapping of five Loci associated with low-density
lipoprotein cholesterol detects variants that double the explained heritability. PLoS Genet 7:
e1002198.
14. Wu, Y., L. L. Waite, A. U. Jackson, W. H. Sheu, S. Buyske, D. Absher, D. K. Arnett, E. Boerwinkle,
L. L. Bonnycastle, C. L. Carty, I. Cheng, B. Cochran, D. C. Croteau-Chonka, L. Dumitrescu, C. B.
Eaton, N. Franceschini, X. Guo, B. E. Henderson, L. A. Hindorff, E. Kim, L. Kinnunen, P.
Komulainen, W. J. Lee, L. Le Marchand, Y. Lin, J. Lindstrom, O. Lingaas-Holmen, S. L. Mitchell, N.
Narisu, J. G. Robinson, F. Schumacher, A. Stancakova, J. Sundvall, Y. J. Sung, A. J. Swift, W. C.
Wang, L. Wilkens, T. Wilsgaard, A. M. Young, L. S. Adair, C. M. Ballantyne, P. Buzkova, A.
Chakravarti, F. S. Collins, D. Duggan, A. B. Feranil, L. T. Ho, Y. J. Hung, S. C. Hunt, K. Hveem, J.
by guest, on March 28, 2018
ww
w.jlr.org
Dow
nloaded from
19
M. Juang, A. Y. Kesaniemi, J. Kuusisto, M. Laakso, T. A. Lakka, I. T. Lee, M. F. Leppert, T. C.
Matise, L. Moilanen, I. Njolstad, U. Peters, T. Quertermous, R. Rauramaa, J. I. Rotter, J. Saramies, J.
Tuomilehto, M. Uusitupa, T. D. Wang, M. Boehnke, C. A. Haiman, Y. D. Chen, C. Kooperberg, T. L.
Assimes, D. C. Crawford, C. A. Hsiung, K. E. North, and K. L. Mohlke. 2013. Trans-ethnic fine-
mapping of lipid Loci identifies population-specific signals and allelic heterogeneity that increases
the trait variance explained. PLoS Genet 9: e1003379.
15. Dumitrescu, L., R. Goodloe, K. Brown-Gentry, P. Mayo, M. Allen, H. Jin, N. B. Gillani, N. Schnetz-
Boutaud, H. H. Dilks, and D. C. Crawford. 2012. Serum vitamins A and E as modifiers of lipid trait
genetics in the National Health and Nutrition Examination Surveys as part of the Population
Architecture using Genomics and Epidemiology (PAGE) study. Hum Genet 131: 1699-1708.
16. Andreasen, C. H., and G. Andersen. 2009. Gene-environment interactions and obesity--further
aspects of genomewide association studies. Nutrition 25: 998-1003.
17. Hellstrand, S., E. Sonestedt, U. Ericson, B. Gullberg, E. Wirfalt, B. Hedblad, and M. Orho-Melander.
2012. Intake levels of dietary long-chain PUFAs modify the association between genetic variation in
FADS and LDL-C. J Lipid Res 53: 1183-1189.
18. Junyent, M., K. L. Tucker, C. E. Smith, A. Garcia-Rios, J. Mattei, C. Q. Lai, L. D. Parnell, and J. M.
Ordovas. 2009. The effects of ABCG5/G8 polymorphisms on plasma HDL cholesterol concentrations
depend on smoking habit in the Boston Puerto Rican Health Study. J Lipid Res 50: 565-573.
19. Ahmad, T., D. I. Chasman, J. E. Buring, I. M. Lee, P. M. Ridker, and B. M. Everett. 2011. Physical
activity modifies the effect of LPL, LIPC, and CETP polymorphisms on HDL-C levels and the risk of
myocardial infarction in women of European ancestry. Circ Cardiovasc Genet 4: 74-80.
20. Surakka, I., A. Isaacs, L. C. Karssen, P. P. Laurila, R. P. Middelberg, E. Tikkanen, J. S. Ried, C.
Lamina, M. Mangino, W. Igl, J. J. Hottenga, V. Lagou, P. van der Harst, I. Mateo Leach, T. Esko, Z.
Kutalik, N. W. Wainwright, M. V. Struchalin, A. P. Sarin, A. J. Kangas, J. S. Viikari, M. Perola, T.
Rantanen, A. K. Petersen, P. Soininen, A. Johansson, N. Soranzo, A. C. Heath, T. Papamarkou, I.
Prokopenko, A. Tonjes, F. Kronenberg, A. Doring, F. Rivadeneira, G. W. Montgomery, J. B.
by guest, on March 28, 2018
ww
w.jlr.org
Dow
nloaded from
20
Whitfield, M. Kahonen, T. Lehtimaki, N. B. Freimer, G. Willemsen, E. J. de Geus, A. Palotie, M. S.
Sandhu, D. M. Waterworth, A. Metspalu, M. Stumvoll, A. G. Uitterlinden, A. Jula, G. Navis, C.
Wijmenga, B. H. Wolffenbuttel, M. R. Taskinen, M. Ala-Korpela, J. Kaprio, K. O. Kyvik, D. I.
Boomsma, N. L. Pedersen, U. Gyllensten, J. F. Wilson, I. Rudan, H. Campbell, P. P. Pramstaller, T.
D. Spector, J. C. Witteman, J. G. Eriksson, V. Salomaa, B. A. Oostra, O. T. Raitakari, H. E.
Wichmann, C. Gieger, M. R. Jarvelin, N. G. Martin, A. Hofman, M. I. McCarthy, L. Peltonen, C. M.
van Duijn, Y. S. Aulchenko, and S. Ripatti. 2011. A Genome-Wide Screen for Interactions Reveals a
New Locus on 4p15 Modifying the Effect of Waist-to-Hip Ratio on Total Cholesterol. PLoS Genet 7:
e1002333.
21. Deurenberg-Yap, M., S. K. Chew, and P. Deurenberg. 2002. Elevated body fat percentage and
cardiovascular risks at low body mass index levels among Singaporean Chinese, Malays and Indians.
Obes Rev 3: 209-215.
22. Adair, L. S. 2004. Dramatic rise in overweight and obesity in adult filipino women and risk of
hypertension. Obes Res 12: 1335-1341.
23. Huxley, R., W. P. James, F. Barzi, J. V. Patel, S. A. Lear, P. Suriyawongpaisal, E. Janus, I. Caterson,
P. Zimmet, D. Prabhakaran, S. Reddy, and M. Woodward. 2008. Ethnic comparisons of the cross-
sectional relationships between measures of body size with diabetes and hypertension. Obes Rev 9
Suppl 1: 53-61.
24. Kobayashi, J., J. Tashiro, S. Murano, N. Morisaki, and Y. Saito. 1998. Lipoprotein lipase mass and
activity in post-heparin plasma from subjects with intra-abdominal visceral fat accumulation. Clin
Endocrinol (Oxf) 48: 515-520.
25. Rodriguez-Lee, M., G. Bondjers, and G. Camejo. 2007. Fatty acid-induced atherogenic changes in
extracellular matrix proteoglycans. Curr Opin Lipidol 18: 546-553.
26. Adair, L. S., B. M. Popkin, J. S. Akin, D. K. Guilkey, S. Gultiano, J. Borja, L. Perez, C. W. Kuzawa,
T. McDade, and M. J. Hindin. 2011. Cohort profile: the Cebu longitudinal health and nutrition survey.
Int J Epidemiol 40: 619-625.
by guest, on March 28, 2018
ww
w.jlr.org
Dow
nloaded from
21
27. Carba, D. B., I. N. Bas, S. A. Gultiano, N. R. Lee, and L. S. Adair. 2013. Waist circumference and the
risk of hypertension and prediabetes among Filipino women. Eur J Nutr 52: 825-832.
28. Kuzawa, C. W., L. S. Adair, J. L. Avila, J. H. Cadungog, and N. A. Le. 2003. Atherogenic lipid
profiles in Filipino adolescents with low body mass index and low dietary fat intake. Am J Hum Biol
15: 688-696.
29. Lange, L. A., D. C. Croteau-Chonka, A. F. Marvelle, L. Qin, K. J. Gaulton, C. W. Kuzawa, T. W.
McDade, Y. Wang, Y. Li, S. Levy, J. B. Borja, E. M. Lange, L. S. Adair, and K. L. Mohlke. 2010.
Genome-wide association study of homocysteine levels in Filipinos provides evidence for CPS1 in
women and a stronger MTHFR effect in young adults. Hum Mol Genet 19: 2050-2058.
30. Voight, B. F., H. M. Kang, J. Ding, C. D. Palmer, C. Sidore, P. S. Chines, N. P. Burtt, C. Fuchsberger,
Y. Li, J. Erdmann, T. M. Frayling, I. M. Heid, A. U. Jackson, T. Johnson, T. O. Kilpelainen, C. M.
Lindgren, A. P. Morris, I. Prokopenko, J. C. Randall, R. Saxena, N. Soranzo, E. K. Speliotes, T. M.
Teslovich, E. Wheeler, J. Maguire, M. Parkin, S. Potter, N. W. Rayner, N. Robertson, K. Stirrups, W.
Winckler, S. Sanna, A. Mulas, R. Nagaraja, F. Cucca, I. Barroso, P. Deloukas, R. J. Loos, S.
Kathiresan, P. B. Munroe, C. Newton-Cheh, A. Pfeufer, N. J. Samani, H. Schunkert, J. N. Hirschhorn,
D. Altshuler, M. I. McCarthy, G. R. Abecasis, and M. Boehnke. 2012. The metabochip, a custom
genotyping array for genetic studies of metabolic, cardiovascular, and anthropometric traits. PLoS
Genet 8: e1002793.
31. Croteau-Chonka, D. C., Y. Wu, Y. Li, M. P. Fogarty, L. A. Lange, C. W. Kuzawa, T. W. McDade, J.
B. Borja, J. Luo, O. AbdelBaky, T. P. Combs, L. S. Adair, E. M. Lange, and K. L. Mohlke. 2012.
Population-specific coding variant underlies genome-wide association with adiponectin level. Hum
Mol Genet 21: 463-471.
32. Price, A. L., N. J. Patterson, R. M. Plenge, M. E. Weinblatt, N. A. Shadick, and D. Reich. 2006.
Principal components analysis corrects for stratification in genome-wide association studies. Nat
Genet 38: 904-909.
33. Adair, L. S. 2001. Size at birth predicts age at menarche. Pediatrics 107: E59.
by guest, on March 28, 2018
ww
w.jlr.org
Dow
nloaded from
22
34. The World Health Organization. 2008. Waist Circumference and Waist-hip ratio: Report of a WHO
Expert Consultation.
35. Shen, W., M. Punyanitya, J. Chen, D. Gallagher, J. Albu, X. Pi-Sunyer, C. E. Lewis, C. Grunfeld, S.
Heshka, and S. B. Heymsfield. 2006. Waist circumference correlates with metabolic syndrome
indicators better than percentage fat. Obesity (Silver Spring) 14: 727-736.
36. Stevens, J., E. G. Katz, and R. R. Huxley. 2010. Associations between gender, age and waist
circumference. Eur J Clin Nutr 64: 6-15.
37. Huang, Y. J., Y. L. Lin, C. I. Chiang, C. T. Yen, S. W. Lin, and J. T. Kao. 2012. Functional
importance of apolipoprotein A5 185G in the activation of lipoprotein lipase. Clin Chim Acta 413:
246-250.
38. Dorfmeister, B., W. W. Zeng, A. Dichlberger, S. K. Nilsson, F. G. Schaap, J. A. Hubacek, M. Merkel,
J. A. Cooper, A. Lookene, W. Putt, R. Whittall, P. J. Lee, L. Lins, N. Delsaux, M. Nierman, J. A.
Kuivenhoven, J. J. Kastelein, M. Vrablik, G. Olivecrona, W. J. Schneider, J. Heeren, S. E. Humphries,
and P. J. Talmud. 2008. Effects of six APOA5 variants, identified in patients with severe
hypertriglyceridemia, on in vitro lipoprotein lipase activity and receptor binding. Arterioscler Thromb
Vasc Biol 28: 1866-1871.
39. Kao, J. T., H. C. Wen, K. L. Chien, H. C. Hsu, and S. W. Lin. 2003. A novel genetic variant in the
apolipoprotein A5 gene is associated with hypertriglyceridemia. Hum Mol Genet 12: 2533-2539.
40. Yamada, Y., S. Ichihara, K. Kato, T. Yoshida, K. Yokoi, H. Matsuo, S. Watanabe, N. Metoki, H.
Yoshida, K. Satoh, Y. Aoyagi, A. Yasunaga, H. Park, M. Tanaka, W. Lee, and Y. Nozawa. 2008.
Genetic risk for metabolic syndrome: examination of candidate gene polymorphisms related to lipid
metabolism in Japanese people. J Med Genet 45: 22-28.
41. Vohl, M. C., B. Lamarche, S. Moorjani, D. Prud'homme, A. Nadeau, C. Bouchard, P. J. Lupien, and J.
P. Despres. 1995. The lipoprotein lipase HindIII polymorphism modulates plasma triglyceride levels
in visceral obesity. Arterioscler Thromb Vasc Biol 15: 714-720.
by guest, on March 28, 2018
ww
w.jlr.org
Dow
nloaded from
23
42. Senti, M., M. Bosch, C. Aubo, R. Elosua, R. Masia, and J. Marrugat. 2000. Relationship of abdominal
adiposity and dyslipemic status in women with a common mutation in the lipoprotein lipase gene.
The REGICOR investigators. Atherosclerosis 150: 135-141.
by guest, on March 28, 2018
ww
w.jlr.org
Dow
nloaded from
24
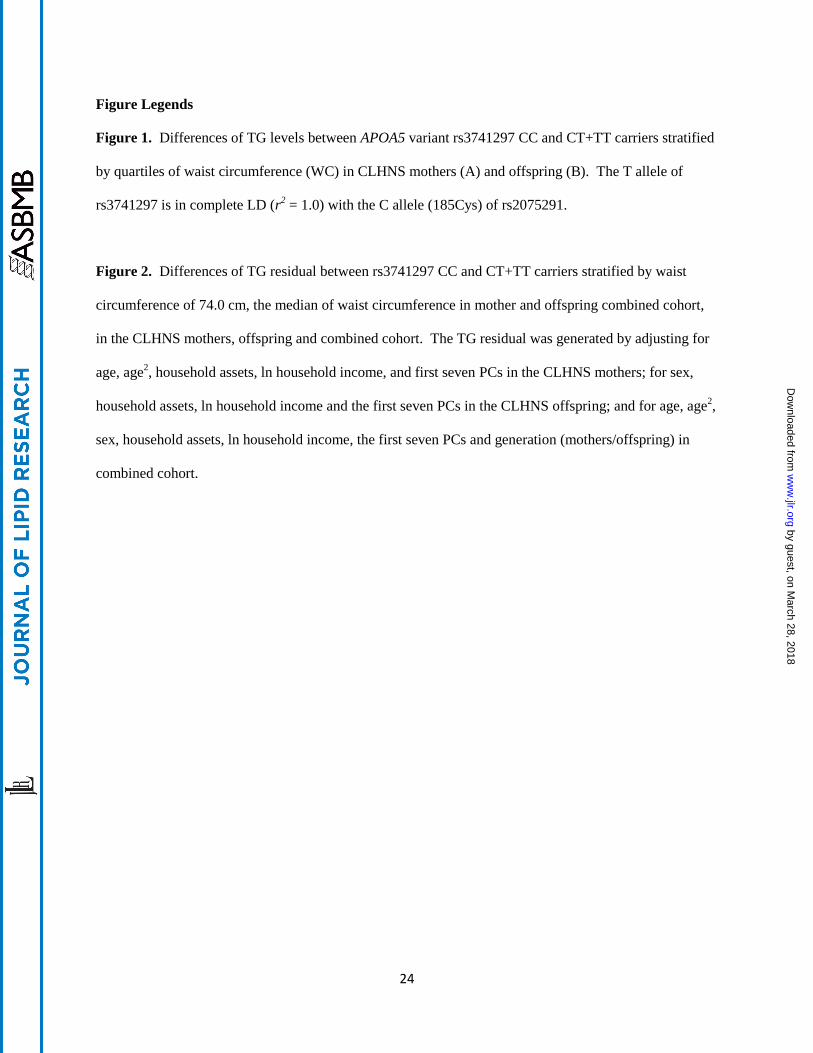
Figure Legends
Figure 1. Differences of TG levels between APOA5 variant rs3741297 CC and CT+TT carriers stratified
by quartiles of waist circumference (WC) in CLHNS mothers (A) and offspring (B). The T allele of
rs3741297 is in complete LD (r2 = 1.0) with the C allele (185Cys) of rs2075291.
Figure 2. Differences of TG residual between rs3741297 CC and CT+TT carriers stratified by waist
circumference of 74.0 cm, the median of waist circumference in mother and offspring combined cohort,
in the CLHNS mothers, offspring and combined cohort. The TG residual was generated by adjusting for
age, age2, household assets, ln household income, and first seven PCs in the CLHNS mothers; for sex,
household assets, ln household income and the first seven PCs in the CLHNS offspring; and for age, age2,
sex, household assets, ln household income, the first seven PCs and generation (mothers/offspring) in
combined cohort.
by guest, on March 28, 2018
ww
w.jlr.org
Dow
nloaded from
25
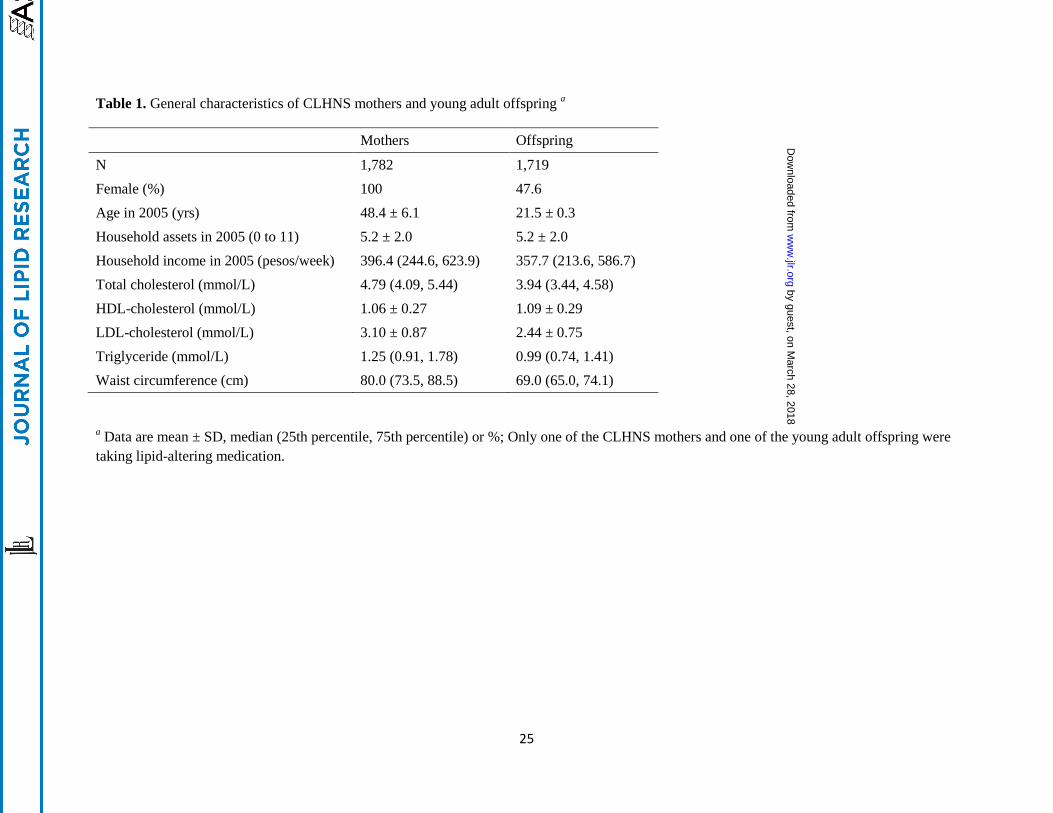
Table 1. General characteristics of CLHNS mothers and young adult offspring a
Mothers Offspring
N 1,782 1,719
Female (%) 100 47.6
Age in 2005 (yrs) 48.4 ± 6.1 21.5 ± 0.3
Household assets in 2005 (0 to 11) 5.2 ± 2.0 5.2 ± 2.0
Household income in 2005 (pesos/week) 396.4 (244.6, 623.9) 357.7 (213.6, 586.7)
Total cholesterol (mmol/L) 4.79 (4.09, 5.44) 3.94 (3.44, 4.58)
HDL-cholesterol (mmol/L) 1.06 ± 0.27 1.09 ± 0.29
LDL-cholesterol (mmol/L) 3.10 ± 0.87 2.44 ± 0.75
Triglyceride (mmol/L) 1.25 (0.91, 1.78) 0.99 (0.74, 1.41)
Waist circumference (cm) 80.0 (73.5, 88.5) 69.0 (65.0, 74.1)
a Data are mean ± SD, median (25th percentile, 75th percentile) or %; Only one of the CLHNS mothers and one of the young adult offspring were
taking lipid-altering medication.
by guest, on March 28, 2018
ww
w.jlr.org
Dow
nloaded from
26
Table 2. Loci associated with levels of lipoprotein cholesterol and triglycerides in the CLHNS a
Locus SNP Trait
Effect
allele
Other
allele
Mothers (n = 1,782) b Offspring (n = 1,719)
c Combined
d
EAF e β (SE) P EAF
e β (SE) P β (SE) P
APOE rs7412 LDL-C T C 0.12 -0.48 (0.04) 1.6E-27 0.11 -0.49 (0.04) 1.0E-35 -0.48 (0.03) 2.7E-53
APOE rs7412 TC T C 0.12 -0.08 (0.01) 1.8E-14 0.11 -0.11 (0.01) 1.7E-20 -0.09 (0.01) 1.5E-30
APOA5 rs662799 TG A G 0.76 -0.18 (0.02) 3.1E-18 0.73 -0.12 (0.02) 2.6E-10 -0.14 (0.01) 5.7E-24
GCKR rs780092 TG A G 0.68 0.09 (0.02) 1.6E-07 0.69 0.06 (0.02) 3.5E-04 0.08 (0.01) 1.8E-09
CETP rs1800775 HDL-C A C 0.40 0.05 (0.01) 6.3E-07 0.43 0.04 (0.01) 1.7E-04 0.04 (0.01) 3.4E-09
TOM1 rs138777 HDL-C G A 0.59 0.05 (0.01) 5.0E-07 0.61 0.02 (0.01) 0.058 0.03 (0.01) 4.0E-05
a Results are shown if P < 10
-6 in the CLHNS mothers.
b Associations in the CLHNS mothers were adjusted for age, age
2, household assets, ln household income and the first seven principal components
of population substructure (PCs).
c Associations in the CLHNS offspring were adjusted for sex, household assets, ln household income and the first seven PCs.
d The mixed model analysis of combined samples was adjusted for age, age
2, sex, household assets, ln household income, the first seven PCs and
generation (mothers/offspring).
e EAF: effect allele frequency.
by guest, on March 28, 2018
ww
w.jlr.org
Dow
nloaded from
27
Table 3. Additional previously reported SNPs that exhibited evidence of association with lipoprotein cholesterol and triglycerides in the CLHNS a
Locus Trait
SNP reported
previously b
SNP
analyzed in
CLHNS
LD r2 c
Mothers (n = 1,782)
Offspring (n = 1,719)
Combined
EAF β (SE) P
EAF β (SE) P
β (SE) P
LPL TG rs12678919 rs328 0.99 0.95 0.11 (0.04) 7.9E-03
0.95 0.07 (0.04) 0.10
0.09 (0.03) 1.6E-03
MLXIPL TG rs17145738 rs17145738 1.00 0.10 -0.05 (0.03) 0.077
0.10 -0.06 (0.03) 0.040
-0.06 (0.02) 4.2E-03
ANGPTL3 TG rs2131925 rs2131925 1.00 0.71 0.04 (0.02) 0.036
0.69 0.04 (0.02) 0.034
0.04 (0.01) 5.1E-03
LIPC HDL-C rs2070895 rs588136 0.87 0.69 -0.05 (0.01) 5.1E-06
0.63 -0.06 (0.01) 1.1E-09
-0.05 (0.01) 1.5E-12
LIPG HDL-C rs7241918 rs2156552 0.94 0.14 -0.02 (0.01) 0.075
0.15 -0.03 (0.01) 0.031
-0.03 (0.01) 4.6E-03
MMAB-MVK HDL-C rs2338104 rs10774708 1.00 0.62 -0.02 (0.01) 0.076
0.61 -0.03 (0.01) 3.6E-03
-0.02 (0.01) 0.011
ABO LDL-C rs9411489 rs2519093 0.95 0.85 -0.10 (0.05) 0.033
0.83 -0.13 (0.03) 1.6E-04
-0.12 (0.03) 3.0E-05
APOB LDL-C rs1367117 rs1367117 1.00 0.88 -0.09 (0.05) 0.047
0.87 -0.09 (0.04) 0.023
-0.08 (0.03) 7.4E-03
TIMD4 TC rs6882076 rs6882076 1.00 0.65 0.01 (0.01) 0.060
0.65 0.02 (0.01) 0.035
0.02 (0.01) 4.0E-03
DNAH11 TC rs12670798 rs5008148 0.94 0.55 0.02 (0.01) 0.072
0.58 0.01 (0.01) 0.052
0.02 (0.01) 0.012
a Results are shown if P < 0.1 in both CLHNS mothers and offspring with a consistent direction of effect.
b SNPs were previously reported in (8), except MMAB-MVK rs2338104, reported in (7).
c Linkage disequilibrium (LD) r
2 between the SNP pairs was estimated based on the 1000 Genomes Project Phase I EUR data (2010 November
release).
by guest, on March 28, 2018
ww
w.jlr.org
Dow
nloaded from
28
Table 4. Lipid loci showing evidence of two signals in the CLHNS a
Locus Trait SNP Mothers (n = 1,782)
Offspring (n = 1,719)
Combined
EAF Pinitial b Pconditional
c
EAF Pinitial
b Pconditional
c
Pinitial
b Pconditional
c LD (D'/r
2)
d
APOA5 TG rs662799 0.76 3.1E-18 2.5E-15
0.73 2.6E-10 7.7E-07
5.7E-24 1.1E-17 1.00/0.09
rs3741297 0.98 3.1E-06 7.4E-03
0.97 3.5E-08 1.1E-04
3.2E-12 1.1E-05
CETP HDL-C rs1800775 0.40 6.3E-07 1.1E-04
0.43 1.7E-04 0.013
3.4E-09 1.2E-05 0.64/0.06
rs7499892 0.84 1.9E-06 3.1E-04
0.84 4.1E-09 2.4E-07
3.5E-12 1.1E-08
LIPC HDL-C rs588136 0.69 5.1E-06 1.0E-04
0.63 1.1E-09 2.0E-07
1.5E-12 1.6E-09 0.34/0.06
rs1532085 0.43 2.6E-04 6.1E-03
0.46 4.1E-05 6.0E-03
5.8E-07 4.5E-04
APOE LDL-C rs7412 0.12 1.6E-27 5.9E-28
0.11 1.0E-35 2.6E-33
2.7E-53 5.4E-52 1.00/0.01
rs769449 0.91 0.032 0.015
0.91 1.5E-08 4.4E-06
5.0E-07 1.5E-05
a Results are shown for SNPs with Pinitial < 10
-6 in the CLHNS mother and offspring combined cohort.
b Pinitial: P values for main effect association.
c Pconditional: P values produced by reciprocal conditional analyses, in which both the primary and secondary signals were included in the model.
d Linkage disequilibrium (LD) (D'/r
2) between the secondary and primary signals (shown in Table 2 and 3) was estimated based on Metabochip
genotypes in the 1,719 CLHNS offspring.
by guest, on March 28, 2018
ww
w.jlr.org
Dow
nloaded from


![Body mass index, abdominal fatness, weight gain and the ... · [51], however, it is unclear whether waist circumference or waist-to-hip ratio is more strongly associated with psoriasis](https://img.pdfslide.us/doc/110x75/5e70519171e1233f161859ba/body-mass-index-abdominal-fatness-weight-gain-and-the-51-however-it-is.jpg)