Embed Size (px)
Citation preview
General Report on the Health and Social Care Sector2012-13 and 2013-14
REPORT BY THE COMPTROLLER AND AUDITOR GENERAL 26 May 2015

General Report on the Health and Social Care Sector 2012-13 and 2013-14
General Report on the Health and Social Care Sector 2012-13 and 2013-14
Published 26 May 2015

General Report on the Health and Social Care Sector 2012-13 and 2013-14

General Report on the Health and Social Care Sector 2012-13 and 2013-14
This report has been prepared under Article 8 of the Audit (Northern Ireland) Order 1987 for presentation to the Northern Ireland Assembly in accordance with Article 11 of the Order.
K J Donnelly Northern Ireland Audit Office
Comptroller and Auditor General 26 May 2015
The Comptroller and Auditor General is the head of the Northern Ireland Audit Office employing some 140 staff. He, and the Northern Ireland Audit Office are totally independent of Government. He certifies the accounts of all Government Departments and a wide range of other public sector bodies; and he has statutory authority to report to the Assembly on the economy, efficiency and effectiveness with which departments and other bodies have used their resources.
For further information about the Northern Ireland Audit Office please contact:
Northern Ireland Audit Office 106 University Street BELFAST BT7 1EU
Tel: 028 9025 1100 email: [email protected] website: www.niauditoffice.gov.uk
© Northern Ireland Audit Office 2015

General Report on the Health and Social Care Sector 2012-13 and 2013-14
General Report on the Health and Social Care Sector 2012-13 and 2013-14
Contents
Part One: Introduction 1
Part Two: Financial performance and governance 5
Part Three: Operational Performance – Access to Hospital Care 15
Part Four: Counter Fraud and Probity Services 21
Part Five: Procurement 31
Part Six: Tackling Health Inequalities 39
Part Seven: Recovering income from private and paying patients treated on Health and Social Care premises in Northern Ireland 45
Part Eight: Transforming Your Care 55
Part Nine: Serious Adverse Incidents and Clinical Negligence 61
Part Ten: The administration and safeguarding of clients’ and residents’ monies 69
Part Eleven: HSC Business Services Transformation Project 73
NIAO Reports 2014-2015 78
General Report on the Health and Social Care Sector 2012-13 and 2013-14
Abbreviations
AMU Acute Medical Unit
APSS Accounts Payable Shared Services
AS Audit Scotland
BIS Department for Business, Innovation & Skills
BSO Business Services Organisation
BSTP Business Services Transformation Project
CTF Charitable Trust Funds
CFPS Counter Fraud and Probity Services
DAC Direct Award Contract
DHSSPS Department of Health, Social Services and Public Safety
ENT Ear, Nose and Throat
EU European Union
FPL Finance, Procurement and Logistics
GP General Practitioner
HSC Health and Social Care
HRPTS Human Resources, Payroll, Travel and Subsistence
IA Internal Audit
ICM Institute of Credit Management
NDPB Non-Departmental Public Body
NFI National Fraud Initiative
NAO National Audit Office
NIA Northern Ireland Assembly
NIAO Northern Ireland Audit Office
NIBTS Northern Ireland Blood Transfusion Service
NIMDTA Northern Ireland Medical and Dental Training Agency

General Report on the Health and Social Care Sector 2012-13 and 2013-14
NIPEC Northern Ireland Practice and Education Council
NISCC Northern Ireland Social Care Council
PSNI Police Service of Northern Ireland
PHA Public Health Agency
PAYSS Payroll and Travel Expenses Shared Service
R&S SSC Recruitment and Selection Shared Services Centre
REFRAIN Regional Fraud Reporting System
RQIA Regulation and Quality Improvement Authority
RVH Royal Victoria Hospital
SSAR Accounts Receivables Shared Services
T&O Trauma and Orthopaedic
TYC Transforming Your Care
UTP Undertaking to Pay
WHO World Health Organisation
WAO Wales Audit Office

General Report on the Health and Social Care Sector 2012-13 and 2013-14
List of Figures
Figure 1.1 HSC bodies covered by this report
Figure 2.1 2013-14 HSC Trust Surpluses/ Deficits (£’000’s)
Figure 2.2 30 Day Prompt payment compliance (number of invoices) by larger HSC bodies
Figure 2.3 30 Day Prompt payment compliance (number of invoices) by HSC bodies
Figure 2.4 Ten Day Prompt payment compliance (number of invoices) by HSC bodies
Figure 2.5 Charitable Trust Funds balances at 31 March (2008 to 2014)
Figure 3.1 Selected hospital waiting time targets (2012-13 and 2013-14)
Figure 3.2Percentage of patients seen within 14 days following an urgent referral for suspect breast cancer over the period January 2014 to March 2014
Figure 4.1Source and Classification of Actual/Suspected Fraud Cases Referred to the CFPS unit during 2012-13 and 2013-14
Figure 4.2The CFPS unit Probity Activity and Recovery Levels (over the four year period to 31 March 2014)
Figure 4.3 The CFPS unit Patient Exemption Verification Activity and Identified Overpayments
Figure 5.1 Number and Value of Direct Award Contracts 2012-13 and 2013-14
Figure 7.1Consultants registered with HSC Trusts to undertake private practice in addition to their public work
Figure 7.2 Private HSC Trust patient episodes by type (2013-14)
Figure 7.3 Overall HSC Trust patient revenue due 2007-08 to 2013-14
Figure 7.4 Patient revenue by HSC Trust 2007-14 (£’000)
Figure 7.5Average number of days taken following patient discharge to recover private practice income for sample cases
Figure 7.6 Private practice and paying patient income outstanding at 31 March 2014 (£)
Figure 8.1 TYC anticipated transitional funding

General Report on the Health and Social Care Sector 2012-13 and 2013-14
Figure 8.2 Actual funding provided for the TYC initiative to date
Figure 9.1 SAIs reported by HSC bodies in the two year period to 31 March 2014
Figure 9.2The volume and cost of settling clinical and social care negligence claims over the five year period to March 2014
Figure 9.3 Estimated clinical and social care negligence liability at 31 March 2014


Part One:Introduction

2 General Report on the Health and Social Care Sector 2012-13 and 2013-14
Part One:Introduction
1 Safer Births: Using Information to Improve Quality (29 April 2014)
2 Primary Care Prescribing (27 November 2014)
The Scope of this Report
1.1 This report provides information on the main issues arising from my audits of 16 health and social care bodies as follows:
• six HSC Trusts;
• the HSC Board;
• three special agencies;
• three special health bodies; and
• three non-departmental public bodies (the NDPBs).
This report does not include information on the findings from the audit of the accounts of the Department of Health, Social Services and Public Safety (the Department) or the Northern Ireland (NI) Fire and Rescue Service since these are included in a General Report I prepared on central government. I reported on the NI Fire and Rescue Service in 2011. The Committee of Public Accounts examined the area and reported on 25 September 2013.
1.2 Figure 1.1 opposite lists the bodies covered by this report and provides information on the gross expenditure of each body in each of the three years to 2013-14.
1.3 Since the last General Report on the HSC Sector, I have published two HSC sector value for money reports. The first report, Safer Births: Using Information to Improve Quality1 was published in April 2014 and highlighted a methodology
1 1
for comparing birthing outcomes. The second, Primary Care Prescribing2, was published in November 2014 and reviewed the potential for generating financial savings without impacting on the quality of care, by altering prescribing patterns.
Key Report Observations
1.4 Health and social care services here are facing an unprecedented financial challenge to manage within limited resources. Increasing demand for health and social care means that pressures on resources will grow as the costs of treatment rise, public expectations increase and the population continues to age.
1.5 My report shows that four HSC Trusts recorded deficits for 2013-14 totalling £14 million (against a total Departmental budget of £4.6 billion). In recent years, the HSC Trusts have needed substantial additional financial support to respond effectively to growing financial pressures. As continued reliance on additional funding is unrealistic, sustainable solutions to the increasing financial pressures must be found.
1.6 I note that there have been vacancies in the leadership teams of two HSC Trusts:
• In the Belfast HSC Trust, an offer of appointment was turned down by a successful candidate in August 2014. Currently, the Department’s
1 2

General Report on the Health and Social Care Sector 2012-13 and 2013-14 3
Chief Medical Officer is acting as Chief Executive in an interim capacity. It is unlikely that the position will be permanently filled until later in 2015; and
• Following a series of crises, the Chief Executive of the Northern HSC Trust
Figure 1.1: HSC bodies covered by this report
HSC Body Gross Expenditure2011-12£ million
2012-13£ million
2013-14£ million
HSC Trusts Belfast HSC TrustNorthern HSC TrustSouth Eastern HSC Trust Southern HSC Trust Western HSC TrustNI Ambulance Service HSC Trust
1,218627546544521
62
1,302651562570605
64
1,269646566574568
68SUB TOTAL 3,518 3,754 3,691
CommissioningBody
NI HSC Board 969 963 942
SUB TOTAL 969 963 942Special Agencies NI Medical and Dental Training Agency
NI Blood Transfusion ServiceNI Guardian Ad Litem Agency
53244
54224
55224
SUB TOTAL 81 80 81Special HealthBodies
Business Services OrganisationPublic Health AgencyPatient and Client Council
122512
129532
135632
SUB TOTAL 175 184 200Non-DepartmentalPublic Bodies
Regulation and Quality Improvement Author-ityNI Social Care CouncilNI Practice and Education Council
SUB TOTAL
731
11
742
13
841
13
TOTAL 4,754 4,994 4,927
Source: HSC 2011-12; 2012-13; and 2013-14 Accounts
stepped aside to be replaced by a Turnaround Team in August 2013. Following the work of this Team, the Medical Director at the Belfast HSC Trust was appointed as Chief Executive of the Northern HSC Trust in May 2014.


Part Two:Financial performance and governance

6 General Report on the Health and Social Care Sector 2012-13 and 2013-14
Part Two:Financial performance and governance
3 Article 15 (1) The Health and Personal Social Services (Northern Ireland) Order 1991
4 The Public Health Agency (PHA), the Northern Ireland Medical and Dental Training Agency (NIMDTA) and the Northern Ireland Blood Transfusion Service (NIBTS) recorded surpluses in excess of the breakeven threshold in 2012-13.
Key Points:
• In 2013-14, 12 out of 16 HSC bodies achieved breakeven – four HSC Trusts (the Northern, South Eastern, Southern and Western HSC Trusts) failed to achieve breakeven;
• Accounting deficits in 2013-14 totalled almost £14 million. As in other years, HSC Trusts relied on additional funding, including allocations from in-year monitoring rounds and managed slippage/deferral of expenditure, in order to try and make up the deficit position. This has led to Trusts carrying forward an underlying/ “real” deficit of £115 million into 2014-15;
• It seems likely that the HSC sector will face increasing financial pressure against an increase in demand for services. However, we acknowledge that the Department has been sending out a strong message to all health bodies, including the HSC Trusts, that, in future, not meeting financial targets will be unacceptable; and
• The performance of HSC bodies against prompt payment targets lags considerably behind that of Northern Ireland Civil Service (NICS) bodies. In 2012-13, five out of 16 HSC bodies met the prompt payment target. Performance deteriorated in 2013-14 when none of the HSC bodies met the prompt payment target. The Department has pointed out to me that the NICS had the advantage of using a system which was implemented several years ago.
Financial performance in the 2012-13 and 2013-14 financial years
2.1 This section of my report considers the performance of HSC bodies against financial targets. In addition, some consideration is given to HSC Trust management of Charitable Trust Funds (CTFs).
2.2 The Department requires HSC bodies to meet financial targets each year and to disclose their achievement in their annual reports. All HSC bodies are required to conform to the general requirement of good financial management. Additionally, HSC bodies are required by statute3 to ensure that their income is sufficient to meet their expenditure, taking
3
one year with another, to achieve “break even”. An organisation is considered to have met the breakeven target if:
“its Net Resource Outturn is contained within +/-0.25 per cent of its agreed Revenue Resource Limit or £20,000, whichever is greater.”
2012-13 financial performance
2.3 In 2012-13, the HSC faced financial pressure against a growing demand for services. In that year, no HSC sector bodies recorded a deficit. The majority of HSC sector bodies achieved break-even (13). Three HSC sector bodies4
recorded surpluses in excess of the breakeven threshold.
3

General Report on the Health and Social Care Sector 2012-13 and 2013-14 7
2013-14 financial performance
2.4 In 2013-14 the Department reported that £139 million savings had been delivered across the HSC sector5. At the start of the financial year, the forecast deficit for the HSC Trusts stood at £7 million. As the year progressed, forecasts rose, first to £30 million and then to £62 million. Various measures were taken throughout the year to address the financial pressures. The Department worked closely with all parts of the HSC system to secure further opportunities to close the funding gap. Individual HSC Trusts were tasked with developing contingency plan proposals. All aspects of the Department’s budget were examined, pressure was put on all budgets, budget reductions were imposed across Arm’s Length Bodies and the potential for service slippage without impacting on patient and client care was considered. Bids for additional funding were made to DFP through in-year monitoring rounds. By 31 March 2014 actual deficits totalled almost £14 million.
2.5 In 2013-14, 12 of the 16 HSC bodies met the breakeven target. HSC Trusts can receive extra funding in-year (from the Executive, Department or HSC Board) to help them manage services at a time of financial pressure. As a result of the re-allocation of additional resources to help it maintain services, the Belfast HSC Trust achieved the breakeven target. However, four of the HSC Trusts (the Northern, South Eastern, Southern and Western HSC Trust) did not achieve breakeven. Going forward,
it is clear that HSC Trusts can no longer anticipate that they will receive additional in-year funding to cover their deficits.
2.6 The outturn of the five non-regional HSC Trusts in 2013-14 is shown in Figure 2.1 (overleaf).
The HSC sector is likely to face further funding constraints in future but can also expect to see a rise in demand for services
2.7 The two years covered in this report have been a period of unprecedented, financial and organisational change and, despite a degree of protection afforded to the health and social care budget, the data presented above demonstrates that the financial health of HSC bodies is weak and declining. Increasingly they have found it harder to balance their budgets in the face of rising inflationary cost pressures, demographic pressures from an increasing and ageing population and the pressures associated with new treatments and patient expectations while at the same time delivering a challenging programme of efficiency savings.
2.8 In 2013-14, four of the five non-regional HSC Trusts had financial deficits. At the start of the 2014-15 financial year, the Department estimated that £160 million would be needed to enable the HSC sector to breakeven. The Department told us that the pressures have been largely addressed through:
5 The Department estimates that, by 31 March 2014, it and its ALBs will have delivered savings totalling £490 million (covering the three year period since 1 April 2011). Over the four year period of the Budget 2010, the Department estimates that delivered savings will amount to £660 million.

8 General Report on the Health and Social Care Sector 2012-13 and 2013-14
Part Two:Financial performance and governance
• Receipt of an additional £80 million through the June and October monitoring rounds;
• The success of a range of measures to control expenditure; and
• The application of HSC Trust contingency plans.
The HSC Board and HSC Trusts are continuing to review costs across all areas of HSC activity in order to achieve financial breakeven.
-5
-4
-3
-2
-1
0
1
WHSCTSHSCTSEHSCTNHSCTBHSCT
Surp
lus/
Def
icit
£ m
illio
n
Figure 2.1: HSC Trust Surpluses or Deficits, 2013-14, £’000s
Source: HSC Trust accounts 2013-14
2.9 Prior to 2013-14, the Department and the HSC Board worked to keep HSC Trust expenditure within a “control total” through in-year monitoring allocations and deferred expenditure. While additional funding allocations have helped HSC bodies achieve financial balance over recent years, they masked, rather than addressed, the underlying financial pressures. As a result, of the £160 million of additional resources required in 2014-15, £115 million represents a carry-forward of 2013-14 pressures.

General Report on the Health and Social Care Sector 2012-13 and 2013-14 9
2.10 Pressures on the health and social care sector are likely to continue and to outpace funding. In view of this, we acknowledge that the Department has been sending out a strong message to all health bodies, including the HSC Trusts, that, in future, not meeting financial targets will be unacceptable.
2.11 The growing sense of realism about the funding gap demonstrated in the actions of the Department is an improvement on previous years when HSC Trusts had produced ‘balanced budgets’ that masked underlying financial problems. During 2014-15 and beyond, the health and social care services faced increasingly difficult choices about how to spend available money - making best use of that money is paramount. It is crucial therefore, that the Department continues to maintain a tight financial grip on operations and ensures, as far as possible, that HSC bodies live within their means. Sharing good practice in areas like cost reduction and making better use of benchmarking data are some ways in which HSC bodies have sought to bring about improvement and generate efficiencies. It is interesting to note that in Scotland and Wales there has been a move away from annual financial resource limits: Welsh NHS bodies now work to 3-year ‘planning and financial duty frameworks’; while in Scotland the move has been more limited and involves allowing some flexibility to carry over funds. The Department has told me that such a measure could not be introduced in
Northern Ireland since Departments do not have authority to manage their financial positions across year end.
Compliance with prompt payment targets poses a challenge for HSC bodies
2.12 HSC bodies are required to pay their invoices promptly6. They monitor their performance and report it publicly in their annual reports each year.
HSC bodies are required to pay 95 per cent of invoices within 30 calendar days
2.13 Legislatively, since 20137, HSC bodies are required to regard payment of an invoice as late unless it is made within 30 days after receipt of an undisputed invoice. Each HSC body has a target to pay a minimum of 95 per cent of invoices within 30 calendar days of receipt of an undisputed invoice.
Five out of 16 HSC bodies met the prompt payment target in 2012-13
2.14 By September 2013, the new financial system (the Finance, Procurement and Logistics (FPL) system) was in place across all HSC bodies. In a previous report8 I noted the Department’s assurance that the new FPL system would be capable of making payments in
3 7
3 8
6 The Department requires that all HSC bodies pay their non-HSC trade creditors in accordance with the Prompt Payment Code set up in 2008 by the Institute of Credit Management (ICM) as requested by the Department for Business, Innovation & Skills (BIS). They are also required to disclose annually the extent to which they comply with these requirements.
7 Late Payment of Commercial Debts Regulations 2013.
8 Financial Auditing and Reporting: General Report by the Comptroller and Auditor General for Northern Ireland (5 November 2013)

Part Two:Financial performance and governance
10 General Report on the Health and Social Care Sector 2012-13 and 2013-14
Part Two:Financial performance and governance
2012-13 Target(95 per cent)
78
80
82
84
86
88
90
92
94
96
98
100
BSOHSCBNIASWHSCTSHSCTSEHSCTNHSCTBHSCT
Perc
enta
ges
of In
voic
es P
aid
2011-12 2012-13
2011-12 Target(90 per cent)
Figure 2.2: 30 Day Prompt payment compliance (by number of invoices)
Source: HSC accounts 2011-12 and 2012-13
line with government prompt payment targets.
2.15 Following the introduction of the new system prompt payment performance fell and only five (out of 16 HSC bodies) achieved the 95 per cent best practice target (by number of bills paid) in 2012-13. I asked the Department when it expects to see improvements in prompt payment performance. The Department told me that the situation has improved in the latter part of 2014-15 as the new Shared Services Centre has become fully operational.
2.16 None of the larger HSC bodies9 paid the target number of invoices within the timescale. Four met the target by value of invoices paid in 2012-13.
2.17 In 2011-12, all of the larger HSC bodies achieved at least 90 per cent. In 2012-13, only six of the eight larger HSC bodies achieved 90 cent (by number of invoices) or four (by value of invoices). Figure 2.2 illustrates achievement against target in 2011-12 and 2012-13.
3 9
9 The term “larger HSC bodies” includes the six HSC Trusts, the HSC Board and Business Services Organisation

General Report on the Health and Social Care Sector 2012-13 and 2013-14 11
2013-14 Target(95 per cent)
78
80
82
84
86
88
90
92
94
96
98
100
NIPEC
NISCC
RQIA
PCC
PHA
BSO
NIGALA
NIBTS
NIMDTA
*
HSCB
NIAS
WHSC
TSH
SCT
SEHSC
T
NHSCT
BHSC
T
Perc
enta
ges
of In
voic
es P
aid
2011-12 2012-13 2013-14
2012-13 Target(90 per cent)
2011-12 Target(90 per cent)
Figure 2.3: 30 Day Prompt payment compliance (by number of invoices)
Source: HSC accounts 2011-12 to 2013-14 (*NIMDTA figures not available)
Only one out of 16 HSC bodies met the prompt payment target in 2013-14
2.18 Figure 2.3 compares performance in all HSC bodies against prompt payment targets over the period 2011-12 to 2013-14. In 2013-14, no HSC body met the 95 per cent standard measured by the number of invoices and only one (NI Blood Transfusion Service) met it by value. Only two HSC bodies (the Western HSC Trust and the NI Patient and Client Council) managed to get performance above even 90 per cent by
number of invoices paid. Nine bodies managed to achieve more than 90 per cent by value. This is a disappointing outcome.
Compliance with the 10 day administrative prompt payment target has improved
2.19 In 2008, the Department of Finance and Personnel introduced an additional target for Central Government Departments, Agencies and Non-Departmental Public

12 General Report on the Health and Social Care Sector 2012-13 and 2013-14
Part Two:Financial performance and governance
Bodies (NDPBs) to pay suppliers, where possible, within 10 working days of receiving a valid invoice. Performance for the HSC bodies is set out in Figure 2.4.
2.20 On the whole, the ten day compliance rate across HSC Trusts has increased from 46 per cent in 2011-12 to 57 per cent in 2013-14. In 2012-13, across the five non-regional HSC Trusts, compliance ranged from 63.7per cent by number of bills paid at the Western HSC Trust to 39 per cent at the Belfast
0
10
20
30
40
50
60
70
80
NIPEC*
NISCC*
RQIA
*PC
C*PH
A*BS
O*
NIGALA
*
NIBTS*
NIMDTA
**
HSCB*
NIAS
WHSC
T
SHSC
T
SEHSC
T
NHSCT
BHSC
T
Perc
enta
ges
of In
voic
es P
aid
with
in 1
0 da
ys
2011-12 2012-13 2013-14
Figure 2.4: Ten Day Prompt payment compliance (number of invoices)
**NIMDTA accounts 2013-14 not signed – figures not availableSource: HSC accounts 2011-12 to 2013-14 (*No data for 2011-12)
HSC Trust. At the NI Ambulance Service Trust the figure fell to 23.6 per cent. In 2013-14, performance at the Belfast HSC Trust had improved to 62.3 per cent but the NI Ambulance Service Trust remained at the bottom end, at 27.7 per cent.
2.21 The prompt payment performance across the HSC sector is considerably less than that in the NI Civil Service. This is an area that we will continue to keep under review and upon which we will report in future years.
General Report on the Health and Social Care Sector 2012-13 and 2013-14 13
Balances held in HSC Charitable Trust Funds are increasing over time
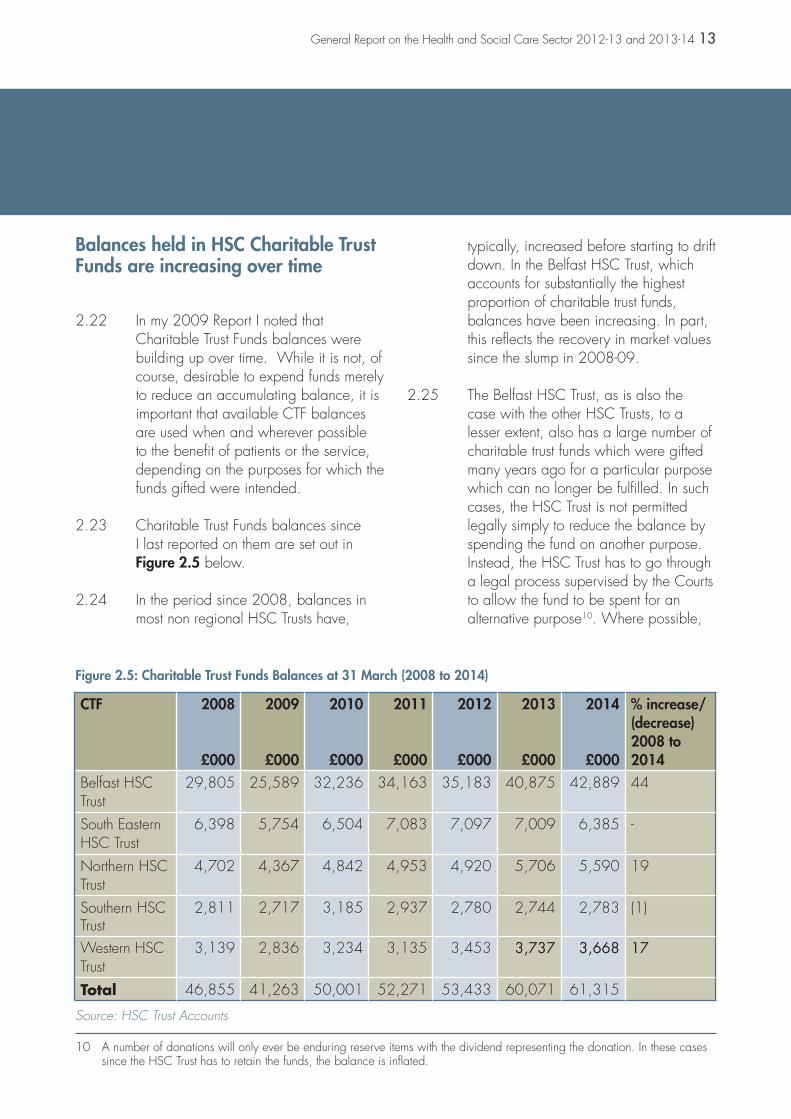
2.22 In my 2009 Report I noted that Charitable Trust Funds balances were building up over time. While it is not, of course, desirable to expend funds merely to reduce an accumulating balance, it is important that available CTF balances are used when and wherever possible to the benefit of patients or the service, depending on the purposes for which the funds gifted were intended.
2.23 Charitable Trust Funds balances since I last reported on them are set out in Figure 2.5 below.
2.24 In the period since 2008, balances in most non regional HSC Trusts have,
typically, increased before starting to drift down. In the Belfast HSC Trust, which accounts for substantially the highest proportion of charitable trust funds, balances have been increasing. In part, this reflects the recovery in market values since the slump in 2008-09.
2.25 The Belfast HSC Trust, as is also the case with the other HSC Trusts, to a lesser extent, also has a large number of charitable trust funds which were gifted many years ago for a particular purpose which can no longer be fulfilled. In such cases, the HSC Trust is not permitted legally simply to reduce the balance by spending the fund on another purpose. Instead, the HSC Trust has to go through a legal process supervised by the Courts to allow the fund to be spent for an alternative purpose10. Where possible,
3 10
10 A number of donations will only ever be enduring reserve items with the dividend representing the donation. In these cases since the HSC Trust has to retain the funds, the balance is inflated.
Figure 2.5: Charitable Trust Funds Balances at 31 March (2008 to 2014)
CTF 2008
£000
2009
£000
2010
£000
2011
£000
2012
£000
2013
£000
2014
£000
% increase/(decrease)2008 to2014
Belfast HSCTrust
29,805 25,589 32,236 34,163 35,183 40,875 42,889 44
South EasternHSC Trust
6,398 5,754 6,504 7,083 7,097 7,009 6,385 -
Northern HSCTrust
4,702 4,367 4,842 4,953 4,920 5,706 5,590 19
Southern HSC Trust
2,811 2,717 3,185 2,937 2,780 2,744 2,783 (1)
Western HSCTrust
3,139 2,836 3,234 3,135 3,453 3,737 3,668 17
Total 46,855 41,263 50,001 52,271 53,433 60,071 61,315
Source: HSC Trust Accounts

14 General Report on the Health and Social Care Sector 2012-13 and 2013-14
Part Two:Financial performance and governance
Concluding Observation
2.26 I encourage each HSC Trust to continue to actively manage their balances. I welcome the efforts made by the HSC Trusts to spend charitable trust funds’ balances, or to obtain Court approval to spend them on alternative purposes when spending on the original purpose is no longer possible.
this purpose will be similar to the original purpose. In the case of the Belfast HSC Trust, because of the number of charitable trusts involved, and the
complexity of preparing the cases for the Courts, this is likely to take a number of years to complete.

Part Three:Operational Performance – Access to Hospital Care

16 General Report on the Health and Social Care Sector 2012-13 and 2013-14
Part Three:Operational Performance – Access to Hospital Care
3.1 Targets and actions for HSC bodies are set out in the annual Commissioning Plans published by the HSC Board. This section of my report summarises hospital performance against four waiting time targets as follows:
• Inpatients (paragraphs 3.3 to 3.5);
• Outpatients (paragraphs 3.6 to 3.8);
• Emergency care patients (paragraphs 3.9 to 3.10); and
• Cancer (paragraphs 3.11 to 3.14).
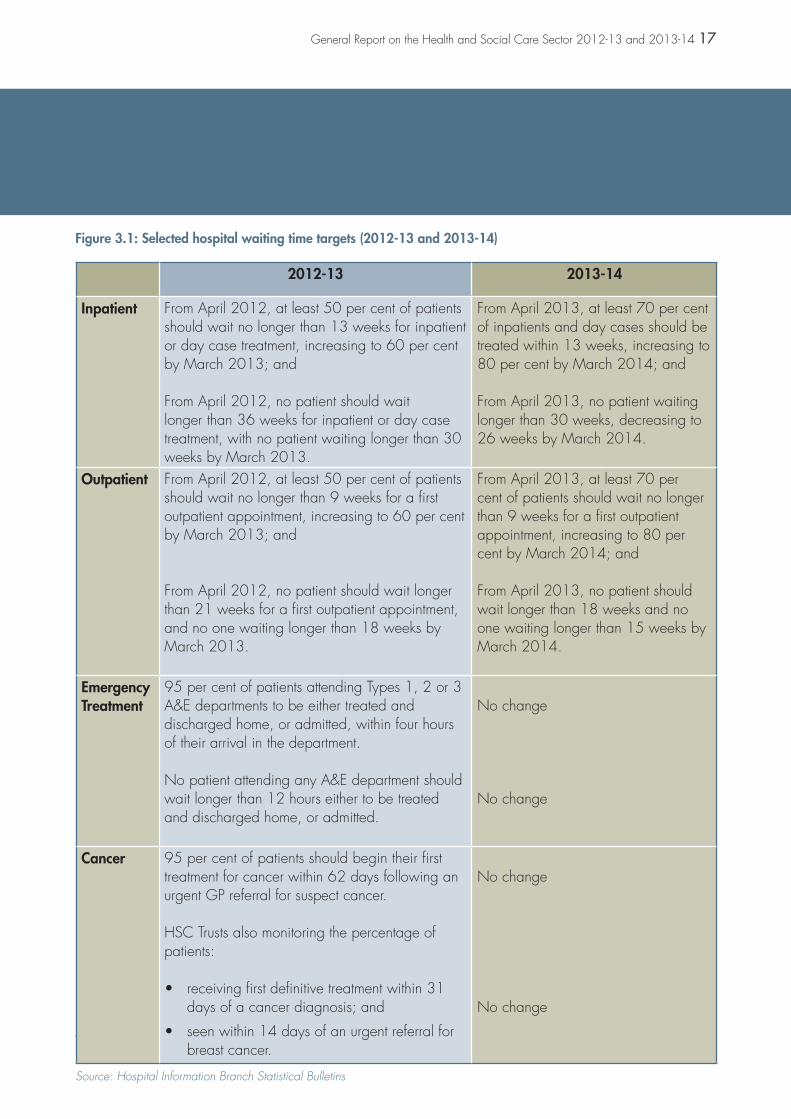
3.2 Figure 3.1 sets out the targets set in each of these areas in 2012-13 and 2013-14.
HSC Trusts’ performance against inpatient targets declined in 2013-14
3.3 The number of patients who completed their inpatient treatment has remained relatively constant in each of the five non-regional HSC Trusts since 2011-12. In 2013-14 a total of 206,752 patients had completed their inpatient treatment (just 4 per cent higher than the number in 2011-12).
Key Points
• HSC Trusts are finding it increasingly difficult to meet waiting time targets;
• HSC Trusts were more successful in achieving inpatient and outpatient waiting time targets in 2012-13 than in 2013-14; and
• Emergency care and cancer waiting time targets were not met in 2012-13 or in 2013-14.
3.4 At 31 March 2013, almost 48,000 people were waiting to be admitted as inpatients. At 31 March 2014, the figure stood at just over 49,000, with a significant number of patients waiting within five specialities (Trauma and Orthopaedic (T&O) Surgery; General Surgery; Urology; Ophthalmology; Ear, Nose and Throat (ENT)).
3.5 In terms of achievement against inpatient targets I note that:
• At 31 March 2013, the Belfast HSC Trust did not meet the first aspect of the inpatient target since it treated only 58 per cent of patients within 13 weeks (against a target of 60 per cent);
• At 31 March 2014, three HSC Trusts (Belfast, Southern and Western) did not meet the first aspect of the inpatient target since they failed to treat 80 per cent of patients within 13 weeks;
• In both years, all HSC Trusts had patients who had waited in excess of the maximum waiting time target (30 weeks at 31 March 2013 and 26 weeks at 31 March 2014); and
General Report on the Health and Social Care Sector 2012-13 and 2013-14 17
Figure 3.1: Selected hospital waiting time targets (2012-13 and 2013-14)
2012-13 2013-14
Inpatient From April 2012, at least 50 per cent of patients should wait no longer than 13 weeks for inpatient or day case treatment, increasing to 60 per cent by March 2013; and
From April 2012, no patient should wait longer than 36 weeks for inpatient or day case treatment, with no patient waiting longer than 30 weeks by March 2013.
From April 2013, at least 70 per cent of inpatients and day cases should be treated within 13 weeks, increasing to 80 per cent by March 2014; and
From April 2013, no patient waiting longer than 30 weeks, decreasing to 26 weeks by March 2014.
Outpatient From April 2012, at least 50 per cent of patients should wait no longer than 9 weeks for a first outpatient appointment, increasing to 60 per cent by March 2013; and
From April 2012, no patient should wait longer than 21 weeks for a first outpatient appointment, and no one waiting longer than 18 weeks by March 2013.
From April 2013, at least 70 per cent of patients should wait no longer than 9 weeks for a first outpatient appointment, increasing to 80 per cent by March 2014; and
From April 2013, no patient should wait longer than 18 weeks and no one waiting longer than 15 weeks by March 2014.
EmergencyTreatment
95 per cent of patients attending Types 1, 2 or 3A&E departments to be either treated and discharged home, or admitted, within four hours of their arrival in the department.
No patient attending any A&E department should wait longer than 12 hours either to be treatedand discharged home, or admitted.
No change
No change
Cancer 95 per cent of patients should begin their first treatment for cancer within 62 days following an urgent GP referral for suspect cancer.
HSC Trusts also monitoring the percentage of patients:
• receiving first definitive treatment within 31 days of a cancer diagnosis; and
• seen within 14 days of an urgent referral for breast cancer.
No change
No change
Source: Hospital Information Branch Statistical Bulletins

18 General Report on the Health and Social Care Sector 2012-13 and 2013-14
Part Three:Operational Performance – Access to Hospital Care
11 These figures exclude appointments with the independent sector.
• The number of patients waiting longer than 26 weeks at 31 March 2014 was 30 per cent higher than the number waiting longer than 26 weeks at 31 March 2013.
HSC Trusts’ performance against outpatient targets declined in 2013-14
3.6 The number of patients who attended their first outpatient appointment increased slightly from just over 481,000 in 2012-13 to almost 486,000 in 2013-1411.
3.7 At 31 March 2013, almost 100,000 patients were waiting for a first outpatient appointment. The number of patients waiting for a first outpatient appointment at 31 March 2014 increased by over 25 per cent to just over 127,000. In both years, around 40 per cent of patients waiting were waiting in the Belfast HSC Trust.
3.8 In terms of achievement against outpatient targets I note that:
• At 31 March 2013 all HSC Trusts ensured that at least 60 per cent of people waited no longer than nine weeks for a consultant led first appointment;
11 11
Percentage
• At 31 March 2014 only the South Eastern HSC Trust ensured that at least 80 per cent of patients waited no longer than nine weeks; and
• In both years, all HSC Trusts had patients who had waited in excess of the maximum waiting time target (18 weeks at 31 March 2013 and 15 weeks at 31 March 2014).
Emergency Care Targets were not met by HSC Trusts in 2012-13 or 2013-14
3.9 Overall the total number of new and unplanned attendances at emergency care departments increased from 682,415 in 2012-13 to 694,618 in 2013-14 (almost 2 per cent). Almost one quarter of all attendances at emergency care departments each year are within the Belfast HSC Trust.
3.10 In terms of achievement against emergency care targets I note that:
• No Type 1 or Type 2 Emergency Department met the target to either treat and discharge or admit 95 per cent of patients within four hours in 2012-13 or 2013-14;
• All HSC Trusts had patients who waited in excess of 12 hours before being either treated and discharged or admitted in 2012-13 and 2013-14;

General Report on the Health and Social Care Sector 2012-13 and 2013-14 19
• In 2012-13, just over 45 per cent of patients who waited more than 12 hours, waited in the Northern HSC Trust; and
• In 2013-14, almost 40 per cent of patients who waited more than 12 hours, waited in the South Eastern HSC Trust.
Cancer Targets were not met in NI in either 2012-13 or 2013-14
3.11 Overall, NI hospitals did not ensure that 95 per cent of patients began their first treatment for cancer within 62 days following an urgent GP referral for suspect cancer in any month during the two year period to 31 March 2014. The Western HSC Trust achieved the target in two months (March 2013 and July 2013) while the Southern HSC Trust achieved the target once (in May 2013). No other HSC Trust achieved the target in any month over the two year period.
3.12 Over the two year period, performance against the 62 day target (at a NI level) varied between just over 77 per cent (October 2013) to just over 87 per cent (December 2012).
3.13 The percentage of patients treated within 31 days of a cancer diagnosis remained relatively static over the two years at between 95 and almost 99 per cent.
3.14 The percentage of patients seen within 14 days of an urgent referral for breast cancer has fallen considerably from around 100 per cent in the period from April 2012 to December 2012 to just over 72 per cent in November 2013 and just under 53 per cent in March 2014. Figure 3.2 (overleaf) shows that during each of the three months to March 2014, only one HSC Trust (the Belfast HSC Trust) saw in excess of 90 per cent of urgent breast cancer referrals within 14 days. The Western HSC Trust achieved the 14 day target in two of the three months. Performance in the remaining HSC Trusts was particularly low during the later part of 2013-14.

20 General Report on the Health and Social Care Sector 2012-13 and 2013-14
Part Three:Operational Performance – Access to Hospital Care
Concluding Observation
3.15 Hospital performance against waiting time targets has declined over the last two years. With the uncertain future financial position and the anticipated increase in demand on hospitals, HSC Trusts look set to struggle to achieve future targets.
0
10
20
30
40
50
60
70
80
90
100
Mar-14Feb-14Jan-14
Perc
enta
ge
Western HSC TrustBelfast HSC Trust
Northern HSC Trust Southern HSC TrustSouth Eastern HSC Trust
Month
Figure 3.2: Percentage of patients seen within 14 days following an urgent referral for suspect breast cancer over the period January 2014 to March 2014
Source: Hospital Information Branch

Part Four:Counter Fraud and Probity Services

22 General Report on the Health and Social Care Sector 2012-13 and 2013-14
Part Four:Counter Fraud and Probity Services
12 The Financial Cost of Healthcare Fraud 2014: What data from round the world shows: Jim Gee and Professor Mark Button, published by BDO LLP and the Centre for Counter Fraud Studies at University of Portsmouth, March 2014.
Key Points:
Estimating Fraud across the Northern Ireland HSC Sector
The full extent of fraud against the HSC sector is not known. However, frauds perpetrated against the HSC sector divert resources and impact on its ability to deliver quality care. During the 2013 Fraud Awareness Month (October 2013), the Department acknowledged that independent research across a number of countries12 had suggested that health sector fraud may be between 3 to 7 per cent or, at its highest level, around a quarter of a billion pounds.
The role and success of the Counter Fraud and Probity Services (CFPS) unit in deterring and investigating actual/potential fraud, error or overpayment
The CFPS unit has undoubtedly contributed to the identification of fraud, error and overpayment in the HSC sector. For example:
Through its counter-fraud services:
Øin the two year period to 31 March 2014, a total of 230 actual/suspected fraud cases were reported to the CFPS unit for investigation and
Øfollowing the CFPS unit investigation, 28 sanctions have been applied to individuals suspected of perpetrating fraud against the HSC sector in the past two years. This included prosecution of 15 individuals.
Through its probity services:
Øthe CFPS unit secured recovery of over £540,000 incorrectly paid to Family Health Practitioners in the four year period to March 2014.
Through its verification services:
Øthe CFPS unit secured recovery of over £120,000 incorrectly claimed in patient exemptions in the four year period to March 2014.

General Report on the Health and Social Care Sector 2012-13 and 2013-14 23
In Northern Ireland, responsibility for the provision of a regional counter fraud and probity service is delegated to the Business Services Organisation
4.1 Frauds perpetrated against the HSC sector divert resources and impact on its ability to deliver quality care. The full extent of fraud against the HSC sector is not known. During the 2013 Fraud Awareness Month (October 2013), the Department reported the detrimental impact that fraud has on the HSC sector. At that time, the Department acknowledged that independent research across a number of countries had suggested that fraud within individual health sectors may be between 3 to 7 per cent or, at its highest level, around a quarter of a billion pounds13.
4.2 The CFPS unit was established in April 2009 to bring together services previously delivered by each of the four legacy Health Boards, the Department and the former Central Services Agency. The CFPS unit has a wide remit and, among others things, is responsible for:
• tackling fraudulent claims by patients for exemptions from statutory dental and ophthalmic charges;
• formal investigation and notification14 of all cases of potential or suspected fraud across all HSC organisations;
12 13
12 14
• delivery of a range of probity verification and assurance work in relation to Primary Care contractors;
• counter fraud and probity policy issues;
• delivery of a regional fraud awareness programme;
• fraud prevention activities such as fraud-proofing documents and undertaking fraud risk assessments; and
• provision of regional advice and guidance in relation to entitlement to free health care in Northern Ireland.
In the two year period to 31 March 2014, a total of almost 280 instances of actual or suspected fraud were reported to the CFPS unit
4.3 The CFPS unit provides a criminal investigation service for all HSC sector organisations. All HSC organisations must report all instances of actual or suspected fraud, including theft, to the CFPS unit through the regional fraud reporting system (REFRAIN). In turn, the CFPS unit is required to notify the Department, the Department of Finance and Personnel and my office of all reported cases of fraud and theft against the HSC sector. Although not a prescribed body15, the CFPS
12 15
13 Oral Statement to the Northern Ireland Assembly by the Northern Ireland Health Minister on Tuesday 15 October 2013.
14 All suspected or actual frauds must be notified to the Department, the Department of Finance and Personnel and the NIAO.
15 The Public Interest Disclosure (Northern Ireland) Order 1998 lists all persons/bodies to whom protected whistleblowing disclosures can be made (prescribed bodies). The Regulation and Quality Improvement Authority (RQIA) and the Northern Ireland Social Care Council (NISCC) are the prescribed bodies for health and social care disclosures in Northern Ireland.

24 General Report on the Health and Social Care Sector 2012-13 and 2013-14
Part Four:Counter Fraud and Probity Services
unit also receives a small number of whistleblowing allegations (fewer than 20 each year) directly through the HSC Fraud Hotline16, online17 or by post.
4.4 Within the CFPS unit, a small team of five experienced, accredited staff investigates any potential or actual fraud case referred to it by a HSC body for formal fraud investigation. HSC
56
8
68
2012-13
Source of referral
2013-14
Source of referral
Total Cases = 132 Total Cases = 146
HSC Trusts HSC Board Other Agencies
113
16 17
Figure 4.1: Source of Actual/Suspected Fraud Cases Referred to the CFPS unit during 2012-13 and 2013-14
Source: The CFPS unit REFRAIN system
organisations are not required to refer all potential or actual fraud cases to the CFPS unit for formal fraud investigation. Figure 4.1 provides an analysis of the source and classification of the potential fraud cases referred to the CFPS unit in 2012-13 and 2013-14.
16 HSC Fraud Hotline: Telephone number 0800 0963396
17 Website address: www.reporthealthfraud.hscni.net

General Report on the Health and Social Care Sector 2012-13 and 2013-14 25
4.5 Figure 4.1 shows that the number of reports to the CFPS unit increased slightly in 2013-14. In 2013-14, the majority of reports were received from the HSC Board. The increase in referrals from the HSC Board is welcomed. I note however, that the number of referrals originating from HSC Trusts fell significantly in 2013-14.
Figure 4.1 (contd): Classification of Actual/Suspected Fraud Cases Referred to the CFPS unit during 2012-13 and 2013-14
Category of Actual/Suspected Fraud Case
2012-13 2013-14Category of Actual/Suspected Fraud Case Note 1
0 10 20 30 40 50 60
FalseRepresentation
Theft
Obtaining ServicesDishonestly
Forgery
Abuse of Position
Failing to DiscloseInformation
Other
Bribery
0 30 60 90 120 150
Customer
Staff
Supplier
Practitioner
Other
Source: The CFPS unit REFRAIN system
Note 1: Since 2013-14 the CFPS unit has begun to use perpetrator (rather than the nature of fraud) to analyse actual/suspected fraud cases.
The CFPS unit investigation of actual/suspected fraud cases has delivered results
4.6 During 2012-13, a CFPS unit investigation led to the successful prosecution of two individuals who had been involved in delivering ophthalmic services. Both individuals received jail

26 General Report on the Health and Social Care Sector 2012-13 and 2013-14
Part Four:Counter Fraud and Probity Services
sentences suspended for two years and a total amount of £40,000 was repaid to the HSC Board. Also that year, on foot of CFPS unit investigations, the Police Service of Northern Ireland (PSNI) issued formal cautions to two individuals. During 2013-14, CFPS unit investigations led to a total of 13 successful prosecutions for a range of fraud-related offences against the HSC bodies.
Data matching through the National Fraud Initiative has identified instances of fraud, error and overpayment
4.7 The majority of HSC sector organisations participate in the National Fraud Initiative (NFI)18, comparing sets of data to highlight inconsistencies and identify potential fraud and error. I note efforts across the HSC sector to extend the use of data matching to detect other types of fraud and error. For example:
• The majority of people who visit or reside temporarily in the UK make only occasional and necessary use of the NHS. There are others, ‘health tourists’, who take advantage of the NHS and access services without paying for them. It is estimated that health tourists in England cost between £12 million and £200 million each year19. While no estimates exist for the cost
12 18
12 19
of health tourism in NI, it may be reasonable to assume that levels will be, at least, broadly similar to those in England since NI has a land border with the Republic of Ireland (ROI). HSC sector treatment is free to those deemed as ordinarily resident in Northern Ireland. Conversely, health treatment in the ROI attracts a charge. There is, therefore an incentive for ROI residents to falsely claim they are ordinarily resident in Northern Ireland. A special team has been set up within the CFPS unit to examine this area.
In the period since August 2012, the CFPS unit’s work across the HSC has led to the removal of over 150 falsely-registered patients from Northern Ireland General Practitioner (GP) lists. The CFPS unit estimates that their removal will generate potential savings of over £1 million. The Business Services Organisation (BSO) is exploring whether data matching would offer an efficient means of identifying individuals falsely-registered with GPs in NI20; and
• A pilot exercise in GB has established the value of matching social care direct payment recipients to death records, enabling HSC Trusts to identify cases where they were not notified of deaths. It is planned that HSC Trusts will take part in direct payment data matching for the first time during 2015.
12 20
18 The National Fraud Initiative is a UK wide data matching exercise designed to detect possible fraud and error. The results of the third NFI exercise in Northern Ireland were published on 17 June 2014 and can be accessed at http://www.niauditoffice.gov.uk/national_fraud_initiative_2014.pdf
19 The Department of Health has commissioned an ‘audit’ of NHS use by visitors and temporary migrants, to estimate the scale of the challenge and the size of the financial burden.
20 It may be possible to identify individuals registered with NI GPs even though they do not reside in NI by comparing NI GP patient registration lists against NI rates or electoral registers.

General Report on the Health and Social Care Sector 2012-13 and 2013-14 27
The CFPS unit makes an important contribution to raising fraud awareness across the HSC sector
4.8 The CFPS unit’s programme of fraud awareness initiatives, which aims to lead and support HSC organisations in reducing fraud, includes amongst other things:
• producing fraud awareness promotional literature;
• developing a fraud awareness e-learning programme for staff;
• holding anti-fraud presentations for a wide range of HSC sector workers, such as pre-registration pharmacists, junior doctors, vocational dentists and those providing domiciliary care;
• manning an information kiosk at regional conferences;
• delivering roadshows in various HSC locations;
• taking the lead on ‘fraud awareness month’ (October 2013) – the first large scale counter fraud event within the HSC sector;
• sharing information via social media sites; and
• maintaining and updating the bespoke CFPS unit website.
4.9 The Fraud Awareness Surveys conducted during CFPS unit’s roadshows in 2012-13 identified that much work needs to be done to improve awareness across the HSC sector. Over 900 staff (clinical, administration and auxiliaries) took part in the surveys. The vast majority of respondents stated that they would be willing to report suspicions of fraudulent activity against the HSC sector but highlighted that they had not attended any fraud awareness training and had no knowledge of how to report a suspicion of fraud.
4.10 In 2013-14, CFPS unit staff engaged with over 3,600 staff across a series of roadshows and presentations. In addition, it issued 40 fraud alerts, held 20 fraud awareness training sessions and delivered 24 fraud awareness presentations across the HSC sector. Some 63,000 HSC sector staff also received information (by way of a circular) on their responsibilities in relation to fraud.
4.11 The CFPS unit designated October 2013 as Fraud Awareness Month. The campaign was launched at an event attended by over 100 health and social care professionals and various representatives from external agencies, such as the Police Service of Northern Ireland and the Law Society of Northern Ireland. Activities during Fraud Awareness Month included roadshows, information kiosks, presentations, desk alerts and the launch of the stand-alone unit website and online reporting tool.

28 General Report on the Health and Social Care Sector 2012-13 and 2013-14
Part Four:Counter Fraud and Probity Services
The CFPS unit probity checks on Family Health Practitioner claims have resulted in the recovery of over £540,000 in the past four years
4.12 The CFPS unit undertakes post-payment verification checks on claims from medical, dental, ophthalmic and pharmaceutical practitioners. The checks undertaken are designed to confirm that claims are proper and in line with the relevant Statement of Fees and Entitlements or Allowances.
4.13 The level of checking is set out each year in a Service Level Agreement between the HSC Board and the Business Services Organisation (BSO). The CFPS
unit currently has 11 staff providing probity services. In each year since 2010-11, the CFPS unit has achieved the probity checking targets set out in its agreed Service Level Agreement (SLA).
4.14 Figure 4.2 sets out the activity and recoveries secured during CFPS unit probity checks over the past four years.
The CFPS unit verification checks on dental and ophthalmic patient exemptions have resulted in recovery of over £120,000 in the past four years
4.15 Patient exemption fraud occurs when an individual who knows they
Figure 4.2: The CFPS unit Probity Activity and Recovery Levels (over the four year period to 31 March 2014)
Number of Claims Verified
CFPS Unit probity check activity over the four year period to 2013-14
Level of recovery following CFPS Unit probity checks over the four year period to 2013-14
Recoveries £’000s
0
100
200
300
400
500
2013-142012-132011-122010-110
50
100
150
200
250
2013-142012-132011-122010-11
Source: CFPS Unit Annual Reports

General Report on the Health and Social Care Sector 2012-13 and 2013-14 29
are not qualified for exemption, claims exemption from paying charges for dental or ophthalmic charges. Patient exemption error occurs when a patient claims exemption in good faith but is not actually eligible for exemption.
4.16 The CFPS unit carries out checks on patient exemption claims for dental and ophthalmic charges. In cases where the CFPS unit identifies that a patient has incorrectly claimed exemption from charges (fraud), the sums are repaid and, where applicable, fixed penalties and surcharges are applied.
4.17 Again the level of verification is set out in the annual SLA between the HSC Board and BSO. The CFPS unit currently has
three staff providing patient exemption verification checks. In each year since 2010-11, the CFPS unit achieved the patient exemption verification targets set out in its agreed SLA.
4.18 Figure 4.3 sets out the activity and amount recovered during the CFPS unit patient exemption verification checks over the past four years.
4.19 The results of the CFPS unit patient exemption verification checks are used by BSO to estimate the extent of patient exemption fraud and error in dental and ophthalmic treatment. BSO’s best estimate at 31 March 2013 was £3.1million. By 2014, that figure had increased to £3.3 million.
Figure 4.3: The CFPS Unit Patient Exemption Verification Activity and Identified Overpayments
Number of Exemptions Verified Amount Recovered £’000s
0
2000
4000
6000
2013-142012-132011-122010-110
10
20
30
40
50
60
2013-142012-132011-122010-11
CFPS Unit patient exemption verification checks over the four year period to 2013-14
Amount recovered following CFPS Unit patientexemption verification checks over the past four years
Source: The CFPS Unit Annual Reports

30 General Report on the Health and Social Care Sector 2012-13 and 2013-14
Part Four:Counter Fraud and Probity Services
4.20 The Department told us that the CFPS unit has just launched a forensic data analytics service which will, via data mining, trend analysis and other innovative technical approaches, proactively identify fraud and waste
across HSC. It is anticipated this service will greatly assist efforts to reduce fraud and error and its outputs could be measured more easily than its current fraud prevention work.
Concluding observations and recommendations
4.21 We acknowledge that, like other UK regions, it is difficult to quantify the prevalence and financial loss resulting from fraudulent activity across the entire health and social care sector with any certainty. We note the Department’s view that focussing resources on prevention and detection work is better than academic assessments of the scale of fraud/error which, in its view, would have to be heavily caveated. While we recognise the value of prevention and detection work, we also take the view that without knowledge of the extent of fraud and error it can be difficult to justify the cost or inconvenience associated with operating appropriate controls.
4.22 While we have provided some detail on the activities of the CFPS unit in combating such financial abuse, this does not provide a measure of the effectiveness of its work and other counter-fraud activities in reducing fraud within the health and social care sector. Baseline risk measurement exercises such as those outlined to identify fraud in family practitioner, dental and ophthalmic services, plus the recent introduction of forensic data analytics, can assist the Department in obtaining reliable measures of the nature and prevalence of fraud within different areas of the HSC services, including the financial impact on the sector. Moreover, these exercises can then be monitored over time to assess the effectiveness of counter fraud action.
4.23 We recommend that the CFPS unit carries out research into other areas of HSC spend that may benefit from an exercise along similar lines to those undertaken in family practitioner, dental and ophthalmic services. The CFPS unit has undertaken to complete a small pilot exercise to determine possible fraud levels. Over time, repeat fraud risk measurement exercises can be carried out in order to measure the effectiveness of these counter fraud initiatives.
4.24 While we note that BSO frequently reminds all HSC sector of the importance of referring all cases or suspected/actual fraud to the CFPS unit, the decline in HSC Trust suspected/actual fraud referrals to the CFPS unit is of concern. It is important that all HSC bodies notify the CFPS unit of all cases to maximise its input across the sector.

Part Five:Procurement

32 General Report on the Health and Social Care Sector 2012-13 and 2013-14
Part Five:Procurement
21 Review of the arrangements for the control of procurement expenditure between and within DHSSPS and its arm’s length bodies, DHSSPS, March 2012
Key Points
• In the two years to 31 March 2014, the number of direct award contracts used by HSC bodies decreased by almost 15 per cent. Expenditure on these contracts rose over the same period by 36 per cent (to £74 million);
• An investigation into whistleblowing allegations within the Northern HSC Trust Estates Department, has identified that:
– inappropriate, or potentially inappropriate, expenditure of at least £5.7 million was incurred
– management action in response to the concerns of the whistleblower was not sufficient
– although there was no clear evidence of fraudulent activity, there was sufficient evidence to proceed with disciplinary action;
• In 2013-14, Internal Audit (IA) provided only “limited” assurance over estate procurement and contract management controls in the Belfast HSC Trust and the Northern Ireland Ambulance Trust. IA assessed controls within the Southern HSC Trust as “unacceptable”; and
• Investigation into whistleblowing allegations revealed that the Belfast HSC Trust Transport Department had made a contract alteration which potentially left it vulnerable to legal challenge and may have led to additional costs of around £36,000.
Progress is being made across HSC sector bodies to implement the 26 recommendations made in a 2012 review of HSC sector procurement
5.1 Procurement by HSC bodies is significant, amounting to almost £800 million annually. In 2012, a comprehensive review of the HSC sector procurement21 identified that HSC bodies could not rule out the existence of cases of non-compliance in estate-related services or service and maintenance contracts. The Department accepted the review’s 26 recommendations and
21 21
anticipated full implementation within three to five years (from the report publication date (March 2012)).
5.2 In broad terms the recommendations centred around:
• improving the quality of guidance to HSC bodies;
• strengthening the Department’s monitoring role;
• extending the influence of Centres of Procurement Expertise (COPEs); and

General Report on the Health and Social Care Sector 2012-13 and 2013-14 33
• promoting collaboration between HSC Trusts.
5.3 By December 2013, the Department assessed that 17 of the 26 recommendations had been completed or acted on. Nine remained outstanding although substantial progress towards implementation had been made.
In exceptional circumstances, HSC bodies can procure goods and services without competitively tendering
5.4 While competitive procurement helps secure value for money in spending and provides assurance of compliance with legal requirements, in exceptional circumstances, it may not be appropriate. In such cases, direct award contracts (DACs) can be used. HSC sector use of DACs is monitored and, in many cases, approved by the Department.
5.5 During the past two years, over 2,600 DACs have been used by HSC bodies. Payments under these DACs amounted to just under £130 million. See Figure 5.1.
Although the number of direct award contracts used by HSC sector bodies decreased in 2013-14, spending on these contracts increased
5.6 The number of DACs reduced from just over 1,400 in 2012-13 to just over 1,200 in 2013-14 (15 per cent). However, the value of DACs rose by 36 per cent over the same period. The Department told me that the increase in the value of DACs is attributable to:
• more complete recording of pharmacy contracts and
• a number of high-value DACs awarded by the Business Services Organisation and the Belfast HSC Trust.
Procurement and contract management issues continue to exist within the Estates Department of the Northern HSC Trust
5.7 In my report on its 2010-11 accounts, I reported my concern that, four years after the Northern HSC Trust came into existence, procurement weaknesses
Figure 5.1 Number and Value of Direct Award Contracts 2012-13 and 2013-14
2012-13 2013-14Number Value
£ millionNumber Value
£ million
Total 1,433 54,998 1,219 74,746
Source: DHSSPS DARC 17/2014 and 27/2013

34 General Report on the Health and Social Care Sector 2012-13 and 2013-14
Part Five:Procurement
had not been addressed. I encouraged the Northern HSC Trust to address weaknesses as a matter of priority given the regularity, litigation and value for money risks. I further reported on the 2013-14 accounts of the Northern HSC Trust on identified weaknesses in procurement.
5.8 Following investigation of whistleblowing allegations raised in 2012, the Northern HSC Trust commissioned its IA service to review the whistleblowers allegations. In October 2012 arrangements were put in place by the Department to advise on the investigation of the allegations, to consider reports and to make sure appropriate action was taken, with the Department’s own IA service also involved in investigating later allegations of Estates Department staff conducting private work.
5.9 The HSC Trust’s IA service issued a final report in January 2014 and, in a statement in the Assembly, the Department’s Minister expressed his concern at a serious lack of control within the Estates Management function in the Northern HSC Trust and predecessor bodies.
5.10 IA identified significant estates procurement and contract management issues. Findings included:
• There was no evidence that the services provided by a contractor for maintenance and aids and adaptations work in the Northern HSC Trust (and Causeway Trust
before) had been competitively tendered. Since 1999 the contractor had received payments from the Trust and its predecessor body of £4.467 million;
• Procurement issues, mainly relating to incorrect tender procedures, were found with 9 of the 31 schemes tested;
• Senior officials in the Estates Department in the Northern HSC Trust were aware as far back as 2009 of concerns over legacy procurement and contract management inherited from the former Homefirst and Causeway Trusts. IA found no evidence action was taken to resolve this; and
• Where Estates Officers have conducted private work, IA could not confirm there were no conflicts of interest although equally there was no evidence that this work conflicted with their official duties.
Investigations identified that, although the problems had previously been brought to the attention of management, no action had been taken to address the issues. It was also highlighted that it was not possible to confirm whether value for money had been achieved in the cases examined.
5.11 While the investigations did not find any clear evidence of fraudulent activity, it did uncover sufficient evidence to proceed with disciplinary action.

General Report on the Health and Social Care Sector 2012-13 and 2013-14 35
Disciplinary proceedings are being progressed by the HSC Trust.
5.12 The total value of inappropriate, or potentially inappropriate, spending uncovered by IA investigations was in the region of £5.7million. For a number of contracts, it was not possible to quantify the total spending (due to insufficient evidence) and, therefore, the value of inappropriate, or potentially inappropriate, spending may be higher. Around £3.6 million of this total related to goods and services provided to one of the Northern HSC Trust predecessor Trusts, the Causeway Trust.
5.13 The Northern HSC Trust is currently acting under DACs for Response Maintenance Services – Buildings and has told me that it is currently completing a business case for the services provided under this contract and plans to provide a permanent solution in place in early 2014-15. It expects that the business case will be completed by the end of April 2015 and that a permanent solution will be in place from September 2015.
Concerns about procurement and contract management within other HSC Trust estates departments have now been identified
5.14 Following the whistleblowing allegations within the Northern HSC Trust, IA has undertaken work to assess the quality of procurement in estates departments in the other HSC Trusts. In 2013-14,
IA provided assurance that estates department procurement controls within the South Eastern HSC Trust and the Western HSC Trust were “satisfactory”. It provided “limited” assurance over the controls in the Belfast HSC Trust and the Northern Ireland Ambulance Trust. It assessed that controls within the Southern HSC Trust were “unacceptable” identifying works to the value of £1.7 million incurred during 2012-13 and 2013-14 which was not subject to proper procurement, as well as identifying significant issues in the processes including approval of contract variations, approval of business cases and checks on works performed.
My investigation of whistleblowing allegations relating to the Belfast HSC Trust Transport Department also identified weaknesses
5.15 The Belfast HSC Trust Transport Department is responsible for transporting clients to and from day centres, delivering goods and laboratory samples and supporting community nursing and Occupational Therapy services. It also provides cover in cases where the NI Ambulance service is unable to provide non-emergency transport of patients to and from hospitals. On occasion where the Transport Department does not have sufficient drivers (either due to absence or requests for increased requirements) to meet the transport demand, it acquires additional resources from external

36 General Report on the Health and Social Care Sector 2012-13 and 2013-14
Part Five:Procurement
service providers. I received information, from a whistleblower, that the Transport Department contract for additional bus drivers had not been correctly procured or managed.
5.16 During my audit of the 2012-13 financial statements, I examined the contract in question. I identified that the original contract (July 2009) required the provider to supply buses and drivers. Less than one year later (in May 2010) a contract alteration allowed the contractor to provide drivers rather than buses and drivers (as detailed in the original contract). In my view, this represented a significant and fundamental change to the terms of the contract. I concluded that the original contract specification was flawed and that the Transport Department’s decision not to retender left it vulnerable to legal challenge from other suppliers.
5.17 I also had concerns as to whether the decision to agree a revised payment rate (from £149 per day for supplying a bus and driver to £90 for supplying a driver only) ensured that value for money was achieved.
5.18 In response to my concerns, the Belfast HSC Trust told me that, in its view, the original specification (for the supply of bus and driver) did meet its requirements. It contended that, since the issue at the time of the contract variation was a shortage of drivers, its decision to alter the existing “bus and driver” contract was valid.
5.19 In response to my concerns, the Transport Department told me that no further payments would be made under the contract and that, in future, it would be utilising existing HSC contracts with employment agencies. I anticipated that utilisation of existing employment agency contracts would generate savings since their rates are considerably less than those charged under the revised contract. The charge under the Transport Department’s contract is 43 per cent higher than the cheapest employment agency contract and 30 per cent22 higher than the most expensive employment agency contract.
5.20 Despite its assurances, I note that the Transport Department has continued to make payments to the original contractor. The Belfast HSC Trust told me that it was unable to obtain sufficient numbers of drivers from contracted employment agencies. In the absence of an alternative, the Belfast HSC Trust told me that, from September 2013, it engaged the original supplier as a non-contracted agency. In the period from April 2013 to August 2013, the contractor was paid almost £20,000 for supplying drivers to the Belfast HSC Trust. Under the revised contractual arrangements (in force from September 2013), the Belfast HSC Trust paid the contractor almost £16,000 (up to 31 March 2014) as a non-contracted agency.
5.21 The Belfast HSC Trust told me that the Transport Department applied the HSC Trust’s guidance on Recruitment
21 22
22 The Transport Department has told me that the contract variation reduces to 19 per cent and 10 per cent respectively after 12 weeks of use and significantly further after prolonged use.
General Report on the Health and Social Care Sector 2012-13 and 2013-14 37
of Agency and Locum Services which indicates that, if the agencies listed on the Regional Contract are unable to meet demand, it is permissible to appoint an agency not listed therein. The Belfast HSC Trust assured me that all required paperwork was completed at the time.
5.22 Total payments to this company since the commencement of the contract in July 2009 have, to date, totalled almost £382,000. Around £150,000 of this related to the original contract. While I note that the original contract was advertised in the EU journal, in my view,
the contract alteration was so significant and fundamental that the contract should have been re-advertised to comply with EU procurement guidance. I further consider that the use of the supplier as a non-contracted agency should also have been advertised in the EU journal.
5.23 Further, given the difference in the charges from the contracted firm and employment agencies, I consider that the continued use of the contract, up to 31 March 2014, cost the Belfast HSC Trust additional expenditure of around £36,000.
Concluding Observations
5.24 Despite implementation of many of the recommendations arising from a 2012 HSC-wide procurement review, I note that significant procurement and contract management problems continue to exist within HSC Trust Estates Departments.
5.25 Management at each of the Trusts has agreed recommendations for improvement arising from the IA work. I intend to keep progress under review and report further in due course as necessary.
5.26 A recent good practice guide published by the four UK supreme audit agencies, including the NIAO, emphasised that whistleblowers have an important role to play in bringing information to their organisation in relation to the proper conduct of public business23. According to the guide, a key element in this is the need for a cultural change throughout the public sector to demonstrate that workers who raise genuine concerns are supported by senior management. This would give acknowledgement to whistleblowing as a catalyst for real improvements in governance and accountability. The issues noted above in the Northern and Belfast HSC Trusts demonstrate the important role of whistleblowers in exposing malpractice.
21 23
23 Whistleblowing in the Public Sector – A good practice guide for workers and employers, NIAO, AS, WAO and NAO, 25 November 2014.

38 General Report on the Health and Social Care Sector 2012-13 and 2013-14
Part Five:Procurement

Part Six:Tackling Health Inequalities

40 General Report on the Health and Social Care Sector 2012-13 and 2013-14
Part Six:Tackling Health Inequalities
24 For example: Mackenbach JP, Bakker MJ: European network on interventions and policies to reduce inequalities in health. Tackling socioeconomic inequalities in health: analysis of European experiences. Lancet 2003,362:1409–1414. Closing the gap in a generation: Health equity through action on the social determinants of health, Commission on Social Determinants of Health - final report, WHO, 2008; Fair Society, Healthy Lives – Strategic Review of Health Inequalities in England post 2010 (the “Marmot Review”) ; Health 2020 – European policy framework and strategy, WHO, 2012; Review of social determinants and the health divide in the WHO European Region, WHO, 2013.
Introduction
6.1 Health is influenced, either positively or negatively, by a variety of factors. Some factors, such as genetic or biological factors, are relatively fixed. Others, such as social determinants, can be modified. The housing and environment we live in, the health, education and other services we have access to, the incomes we can generate and the type of work we do, for instance, can all impact on our health and wellbeing. It is the unequal distribution of these determinants which gives rise to avoidable health inequalities.
6.2 A substantial body of research has established that those who are poorer or disadvantaged are more likely to face more illness during their lifetime and die younger than those who are better
Key Points:
• The Department has various strategies in place to tackle health inequalities.
• In 2008, I reported on:
Øthe lack of progress in increasing life expectancy among those living in deprived areas;
Øthe continuing prevalence of smoking among manual workers;
Øthe higher rates of suicide among the disadvantaged; and
Øthe challenge of reducing tooth decay among children from disadvantaged backgrounds.
• Latest available data for 2010-12 shows that there has been little change in the male and female life expectancy gaps between the most deprived areas and the regional average since 2006-08.
off24. This means that the chances of a long and healthy life are not the same for everyone. There is a health gap between rich and poor. There is also a clear social gradient in health whereby health generally improves with each step on the income ladder.
Various strategies have been launched to tackle health inequalities
6.3 The Executive’s key strategy for tackling health inequalities was the ten year cross- departmental strategy Investing for Health, published in 2002. A review of Investing for Health was completed in 2010, and proposals for an updated framework were published for consultation in 2012 (“Fit and Well – Changing Lives”). Informed by the findings of the review, consultation response, Assembly Health Committee
24 24
General Report on the Health and Social Care Sector 2012-13 and 2013-14 41
report on Health Inequalities and the updated evidence base, the revised framework “Making Life Better – A Whole System Strategic Framework for Public Health 2013 – 2023” was endorsed by the Executive and published in June 2014.
6.4 Making Life Better aims to improve health and reduce health inequalities and proposes as a vision that “all people are enabled and supported in achieving their full health and wellbeing potential.” To achieve the framework’s vision and aims will require effort across the broad range of social, economic and environmental factors which influence health and wellbeing. Contributions must be made at all levels – from government, to regional and local levels – and in many settings - such as communities, workplaces, schools and homes, and health settings. A key aim is to put in place strengthened co-ordination and partnership working in a whole system approach.
6.5 The recent review of health and social care Transforming Your Care (TYC) also identified the need for a renewed focus on public health and social well-being to tackle health inequalities and refocus care provision away from the acute sector into people’s homes and communities. TYC is a key element of a wider, holistic approach to tackling health inequalities. Making Life Better provides further strategic direction to guide and reinforce this approach.
Work is on-going to reduce health inequalities and success is evident in some areas
6.6 Following my report on the Performance of the Health Service in Northern Ireland (October 2008), a report by the Public Accounts Committee in 201025 drew attention to the fact that while overall measures of life expectancy were heading in the right direction, inequalities in health status between those in the more affluent and most disadvantaged parts of Northern Ireland persisted. In particular, the report included the following findings:
• the lack of progress in increasing life expectancy among those living in deprived areas;
• the continuing prevalence of smoking among manual workers;
• the higher rates of suicide among the disadvantaged; and
• the challenge of reducing tooth decay among children from disadvantaged backgrounds.
The Committee concluded that “...further progress in achieving more equal health outcomes for all will require continued drive and focus on the part of DHSSPS”.
6.7 The Northern Ireland Health and Social Care Inequalities Monitoring System contains indicators which measure area differences in morbidity, utilisation of and access to health and social care services here.
24 25
25 Public Accounts Committee, Report on the Performance of the Health Service in Northern Ireland, Session 2009/2010, Eighth Report

42 General Report on the Health and Social Care Sector 2012-13 and 2013-14
Part Six:Tackling Health Inequalities
6.8 The Department’s 2010 Public Service Agreement target was to reduce the health inequalities gap between the 20 per cent most deprived areas and Northern Ireland as a whole as measured by life expectancy at birth by 50 per cent. The latest Monitoring System (2014) shows that, between 2006-08 and 2010-12, there was little change in the male and female life expectancy gaps between the most deprived areas and the regional average, which stood at 4.3 and 2.6 years respectively. Similarly, the gap between the most and least deprived areas remained similar over the period. Males and females in the most deprived areas can expect to live on average 7.3 years and 4.3 years less respectively than their counterparts in the least deprived areas.
6.9 The most noticeable improvements in health gaps over time between the most and least deprived areas have occurred for alcohol and drug related mortality, infant mortality, primary 1 obesity and suicide. Some gaps have widened over time, the most evident increases occurred in the overall hospital admission rate, day case admissions, elective admissions, smoking related mortality and respiratory death rates.
Tackling health inequalities and high mortality rates continues to pose challenges for the HSC sector
6.10 As pointed out at paragraph 6.3, the Department’s strategy document “Making
Life Better” provides the context within which health inequalities are to be tackled going forward. It outlines a number of challenges for the health and social care sector in this regard, for example:
• Its role in preventing poor health and promoting healthy living is vital to reduce health inequalities, but also to sustain the sector into the future;
• embedding prevention and early intervention as a normal way of working right across the design and delivery of services;
• adopting a “gradient” approach which will aim to improve universal services as well as more targeted services; and
• working in partnership with other organisations to affect improvements to the conditions which impact on health and wellbeing and health inequalities, and putting in place a whole system approach.
TYC’s shift in emphasis from care provided in hospital based settings to prevention, early intervention and care provided in primary and community settings is an ongoing development and it will be important to ensure that reducing health inequalities is consistently prioritised across localities and communities.
6.11 The primary causes of health inequalities are complex and, although Northern Ireland’s health is improving, as latest

General Report on the Health and Social Care Sector 2012-13 and 2013-14 43
statistics show, the inequality gap in health between most and least deprived areas has been stable since 2006-08. The health and social care services have a clear role to play in improving health inequalities through education and
Concluding Observations
6.12 Health inequalities and high mortality rates are among the most significant challenges facing the HSC sector. Crucially, it is important that those living in the most deprived areas are not more likely to suffer with a life-limiting illness or die younger than those living in the least deprived areas.
6.13 Addressing health inequalities is undoubtedly complex, requiring sustained and targeted action. The fact that health inequalities have become no less steep over the past generation shows that greater focus and persistence will be needed to drive the right interventions. Towards this end, the Department/HSC Board/Trusts must continue their efforts to develop an evidence base of ‘what works’ to reduce health inequalities and to promote effective ways of sharing good practice within and between local areas.
6.14 I expect the Department to provide strong leadership and to continue to monitor the outcomes of those suffering health inequalities. It must also review the effectiveness of relevant current policy and respond to new knowledge about what works to narrow inequalities. As there is an inevitable time lag between public health interventions and outcomes, the Department should pay particular regard to monitoring the implementation of those activities which, in the short term, would be strong indicators of progress.
awareness-raising along with initiatives which focus specifically on early years. In addition, moves towards preventative spending will also be integral in helping to reduce health inequalities.

44 General Report on the Health and Social Care Sector 2012-13 and 2013-14
Part Six:Tackling Health Inequalities

Part Seven:Recovering income from private and paying patients treated on Health and Social Care premises in Northern Ireland

46 General Report on the Health and Social Care Sector 2012-13 and 2013-14
Part Seven:Recovering income from private and paying patients treated on Health and Social Care premises in Northern Ireland
Key Points:
• The number of private, paying and waiting list initiative patients treated on HSC premises has declined over the past ten years;
• Despite the decline in activity, revenue levels have remained fairly static at £5 million to £6 million each year;
• The Department has provided comprehensive guidance to HSC Trusts on recovering income from patients;
• In a sample of cases I examined, I identified areas of non-compliance with Departmental guidance;
• There may be scope for the Department to increase the charges levied on private and paying patients; and
• At 31 March 2014, £2 million patient revenue remained uncollected.
While healthcare services in Northern Ireland are provided to eligible individuals free of charge, additional treatments can be obtained providing appropriate charges are paid
7.1 In Northern Ireland healthcare services can be accessed by eligible individuals free of charge. HSC premises can also be used to treat private, paying and waiting list initiative patients. In very simple terms:
• Individuals deemed to be ordinarily resident in Northern Ireland are entitled to access healthcare services, free of charge (public patients). Where these patients opt for private treatment on HSC premises they are required to pay for use of the HSC facilities and are separately billed by the consultant (private patients);
• Persons living in the Republic of Ireland but working in Northern Ireland who travel home daily or on a regular basis have the same access to free healthcare services as individuals ordinarily resident in Northern Ireland (cross-border workers) providing they are registered with a General Practitioner (GP) in Northern Ireland. Where these patients opt for private treatment on HSC premises they are required to pay for use of the HSC facilities and are separately billed by the consultant (private patients);
• Persons not ordinarily resident in Northern Ireland can opt to receive treatment on HSC premises in Northern Ireland provided they pay the HSC for use of the facilities (paying patients). The charge levied

General Report on the Health and Social Care Sector 2012-13 and 2013-14 47
includes the cost of the consultant. Paying patients have no contract with HSC consultants; and
• Under the Waiting List Initiative, those private sector healthcare firms contracted to treat patients on behalf of the HSC may undertake work on HSC premises. In these cases, the eligible patients access the treatment free of charge and the HSC pays a fee to the private sector healthcare firms (public patients).
7.2 HSC consultants are entitled to undertake private practice provided it is in addition to completing 10 programmed sessions of public work each week. The majority of Northern Ireland consultants who provide privately-funded healthcare services also hold an HSC contract—very few consultants practice exclusively in the private sector. Information on the numbers of consultants registered as undertaking private practice within each HSC Trust is set out in Figure 7.1 below.
7.3 The majority of private practice takes place in independent or private hospitals (which are separate from the public health service) but consultants are permitted to provide private services in HSC hospitals provided prior approval is obtained from the relevant HSC Trust. This section of the report is limited to considering private, paying and waiting list initiative patient activity undertaken on HSC premises. It does not extend to activity in private or independent hospitals.
The number of patients treated privately on HSC premises has fallen over the last 10 years
7.4 For periods prior to 2013-14, it is not possible for all HSC Trusts to identify separately activity levels for private, paying and waiting list initiative patients treated on HSC premises since they did not all maintain individual management information systems for these patient
Figure 7.1: Consultants registered with HSC Trusts to undertake private practice in addition to their public work
HSC Trust Total Number of Consultants employed
Consultants registered with the HSC Trust as undertaking private practice (Note 1)
Belfast 715 190Western 220 19Southern 215 24South Eastern 207 17Northern 212 45
Source: HSC Trusts
Note 1: The Belfast, Western and Northern HSC Trusts do not maintain a central record information of consultants undertaking private practice. The information from these HSC Trusts was obtained from records held in the Paying Patient Offices.

48 General Report on the Health and Social Care Sector 2012-13 and 2013-14
Part Seven:Recovering income from private and paying patients treated on Health and Social Care premises in Northern Ireland
sets. However, information provided by the Department shows that in 2013-14, 3,282 private patients received private treatment on HSC premises (see figure 7.2). This contrasts with 16,000 episodes in 2003-04 (as reported in my previous report26).
7.5 Figure 7.2 shows the activity within each HSC Trust during 2013-14. That year, the Belfast HSC Trust recorded the most private patient episodes. Outpatient attendances accounted for the majority of the Belfast, Western, Southern and
26 NIAO Report: Private in the Health Service,
0
200
400
600
800
1000
1200
1400
1600
South Eastern Trust Northern TrustSouthern TrustWestern TrustBelfast Trust
Total Outpatient Day case Inpatient
Figure 7.2: Private HSC Trust patient episodes by type (2013-14)
Source: DHSSPS Hospital Statistics
Northern Trusts’ activity in the year while in the South Eastern HSC Trust day cases made up most of the patient episodes.
Despite the fall in activity, the level of revenue due has remained fairly static at between £5 million and £6 million each year
7.6 Since inpatient and day cases make up the majority (54 per cent) of private and paying patient activity and typically
26 NIAO Report: Private Practice in the Health Service, HC 1088, Session 2005-06, 18 May 2006

General Report on the Health and Social Care Sector 2012-13 and 2013-14 49
cost more than outpatient work the level of income due each year has remained relatively static – see Figure 7.3.
7.7 The Belfast HSC Trust earns significantly more revenue than any other HSC Trust. This is primarily because the treatments routinely offered by the Belfast HSC Trust (such as cardiac surgery) incur significantly higher costs than the treatments routinely offered by other HSC Trusts. Figure 7.4 overleaf shows that over the seven year period to 31 March
0
2000
4000
6000
8000
2013-142012-132011-122010-112009-102008-092007-08
£000
’s
HSC Private practice revenue (£,000)
Figure 7.3: Overall HSC Trust patient revenue due 2007-08 to 2013-14
Source: HSC Trust accounts and DHSSPS Hospital Statistics
2014, patient revenue amounted to just over £38 million. Almost £26 million of this related to the Belfast HSC Trust.
I examined the adequacy of HSC Trust management of private and paying patient episodes
7.8 Policy on recovering income from patients in Northern Ireland is set by the Department of Health, Social

50 General Report on the Health and Social Care Sector 2012-13 and 2013-14
Part Seven:Recovering income from private and paying patients treated on Health and Social Care premises in Northern Ireland
Services and Public Safety (the Department). The overriding principle of the Department’s guidance to HSC Trusts is that additionally purchased healthcare services should never be subsided by public funds. I selected a sample of 30 patient cases within each HSC Trust and examined the extent to which management of each case was in line with the best practice set out in Departmental guidance. The results of my examination are set out in the following paragraphs.
Confirming the patient’s intention to pay prior to treatment
7.9 Departmental guidance specifies that HSC Trusts must, before providing treatment, obtain confirmation (on a signed “Undertaking to Pay” (UTP) form)
Figure 7.4: Patient revenue by HSC Trust 2007-14 (£’000)
Year Belfast HSC Trust
£’000
Southern HSC Trust
£’000
South Eastern HSC Trust
£’000
Western HSC Trust* £’000
Northern HSC Trust
£’000
HSC (Total)
£’0002007-08 4,458 755 437 385 249 6,2842008-09 4,070 699 430 454 246 5,8992009-10 3,138 891 385 307 169 4,8902010-11 3,333 1,094 347 233 187 5,1942011-12 3,802 997 281 141 191 5,4122012-13 3,944 723 317 364 169 5,5172013-14 3,158 601 329 579 216 4,883
Total 25,903 5,760 2,526 2,463 1,427 38,079Source: HSC Trust Annual Accounts
*Note: The figures for the Western Trust prior to 2012-13 are incomplete due to a change in the organisation’s financial coding systems.
from patients that they, or their Private Medical Insurance (PMI) provider, intends to pay. Failure to obtain confirmation can lead to difficulties where a HSC Trust tries to enforce an outstanding debt. Late receipt of the form limits the ability of the HSC Trust to confirm that the patient has the capacity to pay for their treatment (in the case of self-funders) or that their treatment is covered under the terms of their policy (in the case of PMI patients). In my sample, I found that:
• In 28 of the cases (19 per cent), the signed UTP form was collected after the date the patient was admitted for treatment; and
• In 25 of the 150 cases (17 per cent) examined, no UTP form had been signed by the private patient.

General Report on the Health and Social Care Sector 2012-13 and 2013-14 51
Setting appropriate charges to ensure that the full cost is recovered
7.10 HSC private and paying patients are required to pay for the cost of the treatment they receive. The Department’s guidance27 for calculating patient charges requires HSC Trusts to:
• Use appropriate costing techniques to set charges which cover all elements of hospital treatment and reflect the standard of accommodation available (for example adjusted for single/double rooms).
7.11 From my examination of cases, I noted that there have been positive developments in the costing mechanisms used by HSC Trusts. At 31 March 2014, the Belfast, Western and Southern HSC Trusts determined charges on the basis of average procedure costs. However, there is still room for improvement in the South Eastern and Northern HSC Trusts. The tariffs in place at 31 March 2014 within the Northern HSC Trust and the South Eastern HSC Trust classify (and charge for) operations on the scale of minor, intermediate, major, major plus and complex major.
7.12 I note that legislatively, the Department is permitted to calculate these charges “on any basis that it considers to be the appropriate commercial basis”. In my view, it is also within the terms of the legislation for HSC Trusts to seek to secure an appropriate commercial margin above cost recovery as a way of
26 27
supporting healthcare services through reinvestment. I acknowledge that care needs to be exercised in order to avoid any contravention of compliance with Competition Law.
7.13 I also noted that large differences can exist in the charges levied by HSC Trusts for similar treatments. These variations will be justified in many cases but it is important that HSC Trusts continue to benchmark their individual charges to identify these factors which drive variations.
Recovering income from patients on a timely basis
7.14 HSC Trusts must recover the full cost of treating private and paying patients to ensure that public funds are not used to subsidise private practice. Income received usefully supplements HSC Trust budgets.
7.15 The Department’s guidance requires HSC Trusts to, among other things:
• Obtain a deposit (equal to the full estimated cost of the hospital charge) prior to admission in cases where there is any doubt about the patient’s ability to pay; and
• Seek settlement of accounts before patient discharge.
27 Management of private practice in health service hospitals in Northern Ireland: A handbook, Department of Health, Social Services and Public Safety, November 2007

52 General Report on the Health and Social Care Sector 2012-13 and 2013-14
Part Seven:Recovering income from private and paying patients treated on Health and Social Care premises in Northern Ireland
7.16 During my examination I noted:
• The Belfast HSC Trust routinely secure deposits for high cost treatments;
• Deposits for lower cost treatments are not imposed by any HSC Trust; and
• No HSC Trust demands a deposit where private patient treatment is covered by PMI.
7.17 While I noted that all HSC Trusts offer patients the facility to pay (using cash, cheque, debit or credit card), I found that private and paying patient bills were settled prior to discharge in only four per cent of the cases we examined. I welcome the introduction of revised arrangements within the Southern and Western HSC Trusts (effective from 1 April 2014) which require:
Western HSC Trust:
• All self-paying inpatients and day-case patients to pay a deposit in advance of admission; and
• outpatients to pay in advance of appointments (for a number of clinics or around 70 per cent of all outpatient appointments).
Southern HSC Trust:
• self-paying private practice patients to make full payment of estimated costs prior to discharge.
7.18 In the cases I examined, 50 per cent of Belfast HSC Trust and Western HSC Trust accounts were settled within 90 days of patient discharge. Within the South Eastern HSC Trust, income was recovered in less than 90 days of patient discharge in 47 per cent of cases. In the Northern HSC Trust, although, on average, accounts were settled on average 29 days after the invoice was dispatched, the time between patient discharge and payment was, on average, 165 days. In the Southern Trust, at the time of our audit, 14 of the 30 accounts examined had not been settled. The 16 which were settled were, on average settled within 29 days of the invoice date and 68 days after patient discharge. Figure 7.5 opposite shows the average number of days between patient discharge and payment.
At 31 March 2014, over £2 million revenue due from private and paying patients had not been recovered
7.19 The total income due from patients receiving treatment on HSC premises in 2013-14 amounted to just under £5 million. Figure 7.6 opposite shows that the cumulative outstanding patient debt at 31 March 2014 was just over £2 million.

General Report on the Health and Social Care Sector 2012-13 and 2013-14 53
0
50
100
150
200
250
South Eastern TrustNorthern TrustSouthern TrustWestern TrustBelfast Trust
Day
s
Self-funding private patients PMI private patients
Figure 7.5: Average number of days taken following patient discharge to recover private practice income for sample cases
Source: HSC Trusts
Figure 7.6: Private practice and paying patient income outstanding at 31st March 2014 (£)
Private and Paying Patient Revenue Due in
2013-14
Income outstanding Overall Income outstanding as % of revenue earned
in 2013-14
HSC Trust
Private Patients
Non UK Private /Paying Patients
Total
£s £s £s £sWestern 579,000 31,000 411,000 442,000 76%Southern Note 1 601,000 239,000 619,000 858,000 143%Northern 216,000 37,000 – 37,000 17%Belfast 3,158,000 86,000 515,000 601,000 19%South Eastern 329,000 19,000 133,000 152,000 46%Total HSCNI 4,883,000 412,000 1,678,000 2,090,000 43%
Source: HSC TrustsNote 1: The Southern HSC Trust figures represent the total outstanding debt for private practice/paying patient income for
invoices raised over a number of years. The HSC Trust is working with DLS and BSO Income Shared Services on recovery of the aged debt. The HSC Trust has assessed the recoverability of this debt and made a bad debt provision within its accounts.

54 General Report on the Health and Social Care Sector 2012-13 and 2013-14
Part Seven:Recovering income from private and paying patients treated on Health and Social Care premises in Northern Ireland
Concluding Observations:
7.20 While I note that the Department has provided comprehensive guidance on the arrangements for recovering income from patients, my review has identified areas where HSC Trusts need to improve compliance. More specifically, HSC Trusts should ensure that:
• In all cases, a signed UTP form is received prior to treatment;
• All HSC Trusts determine charges on the basis of the average cost of procedures;
• Payment is sought from self-pay patients prior to discharge; and
• Issue invoices for all outstanding revenue promptly.
7.21 In my view, it is within the terms of the legislation for Trusts to seek to secure an appropriate commercial margin above cost recovery as a way of supporting healthcare services through reinvestment. While I acknowledge that care needs to be exercised in order to avoid any contravention of compliance with Competition Law, I recommend that the Department benchmarks HSC Trust charges against private sector provider charges and, if appropriate, revises its charging advice to HSC Trusts.

Part Eight:Transforming Your Care

56 General Report on the Health and Social Care Sector 2012-13 and 2013-14
Part Eight:Transforming Your Care
Key Points
• The service delivery model recommended by the Transforming Your Care (TYC) Review proposes shifting care (and therefore resources) from hospital-based settings to prevention, early intervention and care provided in primary and community settings.
• The TYC Review estimated that transitional funding of £70 million would be required to implement the new service model.
• As set out in the TYC Strategic Implementation Plan, the pace of change will be influenced by financial circumstances. Implementation may be achieved slightly more quickly or slightly more slowly depending on the level of resources available.
The Transforming Your Care model, proposing a cultural shift in the delivery of health and social care services, was launched in 2011
8.1 “Transforming Your Care: a Review of Health and Social Care in Northern Ireland” (TYC) was commissioned by the Northern Ireland Minister for Health. The Review was overseen by an Independent Review Team, chaired by John Compton, then Chief Executive of the HSC Board, who was asked to lead the review in an ex-officio capacity. The results were published in December 2011.
8.2 TYC proposes a major strategic and cultural shift in HSC provision, moving services and associated resources from hospital based settings to primary and community based prevention, early intervention and care services. Transitional funding of £70 million was identified as required to facilitate
the TYC reform. The HSC Board has responsibility for implementing the required service delivery changes.
8.3 The proposed model was intended to address the challenges which the health and social care sector will face in the future:
• A growing and ageing population;
• Increased prevalence of long term conditions;
• Increased demand and over reliance on hospital beds;
• Clinical workforce supply difficulties which have put pressure on service resilience; and
• The need for greater productivity and value for money.
General Report on the Health and Social Care Sector 2012-13 and 2013-14 57
8.4 The 2011 report anticipated that the TYC model for integrated health and social care would address 11 key factors as follows:
• The need to be better at preventing ill health;
• The importance of patient centred care;
• Increasing demand in all programmes of care;
• Current inequalities in the health of the population;
• Giving our children the best start in life;
• Sustainability and quality of hospital services;
• The need to deliver a high quality service based on evidence;
• The need to meet the expectations of the people of NI;
• Making best use of resources available;
• Maximising the potential of technology; and
• Supporting the workforce.
TYC involves various budget redistributions and significant capital expenditure
8.5 The shift in care from hospital based settings to prevention, early intervention and care provided in the primary and community settings envisaged under TYC involves budget redistributions estimated at £83 million as follows:
• a five per cent reduction in the hospital services budget (from £1,733 million to £1,650 million);
• a two per cent increase in the Personal and Social Services (PSS) budget (from £903 million to £924 million);
• a three per cent increase in the Family Health Services and Primary Care Services (from £871 million to £892 million); and
• a nine per cent increase in the Community Services (from £477 million to £518 million).
8.6 The original business case identified a selection of projects as particularly relevant to the delivery of TYC. The required capital investment of these projects was estimated at more than £500 million. Investment in HSC capital programmes is overseen by the Health Investment Board. TYC capital investment to date has totalled £57 million on a number of projects including:

58 General Report on the Health and Social Care Sector 2012-13 and 2013-14
Part Eight:Transforming Your Care
28 Transitional funding was estimated at £70 million or £85 million including Quality Improvement Cost Reduction/ Voluntary Redundancy/ Voluntary Early Retirement (QICR/VR/VER)
29 “Invest to Save” of £19 million was provided in 2012-13. Of this, £9 million was allocated to TYC and the remaining £10 million was allocated to HSC saving initiatives.
• provision of 24/7 Percutaneous Coronary Intervention facilities at the Royal Group of Hospitals, Belfast and Altnagelvin Hospital, Londonderry;
• provision of Health and Care Centres in Ballymena and Banbridge; and
• enhancement of Emergency Department facilities at Antrim Area Hospital.
Several other projects are currently at the planning stage.
By 31 March 2014, £28.4 million has been invested in TYC against an initially identified requirement of £70 million
8.7 The TYC Business Case anticipated deployment of the £70 million28 transitional funding to pump prime service reforms and result in a balanced financial position by the end of 2014-15 (see Figure 8.1). Recurrent net benefits of £50 million each year were expected to be realised from 2016-17 onwards after self-financing the ongoing recurrent costs of the reforms.
28 28
Figure 8.1: TYC anticipated transitional funding
Project Year Financial Year £ million1 2012-13 252 2013-14 253 2014-15 20
Total 70
Source: TYC: A Review of Health and Social Care in Northern Ireland
8.8 “Invest to Save” funding for TYC and HSC savings initiatives in 2012-13 amounted to £19 million. Funding in 2013-14 was considerably less than anticipated at £6.15 million. That represents a shortfall of £18.85 million. Details of the funding allocated (against relevant budgets) are set out in Figure 8.2.
8.9 In its 2013-14 Annual Accounts, the HSC Board acknowledged that progress in terms of the shift left of resources has been slower than anticipated. In addition, it noted that “there continues to be a risk that a lack of consensus on the implementation of TYC may impede delivery of the reforms”. The HSC Board is mitigating the risk through regular dialogue and collaboration across a range of stakeholders within and out with HSC organisations.
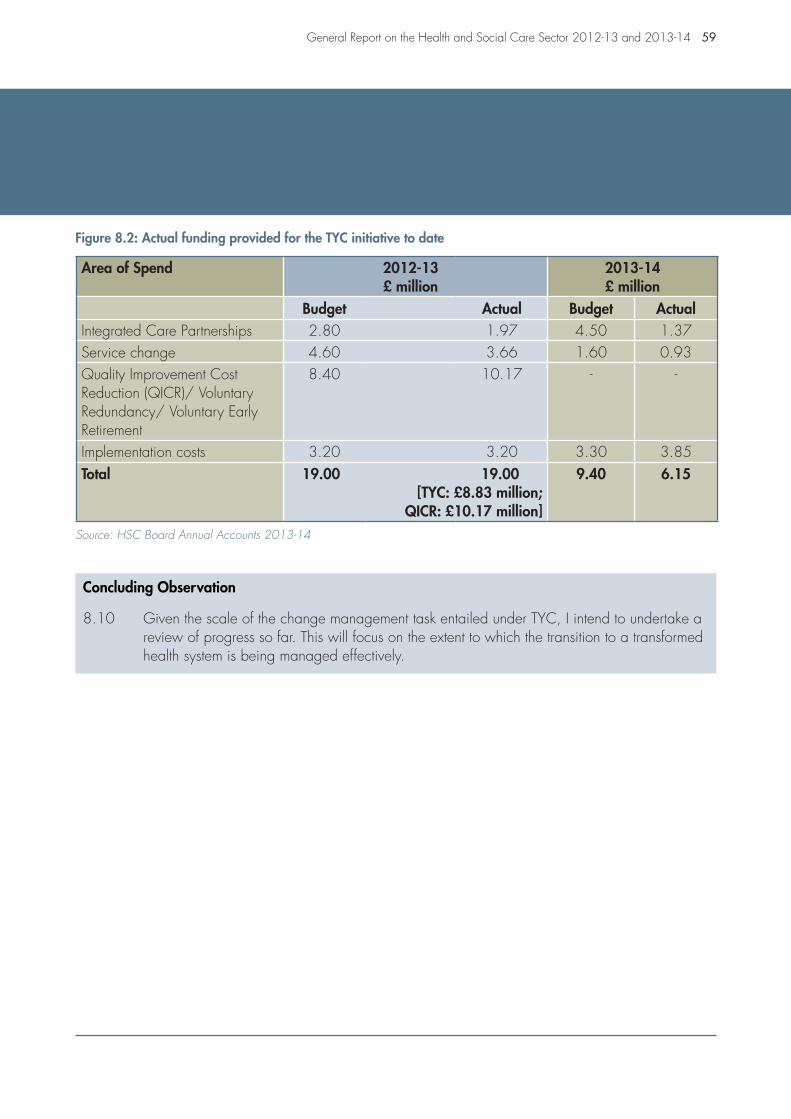
General Report on the Health and Social Care Sector 2012-13 and 2013-14 59
Figure 8.2: Actual funding provided for the TYC initiative to date
Area of Spend 2012-13£ million
2013-14£ million
Budget Actual Budget ActualIntegrated Care Partnerships 2.80 1.97 4.50 1.37Service change 4.60 3.66 1.60 0.93Quality Improvement CostReduction (QICR)/ Voluntary Redundancy/ Voluntary Early Retirement
8.40 10.17 - -
Implementation costs 3.20 3.20 3.30 3.85Total 19.00 19.00
[TYC: £8.83 million; QICR: £10.17 million]
9.40 6.15
Source: HSC Board Annual Accounts 2013-14
Concluding Observation
8.10 Given the scale of the change management task entailed under TYC, I intend to undertake a review of progress so far. This will focus on the extent to which the transition to a transformed health system is being managed effectively.


Part Nine:Serious Adverse Incidents and Clinical Negligence

62 General Report on the Health and Social Care Sector 2012-13 and 2013-14
Part Nine:Serious Adverse Incidents and Clinical Negligence
Summary of Key Points
• Approximately 83,000 adverse incidents are reported each year. In the two year period to 31 March 2014, 828 serious adverse incidents were reported to the HSC Board.
• In the five years to 31 March 2014, over 970 clinical and social care negligence claims were settled incurring costs of just under £160 million.
• At 31 December 2013, the HSC Board reported that almost 2,800 clinical and social care negligence cases remained unsettled. At 31 March 2014, the anticipated liability on outstanding claims was estimated at just over £121 million.
• Within the Northern HSC Trust, a Turnaround Team was appointed to address the poor performance in unscheduled care. The Turnaround Team had significant concerns which extended beyond the Emergency Department. Ultimately, 20 cases were identified where the quality of care provided and/or the response when things went wrong, fell far below the standard which would be expected. A further 11 patients were also recalled for x-rays.
• Pressures within the Royal Victoria Hospital (RVH) Emergency Department led to the declaration of “a major” incident in January 2014. Eight doctors highlighted the severe challenges facing staff and several patients reported having to wait in excess of 25 hours before receiving treatment. On foot of these events, RQIA inspected the RVH Emergency Department, reviewed arrangements for the management and co-ordination of unscheduled care in the Belfast HSC Trusts and across Northern Ireland. RQIA identified several areas where improvement was required, including a “bullying” culture.
While most people access HSC services without incident, sometimes thing go wrong
9.1 The vast majority of HSC patients and clients access services without incident. However, in some cases, things do go wrong. An event or circumstance that could have or did lead to harm, loss or damage to people, property, environment or reputation arising during the course of the business of a HSC
organisation/ Special Agency or commissioned service is referred to as an Adverse Incident (AI).
Around 83,000 adverse incidents are reported each year in HSC bodies
9.2 Approximately 83,000 adverse incidents (AIs) are reported each year by HSC organisations in Northern Ireland.

General Report on the Health and Social Care Sector 2012-13 and 2013-14 63
Information on these is retained within the body of HSC Trust unless the incident is so serious that it merits categorisation as a Serious Adverse Incident (SAI). Guidance has been provided to all HSC bodies on when an AI should be categorised as an SAI. Only a minority of AIs will warrant categorisation as SAIs.
9.3 Responsibility for managing Serious Adverse Incident (SAI) reporting falls to the HSC Board in partnership with the Public Health Agency. If properly managed, the serious adverse incident reporting system can reduce the risk that
incidents recur. Accordingly the HSC Board reviews information on all SAIs and, where appropriate, disseminates learning points across the HSC sector.
Less than one per cent of reported adverse incidents are classified as serious
9.4 Figure 9.1 shows that in the two year period to 31 March 2014, 828 SAIs were reported to the HSC Board. Almost all (over 90 per cent) of reported SAIs (761) originated from one of the five non-regional HSC Trusts.
Figure 9.1: SAIs reported by HSC bodies in the two year period to 31 March 2014
Serious Adverse Incidents April – September
2012
October – March
2013
April – September
2013
October – March 2014
Total for the two year period
to March 2014
Northern HSC Trust 29 48 56 98 231
Belfast HSC Trust 45 49 35 70 199
Southern HSC Trust 15 25 28 47 115
South Eastern HSC Trust 23 34 19 38 114
Western HSC Trust 18 26 27 31 102
Public Health Agency 1 15 0 14 30
Primary Care 5 2 15 1 23
Northern Ireland Ambulance Service
3 4 2 1 10
HSC Board 1 1 1 0 3
Voluntary Bodies 1 0 0 0 1
Business Services Organisation 0 0 0 0 0
Total 141 204 183 300 828Source: HSC Board Learning Reports
64 General Report on the Health and Social Care Sector 2012-13 and 2013-14
Part Nine:Serious Adverse Incidents and Clinical Negligence
30 On 14 November 2012, the Public Accounts Committee of the Northern Ireland Assembly held an inquiry into the Safety of Services Provided by Health and Social Care Trusts. The Committee’s report on the inquiry was published on 27 February 2013 (NIA 102/11-15).
31 HSC Staff Survey 2012
32 Turnaround Support for Northern Health and Social Care Trust 11 June 2013
9.5 In 2012, the Department told the Public Accounts Committee (the Committee) that under-reporting continues to be a widespread issue, particularly in the acute sector30. The Committee concluded that Trusts were not maximising the potential to learn when things go wrong and warned that the public trust in the safety and effectiveness of care could be seriously undermined.
9.6 One possible reason for under-reporting is the presence of a perceived “blame culture”. The most recent HSC Staff Survey31 (2012) reports that only 42 per cent of staff agree that their organisation does not blame or punish people involved in errors, near misses or incidents. Overall, 12 per cent considered that individuals involved were blamed or punished while 43 per cent neither agreed nor disagreed. The Committee was shocked to discover that nurses, or any medical staff who are well placed to advise on patient safety, should have reservations about raising concerns.
9.7 The Department acknowledged that an open and fair culture would ensure that individuals feel free to speak up and challenge the safety of treatment or care provided. It told the Committee that all health and social care staff have been reminded that the leadership within their organisation should promote a culture in which everyone can challenge everyone else.
30 30
30 31
Significant concern over the performance of the Northern HSC Trust has been raised in the two year period to March 2014
9.8 In 2013, the Department commissioned a Turnaround Team to determine the changes required to accelerate performance improvement in unplanned care in the Northern HSC Trust. Initially the review was confined to unplanned care but, as work progressed, it became clear to the Turnaround Team that the cause of the poor performance was not confined to the Emergency Departments.
9.9 In June 2013, the Turnaround Team reported32 that the HSC Trust was “in a poor position in relation to performance” and had “sub-optimal capacity to improve placing the HSC Trust in a category that requires intensive support to improve”. The Turnaround Team recommended and embarked on a three phase Improvement Plan.
9.10 In March 2014, it was revealed that the HSC Trust had identified 20 cases (including 11 deaths) during the period 2008 to 2013 where the quality of care provided and/or the response when things went wrong, fell far below the standard which would be expected. The majority of the cases came to light when serious adverse incidents, complaints and clinical negligence claims were reviewed.
30 32
General Report on the Health and Social Care Sector 2012-13 and 2013-14 65
9.11 The HSC Trust also identified the need to recall nine patients following a review of around 35,000 X-rays from the Causeway Hospital during 2011 and 2012. An extension of the review to all Northern HSC Trust hospitals led to the recall of a further two patients. There are no outstanding actions with respect to patients who were identified by the HSC Trust.
The Performance of the Belfast HSC Trust has also attracted significant attention
9.12 On 8 January 2014, a ‘major incident’ was declared at the Royal Victoria Hospital (RVH) following a period of sustained pressure within the Emergency Department. Less than one month later (on 28 January 2014), the Regulation and Quality Improvement Authority (RQIA) received a letter, signed by eight doctors working in the RVH’s Acute Medical Unit (AMU), which stated that:
“The situation within AMU is worsening and it is our belief that our ability to stand over the quality and safety of many patients under our care is critically compromised through an organisational inability to track and allocate patients to clinical teams in a sustainable and safe manner”.
The letter raised specific concerns over:
• The level of medical staffing within the AMU team; and
• The system’s inability to consistently code and track patients correctly as they are moved within and across Belfast HSC Trust hospitals.
9.13 On 30 January 2014 the Minister asked RQIA to carry out an inspection of the Emergency Department and Acute Medical Unit of the RVH at the earliest opportunity. The remit of the inspection was ultimately extended to include a review of the arrangements for management and co-ordination of unscheduled care in the Belfast HSC Trust and across Northern Ireland.
9.14 RQIA carried out its RVH inspection from 31 January to 3 February 2014. It concluded that the decision to declare a ‘major incident’ was appropriate. It also concluded that arrangements within the Belfast HSC Trust Emergency Departments were having a considerable impact on the experience of patients and were creating risks in ensuring patients’ safety. In particular, RQIA noted that:
• Staff were experiencing very significant challenges in ensuring the smooth flow of patients across the hospital;
• There were staff shortages in critical areas; and
• Many patients were being cared for in areas outside those designed to provide treatment and care.
9.15 In terms of the regional co-ordination of unscheduled and emergency care

66 General Report on the Health and Social Care Sector 2012-13 and 2013-14
Part Nine:Serious Adverse Incidents and Clinical Negligence
across Northern Ireland, RQIA identified that there were inconsistencies in referral arrangements where a primary care patient requires hospital-based assessment and/or unscheduled emergency care.
9.16 RQIA interviewed various members of staff during the inspection. Inspectors were told by staff that:
• They felt “stressed; exhausted; demoralised; not appreciated; that no-one is listening; and they have a poor work-life balance”;
• There was a “bullying culture”;
• They have concerns about being disciplined;
• No action is taken when they report issues; and
• At times, “there is no time to deliver basic patient care, and ...patients have little privacy or dignity”.
9.17 RQIA concluded that there was a need for immediate action to relieve pressure on staff and to reduce risk in critical areas. Several recommendations for improvement were set out.
9.18 Reports about continuing pressures within Belfast HSC Trust Emergency Departments (including trolley waits in excess of 25 hours) continued throughout the period to March 2014.
The cost of settling clinical and social care negligence cases in the five years to 31 March 2014 amounted to just under £160 million
9.19 In terms of the financial outcome of harm to patients and clients, the only actual figure available is the cost of compensating those who pursue a claim for clinical and social care negligence. Figure 9.2 shows that in the five years to 31 March 2014, over 970 clinical
Figure 9.2: The volume and cost of settling clinical and social care negligence claims over the five year period to March 2014
Year Number of Cases
Compensation Plantiff Cost Defence Costs
DLS Cost Total Costs
£million£ million £ million £million £million2009-10 151 9.6 4.4 1.9 1.1 17.02010-11 184 23.6 4.0 2.7 1.0 31.32011-12 192 18.1 7.1 2.1 1.1 28.42012-13 220 19.5 4.8 2.3 1.2 27.82013-14 226 38.5 10.6 3.3 1.1 53.5Total 973 109.3 30.9 12.3 5.5 158.0
Source: Directorate of Legal Services (DLS)

General Report on the Health and Social Care Sector 2012-13 and 2013-14 67
and social care negligence claims were settled incurring costs of just under £160 million.
The cost of settling those cases outstanding at 31 March 2014 is estimated to be around £121 million
9.20 At 31 March 2014, almost 2,800 clinical and social care negligence cases remained open in Northern Ireland. It estimated that the total clinical and social care negligence liability at 31 March 2014 is just over £121 million. See Figure 9.3.
Figure 9.3: Estimated clinical and social care negligence liability at 31 March 2014
HSC Body Clinical and Social Care Negligence Liability at
31 March 2014 £million
Northern HSC Trust 25.2Belfast HSC Trust 43.9Southern HSC Trust 21.5South Eastern HSC Trust 25.6Western HSC Trust 5.1Northern Ireland Ambulance Service 0.1Total 121.4
Source: 2013-14 HSC Trust Annual Accounts
Concluding Observations
9.21 As pressure escalates across HSC Trusts, the risk of patient injury increases. Where a patient sustains injury through an interaction with health and social care services, it can:
• create considerable distress for the patient, their family and staff;
• result in the need for the patient to receive additional treatment or care; and/or
• lead to a costly clinical and social care negligence claim.
9.22 Ensuring that adverse incidents are identified and reported, is central to the learning process so that potential harm to patients can be avoided in the future. However, given the experience of the Turnaround Team in the Northern Trust and the RQIA inspection findings in the Belfast Trust, the culture within HSC bodies is still one of concern. Changing the culture within the HSC sector from one of fear to an eagerness to report, explain and learn from what went wrong will only happen through cultural change.
9.23 In building such a culture, HSC Trusts will also need to provide staff with ongoing support, training and mentorship.


Part Ten:The administration and safeguarding of clients’ andresidents’ monies

70 General Report on the Health and Social Care Sector 2012-13 and 2013-14
Part Ten:The administration and safeguarding of clients’ andresidents’ monies
Key Points:
• I qualified my opinion on the Belfast HSC Trust 2007-08 and 2008-09 Patients’ and Residents’ Monies Accounts.
• Internal Audit (IA) provided only limited assurance on the system of internal control over patients’ private property in the Belfast HSC Trust Mental Health and Learning Disability wards in 2013-14.
• IA provided limited assurance over the Management of Client Monies at five of the 44 independent homes/supported living facilities visited across Northern Ireland.
• A case of financial abuse has been uncovered within the Northern HSC Trust.
Background
10.1 The Department’s Residential and Nursing Care Homes Minimum Standards (The Standards) specify the arrangements required within residential and nursing care homes to ensure provision of a quality service. The Standards outline the arrangements necessary to safeguard clients’ and residents’ money and other valuables during their stay.
10.2 In my 2008 General Health Report33 I reported that the weaknesses in controls and procedures I identified in this area were so significant that I qualified my opinion on the Belfast HSC Trust 2007-08 and 2008-09 Patients’ and Residents’ Monies Account. My report also referred to instances of theft from clients and residents and instances where the return of money/valuables to patients was not receipted.
33 33
Problems also exist in some HSC Trust facilities
10.3 Internal Audit (IA) provided limited assurance on the system of internal control over patients’ private property in the Belfast HSC Trust Mental Health and Learning Disability wards in 2013-14. IA noted that checks were not in place to verify whether patients were receiving those benefits to which they were entitled. IA was also critical of the fact that approaches to managing patients’ private property varied across sites.
The Trusts’ Internal Auditors have been active in visiting independent homes and facilities
10.4 In 2013 Internal Audit (IA) assessed the quality of controls over clients’ and residents’ monies and valuables in 44
33 General Report on the Health and Social Care Sector in Northern Ireland – 2008 NIA 132/08-09 10 June 2009

General Report on the Health and Social Care Sector 2012-13 and 2013-14 71
independent homes/supported living facilities across Northern Ireland. In most facilities, a satisfactory level of assurance was given by IA. However, in five facilities, IA gave a limited assurance. Some of the more significant weaknesses included:
• Several cases where homes’ management were not reconciling residents’ ledger accounts and bank accounts and were not performing checks on cash withdrawals from residents’ bank accounts;
• Instances where residents’ benefits were lodged into the main business account of the home rather than into the resident’s account;
• Several instances of poor record keeping;
• Instances where payments to residents were not receipted or where evidence (e.g. receipts) to support expenditure was not available; and
• One case where a resident’s ledger could not be found. Over the period from April 2012 to May 2013, several payments had been made from this resident’s bank account to various mobile network providers and cash (of around £200-£550 per month) had been withdrawn. No evidence was available to support the payments.
10.5 In a separate audit assignment, commissioned in addition to IA’s annual sampling of homes, IA identified several cases where monies properly due to residents were retained by the home and cases where residents’ money was used to cover costs within the home. In one home, over the period from April 2007 to December 2012, IA identified that purchases totalling £30,503, which should have been funded by the home, were charged to residents.
Failings in safeguarding the finances of a HSC Trust service user who was in receipt of a care package and living independently
10.6 In September 2013, the Northern HSC Trust, having concerns about the financial affairs of a service user:
• reported the circumstances of the case as a Serious Adverse Incident;
• asked IA to review the Mental Health Directorate’s governance and internal control arrangements in place in respect of the Service User’s case; and
• commenced an Adult Safeguarding review, a Social Care Governance review and a disciplinary investigation. The HSC Trust assured me that the care needs of the client have now been assessed and that an appropriate package of care is in place. The client’s needs are now kept under regular review.

72 General Report on the Health and Social Care Sector 2012-13 and 2013-14
Part Ten:The administration and safeguarding of clients’ andresidents’ monies
10.7 IA’s review of the case identified a number of significant issues. More specifically, IA:
• found that since 2002, the service user had incorrectly been charged for support provided by the HSC Trust;
• confirmed that the inappropriate charging had gone undetected since 2002 (raising governance issues and highlighting weaknesses in procedures);
• was concerned over the nature (and oversight of) spending incurred on behalf of the Service User, and the poor standard of associated record keeping; and
• identified that support workers had been named as beneficiaries in the Service User’s will.
10.8 The HSC Trust’s procedures are currently being revised, disciplinary actions are underway and the case has been referred to Counter Fraud and Probity Services and other relevant public bodies.
10.9 This is a difficult case, where HSC Trust procedures have failed to protect a vulnerable individual. I will keep progress under review and report further in due course.
Concluding Observations
10.10 It is concerning that, despite clear minimum standards for administration of residents’ and clients’ money being in place for some years now, some facilities still are not applying them. There is a danger, to say the very least, that when these standards are not applied residents and clients are exposed to the risk of financial abuse.
10.11 I acknowledge that the system of RQIA inspections and IA review has been successful in identifying instances of non-compliance within homes. I note that where issues have been identified, HSC Trusts have drawn up action plans for improvement.
10.12 However, it is of significant concern that inappropriate charging and poor control over patients’ finances went undetected for a period of 10 years.

Part Eleven:HSC Business Services Transformation Project
74 General Report on the Health and Social Care Sector 2012-13 and 2013-14
Part Eleven:HSC Business Services Transformation Project
Key Points:
• By September 2013, the Finance, Procurement and Logistics (FPL) system had been implemented across all 16 HSC sector bodies although a number of key activities and work streams remained to be completed.
• The Human Resources, Payroll, Travel and Subsistence System (HRPTS) has experienced problems, delays and cost overruns. By September 2014, the shared service centre had responsibility for only half of all HSC staff.
• The total cost of the Business Services Transformation Project (BSTP) is estimated at just under £38 million over a 12 year period. It is anticipated that implementation of the project will release savings of £120 million. A ‘Benefits Realisation Project’ was established in September 2014 to ensure that the benefits are achieved and maximised.
34 General Report on the Health and Social Care Sector by the Comptroller and Auditor General for Northern Ireland 2010 & 2011: 6 December 2011
The HSC Business Services Transformation Project (BSTP) was intended to increase operational effectiveness across the HSC sector in a range of business functions
11.1 In my December 201134 General Health report, I outlined the background to the Shared Services Initiative (to be developed through the Business Services Transformation Project (BSTP)) in the health and social care sector. To recap, several of the finance-related systems in place were more than 20 years old. Although the historic failure rate of the systems was low, the cost of maintaining them was rising over time.
11.2 The BSTP was intended to increase operational effectiveness in a range of business functions by making greater use of modern technology, standardising processes and introducing organisational improvements. Responsibility for the Business Services Transformation Project
34 34
was allocated to the Business Services Organisation (BSO), which was established to provide support services to the health and social care sector. Its role was to:
• procure and implement a new system for managing finance, procurement and logistics (the FPL system) across the HSC sector;
• procure and implement a new system for managing human resources, payroll and travelling expenses (the HRPTS system) across the HSC sector;
• replace systems for the payment of contractors within family practitioner services; and
• identify and commission suitable sites for shared services centres.
11.3 The BSTP programme was originally budgeted to cost £28.3 million over
General Report on the Health and Social Care Sector 2012-13 and 2013-14 75
a 12 year period and release savings of £120 million. In November 2013, the budget was increased by £9.5 million. Therefore the total BSTP stands at £37.8 million. The Department told me that a Benefits Realisation Project was established in September 2014 to ensure that the benefits realised from the new systems and the introduction of Shared Services are maximised. In my previous report I commented that strong leadership and substantial capital investment would be crucial to the delivery of these developments.
The Finance, Procurement and Logistics (FPL) System was implemented by September 2013 and resulted in a small overspend35
11.4 Initial deployment of the FPL system within a number of HSC organisations in autumn 2012 caused various stability and functionality issues36. In view of the difficulties experienced, further deployments were postponed from December 2012 until summer 2013. By September 2013, the FPL system had been implemented across all 16 HSC sector bodies although a number of key activities and work streams remained to be completed. The FPL project has cost slightly more than was originally estimated.
11.5 Shared Services have now been established and are responsible for all HSC payments and receipts as follows:
34 35
34 36
• Accounts Payable Shared Services (APSS) are responsible for all HSC organisation payment activities. In terms of payments, the APSS processes approximately 95,000 supplier invoices each month with a value of around £115 million and various manual payments requested by HSC organisations; and
• Accounts Receivables Shared Services (SSAR) are responsible for all income activities. The SSAR is responsible for the creation of approximately 3,000 HSC invoices per month with a value of around £21 million and manages all HSC debt.
The Human Resources, Payroll, Travel and Subsistence System (HRPTS) has experienced problems, delays and cost overruns
11.6 Implementation of the HRPTS was initially expected to commence in September 2012. Full completion was expected by November 2012. However, issues regarding the design of the system arose and it was agreed that, initially, the system would be piloted in BSO and regional organisations prior to its roll out to other organisations in May 2013. The HRPTS pilot went live in BSO in December 2012.
11.7 “Go-live” in the Western HSC Trust was postponed from May 2013 until September 2013 due to the failure
35 While the Department is content that global estimated and actual costs of the BSTP project are released, at that stage, due to commercial confidentiality reasons, it is not appropriate to disclose spend on individual element of the overall project.
36 Business Services Organisation, Belfast HSC Trust and Western HSC Trust and the regional bodies

76 General Report on the Health and Social Care Sector 2012-13 and 2013-14
Part Eleven:HSC Business Services Transformation Project
of a critical interface between the FPL system and the HRPTS and the need for additional functionality. HRPTS was rolled out to the remaining HSC Trusts between November 2013 and March 2014. The HRPTS project cost has cost significantly more than originally estimated.
11.8 The Northern Ireland Assembly and the media have taken a keen interest in difficulties experienced in processing the correct salary and wages payments of HSC sector staff under the new HRPTS. Difficulties have included:
• In April 2014, following a mandatory systems upgrade, just over 7,500 HSC staff had incorrect national insurance contributions deducted from their pay. Approximately £817,000 had to be repaid to staff. The total value of errors amounted to just over £800,000 (less than one per cent of the overall HSC monthly payroll cost). The Department has received assurances from the supplier that the systems errors which caused the calculation error will not reoccur;
• Incorrect tax codes were applied to almost 5,000 HSC staff salaries in April 2014 resulting in the overpayment of tax contributions;
• Although the HSC pension scheme contribution rates changed on 1 April 2014, there was a delay in applying the new rates. This resulted in the under-deduction of pension contributions from employees; and
• Delays in use of the self-service module of the system, increasing the administrative burden on staff and increasing the risk of human error and delay.
Delays have been experienced with the establishment of the Shared Service Centre for Payroll, Travel and Subsistence. By September 2014, the shared service centre had assumed responsibility for only half of all HSC sector staff
11.9 BSO anticipated that the shared service centre responsible for Payroll, Travel and Subsistence (PAYSS) would have assumed responsibility for all HSC sector staff by the end of March 2014. By September 2014 the shared service centre was responsible for processing payroll (and related areas) for approximately half of all HSC sector staff. By February 2015, BSO had assumed responsibility for processing payroll for all HSC staff.
11.10 The payroll solution for the HSC is complex given that in addition to normal weekly, fortnightly and monthly salary calculations arrangements are required to cope with weekly shift patterns, nurse bank arrangements and the need to integrate information from multiple rostering systems. The PAYSS is currently responsible for the payment of approximately 85,000 employee transactions with a value of around £100 million each month.

General Report on the Health and Social Care Sector 2012-13 and 2013-14 77
The transfer of Recruitment and Selection Services is due to be completed by Autumn 2015
11.11 The final stage of the Shared Services Initiative is the transfer of Recruitment and Selection Services from HSC bodies. By January 2015 the Recruitment Services
37 Report on Account NI: Review of a Public Sector Financial Shared Service Centre 9 April 2014 (NIA 173/11-15).
Shared Services Centre (R&S SSC) had taken over responsibility for recruitment and selection of BSO and Regional Organisations and the Southern HSC Trust. The Department expects that Recruitment and Selection Services will be fully transferred from all HSC bodies to the R&S SSC by autumn 2015.
Concluding Observations
11.12 Significant progress has been made in implementing the BSTP. A major challenge for the Department and BSO will be to provide evidence that:
• the project was effectively managed;
• the intended benefits of the project have been realised; and
• the anticipated revenue savings of £120 million have been generated.
11.13 The Public Accounts Committee has previously37 made it clear that it expects post-completion evaluations to explicitly cover these areas. I intend to continue to review this project as it progresses further.

78 General Report on the Health and Social Care Sector 2012-13 and 2013-14
NIAO Reports 2014-2015
Title Date Published
2014
The Future Impact of Borrowing and Private Finance Initiative Commitments 14 January 2014Improving Pupil Attendance: Follow-Up Report 25 February 2014Belfast Metropolitan College’s Titanic Quarter PPP Project 25 March 2014Safer Births: Using Information to Improve Quality 29 April 2014Continuous Improvement Arrangements in Policing 6 May 2014Improving Social Housing through Stock Transfer 3 June 2014Managing and Protecting Funds Held in Court 1 July 2014Modernising benefit delivery in the Social Security Agency’s local office network 11 November 2014Local Government Auditor’s Report - 2014 18 November 2014Primary Care Prescribing 27 November 2014Financial Auditing and Reporting: General Report by the Comptroller and Auditor General for Northern Ireland – 2014 9 December 2014
2015
Continuous improvement arrangements in policing 17 February 2015Cross-border broadband initiative: the Bytel Project 3 March 2015Protecting Strangford Lough 31 March 2015DRD: the effectiveness of public transport in Northern Ireland 21 April 2015


Published and printed by CDS
CDS 133933
9 7 8 1 9 1 0 2 1 9 8 6 7
ISBN 978-1-910219-86-7