Embed Size (px)
Citation preview
Fourth Quarter and Full Year 2017 Results March 26th, 2018
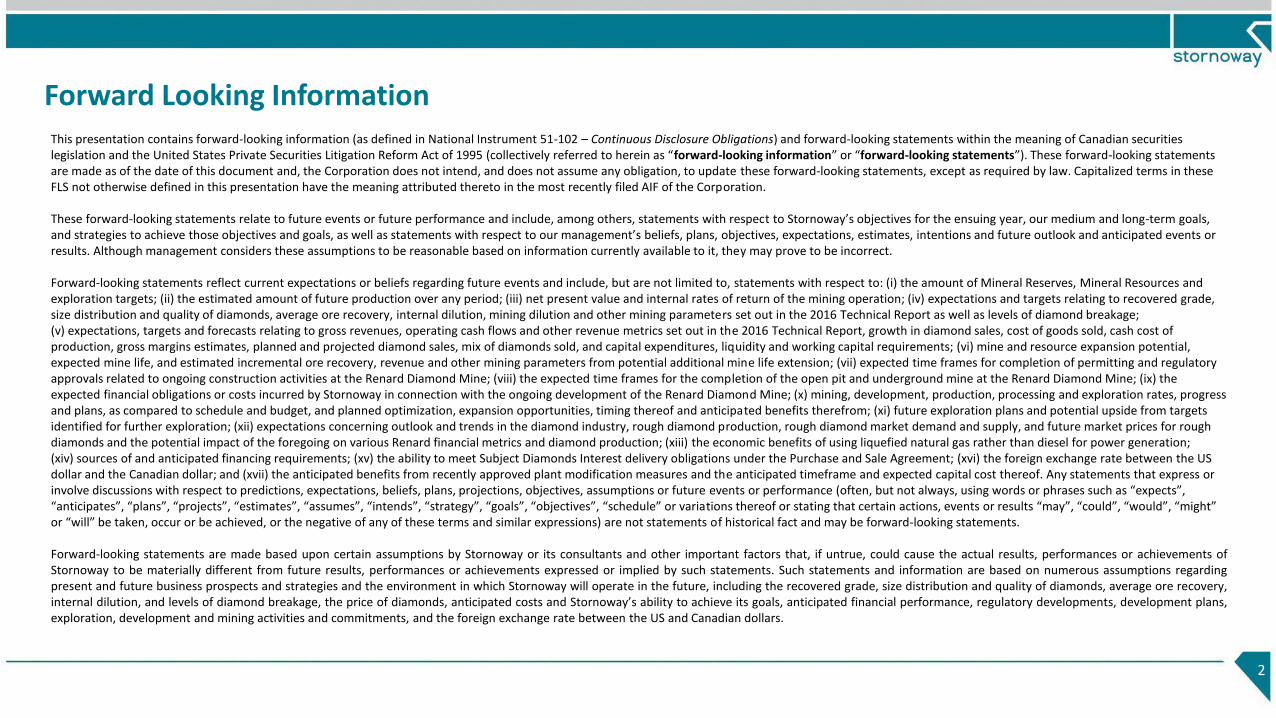
Forward Looking Information
2
This presentation contains forward-looking information (as defined in National Instrument 51-102 – Continuous Disclosure Obligations) and forward-looking statements within the meaning of Canadian securities legislation and the United States Private Securities Litigation Reform Act of 1995 (collectively referred to herein as “forward-looking information” or “forward-looking statements”). These forward-looking statements are made as of the date of this document and, the Corporation does not intend, and does not assume any obligation, to update these forward-looking statements, except as required by law. Capitalized terms in these FLS not otherwise defined in this presentation have the meaning attributed thereto in the most recently filed AIF of the Corporation.
These forward-looking statements relate to future events or future performance and include, among others, statements with respect to Stornoway’s objectives for the ensuing year, our medium and long-term goals, and strategies to achieve those objectives and goals, as well as statements with respect to our management’s beliefs, plans, objectives, expectations, estimates, intentions and future outlook and anticipated events or results. Although management considers these assumptions to be reasonable based on information currently available to it, they may prove to be incorrect.
Forward-looking statements reflect current expectations or beliefs regarding future events and include, but are not limited to, statements with respect to: (i) the amount of Mineral Reserves, Mineral Resources and exploration targets; (ii) the estimated amount of future production over any period; (iii) net present value and internal rates of return of the mining operation; (iv) expectations and targets relating to recovered grade, size distribution and quality of diamonds, average ore recovery, internal dilution, mining dilution and other mining parameters set out in the 2016 Technical Report as well as levels of diamond breakage; (v) expectations, targets and forecasts relating to gross revenues, operating cash flows and other revenue metrics set out in the 2016 Technical Report, growth in diamond sales, cost of goods sold, cash cost of production, gross margins estimates, planned and projected diamond sales, mix of diamonds sold, and capital expenditures, liquidity and working capital requirements; (vi) mine and resource expansion potential, expected mine life, and estimated incremental ore recovery, revenue and other mining parameters from potential additional mine life extension; (vii) expected time frames for completion of permitting and regulatory approvals related to ongoing construction activities at the Renard Diamond Mine; (viii) the expected time frames for the completion of the open pit and underground mine at the Renard Diamond Mine; (ix) the expected financial obligations or costs incurred by Stornoway in connection with the ongoing development of the Renard Diamond Mine; (x) mining, development, production, processing and exploration rates, progress and plans, as compared to schedule and budget, and planned optimization, expansion opportunities, timing thereof and anticipated benefits therefrom; (xi) future exploration plans and potential upside from targets identified for further exploration; (xii) expectations concerning outlook and trends in the diamond industry, rough diamond production, rough diamond market demand and supply, and future market prices for rough diamonds and the potential impact of the foregoing on various Renard financial metrics and diamond production; (xiii) the economic benefits of using liquefied natural gas rather than diesel for power generation; (xiv) sources of and anticipated financing requirements; (xv) the ability to meet Subject Diamonds Interest delivery obligations under the Purchase and Sale Agreement; (xvi) the foreign exchange rate between the US dollar and the Canadian dollar; and (xvii) the anticipated benefits from recently approved plant modification measures and the anticipated timeframe and expected capital cost thereof. Any statements that express or involve discussions with respect to predictions, expectations, beliefs, plans, projections, objectives, assumptions or future events or performance (often, but not always, using words or phrases such as “expects”, “anticipates”, “plans”, “projects”, “estimates”, “assumes”, “intends”, “strategy”, “goals”, “objectives”, “schedule” or variations thereof or stating that certain actions, events or results “may”, “could”, “would”, “might” or “will” be taken, occur or be achieved, or the negative of any of these terms and similar expressions) are not statements of historical fact and may be forward-looking statements.
Forward-looking statements are made based upon certain assumptions by Stornoway or its consultants and other important factors that, if untrue, could cause the actual results, performances or achievements ofStornoway to be materially different from future results, performances or achievements expressed or implied by such statements. Such statements and information are based on numerous assumptions regardingpresent and future business prospects and strategies and the environment in which Stornoway will operate in the future, including the recovered grade, size distribution and quality of diamonds, average ore recovery,internal dilution, and levels of diamond breakage, the price of diamonds, anticipated costs and Stornoway’s ability to achieve its goals, anticipated financial performance, regulatory developments, development plans,exploration, development and mining activities and commitments, and the foreign exchange rate between the US and Canadian dollars.
Forward Looking Information (continued)
3
Although management considers its assumptions on such matters to be reasonable based on information currently available to it, they may prove to be incorrect. Certain important assumptions by Stornoway or itsconsultants in making forward-looking statements include, but are not limited to: (i) the accuracy of our estimates regarding capital and estimated workforce requirements; (ii) estimates of net present value and internalrates of return; (iii) recovered grade, size distribution and quality of diamonds, average ore recovery, internal dilution, mining dilution and other mining parameters set out in the 2016 Technical Report as well as levels ofdiamond breakage; (iv) the expected mix of diamonds sold, and successful mitigation of ongoing issues of diamond breakage in the Renard Diamond Mine process plant and realization of the anticipated benefits fromplant modification measures within the anticipated timeframe and expected capital cost; (v) anticipated timelines for the development of an open pit and underground mine at the Renard Diamond Mine; (vi) anticipatedgeological formations; (vii) continued market acceptance of the Renard diamond production, conservative forecasting of future market prices for rough diamonds and impact of the foregoing on various Renard financialmetrics and diamond production; (viii) the timeline, progress and costs of future exploration, development, production and mining activities, plans, commitments and objectives; (ix) the availability of existing creditfacilities and any required future financing on favorable terms and the satisfaction of all covenants and conditions precedent relating to future funding commitments; (x) the ability to meet Subject Diamonds Interestdelivery obligations under the Purchase and Sale Agreement; (xi) the continued strength of the US dollar against the Canadian dollar and absence of significant variability in interest rates; (xii) increasing carat recoverieswith progressively increasing grade in LOM plan; (xiii) estimated incremental ore recovery, revenue and other mining parameters from potential additional mine life extension with minimal capital expenditures; (xiv)modest capital requirements post-2018 with significant resource expansion available at marginal cost; and (xv) limited cash income taxes payable over the medium term.
By their very nature, forward-looking statements involve inherent risks and uncertainties, both general and specific, and risks exist that estimates, forecasts, projections and other forward-looking statements will not be achieved or that assumptions do not reflect future experience. We caution readers not to place undue reliance on these forward- looking statements as a number of important risk factors could cause the actual outcomes to differ materially from the beliefs, plans, objectives, expectations, anticipations, estimates, assumptions and intentions expressed in such forward-looking statements. These risk factors may be generally stated as the risk that the assumptions and estimates expressed above do not occur, including the assumption in many forward-looking statements that other forward-looking statements will be correct, but specifically include, without limitation: (i) risks relating to variations in the grade, size distribution and quality of diamonds, kimberlite lithologies and country rock content within the material identified as Mineral Resources from that predicted; (ii) variations in rates of recovery and levels of diamond breakage; (iii) risks associated with our dependence on the Renard Diamond Mine and the limited operating history thereof; (iv) risks relating to fluctuations in the Canadian dollar and other currencies relative to the US dollar and variability in interest rates; (v) inaccuracy of our estimates regarding future financing and capital requirements and expenditures, significant additional future capital needs and unavailability of additional financing and capital, on reasonable terms, or at all; (vi) uncertainties related to forecasts, costs and timing of the Corporation’s future development plans, exploration, processing, production and mining activities; (vii) increases in the costs of proposed capital, operating and sustainable capital expenditures; (viii) increases in financing costs or adverse changes to the terms of available financing, if any; (ix) tax rates or royalties being greater than assume, (x) risks associated with ongoing issues of diamond breakage in the Renard Diamond Mine process plant and the failure to realize the anticipated benefits from plant modification measures within the anticipated timeframe and expected capital cost, or at all; (xi) the risks associated with our substantial indebtedness and the failure to meet our debt service obligations; and (xxix) the additional risk factors described herein and in Stornoway’s annual and interim MD&A, its other disclosure documents and Stornoway’s anticipation of and success in managing the foregoing risks. Stornoway cautions that the foregoing list of factors that may affect future results is not exhaustive and new, unforeseeable risks may arise from time to time.
Qualified Persons
The Qualified Persons that prepared the technical reports and press releases that form the basis for the presentation are listed in the Company’s AIF dated February 23, 2017. Disclosure of a scientific or technical nature inthis presentation was prepared under the supervision of M. Patrick Godin, P.Eng. (Québec), Chief Operating Officer. Stornoway’s exploration programs are supervised by Robin Hopkins, P.Geol. (NT/NU), Vice President,Exploration. Each of M. Godin and Mr. Hopkins are “qualified persons” under NI 43-101.
Forward Looking Information (continued)
4
Non-IFRS Financial Measures
This presentation refers to certain financial measures, such Adjusted EBITDA, Adjusted EBITDA margin, Net Income Before Impairment, Average diamond price achieved, Cash Operating Cost per Tonne of Ore Processed,Cash Operating Cost per Carat Recovered, Capital Expenditures and Available Liquidity, which are not measures recognized under IFRS and do not have a standardized meaning prescribed by IFRS.
“Adjusted EBITDA” and “Adjusted EBITDA Margin” are used by management and investors to assess and measure the underlying pre-tax operating performance of the Corporation and are generally regarded by management as better measures to evaluate performance trends. “Adjusted EBITDA” is defined as net income (loss) before depreciation, interest and other financial (income) expenses, and income tax, adjusted for impairment charges, unrealized gains and losses related to the changes in fair value of U.S. Denominated debt and other non-recurring or unusual items that are not reflective of the Corporation’s underlying operating performance and/or unlikely to occur on a regular basis. “Adjusted EBITDA Margin” is the calculation of Adjusted EBITDA divided by total revenues. “Net Income Before Impairment” is used by the Corporation to evaluate earnings trends more readily in comparison with results from prior periods, as it excludes impairment charges deemed not reflective of the underlying operations of the Corporation. “Average diamond price achieved” is a measure used by the Corporation to measure the value of diamonds sold into the market in the period, prior to adjustments to reflect the impact of the stream. This measure is used by management and investors as it reflects the average diamond price achieved during the period and is more comparable to the average diamond price achieved by to other diamond producers. Average diamond price achieved is calculated based on reported revenues adjusted for the amortization of deferred stream revenue, and remittances made to/from stream participants and gains or losses from revenue hedging activities divided by the number of carats sold in the period. “Cash Operating Cost per Tonne Processed” and “Cash Operating Cost per Carat Recovered” are used by management and investors to measure the mine’s cash operating cost based on per tonne of ore processed or per carat recovered. Cash Operating Cost Per Tonne Processed is calculated based on reported operating expenses adjusted for the impact of inventory variation, excluding depreciation, divided by tonnes of ore processed for the period. Cash Operating Cost per Carat Recovered is the total cash operating cost divided by carats recovered. “Capital Expenditure” is the term used by the Corporation and investors to describe capital expenditures incurred during the period. This measure is used by management and investors to measure the amount of capital spent by the corporation on sustaining, margin improvement, and/or growth capital projects in the period. “Available Liquidity” comprises cash and cash equivalents, short-term investments and available credit facilities (less related upfront fees) and is used by the management and investors to measure the amount of cash resources available to the Corporation, over and above the cash generated from operations, to support the operating and capital requirements of the business.
2017 Highlights
5
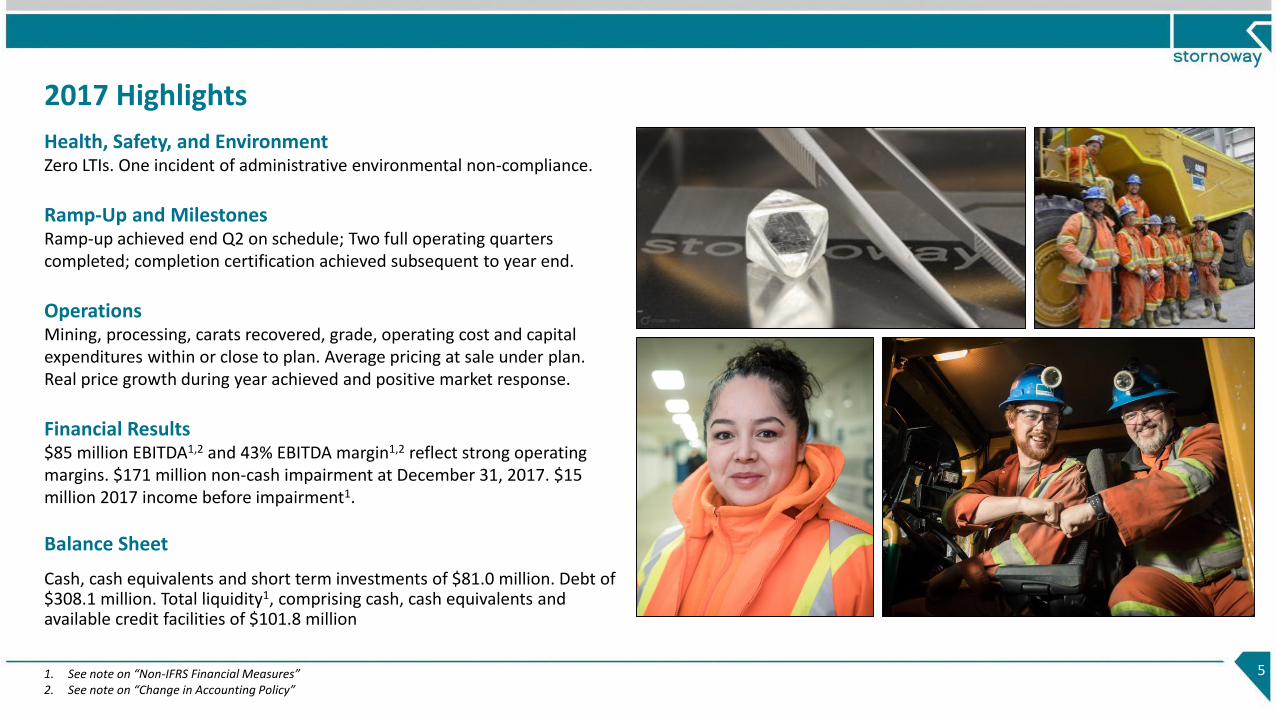
Health, Safety, and EnvironmentZero LTIs. One incident of administrative environmental non-compliance.
Ramp-Up and MilestonesRamp-up achieved end Q2 on schedule; Two full operating quarters completed; completion certification achieved subsequent to year end.
OperationsMining, processing, carats recovered, grade, operating cost and capital expenditures within or close to plan. Average pricing at sale under plan. Real price growth during year achieved and positive market response.
Financial Results$85 million EBITDA1,2 and 43% EBITDA margin1,2 reflect strong operating margins. $171 million non-cash impairment at December 31, 2017. $15 million 2017 income before impairment1.
Balance Sheet
Cash, cash equivalents and short term investments of $81.0 million. Debt of $308.1 million. Total liquidity1, comprising cash, cash equivalents and available credit facilities of $101.8 million
1. See note on “Non-IFRS Financial Measures”2. See note on “Change in Accounting Policy”
Note on Accounting Policy Change
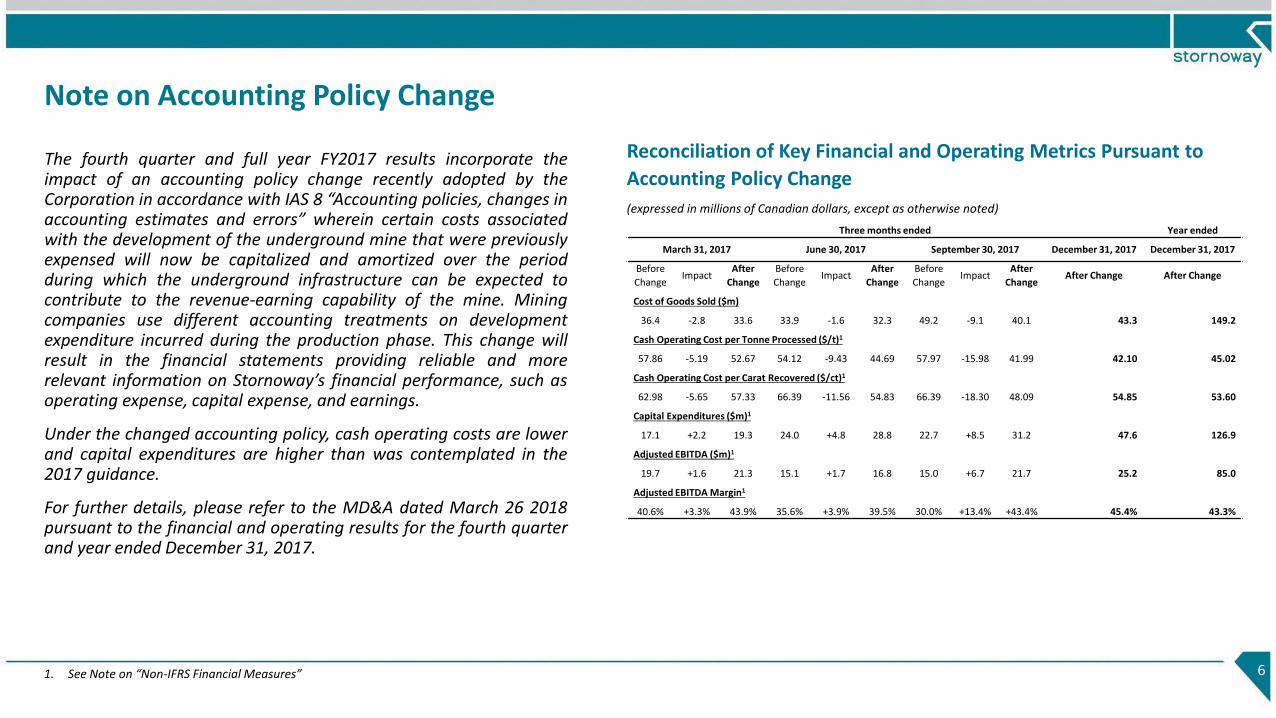
The fourth quarter and full year FY2017 results incorporate theimpact of an accounting policy change recently adopted by theCorporation in accordance with IAS 8 “Accounting policies, changes inaccounting estimates and errors” wherein certain costs associatedwith the development of the underground mine that were previouslyexpensed will now be capitalized and amortized over the periodduring which the underground infrastructure can be expected tocontribute to the revenue-earning capability of the mine. Miningcompanies use different accounting treatments on developmentexpenditure incurred during the production phase. This change willresult in the financial statements providing reliable and morerelevant information on Stornoway’s financial performance, such asoperating expense, capital expense, and earnings.
Under the changed accounting policy, cash operating costs are lowerand capital expenditures are higher than was contemplated in the2017 guidance.
For further details, please refer to the MD&A dated March 26 2018pursuant to the financial and operating results for the fourth quarterand year ended December 31, 2017.
Three months ended Year ended
March 31, 2017 June 30, 2017 September 30, 2017 December 31, 2017 December 31, 2017
Before
ChangeImpact
After
Change
Before
ChangeImpact
After
Change
Before
ChangeImpact
After
ChangeAfter Change After Change
Cost of Goods Sold ($m)
36.4 -2.8 33.6 33.9 -1.6 32.3 49.2 -9.1 40.1 43.3 149.2
Cash Operating Cost per Tonne Processed ($/t)1
57.86 -5.19 52.67 54.12 -9.43 44.69 57.97 -15.98 41.99 42.10 45.02
Cash Operating Cost per Carat Recovered ($/ct)1
62.98 -5.65 57.33 66.39 -11.56 54.83 66.39 -18.30 48.09 54.85 53.60
Capital Expenditures ($m)1
17.1 +2.2 19.3 24.0 +4.8 28.8 22.7 +8.5 31.2 47.6 126.9
Adjusted EBITDA ($m)1
19.7 +1.6 21.3 15.1 +1.7 16.8 15.0 +6.7 21.7 25.2 85.0
Adjusted EBITDA Margin1
40.6% +3.3% 43.9% 35.6% +3.9% 39.5% 30.0% +13.4% +43.4% 45.4% 43.3%
6
Reconciliation of Key Financial and Operating Metrics Pursuant to
Accounting Policy Change
(expressed in millions of Canadian dollars, except as otherwise noted)
1. See Note on “Non-IFRS Financial Measures”
2017 Production & Financial ResultsAs of December 31, 2017
7
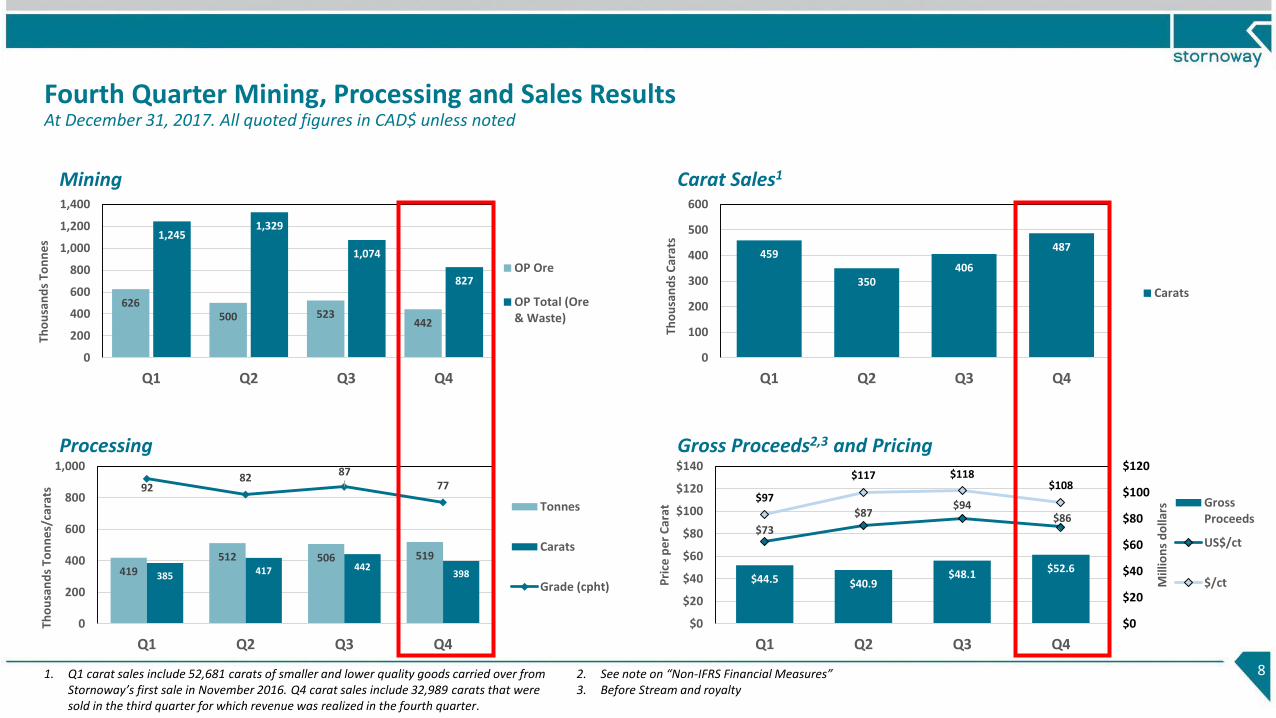
Fourth Quarter Mining, Processing and Sales ResultsAt December 31, 2017. All quoted figures in CAD$ unless noted
8
419512 506 519
385 417 442398
9282
8777
0
200
400
600
800
1,000
Q1 Q2 Q3 Q4
Tho
usa
nd
s To
nn
es/
cara
ts
Tonnes
Carats
Grade (cpht)
Mining
Processing
626500 523
442
1,2451,329
1,074
827
0
200
400
600
800
1,000
1,200
1,400
Q1 Q2 Q3 Q4
Tho
usa
nd
s To
nn
es
OP Ore
OP Total (Ore& Waste)
459
350406
487
0
100
200
300
400
500
600
Q1 Q2 Q3 Q4
Tho
usa
nd
s C
arat
s
Carats
$44.5 $40.9$48.1 $52.6
$73
$87$94
$86
$97
$117 $118$108
$0
$20
$40
$60
$80
$100
$120
$0
$20
$40
$60
$80
$100
$120
$140
Q1 Q2 Q3 Q4
Mill
ion
s d
olla
rs
Pri
ce p
er
Car
at
GrossProceeds
US$/ct
$/ct
Carat Sales1
Gross Proceeds2,3 and Pricing
1. Q1 carat sales include 52,681 carats of smaller and lower quality goods carried over from Stornoway’s first sale in November 2016. Q4 carat sales include 32,989 carats that were sold in the third quarter for which revenue was realized in the fourth quarter.
2. See note on “Non-IFRS Financial Measures”3. Before Stream and royalty
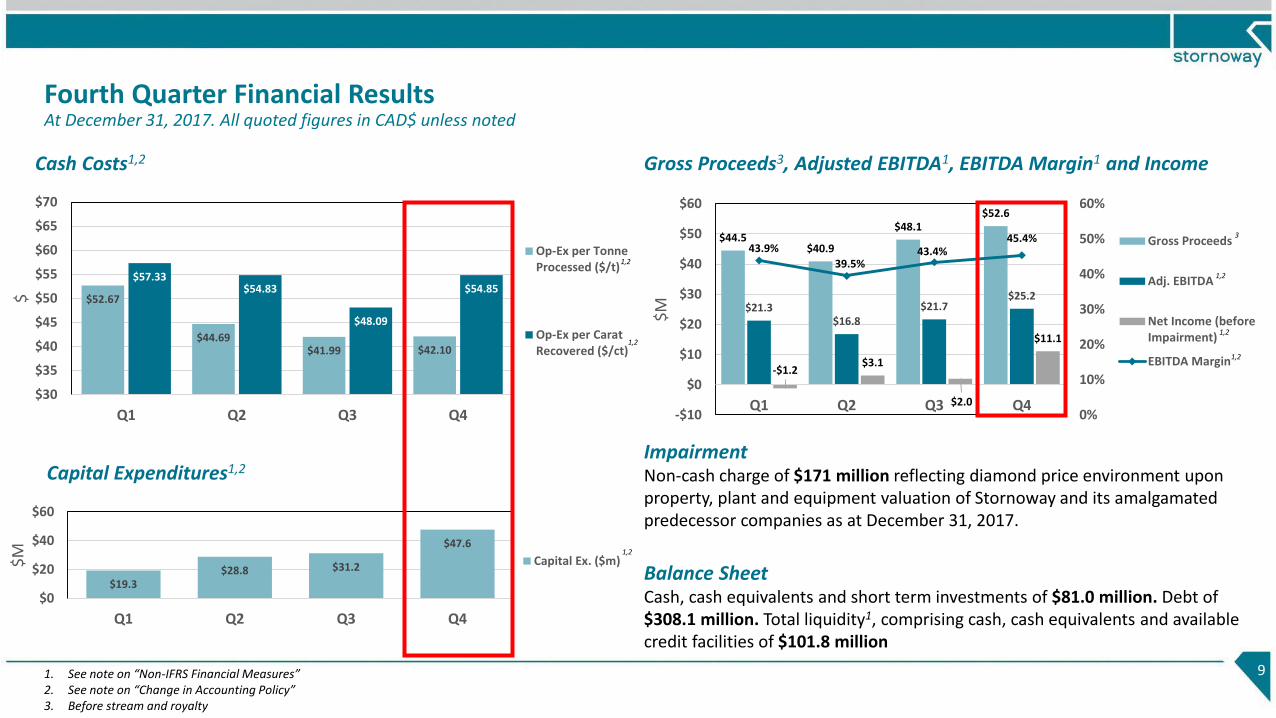
Fourth Quarter Financial ResultsAt December 31, 2017. All quoted figures in CAD$ unless noted
Gross Proceeds3, Adjusted EBITDA1, EBITDA Margin1 and Income
9
$44.5$40.9
$48.1$52.6
$21.3$16.8
$21.7$25.2
-$1.2$3.1
$2.0
$11.1
43.9%
39.5%43.4%
45.4%
0%
10%
20%
30%
40%
50%
60%
-$10
$0
$10
$20
$30
$40
$50
$60
Q1 Q2 Q3 Q4
$M
Gross Proceeds
Adj. EBITDA
Net Income (beforeImpairment)
EBITDA Margin
Cash Costs1,2
$52.67
$44.69$41.99 $42.10
$57.33$54.83
$48.09
$54.85
$30
$35
$40
$45
$50
$55
$60
$65
$70
Q1 Q2 Q3 Q4
$
Op-Ex per TonneProcessed ($/t)
Op-Ex per CaratRecovered ($/ct)
$19.3$28.8 $31.2
$47.6
$0
$20
$40
$60
Q1 Q2 Q3 Q4
$M
Capital Ex. ($m)
Capital Expenditures1,2ImpairmentNon-cash charge of $171 million reflecting diamond price environment upon property, plant and equipment valuation of Stornoway and its amalgamated predecessor companies as at December 31, 2017.
Balance SheetCash, cash equivalents and short term investments of $81.0 million. Debt of$308.1 million. Total liquidity1, comprising cash, cash equivalents and available credit facilities of $101.8 million
1. See note on “Non-IFRS Financial Measures”2. See note on “Change in Accounting Policy”3. Before stream and royalty
1,2
1,2
1,2
1,2
1,2
1,2
3
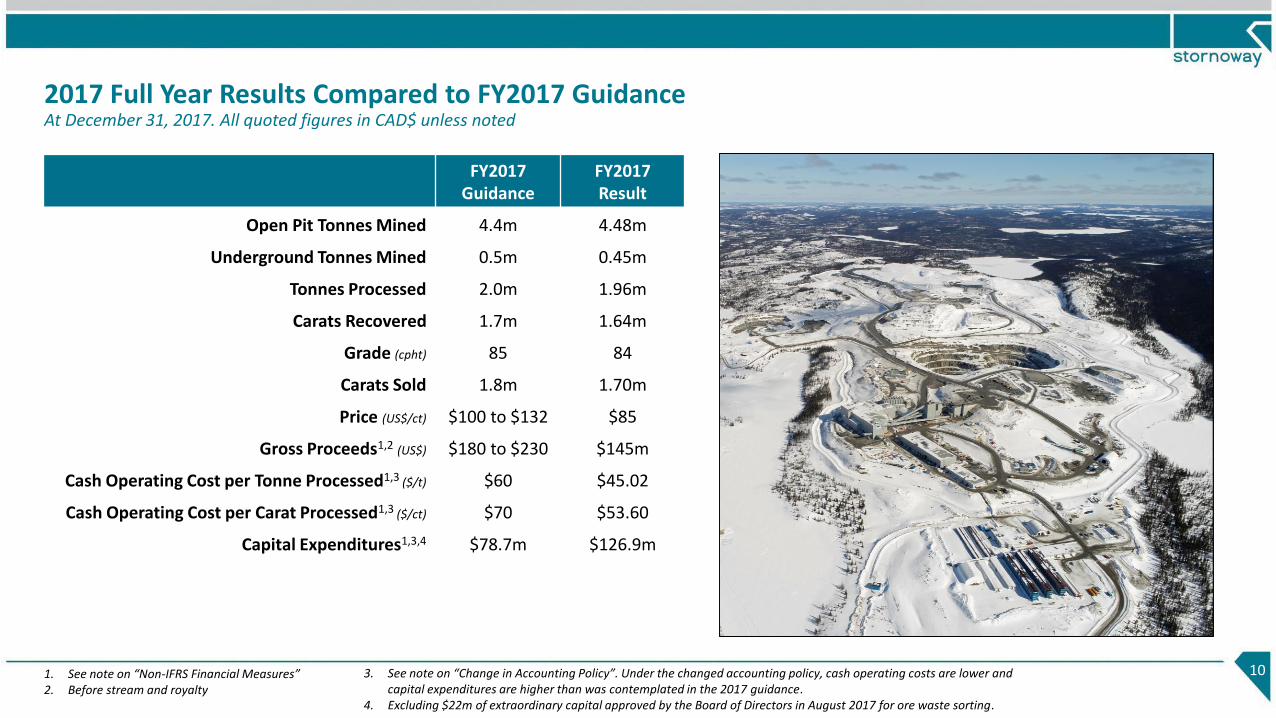
2017 Full Year Results Compared to FY2017 GuidanceAt December 31, 2017. All quoted figures in CAD$ unless noted
10
FY2017 Guidance
FY2017 Result
Open Pit Tonnes Mined 4.4m 4.48m
Underground Tonnes Mined 0.5m 0.45m
Tonnes Processed 2.0m 1.96m
Carats Recovered 1.7m 1.64m
Grade (cpht) 85 84
Carats Sold 1.8m 1.70m
Price (US$/ct) $100 to $132 $85
Gross Proceeds1,2 (US$) $180 to $230 $145m
Cash Operating Cost per Tonne Processed1,3 ($/t) $60 $45.02
Cash Operating Cost per Carat Processed1,3 ($/ct) $70 $53.60
Capital Expenditures1,3,4 $78.7m $126.9m
1. See note on “Non-IFRS Financial Measures”2. Before stream and royalty
3. See note on “Change in Accounting Policy”. Under the changed accounting policy, cash operating costs are lower and capital expenditures are higher than was contemplated in the 2017 guidance.
4. Excluding $22m of extraordinary capital approved by the Board of Directors in August 2017 for ore waste sorting.
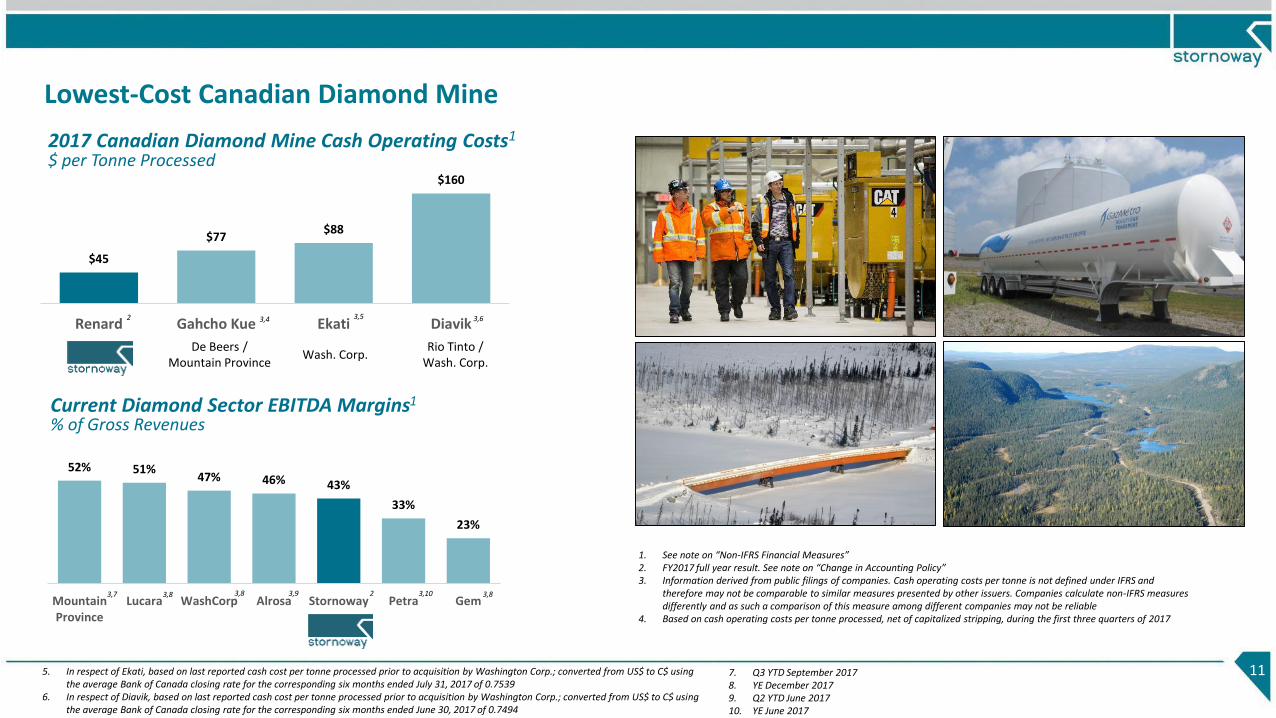
Lowest-Cost Canadian Diamond Mine
11
1. See note on “Non-IFRS Financial Measures”2. FY2017 full year result. See note on “Change in Accounting Policy”3. Information derived from public filings of companies. Cash operating costs per tonne is not defined under IFRS and
therefore may not be comparable to similar measures presented by other issuers. Companies calculate non-IFRS measures differently and as such a comparison of this measure among different companies may not be reliable
4. Based on cash operating costs per tonne processed, net of capitalized stripping, during the first three quarters of 2017
7. Q3 YTD September 20178. YE December 20179. Q2 YTD June 201710. YE June 2017
Current Diamond Sector EBITDA Margins1
% of Gross Revenues
$45
$77$88
$160
Renard Gahcho Kue Ekati Diavik
De Beers / Mountain Province
Wash. Corp.Rio Tinto /
Wash. Corp.
52% 51%47% 46% 43%
33%
23%
MountainProvince
Lucara WashCorp Alrosa Stornoway Petra Gem
2017 Canadian Diamond Mine Cash Operating Costs1
$ per Tonne Processed
3,42 3,5 3,6
3,7 3,8 3,9 2 3,10 3,8
5. In respect of Ekati, based on last reported cash cost per tonne processed prior to acquisition by Washington Corp.; converted from US$ to C$ using the average Bank of Canada closing rate for the corresponding six months ended July 31, 2017 of 0.7539
6. In respect of Diavik, based on last reported cash cost per tonne processed prior to acquisition by Washington Corp.; converted from US$ to C$ using the average Bank of Canada closing rate for the corresponding six months ended June 30, 2017 of 0.7494
3,8
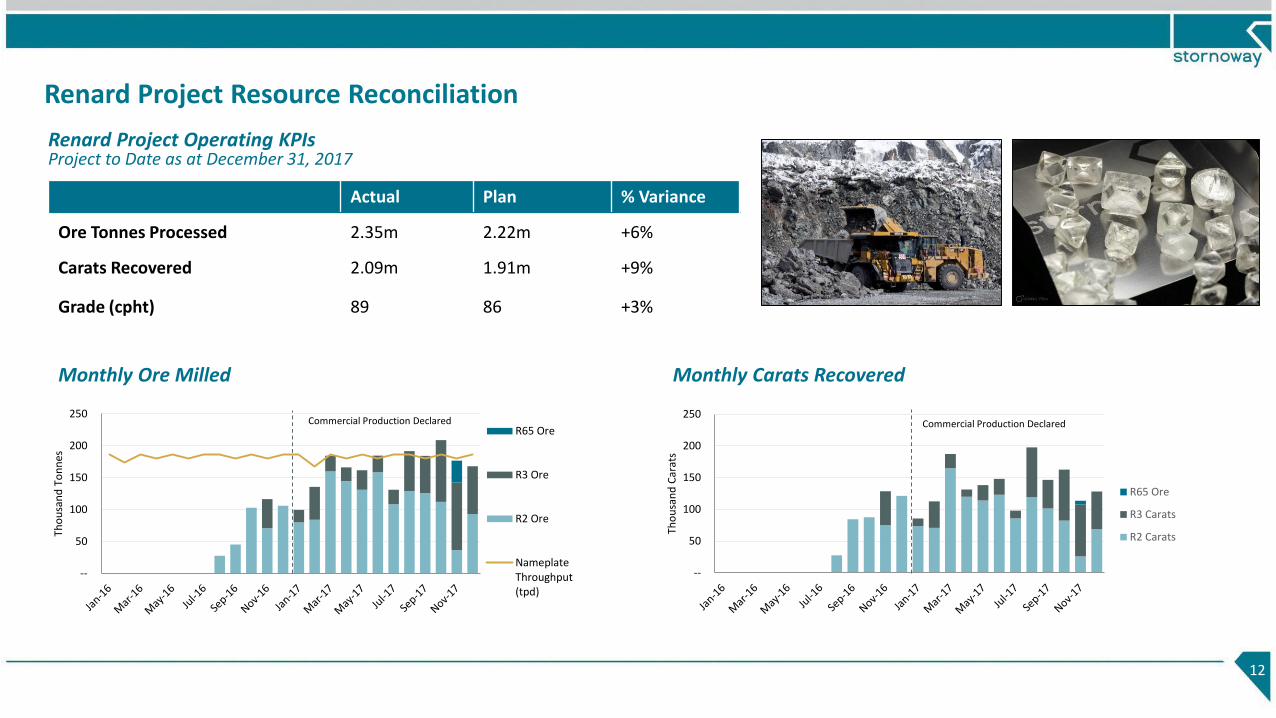
Renard Project Resource Reconciliation
12
Actual Plan % Variance
Ore Tonnes Processed 2.35m 2.22m +6%
Carats Recovered 2.09m 1.91m +9%
Grade (cpht) 89 86 +3%
Monthly Carats Recovered
--
50
100
150
200
250
Tho
usa
nd
Car
ats
R65 Ore
R3 Carats
R2 Carats
Commercial Production Declared
Monthly Ore Milled
--
50
100
150
200
250
Tho
usa
nd
To
nn
es
R65 Ore
R3 Ore
R2 Ore
NameplateThroughput(tpd)
Commercial Production Declared
Renard Project Operating KPIsProject to Date as at December 31, 2017
13
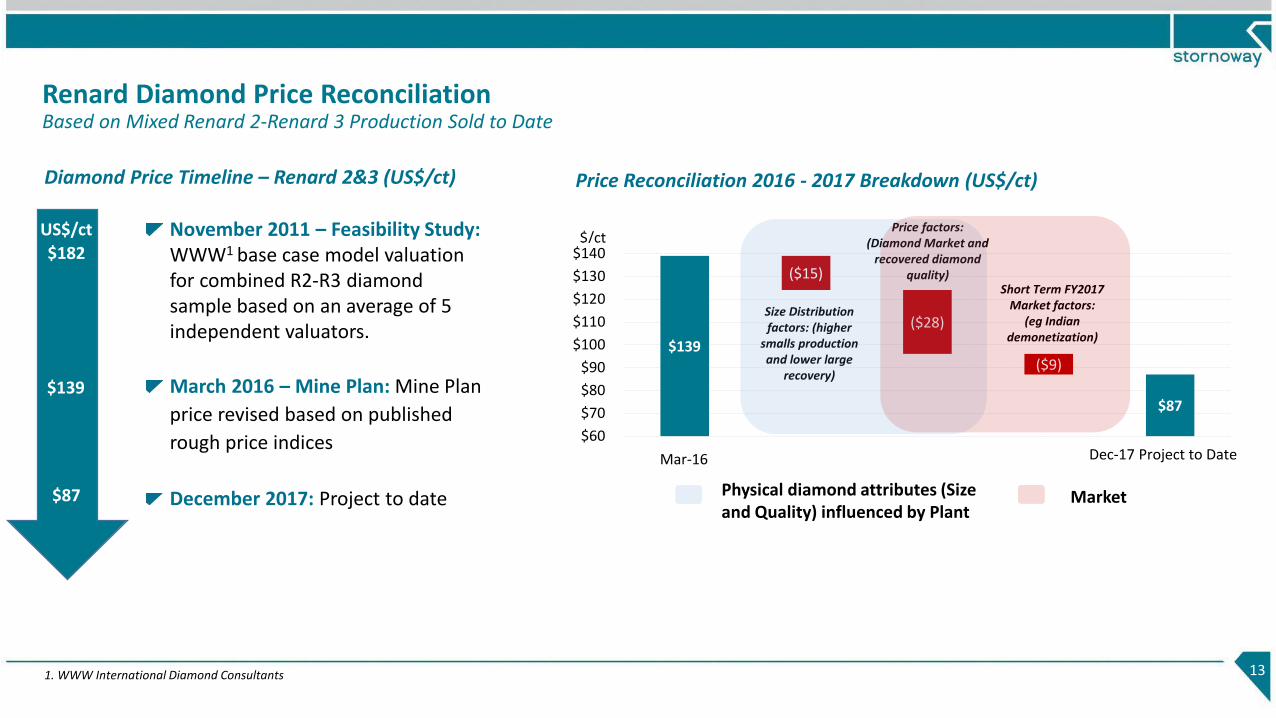
Renard Diamond Price ReconciliationBased on Mixed Renard 2-Renard 3 Production Sold to Date
Diamond Price Timeline – Renard 2&3 (US$/ct)
November 2011 – Feasibility Study: WWW1 base case model valuation for combined R2-R3 diamond sample based on an average of 5 independent valuators.
March 2016 – Mine Plan: Mine Plan
price revised based on published
rough price indices
December 2017: Project to date
$139
$87
($15)
($28)
($9)
$60
$70
$80
$90
$100
$110
$120
$130
$140
($15) ($28) ($9)Mar-16 Dec-17 Project to Date
$/ct
Price Reconciliation 2016 - 2017 Breakdown (US$/ct)
Price factors: (Diamond Market and
recovered diamond quality)
Size Distribution factors: (higher
smalls production and lower large
recovery)
Short Term FY2017 Market factors:
(eg Indian demonetization)
US$/ct
$182
$139
$87
1. WWW International Diamond Consultants
Physical diamond attributes (Size and Quality) influenced by Plant
Market
100.0
111.7109.9
113.9 115.4119.2 119.0
110.1 111.1113.5
120.0
90.0
100.0
110.0
120.0
130.0
Ind
ex
(No
v 2
01
6=1
00
)
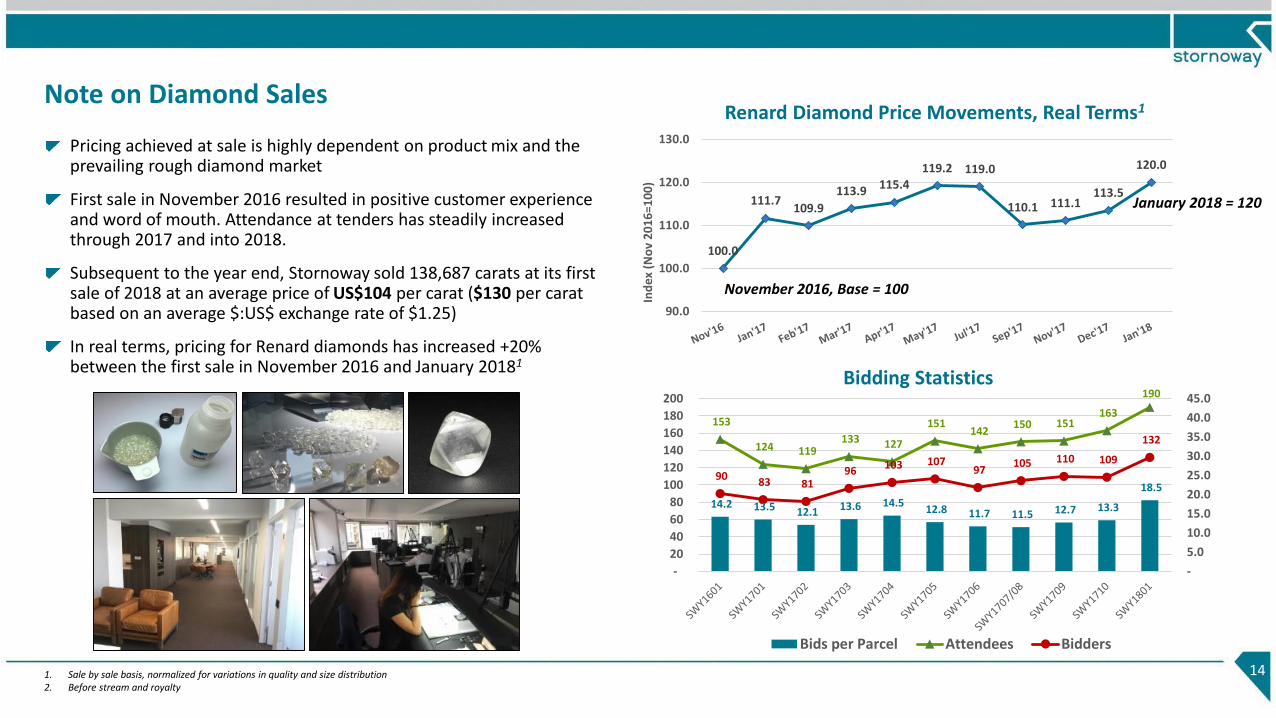
Note on Diamond Sales
14
Renard Diamond Price Movements, Real Terms1
1. Sale by sale basis, normalized for variations in quality and size distribution2. Before stream and royalty
November 2016, Base = 100
January 2018 = 120
Pricing achieved at sale is highly dependent on product mix and the prevailing rough diamond market
First sale in November 2016 resulted in positive customer experience and word of mouth. Attendance at tenders has steadily increased through 2017 and into 2018.
Subsequent to the year end, Stornoway sold 138,687 carats at its first sale of 2018 at an average price of US$104 per carat ($130 per carat based on an average $:US$ exchange rate of $1.25)
In real terms, pricing for Renard diamonds has increased +20% between the first sale in November 2016 and January 20181
Bidding Statistics
14.2 13.5 12.1 13.6 14.5 12.8 11.7 11.5 12.7 13.3
18.5
153
124 119 133 127
151 142
150 151 163
190
90 83 81
96 103 107
97 105 110 109
132
-
5.0
10.0
15.0
20.0
25.0
30.0
35.0
40.0
45.0
-
20
40
60
80
100
120
140
160
180
200
Bids per Parcel Attendees Bidders
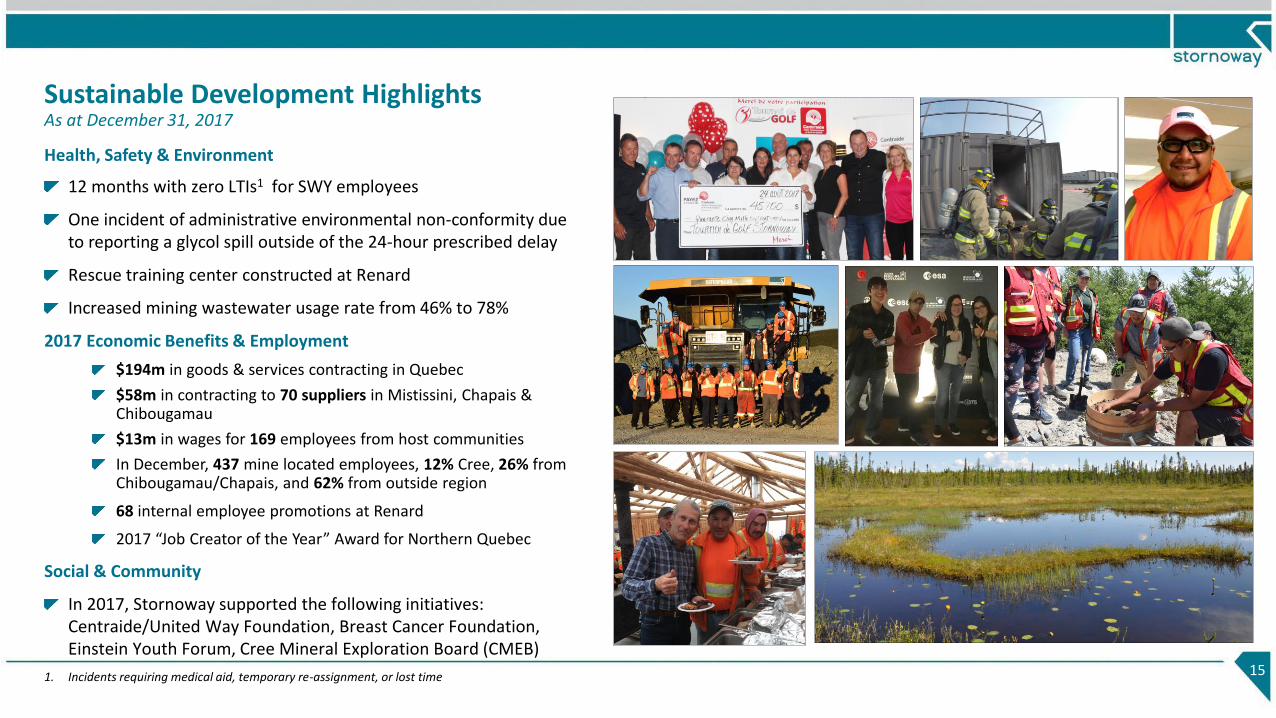
Sustainable Development HighlightsAs at December 31, 2017
15
Health, Safety & Environment
12 months with zero LTIs1 for SWY employees
One incident of administrative environmental non‐conformity due to reporting a glycol spill outside of the 24-hour prescribed delay
Rescue training center constructed at Renard
Increased mining wastewater usage rate from 46% to 78%
2017 Economic Benefits & Employment
$194m in goods & services contracting in Quebec
$58m in contracting to 70 suppliers in Mistissini, Chapais &Chibougamau
$13m in wages for 169 employees from host communities
In December, 437 mine located employees, 12% Cree, 26% from Chibougamau/Chapais, and 62% from outside region
68 internal employee promotions at Renard
2017 “Job Creator of the Year” Award for Northern Quebec
Social & Community
In 2017, Stornoway supported the following initiatives: Centraide/United Way Foundation, Breast Cancer Foundation, Einstein Youth Forum, Cree Mineral Exploration Board (CMEB)
1. Incidents requiring medical aid, temporary re-assignment, or lost time
2018 OutlookAs of December 31, 2017
16
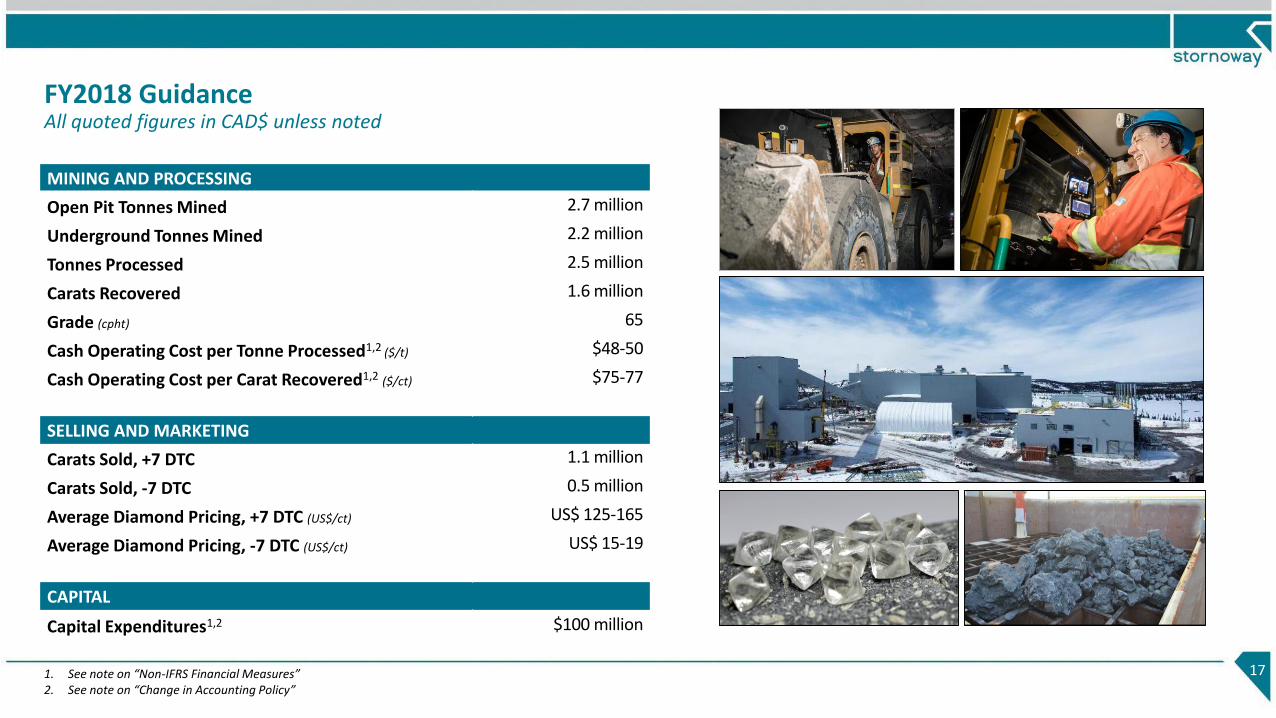
FY2018 GuidanceAll quoted figures in CAD$ unless noted
17
MINING AND PROCESSING
Open Pit Tonnes Mined 2.7 million
Underground Tonnes Mined 2.2 million
Tonnes Processed 2.5 million
Carats Recovered 1.6 million
Grade (cpht) 65
Cash Operating Cost per Tonne Processed1,2 ($/t) $48-50
Cash Operating Cost per Carat Recovered1,2 ($/ct) $75-77
SELLING AND MARKETING
Carats Sold, +7 DTC 1.1 million
Carats Sold, -7 DTC 0.5 million
Average Diamond Pricing, +7 DTC (US$/ct) US$ 125-165
Average Diamond Pricing, -7 DTC (US$/ct) US$ 15-19
CAPITAL
Capital Expenditures1,2 $100 million
1. See note on “Non-IFRS Financial Measures”2. See note on “Change in Accounting Policy”
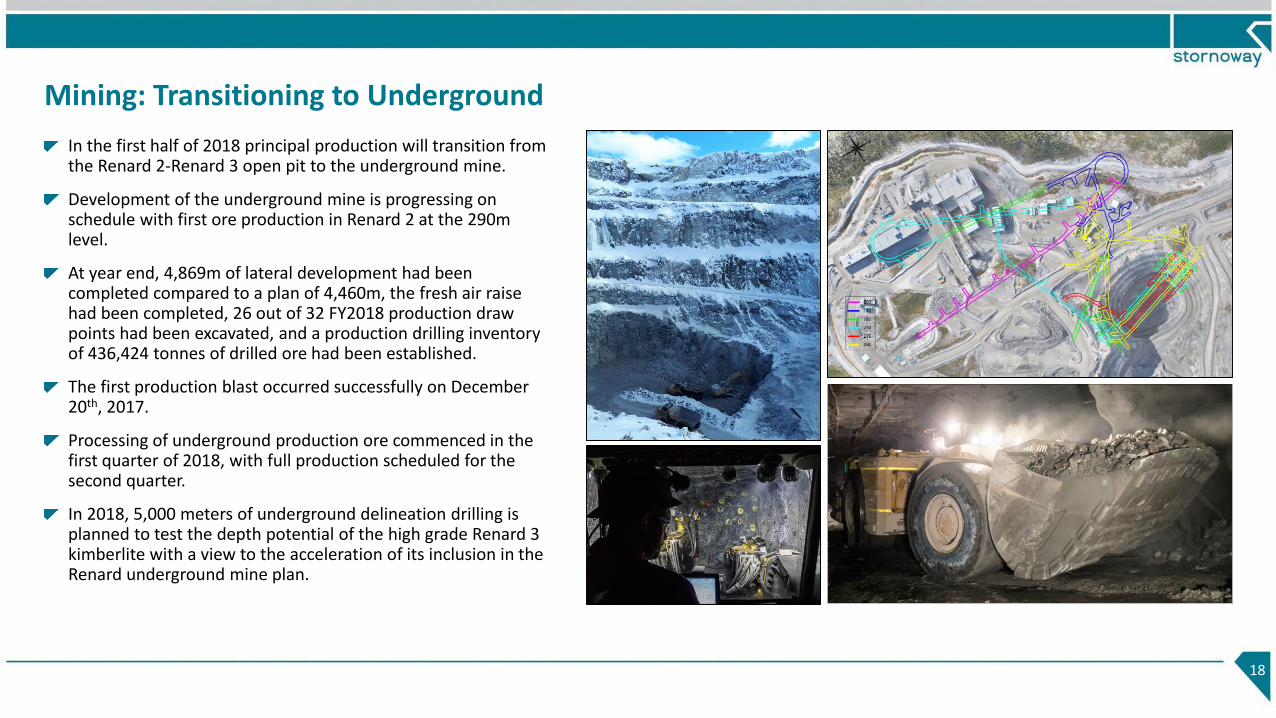
Mining: Transitioning to Underground
18
In the first half of 2018 principal production will transition from the Renard 2-Renard 3 open pit to the underground mine.
Development of the underground mine is progressing on schedule with first ore production in Renard 2 at the 290m level.
At year end, 4,869m of lateral development had been completed compared to a plan of 4,460m, the fresh air raise had been completed, 26 out of 32 FY2018 production draw points had been excavated, and a production drilling inventory of 436,424 tonnes of drilled ore had been established.
The first production blast occurred successfully on December 20th, 2017.
Processing of underground production ore commenced in the first quarter of 2018, with full production scheduled for the second quarter.
In 2018, 5,000 meters of underground delineation drilling is planned to test the depth potential of the high grade Renard 3 kimberlite with a view to the acceleration of its inclusion in the Renard underground mine plan.
Processing: Ore-Waste Sorting
19
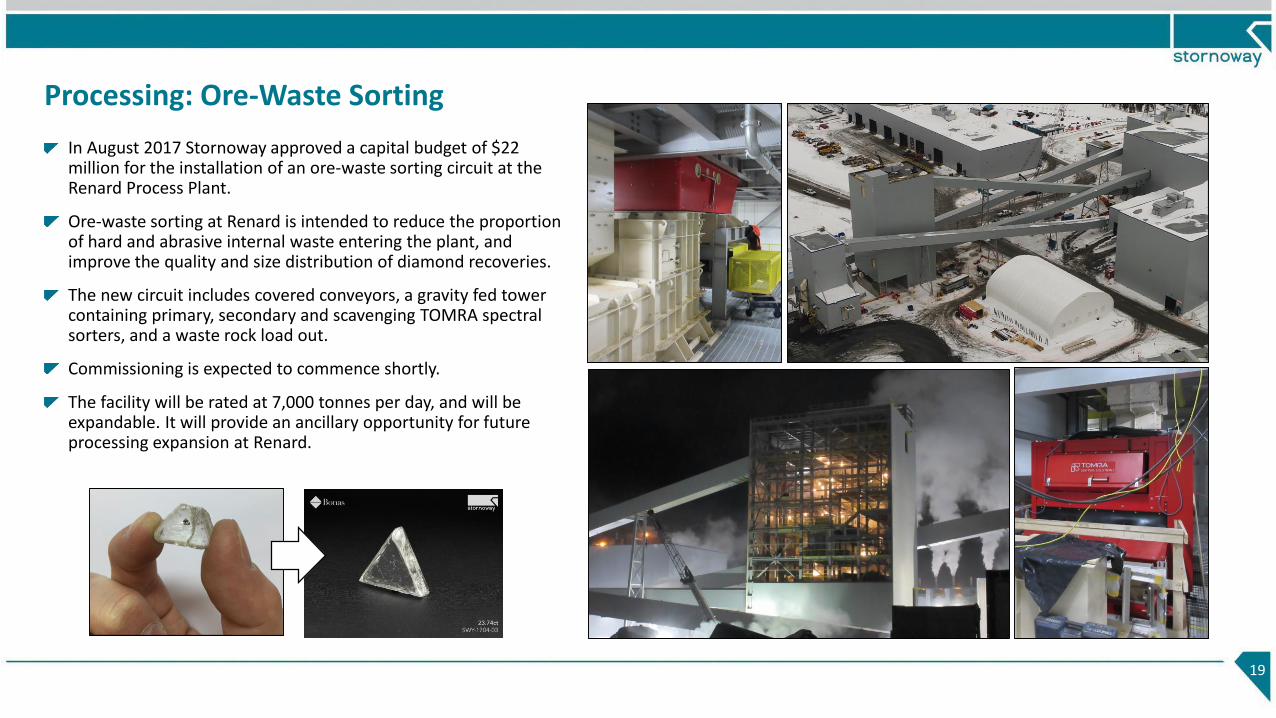
In August 2017 Stornoway approved a capital budget of $22 million for the installation of an ore-waste sorting circuit at the Renard Process Plant.
Ore-waste sorting at Renard is intended to reduce the proportion of hard and abrasive internal waste entering the plant, and improve the quality and size distribution of diamond recoveries.
The new circuit includes covered conveyors, a gravity fed tower containing primary, secondary and scavenging TOMRA spectral sorters, and a waste rock load out.
Commissioning is expected to commence shortly.
The facility will be rated at 7,000 tonnes per day, and will be expandable. It will provide an ancillary opportunity for future processing expansion at Renard.
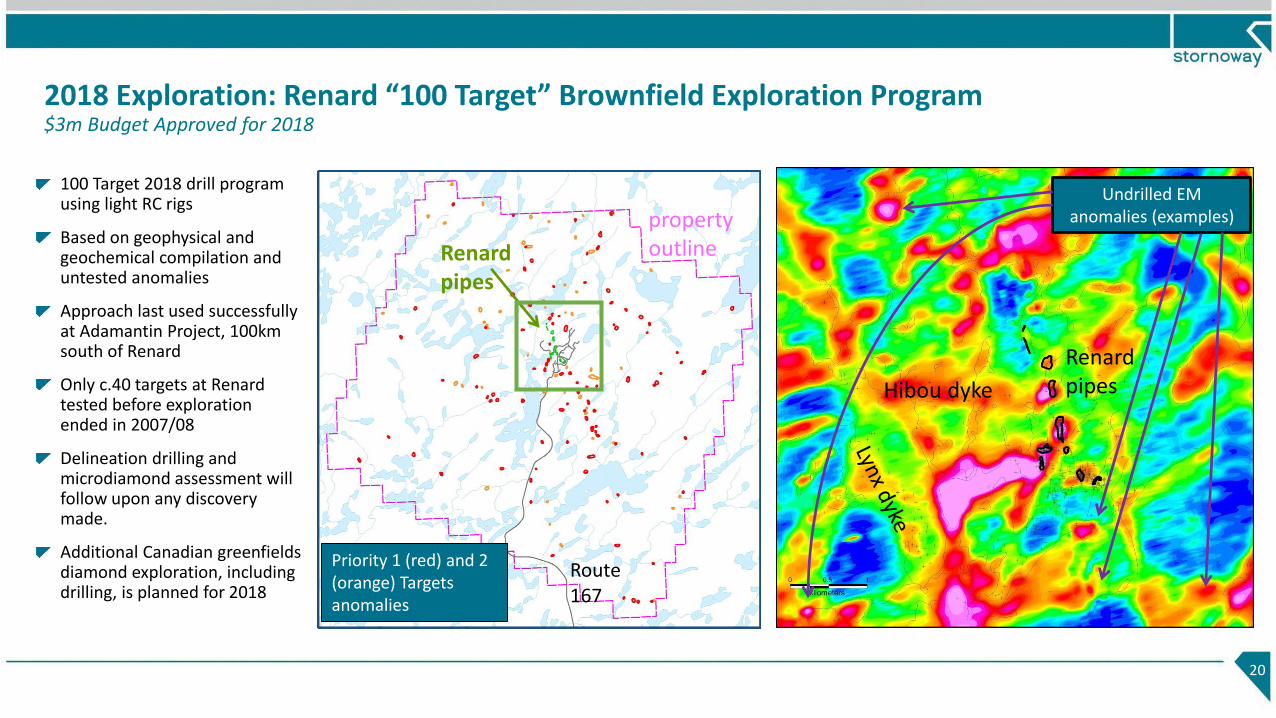
2018 Exploration: Renard “100 Target” Brownfield Exploration Program$3m Budget Approved for 2018
100 Target 2018 drill program using light RC rigs
Based on geophysical and geochemical compilation and untested anomalies
Approach last used successfully at Adamantin Project, 100km south of Renard
Only c.40 targets at Renardtested before exploration ended in 2007/08
Delineation drilling and microdiamond assessment will follow upon any discovery made.
Additional Canadian greenfieldsdiamond exploration, including drilling, is planned for 2018
20
Renard pipesHibou dyke
Priority 1 (red) and 2 (orange) Targets anomalies
Route 167
property outline
Undrilled EM anomalies (examples)
Renard pipes
The Future: Diamond Mine Depletion, 2018-2025
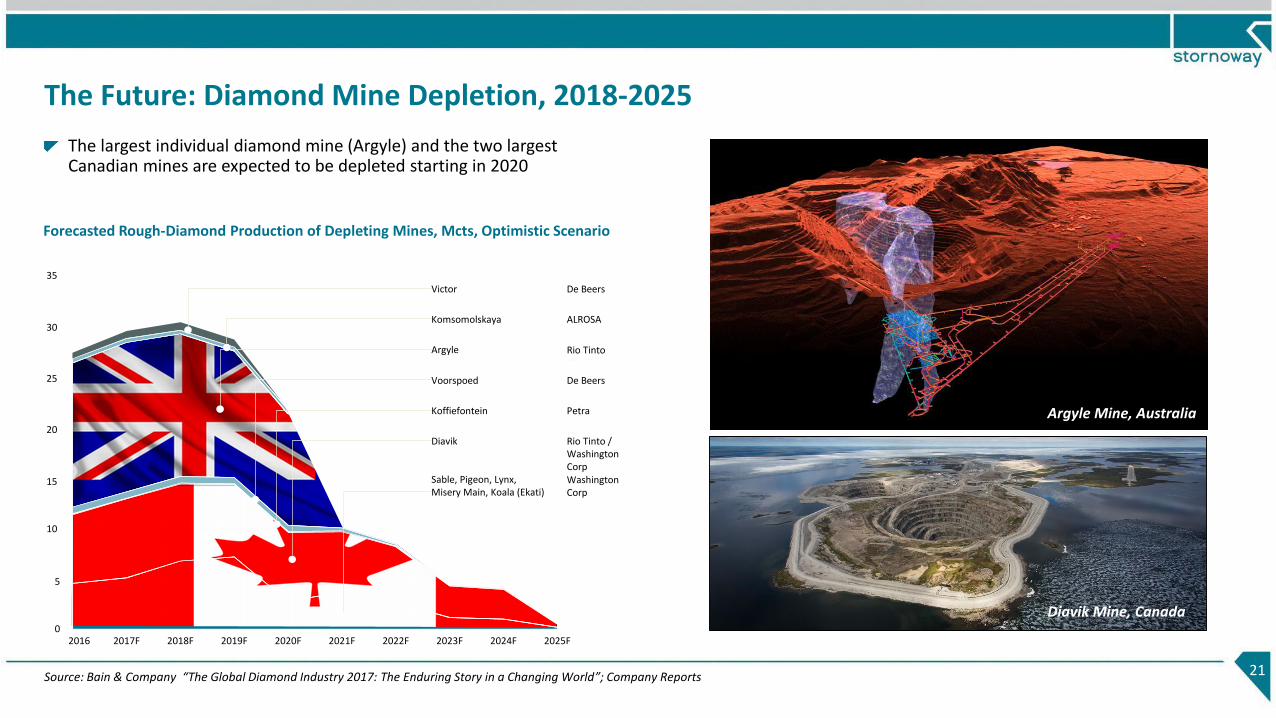
The largest individual diamond mine (Argyle) and the two largest Canadian mines are expected to be depleted starting in 2020
21
Forecasted Rough-Diamond Production of Depleting Mines, Mcts, Optimistic Scenario
Argyle Mine, Australia
Source: Bain & Company “The Global Diamond Industry 2017: The Enduring Story in a Changing World”; Company Reports
Victor De Beers
Komsomolskaya ALROSA
Argyle Rio Tinto
Voorspoed De Beers
Koffiefontein Petra
Diavik Rio Tinto / Washington Corp
Sable, Pigeon, Lynx,Misery Main, Koala (Ekati)
Washington Corp
30
25
20
15
0
35
2016 2017F 2018F 2019F 2020F 2021F
10
5
2022F 2023F 2024F 2025F
Diavik Mine, Canada
22
Head Office:
1111 Rue St. Charles Ouest,
Longueuil, Québec J4K 4G4
Tel: +1 (450) 616-5555
IR Contact:
Orin Baranowsky, Chief Financial Officer
Tel: +1 (416) 304-1026 x2103
www.stornowaydiamonds.com
Stornoway Diamond Corporation TSX:SWY, TSX:SWY.DB.U