Embed Size (px)
Citation preview
1 |
CANADA’S INTERMEDIATE GOLD PRODUCER
Scotiabank Mining Conference Toronto – December 5-6, 2017
2 |
Forward Looking Information This presentation contains certain forward-looking information and forward-looking statements, as defined in applicable securities laws (collectively referred to herein as
“forward-looking statements”). Forward-looking statements relate to future events or future performance and reflect current expectations or beliefs regarding future events
and include, but are not limited to, statements with respect to: (i) the amount of mineral resources and mineral reserves and exploration targets; (ii) the amount of future
production over any period; (iii) net present value and internal rates of return of mining operations; (iv) assumptions relating to recovered grade, average ore recovery,
internal dilution, mining dilution and other mining parameters set out in the technical reports, studies and disclosure of the Company; (v) assumptions relating to revenues,
operating cash flow and other revenue metrics set out in the Company’s disclosure materials (vi) mine expansion potential and expected mine life; (vii) expected time frames
for completion of permitting and regulatory approvals; (viii) future capital and operating expenditures; (ix) future exploration plans; (x) future gold prices; and (xi) sources of
and anticipated financing requirements. All statements other than statements of historical fact are forward-looking statements. Often, but not always, forward-looking
statements can be identified by the use of words such as “plans”, “expects”, “is expected”, “budget”, “scheduled”, “estimates”, “continues”, “forecasts”, “projects”, “predicts”,
“intends”, “anticipates”, “targets”, or “believes”, or variations of, or the negatives of, such words and phrases or state that certain actions, events or results “may”, “could”,
“would”, “should”, “might” or “will” be taken, occur or be achieved. Forward-looking statements involve known and unknown risks, uncertainties and other factors, which may
cause actual results to differ materially from those anticipated in such forward-looking statements. The forward-looking statements in this presentation speak only as of the
date of this presentation or as of the date or dates specified in such statements.
Forward-looking statements involve known and unknown risks, uncertainties and other factors which are beyond Detour Gold's ability to predict or control and may cause
Detour Gold's actual results, performance or achievements to be materially different from any of its future results, performance or achievements expressed or implied by
forward-looking statements. These risks, uncertainties and other factors include, but are not limited to, gold price volatility, changes in debt and equity markets, the
uncertainties involved in interpreting geological data, risks relating to variations in recovered grades and mining dilution, variations in rates of recovery, changes or delays in
mining development and exploration plans, the success of mining, development and exploration plans, changes in project parameters, risks related to the receipt of
regulatory approvals, increases in costs, environmental compliance and changes in environmental legislation and regulation, interest rate and exchange rate fluctuations,
general economic conditions and other risks involved in the gold exploration and development industry, as well as those risk factors discussed in the section entitled
"Description of Business - Risk Factors" in Detour Gold's 2016 AIF and in the continuous disclosure documents filed by Detour Gold on and available on SEDAR at
www.sedar.com. Such forward-looking statements are also based on a number of assumptions which may prove to be incorrect, including, but not limited to, assumptions
about the following: the availability of financing for exploration and development activities; operating and capital costs; the Company's ability to attract and retain skilled staff;
the mine development and production schedule and related costs, dilution control; sensitivity to metal prices and other sensitivities; the supply and demand for, and the level
and volatility of the price of, gold; timing of the receipt of regulatory and governmental approvals for development projects and other operations; the timing and results of
consultations with the Company’s Aboriginal partners; the supply and availability of consumables and services; the exchange rates of the Canadian dollar to the U.S. dollar;
energy and fuel costs; required capital investments; estimates of net present value and internal rate of returns; the accuracy of reserve and resource estimates, production
estimates and capital and operating cost estimates and the assumptions on which such estimates are based; market competition; ongoing relations with employees and
impacted communities and general business and economic conditions. Accordingly, readers should not place undue reliance on forward-looking statements.
The forward-looking statements contained herein are made as of the date hereof, or such other date or dates specified in such statements.
Detour Gold undertakes no obligation to update publicly or otherwise revise any forward-looking statements contained herein whether as a result of new information or future
events or otherwise, except as may be required by law. If the Company does update one or more forward-looking statements, no inference should be drawn that it will make
additional updates with respect to those or other forward-looking statements.
All monetary amounts are in U.S. dollars unless otherwise stated.
3 |
The Company has included non-IFRS measures in this presentation: total cash costs and all-in sustaining costs,. The Company believes that these measures, in addition to
conventional measures prepared in accordance with IFRS, provide investors an improved ability to evaluate the underlying performance of the Company. The non-IFRS measures
are intended to provide additional information and should not be considered in isolation or as a substitute for measures of performance prepared in accordance with IFRS. These
measures do not have any standardized meaning prescribed under IFRS, and therefore may not be comparable to other issuers. Other companies may calculate these measure
differently.
Detour Gold reports total cash costs on a sales basis. Total cash costs include production costs such as mining, processing, refining and site administration, agreements with
Aboriginal communities, less non-cash share-based compensation and net of silver sales divided by gold ounces sold to arrive at total cash costs per gold ounce sold. The measure
also includes other mine related costs incurred such as mine standby costs and current inventory write downs. Production costs are exclusive of depreciation and depletion.
Production costs include the costs associated with providing the royalty in kind ounces.
The Company believes the measure all-in sustaining costs more fully defines the total costs associated with producing gold. The Company calculates all-in sustaining costs as the
sum of total cash costs (as described above), share-based compensation, corporate general and administrative expense, exploration and evaluation expenses that are sustaining in
nature, reclamation cost accretion, sustaining capital including deferred stripping, and realized gains and losses on hedges due to operating and capital costs, all divided by the gold
ounces sold to arrive at a per ounce figure.
Costs excluded from all-in sustaining costs are non-sustaining capital expenditures and exploration costs that are expected to materially increase production, financing costs and tax
expense. Consequently, this measure is not representative of all of the Company’s cash expenditures. In addition, the calculation of all-in sustaining costs does not include
depreciation and depletion expense as it does not reflect the impact of expenditures incurred in prior periods.
Total site costs and total site costs per ounce
Detour Gold reports total site costs and total site costs per ounce on a sales basis. Total site costs include production and operating costs such as mining, processing, site general
and administration, bullion shipment, refining, agreements with Aboriginal communities, capital costs (including closure costs) and net of silver sales.
The Company calculates total site costs per ounce as the sum of total site costs (as described above) divided by the total gold ounces sold. Gold ounces produced is noted before
delivering the royalty in kind ounces.
Notes to Investors
The scientific and technical content of this presentation was reviewed, verified and approved by Drew Anwyll, P.Eng., Senior Vice President Technical Services, a Qualified Person
as defined by Canadian Securities Administrators National Instrument 43-101 “Standards of Disclosure for Mineral Projects”.
Qualified Persons
Non-IFRS Financial Performance Measures
All monetary amounts are in U.S. dollars unless otherwise stated.
4 |
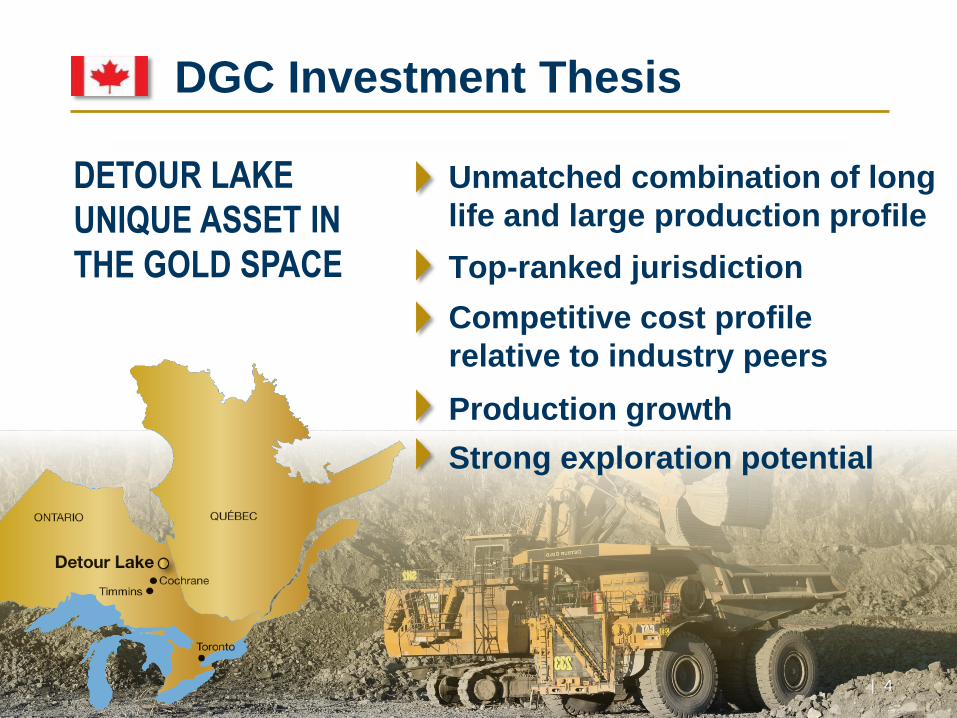
Unmatched combination of long
life and large production profile
Competitive cost profile
relative to industry peers
Production growth
Top-ranked jurisdiction
| 4
DGC Investment Thesis
Strong exploration potential
5 |
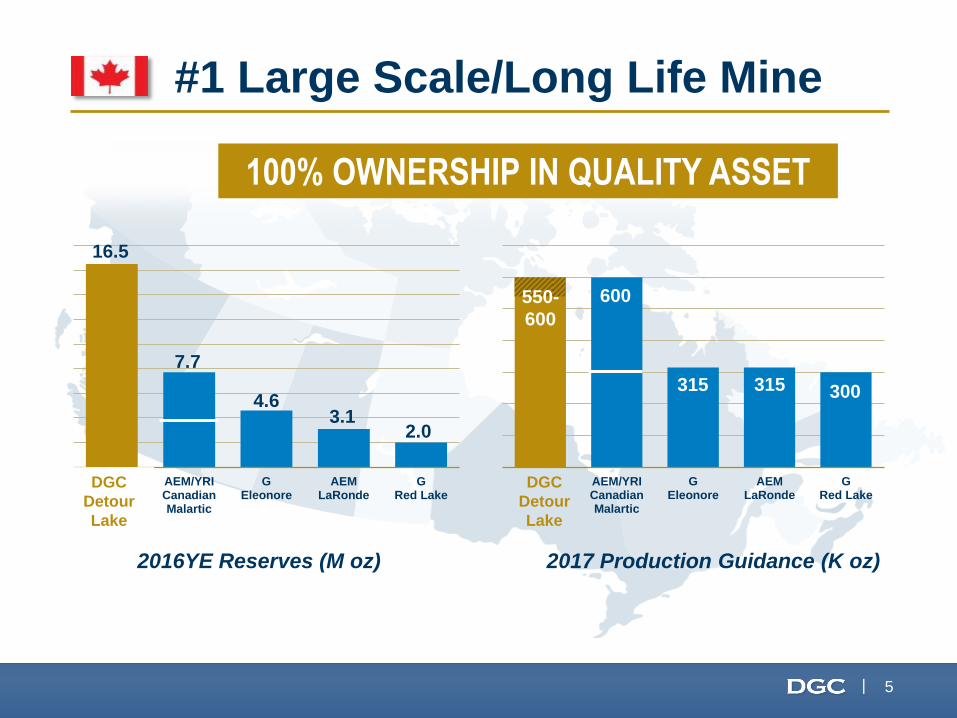
#1 Large Scale/Long Life Mine
100% OWNERSHIP IN QUALITY ASSET
2016YE Reserves (M oz) 2017 Production Guidance (K oz)
AEM/YRICanadianMalartic
GEleonore
AEMLaRonde
GRed Lake
16.5
7.7
4.6 3.1
2.0
AEM/YRICanadianMalartic
GEleonore
AEMLaRonde
GRed Lake
600 550-
600
315 300 315
DGC
Detour
Lake
DGC
Detour
Lake
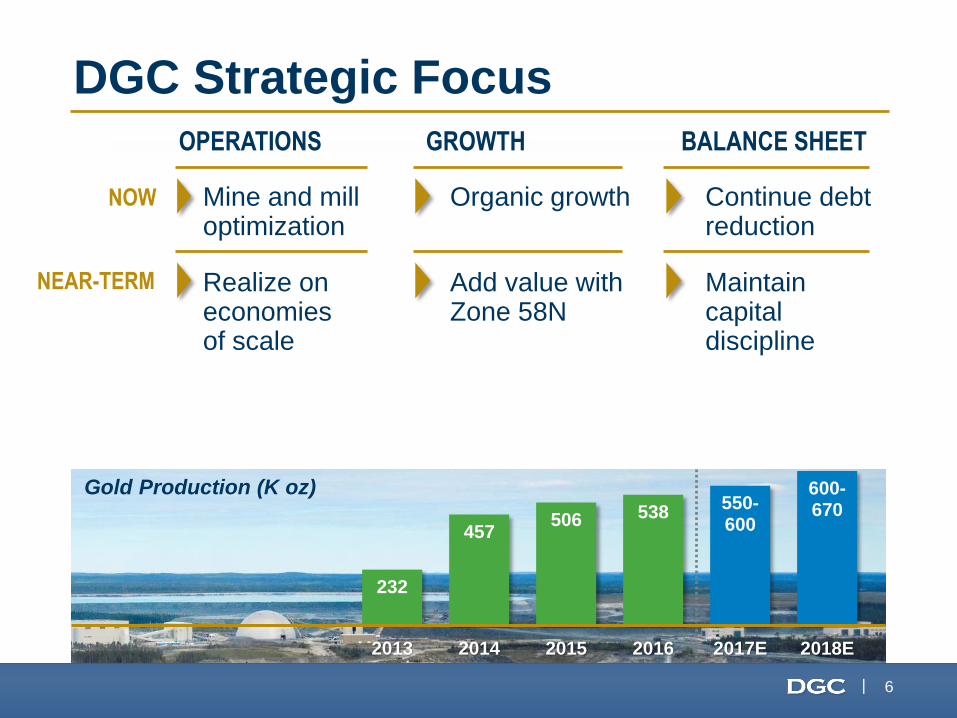
6 |
OPERATIONS GROWTH BALANCE SHEET
Mine and mill optimization
Organic growth Continue debt reduction
Realize on economies of scale
Add value with Zone 58N
Maintain capital discipline
DGC Strategic Focus
232
457 506 538
550- 600
600- 670
2013 2014 2015 2016 2017E 2018E
Gold Production (K oz)
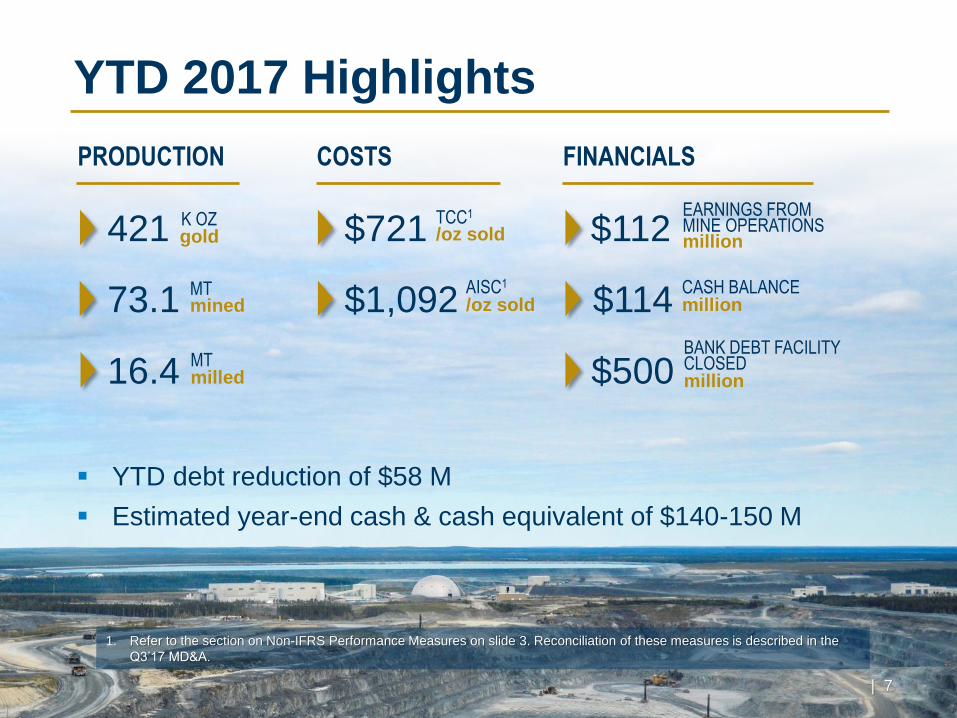
7 |
PRODUCTION
421 K OZ gold
YTD 2017 Highlights
COSTS FINANCIALS
$721
$1,092
TCC1
/oz sold
AISC1
/oz sold
$112 EARNINGS FROM MINE OPERATIONS million
$114 CASH BALANCE million
$500
YTD debt reduction of $58 M
Estimated year-end cash & cash equivalent of $140-150 M
73.1 MT mined
16.4 MT milled
1. Refer to the section on Non-IFRS Performance Measures on slide 3. Reconciliation of these measures is described in the
Q3’17 MD&A.
| 7
BANK DEBT FACILITY CLOSED million
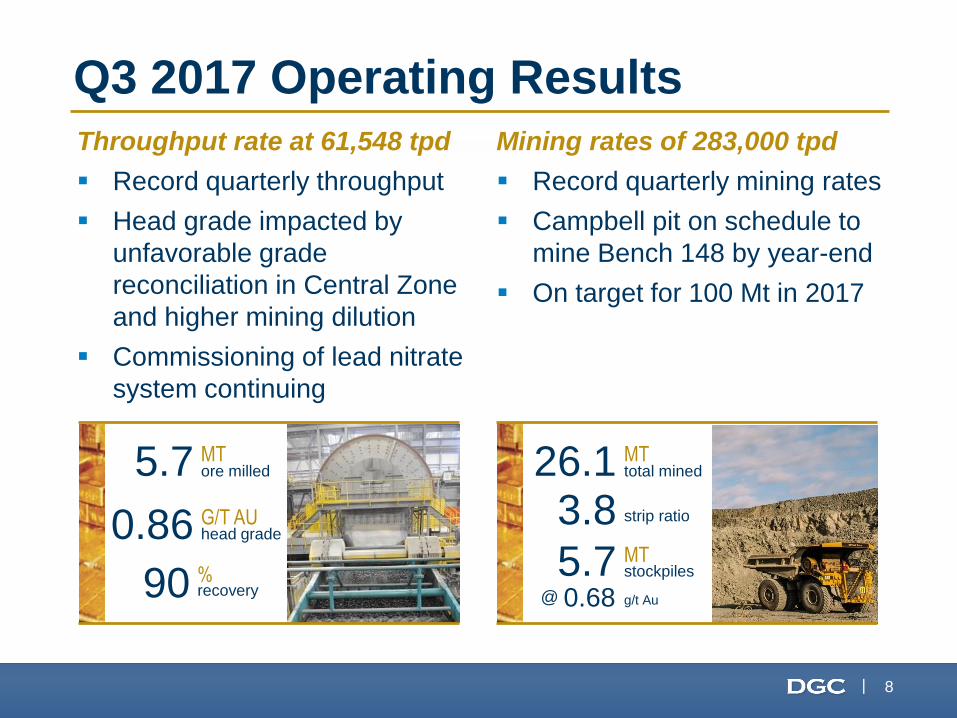
8 |
Q3 2017 Operating Results
total mined 26.1 MT
3.8 strip ratio
MT ore milled
0.86 G/T AU head grade
% recovery
5.7
90
Throughput rate at 61,548 tpd
Record quarterly throughput
Head grade impacted by
unfavorable grade
reconciliation in Central Zone
and higher mining dilution
Commissioning of lead nitrate
system continuing
Mining rates of 283,000 tpd
Record quarterly mining rates
Campbell pit on schedule to
mine Bench 148 by year-end
On target for 100 Mt in 2017
5.7 stockpiles MT
g/t Au @ 0.68
9 |
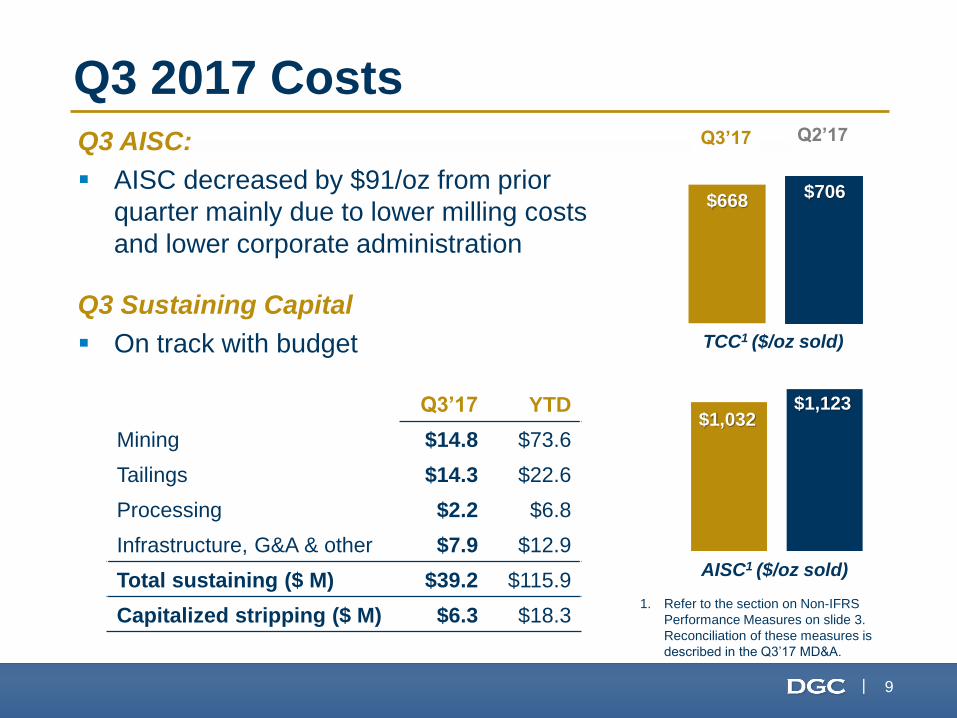
Q3 2017 Costs
1. Refer to the section on Non-IFRS
Performance Measures on slide 3.
Reconciliation of these measures is
described in the Q3’17 MD&A.
Q3 AISC:
AISC decreased by $91/oz from prior
quarter mainly due to lower milling costs
and lower corporate administration
Q3 Sustaining Capital
On track with budget TCC1 ($/oz sold)
Q2’17 Q3’17
AISC1 ($/oz sold)
$1,032 $1,123
$668 $706
Q3’17 YTD
Mining $14.8 $73.6
Tailings $14.3 $22.6
Processing $2.2 $6.8
Infrastructure, G&A & other $7.9 $12.9
Total sustaining ($ M) $39.2 $115.9
Capitalized stripping ($ M) $6.3 $18.3
10 |
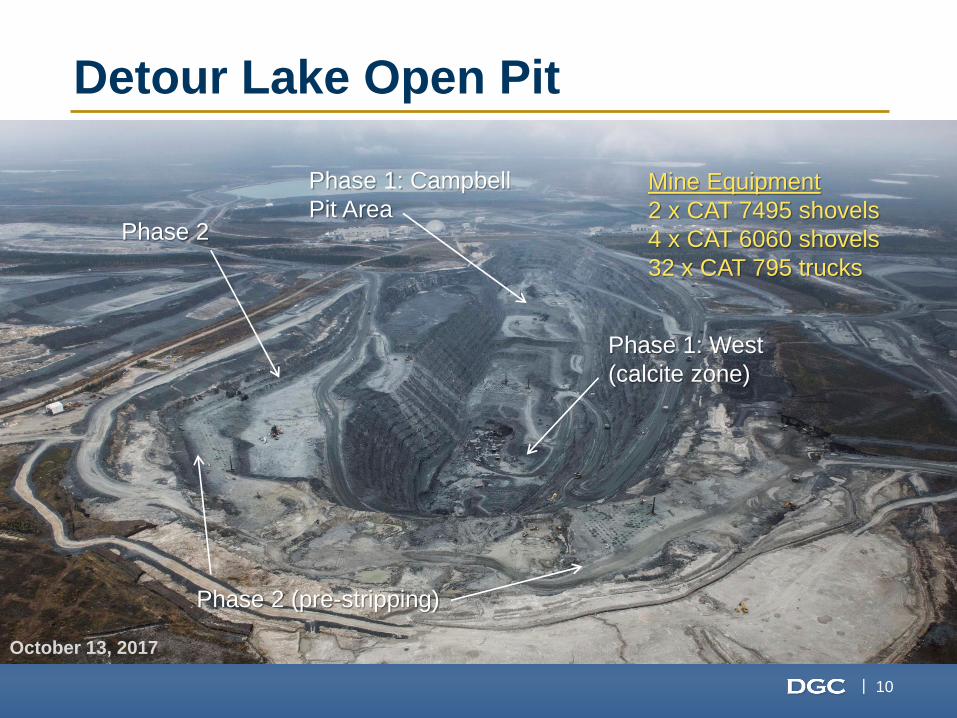
Mine Equipment
2 x CAT 7495 shovels
4 x CAT 6060 shovels
32 x CAT 795 trucks
Phase 1: Campbell
Pit Area
Phase 2 (pre-stripping)
October 13, 2017
Phase 1: West
(calcite zone)
Phase 2
Detour Lake Open Pit
11 |
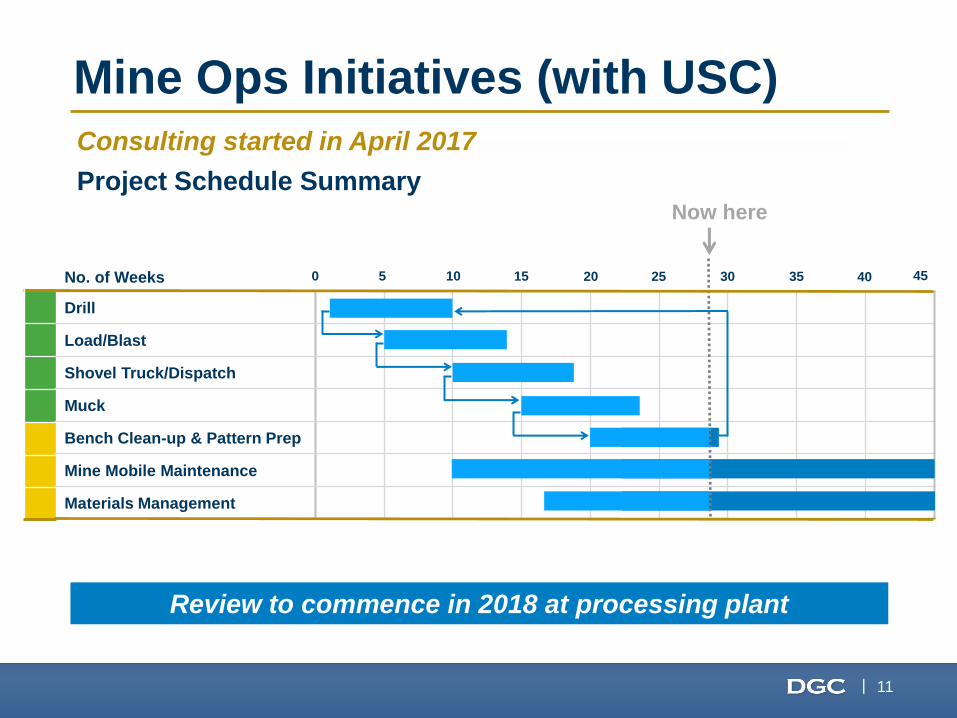
Mine Ops Initiatives (with USC)
Consulting started in April 2017
Project Schedule Summary
Review to commence in 2018 at processing plant
Now here
No. of Weeks
Drill
Load/Blast
Shovel Truck/Dispatch
Muck
Bench Clean-up & Pattern Prep
Mine Mobile Maintenance
Materials Management
0 5 10 15 20 25 30 35 40 45
12 |
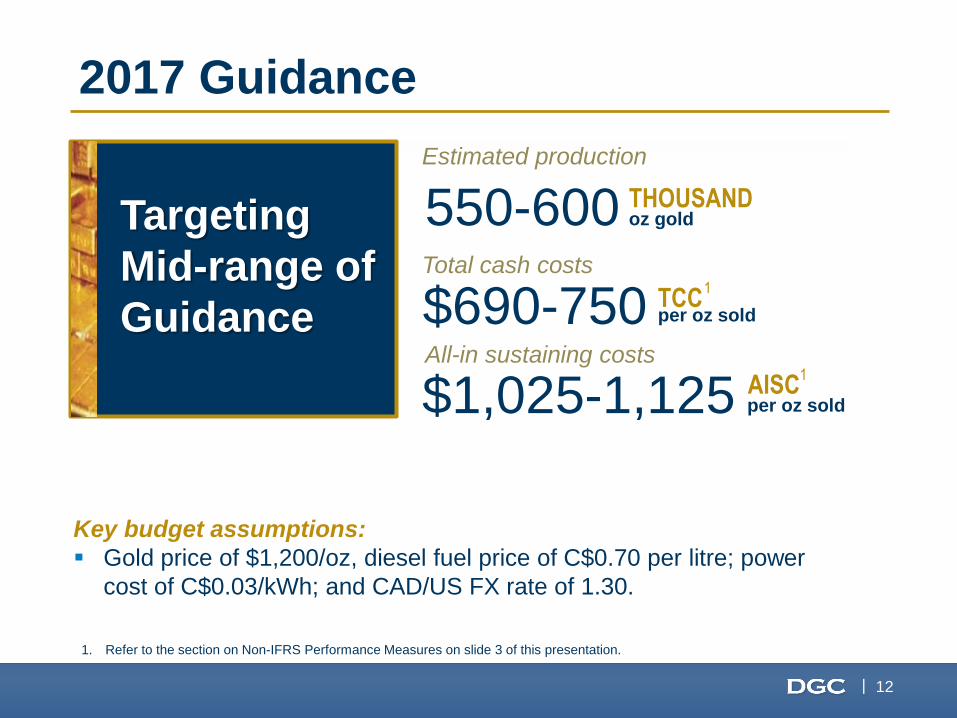
2017 Guidance
550-600 THOUSAND oz gold
$690-750 TCC per oz sold
1
$1,025-1,125 All-in sustaining costs
AISC per oz sold
1
Estimated production
Total cash costs
Key budget assumptions:
Gold price of $1,200/oz, diesel fuel price of C$0.70 per litre; power
cost of C$0.03/kWh; and CAD/US FX rate of 1.30.
1. Refer to the section on Non-IFRS Performance Measures on slide 3 of this presentation.
Targeting
Mid-range of
Guidance
13 |
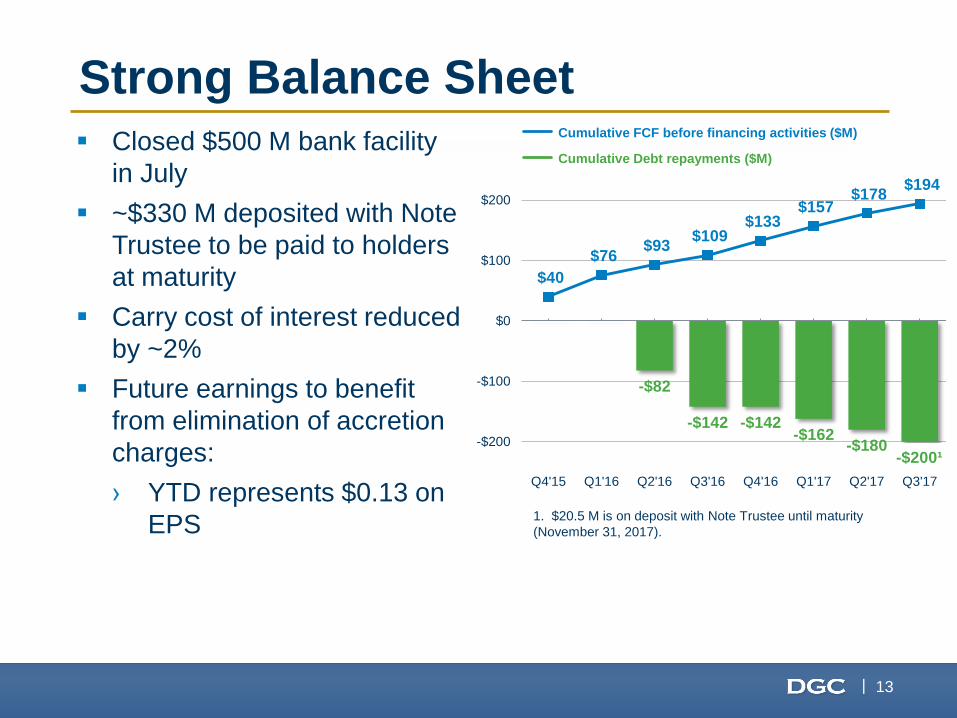
Strong Balance Sheet
Closed $500 M bank facility
in July
~$330 M deposited with Note
Trustee to be paid to holders
at maturity
Carry cost of interest reduced
by ~2%
Future earnings to benefit
from elimination of accretion
charges:
› YTD represents $0.13 on
EPS
-$82
-$142 -$142 -$162
-$180 -$200¹
$40
$76 $93
$109 $133
$157 $178
$194
Q4'15 Q1'16 Q2'16 Q3'16 Q4'16 Q1'17 Q2'17 Q3'17
-$200
-$100
$0
$100
$200
Cumulative FCF before financing activities ($M)
1. $20.5 M is on deposit with Note Trustee until maturity
(November 31, 2017).
Cumulative Debt repayments ($M)
14 |
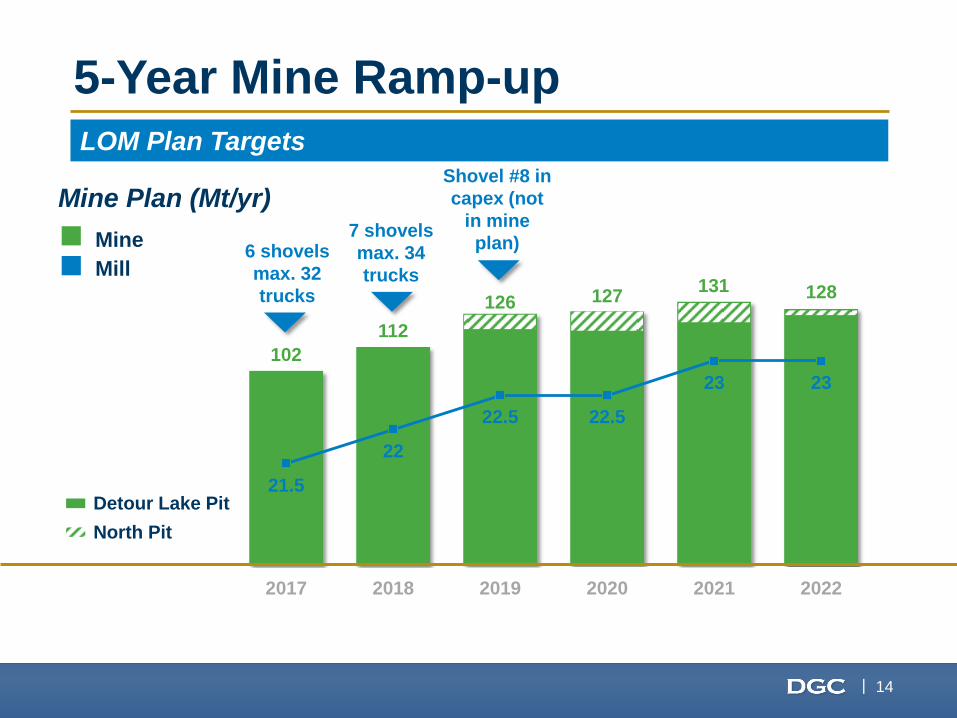
5-Year Mine Ramp-up
102
112
126
21.5
22
22.5 22.5
23 23
2017 2018 2019 2020 2021 2022
Mine Plan (Mt/yr)
Mine
Mill
LOM Plan Targets
6 shovels
max. 32
trucks
7 shovels
max. 34
trucks
Shovel #8 in
capex (not
in mine
plan)
Detour Lake Pit
North Pit
131 128 127
15 |
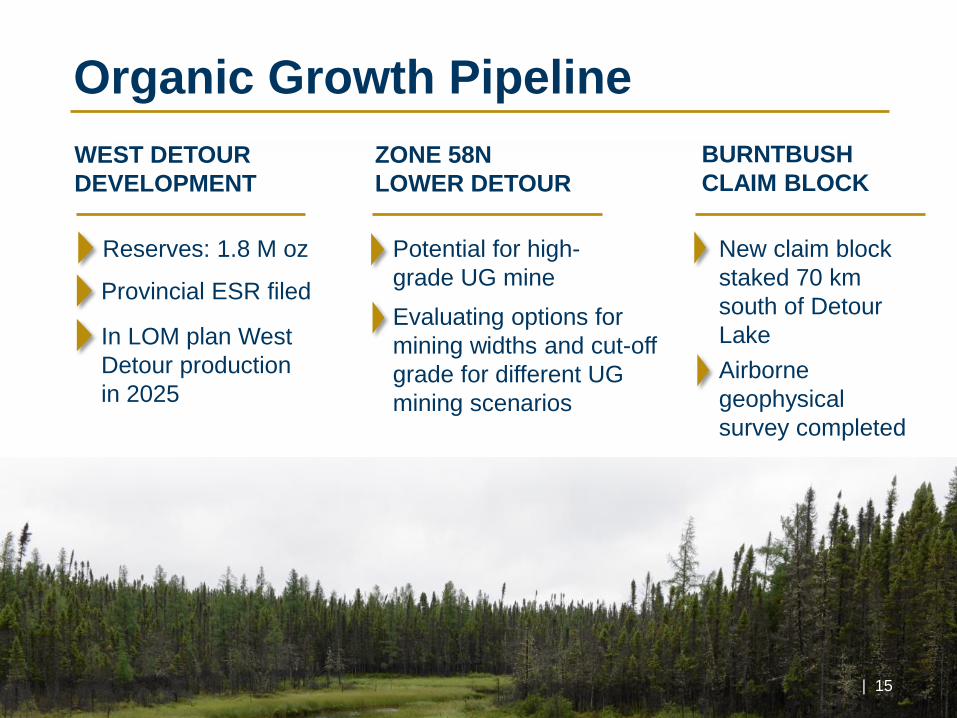
Organic Growth Pipeline
WEST DETOUR
DEVELOPMENT
ZONE 58N
LOWER DETOUR
Provincial ESR filed
In LOM plan West
Detour production
in 2025
Reserves: 1.8 M oz
Evaluating options for
mining widths and cut-off
grade for different UG
mining scenarios
Potential for high-
grade UG mine
| 15
BURNTBUSH
CLAIM BLOCK
New claim block
staked 70 km
south of Detour
Lake
Airborne
geophysical
survey completed
16 |
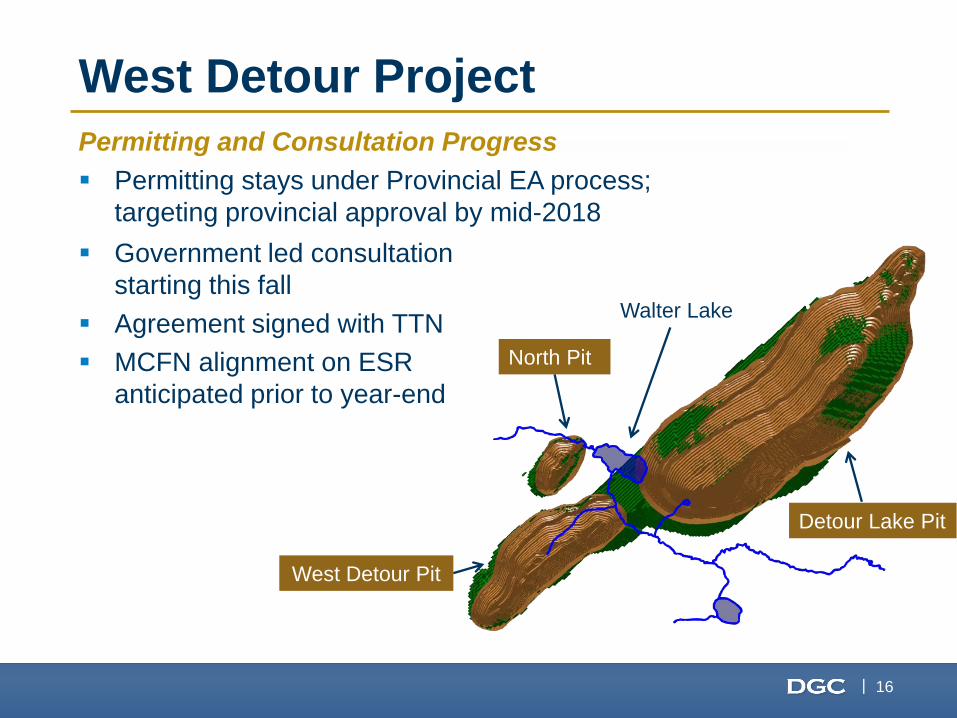
West Detour Project
Walter Lake
North Pit
West Detour Pit
Detour Lake Pit
Permitting and Consultation Progress
Permitting stays under Provincial EA process;
targeting provincial approval by mid-2018
Government led consultation
starting this fall
Agreement signed with TTN
MCFN alignment on ESR
anticipated prior to year-end
17 |
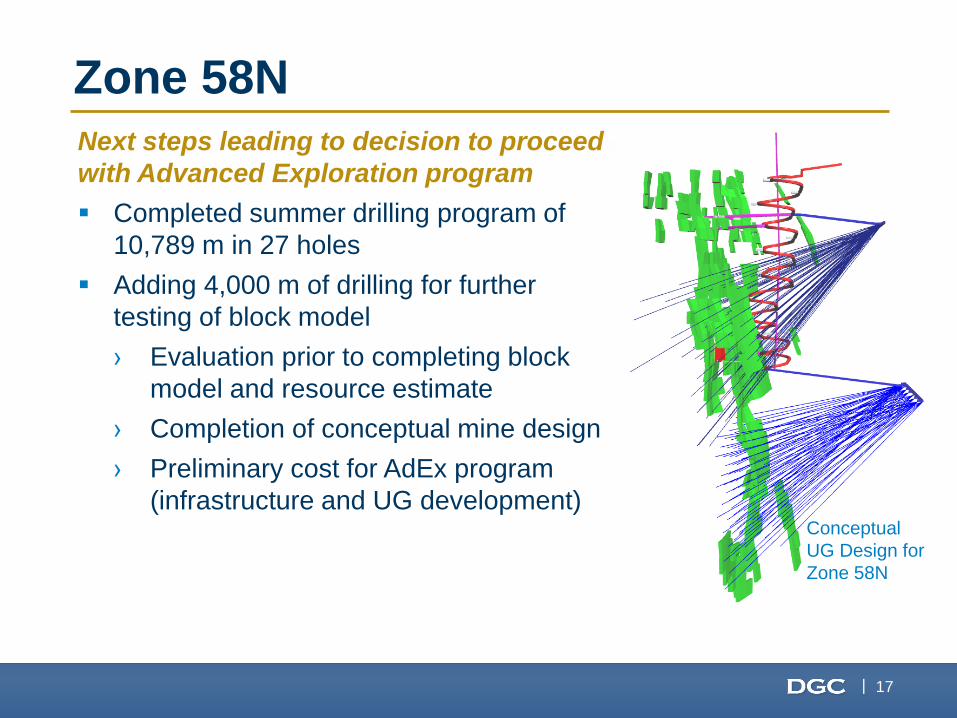
Zone 58N
Next steps leading to decision to proceed
with Advanced Exploration program
Completed summer drilling program of
10,789 m in 27 holes
Adding 4,000 m of drilling for further
testing of block model
› Evaluation prior to completing block
model and resource estimate
› Completion of conceptual mine design
› Preliminary cost for AdEx program
(infrastructure and UG development)
Conceptual
UG Design for
Zone 58N
18 |
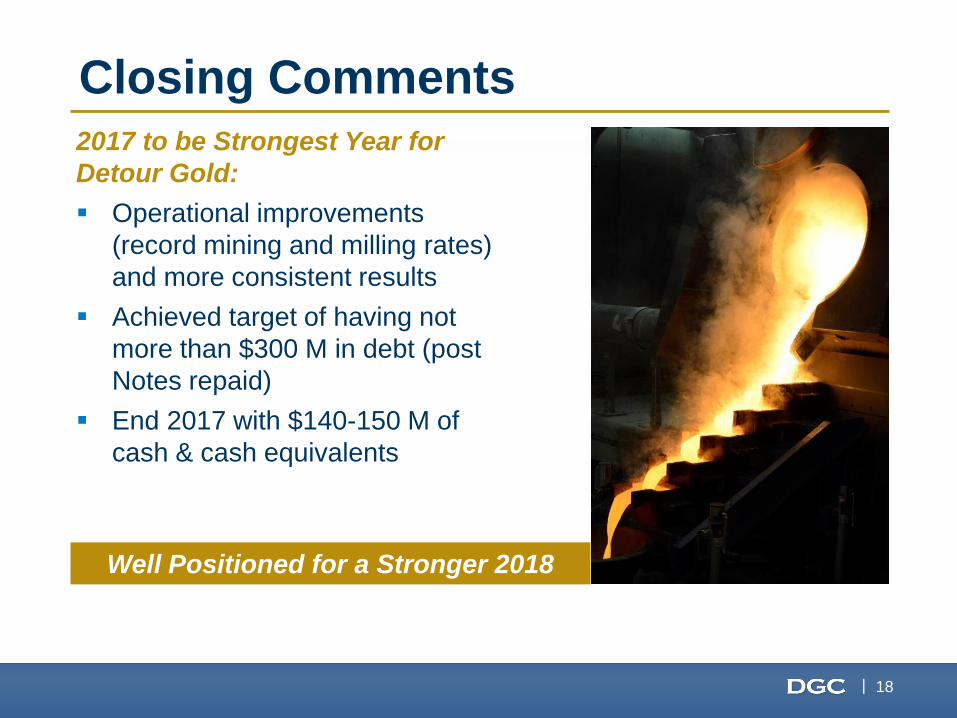
Closing Comments
2017 to be Strongest Year for
Detour Gold:
Operational improvements
(record mining and milling rates)
and more consistent results
Achieved target of having not
more than $300 M in debt (post
Notes repaid)
End 2017 with $140-150 M of
cash & cash equivalents
Well Positioned for a Stronger 2018
19 |
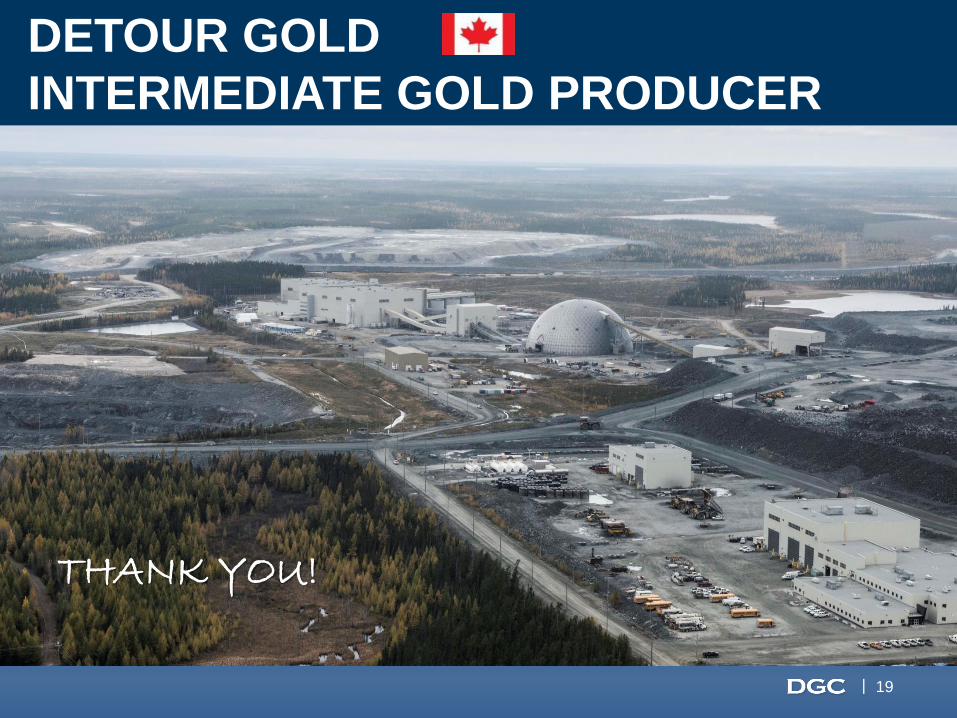
DETOUR GOLD
INTERMEDIATE GOLD PRODUCER
THANK YOU!
20 |
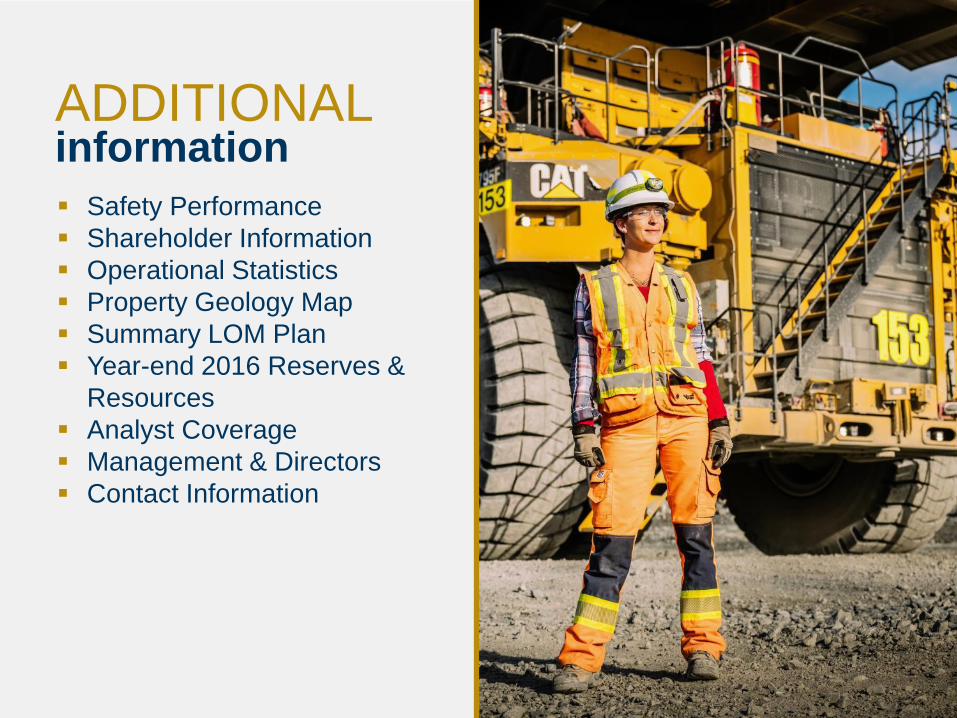
ADDITIONAL information
Safety Performance
Shareholder Information
Operational Statistics
Property Geology Map
Summary LOM Plan
Year-end 2016 Reserves &
Resources
Analyst Coverage
Management & Directors
Contact Information
21 |
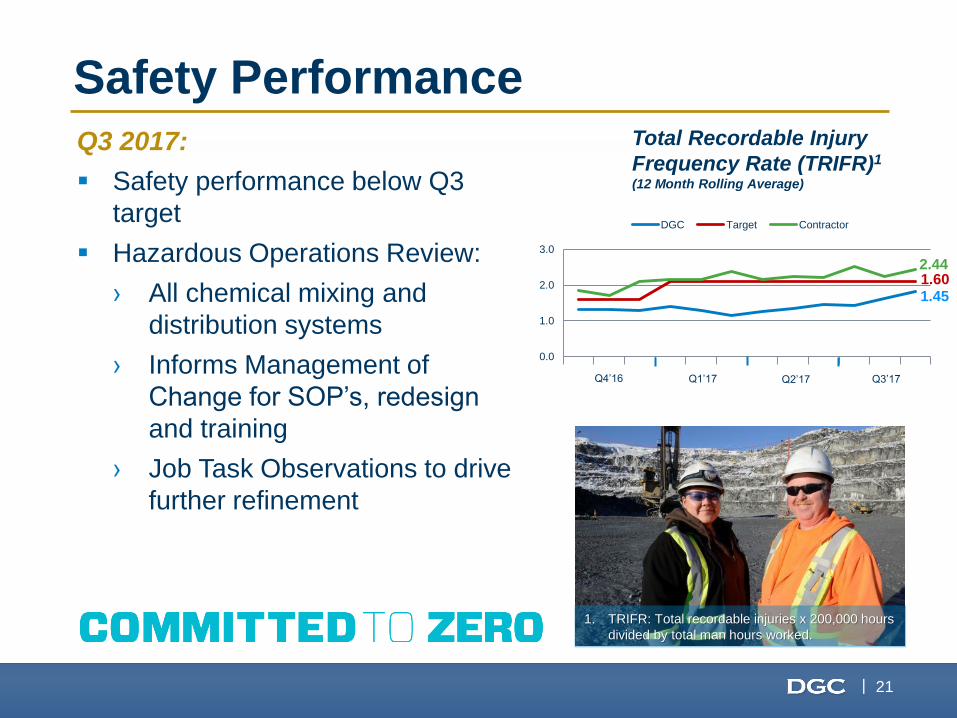
Total Recordable Injury
Frequency Rate (TRIFR)1
(12 Month Rolling Average)
Safety Performance
1. TRIFR: Total recordable injuries x 200,000 hours
divided by total man hours worked.
0.0
1.0
2.0
3.0
DGC Target Contractor
Q1’17 Q4’16 Q2’17 Q3’17
2.44 1.60 1.45
Q3 2017:
Safety performance below Q3
target
Hazardous Operations Review:
› All chemical mixing and
distribution systems
› Informs Management of
Change for SOP’s, redesign
and training
› Job Task Observations to drive
further refinement
22 |
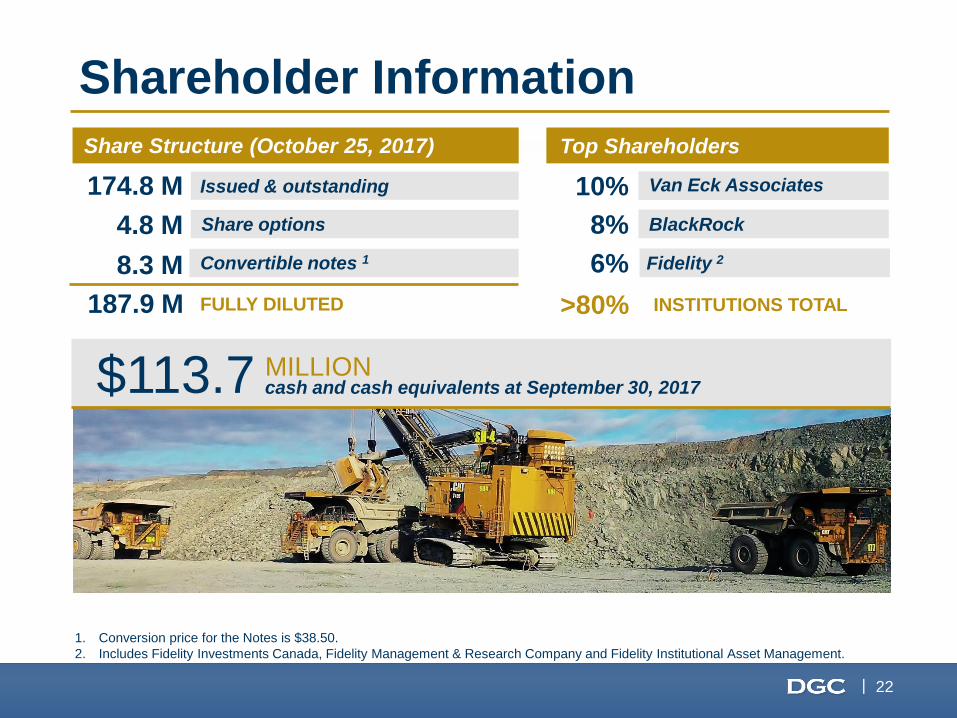
1. Conversion price for the Notes is $38.50.
2. Includes Fidelity Investments Canada, Fidelity Management & Research Company and Fidelity Institutional Asset Management.
Shareholder Information
>80% INSTITUTIONS TOTAL
4.8 M Share options
8.3 M Convertible notes 1
187.9 M FULLY DILUTED
174.8 M Issued & outstanding
Share Structure (03/31/2014) Top Shareholders
10%
$113.7 MILLION cash and cash equivalents at September 30, 2017
Share Structure (October 25, 2017) Top Shareholders
Van Eck Associates
8% BlackRock
6% Fidelity 2
23 |
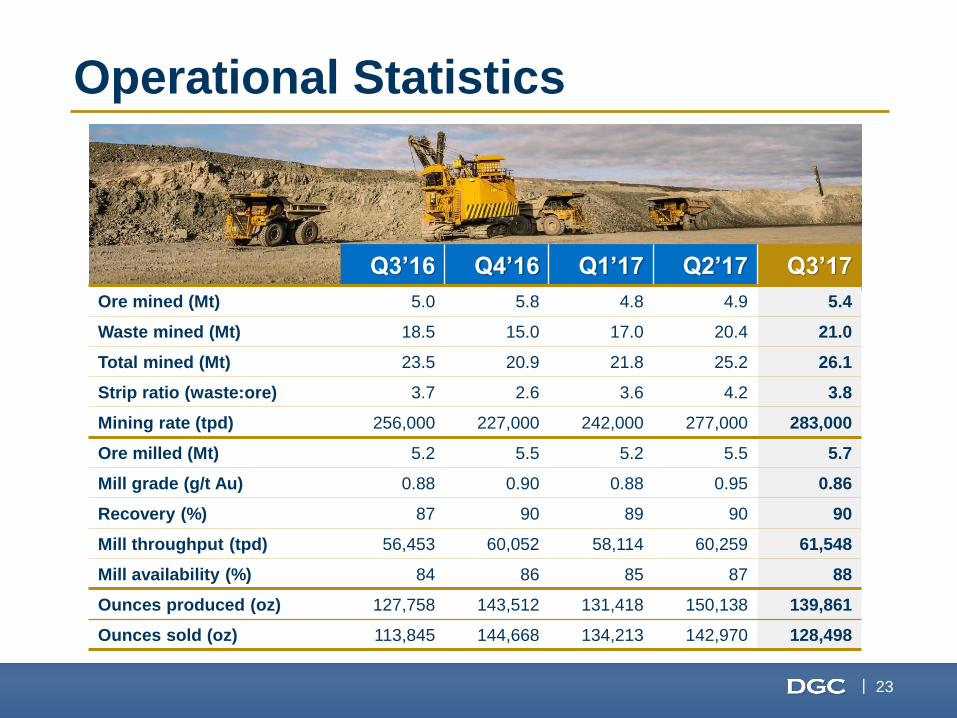
Operational Statistics
Q3’16 Q4’16 Q1’17 Q2’17 Q3’17
Ore mined (Mt) 5.0 5.8 4.8 4.9 5.4
Waste mined (Mt) 18.5 15.0 17.0 20.4 21.0
Total mined (Mt) 23.5 20.9 21.8 25.2 26.1
Strip ratio (waste:ore) 3.7 2.6 3.6 4.2 3.8
Mining rate (tpd) 256,000 227,000 242,000 277,000 283,000
Ore milled (Mt) 5.2 5.5 5.2 5.5 5.7
Mill grade (g/t Au) 0.88 0.90 0.88 0.95 0.86
Recovery (%) 87 90 89 90 90
Mill throughput (tpd) 56,453 60,052 58,114 60,259 61,548
Mill availability (%) 84 86 85 87 88
Ounces produced (oz) 127,758 143,512 131,418 150,138 139,861
Ounces sold (oz) 113,845 144,668 134,213 142,970 128,498
24 |
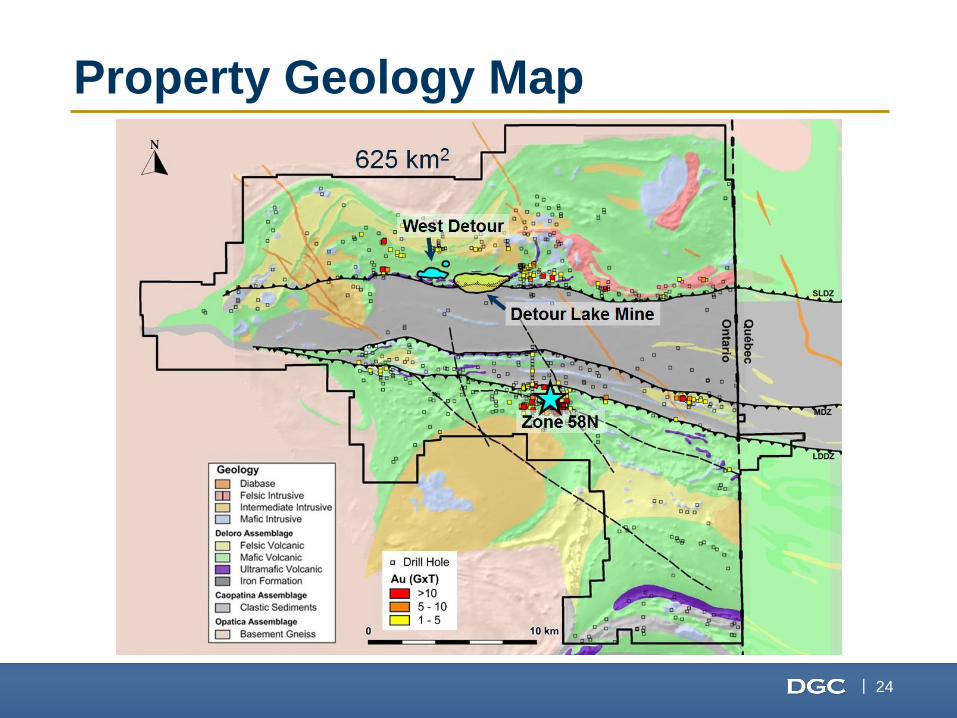
Property Geology Map
25 |
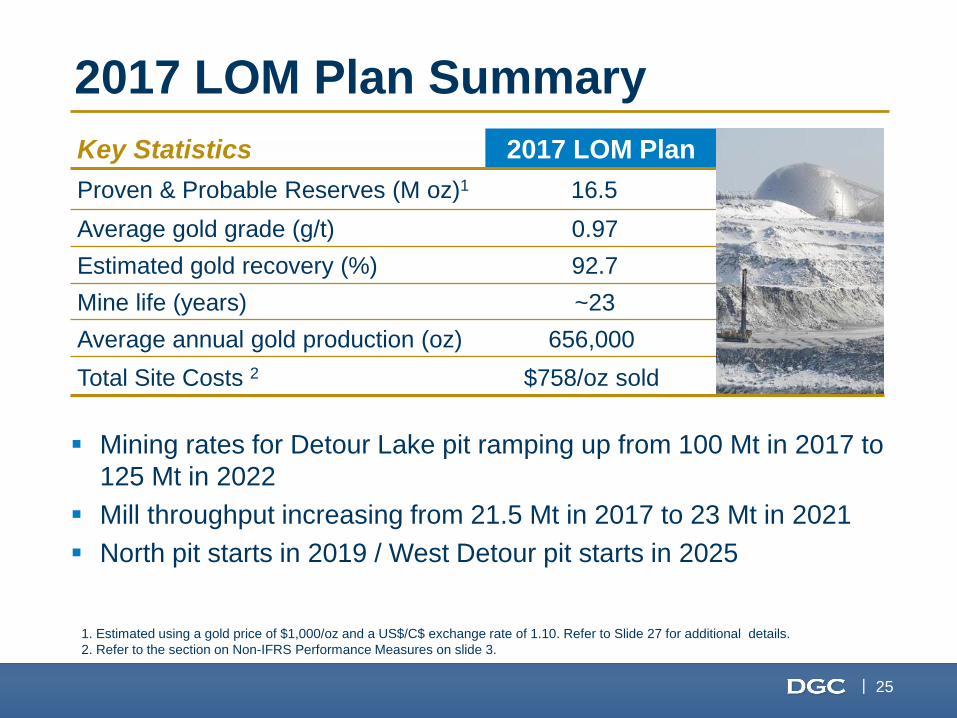
2017 LOM Plan Summary
Key Statistics 2017 LOM Plan
Proven & Probable Reserves (M oz)1 16.5
Average gold grade (g/t) 0.97
Estimated gold recovery (%) 92.7
Mine life (years) ~23
Average annual gold production (oz) 656,000
Total Site Costs 2 $758/oz sold
1. Estimated using a gold price of $1,000/oz and a US$/C$ exchange rate of 1.10. Refer to Slide 27 for additional details.
2. Refer to the section on Non-IFRS Performance Measures on slide 3.
Mining rates for Detour Lake pit ramping up from 100 Mt in 2017 to
125 Mt in 2022
Mill throughput increasing from 21.5 Mt in 2017 to 23 Mt in 2021
North pit starts in 2019 / West Detour pit starts in 2025
26 |
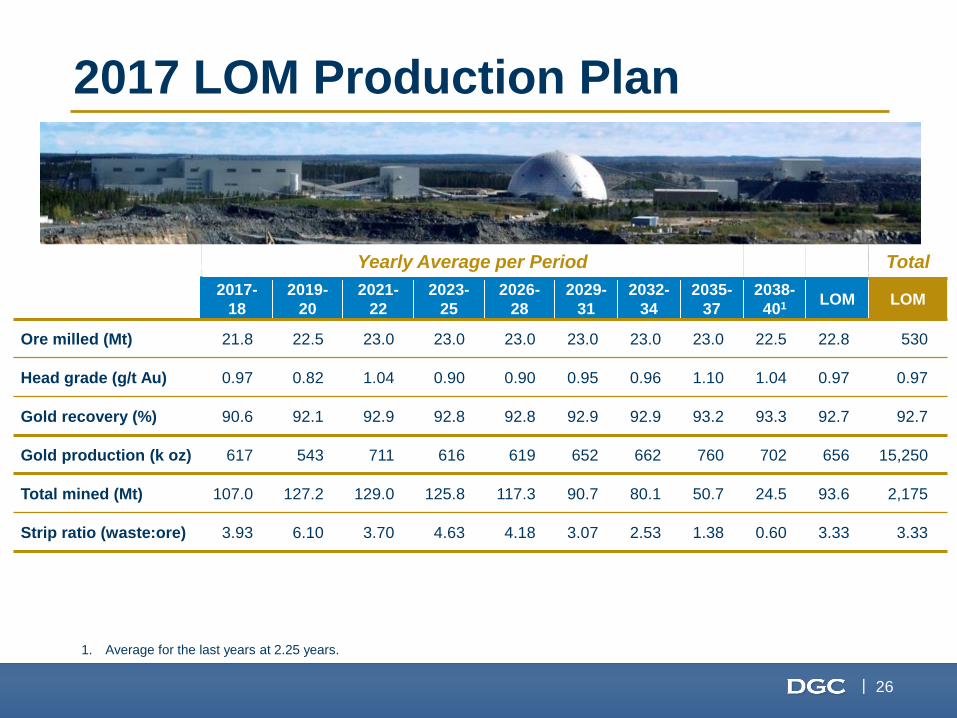
2017 LOM Production Plan
Yearly Average per Period Total
2017-
18
2019-
20
2021-
22
2023-
25
2026-
28
2029-
31
2032-
34
2035-
37
2038-
401 LOM LOM
Ore milled (Mt) 21.8 22.5 23.0 23.0 23.0 23.0 23.0 23.0 22.5 22.8 530
Head grade (g/t Au) 0.97 0.82 1.04 0.90 0.90 0.95 0.96 1.10 1.04 0.97 0.97
Gold recovery (%) 90.6 92.1 92.9 92.8 92.8 92.9 92.9 93.2 93.3 92.7 92.7
Gold production (k oz) 617 543 711 616 619 652 662 760 702 656 15,250
Total mined (Mt) 107.0 127.2 129.0 125.8 117.3 90.7 80.1 50.7 24.5 93.6 2,175
Strip ratio (waste:ore) 3.93 6.10 3.70 4.63 4.18 3.07 2.53 1.38 0.60 3.33 3.33
1. Average for the last years at 2.25 years.
27 |
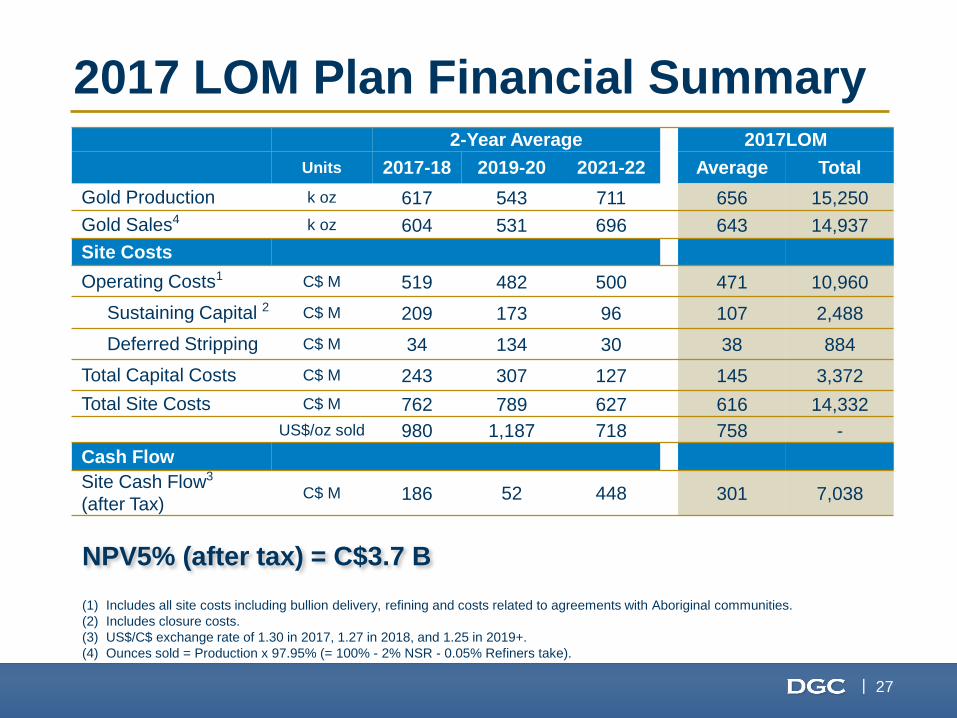
(1) Includes all site costs including bullion delivery, refining and costs related to agreements with Aboriginal communities.
(2) Includes closure costs.
(3) US$/C$ exchange rate of 1.30 in 2017, 1.27 in 2018, and 1.25 in 2019+.
(4) Ounces sold = Production x 97.95% (= 100% - 2% NSR - 0.05% Refiners take).
2-Year Average 2017LOM
Units 2017-18 2019-20 2021-22 Average Total
Gold Production k oz 617 543 711 656 15,250
Gold Sales4 k oz 604 531 696 643 14,937
Site Costs
Operating Costs1 C$ M 519 482 500 471 10,960
Sustaining Capital 2 C$ M 209 173 96 107 2,488
Deferred Stripping C$ M 34 134 30 38 884
Total Capital Costs C$ M 243 307 127 145 3,372
Total Site Costs C$ M 762 789 627 616 14,332
US$/oz sold 980 1,187 718 758 -
Cash Flow
Site Cash Flow3
(after Tax) C$ M 186 52 448 301 7,038
2017 LOM Plan Financial Summary
NPV5% (after tax) = C$3.7 B
28 |
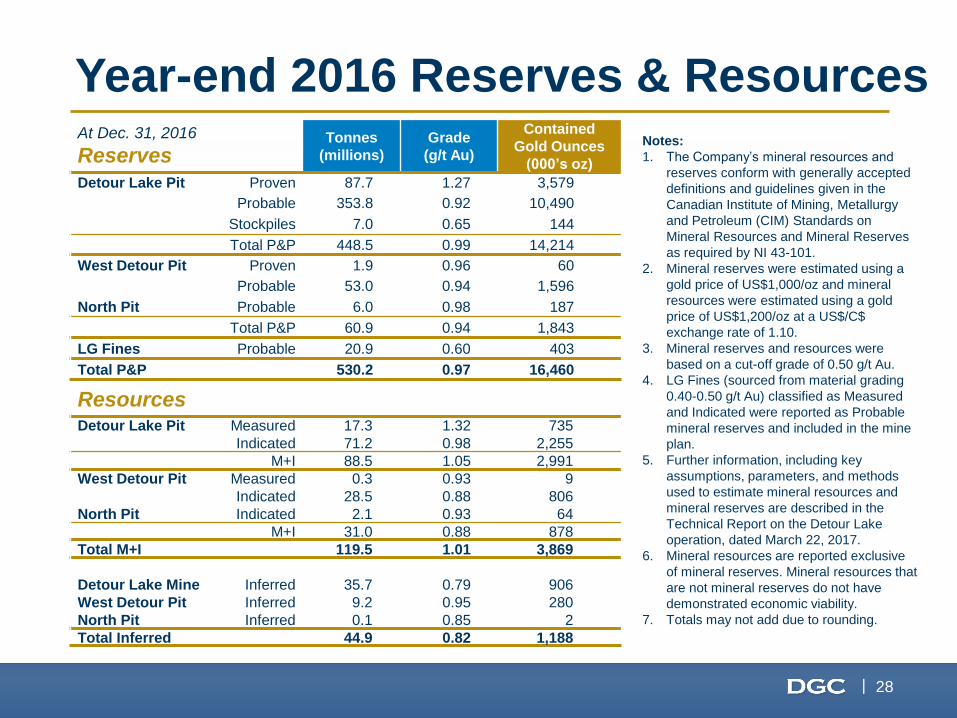
Year-end 2016 Reserves & Resources Notes:
1. The Company’s mineral resources and
reserves conform with generally accepted
definitions and guidelines given in the
Canadian Institute of Mining, Metallurgy
and Petroleum (CIM) Standards on
Mineral Resources and Mineral Reserves
as required by NI 43-101.
2. Mineral reserves were estimated using a
gold price of US$1,000/oz and mineral
resources were estimated using a gold
price of US$1,200/oz at a US$/C$
exchange rate of 1.10.
3. Mineral reserves and resources were
based on a cut-off grade of 0.50 g/t Au.
4. LG Fines (sourced from material grading
0.40-0.50 g/t Au) classified as Measured
and Indicated were reported as Probable
mineral reserves and included in the mine
plan.
5. Further information, including key
assumptions, parameters, and methods
used to estimate mineral resources and
mineral reserves are described in the
Technical Report on the Detour Lake
operation, dated March 22, 2017.
6. Mineral resources are reported exclusive
of mineral reserves. Mineral resources that
are not mineral reserves do not have
demonstrated economic viability.
7. Totals may not add due to rounding.
At Dec. 31, 2016
Reserves Tonnes
(millions)
Grade
(g/t Au)
Contained
Gold Ounces
(000’s oz)
Detour Lake Pit Proven 87.7 1.27 3,579
Probable 353.8 0.92 10,490
Stockpiles 7.0 0.65 144
Total P&P 448.5 0.99 14,214
West Detour Pit Proven 1.9 0.96 60
Probable 53.0 0.94 1,596
North Pit Probable 6.0 0.98 187
Total P&P 60.9 0.94 1,843
LG Fines Probable 20.9 0.60 403
Total P&P 530.2 0.97 16,460
Resources
Detour Lake Pit Measured 17.3 1.32 735
Indicated 71.2 0.98 2,255
M+I 88.5 1.05 2,991
West Detour Pit Measured 0.3 0.93 9
Indicated 28.5 0.88 806
North Pit Indicated 2.1 0.93 64
M+I 31.0 0.88 878
Total M+I 119.5 1.01 3,869
Detour Lake Mine Inferred 35.7 0.79 906
West Detour Pit Inferred 9.2 0.95 280
North Pit Inferred 0.1 0.85 2
Total Inferred 44.9 0.82 1,188
29 |
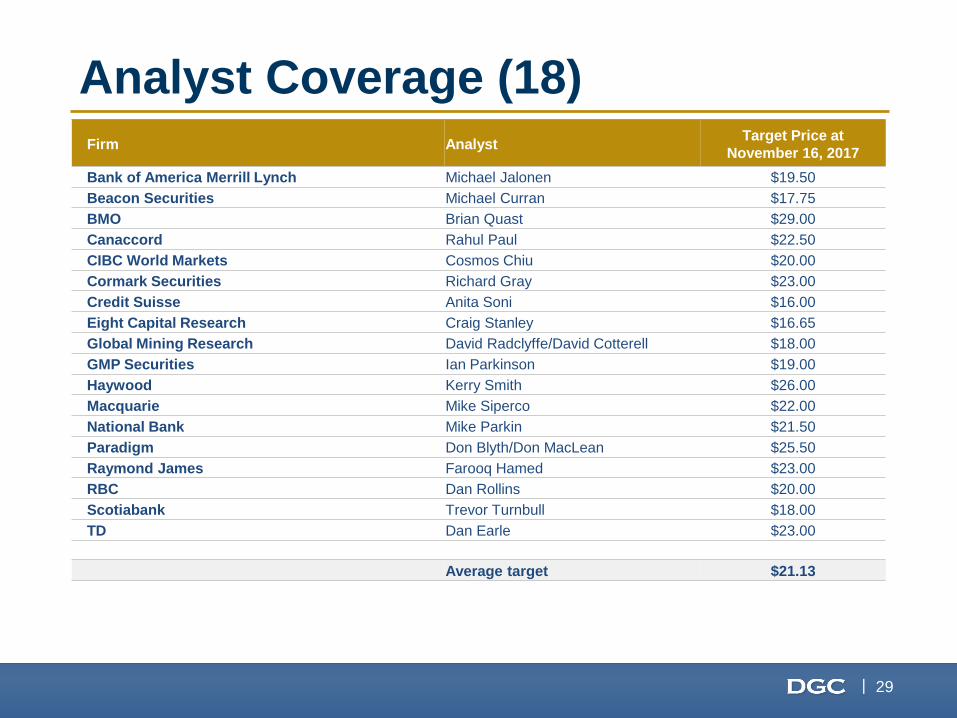
Analyst Coverage (18) Firm Analyst
Target Price at
November 16, 2017
Bank of America Merrill Lynch Michael Jalonen $19.50
Beacon Securities Michael Curran $17.75
BMO Brian Quast $29.00
Canaccord Rahul Paul $22.50
CIBC World Markets Cosmos Chiu $20.00
Cormark Securities Richard Gray $23.00
Credit Suisse Anita Soni $16.00
Eight Capital Research Craig Stanley $16.65
Global Mining Research David Radclyffe/David Cotterell $18.00
GMP Securities Ian Parkinson $19.00
Haywood Kerry Smith $26.00
Macquarie Mike Siperco $22.00
National Bank Mike Parkin $21.50
Paradigm Don Blyth/Don MacLean $25.50
Raymond James Farooq Hamed $23.00
RBC Dan Rollins $20.00
Scotiabank Trevor Turnbull $18.00
TD Dan Earle $23.00
Average target $21.13
30 |
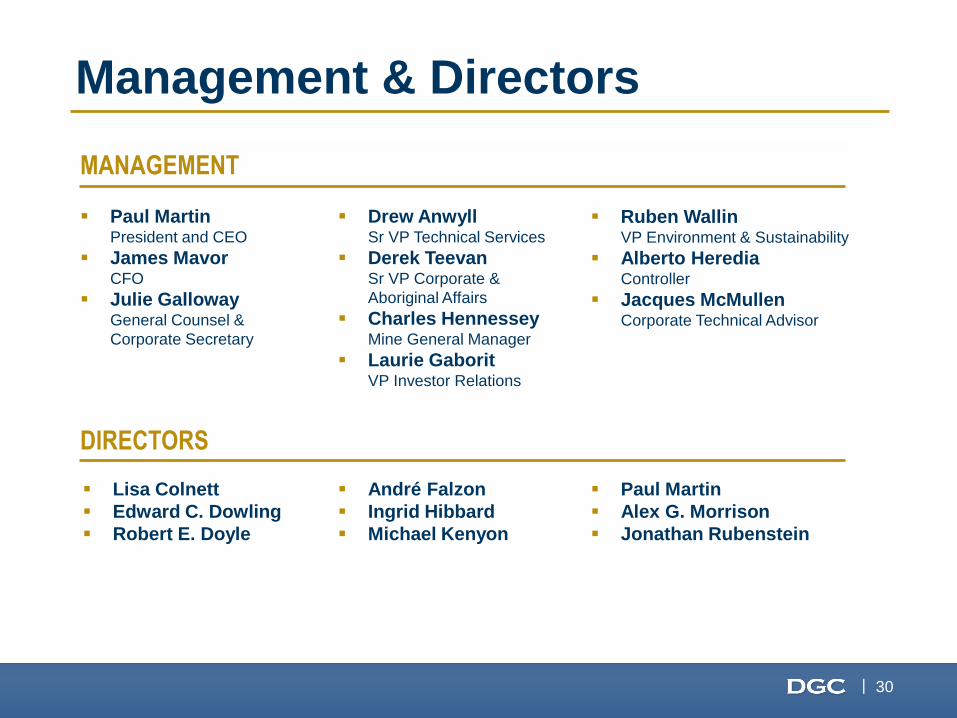
Paul Martin President and CEO
James Mavor CFO
Julie Galloway General Counsel &
Corporate Secretary
Drew Anwyll Sr VP Technical Services
Derek Teevan Sr VP Corporate &
Aboriginal Affairs
Charles Hennessey Mine General Manager
Laurie Gaborit VP Investor Relations
Ruben Wallin VP Environment & Sustainability
Alberto Heredia Controller
Jacques McMullen Corporate Technical Advisor
Lisa Colnett
Edward C. Dowling
Robert E. Doyle
Paul Martin
Alex G. Morrison
Jonathan Rubenstein
André Falzon
Ingrid Hibbard
Michael Kenyon
Management & Directors
MANAGEMENT
DIRECTORS
31 |
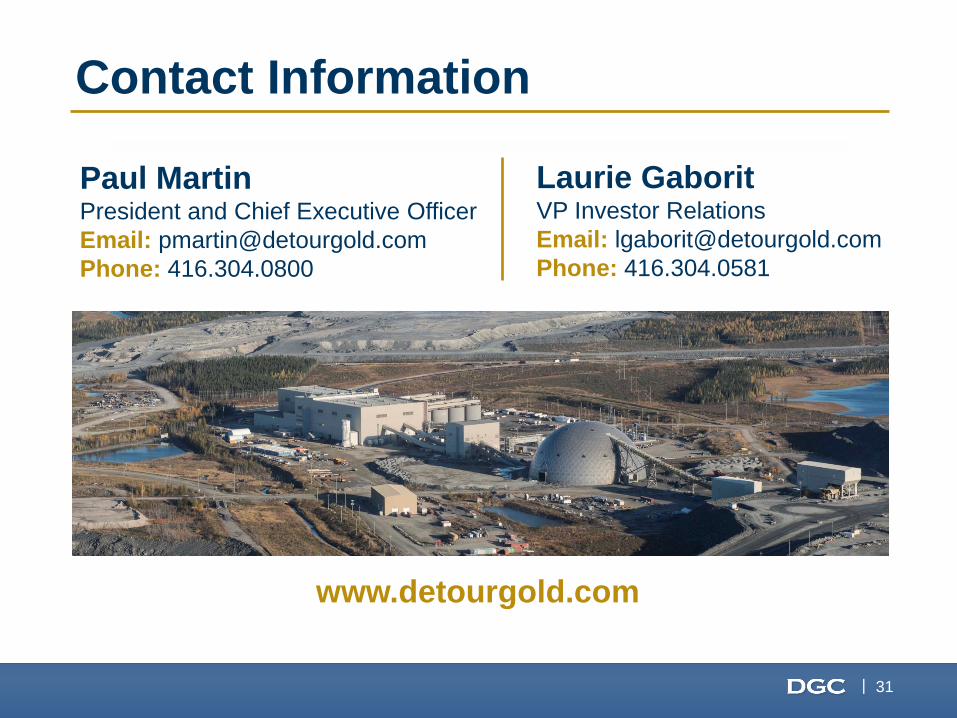
Laurie Gaborit VP Investor Relations
Email: [email protected]
Phone: 416.304.0581
Paul Martin President and Chief Executive Officer
Email: [email protected]
Phone: 416.304.0800
www.detourgold.com
Contact Information