Embed Size (px)
Citation preview

Radon in the Living Environment,19-23 April 1999, Athens, Greece 091
773
INFLUENCE OF UNDERGROUND MINING ON THE GEOGENIC RADON POTENTIAL
R. Klingel 1, J. Kemski 2
1 Institute of Geology, Bonn UniversityNussallee 8, D-53115 Bonn, Germany
tel.: ++49 228 73 2488, fax: ++49 228 73 9037, e-mail: [email protected] Kemski, Klingel & Veerhoff, Consulting Geologists
Von-Weichs-Strasse 9a, D-53121 Bonn, Germanytel.: ++49 228 6200910, fax: ++49 228 6200913, e-mail: [email protected]
Different aspects of the geogenic radon potential in a coal mining area in south-western Germany arediscussed. Due to the rather low specific radium activities of rocks and soils varying between 10 and70 Bq/kg a low geogenic radon potential can be expected. Radon concentrations in soil gas inabandoned mining areas are characterized by a lognormal distribution with a median value of 20kBq/m3. In the neighboring area with deep mining generally younger than two years, radon contentsincrease up to a median value of 38 kBq/m3. The radon background in mining areas can besuperimposed by an advective, structurally controlled component. Actually, narrow mining inducedfracture zones constant in time and adjacent to the mining area often show radon peaks in soil gas fourto five times higher than the background reaching values of more than 100 kBq/m3. A positivecorrelation between methane and radon at methane degassing spots is probably caused by a CH4 flow,which collects radon from the soil and carries it up to the surface. Indoor measurements in about 100houses over a period of three months were conducted. The radon concentrations on ground floor arenot influenced by the mining activities. In the basement, however, higher radon concentrations weredetected. A time-dependent spatial shift of high indoor values following the direction of undergroundcoal mining can be explained by the disturbance of the rock system strength in the subsurface leadingto tectonic movements just above the recent mining area.Key words: deep mining, geogenic radon potential, indoor radon, radon in soil gas
INTRODUCTION
The breakdown of drifts and crosscuts following underground coal mining leads to drasticdisruptions at the surface known as subsidence. These movements change the fabric of the rocksgenerating sufficient pathways for an enhanced migration of soil gases in the subsurface. Therefore,mining regions are considered to be potentially radon affected areas (Lehmann et al., this volume;Wysocka et al., 1995). To find evidence for the expected influences of underground mining, detailedgeologically based field measurements were carried out on the evaluation of the geogenic radonpotential (Kemski, Klingel, Siehl, 1996a; figure 1). Selected rock and soil samples have beenanalyzed by gamma spectrometry for their radium contents. Investigations along profile linescrossing zones of mining indurced tension and at methane degassing spots were used to estimate theexistence and the extent of an additional advective component of the radon signal. Finally, possibleeffects of mining activities on radon concentrations in buildings were verified by an indoor survey.
STUDY AREA
The study area is situated in the southwestern part of Germany in the Saarland. Coal mining is themost important industry since the beginning of this century. The densely populated area has a size ofapproximately 6 km2. Subsidence problems always occur after a new exploitation of coal bearing

091 Radon in the Living Environment,19-23 April 1999, Athens, Greece
774
beds in the underground.
Conglomerates, sandstones, siltstones and shales with layers of hard-coal of Carboniferous age(Westfal) are the typical rocks in this area. In its eastern part they are covered by young terracesediments of the Saar River, in the south by flat lying sedimentary rocks of Rotliegend (Permian)and Buntsandstein (Triassic) age. Two different types of soils can be differentiated in theinvestigated area. Eutric cambisols with a depth of less than 1 m and with high permeability arederived from sandstones and conglomerates. Soils developed from deeply weathered siltstones andshales can be classified as gleyic luvisols with low permeability.
MEASUREMENT METHODS
Evaluation of the geogenic radon potential is based on a standardized procedure for radonmeasurements (Kemski, Klingel, Siehl, 1996a). An active spot measuring system with a scintillationcounter and Lucas cells was used to measure radon concentrations in soil gas. At each measuringsite, three boreholes of 1 m depth were drilled. After pumping 10 l of soil gas from the borehole toavoid contamination of atmospheric air, two gas samples of about 100 ml were taken at each site.The maximum radon value was used for evaluation. Gas permeability of the soils was ignored inthis campaign, because it was generally lower than 10-14 m2. All radon measurements werecompleted within four weeks under the same meteorological conditions, therefore seasonalvariations in soil moisture and atmospheric pressure could be neglected.
Investigations at the profile lines and the methane degassing spots were conducted in a similiar waywith the drilling of just one hole per measuring site. Methane was measured in situ by heatconductivity (AUER M 510).
RESULTS
Radium in rocks and soils
Rocks and soils were examined for their specific radium activity to test for geochemical anomalies.Coals are characterized by very low radium contents, often below 10 Bq/kg. In all other rocksspecific activities vary between 10 and 70 Bq/kg with a median value of 33 Bq/kg. These results fitvery well to the known ranges of radium activities in other sedimentary rocks (Kemski, Klingel,Siehl, 1996b). Although weathering processes increase the content of resistant minerals withradionuclides in soils, the specific radium activities of the investigated soils are lower rangingbetween 20 and 30 Bq/kg with a median value of 26 Bq/kg. The deposition of loess as well as theleaching effects may have caused the decrease of radium activities. In soils with a low gaspermeability radium is the only source for the diffusive component of radon in soil gas. Due to therather low specific radium activities of rocks and soils a low geogenic radon potential can beexpected.
The geogenic radon potential
Radon measurements at 44 sites have been performed in soils overlying Carboniferous rocks and interrace sediments of the Saar river to evaluate the geogenic radon potential. Radon concentrationsshow a lognormal distribution, which is typical for such data. They range from 2 to 98 kBq/m3 witha slightly increased median value of 27 kBq/m3 compared to the known value of 21 kBq/m3 for

Radon in the Living Environment,19-23 April 1999, Athens, Greece 091
775
Carboniferous rocks in the Saarland (Kemski, Klingel, Siehl, 1996c). Data were summarized in twogroups (figure 2). Group 1 summarizes all locations, which have remained largely unaffected by theprevious mining, as well as those, where the deep underground mining did not occur within the lasttwo years. Group 2 encompasses all locations with recent mining activities (younger than twoyears). In the area unaffected by mining, the median value is 20 kBq/m3, whereas in the mining area,the median value increases to 38 kBq/m3. This difference can be contributed to the influence ofmining. Especially, the subsidence following deep mining generate pathways for gas migration.
Zones of mining induced tension
As a consequence of mining activities, the rock system strength is disturbed leading to a roof breakin the underground stopes. Tectonic movements in the overlying rocks are the most commonfeature. At the surface the area generated by mining subsidence forms a depression zone (figure 3).This area is larger than in the actual underground mining area. The subsidence in the depressionzone can be described as a long lasting dynamic process. The highest rate of subsidence at thesurface reaching up to two centimeters per day occurs approximately two months after the mining ofthe respective area. One year after the beginning of the subsidence, 75 % of the movements havebeen accomplished, hence continuing for about two years after the end of mining. On a circular zonearound the mining area – the zone of mining induced tension - the cracks and fissures remain openfor longer time periods. It is not a single lineament, but a cluster of narrow linear elements with alateral extension up to more than 50 meters.
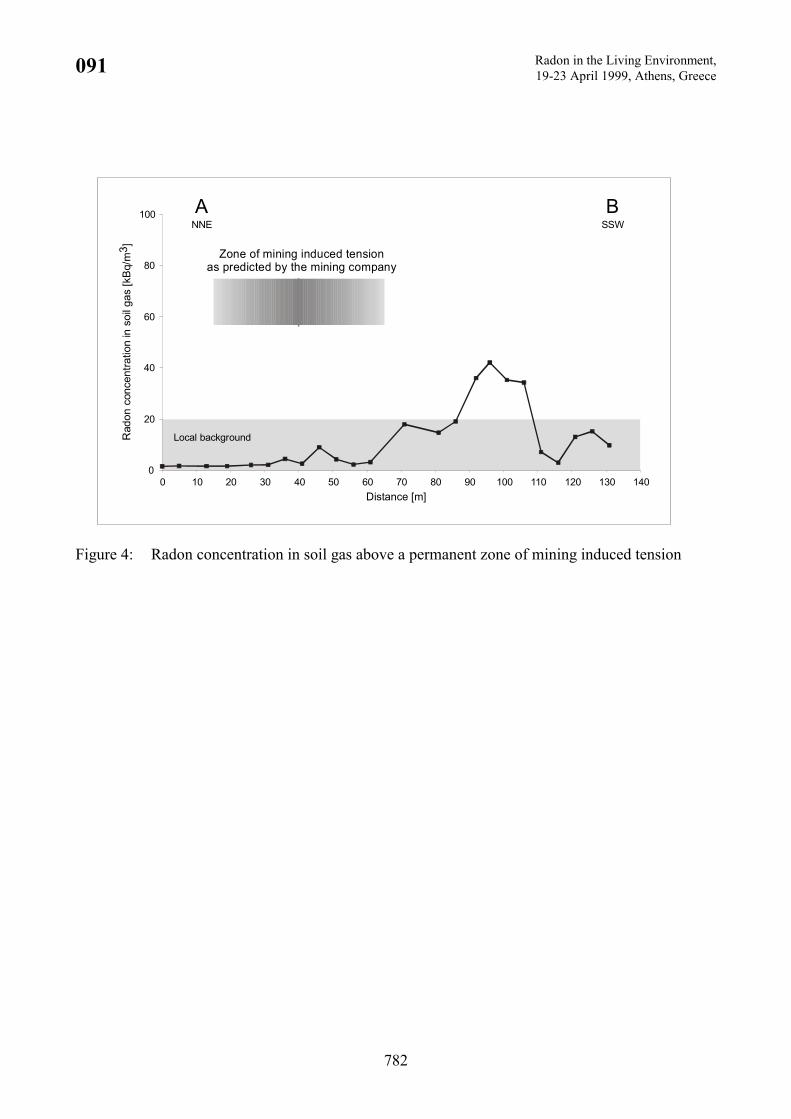
Soil gas measurements of CO2, radon or helium are well established as a tool for the mapping offaults or fracture zones. Gas peaks at the surface are situated above the outcrop of these pathwaysindicating the structural controlled gas transport. The mining induced disruptions at the surface canbe also detected with the application of this method. Therefore radon concentrations in soil gas weremeasured along several profile lines of 100 and 350 meters in lengths crossing the zone of mininginduced tension. The influence of morphology, the type of soil, and the water content on the radonconcentration could be neglected. For each line radon concentrations clearly above the localbackground of 10 to 20 kBq/m3 were detected, reaching from 40 kBq/m3 (figure 4) up to more than100 kBq/m3 in profile lines in the western part of the investigated area. The close relationshipbetween the predicted zones of mining induced tension and the peak maxima indicates an advectivecomponent of the radon signal. Radon measurements at mining induced zones of tension, wheremining activities have been finished more than five years ago, prove, that the position of the radonanomalies are constant over a longer period.
Methane and radon
Methane (CH4) is generated, accumulated, and stored in the rocks during the process of formation ofhard-coal. It can be released, if cavities and other pathways in the bedrock exist, enabling the gas tomigrate to the surface. Therefore, methane can act as a carrier gas for radon. Extensive or spotdegassing as well as degassing along lineaments can be observed. Usually methane exhalations varyin time depending on seasonal changes in soil moisture or atmospheric pressure. It is well known,that CH4 degassing is rarely constant over long periods at the same spot and decreases with time(Kaltwang, 1990).
The field measurements were performed both for radon and methane in disturbed soils just belowthe surface of roads and other pavements in depths of about 30 cm. This very special samplingsituation as well as the results cannot be compared to soil gas measurements used for the evaluation

091 Radon in the Living Environment,19-23 April 1999, Athens, Greece
776
of the geogenic radon potential. As expected, dilution of radon by atmospheric influences in theseshallow depths and the very low radionuclide contents of gravel and sand below roads andpavements reduce the radon background to 2 kBq/m3.
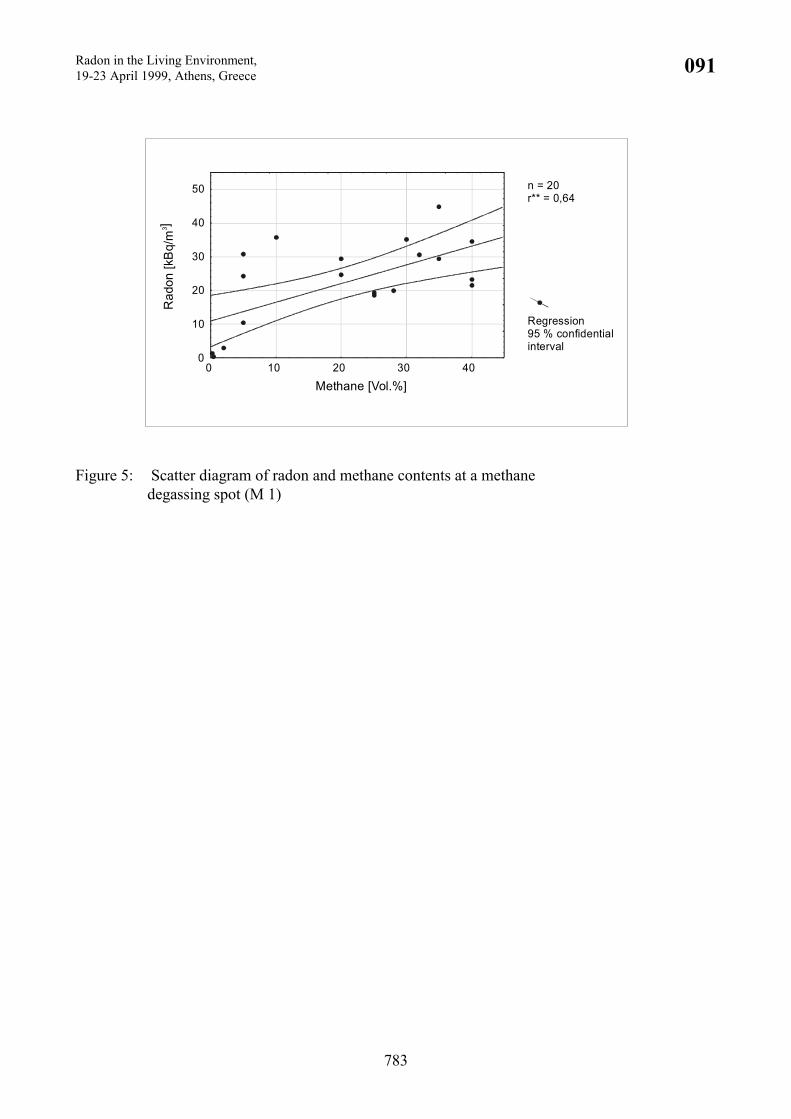
Radon concentrations at four methane degassing spots are positively correlated with methaneconcentrations (figure 5). Especially above 10 vol.% of methane this dependence becomes obvious,when radon concentrations are exceeding the background at least five times.
Indoor measurements
Indoor measurements of radon concentrations were carried out in about 100 houses over a period ofthree months. In every building two solid-state nuclear track detectors (Macrofol) were installed inthe transition in spring and in autumn: one detector in the basement and one in the living area on theground floor. Two groups of house locations were selected for this study: half the number ofbuildings were in an area with mining activities younger than two years (case group), the other halfin an area without recent mining activities (control group).
The median values of 47 Bq/m3 (control group) respective 48 Bq/m3 (case group) in the groundfloor correspond closely to the German median value of 40 Bq/m3 (figure 6). It is far below theupper limit of the normal range of radon concentrations in buildings in Germany of 250 Bq/m3
(SSK, 1994). Obviously, there is no difference between both groups. In the basements of the housesin the control group however, the median value of 60 Bq/m3 is about 30 % below the median valueof 85 Bq/m3 in the case group (figure 7; median value for basements in West-Germany: 52 Bq/m3
(BMI, 1985)). Further results of a questionnaire show the influence of the building site andconstruction characteristics on the indoor radon values.
Especially the existence of cracks and fissures in basement walls and floors as well as a lackingdamp-proofing in the basement is correlated with increased indoor radon concentrations.
DISCUSSION
Radon concentrations in soil gas in the investigated area are influenced by mining activites in theunderground in different ways.
Radon contents in soil gas (median: 20 kBq/m3) are generally low compared to other regions ofGermany (Kemski et al., 1998). Nevertheless a clear spatial pattern of increased values is observed.In the mining affected area radon concentrations are significantly higher (median: 38 kBq/m3).Strongly enhanced values up to more than 100 kBq/m3 locally occur at the zones of mining inducedtension. Both phenomena can be explained by mining induced tectonic movements in thesubsurface. Time dependent changes in the fabric of rocks and soils increase the radon emanationrate. Additionally an advective, also structurally controlled migration is generated resulting in theradon peaks at the zones of mining induced tension.
Degassing of methane is positively correlated with radon concentrations in soil gas. Obviously, CH4acts as a carrier gas for radon. Because methane degassing into buildings leads to a hazard situationfor their inhabitants, surveys to localize exhalation spots exist. In case of methane problems inhouses extensive preventive ventilation procedures were initiated instantly. As a consequence, radoncontents in these buildings are reduced to a negligible level.
Radon in the Living Environment,19-23 April 1999, Athens, Greece 091
777
The mining induced subsurface dislocations of rocks have a strong influence on the fabric of soilsand rocks as well as on the foundations of buildings creating cracks in floors and walls. Thereforethe radon transfer from the soil into the house may increase following the existing gradient betweensoil gas and indoor air. Consequently, the highest indoor radon concentrations were observed in thebasement of houses in the case group. The spatial distribution of high indoor values vary in time.The comparison of indoor measurements from spring and from autumn show a shift of radon peaksfrom east to west with time, following the direction of deep mining.
CONCLUSIONS
The study shows evidence for a clear pattern of the radon concentrations in soil gas and in buildingsinfluenced by mining activities. Increased indoor radon concentrations in the basements limited bythe time of deep mining activities were measured. In living rooms, however, radon contents weregenerally below the upper limit of the normal range with just a few exceptions; measures to reduceindoor radon concentrations have not been recommended.
It has to be emphasized, that the radon concentrations in soil gas in this area are rather lowcompared to other regions in Germany. Therefore increased indoor radon contents in regions withhigher soil gas concentrations and mining activities can be expected. Additionally, always localgeological characteristics and specific building construction types have to be carefully consideredand should be investigated in detail.
REFERENCES
[1] BMI (Federal Ministry of the Interior). Radon in Wohnungen und im Freien - Erhebungsmessungen inder Bundesrepublik Deutschland. Report BMI 1985, 82 pp.
[2] Kaltwang H.-J. Methanausgasungen im Bereich der Saarländischen Steinkohlelagerstätte. DasMarkscheidewesen 1990; 97, 3: 460-462.
[3] Kemski J, Klingel R, Siehl A. Classification and mapping of radon-affected areas in Germany.Environm Int 1996a; 22, 1: S789-S798.
[4] Kemski J, Klingel R, Siehl A. Die terrestrische Strahlung durch natürlich radioaktive Elemente. in:Siehl A, editor. Umweltradioaktivität. Ernst & Sohn, Berlin, 1996b, pp. 69-96.
[5] Kemski J, Klingel R, Siehl A. Geogene Faktoren der Strahlenexposition unter besondererBerücksichtigung des Radonpotentials (Abschlußbericht zum Forschungsvorhaben St. Sch. 4062).Schriftenreihe Reaktorsicherheit und Strahlenschutz 1996c; BMU-1996-470, 76 pp.
[6] Lehmann R, Kemski J, Siehl A, Stegemann R. Approach to identfication of radon areas in Germany.This volume.
[7] Kemski J, Siehl A, Stegemann R, Valdivia-Manchego M. Mapping the geogenic radon potential inGermany using GIS-techniques. in: Barnet I, Neznal M, editors. Radon investigations in the CzechRepublic VII and the fourth international workshop on the Geological Aspects of Radon RiskMapping. 1998, pp. 45-52.
[8] Palm H. Steinkohlenlagerstätten und Kohleabbau. in: Wiggering H, editor. Steinkohlenbergbau. Ernst& Sohn, Berlin, 1993, pp. 54-66.
[9] SSK. Strahlenschutzgrundsätze zur Begrenzung der Strahlenexposition durch Radon und seine

091 Radon in the Living Environment,19-23 April 1999, Athens, Greece
778
Zerfallsprodukte in Gebäuden. 1994; Bundesanzeiger Nr. 155.
[10] Wysocka M, Lebecka J, Chalupnik S, Mielnikow A. Survey of radon in an area strongly affected bymining activites. in: Dubois C, editor. Gas geochemistry. Science Reviews, Northwood, 1995, pp.481-487.

Radon in the Living Environment,19-23 April 1999, Athens, Greece 091
779
Figure 1: Map of measuring sites in the study area
B B BB BB B
C CCC CC CC
DD DD DDD D
F
H H HH HH H H L L LL LL L L
A
M 1
B
025
0 m
N
Dee
p m
inin
g ar
ea
Met
hane
deg
assi
ng s
pot
Mea
surin
g si
tes
of g
eoge
nic
rado
n po
tent
ial
Prof
ile li
neB
A
Ger
man
y
Stud
yar
ea
Min
ing
affe
cted
(< 2
yea
rs)
Not
min
ing
affe
cted
Tem
pora
ry
Perm
anen
tzo
ne o
f min
ing
indu
ced
tens
ion

091 Radon in the Living Environment,19-23 April 1999, Athens, Greece
780
Figure 2: Frequency distribution of radon concentration in soil gas
Group 2: Mining affected measuring sites(n = 23, median: 38 kBq/m3)
0
2
4
6
8
10
< 15 15-30 30-45 45-60 60-75 75-90 > 90
Radon concentration in soil gas [kBq/m3]
Freq
uenc
y [%
]
(n = 21, median: 20 kBq/m3)
0
2
4
6
8
10
< 15 15-30 30-45 45-60 60-75 75-90 > 90
Radon concentration in soil gas [kBq/m3]
Freq
uenc
y [%
]

Radon in the Living Environment,19-23 April 1999, Athens, Greece 091
781
Figure 3: Radon migration above deep mining affected areas and tectonic faults (modified afterPalm, 1993)
Longwall
Zone of mininginduced tensionZone of mining
induced tension Zone ofcompression
Radon
Radon Radon
Radon
Tectonic fault
Coal seams
Radon
091 Radon in the Living Environment,19-23 April 1999, Athens, Greece
782
Figure 4: Radon concentration in soil gas above a permanent zone of mining induced tension
0
20
40
60
80
100
0 10 20 30 40 50 60 70 80 90 100 110 120 130 140Distance [m]
Rad
on c
once
ntra
tion
in s
oil g
as [k
Bq/m
3 ]
A BNNE SSW
Local background
Zone of mining induced tension as predicted by the mining company
Radon in the Living Environment,19-23 April 1999, Athens, Greece 091
783
Figure 5: Scatter diagram of radon and methane contents at a methane degassing spot (M 1)
Regression 95 % confidential interval
n = 20r** = 0,64
Methane [Vol.%]
Rad
on [k
Bq/
m]3
0
10
20
30
40
50
0 10 20 30 40

091 Radon in the Living Environment,19-23 April 1999, Athens, Greece
784
control group case group control group case group
basement ground floorn 37 61 40 58
min [Bq/m3] 24 26 18 13
10 pc [Bq/m3] 34 35 27 25
median [Bq/m3] 60 85 47 48
90 pc [Bq/m3] 109 164 102 122
max [Bq/m3] 275 910 320 276
Figure 6: Statistics of indoor radon concentration

Radon in the Living Environment,19-23 April 1999, Athens, Greece 091
785
Figure 7 : Frequency distribution of indoor radon concentration.
091 Radon in the Living Environment,19-23 April 1999, Athens, Greece
786