Embed Size (px)
Citation preview

FOSTER CORRIDOR TRANSPORTATION EXISTING CONDITIONS & OPPORTUNITIES
Preliminary Assessment
DRAFT
September 2012
Prepared for:

Table of Contents
Page
1 Inner Foster Road: Corridor growth and planning context ...............................................1-1 Historical background ........................................................................................................................... 1-1 Corridor planning overview................................................................................................................. 1-2
2 Corridor conditions and community character .................................................................2-1 Character and land use ........................................................................................................................ 2-1 Right-of-way conditions ........................................................................................................................ 2-8
3 Corridor safety .................................................................................................................3-1
4 Multimodal conditions .....................................................................................................4-1 Traffic operations .................................................................................................................................. 4-1 Pedestrian connectivity and amenities ............................................................................................... 4-8 Bicycle connectivity and corridor access ......................................................................................... 4-11 Transit operations and access ........................................................................................................... 4-12
5 Needs assessment and gap analysis ...............................................................................5-1 Corridor opportunities and trade-offs .............................................................................................. 5-1 Improvements constructed since 2003 ............................................................................................... 5-4 Planned and funded improvements ................................................................................................... 5-6
Figures
Page
Figure 1 Foster Road corridor extent ............................................................................................... 2-1
Figure 2 Foster Corridor zoning ......................................................................................................... 2-2
Figure 3 Foster Road corridor conditions—SE 50th Avenue to SE 58th Avenue ........................ 2-3
Figure 4 Foster Road corridor conditions—SE 58th Avenue to SE 68th Avenue ........................ 2-4
Figure 5 Foster Road corridor conditions—SE 68th Avenue to SE 78th Avenue ........................ 2-5
Figure 6 Foster Road corridor conditions—SE 77th Avenue to SE 87th Avenue ........................ 2-6
Figure 7 Foster Road corridor conditions—SE 87th Avenue to SE 97th Avenue ........................ 2-7
Figure 8 Foster Road’s Diverse Districts and Character ................................................................ 2-8
Figure 9 Right-of-way dimensions ..................................................................................................... 2-8
Figure 10 Existing cross section – SE Bush Street to SE 72nd Avenue ............................................ 2-9
Figure 11 Existing cross section – SE 72nd Avenue to SE 80th Avenue .......................................... 2-9
Figure 12 Existing cross section – SE 80th Avenue to SE 87th Avenue ......................................... 2-10
Figure 13 Existing cross section – Foster Road couplet area ........................................................ 2-10
Figure 14 Foster collision summary data, 2001 - 2010 .................................................................. 3-2
Figure 15 Corridor collisions and fatalities by mode ...................................................................... 3-3
Figure 16 Foster Road traffic volumes at select intersections ......................................................... 4-1
Figure 17 Foster Road Weekday Volume by Direction and Time of Day .................................. 4-2
Figure 18 High peak period turn movements (over 200) at key intersections, 2012 ............... 4-3
Figure 19 Corridor volume comparison .............................................................................................. 4-4
Figure 20 Existing and proposed signal locations and signal distances ...................................... 4-5
Figure 21 Signals and pedestrian refuges ......................................................................................... 4-6
Figure 22 Corridor and commercial district comparison: Intersection and signal spacing ........ 4-6
Figure 23 Intersection Level of Service at Select Intersections, 2012 and 2035 ....................... 4-7

FOSTER CORRIDOR ENHANCEMENT OPPORTUNITIES | DRAFT PRELIMINARY ASSESSMENT
Foster Lents Integration Partnership
Nelson\Nygaard Consulting Associates Inc. | 1-2
Figure 24 Pedestrian island location on Foster Road....................................................................... 4-8
Figure 25 Foster corridor gaps and opportunities matrix ............................................................... 5-1

1 INNER FOSTER ROAD: CORRIDOR GROWTH AND PLANNING CONTEXT
The Foster Road Transportation and Streetscape Plan was developed via a public process and
adopted by Portland City Council in 2003. The Plan outlined improvements to Foster Road that
would enhance both safety and the appearance of the street from SE 50th to SE 90th Avenues.
Subsequently, the City of Portland has adopted two plans that directly affect Foster Road: the
Portland Streetcar System Concept Plan and the Portland Bicycle Plan for 2030. These plans call
for adding both streetcar and bicycle infrastructure (e.g. an on-street separated bicycle facility) on
Foster Road in the future.
In early 2012 the City of Portland was awarded $1.25 million, as part of the Regional Flexible
Fund Allocation, to construct many of the improvements identified in the plan related to safety
and streetscape enhancements. The Portland Development Commission also set aside $2 million
for this effort, bringing the total available funding to $3.25 million. Funding for construction will
be available in 2014.
This planning process, led by the Portland Bureau of Transportation (PBOT), will update the
Foster Road Transportation and Streetscape Plan. The project will study cross section options
that accommodate bicycle infrastructure, anticipate future high capacity transit as well as confirm
and prioritize with stakeholders the safety improvements (curb extensions, marked crossings,
medians, etc.) and streetscape elements (trees, street lights, etc.) identified in the Regional
Flexible Fund grant from SE 50th to SE 84th Avenues.
This report provides a summary of existing corridor conditions. The report establishes a baseline
understanding of right-of-way characteristics, traffic and transit operations, and bicycle and
pedestrian infrastructure conditions.
HISTORICAL BACKGROUND
Foster Road is an important east-west thoroughfare, a strategic route that began as a Native
American trail. It became an alternative to the Barlow Trail during the pioneer era, bringing the
settlers directly into Portland rather than down to Oregon City. Foster then became a well
traveled farm-to-market route connecting Powell Valley Road near the present-day SE 52nd
Avenue and to the Willamette River and Portland.
In the 1930s, wide streets like Foster became the standard transportation model and served all
functions – driving, parking, streetcar operation, and walking. Adhering to traditional Parisian
standards, sidewalks along the corridor were 17 feet wide, possibly the widest in the City at the
time. To this day, Foster still offers pedestrians and patrons generous sidewalks west of 82nd
Avenue. With the demise of the City’s streetcar and trolleybus network in the years after WWII,
the corridor’s function refocused to facilitate the efficient flow of motor vehicles and goods
movement. Investments in bicycle and pedestrian infrastructure along and across Foster were not

FOSTER CORRIDOR EXISTING CONDITIONS & OPPORTUNITIES | DRAFT PRELIMINARY ASSESSMENT
Foster Lents Integration Partnership
Nelson\Nygaard Consulting Associates Inc. | 1-2
prioritized. As a result, Foster lacks amenities that are present in thriving or revitalizing eastside
commercial and retail corridors like Sandy Boulevard and Woodstock Street, to name just two.
The 2003 Foster Rd Transportation and Streetscape Plan recommended a number of
improvements to make Foster Rd safer and more pleasant for all modes. As part of
redevelopment, sidewalks would be widened where they are narrow today and trees and
ornamental lights installed. A series of pedestrian crossings improvements were recommended,
several of which have been implemented.
CORRIDOR PLANNING OVERVIEW
The City’s Transportation System Plan (TSP) is the primary document guiding the function of the
streets in the City of Portland. It is the 20-year plan for transportation improvements in Portland,
based on current and projected land uses. The goal of the TSP is to provide transportation choices
for residents, employees, visitors, and firms doing business in Portland.
TSP designations
The TSP classifies each street in the City with one or
multiple street classification functions; these state
the intent (function) and general look and features
(design) of streets. Supporting efforts to create a
more walkable and human-scaled corridor
consistent with the City’s Comprehensive Plan and
the region’s 2040 Growth Concept Plan, the City of
Portland’s has designated Foster Road as a Regional
Main Street from SE 63rd to SE 77th Avenue and east
of SE 80th Avenue connecting to the Lents Town
Center and Green Line MAX station (see the side bar
for design features consistent with the Regional
Main Street designation).
In addition, Foster Road has functional and street
design designations for all the transportation modes,
making it one of the most important streets and
corridors in the City. Foster Road is designated as a:
Major City Traffic Street; Major Transit Priority
Street; Major Emergency Response Street; Truck
Access Street; City Bikeway; and City Walkway. The
segment between SE 87th and 101st Avenues assigned
as part of the Lents Pedestrian District. Below is a
brief explanation of each modal classification.
Chapter 2 of the TSP, Policy 6.4 Classification
Descriptions, provides more details.
Major City Traffic Streets are intended to serve as the principal routes for traffic that
has at least one trip end within a transportation district.
Major Transit Priority Streets are intended to provide for high-quality transit service
that connects the Central City and other regional and town centers and main streets.
Design elements of Regional Main Streets
Low to moderate vehicle speeds
Use of medians and curb extensions to enhance pedestrian crossings where wide streets make crossing difficult
Combined driveways
On-street parking where possible
Wide sidewalks with pedestrian amenities such as benches, awnings and special lighting; landscape strips, street trees, or other design features that create a pedestrian buffer between curb and sidewalk
Improved pedestrian crossings at all intersections and mid-block crossings where intersection spacing exceeds 400 feet
Striped bikeways or wide outside lane
Vehicle lane widths that consider the above improvements
Source: Policy 6.11 (Street Design Classification Descriptions) of the Portland Transportation System Plan

FOSTER CORRIDOR EXISTING CONDITIONS & OPPORTUNITIES | DRAFT PRELIMINARY ASSESSMENT
Foster Lents Integration Partnership
Nelson\Nygaard Consulting Associates Inc. | 1-3
Major Emergency Response Streets are intended to serve primarily the longer, most direct legs of emergency response trips.
Truck Access Streets are intended to serve as access and circulation routes for delivery
of goods and services to neighborhood-serving commercial and employment uses.
City Bikeways are intended to serve the Central City, regional and town centers, station
communities, and other employment, commercial, institutional, and recreational
destinations.
City Walkways are intended to provide safe, convenient, and attractive pedestrian
access to activities along major streets and to recreation and institutions; provide
connections between neighborhoods; and provide access to transit.
These overlapping classifications call for a balanced approach to addressing different
transportation functions expected for Foster Road and infrastructure that facilitates access and
movement for the different modes.

FOSTER CORRIDOR EXISTING CONDITIONS & OPPORTUNITIES | DRAFT PRELIMINARY ASSESSMENT
Foster Lents Integration Partnership
Nelson\Nygaard Consulting Associates Inc. | 2-1
2 CORRIDOR CONDITIONS AND COMMUNITY CHARACTER
Traveling along the inner Foster Road corridor (highlighted in Figure 1) presents motorists,
pedestrians, cyclists, and transit passengers with a variety of right-of-way conditions and land use
environments. Land uses, sidewalk widths, and the overall right-of-way width can shift from
segments to segment. Figure 3 through Figure 7 are a series of data-rich reference maps that
detail traffic conditions, PM peak traffic counts and average daily volumes, right-of-way changes,
transit productivity, and existing and future network connections along the Foster Road corridor.
Subsequent sections throughout this preliminary assessment report refer back to these corridor
maps.
Figure 1 Foster Road corridor extent
CHARACTER AND LAND USE
Between SE 50th Avenue and I-205, Foster Road supports a diverse mix of land uses, including
residential neighborhoods and a variety of businesses fronting Foster Rd, including a large
number of retailers. The Foster Corridor contains five district nodes: Gateway District (see
corridor reference map 1), Western Core (see corridor reference map 4), Heart of Foster (see
corridor reference map 6), Green Link (see corridor reference map 8), and Crossroads District

FOSTER CORRIDOR EXISTING CONDITIONS & OPPORTUNITIES | DRAFT PRELIMINARY ASSESSMENT
Foster Lents Integration Partnership
Nelson\Nygaard Consulting Associates Inc. | 2-2
(see corridor reference map 11). Each node represents the commercial and transportation hubs
that support economic activity, regional mobility, and local access.
Outside of the recent pedestrian improvements installed along Foster Road, land uses and
transportation infrastructure are strongly oriented toward automobile use, with many businesses
providing off street parking, for example, leading to buildings set back from the sidewalk and a
large number of driveways. That being said, various pockets of medium density mixed use land
uses occur around the district nodes oriented toward the street.
As depicted in Figure 2, zoning along the majority of Foster Road is General Commercial (CG),
allowing a wide range of commercial activities. The “Heart of Foster” district has a segment zoned
as Storefront Commercial (CS), from SE 63rd to 67th Avenues, which is typically designated for
Main Streets. The “Crossroads District” at the intersection Foster Road and SE 82nd Avenue is
designated as Central Employment (EX), which allows mixed-uses and is intended to collocate
industrial, business, service, and limited residential uses. Although development standards in this
zone are intended to allow new development that is similar in character to existing development—
primarily big box style retail developments—businesses like the Fred Meyer at SE 80th Avenue
have the ability to redevelop to establish a more storefront appeal that is typically seen in the CS
and CG zones. The TSP orients land uses to the sidewalk along transit corridors such as SE 82nd
and Foster Road.
Figure 2 Foster Corridor zoning
Source: City of Portland

FOSTER CORRIDOR EXISTING CONDITIONS & OPPORTUNITIES | DRAFT PRELIMINARY ASSESSMENT
Foster Lents Integration Partnership
Nelson\Nygaard Consulting Associates Inc. | 2-3
Figure 3 Foster Road corridor conditions—SE 50th Avenue to SE 58th Avenue

FOSTER CORRIDOR EXISTING CONDITIONS & OPPORTUNITIES | DRAFT PRELIMINARY ASSESSMENT
Foster Lents Integration Partnership
Nelson\Nygaard Consulting Associates Inc. | 2-4
Figure 4 Foster Road corridor conditions—SE 58th Avenue to SE 68th Avenue

FOSTER CORRIDOR EXISTING CONDITIONS & OPPORTUNITIES | DRAFT PRELIMINARY ASSESSMENT
Foster Lents Integration Partnership
Nelson\Nygaard Consulting Associates Inc. | 2-5
Figure 5 Foster Road corridor conditions—SE 68th Avenue to SE 78th Avenue

FOSTER CORRIDOR EXISTING CONDITIONS & OPPORTUNITIES | DRAFT PRELIMINARY ASSESSMENT
Foster Lents Integration Partnership
Nelson\Nygaard Consulting Associates Inc. | 2-6
Figure 6 Foster Road corridor conditions—SE 77th Avenue to SE 87th Avenue

FOSTER CORRIDOR EXISTING CONDITIONS & OPPORTUNITIES | DRAFT PRELIMINARY ASSESSMENT
Foster Lents Integration Partnership
Nelson\Nygaard Consulting Associates Inc. | 2-7
Figure 7 Foster Road corridor conditions—SE 87th Avenue to SE 97th Avenue

FOSTER CORRIDOR EXISTING CONDITIONS & OPPORTUNITIES | DRAFT PRELIMINARY ASSESSMENT
Foster Lents Integration Partnership
Nelson\Nygaard Consulting Associates Inc. | 2-8
Pockets of walkable urban streetscape can be found along Foster Road, most notably the area
between SE 65th Avenue and SE 67th Avenue. Figure 8 below represents the character and land
use conditions at each of the inner Foster Road’s district nodes.
Figure 8 Foster Road’s Diverse Districts and Character
Gateway Western Core Heart of Foster
Green Link Crossroads
Land use character along Foster Road varies by district.
Images from PBOT
RIGHT-OF-WAY CONDITIONS
Right-of-way along the Foster Road corridor changes intermittently. The corridor’s right-of-way
(lot line to lot line) ranges from 58 feet—on the east end of the corridor—to 94 feet—on the west
end of the corridor. Figure 9 describes the corridor’s right-of-way dimensions, including curb-to-
curb widths, lane configurations, and sidewalk widths. Further detail on Foster Road’s right-of-
way conditions are examined in greater detail in the sub-sections that follow.
Figure 9 Right-of-way dimensions
Location ROW
(ft) Curb-to-curb
width (ft) Representative lane configuration (ft) Sidewalks (ft)
Bush -72nd Avenue 86-94’ 60’ EB 18’w/|10’|4’|10’|18’w/ WB 13-17’ (mostly 15’)
72nd-80th Avenue 76’ 50’ EB 18’w/|10’-10.5’|10’-10.5’|11’-12’ WB 13’
80th-87th Avenue 60’ 50’ EB 20’w/|10’|10’|10’ WB 5’
Couplet area 58’ 44’ 11’|11’|10’|5’|7’ WB only 6-8’
Curb-to-curb conditions
As displayed in the corridor reference maps and the cross sections in Figure 10 through Figure 13,
the curb-to-curb roadway width ranges between 40 feet to 60 feet, with a short segment of 5-lane
cross section between SE 50th Avenue and SE 52nd Avenue that expands to 65.5 feet. At 50 feet
from curb to curb, the narrowest two-way cross section west of SE 82nd Avenue occurs between

FOSTER CORRIDOR EXISTING CONDITIONS & OPPORTUNITIES | DRAFT PRELIMINARY ASSESSMENT
Foster Lents Integration Partnership
Nelson\Nygaard Consulting Associates Inc. | 2-9
SE 72nd Avenue and SE 79th Avenue. Although street widths typically remain unchanged for
longer stretches of the corridor, sidewalk widths expand and narrow almost on a block-by-block
basis. The corridor includes four typical right-of-way cross sections. These include segments west
of SE 72nd Avenue, between SE 72nd Avenue and SE 80th Avenue, east of SE 80th Avenue, and in
the couplet area. Right-of-way is widest west of SE 72nd Avenue and narrowest in the couplet area.
Figure 10 Existing cross section – SE Bush Street to SE 72nd Avenue
Figure 11 Existing cross section – SE 72nd Avenue to SE 80th Avenue

FOSTER CORRIDOR EXISTING CONDITIONS & OPPORTUNITIES | DRAFT PRELIMINARY ASSESSMENT
Foster Lents Integration Partnership
Nelson\Nygaard Consulting Associates Inc. | 2-10
Figure 12 Existing cross section – SE 80th Avenue to SE 87th Avenue
Figure 13 Existing cross section – Foster Road couplet area
FOSTER CORRIDOR EXISTING CONDITIONS & OPPORTUNITIES | DRAFT PRELIMINARY ASSESSMENT
Foster Lents Integration Partnership
Nelson\Nygaard Consulting Associates Inc. | 2-11
Four lane cross section with left turn lane and right turn pocket on eastbound Foster Road at SE 82nd Avenue.
Image from PBOT
Lane configurations
Foster Road is typically a four lane cross section with two travel lanes in each direction and an
occasional left-turn lane or pedestrian refuge island. The longest stretch containing a 4-foot
striped median is located between Powell Boulevard and SE 72nd Avenue (see reference maps 1-9).
Between Powell Boulevard and SE 52nd Avenue (shown in Figure 3), the roadway becomes a 5-
lane configuration with two eastbound lanes and three westbound lanes.
On-street parking
Depending on the curb-to-curb street width, parking is
available on one or both sides of Foster with either
time limited (protime) or one-hour time restricted
parking. On-street parking is generally dedicated to the
eastbound side of Foster Road, while many segments
on the westbound side, especially east of SE 72nd, allow
for weekday AM peak period restricted parking (i.e. no
parking between 7AM-9AM, Monday through Friday).
Because of the limited width between the curb lane and
parking spaces and the lack of T-bar parking bay
markings and signs, motorists are unclear in some
segments whether parking is permissible. In addition,
many vehicles park partly on the sidewalk, perhaps
because 18 feet is provided for the general purpose
Outside travel lanes and parking measure 18’, creating tight parking conditions.
Image from PBOT

FOSTER CORRIDOR EXISTING CONDITIONS & OPPORTUNITIES | DRAFT PRELIMINARY ASSESSMENT
Foster Lents Integration Partnership
Nelson\Nygaard Consulting Associates Inc. | 2-12
curb lane and parking and the relatively fast traffic.
Prevalence of skewed intersections
Because Foster Road bisects the street grid diagonally from northwest to southeast, nearly all 42
intersections within the project area are skewed. Only SE Rhone Street, SE 60th Avenue and SE
80th Street are aligned perpendicular to Foster Road. This presents unique geometric and
pedestrian design challenges at each location. In some cases, up to six street segments converge at
a one intersection. Skewed intersection along Foster introduce safety concerns including poor
sightlines for turning motorists, longer crossings and more conflict areas for pedestrians, and
increased delay for all users. On the other hand, these may provide for unique buildings such as
the Phoenix and opportunities for green landscaping and public areas.
Intersection of Foster Road and SE 67th Avenue with the historical Phoenix building in the background.
Varying curb radii
Figure 3 through Figure 7 highlights the different curb radii at each intersection corner. Due to
the unusual amount of skewed intersections along the corridor, curb radii vary dramatically with
a range of implications for turning traffic and crossing pedestrians. A smaller curb radius
(between 8 feet and 15 feet) slows down turning vehicles and reduces crossing distances for
pedestrians. A larger curb radius (typically over 25 feet) allows for fast, swooping turn movements
also increases the distance a pedestrian must walk to cross the street. Although many corners
have relatively tight curb radii of 12 to 15 feet, a large proportion have wide curb radii of 25 to 50
feet (for example the southeast corner of SE 82nd Avenue) and Foster and SE Holgate.

FOSTER CORRIDOR EXISTING CONDITIONS & OPPORTUNITIES | DRAFT PRELIMINARY ASSESSMENT
Foster Lents Integration Partnership
Nelson\Nygaard Consulting Associates Inc. | 2-13
One-way couplet
In order to facilitate I-205 on- and off-ramp activity, ODOT and the City of Portland reconfigured
the Foster Road corridor between SE 89th Avenue and SE 97th Avenue to operate as a one-way
couplet as it approaches the Lents Town Center and the I-205 ramps. Westbound traffic uses a
one-way segment on Foster Road and eastbound traffic uses SE Couplet/ Woodstock Street. Each
direction has three travel lanes and is furnished with a five-foot bike lane.
Utilities
Foster Road is an important utility corridor. There are telecommunication and electricity poles
lining both sides of the street in the sidewalk furnishing zone. In addition, water and sewer mains
are located beneath the roadway. Main locations vary, from the north to south side of the street,
depending on the segment. Lateral connections stem from the mains at irregular intervals to serve
adjacent properties. Existing utility infrastructure will be a key consideration when developing
design alternatives, as relocation costs are substantial.

FOSTER CORRIDOR EXISTING CONDITIONS & OPPORTUNITIES | DRAFT PRELIMINARY ASSESSMENT
Foster Lents Integration Partnership
Nelson\Nygaard Consulting Associates Inc. | 3-1
3 CORRIDOR SAFETY Foster Road is a designated High Crash Safety Corridor—roadways identified as having a higher
incidence of fatalities and serious-injury traffic crashes than the citywide average for similar
roadways. A 2011 PBOT study, the SE Foster Rd High Crash Corridor Safety Plan, examined the
entire Foster corridor and established the following key findings:
The incidence of crashes involving alcohol is higher in this corridor than the Citywide
average.
The incidence of crashes caused by motorists disregarding traffic signals is about 60%
higher than the Citywide average. Signal disregard crashes are almost always classified as
‘turning’ or ‘angle’ crashes which typically result in more injuries and deaths.
Bicycle facilities are lacking on Foster west of 90th Avenue. However, all existing and
proposed bicycle crossings on Foster occur at traffic signals.
The average distance between pedestrian crossing improvements (signals or pedestrian
islands) is 1120 feet, or nearly ¼ mile.
Several safety improvements were identified in this report, which along with recommendations
from the Foster Road Transportation and Streetscape Plan, formed the basis for the projects
awarded the Regional Flexible Funds grant. Figure 14 summarizes reported crashes on Foster
from Powell to SE 94th Ave from 2001 – 2010. (NOTE: data were selected within 50 feet of the
Foster centerline)
Portland Bureau of Transportation introduced a variety of pedestrian safety countermeasures to address corridor safety for all roadway users.
Image from PBOT
FOSTER CORRIDOR EXISTING CONDITIONS & OPPORTUNITIES | DRAFT PRELIMINARY ASSESSMENT
Foster Lents Integration Partnership
Nelson\Nygaard Consulting Associates Inc. | 3-2
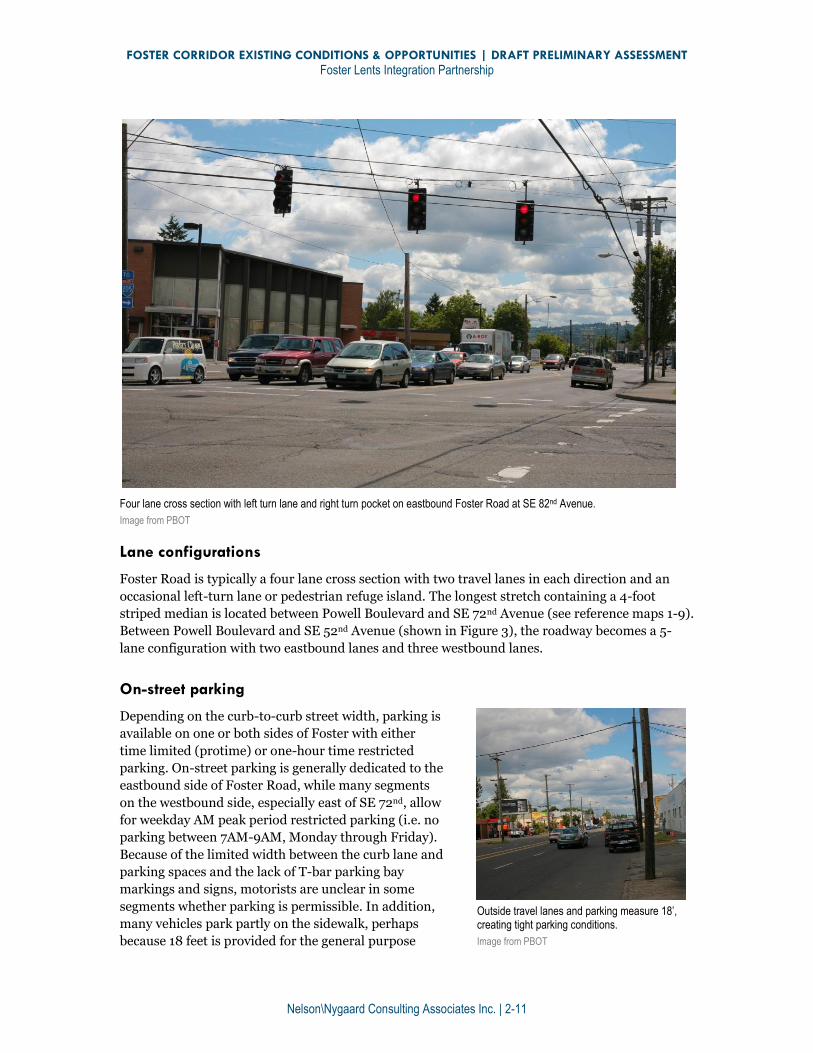
Figure 14 Foster collision summary data, 2001 - 2010
Injuries and Fatalities Crashes by top 3 location types
7 Fatalities 759 Intersection crashes (62%)
537 Crashes involving injuries 373 Roadway straight section crashes (30%)
25 Injuries of Type A severity (incapacitating) 95 Alley-related crashes (8%)
131 Injuries of Type B severity (non-incapacitating)
381 Injuries of Type C severity (pain) Crashes by top collision types
685 Property damage only crashes 495 Rear-end (40%)
1,229 Total Reported crashes from 2001 - 2010 350 Turning (28%)
162 Angle (13%)
Collisions involving vulnerable users 125 Sideswipe - Passing (19%)
32 Total crashes involving pedestrians (4 fatalities)* 31 Fixed Object (3%)
22 Total crashes involving bicyclists (0 fatalities)
* A 2012 pedestrian fatality at 71st and Foster is not included in the above total.
Figure 15 on the following page displays a series of maps showing the locations of different types
of collisions from 2001 - 2010 (for which there are data). The maps also show the location of
fatalities.
Key safety issues facing the Foster Road corridor
Crossing safety
Long crossing distances and extensive driveway density create greater opportunities for pedestrian and bicycle conflicts
Some longer block lengths combined with a lack of safe crossing facilities may encourage unsafe crossing practices
Visibility of vulnerable roadway users is low, especially those using mobility aides
Motorist Behavior
Excessive speeding along links and during turn movements (partially a geometric design issue)
Many motorists do not comply with yield and stop controls
Drunk/impaired driving is high (3% of all crashes involved alcohol; 45% of all fatal crashes involved alcohol)
Red light running and tail-gating is common and contribute to the corridor’s high number of collisions
Design
Current geometric intersection design facilitates fast vehicle movements
Lane widths—especially curb lanes with no marked parking bays and no parked vehicles—tend to encourage speeding
Foster lacks comfortable accommodations for active transportation markets
Source: SE Foster Road High Crash Corridor Safety Action Plan

FOSTER CORRIDOR EXISTING CONDITIONS & OPPORTUNITIES | DRAFT PRELIMINARY ASSESSMENT
Foster Lents Integration Partnership
Nelson\Nygaard Consulting Associates Inc. | 3-3
Figure 15 Corridor collisions and fatalities by mode

FOSTER CORRIDOR EXISTING CONDITIONS & OPPORTUNITIES | DRAFT PRELIMINARY ASSESSMENT
Foster Lents Integration Partnership
Nelson\Nygaard Consulting Associates Inc. | 4-1
4 MULTIMODAL CONDITIONS
TRAFFIC OPERATIONS
Current and projected traffic volumes
As summarized in Figure 16, traffic volumes along the corridor range from
moderate to high. Total average daily traffic (ADT) ranges between 19,315 east of SE 80th
Avenue and 24,436 east of SE 82nd Avenue. Daily volumes also vary by direction. For example,
ADT ranges from 9,685 westbound vehicles per day at Foster Road east of 80th Avenue to 13,245
eastbound vehicles per day at Foster Road west of 72nd Avenue.
Figure 16 Foster Road traffic volumes at select intersections
Location (Date) Southeast
bound Northwest
bound Total
SE Foster Rd at 72nd Ave (2008)
13,245 11,083 24,328
SE Foster Rd east of 80th Ave (2012)
9,618 9,697 19,315
SE Foster Rd east of 82nd Ave (2012)
11,233 13,203 24,436
SE Foster Rd east of 88th Ave (2010)
10,620 12,437 23,057
Inbound couplet: SE Foster Rd east of SE 89th Ave (2010)
n/a 12,576 n/a
Outbound couplet: SE Couplet St south of SE Foster Rd (2010)
11,220 n/a n/a
Source: PBOT
Traffic flow is relatively well distributed throughout the day. Throughout the corridor
traffic is heaviest after the noon hour. However, stark occurrences of “peaked” traffic flow only
occurs in the AM westbound direction. Average daily westbound volume is roughly double
eastbound traffic in the AM peak. As a result return trips are more evenly distributed in the PM
but east bound traffic is marginally higher than westbound traffic. Traffic volumes never exceed
1,000 vehicles per hour in any direction. This signals that, although traffic volumes are relatively
high, they are well distributed throughout the day.

FOSTER CORRIDOR EXISTING CONDITIONS & OPPORTUNITIES | DRAFT PRELIMINARY ASSESSMENT
Foster Lents Integration Partnership
Nelson\Nygaard Consulting Associates Inc. | 4-2
Figure 17 Foster Road Weekday Volume by Direction and Time of Day
Foster Road east of SE 80th Avenue, 2012
Foster Road east of SE 82nd Avenue, 2012

FOSTER CORRIDOR EXISTING CONDITIONS & OPPORTUNITIES | DRAFT PRELIMINARY ASSESSMENT
Foster Lents Integration Partnership
Nelson\Nygaard Consulting Associates Inc. | 4-3
Foster Road east of SE 88th Avenue, 2010
Source: PBOT
Various intersections exhibit high turn volumes. The most concentrated PM peak period
(4:00 PM – 6:00PM) turn volumes occur at eastbound right turns from SE Holgate onto
southeast bound Foster, and multiple turn movements onto and off of Foster Road at SE 82nd
Avenue. Figure 18 summarizes high peak period turn movements (over 200) at four of the
corridor’s key signalized intersections (peak period counts are indicated in parentheses and
placed in order of magnitude).
Figure 18 High peak period turn movements (over 200) at key intersections, 2012
Foster/SE 52nd Avenue (see reference map 2)
Foster/SE Holgate (see reference map 5)
Foster/SE 72nd Avenue (see reference map 8)
Foster/SE 82nd Avenue (see reference map 11)
Southeastbound Foster right turns onto southbound 52nd Avenue (285)
Northbound 52nd Avenue left turns onto northwestbound Foster (265)
Eastbound Holgate right turns onto southeastbound Foster (357)
Westbound Holgate right turns onto northwestbound Foster (219)
Southeastbound Foster right turns onto southbound 72nd Avenue (341)
Northbound 72nd Avenue left turns onto northwestbound Foster (232)
Southbound 82nd Avenue left turns onto southeastbound Foster (328)
Northbound 82nd Avenue left turns onto northwestbound Foster (265)
Northwestbound Foster left turns onto southbound 82nd Avenue (265)
Southeastbound Foster left turns onto northbound 82nd Avenue (207)
Southeastbound Foster right turns onto southbound 82nd

FOSTER CORRIDOR EXISTING CONDITIONS & OPPORTUNITIES | DRAFT PRELIMINARY ASSESSMENT
Foster Lents Integration Partnership
Nelson\Nygaard Consulting Associates Inc. | 4-4
Avenue (227)
Northwestbound Foster right turns onto northbound 82nd Avenue (246)
Source: PBOT 2012 intersection counts
Traffic on Foster will increase in the next 20 years.1 According to PBOT traffic analysis
conducted for the Regional Transportation Plan, PM peak traffic volumes are projected to
increase throughout the Foster corridor. Westbound traffic will see less pronounced increases in
PM peak period traffic, increasing between 6% and 25% depending on the segment. Segments
between Holgate and SE 70th Avenue are projected to see a 3% decrease in PM peak period traffic.
Eastbound traffic is projected to exhibit between 13% and 31% increases in PM peak period traffic
depending on the segment.
Traffic condition on Foster Road compare favorably to other corridors in Portland that have
undergone major streetscape and operation changes. Figure 19 compares traffic volumes on
Foster with similar corridors. Foster is classified in the TSP as a Major City Traffic Street. At over
24,000, Foster and 82nd has among the highest daily volumes of any segment included in this
analysis. Tacoma Street, a District Collector, regularly has daily volumes approaching 30,000
approaching the Sellwood Bridge.
Figure 19 Corridor volume comparison
Location Date Direction ADT One-Hour PM Peak Speed
SE FOSTER RD E of 88TH AVE 8/10/2010 Both 23,057 876 35
SE FOSTER RD E of 80TH AVE 6/27/2012 Both 19,315 733 35
SE FOSTER RD E of 82ND AVE 6/27/2012 Both 24,436 921 35
SE HAWTHORNE BLVD E of 45TH AVE 1/31/2011 Both 12,687 603 25
SE HAWTHORNE BLVD W of 33RD AVE 1/31/2011 Both 17,137 857 25
NE SANDY BLVD E of PRESCOTT ST 1/4/2005 Both 15,795 703 35
NE SANDY BLVD W of 77TH AVE 2/9/2011 Both 15,340 787 35
NE WEIDLER ST W of 7TH AVE 5/18/2009 EB only 20,028 1,851 30
N WEIDLER ST W of WILLIAMS AVE 6/24/2009 EB only 26,062 2,355 30
N WEIDLER ST W of VANCOUVER AVE 6/29/2009 EB only 15,979 1,588 30
NE BROADWAY E of GRAND AVE 5/18/2009 WB only 21,592 1,621 30
NE BROADWAY W of VICTORIA AVE 1/19/2010 WB only 30,842 2,125 30
SW BARBUR BLVD S of 4TH AVE 2/18/2009 Both 15,581 750 35
1 City of Portland Bureau of Transportation Foster Rd Traffic Study (2011)

FOSTER CORRIDOR EXISTING CONDITIONS & OPPORTUNITIES | DRAFT PRELIMINARY ASSESSMENT
Foster Lents Integration Partnership
Nelson\Nygaard Consulting Associates Inc. | 4-5
Location Date Direction ADT One-Hour PM Peak Speed
SW BARBUR BLVD N of LANE ST 11/1/2010 Both 15,170 756 35
SE TACOMA ST W of 6TH AVE 11/8/1999 Both 30,350 1,388 30
SE TACOMA ST W of 6TH AVE 9/18/2007 Both 29,978 1,292 30
SE TACOMA ST W of 6TH AVE 6/18/2012 Both 28,538 1,251 30
*Note: Foster, Sandy, and Broadway and Barbur are Major City Traffic Streets. Hawthorne/Tacoma are District Collectors.
Signal locations and performance
Figure 20 and 21 shows the location and distance between traffic signals on Foster. The distances
vary from 445’ to well over a quarter mile. In addition to providing fewer protected pedestrian
crossings, large and inconsistent distances between traffic signals limit the ability to regulate
traffic speeds. On Foster west of 94th, the average distance between traffic signals is just under a
quarter mile (1,214 feet). This is considerably higher than the average distance on comparable
streets, such as Hawthorne, Sandy, and NE Broadway (see Figure 22). However, when comparing
smaller commercial districts, the Heart of Foster (Holgate – 67th) fares slightly better, with a
smaller average distance between signals than the central Hawthorne commercial area (34th –
39th). Of these districts, only NE Broadway has dedicated bicycle facilities.
Figure 20 Existing and proposed signal locations and signal distances
Location Distance Roadway section
SE 52nd Avenue – full signal 890' SE Powell to SE 52nd Avenue
SE 56th Avenue –half signal 1125' SE 52nd Avenue to SE 56th Avenue
SE Holgate – full signal 2225' SE 56th Avenue to SE Holgate Boulevard
SE 64th Avenue – half signal (school) 445' SE Holgate Boulevard to SE 64th Avenue
SE 65th Avenue –ped island and marked crosswalk 290' SE 64th Avenue to SE 65th Avenue
SE 67th Avenue –full signal 475' SE 65th Avenue to SE 67th Avenue
SE 69th Avenue – proposed future signal with ped island and marked crosswalk
400' SE 67th Avenue to SE 69th Avenue
SE 72nd Avenue – full signal 1335' SE 69th Avenue to SE 72nd Avenue
SE 78th Avenue – half signal 1625’ SE 72nd Avenue to SE 78th Avenue
SE 80th Avenue –ped island, marked crosswalk and beacons
805' SE 78th Avenue to SE 80th Avenue
SE 82nd Avenue –full signal 530' SE 80th Avenue to SE 82nd Avenue
SE 92nd Avenue –full signal 2865' SE 82nd Avenue to 92nd Avenue

FOSTER CORRIDOR EXISTING CONDITIONS & OPPORTUNITIES | DRAFT PRELIMINARY ASSESSMENT
Foster Lents Integration Partnership
Nelson\Nygaard Consulting Associates Inc. | 4-6
Figure 21 Signals and pedestrian refuges
Figure 22 Corridor and commercial district comparison: Intersection and signal spacing
Corridors
Street segment Length (ft) Average intersection spacing (ft)
Average traffic signal spacing (ft)
SE Foster: 50th - 94th 12,141 264 1,214
SE Hawthorne: Grand - 49th
10,805 204 900
NE Sandy: 14th - 47th 9,593 282 685
NE Broadway: Grand - 39th
9,655 333 644
Commercial districts
Street segment Length (ft) Average intersection spacing (ft)
Average traffic signal spacing (ft)
SE Foster: Holgate - 67th 1,225 136 408
SE Hawthorne: 34th - 39th 1,731 192 433
NE Sandy: 37th - 43rd 1,800 164 300
NE Broadway: 7th - 16th 2,337 234 334

FOSTER CORRIDOR EXISTING CONDITIONS & OPPORTUNITIES | DRAFT PRELIMINARY ASSESSMENT
Foster Lents Integration Partnership
Nelson\Nygaard Consulting Associates Inc. | 4-7
According to an intersection level of service (LOS) analysis conducted by PBOT using 2012 PM
peak period traffic, all signals—except at SE 82nd Avenue—operate at acceptable levels with
average levels of delay, at minimum (i.e. LOS C or better). Projected growth is anticipated to
degrade operations at two signalized intersections, including Holgate Boulevard and SE 72nd
Avenue. SE 72nd Avenue is the only intersection forecasted to fail (LOS F) in the 2035 PM peak.
Figure 23 summarizes PM peak intersection performance at key intersections along the Foster
Road corridor.
Figure 23 Intersection Level of Service at Select Intersections, 2012 and 2035
Intersection
2012 PM Peak Performance 2035 PM Peak Performance
Intersection delay (sec) LOS Intersection delay (sec) LOS
SE 52nd Avenue 22.2 C 29.2 C
SE 56th Avenue 6.0 A 7.7 A
SE Holgate Boulevard 14.7 B 21.1 D
SE 64th Avenue 3.6 A 3.4 A
SE 67th Avenue 2.8 A 3.4 A
SE 72nd Avenue 32.9 C 85.0 F
SE 78th Avenue 2.3 A 2.6 A
SE 82nd Avenue 34.0 D 47.0 D
Traffic speeds
Speeding occurs, but the severity of speeding does not seem as pronounced as
perceived. Motorists generally adhere to Foster’s 35 mph posted speed limit. 85th percentile
speeds range between 33 mph at SE 69th Avenue and 39 mph at SE Cora Street. Speed can reach
up to 16% over the posted speed limit at SE 69th Avenue and 35% at SE Cora Street. Speeds are
higher along the more rural sections of Foster Road east of I-205.
Access management and driveways
The number and length of driveways creates conflicts for pedestrians and bicyclists.
Between Powell Boulevard and SE 82nd Avenue, there are 147 driveways providing business and
residential access. This equates to roughly 77 driveways per mile and accounts for 40% of this
corridor segment’s length. Although many of these driveways are not in operation, this data
suggests that pedestrians and cyclists face turn conflicts for a sizeable portion of Foster Road.
Driveways range from 10 feet to 90 feet in length, but the majority of driveways (roughly 65%)
measure between 15 feet and 30 feet in length—typical lengths for arterial corridor driveways.

FOSTER CORRIDOR EXISTING CONDITIONS & OPPORTUNITIES | DRAFT PRELIMINARY ASSESSMENT
Foster Lents Integration Partnership
Nelson\Nygaard Consulting Associates Inc. | 4-8
PEDESTRIAN CONNECTIVITY AND AMENITIES
Walking trips to, from, and along the corridor
stem from a variety of demand generators. Key
land uses that attract walking trips include area schools
such as Mt. Scott High School, Creston School,
Centennial Transition Center, Arleta Elementary
School, office and retail located near SE 82nd Avenue
(including the Fred Meyer at SE 80th Avenue), and the
“Heart of Foster” commercial node. Moderate to high
activity transit stops along the corridor are also major
contributors to pedestrian demand.
Pedestrian counts. PM peak period pedestrian
activity at the district nodes is highest at SE 82nd
Avenue (364 total movements), SE Holgate Boulevard
(133 total movements) and SE 72nd Avenue (90 total
movements). High pedestrian activity at SE 82nd
Avenue is likely due to the amount of PM peak period
transfer activity between Line 10, 14, and 72. This
occurs between Lines 14 and 17 at Holgate as well.
Signalized intersections and crossings. There
are 18 signalized intersections along this stretch of
Foster Road: eight pedestrian actuated, five timed (no
pedestrian activation), and 3 dedicated pedestrian “half
signals.” The limited number of signalized crossings
increases effective block distances for those only
willing or able to cross at signalized intersections. Consequently, this either increases walking
distances or encourages unsafe crossing practices like jaywalking. Figure 24 summarizes the
locations of pedestrian islands along the inner Foster Road corridor.
The marked crosswalk and pedestrian refuge at SE 80th Avenue was recently enhanced with
pedestrian-activated Rectangular Rapid Flashing Beacons (RRFB) following recent pedestrian
fatalities at this location. This treatment increases motorist awareness of pedestrians and cyclists
crossing, and improves stop compliance at crossing locations.
Figure 24 Pedestrian island location on Foster Road
Distance to nearest signal in both directions Pedestrian Island Location
575'/800' SE Gladstone
790'/890’ SE Cora
265'/500' SE 65th Avenue
400'/1140' SE 69th Avenue
835'/530' SE 80th Avenue
Source: SE Foster Road High Crash Corridor Safety Plan
The mid-block crossing east of SE 80th Avenue features a rectangular rapid flashing beacon
Image from PBOT

FOSTER CORRIDOR EXISTING CONDITIONS & OPPORTUNITIES | DRAFT PRELIMINARY ASSESSMENT
Foster Lents Integration Partnership
Nelson\Nygaard Consulting Associates Inc. | 4-9
Sidewalk provision. Sidewalks are provided on all street segments between Powell Boulevard
and I-205. West of SE 80th Avenue, sidewalks are generous in width, ranging between 13-17 feet.
Sidewalks are generally clear of obstructions, but pedestrian zone widths (sidewalk width minus
landscaped parkway, utilities, and furniture zone amenities) vary by segment and quality. In
addition, driveway slope creates challenges for those using mobility devices (e.g., wheelchairs,
walkers, etc.). East of SE 80th Avenue, the quality of the pedestrian environment degrades
precipitously to substandard dimensions. Along this stretch, sidewalk pavement quality erodes,
sidewalk widths narrow (roughly 5-8 feet), and obstructions like sign posts, utility poles, and
driveway slopes become more prevalent. A new development at SE 89th Avenue with 20-foot
sidewalks, well defined pedestrian zones, stormwater features, period lighting, street trees, and a
recessed parallel parking buffer provides a glimpse at how pedestrian conditions along the
corridor can improve.
Widths of sidewalk zones vary by segment.
Image from PBOT
Crosswalks and crossing distances. Marked crosswalks are primarily located at signalized
intersections, while unsignalized marked crossings at intersections are located at only five
locations (including Foster Road at SE Cora Street and SE Couplet Street and SE Woodstock
Boulevard). Only two mid-block crossings are provided; one between SE 68th and 69th Avenue
(supplemented with a pedestrian refuge island and continental crosswalk markings) and the other
between SE 80th Avenue and SE Harold Street (supplemented with a Z-pattern pedestrian refuge
island, continental crosswalk markings, and a Rectangular Rapid Flashing Beacon).
Crossing distances range from roughly 60 feet at SE Cora Street to 110 feet at SE 82nd Avenue.
This is partially due to skewed intersection design and the lack of curb extensions throughout the
corridor. SE 52nd Avenue is a prime example of how skewed intersections increase crossing
distances and can limit motorists’ visibility of crossing pedestrians.

FOSTER CORRIDOR EXISTING CONDITIONS & OPPORTUNITIES | DRAFT PRELIMINARY ASSESSMENT
Foster Lents Integration Partnership
Nelson\Nygaard Consulting Associates Inc. | 4-10
Complex intersections for pedestrians. Complex
intersections at SE 82nd Avenue and the Foster
Road/SE Couplet Street connection include crossing
islands with protected right turn lanes, which offer
slower pedestrians an opportunity to break their
crossing into multiple phases. The intersection at SE
82nd Avenue has multiple signal phases including a
protected left turn phase. Although this increases
pedestrian delay, the safety benefit likely outweighs the
time delay cost for pedestrians due to the high number
of left turn movements onto and off of SE 82nd Avenue.
Curb ramps and curb extensions. The majority of
curb ramps along Foster Road have diagonal rather
than perpendicular (i.e. two ramps extending in each
direction) curb ramp design. Perpendicular curb ramp
design shortens crossing distances and makes crossing
movements easier for people with sight impairments.
Although Foster Road is relatively wide, only three
intersections along the corridor are furnished with curb
extensions (including Foster Road at SE Center Street,
SE 87th Avenue, and SE Couplet Street). Additionally, only a small percentage of intersections
have been fully retrofitted with accessible curb ramp design including detectable warnings,
adequate landings, and acceptable ramp design accounting for major changes in cross slope and
grade on the ramp and ramp flares.
Lack of placemaking features. Although sidewalks provide ample space for pedestrians west
of SE 80th Ave, limited street trees, poor illumination, high traffic speeds and volumes,
automobile-oriented land uses and prevalence of off-street parking lots make the pedestrian
environment disengaging and a lined with potential conflicts.
Future improvements. PBOT has secured a Regional Flexible Funds Grant from Metro to
construct crossing improvements at SE 58th, 60th, 61st, 65th and 69th Avenue. Sidewalk
enhancements, curb ramps, curb extensions, signal upgrades and bus stop improvements are also
proposed between SE 63rd and 67th Avenue and at SE 82nd Avenue.
The 6-leg intersection at Holgate and Foster presents pedestrians with complex multi-stage crossings, multiple conflict points, and long crossing distances.
Image from Bing
FOSTER CORRIDOR EXISTING CONDITIONS & OPPORTUNITIES | DRAFT PRELIMINARY ASSESSMENT
Foster Lents Integration Partnership
Nelson\Nygaard Consulting Associates Inc. | 4-11
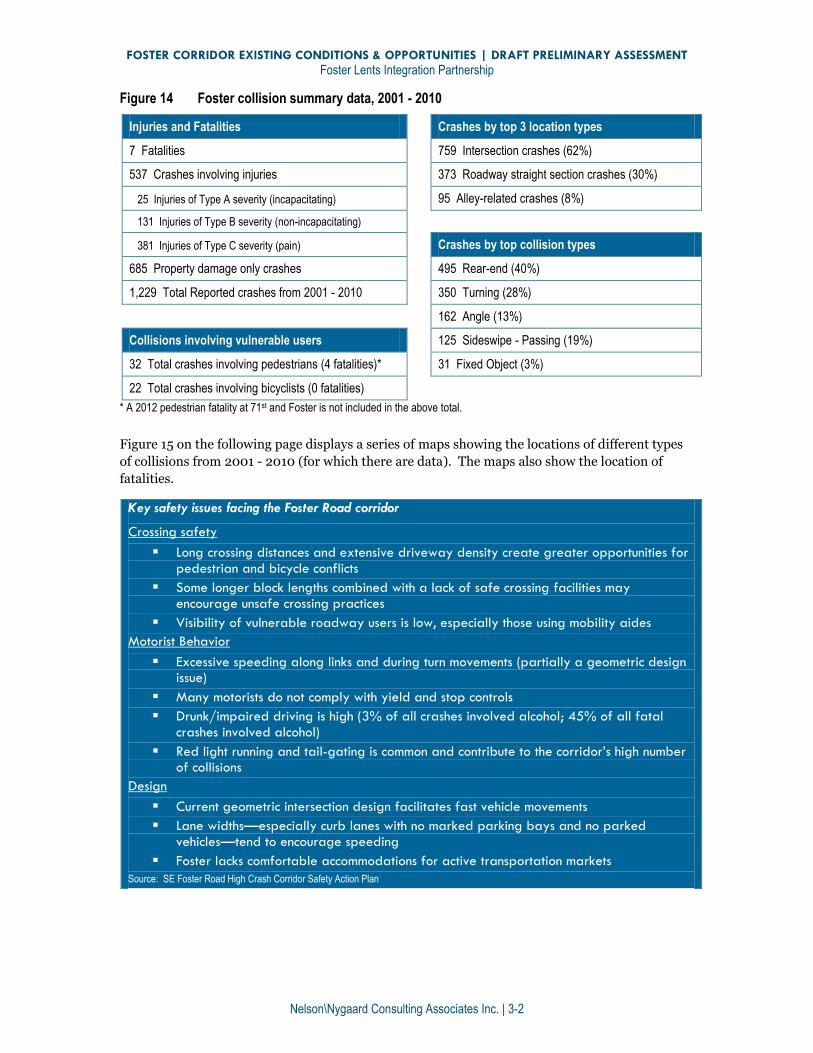
BICYCLE CONNECTIVITY AND CORRIDOR ACCESS
Cycling on Foster Road. Bicycle facilities along Foster are limited to bicycle lanes in the
couplet section that connects into the Green Line light rail station starting at SE 91st Avenue.
Between SE Powell Boulevard and SE 91st Avenue, there are no separated bicycle facilities.
Subsequently, many cyclists choose to ride on the sidewalk or use indirect neighborhood
connections.
With bicycle facilities lacking along the majority of Foster Road only strong and confident cyclists ride in the travel lane, while most choose to ride on the sidewalk.
Images from PBOT
Existing and funded bikeway connections are limited to the corridor edges. The
Center Street Neighborhood Greenway (reference map 3), SE 87th Avenue (reference map 12), and
the I-205 multi-use path (reference map 14) are the only existing direct bikeway connections
across Foster Road. SE Woodstock Boulevard is a less direct east-west bikeway alternative to
riding along Foster Road. It is furnished with a bike lane that connects cyclists to Eastmoreland,
Sellwood, and eventually the Springwater Corridor. The planned bike lane on SE 52nd Avenue (as
part of the 50s Bikeway project) and the SE 56th Avenue shared roadway are the only funded
bikeway connections available to Foster Road in the near-term.
Future bikeway connections to and across Foster Road are limited today. However,
the Portland Bicycle Plan for 2030 identifies various unfunded network improvements. A
dedicated bike lane or separated facility is planned for Foster Road by 2030. Other future bikeway
connections planned for the corridor include bike lanes on SE 82nd Avenue and SE Holgate
Boulevard, and neighborhood greenway connections on SE 87th Avenue, SE 77th/78th Avenue, and
SE 67th Avenue. SE 72nd Avenue should have bike lanes south of Foster and a neighborhood
greenway connection north of Foster.
Existing bicycle crossings are limited. Bicycle activated signals are not currently available
to cyclists crossing Foster Road. Future pedestrian and bicycle actuated signals will be located at
SE 58th Avenue, SE 60th Avenue, SE 61st Avenue, SE 64th Avenue, SE 65th Avenue, SE 67th Avenue,
and SE 69th Avenue. However, a key deficiency is that all existing and future crossings in the 2030
Plan are focused at signalized intersections.
Bike counts. PM peak period (4PM- 6PM) bicycle counts are highest at SE 52nd Avenue (45
total) and SE 72nd Avenue (21 total). Although no counts are available for SE Center Street at this

FOSTER CORRIDOR EXISTING CONDITIONS & OPPORTUNITIES | DRAFT PRELIMINARY ASSESSMENT
Foster Lents Integration Partnership
Nelson\Nygaard Consulting Associates Inc. | 4-12
time, it is likely that the SE Center Street Neighborhood Greenway crossing exhibits higher
bicycle counts.
Bicycle parking. Between Powell Boulevard
and I-205, Foster Road offers only 37 publically-
owned and maintained staple or U-racks. This is
equal to 8 racks per mile along the corridor.
There are no on-street bicycle parking corrals
along the corridor. There is also privately owned
and maintained bicycle parking supply along the
corridor, but they include wave or
“wheelbender” racks that are less preferred by
cyclists.
TRANSIT OPERATIONS AND ACCESS
Frequent transit service. The Foster Road corridor is well served by transit. Anchored by
Lents Town Center and Downtown Portland, TriMet’s Frequent Service line 14 operates 20-hour
service on Foster daily between 5:00 AM and 1:30 AM. Stops are served every 5-10 minutes in the
peak commute periods and 17 minutes in the afternoon. PM peak hour bus volumes on inner
Foster Road (5:00 PM – 6:00 PM) reaches up to 12 buses, including two limited stop express
trips. Buses typically use pull out spaces to facilitate boarding activity. There are no bus bulbs
along Foster Road to facilitate in-lane boarding activity.
A passenger gets off Line 14 at SE 65th Avenue in the Heart of Foster. Many stops along Foster Road offer basic passenger amenities including route information and benches.
Image from PBOT
Short-term bicycle parking off of Foster Road
Image from PBOT

FOSTER CORRIDOR EXISTING CONDITIONS & OPPORTUNITIES | DRAFT PRELIMINARY ASSESSMENT
Foster Lents Integration Partnership
Nelson\Nygaard Consulting Associates Inc. | 4-13
Transfer hubs. Lines 9, 10, 17, 71, 72, and MAX Green Line each serve the corridor at key
transfer locations. The Crossroads District (SE 82nd Avenue), Green Link (SE 72nd Avenue), and
Heart of Foster (SE Holgate) nodes serve as key bus transfer hubs. In addition to Line 14, Lines 10
and 72—the latter being a key east-west connection—serve the Crossroads District, which partially
explains the area’s high level of boarding and alighting activity (over 1,500 average daily boarding
alightings). The corridor is also served by Kern Park Christian Church Park & Ride—one of
Portland’s 19 Park & Ride facilities. This Park & Ride accommodates 24 parking spaces and is
located on SE Holgate roughly 1,200 feet east of the Heart of Foster.
Weekday boarding activity and daily transit flows. Weekday boarding activity on Foster
Road is highest at the Crossroads District transfer hub at SE 82nd Avenue (1,500
boarding/alightings) and the MAX Green Line Lents Town Center/SE Foster Rd Station area
(2,400 boarding/alightings including transfers).2 Other stop locations with relatively high
boarding and alighting activity include SE 72nd Avenue (260 boardings/alightings) and SE
Holgate (225 boardings/alightings).
Boarding activity roughly aligns with daily commute flows; westbound stops generally exhibit
higher boarding counts, while eastbound stops have higher alighting counts.
Stop amenities. The quality of stop amenities ranges from sign posts with basic stop signage to
stops with shelters, benches and trash receptacles.
2 Note: This does not include boarding and alighting activity on routes that intersect the Foster Road corridor.
FOSTER CORRIDOR EXISTING CONDITIONS & OPPORTUNITIES | DRAFT PRELIMINARY ASSESSMENT
Foster Lents Integration Partnership
Nelson\Nygaard Consulting Associates Inc. | 5-1
5 NEEDS ASSESSMENT AND GAP ANALYSIS
CORRIDOR OPPORTUNITIES AND TRADE-OFFS
Existing conditions of the Foster Road corridor have been identified and analyzed to provide
insight into the challenges and opportunities for future transportation enhancements. The
following matrix presents:
Key gaps and issues with Foster Road mobility and access
Opportunities to improve person mobility, safety, and economic development potential
along the inner Foster Road corridor (corresponding with key gaps)
Trade-offs and/or constraints that weigh the financial implications, modal impacts, and
coordination efforts required for implementing specific opportunities
This will inform prioritization of spot improvements and corridor-wide cross section alternatives
in the latter phases of the Foster Lents Integration Partnership process. The Foster corridor gaps
and opportunities matrix (Figure 25) is not meant to be a final determination of opportunities.
Additional opportunities will be explored to maximize potential corridor enhancements. Each
opportunity in the matrix highlights general multimodal benefits on the basis of safety,
accommodation/comfort, and travel time.
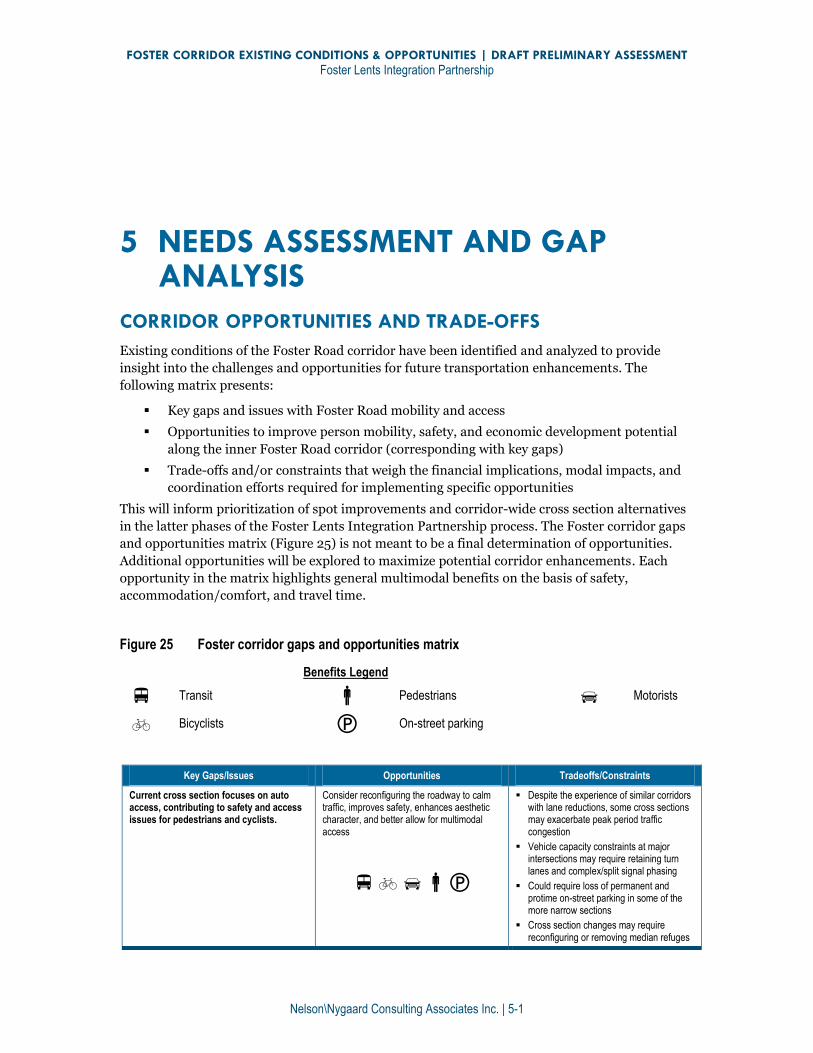
Figure 25 Foster corridor gaps and opportunities matrix
Benefits Legend
Transit Pedestrians Motorists
Bicyclists On-street parking
Key Gaps/Issues Opportunities Tradeoffs/Constraints
Current cross section focuses on auto access, contributing to safety and access issues for pedestrians and cyclists.
Consider reconfiguring the roadway to calm traffic, improves safety, enhances aesthetic character, and better allow for multimodal access
Despite the experience of similar corridors with lane reductions, some cross sections may exacerbate peak period traffic congestion
Vehicle capacity constraints at major intersections may require retaining turn lanes and complex/split signal phasing
Could require loss of permanent and protime on-street parking in some of the more narrow sections
Cross section changes may require reconfiguring or removing median refuges

FOSTER CORRIDOR EXISTING CONDITIONS & OPPORTUNITIES | DRAFT PRELIMINARY ASSESSMENT
Foster Lents Integration Partnership
Nelson\Nygaard Consulting Associates Inc. | 5-2
Key Gaps/Issues Opportunities Tradeoffs/Constraints
Could create diversion impacts
Alternatives that reconstruct the curb and gutter or move utilities will be costly
Potential high cost, high/multi-user benefit improvement
Requires substantial outreach effort (underway)
Existing transit service operates as “Frequent Service” but there is opportunity for service that can stimulate development and corridor revitalization and improve frequency
Establish streetcar, or enhanced bus service on SE Foster Road
Enhanced transit, especially rail, requires substantial capital, and analysis of land use and network connections.
Current land uses would not support enhanced transit services (streetcar and busway), though Foster has zoning that generally supports transit.
Corridor lacks a density of bikeway connections—especially to district nodes
Develop direct and low stress bikeway connections across Foster Road, prioritizing access to Crossroads, GreenLink, Heart of Foster, Western Core, and Gateway
Requires greater funding allocation to bicycle improvements
Likely requires improvements to signal timing, intersection approaches and the number and quality of crossings (see below)
Because of the area’s irregular street grid, opportunities for direct connections are limited
Expand the number of bicycle crossings and enhance existing crossings with bicycle detection, colored pavement treatments, pavement markings, refuges, and turn queue boxes, among others
Might be a lower priority improvement as there are no planned bikeway connections at unsignalized intersections
Costs depend on the type of improvement
Pedestrian access along Foster Road presents users with complex intersections (e.g., long crosswalk distances, pedestrian delay, etc.) and conflict points (e.g., driveways)
Redesign intersections with tighter curb radii to limit intersection skew/crossing complexity, increase pedestrian visibility, and reduce turning movements speeds
High cost improvement requiring significant study and engineering
Would work best with a speed limit reduction as vehicles currently expect geometries that are amenable to faster turns
Adjust traffic signal timing to limit pedestrian delay
May increase traffic delay and queuing in the AM/PM peaks
Break up long block faces and expand safe crossing opportunities with mid-block crossing furnished with pedestrian refuges and expanded use of rectangular rapid flashing beacons (RRFBs)
Higher cost, high compliance traffic control devices
RRFBs may cause minor cumulative traffic delay in the peak travel periods
Clearly define conflict zones at intersections and high activity driveways with pavement markings, signs, and pavement design
Pavement design/decorations are more costly than pavement markings and bicycle/pedestrian benefits depend on type of application
Many transit stops lack high quality passenger amenities that improve the transit experience
Construct high amenity transit shelters that improve passenger comfort and safety, including lighting, benches, covered shelters, transit information, consistent bus landing
Costs depend on the type of improvement
Requires coordination and cost sharing with TriMet

FOSTER CORRIDOR EXISTING CONDITIONS & OPPORTUNITIES | DRAFT PRELIMINARY ASSESSMENT
Foster Lents Integration Partnership
Nelson\Nygaard Consulting Associates Inc. | 5-3
Key Gaps/Issues Opportunities Tradeoffs/Constraints
pads, facility design that establishes predictable passenger ingress and egress, bicycle parking (at major transfer hubs), and trash receptacles
Several transit stops are located a sizeable walking distance from traffic controlled intersections or crossings, which may encourage jaywalking or crossing at unsignalized intersections with no marked crosswalks
Adhere to the TSP’s Major Transit Priority Street designation, by establishing regular stop distances with enhanced pedestrian and bicycle safety crossing measures
Moving stop location require extensive coordination with TriMet (and ODOT depending on whether the stops lie their sphere of influence)
Potential high cost service/capital improvement, requiring replacement of stop infrastructure
No strategic access management efforts have been pursued (i.e. median, median barriers, driveway closure/consolidation)
Develop a raised/landscaped median along portions of Foster Road
Developing landscaped medians will require coordination between PBOT, BES, and volunteer organizations.
Landscaped medians create higher capital and annual operating and maintenance costs.
Decommission driveways that are underutilized, not in operation, or pose significant risk to pedestrians and bicyclists
Requires significant property owner and business engagement
Existing and planned bicycle crossing are only located at signalized intersections; average signal spacing is roughly 1,200 feet
Establish marked bicycle crossings at unsignalized intersections with crosswalks, median refuges that facilitate two-stage crossings, and median barriers/access management where appropriate
Developing landscaped medians will require coordination between PBOT, BES, and volunteer organizations.
Landscaped medians create higher capital and annual operating and maintenance costs.
Current pedestrian conditions generally are not consistent with the corridor’s City Walkway and Regional Main Street designations
Establish consistent pedestrian/sidewalk zones that organize sidewalk uses and introduce urban design/placemaking features
My require expanding sidewalks in places where sidewalks are less than 13-15’ (high cost)
Costly/Redesigning will likely need to occur with redevelopment
Sidewalk widths and walking conditions east of SE 82nd Avenue are uncomfortable and, in some cases, unsafe
Pursue a lane reduction east of SE 82nd Avenue to gain space for sidewalks
Benefits depend on lane configuration
Sidewalk expansion will likely occur over time through redevelopment dedications
Will require buy-in from ODOT and other stakeholders
Implement arterial traffic calming measures (e.g., gateways, reduce lane widths, provide permanent on-street parking with curb extensions)
Will require buy-in from ODOT and local businesses
Requires additional traffic study to determine potential traffic and diversion impacts or calming measures
Foster Road lacks a comfortable, designated bicycle facility
Develop a clearly demarcated bikeway—preferably separated by a marked buffer or physical barrier—on Foster Road between SE 52nd Avenue and the couplet area (SE 87th Avenue)
Separated facilities introduce challenges at intersections; may require bicycle signals and/or parking removal to preserve motorist’ sightlines
May require lane reduction and/or parking removal depending on the corridor segment
Parking supply is constrained by driveway density, inadequate parking bay widths, and a lack of clear pavement markings
Maintain and expand on-street parking supply as a pedestrian buffer and a speed management tool.
Parking supply can be increased by consolidating driveways, although this will require significant property owner and

FOSTER CORRIDOR EXISTING CONDITIONS & OPPORTUNITIES | DRAFT PRELIMINARY ASSESSMENT
Foster Lents Integration Partnership
Nelson\Nygaard Consulting Associates Inc. | 5-4
Key Gaps/Issues Opportunities Tradeoffs/Constraints
business engagement
Stripe parking bays with T-bars to reduce the effective curb travel lane width
None
Right-of-way widths and signal spacing encourage speeding
Reduce the speed limit to 30 mph, and potentially lower at select district nodes
May heighten vehicle and transit delay during peak travel periods
Requires buy-in from neighborhood, businesses, and ODOT
See the tradeoffs/challenges from the “Alternative cross sections with a two or three-lane cross-section” opportunity above
IMPROVEMENTS CONSTRUCTED SINCE 2003
Since adoption of the 2003 Plan, several safety enhancements have been built by PBOT. In 2006-
2007, median islands, marked crosswalks, and crossing signage were installed at SE 58th, 61st,
65th, and 69th Avenues. In 2008, a median island, marked crosswalk, and a Rectangular Rapid
Flashing Beacon was installed at SE 80th Avenue. In addition, crossing improvements targeted at
bicyclists were built in 2010 as part of the Center Avenue Neighborhood Greenway Project.
SE 58th Avenue and Foster Road, before and after crossing improvements

FOSTER CORRIDOR EXISTING CONDITIONS & OPPORTUNITIES | DRAFT PRELIMINARY ASSESSMENT
Foster Lents Integration Partnership
Nelson\Nygaard Consulting Associates Inc. | 5-5
SE 65th Avenue and Foster Road, before and after crossing improvements
SE 69th Avenue and Foster Road, before and after crossing improvements
SE 56th Avenue and Center Avenue Neighborhood Greenway Crossing
FOSTER CORRIDOR EXISTING CONDITIONS & OPPORTUNITIES | DRAFT PRELIMINARY ASSESSMENT
Foster Lents Integration Partnership
Nelson\Nygaard Consulting Associates Inc. | 5-6
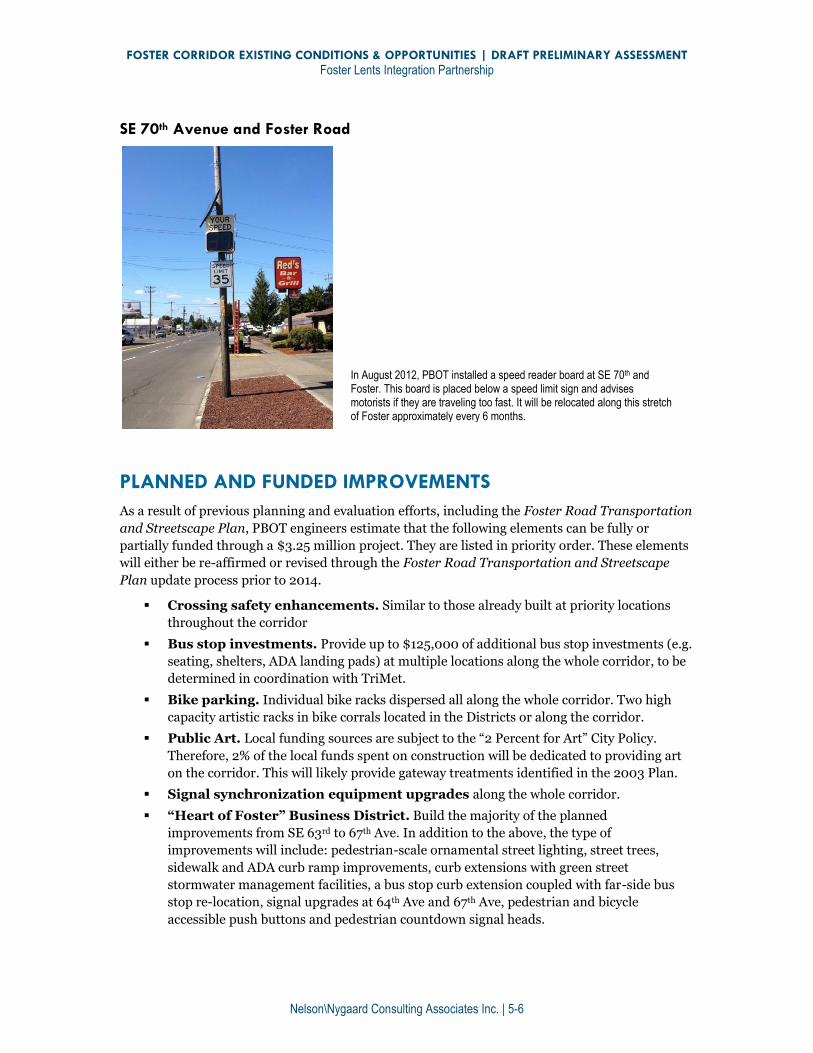
SE 70th Avenue and Foster Road
PLANNED AND FUNDED IMPROVEMENTS
As a result of previous planning and evaluation efforts, including the Foster Road Transportation
and Streetscape Plan, PBOT engineers estimate that the following elements can be fully or
partially funded through a $3.25 million project. They are listed in priority order. These elements
will either be re-affirmed or revised through the Foster Road Transportation and Streetscape
Plan update process prior to 2014.
Crossing safety enhancements. Similar to those already built at priority locations
throughout the corridor
Bus stop investments. Provide up to $125,000 of additional bus stop investments (e.g.
seating, shelters, ADA landing pads) at multiple locations along the whole corridor, to be
determined in coordination with TriMet.
Bike parking. Individual bike racks dispersed all along the whole corridor. Two high
capacity artistic racks in bike corrals located in the Districts or along the corridor.
Public Art. Local funding sources are subject to the “2 Percent for Art” City Policy.
Therefore, 2% of the local funds spent on construction will be dedicated to providing art
on the corridor. This will likely provide gateway treatments identified in the 2003 Plan.
Signal synchronization equipment upgrades along the whole corridor.
“Heart of Foster” Business District. Build the majority of the planned
improvements from SE 63rd to 67th Ave. In addition to the above, the type of
improvements will include: pedestrian-scale ornamental street lighting, street trees,
sidewalk and ADA curb ramp improvements, curb extensions with green street
stormwater management facilities, a bus stop curb extension coupled with far-side bus
stop re-location, signal upgrades at 64th Ave and 67th Ave, pedestrian and bicycle
accessible push buttons and pedestrian countdown signal heads.
In August 2012, PBOT installed a speed reader board at SE 70th and Foster. This board is placed below a speed limit sign and advises motorists if they are traveling too fast. It will be relocated along this stretch of Foster approximately every 6 months.

FOSTER CORRIDOR EXISTING CONDITIONS & OPPORTUNITIES | DRAFT PRELIMINARY ASSESSMENT
Foster Lents Integration Partnership
Nelson\Nygaard Consulting Associates Inc. | 5-7
“Crossroads District”. Build many of the planned improvements from SE 80th to 84th
Ave. Some improvements have been built at 80th Ave and 84th Ave. In addition to the
above, the following will be built at the 82nd Ave and Foster Rd intersection: wider
sidewalks near the intersection with right-of-way acquisition, new ADA curb ramps,
green street stormwater management facilities, possibly street trees and signal upgrades,
including new signal pole and mast arms, signal head back plates for greater visibility,
microwave pedestrian detection to extend the “Don’t Walk” phase for slow-moving
pedestrians that remain in the crosswalk at the end of the regular phase, in-road vehicle
detectors to extend the red light to avoid crashes from red light running, count-down
pedestrian signal heads and accessible push buttons.
Possibly the “Green Link” Focal Point. Improvements may include curb extensions,
street trees, bike racks, lighting, and public art at SE 72nd Avenue.
In addition, the 50s Bikeway project, to be built in 2013, will include an enhanced crossing at
Foster and 52nd. The project will rebuild the SE corner, with 5’ green bike lanes approaching the
intersection on both sides of Foster, and dotted bike lanes through the intersection.