Embed Size (px)
Citation preview

annual repor t2010
For
per
sona
l use
onl
y
CORPORATE DIRECTORY
Directors
William Bloking Chairman
Jocot de Dios President and CEO
David Whitby Non-Executive Director
Vincent Pérez Non-Executive Director
Eduardo Mañalac Non-Executive Director
Andrew Edwards Non-Executive Director
Company Secretary
John Newman
Registered and Principal Office
Level 3 1 Preston Street COMO WA 6152
P +61 (0) 8 9474 0000 F +61 (0) 8 9474 0099 E [email protected] W www.nido.com.au
Share Registry
Computershare Limited Level 2, 45 St George’s Terrace PERTH WA 6000
P +61 (0) 8 9323 2000 F +61 (0) 8 9323 2033
Solicitors
Clayton Utz QV1 250 St Georges Terrace PERTH WA 6000
P +61 (0) 8 9426 8000 F +61 (0) 8 9481 3095
Minter EllisonLevel 49 152 – 158 St Georges Terrace PERTH WA 6000
P +61 (0) 8 9429 7444 F +61 (0) 8 9428 7666
Romulo Mabanta Law Office 30th Floor, Citibank Tower, 8741 Paseo de Roxas, Makati City, PHILIPPINES
P +63 2 848 0114 F +63 2 810 3110
Auditors
Ernst & Young The Ernst & Young Building 11 Mounts Bay Road PERTH WA 6000
P +61 8 9429 2222 F +61 8 9429 2436
Securities Exchange Listing
The Company’s securities are listed on the official list of the Australian Securities Exchange Limited.
ASX Code Shares: NDO
For
per
sona
l use
onl
y

2010 Summary 2
Chairman’s Letter 3
Chief Executive Offi cer’s Report 4
Operations Review 6
Petroleum Permit Interest Schedule 17
Directors’ Report 18
Auditor’s Independence Declaration 38
Corporate Governance Statement 39
Directors’ Declaration 47
Statement of Comprehensive Income 48
Balance Sheet 49
Statement Cash Flows 50
Statement of Changes In Equity 51
Notes to the Financial Statements 52
Independent Auditor’s Report 99
Additional Information 101
For
per
sona
l use
onl
y

NIDO PETROLEUM ANNUAL REPORT 2010 2
2010 SUMMARY
Production
❯ A total of 2.6 MMstb (gross) were produced from the Galoc oil
fi eld in 2010 corresponding to an average uptime of 84%.
❯ A total of 0.3 MMstb (gross) were produced from the Tindalo oil
fi eld Extended Well Test in 2010.
❯ Revenue from crude oil sales increased by 25.7% from
the previous year, to $60.1 million.
Development
❯ In March 2010 Nido farmed out 7.6% of its interest in SC 54A to
TG World (BVI) Corporation, ahead of the commencement of the
Tindalo oil fi eld Extended Well Test.
❯ Nido reprocessed 140 sq. km. of 3D seismic data within
SC 54A covering the Nido 1x1 and Yakal discoveries and the
Pungapong and Nandino prospects.
❯ First oil was achieved on 30 May 2010 at the Tindalo oil fi eld,
some fi ve months after achieving Final Investment Decision in
December 2009.
❯ The Tindalo oil fi eld Extended Well Test commenced on
6 June 2010.
❯ The Extended Well Test failed to produce oil at economic
rates due to excessive water production and the SC 54A Joint
Venture decided to abandon the well in December 2010 with
completion of abandonment occurring in the fi rst quarter of
2011.
Exploration
❯ The Company announced at its 21 May 2010 AGM a fi ve well
exploration program.
❯ In October 2010, Shell Philippines Exploration B.V. farmed into
SC 54B to earn a 45% Participating Interest in the block.
❯ A deepwater multi-beam and sea-bed coring program was
completed in SC 58 between March and April 2010. Results
indicate widespread micro-seepage of mature hydrocarbons
across the most prospective part of the block.
❯ Reprocessing of the Talusi 2D seismic in SC 58 was completed
during 2010 improving the subsurface imaging of the source
grabens in the deepwater.
❯ In SC 63, Pre Stack Depth Migration processing of the Kawayan
3D seismic was completed in July 2010.
❯ The SC 54 Sub-Phase 5 relinquishment of 25% due in August
2010 was successfully deferred to the end of Sub-Phase 6 in
August 2011.
❯ The Joint Philippine Basin Study conducted between Nido and
a SE Asian National Oil Company was completed in the fi rst half
of 2010.
Health, Safety, Security and Environment (HSSE)
❯ Excellent 2010 HSSE performance across all assets and
activities.
❯ Zero fatalities and zero Lost Time Injuries.
❯ Total Recordable Injury Frequency Rate (TRIFR) for 2010 was
2.05 compared to the National Offshore Petroleum Safety
Authority (NOPSA) benchmark of 7.87 as at 30 June 2010.
Corporate and Financial
❯ Cash on hand at year end of $24.2 million.
❯ Gross profi t from continuing operations of $7.5 million.
❯ Successfully completed a private share placement and Share
Purchase Plan, raising a total of $28.0 million (net).
❯ Debt reduced by US$10.0 million during the year, with debt
outstanding at year end of US$9.2 million (US$3.1 million as of
the date of this Annual Financial Report).
For
per
sona
l use
onl
y

NIDO PETROLEUM ANNUAL REPORT 2010 3
Dear Shareholder,
I am pleased to present my second Report to you as Chairman of Nido Petroleum Limited (Nido).
2010 was a very challenging year for our
Company – with highly mixed results.
The failure of the Extended Well Test at
Tindalo to produce oil at economic rates,
despite the investment of a signifi cant
amount of time, money, and effort, was a
major disappointment and the Company
recognises that we fell well short of
shareholders’ – and our own - expectations.
We are currently undertaking a thorough,
independent review of the Tindalo
development project in order to identify and
capture any lessons to be learned for future
development activities.
Notwithstanding the disappointing results at
Tindalo, we were pleased to have delivered
the project on schedule, on budget, and
with an excellent HSSE record. Moreover,
given our successful equity raising and
farmout activities during the year, coupled
with the continuing production at Galoc,
the Tindalo disappointment will not deter
Nido from pursuing its strategic exploration
objectives.
On a more positive note, the Galoc asset
performed very well, with 8 off-take cargoes
totaling 2.6 million barrels of oil (gross)
and a signifi cant increase in facility uptime
from 64 percent in 2009 to 84 percent in
2010. The Galoc Joint Venture is currently
considering further development options
which have the potential to signifi cantly
increase the life of the fi eld, and we are thus
optimistic about its future.
During the year, we farmed out 27 percent
of our 60 percent Participating Interest in
Service Contract 54B to Shell Philippines
Exploration B.V., thus enabling the
SC 54B Joint Venture to drill the Gindara
prospect commencing in May 2011. This
was a major strategic achievement for
the Company, with the Gindara prospect
marking the beginning of Nido’s “big hit”,
5-Well exploration campaign.
Whilst the current plan has the Aboabo
prospect in SC 63 as the likely second
well in our 5-Well campaign, the recently
completed Kawayan 3D Seismic Survey
within SC 63 has identifi ed a number of
exciting new leads and prospects which,
after further interpretation, could alter the
drilling sequence in that block and/or in the
overall program.
Nido also completed the geochemical
analysis of the deepwater sea-bed cores
acquired in SC 58 during the year. The
results provide evidence of an active source
system within the block, and the work
brings into focus the huge upside potential
of the large Balyena, Butanding and Dorado
prospects.
We also made signifi cant strides in the
reduction of our external debt. Through
share conversions as well as principal and
interest payments under the Convertible
Note with Merrill Lynch, external debt has
been reduced from US$19.2 million at the
beginning of 2010 to US$3.1 million as at
the date of this Annual Financial Report.
We look to the future with continued
enthusiasm and optimism. Nido’s
exploration portfolio contains more than
90 prospects and leads, with potential oil in
place (gross, mean, unrisked) of more than
11 billion barrels of oil equivalent. We have
spent more than $70 million on exploration
activities, including the acquisition of 2D
and 3D seismic over all areas of interest in
SC 54A and B, SC 63, and SC 58, as
well as sea-bed cores over the key areas
of interest in SC 58, in order to move key
prospects to a “drill-ready” status. This
work was an essential precursor to the
drilling of a strategic, statistically signifi cant
program that will test the key play types
across the basin and provide additional
technical data to further de-risk the portfolio.
The campaign will commence in 6 to 8
weeks with the drilling of Gindara, followed
by subsequent wells in SC 63, SC 58 and
SC 54A.
I would like to express my sincere thanks
to my fellow Directors, our Leadership
Team and our staff for their commitment
and dedication during the year, particularly
given some of the diffi cult decisions that
were required to be made concerning the
abandonment of Tindalo and the decision
to preserve our cash reserves for our
exploration drilling rather than pursuing a
development at Yakal. I would also like
to thank you, our shareholders, for your
support.
We eagerly await the commencement of
our drilling campaign. With the continued
support of our shareholders, our employees
and our Board, we can look forward to
2011 with excitement and enthusiasm
as we pursue the creation of signifi cant
shareholder value through the discovery
and development of new hydrocarbon
resources.
Yours faithfully,
William Bloking FAICD
Chairman
CHAIRMAN’S LETTERF
or p
erso
nal u
se o
nly

NIDO PETROLEUM ANNUAL REPORT 2010 4
CHIEF EXECUTIVE OFFICER’S REPORT
Dear Shareholder,
At the beginning of 2010, we were optimistic about the prospects of the coming year and looked forward to achieving first oil at Tindalo and strategically farming out working interests from our acreage to enable us to commence our “big hit” exploration program.
While we succeeded in achieving fi rst oil at Tindalo within fi ve months
from fi nal investment decision early water incursion proved to be
insurmountable and as the year ended the SC 54A Joint Venture
decided to plug and abandon the well.
We were, however, more fortunate with our farmout activities as
Shell Philippines Exploration B.V. entered into a farm-in transaction
involving the SC 54B block and a signifi cant carry for the drilling
of the Gindara prospect, one of Nido’s larger prospects. The
drilling of Gindara represents the start of the Company’s “big-hit”
exploration program that will see us drill the major prospects within
our portfolio.
Against the backdrop of these two key activities, work continued
on the rest of our acreage as we sought to mature other drilling
prospects. We also continued with the prudent monitoring and
management of spending even as credit and capital markets
began to open up.
Importantly, we achieved an excellent safety record during 2010,
in a year where the Company operated its fi rst offshore production
facility at Tindalo. We accumulated 977,788 man-hours during
the year with zero fatalities, zero Lost Time Injuries and a Total
Recordable Injury Frequency Rate (TRIFR) of 2.05. This TRIFR
rate compares well with the Australian National Offshore Petroleum
Safety Authority (NOPSA) current industry rate of 7.87 as at
30 June 2010.
With the drilling of Gindara on the horizon, we ended the year with renewed purpose and vigour to make 2011 better.
Exploration ActivityOur subsurface work for SC 54B’s Gindara prospect continued
and as Nido has been asked to continue as operator for the drilling
campaign, we have expanded our drilling and operations teams.
In SC 58, we completed a sea-bed coring survey which was
initiated to prove an active oil source within the block. Positive
results from geochemical studies of the cores indicate micro-
seepage concentrated in the central portion of the contract area.
These results highlight the very prospective nature of SC 58,
particularly around our key drilling prospects. The forward program
for this year involves further geological and geophysical work to
feed into drill planning.
Processing was completed on the Kawayan 3D seismic in
SC 63 showing a marked increase in imaging over the previous 2D
seismic. Structural studies and interpretation of this 3D seismic
have identifi ed a number of new Prospects and Leads. Further
work in 2011 is aimed at progressing Aboabo and other prospects
towards drilling.
As we completed the Shell Philippines Exploration B.V. farmout
near the end of 2010, we resumed farm-in activities for our other
blocks. Given the oil price environment and the continued level of
activity in the Philippine upstream sector, we are seeing continued
interest in exploration activity.
Development & Appraisal ActivityWhile Nido achieved fi rst oil at Tindalo in May 2010, early water
breakthrough on the third day of the Extended Well Test set the
pattern for what would ultimately be a disappointing project.
Despite signifi cant attempts to address the water infl ux, which
included the drilling of a short radius sidetrack well and a workover
of the sidetrack, the problem persisted. Given the uneconomic oil
production rates, the SC 54A Joint Venture decided in December
to plug and abandon the well and subsequently demobilise the rig.
Nido, as operator of the block has commissioned a thorough review of the project with a view to applying the lessons learned to other potential shallow water opportunities within our acreage.
Production ActivityAs we experienced disappointment with Tindalo, Galoc’s performance impressed. In 2010, Galoc produced a total of 2.6 MMstb of crude oil (604,208 stb net to Nido) with an average uptime of 84%. The crude cargoes continued to be marketed and sold throughout Southeast Asia, attracting repeat buyers in an increasingly improving price environment.
In the last twelve months, the Galoc Joint Venture continued to
review development options for the fi eld. This work has resulted in
a more robust understanding of the Galoc North Prospect as well
as the identifi cation of a new exploration target in the SC 14C1
block. This will add to the menu of options to be considered by the
SC 14C1 Joint Venture in 2011.
For
per
sona
l use
onl
y

NIDO PETROLEUM ANNUAL REPORT 2010 5
CHIEF EXECUTIVE OFFICER’S REPORT
Corporate DevelopmentsNido continued to monitor its general and administrative
expenditures to stay in line with our commitment to run our
corporate operations more prudently and economically. When
Tindalo did not provide us with the expected second revenue
stream we conducted a private placement followed by a Share
Purchase Plan that generated the Company $28.0 million (net).
During the year we worked closely with Merrill Lynch to
successfully restructure our Convertible Note repayments in order
to manage our cash fl ow. Through a combination of principal
repayments and Merrill Lynch’s conversion of Notes, debt was
reduced by US$10 million to US$9.2 million by year end.
While we had hoped that 2010 would be better, this has only strengthened our resolve to continue with our “big hit” exploration program and our search for additional near term revenue streams from within our portfolio to complement Galoc production.
The fi rst part of 2011 will see the Company investing heavily not
only in preparations for Gindara, but also in maturing the identifi ed
prospects in SC 63 and SC 58. We have committed ourselves to
drilling an exploration program, and not just one well. While Gindara
sits as one of our leading prospects in the inventory today, there
are more that Nido intends to drill within the NW Palawan Basin.
The current production asset and other shallow water opportunities
will be evaluated and pursued to enable us to fund this program.
With your continued support we will meet with success.
Yours faithfully,
J.V. Emmanuel Araullo de Dios MAICD
President and Chief Executive Offi cer
For
per
sona
l use
onl
y

NIDO PETROLEUM ANNUAL REPORT 2010 6
OPERATIONS REVIEW
PRODUCTION AND DEVELOPMENT
2010 PRODUCTION SUMMARY
Field
Gross Oil Production Net Production to Nido
Year Total
Average Daily
Year Total
Average Daily
Stb Bopd Stb Bopd
Galoc 2,640,826 7,235 604,208 1,655
Nido & Matinloc 156,131 428 39,137 107
Tindalo 268,851 737 113,993 312
Total 3,065,808 8,400 757,338 2,074
Galoc – SC 14 Block C1, North West Palawan Basin, Philippines
The Company’s wholly owned subsidiaries, Nido Production
(Galoc) Pty Ltd and Nido Petroleum Philippines Pty Ltd, hold a
combined 22.879% interest in Service Contract SC 14C1 which
contains the Galoc oil fi eld development.
Production ActivitiesOperationally, 2010 was a better year for the Galoc oil fi eld with
an average uptime of 84% compared to the 64% average uptime
registered in 2009. The improved uptime allowed the fi eld to
produce at a rate of 7,235 bopd (gross average for the year).
The Galoc oil fi eld produced about 2.6 MMstb gross (604,208
stb net to Nido) during the year with a cumulative production from
start-up to year end of 6.2 MMstb. A total of eight cargoes were
sold to buyers in Korea and Japan.
Facility Repairs and EnhancementsIn the fourth quarter of 2010 the FPSO contractor tested a Torpedo
Buoy enhancement to the Mooring and Riser system. Unfortunately,
during rough weather it separated on 25 October 2010 and a
31 day shutdown ensued. The Operator resumed production on
25 November 2010 and the system has been restored to its
pre-trial condition.
For
per
sona
l use
onl
y

NIDO PETROLEUM ANNUAL REPORT 2010 7
OPERATIONS REVIEW
Galoc – SC 14 Block C1, North West Palawan Basin, Philippines - continued
Further DevelopmentPotential Phase 2 options for the development of the Galoc oil
fi eld were investigated throughout 2010. Reprocessed Pre Stack
Depth Migration Galoc 3D seismic data was integrated with
previous 3D mapping and in this context new Top Nido depth
maps were generated by the Operator and Nido. Various potential
development scenarios involving one to two horizontal wells with
possible pilot holes were being considered by the Joint Venture
during the year, but no decisions on the optimal development
scenario had been made by the end of 2010.
A biostratigraphic review of key fi eld wells was also completed by
Nido on behalf of the SC 14C1 Joint Venture to better constrain
the vertical and lateral position of the G-3 and G-4 wells within
the Galoc Clastic Unit (GCU) stratigraphic sequences and provide
an improved realisation of the 3D-based structural model over
the western fl ank of the fi eld. It is anticipated that this work will
culminate in a revised view of the existing and future potential of
the Galoc development and will be critical in determining the scope
and value of Phase 2 development activities.
An independent subsurface review was also completed by Nido on
the Galoc North structure which lies immediately north of the Galoc
oil fi eld. Preliminary seismic interpretation indicates that a common
oil-water contact could exist between the Galoc fi eld and the Galoc
North structure which would signifi cantly upgrade Galoc North as a
potential low risk drilling target. Drilling of the Galoc North prospect
could potentially be combined with Phase 2 development activity.
Reserves Nido commissioned Gaffney Cline & Associates (GCA)
independently of the Galoc Joint Venture in the fi rst quarter of
2010 to update the Reserves estimates of the Galoc oil fi eld as at
31st December, 2009 from its pre-production estimates following
receipt of additional data from down-hole pressure measurements
in the two producing wells together with production data through to
the end of 2009.
Reserves estimates as at 31st December, 2009 outlined below
for the Galoc oil fi eld represent GCA’s estimates and are not
necessarily those of the SC 14C1 Joint Venture partners.
Nido has advised GCA that production performance of the Galoc
fi eld during 2010 has been consistent with the expectations for the
fi eld that were assumed for the 31st December, 2009 Reserves
estimate and has therefore applied the 2010 recorded production
volumes from the fi eld to update the Reserves position for the fi eld
at 31st December, 2010.
For
per
sona
l use
onl
y

NIDO PETROLEUM ANNUAL REPORT 2010 8
OPERATIONS REVIEW
Galoc – SC 14 Block C1, North West Palawan Basin, Philippines - continued
The Reserves position for the Galoc oil fi eld is shown below:
Reserves
Category
STOIIP Recovery
Factor
Estimated
Ultimate
Recovery
at
31 Dec
2009
Production
Oct
2008 to
Dec 2009
Reserves(1)
at
31 Dec
2009
Production
Jan to
Dec
2010
Reserves(3)
at
31 Dec
2010
MMstb % MMstb MMstb MMstb MMstb MMstb
Proved
(1P)(2)89 11.7 10.4 3.6 6.8 2.6 4.2
Proved +
Probable
(2P)(2)
121 15.1 18.3 3.6 14.7 2.6 12.1
Proved +
Probable +
Possible
(3P)(2)
178 15.1 26.9 3.6 23.4 2.6 20.8
(1) In accordance with ASX Listing Rule 5.11, the Company confi rms that the hydrocarbon
reserves information above, was reviewed and signed off by Mr David S. Ahye, B. Eng.,
Principal Advisor, Gaffney Cline & Associates, who is a member of the Society of Petroleum
Engineers and has at least 5 years’ experience in the sector. Mr Ahye is not an employee of
the Company and consented in writing to the inclusion above of the hydrocarbon reserves
information in the form and context in which it appears.
(2) Please refer to the Glossary for defi nitions.
(3) Nido updated Reserves estimate based on 2010 fi eld production performance results.
Internal studies are underway to update the Galoc reserve
estimates as well as to determine options for further development
of the fi eld which have not yet been incorporated into the Reserves
estimates.
Nido and Matinloc – SC 14 Blocks A & B, North West Palawan Basin, Philippines
Nido’s wholly owned subsidiary, Nido Production (Galoc) Pty
Ltd, holds a 22.486% working interest in the Nido oil fi eld and a
28.283% working interest in the Matinloc oil fi eld. Both the Nido
and Matinloc oil fi elds are in late-life, cyclical production.
During 2010, both fi elds produced a combined total of 156,131
stb, averaging 428 bopd (approximately 107 bopd net to Nido).
Revenue from crude oil sales relating to the Nido and Matinloc
fi elds totalled $2.2 million for the year (2009: $1.5 million).
Tindalo and SC 54 BLOCK A – SC 54A, North West Palawan Basin, Philippines
The Company’s wholly owned subsidiary, Nido Petroleum
Philippines Pty Ltd, holds a 42.4% working interest in the SC 54A
block.
Development and Production ActivitiesFirst oil from the Tindalo project fl owed to surface on 30 May 2010.
Approximately 44 metres of the Nido limestone reservoir was
perforated and stimulated with acid achieving a maximum oil fl ow
rate of 18,689 bopd of 27°API oil with choke size 136/64th and a
fl owing tubing head pressure of 59 psig. Following a short-term drill
stem test, an Extended Well Test commenced on 6 June 2010.
Not long after the start of the Extended Well Test, the well saw
formation water breakthrough which displaced oil production. A
short radius sidetrack drilling program and subsequent sidetrack
workover failed to eliminate water production or reduce it
suffi ciently to permit economic oil production. The SC 54A Joint
Venture subsequently decided to abandon the Tindalo-1ST1 well
in December. Abandonment was completed in January 2011 and
the Joint Venture demobilised the project equipment (including the
Aquamarine Driller rig and Tove Knutsen FSO) from the Service
Contract area.
During the drill stem test and the Extended Well Test the Tindalo
fi eld produced a total of 268,851 stb* (gross). One cargo of
194,336 bbl* @ 60˚F was sold in September 2010 and another
cargo of 73,420 bbl* @ 60˚F was sold in the fi rst quarter of 2011.
* Please note that the difference in the cumulative volume of the cargoes compared with
the volume produced in the fi eld is due to the different units of measurement used.
Farmout to TG WorldOn 11 March 2010, Nido Petroleum Philippines Pty Ltd farmed-out
7.6% of its interest in SC 54A to TG World (BVI) Corporation (TG
World) a subsidiary of Canadian junior oil and gas company, TG
World Energy Corporation. Consideration from the transaction,
which includes contingent payments based on production
milestones, will total a maximum of US$6.8 million.
Seismic Reprocessing and Other StudiesNido has reprocessed 3D seismic data covering an area of
140 sq. km. within the central portion of the contract area which
includes the Tindalo fi eld and the Nido 1X1 and Yakal discoveries,
as well as the Pungapong and Nandino prospects along with
numerous smaller leads.
Following a thorough review of the Tindalo project including a
consideration of the lessons learned the SC 54A Joint Venture
intends to review the existing discoveries along with the prospects
and leads with a view to evaluating further development options in
this block.
For
per
sona
l use
onl
y

NIDO PETROLEUM ANNUAL REPORT 2010 9
OPERATIONS REVIEW
West Linapacan – SC 14 Block C2, North West Palawan Basin, Philippines
The Company’s wholly owned subsidiary, Nido Production (Galoc)
Pty Ltd, holds a 22.279% working interest in the West Linapacan
block.
West Linapacan A was discovered in the early 1990’s and,
following the drilling and completion of three vertical subsea wells,
an FPSO-type development was employed to produce from the
fi eld from 1992 through to early 1996. The fi eld generated a peak
production rate of over 18,000 bopd. The fi eld has now been shut
in for over 12 years and it is believed that it will have returned to
close to its pre-production state. This presents the West Linapacan
Joint Venture with the opportunity to redevelop the fi eld, possibly
in conjunction with a development of the nearby unproduced West
Linapacan B oil discovery.
Throughout 2010 the block Operator, Pitkin Petroleum, continued
its development studies over the West Linapacan area. This
included the reprocessing of the 3D seismic data set and
interpretation and integration with the fi elds’ production history.
Detailed stratigraphic and structural mapping of the reservoir
utilising the 3D seismic inversion volume was undertaken and
the Operator is planning to update the potential reserves and
conceptual development plan following this detailed reservoir
mapping.
EXPLORATION
At the Company’s Annual General Meeting held on 21 May 2010,
the Board of Directors announced plans to initiate a fi ve well
drilling exploration program across its NW Palawan exploration
acreage commencing in 2011. The planned drilling candidates
in this program are designed to deliver a number of key strategic
objectives:
• Maximise the chances of making a signifi cant commercial
discovery by drilling a set of wells comprising a balanced mix of
low to high risk/reward prospects.
• Test a number of key play types across the basin which
would provide additional subsurface data to further de-risk the
exploration portfolio.
• Meet future Service Contract work program obligations.
• Secure tenure over the Company’s exploration acreage.
The fi ve well program will test two distinct geological provinces:
(i) the NW Palawan geological province (SC 54B/SC 58) where
the primary target is the proven Nido Limestone play in both
shallow and deepwater environments; and (ii) the Sabah geological
province (SC 63) which represents the extension of the prolifi c
offshore fold-thrust belt of Brunei and Sabah where the primary
reservoirs are the Miocene-aged clastics and a new potential
reservoir objective in the deeper pre-Nido section.
The current drilling candidates for the fi ve well program are:
Gindara (mid water depth, SC 54B), Balyena (deepwater,
SC 58), Aboabo area and Kalapato (shallow water, SC 63) and
Lawaan (shallow water, SC 54A). The timing of these wells will be
infl uenced by a number of factors including Joint Venture approvals
and rig availability.
Following the Shell Philippines Exploration B.V. farm-in to SC 54B,
the Gindara prospect will be the fi rst well to be drilled in 2011.
PuertoPrincesa
Lawaan
Kalapato
Gindara
Balyena
Aboabo
120°
0'0"
E
10°0'0"N
0 50 10025
km
Prospects
Gas Fields
Oil Fields
NIDO Operated Permits
Non Operated PermitsSC 58
SC 63
SC 54A
SC 54B
SC 14C-1
SC 14C-2
SC 6B
For
per
sona
l use
onl
y
NIDO PETROLEUM ANNUAL REPORT 2010 10
OPERATIONS REVIEW
SC 54B, North West Palawan Basin, Philippines
LawaanGindara
0 5025
km
Prospects
Gas Fields
Oil Fields
NIDO Operated Permits
Non Operated Permits
3D Survey
Abukay 3D
SC 54A
SC 54B
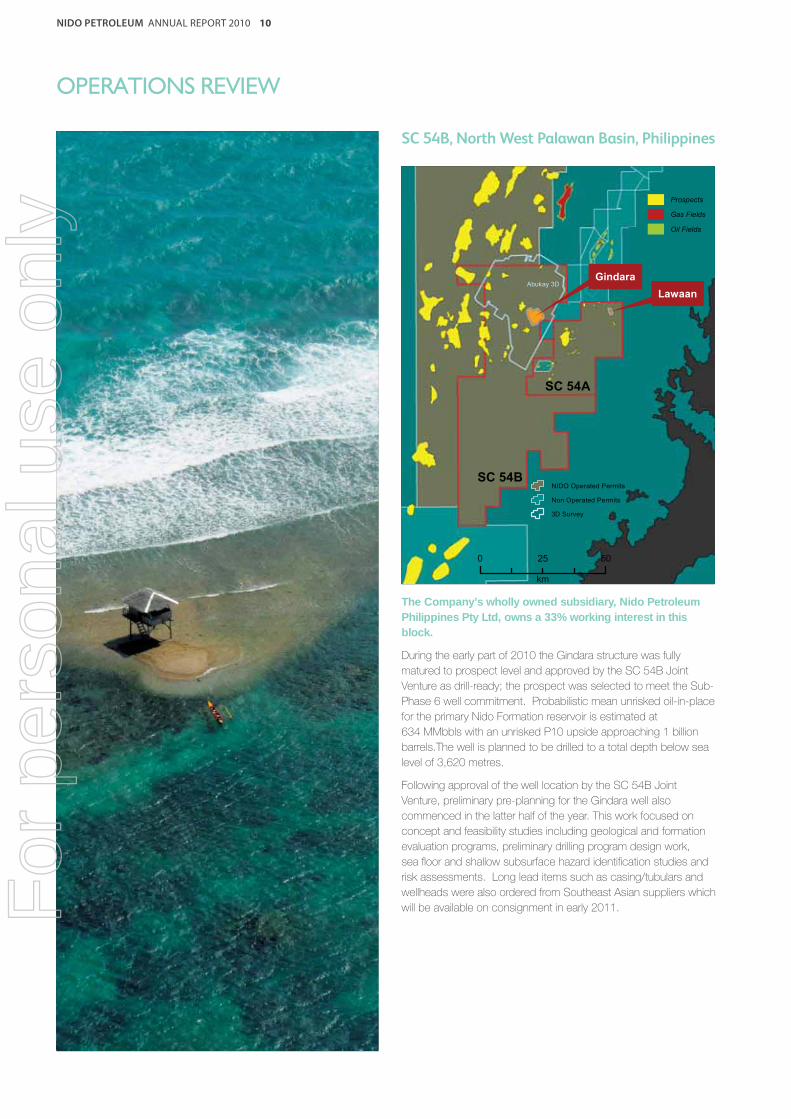
The Company’s wholly owned subsidiary, Nido Petroleum Philippines Pty Ltd, owns a 33% working interest in this block.
During the early part of 2010 the Gindara structure was fully
matured to prospect level and approved by the SC 54B Joint
Venture as drill-ready; the prospect was selected to meet the Sub-
Phase 6 well commitment. Probabilistic mean unrisked oil-in-place
for the primary Nido Formation reservoir is estimated at
634 MMbbls with an unrisked P10 upside approaching 1 billion
barrels.The well is planned to be drilled to a total depth below sea
level of 3,620 metres.
Following approval of the well location by the SC 54B Joint
Venture, preliminary pre-planning for the Gindara well also
commenced in the latter half of the year. This work focused on
concept and feasibility studies including geological and formation
evaluation programs, preliminary drilling program design work,
sea fl oor and shallow subsurface hazard identifi cation studies and
risk assessments. Long lead items such as casing/tubulars and
wellheads were also ordered from Southeast Asian suppliers which
will be available on consignment in early 2011. For
per
sona
l use
onl
y
NIDO PETROLEUM ANNUAL REPORT 2010 11
OPERATIONS REVIEW
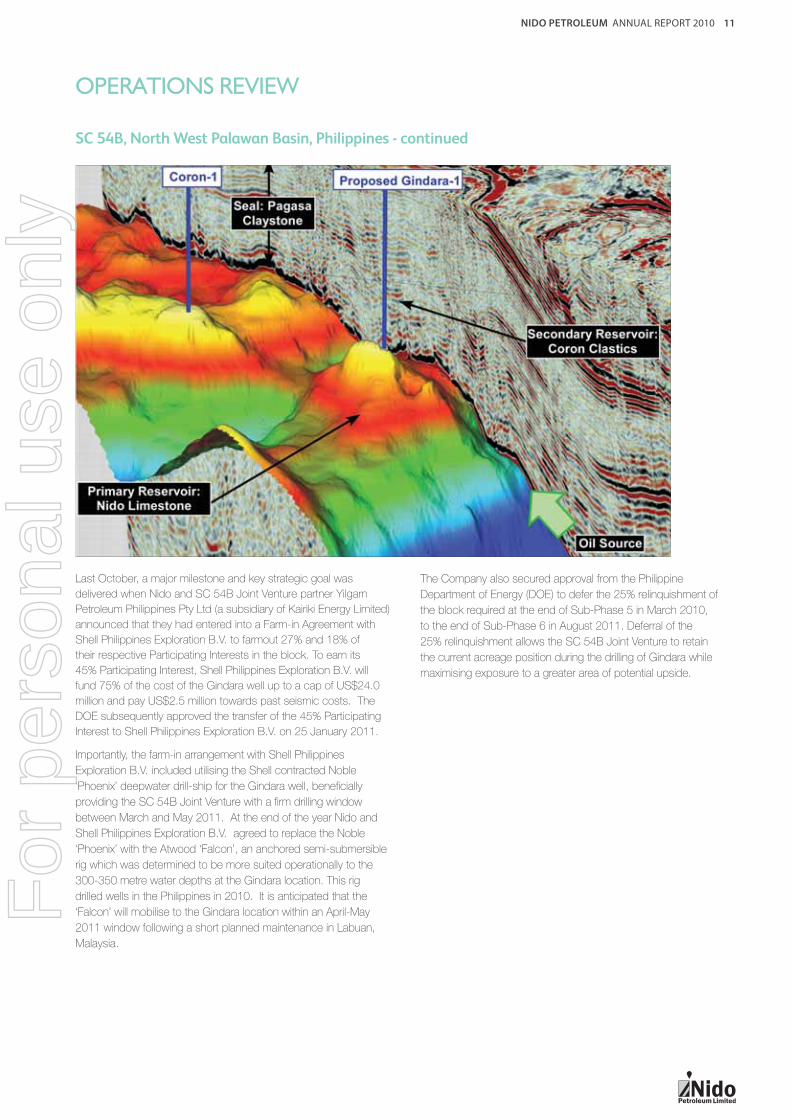
Last October, a major milestone and key strategic goal was
delivered when Nido and SC 54B Joint Venture partner Yilgarn
Petroleum Philippines Pty Ltd (a subsidiary of Kairiki Energy Limited)
announced that they had entered into a Farm-in Agreement with
Shell Philippines Exploration B.V. to farmout 27% and 18% of
their respective Participating Interests in the block. To earn its
45% Participating Interest, Shell Philippines Exploration B.V. will
fund 75% of the cost of the Gindara well up to a cap of US$24.0
million and pay US$2.5 million towards past seismic costs. The
DOE subsequently approved the transfer of the 45% Participating
Interest to Shell Philippines Exploration B.V. on 25 January 2011.
Importantly, the farm-in arrangement with Shell Philippines
Exploration B.V. included utilising the Shell contracted Noble
‘Phoenix’ deepwater drill-ship for the Gindara well, benefi cially
providing the SC 54B Joint Venture with a fi rm drilling window
between March and May 2011. At the end of the year Nido and
Shell Philippines Exploration B.V. agreed to replace the Noble
‘Phoenix’ with the Atwood ‘Falcon’, an anchored semi-submersible
rig which was determined to be more suited operationally to the
300-350 metre water depths at the Gindara location. This rig
drilled wells in the Philippines in 2010. It is anticipated that the
‘Falcon’ will mobilise to the Gindara location within an April-May
2011 window following a short planned maintenance in Labuan,
Malaysia.
The Company also secured approval from the Philippine
Department of Energy (DOE) to defer the 25% relinquishment of
the block required at the end of Sub-Phase 5 in March 2010,
to the end of Sub-Phase 6 in August 2011. Deferral of the
25% relinquishment allows the SC 54B Joint Venture to retain
the current acreage position during the drilling of Gindara while
maximising exposure to a greater area of potential upside.
SC 54B, North West Palawan Basin, Philippines - continued
For
per
sona
l use
onl
y

NIDO PETROLEUM ANNUAL REPORT 2010 12
OPERATIONS REVIEW
SC 58, North West Palawan Basin, Philippines
Dorado
Butanding
Balyena
0 5025
km
Prospects
Gas Fields
Oil Fields
Non Operated Permits
NIDO Operated Permits
SC 58
SC 63
SC 54A
SC 54B
Abukay 3D
The Company’s wholly owned subsidiary, Nido Petroleum Philippines Pty Ltd, holds a 50% working interest in the SC 58 block. The working interest is dependent upon the completion of the Company’s obligations (which includes payment of 100% of the costs of drilling an exploration well in Sub-Phase 3) under its Farm-in Agreement with PNOC Exploration Corporation dated 17 July 2006.
Exploration activity in SC 58 during 2010 focused on the multi-
beam and deepwater sea-bed coring program implemented
between March and April 2010. One of a number of key
subsurface uncertainties or risks in deepwater SC 58 is the direct
evidence of the presence of an active charge system. 2D and
3D seismic mapping had confi rmed the presence of a number of
NE-SW trending graben systems interpreted to contain potential
source rocks similar to those recognised as being present and
thermally mature in the Malampaya graben immediately to the east
of SC 58.
However, as no wells have been drilled in SC 58 there is no
calibration point to de-risk this key petroleum system element.
By geochemically analysing carefully located sea-bed cores it
is possible to detect seepage of hydrocarbons at the sea fl oor.
These can provide direct evidence that a working source and
charge system is present in the subsurface. Furthermore the
seeped oils can be compared to oils collected from fi elds providing
a geochemical ‘fi nger-print’ that similar hydrocarbons are being
generated in the area.
For
per
sona
l use
onl
y

NIDO PETROLEUM ANNUAL REPORT 2010 13
OPERATIONS REVIEW
SC 58, North West Palawan Basin, Philippines - continued
The multi-beam survey acquired by Fugro Survey Pte Ltd
commenced in March 2010 and acquired approximately 1,500 sq.
km. of data producing a highly detailed topographic map of the sea
fl oor over the central sector of the block which contains a number
of large prospects including Balyena, Balyena East, Butanding and
Dorado. The map was integrated with seismic data and areas of
potential sea fl oor seepage identifi ed.
A total of 180 drop cores were collected from the high-graded areas
and analysed geochemically using Gas Chromatography and Gas
Chromatography Mass Spectrometry.
The results were very encouraging:
• The majority of core data indicates widespread micro-
seepage of liquid hydrocarbons across SC 58 based on Gas
Chromatography (GC) results.
• Gas Chromatography – Mass Spectrometry (GC-MS) analysis of
14 selected core samples for biomarker ‘fi ngerprinting’ confi rmed
the liquid hydrocarbons show similar thermal maturities and
biomarker affi nities with known NW Palawan source rocks and
oils recovered from fi elds in the inboard parts of the NW Palawan
basin (Malampaya/Galoc/Nido/Tindalo fi elds).
• The central area of the sea-bed coring survey showed the
strongest evidence for light hydrocarbon micro-seepage
corresponding with the location of the large Butanding, Balyena,
Balyena East and Dorado Prospects.
The Company believes that the results of the sea-bed coring
program have signifi cantly reduced the charge risk in deepwater
SC 58 and upgraded the prospectivity of the Prospects and Leads
portfolio identifi ed from the existing 2D and 3D seismic data.
In tandem with the sea-bed coring work, the Company also
reprocessed a portion of the Talusi 2D seismic survey in order to
aid core locations by providing better imaging of the deep graben
systems. This work commenced in March and was completed
in September 2010 and has been integrated into the subsurface
providing important data on thermal modelling of the deepwater
grabens, in particular the timing of hydrocarbon generation into the
main prospects.
During the latter half of the year, exploration activity focused on
the detailed integration of the sea-bed coring results into the re-
assessment of the Prospects and Leads portfolio and remaining
subsurface risks. This work was ongoing at the end of the year with
subsurface studies starting to focus on the need to further de-risk
reservoir uncertainty using seismic inversion and amplitude versus
offset (AVO) seismic analyses.
The fi ve well exploration program includes the drilling of an SC 58
deepwater well for which the Company has secured long lead
drilling items (casing/tubulars). It is anticipated that the fi rst drilling
candidate will be Balyena with the other large deepwater prospects
- Butanding and Dorado to follow. The fi nal drilling decision will be
made following completion of the remaining de-risking work planned
for 2011.
Subsequent to the end of the 2010 Financial Year, the Company,
with the agreement of the DOE, deferred the SC 58 Sub-Phase 3
well commitment by 12 months from January 2012 to January 2013
so as to enable the Company to complete the remaining
de-risking work. The Company has also sought to defer the election
to drill under the Farm-in Agreement with PNOC-EC (the election is
currently required to be made prior to the end of April 2011) by a
period of 12 months. Discussions with PNOC-EC concerning this
request were ongoing as at the date of this Annual Financial Report.
For
per
sona
l use
onl
y
NIDO PETROLEUM ANNUAL REPORT 2010 14
OPERATIONS REVIEW
SC 63, North West Palawan Basin, Philippines
Kalapato
Aboabo
0 5025
km
Prospects
Gas Fields
Oil Fields
NIDO Operated Permits
Non Operator Permits
3D Survey
SC 63
Kawayan 3D
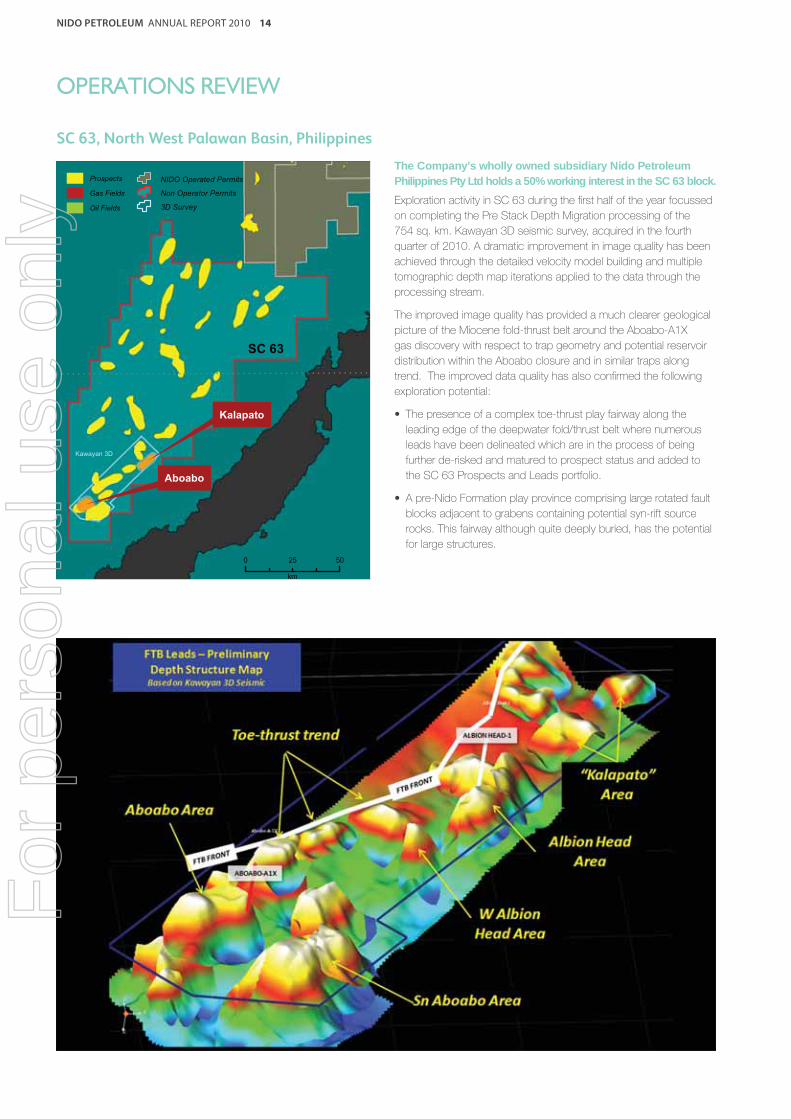
The Company’s wholly owned subsidiary Nido Petroleum Philippines Pty Ltd holds a 50% working interest in the SC 63 block.
Exploration activity in SC 63 during the fi rst half of the year focussed
on completing the Pre Stack Depth Migration processing of the
754 sq. km. Kawayan 3D seismic survey, acquired in the fourth
quarter of 2010. A dramatic improvement in image quality has been
achieved through the detailed velocity model building and multiple
tomographic depth map iterations applied to the data through the
processing stream.
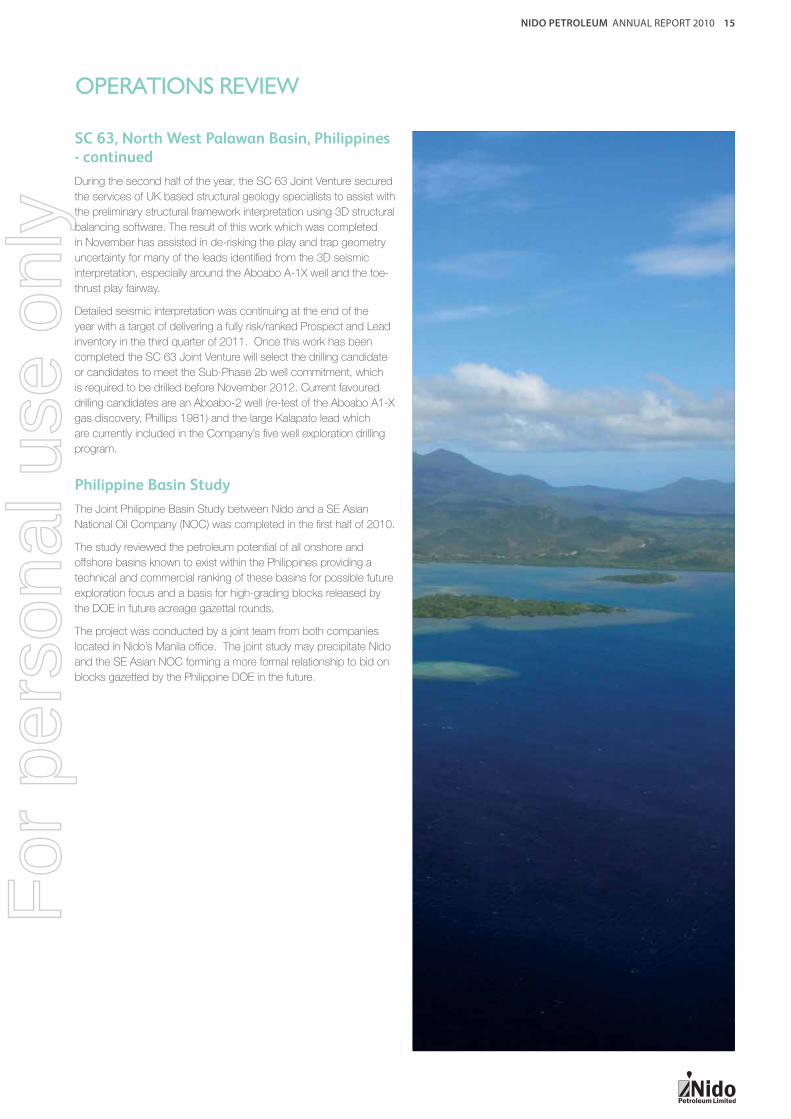
The improved image quality has provided a much clearer geological
picture of the Miocene fold-thrust belt around the Aboabo-A1X
gas discovery with respect to trap geometry and potential reservoir
distribution within the Aboabo closure and in similar traps along
trend. The improved data quality has also confi rmed the following
exploration potential:
• The presence of a complex toe-thrust play fairway along the
leading edge of the deepwater fold/thrust belt where numerous
leads have been delineated which are in the process of being
further de-risked and matured to prospect status and added to
the SC 63 Prospects and Leads portfolio.
• A pre-Nido Formation play province comprising large rotated fault
blocks adjacent to grabens containing potential syn-rift source
rocks. This fairway although quite deeply buried, has the potential
for large structures.
For
per
sona
l use
onl
y
NIDO PETROLEUM ANNUAL REPORT 2010 15
OPERATIONS REVIEW
SC 63, North West Palawan Basin, Philippines - continued
During the second half of the year, the SC 63 Joint Venture secured
the services of UK based structural geology specialists to assist with
the preliminary structural framework interpretation using 3D structural
balancing software. The result of this work which was completed
in November has assisted in de-risking the play and trap geometry
uncertainty for many of the leads identifi ed from the 3D seismic
interpretation, especially around the Aboabo A-1X well and the toe-
thrust play fairway.
Detailed seismic interpretation was continuing at the end of the
year with a target of delivering a fully risk/ranked Prospect and Lead
inventory in the third quarter of 2011. Once this work has been
completed the SC 63 Joint Venture will select the drilling candidate
or candidates to meet the Sub-Phase 2b well commitment, which
is required to be drilled before November 2012. Current favoured
drilling candidates are an Aboabo-2 well (re-test of the Aboabo A1-X
gas discovery, Phillips 1981) and the large Kalapato lead which
are currently included in the Company’s fi ve well exploration drilling
program.
Philippine Basin Study
The Joint Philippine Basin Study between Nido and a SE Asian
National Oil Company (NOC) was completed in the fi rst half of 2010.
The study reviewed the petroleum potential of all onshore and
offshore basins known to exist within the Philippines providing a
technical and commercial ranking of these basins for possible future
exploration focus and a basis for high-grading blocks released by
the DOE in future acreage gazettal rounds.
The project was conducted by a joint team from both companies
located in Nido’s Manila offi ce. The joint study may precipitate Nido
and the SE Asian NOC forming a more formal relationship to bid on
blocks gazetted by the Philippine DOE in the future.
For
per
sona
l use
onl
y

NIDO PETROLEUM ANNUAL REPORT 2010 16
OPERATIONS REVIEW
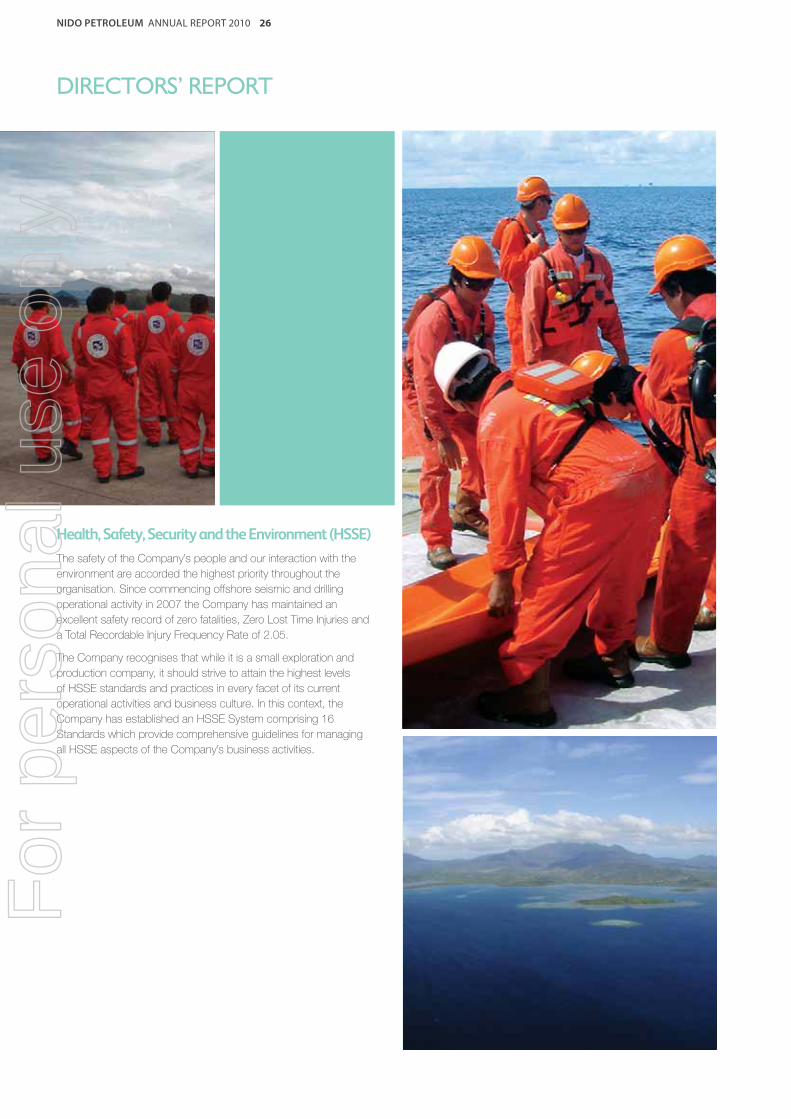
HEALTH, SAFETY, SECURITY AND ENVIRONMENT (HSSE)
In 2009, Nido implemented a comprehensive HSSE Management
System comprising 16 Standards and associated Systems in order
to provide the Company with a systematic, verifi able and continually
improving approach to HSSE across its operations and organisation.
To support the oversight of HSSE across the organisation Nido
appointed an HSSE Manager during the year and established a
monthly HSSE meeting to monitor HSSE performance against
Company key performance indicators and address HSSE issues
and incidents which arise during activities.
HSSE performance over 2010 was excellent considering Nido
became an offshore operator for the fi rst time at the Tindalo fi eld.
The Company accumulated 977,788 man-hours during the year
with zero fatalities, zero Lost Time Injuries and a Total Recordable
Injury Frequency Rate of 2.05 which compares well with the
Australian National Offshore Petroleum Safety Authority (NOPSA)
current industry rate of 7.87 as at 30 June 2010.
For
per
sona
l use
onl
y

NIDO PETROLEUM ANNUAL REPORT 2010 17
PETROLEUM PERMIT INTEREST SCHEDULE
Philippines Nido Approx Net
Interest Area
Permit Basin (%) (sq. km.) Operator
SC 14 Block A North West Palawan 22.49 5 Philodrill (1)
SC 14 Block B North West Palawan 28.28 44 Philodrill (1)
SC 14 Block C-1 (2) North West Palawan 22.88 40 GPC (3)
SC 14 Block C-2 (4) North West Palawan 22.28 37 Philodrill (1)
SC 14 Block D North West Palawan 31.42 55 Philodrill (1)
SC 6B North West Palawan 7.81 43 Philodrill (1)
SC 54A North West Palawan 42.40(5) 441 Nido
SC 54B North West Palawan 60.00(6) 1,897 Nido
SC 58 North West Palawan 50.00(7) 6,743 Nido (8)
SC 63 North West Palawan 50.00 5,336 PNOC (9)
Total 14,641
Data as at 31 December 2010:
(1) The Philodrill Corporation
(2) Galoc Block
(3) Galoc Production Company WLL
(4) West Linapacan Block
(5) In March 2010 Nido Petroleum Philippines Pty Ltd farmed down a 7.6% working interest in SC 54A to TG World (BVI) Corporation,
a subsidiary of TG World Energy Corporation
(6) Nido’s interest reduced to 33% on 25 January 2011. Refer to Note 32(1) in the Notes to Financial Statements
(7) Subject to Nido completing its obligations under its Farm-in Agreement with PNOC Exploration Corporation
(8) SC 58 operatorship reverts to PNOC Exploration Corporation upon completion of Nido’s farm-in obligations
(9) PNOC Exploration Corporation
For
per
sona
l use
onl
y

NIDO PETROLEUM ANNUAL REPORT 2010 18
DIRECTORS’ REPORT
The Directors of Nido Petroleum Limited are pleased to present the Annual Financial Report for the year ended 31 December 2010.
Directors
The names and details of the Company’s Directors in office during the financial year and until the date of this Report are as follows. Directors were in office for the entire period unless otherwise stated.
William Bloking FAICD
B.E Science (University of South Carolina)
(Summa cum Laude)
Chairman (Appointed 15 May 2009,
previously Non-Executive Director Appointed
6 February 2008)
Member and Chair, Remuneration and
Nomination Committee (Appointed
8 September 2008)
Member, Audit & Risk Management
Committee (Appointed 6 September 2010)
Bill has over 35 years’ experience in the energy
sector with ExxonMobil and the BHP Billiton
Group, holding senior executive positions
in Australia, Asia, South America and the
United States. Until his retirement in January
2007, Bill was President of Australia/Asia
Gas at BHP Billiton Petroleum, where he had
overall strategic, commercial and corporate
accountability for BHP Billiton’s international
LNG business and its domestic gas business
in Australia. Prior to joining BHP, he had spent
24 years with ExxonMobil holding a variety
of senior executive positions including Chief
Operating Offi cer of Esso Eastern Products
Trading Company, Supply Operations Manager
for the Far East and Western Hemisphere and
General Manager of Natural Gas in Indonesia.
Bill is currently Executive Chairman and
President of KAL Energy, Inc. (Appointed
26 June 2007), Chairman of Transerv Energy
Limited (Appointed 15 March 2011) and
he is a Non-Executive Director of the John
Holland Group (Appointed 1 January 2007),
Miclyn Express Offshore Limited (Appointed
19 February 2010), the Lions Eye Institute
(Appointed 1 October 2003), and the West
Australian Symphony Orchestra (Appointed
19 August 2005). He is also a Fellow of the
Australian Institute of Company Directors,
a Governor of the American Chamber of
Commerce in Australia and an Adjunct
Professor at Murdoch University.
Bill was formerly Chairman of Cool Energy Ltd
(Appointed 10 January 2007, Resigned
6 March 2009), the National Offshore
Petroleum Safety Authority (Appointed
1 March 2008, Resigned 25 August 2009),
Norwest Energy NL (Appointed 12 February
2007, Resigned 30 June 2009), and Cullen
Wines (Australia) Pty Ltd (Appointed
27 May 2006, retired 21 November 2009).
J.V. Emmanuel (Jocot) Araullo de Dios
MAICD
B.Sc in BA (Uni. of the Philippines), LL.B
(Ateneo de Manila University), LL.M (Harvard
Law School)
President and Chief Executive Offi cer
(Appointed 6 February 2008)
Jocot has over 15 years of experience
in commercial and fi nancial transactions,
including within the international energy sector.
Jocot was Managing Director at Merritt
Advisory Partners Inc., an energy advisory fi rm
focusing on energy projects and transactions
within Asia. Jocot also served as Chairman of
the Board of publicly listed PNOC Exploration
Corporation (the oil and gas arm of the
Philippine National Oil Company, Appointed
3 November 2004, Resigned 30 August 2005)
and held the position of Undersecretary of the
Philippine Department of Energy for three years
where he led the preparation of the Philippine
Energy Plan, supervised the country’s
downstream oil sector and participated in the
restructuring of the Philippine power sector.
He continues to hold the position of President
of Nido Petroleum Philippines Pty Ltd of which
he was Appointed in 2008.
Jocot has represented the Philippines in
various international organisations including the
APEC Energy Working Group. In 2005, Jocot
received the prestigious Secretary’s Award
of Recognition for Distinguished Government
Service. Jocot is currently a Non-Executive
Director of the Boards of Phoenix Petroleum
Philippines Inc., a publicly-listed downstream
oil company in the Philippines (Appointed
1 April 2007), and Davies Energy Services,
Inc., an energy services company (Appointed
10 March 2006). Jocot is a member of the
Australian Institute of Company Directors.
For
per
sona
l use
onl
y

NIDO PETROLEUM ANNUAL REPORT 2010 19
DIRECTORS’ REPORT
David Whitby MAICD
B.E. Mechanical (Royal Military College,
Canada)
Non-Executive Director (Appointed
15 May 2009)
Chairman, Non-Independent (Appointed
6 February 2008 – Resigned 15 May 2009)
Managing Director (Appointed 21 July 2004
- Resigned 6 February 2008)
Member, Remuneration and Nomination
Committee (Appointed 21 January 2010)
David’s prior work experience includes
appointments as Project Director of the
West Java Gas Project with Conoco-Phillips
in Jakarta, Vice President of Corporate
Development for Gulf Indonesia, Jakarta,
President of Gulf (Australia) Resources Ltd in
Perth and Vice President of Heavy Oil for Husky
Oil in Canada. Prior to entering the oil industry,
David was an offi cer in the Canadian Armed
Forces military engineering branch.
David is the Non-Executive Chairman of Xstate
Resources Limited (Appointed 13 February 2011).
David was formerly a Director of Cool Energy
Pty Ltd (Appointed 11 June 2007, Resigned
9 February 2009). He is a member of the
Australian Institute of Company Directors.
Vincent S Pérez
B.Bus. Econs (Uni. of the Philippines),
MBA (Wharton School, Uni. of Pennsylvania)
Non-Executive Director, Independent
(Appointed 5 April 2006)
Member Audit and Risk Management
Committee (Appointed 2 November 2006 –
Resigned 6 September 2010)
Member Remuneration and Nomination
Committee (Appointed 8 September 2008 –
Resigned 21 January 2010)
Vince has over 17 years of experience in debt
restructuring, capital markets and private equity
in emerging markets, including appointments in
Pittsburgh, London, New York and Singapore
with Mellon Bank and Lazard Frères. In early
2001, he served as Philippine Undersecretary
for Industry at the Department of Trade
and Industry and Managing Head of this
Department’s Board of Investments. He then
served as Philippine Energy Secretary from
June 2001 to March 2005.
Vince has held Board positions on several
listed companies including the Philippine
National Bank (Appointed 24 May 2005,
Resigned 30 May 2006), PNOC Energy
Development Corporation (Appointed
14 June 2007, Resigned 31 July 2010),
Del Monte Pacifi c Limited (Appointed
2 August 1999, Resigned 21 March 2001),
and SM Investments Corporation (Appointed
15 July 2005). Vince is currently Chairman of
WWF Philippines and a member of the Board
of Trustees of WWF International and the
Board of Advisors of the Center for Business
and the Environment at Yale University, Coca
Cola Philippines, and Pictet Clean Energy
Fund. He is the Chairman of Merritt Partners
Pte Ltd and Merritt Advisory Partners Inc.,
and is Chief Executive Offi cer of Alternergy
Philippine Holdings Corporation and Alternergy
Philippines Investments Corporation.
Eduardo V. Mañalac AAICD
B.S. Geology, Post Graduate Petroleum Geology (Uni. of the Philippines) Non-Executive Director, Independent (Appointed 20 February 2009) Member, Audit and Risk Management Committee (Appointed 20 February 2009) Member, Remuneration and Nomination Committee (Appointed 20 February 2009)
Ed has had a 35-year career in international petroleum exploration and production management, acreage acquisition, production sharing contracts and Joint Venture negotiations. During his early career he joined a national oil company and started the fi rst geological mapping of the Palawan Basin in the Philippines.
For 28 of those 35 years he enjoyed a career with Phillips Petroleum (now Conoco Phillips) in many parts of the world, most recently in China, and encouraged Phillips’ initial entry into the Palawan Basin and similar areas in Indonesia. From 2003 to 2004, Ed was Undersecretary of the Department of Energy in the Philippines, where he introduced the fi rst public bidding round for exploration acreage targeting the Palawan Basin. From 2004 to 2006 he was President and CEO of the Philippine National Oil Company (Appointed 20 August 2004, Resigned 31 October 2006) and its subsidiary PNOC Exploration Corporation (Appointed 24 September 2004, Resigned 31 October 2006), and was Chairman of PNOC Energy Development Corporation (Appointed 13 September 2004, Resigned 31 October 2006). Ed was a Non-Executive Director of Wellex Industries (Appointed 7 January 2008, Resigned 1 April 2010) a publicly listed energy, mining and exploration company in the Philippines of which he was Chairman up to January 2009.
He brings to the Board a wealth of understanding in exploration and operations and a deep knowledge of the Palawan Basin and markets and acreage in the region.
He is the President of TransEnergy International Limited (Appointed 28 November 2006), an energy resources consultancy company in the Philippines, where he has been the principal consultant since December 2006. More recently, in November 2009, Eduardo was Appointed Non-Executive Director of Basic Energy Corporation (Appointed 1 October 2009), another listed energy company in the Philippines. He is a member of the Australian Institute of Company Directors.
For
per
sona
l use
onl
y

NIDO PETROLEUM ANNUAL REPORT 2010 20
DIRECTORS’ REPORT
Andrew Edwards GAICD
B.Com (University of Western Australia) Non-Executive Director, Independent (Appointed 11 December 2009) Member and Chair, Audit and Risk Management Committee (Appointed 11 December 2009)
Andrew is a former managing partner of PriceWaterhouseCoopers, Perth Offi ce (PWC), past National Vice President of the (then) Securities Institute of Australia (now the Financial Services Institute of Australasia) and past President of the Western Australian division of that Institute, past State Chairman of the Institute of Chartered Accountants local Education Committee and a past member of its National Education Committee.
Andrew is a current Board member of Mermaid Marine Australia Limited (Appointed 18 December 2009), Mermaid Marine Vessel Operations Pty Ltd (Appointed 1 February 2010), Mermaid Marine Supply Base Pty Ltd (Appointed 1 February 2010), Mermaid Marine Charters Pty Ltd (Appointed 1 February 2010), Sungrid Limited (Appointed 30 April 2010), MACA Limited (Appointed
1 October 2010), and Activ Foundation Inc (Appointed 27 October 2008). He is a member of the Australian Institute of Company Directors.
Alternate Director
Joanne Williams
B.E. (Chem) (University of Adelaide) (Appointed 6 February 2008. Resigned 6 April 2010.)
Joanne, who is also the Company’s Deputy Managing Director, was appointed an Alternate Director for both Mr David Whitby and Mr Vince Pérez on 6 February 2008 and Resigned on 6 April 2010.
Joanne has 15 years of experience in the upstream oil and gas industry where she has held positions in the areas of offshore production operations and management, reservoir engineering, hands-on FPSO operations, fi eld appraisal and development planning, project management, mergers and acquisitions, corporate and business development.
Joanne has extensive expertise in identifying and realising marginal fi eld opportunities as well as optimisation and extension of late life fi eld production. Joanne’s experience includes positions with upstream and gas operating companies including Woodside Petroleum, Newfi eld Exploration, Crusader Resources, Clyde Resources and Gulf Australia. Joanne was a winner of the 2007 40 Under 40 Award and fi nalist in the Telstra Business Women of the Year awards in 2007.
Ms Williams has not attended any meetings in her capacity as Alternate Director for either Mr Whitby or Mr Pérez for the period ending 31 December 2010.
Company Secretary
John Newman MAICD
BEc,LLB (Monash University)
(Appointed 4 November 2009)
John is a lawyer with over 15 years of
experience, nine of which have been in the
energy and resources sector. John manages
the Company group’s legal, compliance and
company secretarial affairs. John’s previous
experience includes positions with the Timor
Sea Designated Authority, Cridlands Lawyers
and the Northern Land Council. Prior to
working in a resources context John was
the principal solicitor with the Refugee and
Immigration Legal Centre in Melbourne.
John is currently a member of the Law Society
of Western Australia, Australian Institute of
Company Directors (AICD), the Resources
and Energy Law Association (AMPLA),
the Association of International Petroleum
Negotiators (AIPN) and an affi liate of Chartered
Secretaries Australia (CSA).
For
per
sona
l use
onl
y

NIDO PETROLEUM ANNUAL REPORT 2010 21
DIRECTORS’ REPORT
Directors’ and Committee Meetings
The following Table details the number of Directors’ and Committee
meetings held during the fi nancial year and the number of meetings
attended by each Director.
Board of Directors Meetings 2010
Directors Held(1) Attended
W Bloking 6 6
J de Dios 6 6
D Whitby 6 6
V Pérez 6 6
E Mañalac 6 6
A Edwards 6 6
J Williams (as Alternate) 0(2) 0
Audit & Risk Management Committee Meetings 2010
Directors Held(1) Attended
V Pérez 2(3) 2
W Bloking 1(3) 1
E Mañalac 3 3
A Edwards 3 3
Remuneration & Nomination Committee Meetings 2010
Directors Held(1) Attended
W Bloking 2 2
E Mañalac 2 2
D Whitby 2 2
(1) Number of meetings held during term of offi ce.
(2) Joanne Williams Resigned as Alternate Director of D Whitby and V Pérez as at 6 April 2010.
(3) V Pérez Resigned as a member of the Audit & Risk Management Committee and was
replaced by W Bloking on 6 September 2010.
Directors’ Interests in Securities of the Company
As at the date of this Report, the interests of the Directors in the shares, options and Performance Rights of Nido Petroleum Limited were:
Options Over Ordinary Shares
Director OrdinaryShares
Expiry Date: 12 May 2011
Exercisable at 35 cents
Expiry Date: 12 May 2011
Exercisable at 40 cents
Expiry Date: 12 May 2011
Exercisable at 45 cents
Expiry Date: 12 May 2011
Exercisable at 50 cents
Performance Rights
W Bloking 1,320,000 3,000,000 2,000,000 - - -
J de Dios 1,120,000 - 3,000,000 2,000,000 2,000,000 1,047,535
D Whitby 11,893,524 - - - - -
V Pérez 1,000,000 - - - - -
A Edwards 470,000 - - - - -
For
per
sona
l use
onl
y
NIDO PETROLEUM ANNUAL REPORT 2010 22
DIRECTORS’ REPORT
Principal Activities
The principal activities of the consolidated entity during the fi nancial
year, which occurred primarily in the Philippines, included:
• Exploration for oil and gas;
• Development of its oil and gas assets; and
• Production and sale of oil.
There were no signifi cant changes in the nature of the principal
activities during the year.
Operating and Financial Review
A full review of operations of the consolidated entity during the
year ended 31 December 2010 is included in the section entitled
“Operations Review” preceding this Directors’ Report.
Summary of Financial Performance
A summary of key fi nancial indicators for the Company, with prior
year comparison, is set out in the following table:
Consolidated Consolidated
2010 2009
$’000 $’000
Revenue from sale of crude oil 60,135 47,835
Gross profi t 7,547 20,093
Net loss before tax and fi nance costs
(40,569) (14,629)
Net loss for the year after tax (43,374) (28,252)
Basic loss per share (cents) from continuing operations
(3.92) (2.69)
Net cash from operating activities
3,195 9,599
Net cash from/(used in) investing activities
(16,814) 282
Net cash from/(used in) fi nancing activities
21,655 (3,030)
The profi t/(loss) from continuing operations before income tax,
fi nance costs, foreign currency gains/(losses) and fair value gain/
(loss) on embedded derivative of the Group for the year ended
31 December 2010 was a loss of $28,540,000 (2009: profi t of
$9,465,000).
The net loss of the Group for the year ended 31 December 2010
of $43.4 million (2009: loss $28.3 million), was impacted by the
following signifi cant items:
• Oil revenue totalled $60.1 million, of which revenue from the
Galoc oil fi eld for the year was $51.1 million (2009:
$46.6 million), revenue from the Tindalo oil fi eld for the year was
$6.8 million, and revenue from the Nido and Matinloc oil fi elds
for the year was $2.2 million (2009: $1.2 million).
• Cost of sales for the year increased by $24.9 million to
$52.7 million (2009: $27.8 million). This increase is due primarily
to costs relating to the Extended Well Test at the Tindalo oil fi eld
during 2010.
• Other income of $2.4 million (2009: $ 1.0 million) relates
primarily to a net gain on the farmout of SC 54A working interest
($1.9 million) and insurance proceeds relating to Galoc oil fi eld
activities ($0.5 million).
• Total fi nance costs for the year of $3.7 million (2009:
$2.6 million) relate predominantly to the Merrill Lynch Convertible
Note interest.
• Fair value gain of $8.0 million (2009: loss of $8.4 million) on
embedded derivative relates to the non-cash fair value gain
movement in relation to the Convertible Note call option.
• An increase in other expenses in 2010 to $38.5 million (2009:
$11.7 million), is due primarily to the impairment of the Tindalo oil
fi eld in Service Contract 54A in the amount of $29.7 million as a
result of abandoning the fi eld in December 2010 offset by:
° A decrease in employee benefi ts expense (net of share based
payments expense) of $0.4 million to $5.5 million (2009:
$5.9 million);
° A decrease in share based payments to $0.1 million (2009:
$1.0 million); and
° A 31% reduction in offi ce and other expenses in 2010 to
$2.3 million (2009: $3.3 million) which was due to the
Company’s ongoing focus on lowering administrative costs.
• Net foreign currency loss of $12.0 million (2009: loss of
$24.1 million) was due to the strengthening of the Australian
dollar which had a negative impact on net US dollar balances
predominately from AUD denominated parent company loans
to subsidiaries (with USD functional currencies), offset by the
impact of the USD Convertible Note debt in the parent company
(with AUD functional currency).
Financing Activities
The Company’s fi nancing costs primarily represent costs of the
Convertible Note which appear in the Income Statement and in the
Notes to the Financial Statements. For the year ended
31 December 2010, fi nance costs relating to the Convertible
Note totaled $3.7 million (2009: $2.6 million). The fair value gain
in relation to the Convertible Note call option embedded derivative
totalled a non-cash fair value movement of $8.0 million (2009: loss
of $8.4 million).
For
per
sona
l use
onl
y
NIDO PETROLEUM ANNUAL REPORT 2010 23
DIRECTORS’ REPORT
Operating and Financial Review - continued
The fair value of the call option represents the value of the option
to the holder to convert the Convertible Note into fully paid shares
in the Company. The fair value has been determined using a
Black Scholes model, taking into account factors such as share
price volatility, expected life, exercise price and current share
price. As the Company’s share price changes, the value of the
call option will change, resulting in a change to the liability reported
in the Balance Sheet and an income or expense in the Income
Statement. As at 31 December 2010, the value of the call option
was $1.8 million (2009: $9.8 million) which has reduced primarily
due to a reduction in remaining Notes that are, as at 31 December
2010, convertible into a maximum of 57,571,544 shares (2009:
114,307,091). Refer to Note 17.
The underlying debt repayable to Merrill Lynch of US$9.2 million
plus interest will not change, assuming that the Convertible
Notes are not redeemed or converted, subject to the Terms and
Conditions detailed in the Notes to the Financial Statements.
Summary of Financial Position
The Company’s cash reserves at the end of 2010 totalled $24.2
million compared to $17.1 million on 31 December 2009. The
increase in cash was due primarily to net proceeds from oil
production of $22.7 million; proceeds (after selling costs) received
from farming out 7.6% out of Nido’s interest in SC 54A of $5.6
million; and proceeds of $28.0 million (net of capital raising costs)
resulting from the issuance of capital, offset by $16.5 million in
development expenditure and security bonds relating primarily
to Tindalo oil fi eld capital expenditure; repayment of principal
and interest relating to the Convertible Note of $9.0 million (not
including the impact of conversions); exploration expenditure of
$5.7 million predominantly relating to the SC 58 sea-bed coring
program and the SC 63 Kawayan 3D seismic acquisition; income
tax paid in the amount of $7.1 million; and overheads and other
expenditures of $10.3 million.
Production Activities
In 2010, Nido achieved the following key production milestones:
• 2.6 MMstb (gross) were produced from the Galoc fi eld.
• Production uptime at Galoc averaged 84% during the year.
• 0.3 MMstb were produced during the Tindalo oil fi eld Extended
Well Test.
• Revenue from crude oil sales increased by 25.7% to $60.1 million.
Exploration & Evaluation Activities
In 2010, Nido undertook the following key exploration activities:
• The Company’s Board of Directors announced a fi ve well
exploration program at the 21 May 2010 AGM.
• In October 2010, Shell Philippines Exploration B.V. farmed-in
to SC 54B to earn a 45% Participating Interest in the block by
providing a signifi cant carry of costs for the drilling of the Gindara
exploration well in 2011.
• The deepwater multi-beam and sea-bed coring program was
completed in SC 58 between March and April 2010. Results
indicate widespread micro-seepage of mature hydrocarbons
across the most prospective part of the block and adjacent to
key prospects.
• Reprocessing of the Talusi 2D seismic in SC 58 was also
completed during the year which improved subsurface imaging
of the source grabens in the deepwater.
• In SC 63, Pre Stack Depth Migration processing of the Kawayan
3D seismic was completed in July 2010.
• The SC 54 Sub-Phase 5 (25%) relinquishment due in August
2010 was successfully deferred to the end of Sub-Phase 6 in
August 2011.
Development Activities
In 2010, Nido undertook the following key development activities:
• In March 2010 Nido farmed out 7.6% of its interest in SC 54A to
TG World (BVI) Corporation, ahead of the commencement of the
Tindalo oil fi eld Extended Well Test.
• First oil achieved on 30 May 2010 at the Tindalo oil fi eld, some
fi ve months after achieving Final Investment Decision.
• Extended Well Test commenced on 6 June 2010 at Tindalo.
• The Extended Well Test failed to produce oil at economic
rates due to excessive water production and the SC 54A Joint
Venture decided to abandon the well in December 2010 with
completion of abandonment occurring in the fi rst quarter of
2011.
Corporate Activities
SC 54B – Shell Philippines Exploration B.V. Farm-in During the year Nido announced it had farmed out 27% of its
Participating Interest in SC 54B to Shell Philippines Exploration
B.V.. The farmout was coordinated jointly with SC 54B partner
Yilgarn Petroleum Philippines Pty Ltd which also contributed 18%
of its Participating Interest to Shell Philippines Exploration B.V..
To earn its 45% Participating Interest, Shell Philippines Exploration
B.V. will carry 75% of the Gindara well cost up to a cap of
US$24.0 million and has agreed to pay US$2.5 million of past
seismic costs. Following approval by the Philippine DOE of
the Shell Philippines Exploration B.V. farm-in in January 2011,
Participating Interests in the block are:
• Nido Petroleum Philippines Ltd 33%
• Yilgarn Petroleum Philippines Pty Ltd 22%
• Shell Philippines Exploration B.V. 45%.
Nido will remain operator of the block through to the completion of
drilling activities on the Gindara well after which Shell Philippines
Exploration B.V. has the option to assume operatorship from Nido.
Successful Completion of Share Placement, Raising $19.9 millionOn 28 October 2010, Nido completed a successful placement
of 159,000,000 ordinary fully paid shares to sophisticated and
professional investors at $0.125 per share to raise total proceeds
of $19.9 million (before costs).
For
per
sona
l use
onl
y
NIDO PETROLEUM ANNUAL REPORT 2010 24
DIRECTORS’ REPORT
Operating and Financial Review - continued
Successful Completion of Share Purchase Plan, Raising $9.3 millionOn 3 December 2010 Nido successfully completed a Share
Purchase Plan and raised gross proceeds of $9.3 million. On
8 December 2010, 74,080,000 new ordinary shares were allotted
at an issue price of $0.125 per share.
Proceeds from the Placement and Share Purchase Plan are
intended to be used towards securing Nido’s future exploration
program and for general working capital and partial debt reduction.
Dividends
No dividends were paid or declared by the consolidated entity
during the fi nancial year.
Corporate Structure
The Company is limited by shares and is incorporated and
domiciled in Australia.
Signifi cant Changes in the State of Affairs
Signifi cant changes in the state of affairs of the Company during
the fi nancial year are detailed in the fi nancial and activities review in
this Report.
Likely Developments and Expected Results
The Company will continue to maximise revenues from its
interest in the Galoc oil fi eld and consider the merits of a Phase 2
development together with its Joint Venture Partners. In addition,
the Company will continue to assess potential opportunities
for appraisal and development within SC 54A to add a second
revenue stream, which would enable the Company to accelerate
the drilling of its expansive deepwater portfolio of assets over the
longer term through a multi-well exploration drilling program.
The Company continues to pursue strategic opportunities with
respect to its assets and is in discussions with a number of
potential partners including oil majors concerning possible farmout
transactions.
For
per
sona
l use
onl
y

NIDO PETROLEUM ANNUAL REPORT 2010 25
DIRECTORS’ REPORT
Corporate Social Responsibility
Nido is committed to enhancing shareholder value by conducting
international oil and gas exploration, development and production
in a manner that, through its Corporate Social Responsibility
Programs, shares part of the benefi ts of this activity with the
communities in which it operates.
Nido has adopted a two pronged approach to its Corporate
Social Responsibility Programs. This involves the Nido Petroleum
Foundation, Inc. (Nido Foundation) in the Philippines and the
Company’s Charitable Donations Committee, which actively
encourages and supports staff as they work in a range of
community organisations in Australia and the Philippines.
In 2010, Nido provided funds to the Social Services Programs of
the Holy Trinity Parish in Quezon City, Philippines which caters to
the needs of the urban poor and marginalised members of the
community. The program includes medical/dental outreach clinics,
livelihood opportunities, out of school youth education, skills
training program and adult literacy education classes.
Nido also supported the fund raising campaign of the Association
of Filipinos for the Advancement of Geosciences, Inc (AFAG)
where the proceeds were used to purchase equipment for a small
university geology department.
Staff Involvement
During 2010 the Company supported staff involvement with
the Breast Cancer Foundation of Western Australia, Channel 7
Telethon, Ronald MacDonald charities and the Salvation Army.
Nido also proudly supported the Mission Australia Christmas Lunch
for the third year in a row.
Further details on the Company’s Corporate Social Responsibility
activities can be accessed from the Company’s website.
For
per
sona
l use
onl
y
NIDO PETROLEUM ANNUAL REPORT 2010 26
DIRECTORS’ REPORT
Health, Safety, Security and the Environment (HSSE)
The safety of the Company’s people and our interaction with the
environment are accorded the highest priority throughout the
organisation. Since commencing offshore seismic and drilling
operational activity in 2007 the Company has maintained an
excellent safety record of zero fatalities, Zero Lost Time Injuries and
a Total Recordable Injury Frequency Rate of 2.05.
The Company recognises that while it is a small exploration and
production company, it should strive to attain the highest levels
of HSSE standards and practices in every facet of its current
operational activities and business culture. In this context, the
Company has established an HSSE System comprising 16
Standards which provide comprehensive guidelines for managing
all HSSE aspects of the Company’s business activities.
For
per
sona
l use
onl
y

NIDO PETROLEUM ANNUAL REPORT 2010 27
DIRECTORS’ REPORT
Remuneration Report (Audited)
For the purposes of this Report the term “Executive” includes those
Key Management Personnel who are not Directors of the parent
company or did not act in that capacity during the reporting period.
Details of Key Management Personnel (including the fi ve
highest paid executives of the Company and the Group)
(i) Directors
W Bloking Chairman (Non-Executive)
J de Dios President & CEO (Executive Director)
D Whitby Director (Non-Executive)
V Pérez Director (Non-Executive)
E Mañalac Director (Non-Executive)
A Edwards Director (Non-Executive)
(ii) Executives
J Williams Deputy Managing Director
A Gilbert Chief Financial Offi cer
J Pattillo Head of Exploration
J Newman General Counsel and Company
Secretary (Appointed 4 November 2009)
A Francis Head of Commercial
(Resigned 26 March 2010)
M Lamattina In-House Counsel and Company
Secretary (Resigned 6 March 2009)
P Quaife Deputy Head of Exploration
(Resigned 6 February 2009)
D Edwards Company Secretary
(Appointed 6 March 2009 –
Resigned 4 November 2009)
There were no changes in the Key Management Personnel after
reporting date and before the date the Financial Report was
authorised for issue.
Remuneration Policy
During 2010 the Company completed a comprehensive review of
its Remuneration Policy and strategy. The Company implemented
a new Remuneration Policy which recognises that the Board is
responsible to the Company’s shareholders to ensure that interests
of the Non-Executive Directors, CEO and staff of the Company
are aligned with the interests of the shareholders. In this context,
as part of its Remuneration Policy, the Company has implemented
revised Short Term Incentive (STI) and Long Term Incentive (LTI)
Plans.
The Company has maintained its performance management
procedure for Executives and staff and as part of such procedure
all of the current Executives undertake a performance appraisal
with the CEO each year. The CEO’s performance is, in turn,
reviewed by the Board.
Company Performance & Remuneration
The Company share price and earnings per share (EPS), shown in
the Table below, refl ect Company performance during the previous
fi ve fi nancial years and for the current year ended 31 December
2010.
31 Dec
2010
31 Dec
2009
31 Dec
2008
31 Dec
2007
31 Dec
2006
31 Dec
2005
EPS (cents) (3.92) (2.69) 0.71 (2.53) (0.99) (1.46)
Share price 0.115 0.185 0.093 0.28 0.175 0.145
Following a review of the current market conditions by independent
consultants and a subsequent review and recommendation by the
Remuneration and Nomination Committee, pay increases at an
average rate of 5% have been awarded to Executives and staff for
the 2011 year. The CEO has on his own volition accepted a 2.5%
increase, notwithstanding a recommended increase of 5.6% for
the 2011 year, with the remainder of the recommended increase
being placed at risk and dependent on Company performance
against the 2011 STI targets.
Remuneration Principles
The Company has adopted the following principles in its
remuneration framework:
Non-Executives Managing Director & Executives
1. The Board seeks to set
aggregate remuneration
at a level which provides
the Company with the
ability to attract and retain
Directors of the highest
calibre, while incurring a
cost which is acceptable to
shareholders; and
2. Directors need to be
aligned with the creation
of shareholder value and
Company performance.
• Providing fair, consistent and
competitive compensation
and rewards to attract and
retain high calibre employees;
• Ensuring that total
remuneration is competitive
by market standards;
• Incorporating in the
remuneration framework both
short and long term incentives
linked to the strategic
goals and performance
of the Company and total
shareholder return;
• Demonstrating a clear
relationship between
individual performance and
remuneration; and
• Motivating employees to
pursue and achieve the long
term growth and success of
the Company.
Remuneration Structure
In accordance with the ASX Corporate Governance Council’s
Principles of Good Corporate Governance and Best Practice
Recommendations (ASX Principles and Recommendations)
the structure of the Company’s Non-Executive and Executive
remuneration is clearly distinguished.
For
per
sona
l use
onl
y

NIDO PETROLEUM ANNUAL REPORT 2010 28
DIRECTORS’ REPORT
Remuneration Report (Audited) - continued
Non-Executive Remuneration Structure
The Company’s Constitution and the ASX Listing Rules specify
that the aggregate fees to be paid to Non-Executive Directors
are to be approved by shareholders at a General Meeting. The
latest determination was made at the Company’s Annual General
Meeting held on 9 May 2008 where shareholders approved an
aggregate amount of $450,000 per year (all inclusive).
The fee structure for Non-Executive Directors is reviewed annually
and the Board considers advice from external consultants, which
includes comparative analyses of the fees paid to Non-Executive
Directors of comparable companies when undertaking the annual
review process.
In 2010, the Non-Executive Directors were paid fees associated
with their duties as Directors, including their membership in Board
committees. Each Director was paid a base fee of $65,000
per year, with the Chairman of the Board receiving an additional
$45,500 (70 per cent of the base fee) for his role, the Chair of
the Audit & Risk Management Committee receiving an additional
$26,000 (40 per cent of the base fee) for his role, members of
the Audit & Risk Management Committee receiving an additional
$6,500 (10 per cent of the base fee) for their roles, and the Chair
of the Remuneration and Nomination Committee receiving an
additional $6,500 (10 per cent of the base fee) for his role. These
additional payments recognise the additional time commitment by
Non-Executive Directors who serve on sub-committees and the
role of the Chairman.
These remuneration levels took effect from 1 July 2008 and
have not been increased since that time despite the Company
receiving external advice in 2010 that these remuneration levels
are below current market conditions. Notwithstanding this advice
and in recognition of the early abandonment of the Tindalo project,
the Board has resolved not to increase Non-Executive Director
remuneration levels at this time.
The Non-Executive Directors are not entitled to receive retirement
benefi ts and do not participate in any incentive programs.
Furthermore, the Company did not grant any options to Non-
Executive Directors during 2010 in accordance with the
Company’s policy prohibiting grants of options to Non-Executive
Directors.
Apart from their duties as Directors, some Non-Executive Directors
undertake work for the Company on a consultancy basis pursuant
to the terms of consultancy services agreements. Requests
for services issued pursuant to the terms of these agreements
may only be initiated by the CEO and must also be signed off by
an independent Non-Executive Director. A copy of the request
for services must also be provided to the Remuneration and
Nomination Committee. The nature of the consultancy work varies
depending on the expertise of the relevant Non-Executive Director.
Under the terms of these consultancy agreements Non-Executive
Directors receive a daily rate for the work performed and such rate
is comparable to market rates that they would otherwise receive
for their consultancy services. These agreements are therefore
entered into on an arm’s length basis.
Following a review of these consultancy fees and in accordance
with recommendations received from the Remuneration and
Nomination Committee, the Board has determined that no increase
will be made to Non-Executive Director consultancy fees for 2011.
The remuneration of Non-Executive Directors for the periods
ending 31 December 2010 and 31 December 2009 is detailed
further in this Remuneration Report. The amounts listed under
‘Salary & Fees’ include both Director fees and consultancy fees
received by the Non-Executive Directors.
Alternate Directors
No separate remuneration is offered to or received by Alternate
Directors for the performance of their roles as Alternate Directors.
They are otherwise remunerated in their capacities as Executives
of the Company. At present the Company does not currently have
any Alternate Directors as Ms Joanne Williams Resigned as an
Alternate Director on 6 April 2010.
CEO and Executive Remuneration Structure
Executive Remuneration consists of the following key elements:
• Fixed remuneration; and
• Variable remuneration, comprising Short Term Incentives (STI)
and Long Term Incentives (LTI).
The proportion of fi xed remuneration and variable remuneration
is established for each Executive by the Remuneration and
Nomination Committee and approved by the Board in accordance
with the Remuneration Policy, and the STI and LTI Plans.
Fixed Remuneration
The level of fi xed remuneration is set to provide a base level
of remuneration which is both appropriate for the position and
competitive in the market. Fixed remuneration is reviewed annually
by the Remuneration and Nomination Committee and approved
by the Board having regard to the Company and individual
performance, relevant comparable remuneration in the oil and gas
industry and independent external advice. Executives receive their
fi xed remuneration in the form of cash and varying fringe benefi ts.
The fi xed remuneration for Executives is detailed further in this
Report.
Variable Remuneration – Short Term Incentive
Under the Company’s STI Plan, STI payments are granted annually
to staff, Executives and Executive Directors depending on the
Company’s annual performance goals and individual performance
targets over the preceding year. The Remuneration and
Nomination Committee retains the discretion to adjust individual
bonuses to reward outstanding individual performance.
In determining the amount of the STI pool each year the Company
sets a number of performance criteria and assigns a weighting to
each criterion. As against each criterion there are three levels of
performance which can attract an award to the pool: threshold;
target and stretch.
If the Company achieves the threshold level of performance the
Company awards 80% of the target pool for that criterion. If the
Company achieves the target level of performance the Company
awards 100% of the target pool for that criterion and if the
Company achieves the stretch level of performance the Company
awards 120% of the target pool for that criterion. To the extent that
the Company achieves less than the threshold level there is no
award for this criterion and the pool is reduced accordingly.
For
per
sona
l use
onl
y

NIDO PETROLEUM ANNUAL REPORT 2010 29
DIRECTORS’ REPORT
Remuneration Report (Audited) - continued
The overall target STI pool available is 15% of the gross base salary
of the Company’s staff. The Board, however, retains discretion to
withhold the award of any payments depending on the Company’s
closing cash position and its ability to comply with its commitments
for the following year after bonuses are paid.
The amount of the available STI pool that staff and Executives are
entitled to receive is dependent on their individual performance.
An Executive’s performance during the year is assessed against
his or her individual performance agreement, which is set at the
start of each year and includes key performance indicators (KPIs)
relevant to their area of responsibility.
KPIs include fi nancial metrics in terms of budgetary performance,
operational metrics in terms of project progress, exploration
activities and production activities, health and safety metrics as
well as professional service metrics for the timeliness and accuracy
of advice and support provided to the technical and operational
parts of the business. These KPIs are chosen because they align
individual performance with the achievement of Nido’s strategic plan.
Subject to the overall pool that the Company has available for
distribution which is dependent on the Company’s performance
against the Company targets, if an individual achieves target
on all of the relevant KPIs the bonus such individual receives is
15% of his or her base (gross) salary. This applies to all staff and
Executives including the CEO.
For 2010 the Board determined a set of STI targets refl ecting the
Company’s strategy, business plan and budget. The 2010 STI
targets for the Company were performance against budget, HSSE
performance, milestones for the Tindalo development, strategic
farmout initiatives and relevant Joint Venture approvals to drill an
exploration well.
Against this weighted group of performance targets the Company
performed on target with respect to its performance against budget
and the Joint Venture approval for the drilling of an exploration
well. The Company performed at stretch with respect to HSSE
and at threshold with respect to farmout initiatives and the Tindalo
development.
In relation to Tindalo the relevant threshold target set was the
achievement of readiness for start up of the Tindalo project within
the third quarter of 2010 provided that this was achieved within
20% of the approved capital budget.
Given the achievement of between threshold and stretch for all of
the target criteria the total STI bonus pool calculated in accordance
with the STI policy amounted to 13.8% of the gross base salary
of the Company’s staff. The Board, however, in determining the
allocation of the bonus pool took into consideration prudent cash
fl ow management and therefore resolved that only half of the
available pool would be payable to staff as soon as reasonably
practicable after 11 March 2011 with a further half to be payable
on or before 1 September 2011.
The STI bonuses paid to Executives and Executive Directors in
2010 amounted to $24,459 (2009: $73,952). The specifi c award
to each Executive and Executive Director including the date of the
award is listed further in this Report. No cash bonuses were paid
to Non-Executive Directors.
In addition to the STI Plan, the CEO has the discretion to award
cash bonuses on an “ad hoc” basis of up to a maximum net
amount of $1,500 per project or task to any employee for
exceptional work rendered. During the 2010 year, the CEO granted
a number of these adhoc bonuses including three awards to each
of Jon Pattillo and John Newman, two awards to each of Joanne
Williams and Ashley Gilbert and one award to Andrew Francis.
There are no specifi c performance hurdles nor any forfeiture
conditions attached to these awards.
Variable Remuneration – Long Term Incentive
LTI grants to Executives have previously been delivered in the
form of employee share options granted under the Company’s
2007 Employee Share Option Program. Options were issued at
an exercise price determined by the Board at the time of issue.
No performance hurdles have been set on options issued to
executives. The Company believed that as options were issued
at a price around the Company’s current share price at the date
of issue of those options, there was an inherent performance
hurdle as the share price of the Company’s shares had to increase
signifi cantly before any reward could accrue to the Executive.
In 2010, within the context of the review of the Company’s
Remuneration Policy the Company introduced an Employee
Performance Rights Plan (Plan) which was approved by
Shareholders at the Company’s Annual General Meeting on 21
May 2010. The objectives of the Plan are to:
• Align employee incentives with shareholder interests;
• Balance the short term with the long term Company focus; and
• Attract and retain high calibre employees by providing an
attractive long term retention tool that builds an ownership of the
Company mindset.
Under the Plan and the Policy, the Board makes annual awards
of Performance Rights to employees. The level of the award of
Performance Rights is dependent on an employee’s position within
the Company. Subject to the Company achieving the performance
criteria set out in the terms of the Plan, Performance Rights held
by an employee may convert into shares in the Company. In the
event the Company fails to achieve the performance criteria, all of
the employee’s Performance Rights lapse with no shares being
issued. Furthermore, in the event that an employee leaves the
Company prior to the expiration of the relevant vesting period for a
particular award of Performance Rights, such Performance Rights
also lapse.
The key performance criterion of the Performance Rights Plan is
Nido’s relative total shareholder return performance over a three
year testing period when compared against the total shareholder
return of a peer group of ASX listed oil and gas companies over
the same period. The Board believes the three year performance
period is an important design feature of the Plan as it allows time to
ensure that any award is aligned with shareholder interests.
The peer group comprises the following companies: Woodside
Petroleum Limited, Otto Energy Limited, Kairiki Energy Limited,
AWE Limited, Horizon Oil Limited, Karoon Gas Limited, Mosaic
Oil Limited, Victoria Petroleum NL, Nexus Energy Limited, New
Zealand Oil and Gas Limited, Tap Oil Limited, Oilex Limited, Oil
Search Limited, Pan Pacifi c Petroleum NL, Roc Oil Limited, Stuart
Petroleum Limited, AED Oil Limited and Santos Limited.
For
per
sona
l use
onl
y

NIDO PETROLEUM ANNUAL REPORT 2010 30
DIRECTORS’ REPORT
Remuneration Report (Audited) - continued
Nido’s relative total shareholder return ranking against this peer
group over the three year period determines the number of
Performance Rights in a particular award that an employee
becomes entitled to convert into shares as follows:
Performance Ranking Range Compared to Peer Group
Number of Performance Rights Exercisable
Below 50th percentile of relative
total shareholder return as
compared against the peer
group
No Performance Rights
exercisable
50th percentile of relative total
shareholder return as compared
against the peer group
50% of the Rights in the Offer
available to be exercised and
converted into shares
51st percentile to 74th
percentile of relative total
shareholder return as compared
against the peer group
For each Performance Ranking
Range percentile increase
above 50%, the number of
Performance Rights exercisable
and converted into shares in
the Offer increases by 2%
For example, if the Performance
Ranking Range is at the 52nd
percentile, 54% of the Rights
in the Offer are available to be
exercised and converted into
shares.
75th percentile or higher of
relative total shareholder return
as compared against the peer
group
100% of Rights in the Offer
available to be exercised and
converted into shares
By way of example if an employee is offered 500,000 Performance
Rights and Nido performs at the 50th percentile against its peer
group over the relevant 3 year testing period following the award of
the Performance Rights, the relevant employee would be entitled
to convert 50% of the Performance Rights into shares namely,
250,000 shares, following the completion of the testing period.
The LTI Performance Rights granted to Executives during the year
are listed in this Report.
CEO and Executive Employment Contracts
It is the Board’s policy that employment contracts are entered into
with the CEO and Executives. The CEO, Mr de Dios, is employed
under a four-year fi xed term contract subject to the approval of a
Business Visa subclass 457. The current employment contract
commenced on 6 February 2008 and provides that:
• Mr de Dios receives fi xed remuneration of $446,250 per annum,
plus 12% superannuation;
• Mr de Dios, as an expatriate of the Philippines, also receives
together with his family other assistance with a motor vehicle,
rent, education, relocation costs and visas;
• In connection with Mr de Dios’ expatriate status in Australia, the
Company provides tax equalisation assistance by paying the
difference between the higher host country tax rate in Australia
and the applicable lower tax rate in the Philippines. This tax
equalisation does not apply to non-employment income derived
in the Philippines during Mr de Dios’ period of employment or to
employee share plans. The Company also procures tax advice
and assistance with the preparation and lodgement of Mr de
Dios’ annual tax return while in Australia;
• Mr de Dios may resign from his position and thus terminate his
contract by giving one month’s written notice;
• In the event that the Company terminates Mr de Dios’
employment, except in circumstances of misconduct or material
breaches of the contract, the Company will pay Mr de Dios 12
months of his fi xed remuneration package;
• Under the Company’s 2007 Employee Share Option Plan, upon
Resignation of Mr de Dios or upon termination by the Company,
any options held that have vested will need to be exercised
within 30 days of termination or they will be forfeited, unless
the Board approves other terms it considers appropriate. Any
options that have not vested will be forfeited.
Mr de Dios continues to serve as President of Nido Petroleum
Philippines Pty Ltd in a concurrent capacity and does not earn a
separate salary for that position.
The contracts with Executives specifi ed under the Remuneration of
Directors and Executives table have no termination date and under
the terms of the contracts:
• The Executive may resign from his or her position and thus
terminate his or her contract by giving one month’s written
notice;
• In the event that the Company terminates an Executive’s
employment, except in circumstances of misconduct or material
breaches of their contract and, with the exception of the
Company Secretary(1), the Company will pay the Executive 12
months of his or her fi xed remuneration package;
• Under the Company’s 2007 Employee Share Option Plan,
upon Resignation of the Executive or upon termination by the
Company, any options held that have vested will need to be
exercised within 30 days of termination or such options will be
forfeited, unless the Board approves other terms it considers
appropriate. Any options that have not vested will be forfeited.
(1) Mr Newman’s employment contract does not provide a termination benefi t
but provides a 12 month notice period in the event of termination by the
Company.
For
per
sona
l use
onl
y
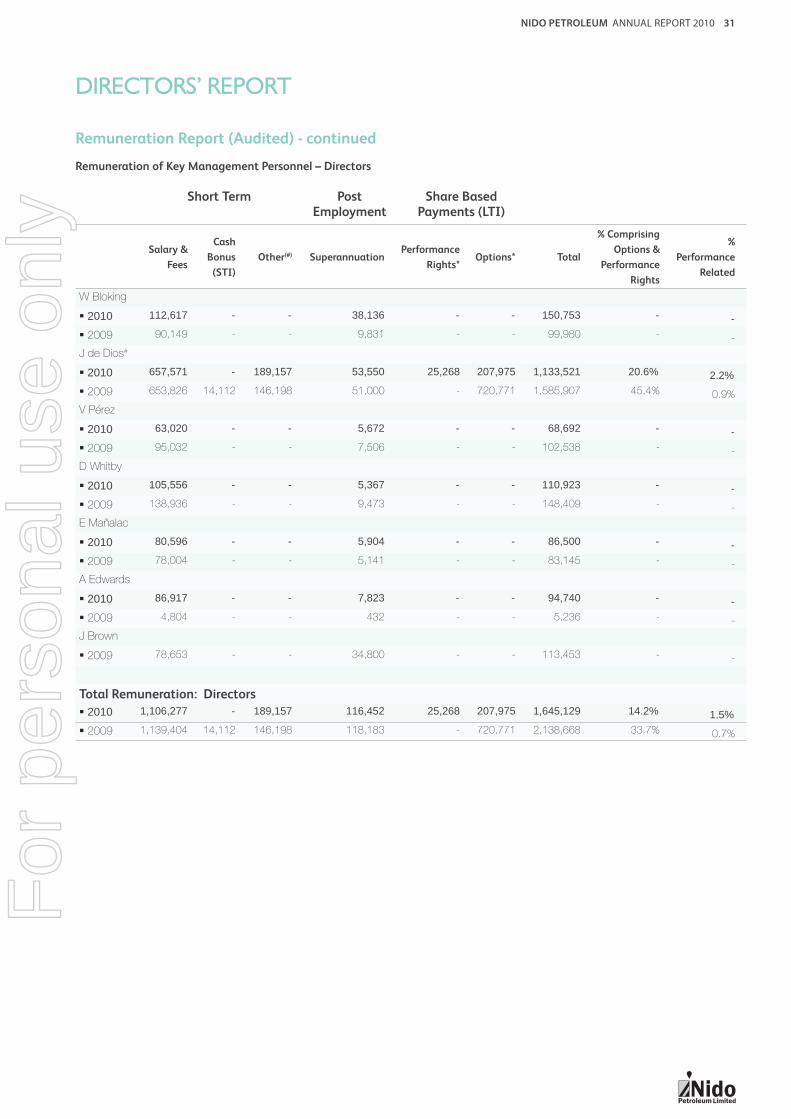
NIDO PETROLEUM ANNUAL REPORT 2010 31
DIRECTORS’ REPORT
Remuneration Report (Audited) - continued
Remuneration of Key Management Personnel – Directors
Short Term Post Employment
Share Based Payments (LTI)
Salary &
Fees
Cash
Bonus
(STI)
Other(#) SuperannuationPerformance
Rights*Options* Total
% Comprising
Options &
Performance
Rights
%
Performance
Related
W Bloking
2010 112,617 - - 38,136 - - 150,753 - -
2009 90,149 - - 9,831 - - 99,980 - -
J de Dios#
2010 657,571 - 189,157 53,550 25,268 207,975 1,133,521 20.6% 2.2%
2009 653,826 14,112 146,198 51,000 - 720,771 1,585,907 45.4% 0.9%
V Pérez
2010 63,020 - - 5,672 - - 68,692 - -
2009 95,032 - - 7,506 - - 102,538 - -
D Whitby
2010 105,556 - - 5,367 - - 110,923 - -
2009 138,936 - - 9,473 - - 148,409 - -
E Mañalac
2010 80,596 - - 5,904 - - 86,500 - -
2009 78,004 - - 5,141 - - 83,145 - -
A Edwards
2010 86,917 - - 7,823 - - 94,740 - -
2009 4,804 - - 432 - - 5,236 - -
J Brown
2009 78,653 - - 34,800 - - 113,453 - -
Total Remuneration: Directors
2010 1,106,277 - 189,157 116,452 25,268 207,975 1,645,129 14.2% 1.5%
2009 1,139,404 14,112 146,198 118,183 - 720,771 2,138,668 33.7% 0.7%
For
per
sona
l use
onl
y

NIDO PETROLEUM ANNUAL REPORT 2010 32
DIRECTORS’ REPORT
Remuneration Report (Audited) - continued
Remuneration of Key Management Personnel – Executives
Short Term Post Employment Share Based Payments (LTI)
Salary & Fees
Cash Bonus
(STI)
Other(#)
SuperannuationPerformance
Rights*Options* Total
% Comprising
Options & Performance
Rights
% Performance
Related
J Williams#
2010 339,120 3,824 3,473 36,960 21,486 - 404,863 5.3% 6.3%
2009 320,000 14,016 3,492 38,400 - - 375,908 - 3.7%
J Pattillo #
2010 396,240 7,459 8,183 47,578 25,353 - 484,813 5.2% 6.8%
2009 377,600 14,112 4,524 45,312 - 12,957 454,505 2.9% 3.1%
A Francis (1) #
2010 80,177 1,912 32,421 8,578 - (364,427)^ (241,339) 151.0% (0.8)%
2009 289,204 14,052 37,160 34,704 - 99,952 475,072 21.0% 3.0%
A Gilbert#
2010 285,131 3,757 8,544 25,683 17,760 4,123 344,998 6.3% 6.2%
2009 271,782 14,100 5,315 24,460 - 34,941 350,598 10.0% 4.0%
J Newman#
2010 209,760 7,507 17,703 25,200 13,429 - 273,599 4.9% 7.7%
2009 109,616 14,112 6,853 13,154 - - 143,735 - 9.8%
P Quaife
2009 33,984 1,876 - 3,221 - - 39,081 - 4.8%
D Edwards
2009 68,956 - - - - - 68,956 - -
M Lamattina#
2009 39,335 1,684 281 3,837 - - 45,137 - 3.7%
Total Remuneration: Executives
2010 1,310,428 24,459 70,324 143,999 78,028 (360,304) 1,266,934 (22.3%) 8.1%
2009 1,510,477 73,952 57,625 163,088 - 147,850 1,952,992 7.5% 3.8%
Remuneration of Key Management Personnel - Notes
(1) Resigned 26 March 2010 as Commercial Manager.
^ Credit of $364,427 was recognised in the Income Statement due to forfeiture of options which is in accordance with AASB 2 “Share Based Payments”, resulting from
Mr A Francis Resignation as outlined in point (1).
# Includes non-cash benefi ts paid.
* The amount included as remuneration relating to options and Performance Rights is not related to or indicative of the benefi t (if any) that the individual may ultimately
realise. The fair value of these instruments as at their date of grant was determined in accordance with AASB 2 “Share Based Payments” applying valuation models.
Details of the assumptions underlying the valuations are set out in Note 23 to the Financial Statements.
For the year ended 31 December 2010, no options which were granted to Directors in previous years had been exercised.
The amounts disclosed above do not include insurance premiums paid in relation to Directors’ and offi cers’ liability insurance as the terms of
the insurance policy preclude disclosure of these amounts.
For
per
sona
l use
onl
y

NIDO PETROLEUM ANNUAL REPORT 2010 33
DIRECTORS’ REPORT
Remuneration Report (Audited) - continued
Compensation Options and Performance Rights to Directors – Granted and vested during the year
The Table below sets out options and Performance Rights granted during the year to Directors, together with options and Performance
Rights granted in previous years which vested during the year. The options and Performance Rights were issued free of charge and entitle
the holder to subscribe for one fully paid ordinary share in the Company.
Terms and Conditions of Each Grant
Number of Options
Granted
Number of Performance
Rights Granted Grant Date
Value eachat Grant Date
$
Exercise Price
$
First|y Exercise
Date
Last ExerciseDate/ Expiry
Date
2010
Directors
J de Dios - 1,047,535 28/5/10 0.122 Nil 28/5/13 28/5/13
Total - 1,047,535
2009
Directors
J de Dios - - - - - - -
Total - -
Numberof Options
Vested During the
Year
%of Options
Vested During the
Year
Number of Performance
Rights Vested During the
Year
%of
Performance Rights Vested
During the Year
2010
Directors
J de Dios 4,000,000 44% - -
Total 4,000,000 -
2009
Directors
J de Dios 4,500,000 50% - -
Total 4,500,000 -
For vesting conditions refer to Note 23 (b) for details.
For
per
sona
l use
onl
y

NIDO PETROLEUM ANNUAL REPORT 2010 34
DIRECTORS’ REPORT
Remuneration Report (Audited) - continued
Compensation Options and Performance Rights to Executives – Granted and vested during the year
The Table below sets out options and Performance Rights granted to Executives during the year, together with options and Performance
Rights granted in previous years which vested during the year. The options and Performance Rights were issued free of charge and entitle
the holder to subscribe for one fully paid ordinary share in the Company.
Terms and Conditions of Each Grant
Number of Options
Granted
Number of Performance
Rights Granted Grant Date
Value eachat Grant
Date $
Exercise Price
$
FirstExercise
Date
Last ExerciseDate/ Expiry
Date
2010
Executives
J Williams - 788,732 30/4/10 0.122 Nil 30/4/13 30/4/13
J Pattillo - 930,704 30/4/10 0.122 Nil 30/4/13 30/4/13
J Newman - 492,958 30/4/10 0.122 Nil 30/4/13 30/4/13
A Gilbert - 651,942 30/4/10 0.122 Nil 30/4/13 30/4/13
A Francis - - - - - - -
Total - 2,864,336
2009
Executives
J Pattillo - - - - - - -
A Francis - - - - - - -
A Gilbert - - - - - - -
M Lamattina - - - - - - -
Total - -
Numberof Options
Vested During the Year
%of Options
Vested During the
Year
Number of Performance
Rights Vested During the
Year
%of
Performance Rights Vested
During the Year
2010
Executives
J Williams - - - -
J Pattillo - - - -
J Newman - - - -
A Gilbert 200,000 10% - -
A Francis 625,000 25% - -
Total 825,000 -
2009
Executives
J Pattillo 1,250,000 50% - -
A Francis 1,250,000 50% - -
A Gilbert 700,000 35% - -
M Lamattina 62,500 25% - -
Total 3,262,500 -
For
per
sona
l use
onl
y
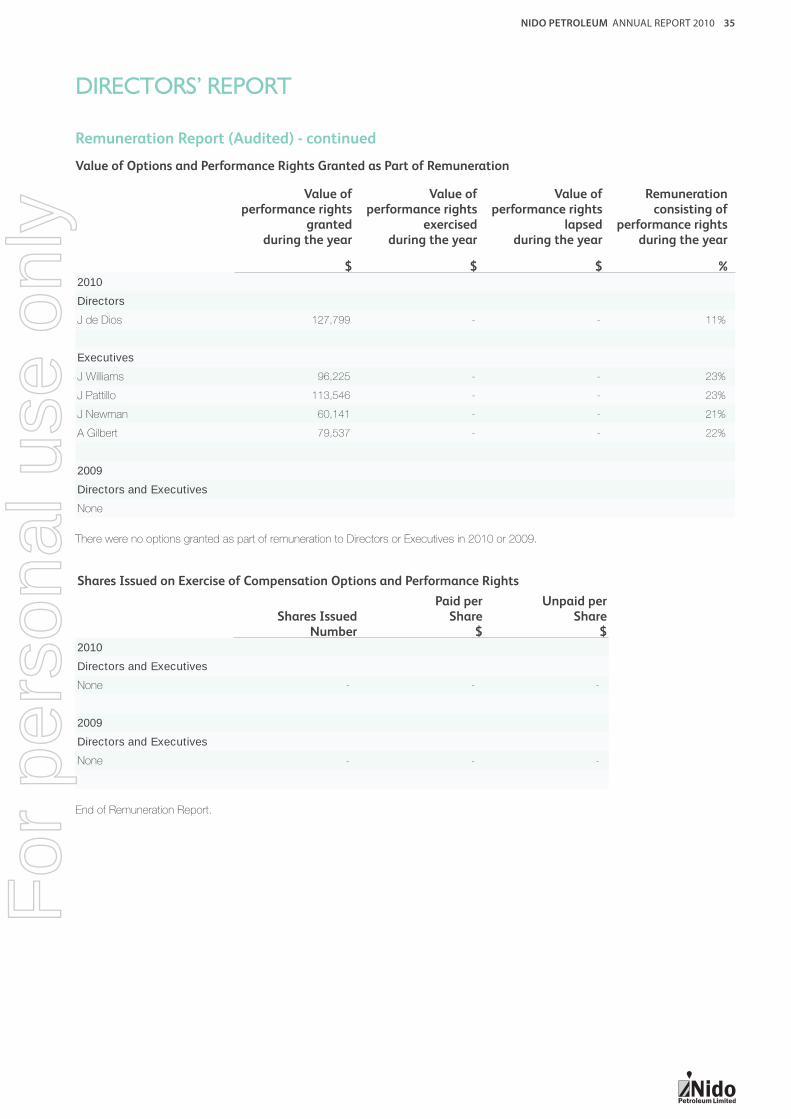
NIDO PETROLEUM ANNUAL REPORT 2010 35
DIRECTORS’ REPORT
Remuneration Report (Audited) - continued
Value of Options and Performance Rights Granted as Part of Remuneration
Value of performance rights
grantedduring the year
$
Value of performance rights
exercisedduring the year
$
Value of performance rights
lapsed during the year
$
Remuneration consisting of
performance rights during the year
%2010
Directors
J de Dios 127,799 - - 11%
Executives
J Williams 96,225 - - 23%
J Pattillo 113,546 - - 23%
J Newman 60,141 - - 21%
A Gilbert 79,537 - - 22%
2009
Directors and Executives
None
There were no options granted as part of remuneration to Directors or Executives in 2010 or 2009.
Shares Issued on Exercise of Compensation Options and Performance Rights
Shares IssuedNumber
Paid perShare
$
Unpaid perShare
$2010
Directors and Executives
None - - -
2009
Directors and Executives
None - - -
End of Remuneration Report.
For
per
sona
l use
onl
y

NIDO PETROLEUM ANNUAL REPORT 2010 36
DIRECTORS’ REPORT
Share and Option Schemes
Unissued shares
As at the date of this Report, there were 15,450,000 unissued
ordinary shares under option and 7,027,738 Performance Rights
on issue. Refer to Note 23 of the Financial Statements for further
details of the outstanding options and Performance Rights as at
31 December 2010. Option and Performance Right holders do
not have any right to participate in any share issue of the Company
or any related body corporate, unless these holders are already
shareholders in the Company.
Shares issued as a result of the exercise of Options and
Performance Rights
During the fi nancial year and up to the date of this Report,
employees and Directors did not exercise the option or
performance right to acquire any fully paid ordinary shares (2009: nil).
Corporate Governance
Recognising the need for the highest standards of corporate
behaviour and accountability to shareholders, the Directors of the
Company support the Principles of Corporate Governance which
are detailed in the Company’s Corporate Governance Statement
and set out in this Annual Report.
Indemnifi cation of Directors and Offi cers
During the year the Company paid premiums in respect of a
contract insuring all Directors and Offi cers of the Company and its
controlled entities against liabilities incurred while performing duties
as Directors or Offi cers to the extent permitted by the Corporations
Act, 2001. Due to a confi dentiality clause in the contract, the
amount of the premium has not been disclosed.
Environmental Regulation and Performance
The Company’s environmental obligations are regulated under
the laws of the countries in which Nido has operations. It is the
Company’s policy to comply with its environmental performance
obligations and, where possible, adhere to higher standards than
what is required.
As set out in the Company’s Health, Safety, Security and
Environment Policy, the Company is committed to enhancing
shareholder value through international oil and gas exploration,
development and production activities in a manner that protects
health, safety, security and the environment. The Company is
committed to conducting its business in a manner that minimises
the adverse impact on employees, contractors, the community
and the environment that may be affected by its work activities.
To achieve this, the Company:
• Demonstrates a strong commitment to health, safety, security
and environmental care through its behaviour;
• Complies with health, safety, security and environmental
obligations and regulations of the country of operations whilst
striving for higher standards;
• Commits to the continuous improvement of its health and safety
behaviour and environmental culture;
• Respects local culture and is proactive in recognising its
responsibility to meet and exceed community expectations; and
• Designs local solutions for local issues, creating positive change.
The Company believes that no task is so urgent that it cannot be
done safely and that health, safety, security and the environment
are of paramount concern in planning and carrying out every
task. The Company is committed to caring for the people and the
environment connected with its work.
The Company has also adopted an emergency response plan
and health, safety, security and environmental procedures which
have been the subject of information and training to staff and
contractors. Environmental liability risks are also managed through
contract terms and insurance policies. The above measures
represent prudent risk management controls designed to minimise
the risk of negative environmental impacts.
No environmental breaches have been notifi ed by any applicable
government agency as at the date of this Report.
Details in relation to the abandonment and restoration obligations
of the Company in the Philippines associated with its existing
operations and facilities are set out in Notes 15 and 16 of the
Notes to the Financial Statements.
The Company regularly reviews changes to environmental
regulations that may affect or pose a risk to the Company’s
business activities and where appropriate, amend such policies
and procedures as necessary. In the coming year, the Company
will, amongst other things, consider the potential risks associated
with climate change and their impact on the Company’s business,
both in terms of the impact of weather on the Company’s
operations and the regulatory changes which will ensue in Australia
and the Philippines.
Subsequent Events
The Company has identifi ed the following as events occurring after
year end:
(1) Shell Philippines Exploration B.V. farm-in to Nido and Yilgarn
Petroleum Philippines Pty Ltd’s interests in SC 54B was
formally approved by the DOE on 25 January 2011. Approval
of the SC 54B farm-in by the DOE is the last in a number
of Conditions Precedent provided under the terms and
conditions of the Farm-in Agreement.
(2) Merrill Lynch converted US$2.6 million worth of Notes on
31 January 2011 and 22 February 2011 resulting in the
issuance of 33,191,798 ordinary shares. The conversion
proceeds were applied directly against the remaining
underlying outstanding debt. The maximum number of shares
remaining that can be issued on conversion of the Notes as at
date of release of the Annual Report was 24,379,746.For
per
sona
l use
onl
y
NIDO PETROLEUM ANNUAL REPORT 2010 37
DIRECTORS’ REPORT
Subsequent Events - continued
(3) The Company, with the agreement of the DOE, has deferred
the SC 58 Sub Phase 3 well commitment by 12 months from
January 2012 to January 2013 so as to enable the Company
to complete its remaining de-risking work in relation to SC 58.
The Company has also sought from PNOC-EC to defer the
election to drill under the Farm-in Agreement (the election is
currently required to be made prior to the end of April 2011)
by a period of 12 months. Discussions with PNOC-EC
concerning this request were ongoing as at the date of this
Annual Report.
Rounding
The amounts contained in this Report and in the Financial
Statements have been rounded to the nearest $1,000 (where
rounding is applicable) under the option available to the Company
under ASIC Class Order 98/0100. The Company is an entity to
which the Class Order applies.
Auditor’s Independence and Non-Audit Services
Auditor’s Independence Declaration
The Auditor’s Independence Declaration is included in the next
page of this Report.
Non-Audit Services
The following non-audit services were provided by the entity’s
auditor, Ernst & Young. The Directors are satisfi ed that the
provision of non-audit services is compatible with the general
standard of independence for auditors imposed by the
Corporations Act. The nature and scope of each type of non-
audit service provided means that auditor independence was not
compromised.
Ernst & Young received, or are due to receive, the following
amounts for the provision of non-audit services.
Tax compliance and advice services $64,490
Signed in accordance with a Resolution of the Directors.
William Bloking FAICD
Chairman
22 March 2011For
per
sona
l use
onl
y

NIDO PETROLEUM ANNUAL REPORT 2010 38
AUDITOR’S INDEPENDENCE DECLARATION
Auditor’s Independence Declaration to the Directors of Nido Petroleum Limited
In relation to our audit of the Financial Report of Nido Petroleum Limited for the fi nancial year ended 31 December 2010, to the best of my
knowledge and belief, there have been no contraventions of the auditor independence requirements of the Corporations Act 2001 or any
applicable code of professional conduct.
Ernst & Young
RJ Curtin
Partner
Perth
22 March 2011
Ernst & Young Building 11 Mounts Bay Road Perth WA 6000 Australia GPO Box M939 Perth WA 6843
Tel: +61 8 9429 2222 Fax: +61 8 9429 2436 www.ey.com/au
Liability limited by a scheme approved
under Professional Standards Legislation
For
per
sona
l use
onl
y

NIDO PETROLEUM ANNUAL REPORT 2010 39
CORPORATE GOVERNANCE STATEMENT
Since the introduction of the ASX Corporate Governance Council’s
Principles of Good Corporate Governance and Best Practice
Recommendations (ASX Principles and Recommendations)
and the revised second editions of the ASX Principles and
Recommendations, Nido Petroleum Limited has made it a priority
to adopt systems of control and accountability as the basis for the
administration of corporate governance. The Company’s corporate
governance practices for the year ended 31 December 2010
and as at the date of this Report are outlined in this corporate
governance statement.
The Company has considered each recommendation provided
in the ASX Principles and Recommendations, taking into account
factors such as the size of the Company and the Board, resources
available and activities of the Company. Where, after due
consideration, the Company’s corporate governance practices
depart from the ASX Principles and Recommendations, the Board
has offered full disclosure of the nature of, and reason for, the
adoption of its own practice.
Further information about the Company’s Corporate Governance practices is provided on the Company’s website at www.nido.com.au. Information published on the Company’s website includes charters (for the Board and its sub-committees), the Company’s Code Of Conduct and other policies and procedures relating to the Board and its responsibilities.
The Company’s corporate governance practices are structured
with reference to the ASX Principles and Recommendations as
follows:
Principle 1
Lay solid foundations for management and oversight;
Principle 2
Structure the Board to add value;
Principle 3
Promote ethical and responsible decision-making;
Principle 4
Safeguard integrity in fi nancial reporting;
Principle 5
Make timely and balanced disclosure;
Principle 6
Respect the rights of shareholders;
Principle 7
Recognise and manage risk; and
Principle 8
Remunerate fairly and responsibly.
For
per
sona
l use
onl
y
NIDO PETROLEUM ANNUAL REPORT 2010 40
CORPORATE GOVERNANCE STATEMENT
Compliance with best Practice Recommendations
Principle 1: Lay solid foundations for management and oversight
Recommendations:
1.1 Companies should establish the functions reserved to the
Board and those delegated to senior executives and disclose
those functions.
1.2 Companies should disclose the process for evaluating the
performance of senior executives.
1.3 Companies should provide the information indicated in the
Guide to Reporting on Principle 1.
The Chief Executive Offi cer is responsible to the Board for the
day-to-day management of the Company and its subsidiaries. The
Board is responsible for the overall performance of the Company
and accordingly takes accountability for monitoring the Company’s
business and affairs and setting its strategic direction, establishing
policies and overseeing the Company’s fi nancial position.
The Board has a charter which establishes the relationship
between the Board and management and describes their
respective functions and responsibilities. The powers reserved for
the Board include:
(a) Oversight of the Company and the Company’s group
members’ control and accountability systems;
(b) Appointment and, where appropriate, removal of the Chief
Executive Offi cer of the Company;
(c) Appointment and, where appropriate, removal of the Chief
Financial Offi cer and the Company Secretary;
(d) Input into and fi nal approval of management’s development of
corporate strategy and performance objectives, reserves and
fi nancial plans;
(e) Reviewing, ratifying and monitoring systems of risk
management and internal compliance and control, codes of
conduct and legal compliance;
(f) Monitoring senior management’s performance in implementing
strategies, achieving objectives and observing budgets and
ensuring that appropriate resources are available for these
purposes;
(g) Encouraging a culture that promotes ethical and responsible
decision making, compliance with regulatory responsibilities
and transparency through effective and timely reporting;
(h) Keeping under review management succession plans and
development activities;
(i) Reviewing procedures and practices employed in relation
to health, safety and the environment and assessing their
adequacy;
(j) Approving policies of Company-wide or general application;
(k) Formulating and adopting appropriate Board policies;
(l) Adopting a continuous disclosure policy and monitoring its
operation;
(m) Approving the issue of any shares, options, equity instruments
or other securities in the Company;
(n) Approving and monitoring the progress of major capital
expenditure, capital management and acquisitions and
divestitures;
(o) Monitoring the fi nancial performance of the Company;
(p) Approving and monitoring fi nancial and other reporting
including the annual and half year fi nancial reports;
(q) Approving borrowings other than in the ordinary course of
business and the granting of security over, or interests in, the
Company or its assets;
(r) Approving the annual budget and strategic plan;
For
per
sona
l use
onl
y
NIDO PETROLEUM ANNUAL REPORT 2010 41
CORPORATE GOVERNANCE STATEMENT
Compliance with best Practice Recommendations - continued
(s) Approving any matters that might signifi cantly impact the
reputation of the Company;
(t) Approving the engagement of auditors to review and Report
to the Board on the Company’s fi nancial results and reporting
systems, internal controls and compliance with statutory and
regulatory requirements; and
(u) Assessing the appropriateness of, and monitoring compliance
with, corporate governance policies and ethical standards.
A copy of the Board Charter is available from the corporate
governance section of the Company’s website.
In relation to Recommendation 1.2, details of the performance
review process for senior executives are set out in the
Remuneration Report which forms part of the Directors’ Report.
Principle 2: Structure the Board to add value
Recommendations:
2.1 A majority of the Board should be independent Directors;
2.2 The Chair should be an independent Director;
2.3 The roles of the Chair and Chief Executive Offi cer should not
be exercised by the same individual;
2.4 The Board should establish a Nomination Committee;
2.5 Companies should disclose the process for evaluating the
performance of the Board, its committees and individual
Directors; and
2.6 Companies should provide the information indicated in the
Guide to Reporting on Principle 2.
Board Structure
The Board is currently composed of six Directors, with fi ve
Non-Executive Directors and one Executive Director. The names
of the Directors in offi ce as at the date of this Report, the year
of each Director’s appointment and each Director’s status as
independent, Non-Executive or Executive Director, are set out in
the Directors’ Report.
There have been no changes to the Board for the year ending 31
December 2010.
Independence
Directors are expected to bring independent views and judgment
to the Board’s deliberations. The Board has reviewed the position
and associations of all Directors in offi ce at the date of this Report
and considers that a majority of the Directors are independent in
accordance with recommendation 2.1.
In determining whether a Director is independent, the Board
has considered the relationships affecting independent status
described in ASX Principle 2 and other information, facts and
circumstances that the Board considers relevant. The Board
assesses the independence of new Directors upon appointment
and reviews their independence, and the independence of the
other Directors, as appropriate.
The test of whether a relationship is material is based on the nature
of the relationship and the circumstances of the Director. Materiality
is considered from the perspective of the Company, the Director
and the person or entity with which the Director has a relationship.
The two Directors who are not considered to be independent are:
• Mr David Whitby, Non-Executive Director; and
• Mr Jocot de Dios, Chief Executive Offi cer.
Mr Whitby is deemed not to be independent by virtue of his prior
role, held within the last three years, as Managing Director of the
Company (Mr Whitby resigned as Managing Director on 6 February
2008).
The Board considers that Messrs Pérez, Bloking, Mañalac and
Edwards are independent Directors in accordance with ASX
Principle 2.
In reaching this view, the Board has considered the consultancy
agreements existing between Messrs Perez, Bloking, Mañalac,
Edwards and the Company and has determined that the level of
consultancy fees are neither material to the Company nor material
to any of the Directors in the context of their overall income and are
comparable to commercial rates available for comparable services
and are therefore equivalent to consultancies entered into on an
arm’s length basis.
Retirement and Re-election
The Company’s constitution requires that one third of the Directors
except for the Chief Executive Offi cer retire from offi ce at each
Annual General Meeting. Directors who have been appointed by
the Board during the year (as a casual vacancy or as an addition
to the Board) are required to retire from offi ce at the next Annual
General Meeting.
Directors cannot hold offi ce for a period in excess of three
years or beyond the third Annual General Meeting following their
appointment without submitting themselves for re-election. Retiring
Directors are eligible for re-election by shareholders.
Board support for Directors retiring by rotation and seeking re-
election is not automatic and is subject to the recommendation of
the Remuneration and Nomination Committee and the views of the
remaining members of the Board.
Nomination and Appointment of Directors
Since 8 September 2008, recommendations of candidates for
appointment as new Directors have been made by the Board’s
Remuneration and Nomination Committee for consideration by
the Board as a whole. If it is necessary to appoint a new Director
to fi ll a vacancy on the Board or to complement the existing
Board, a wide potential base of candidates is considered with the
assistance of an independent consultant.
If a candidate is recommended by the Remuneration and
Nomination Committee, the Board assesses the qualifi cations of
the proposed individual in terms of the skills that he or she may
bring to the Board. The availability of the candidate to devote
suffi cient time to the Board is also considered.
For
per
sona
l use
onl
y
NIDO PETROLEUM ANNUAL REPORT 2010 42
CORPORATE GOVERNANCE STATEMENT
Compliance with best Practice Recommendations - continued
Induction
New Directors are provided with a formal letter of appointment
which sets out the key terms and conditions of appointment
including duties, rights and responsibilities, the time commitment
envisaged and the Board’s expectations regarding involvement in
committee work. The Director meets all members of the Board
and, as appropriate, key executives. The Director is encouraged
to visit the head offi ce in Perth and operations offi ce in Manila to
become acquainted with the Company’s activities.
Knowledge, Skills and Experience
All Directors are expected to maintain the skills required to
discharge their obligations to the Company. Directors are provided
with papers, presentations and briefi ngs about the Company’s
business and operations. Directors are encouraged to undertake
continuing education and training relevant to the discharge of
their duties to the Company and are required to undertake the
Australian Institute of Company Directors (AICD) Course or an
equivalent course. Subject to prior approval by the Board, the cost
of continuing education is met by the Company.
Access to Information and Independent Advice
All Directors have unrestricted access to employees of the
Company and, subject to the law, access to all Company records
and information held by the Company’s employees. The Board
receives regular fi nancial and operational reports from management
to enable it to carry out its duties. Consistent with ASX Principle 2,
each Director may, with the prior approval of the Chairman, obtain
independent professional advice to assist the Director in the proper
exercise of powers and discharge of duties as a Director or as a
member of a Board committee. The Company will reimburse the
Director for the reasonable expenses of obtaining that advice.
Confl icts of Interest
Directors are required to avoid confl icts of interest and immediately
inform their fellow Directors should a confl ict of interest arise.
Directors are also required to advise the Company of any relevant
interests that may result in a confl ict.
Where a matter in which a Director has a material personal interest
is being considered by the Board, that Director must not be
present when the matter is being considered or vote on the matter,
unless all the other Directors have passed a resolution to enable
that Director to do so or the matter comes within a category of
exception under the Corporations Act 2001.
Committees
Audit and Risk Management Committee
The Board has established an Audit and Risk Management
Committee as a standing committee to assist it in the discharge of
its responsibilities. The Audit and Risk Management Committee
comprises Mr Andrew Edwards as Chairman, and Messrs William
Bloking and Eduardo Mañalac as members. Further information
in relation to the Audit and Risk Management Committee’s role is
contained in its charter and set out on the Company’s website and
under Principle 4 of this Corporate Governance Statement.
Remuneration and Nomination Committee
The Board has established a Remuneration and Nomination
Committee with Mr William Bloking as Chairman, and Messrs
David Whitby and Mr Eduardo Mañalac as members.
Further details of the remuneration functions of the Remuneration
and Nomination Committee are contained under Principle 8
of this Corporate Governance Statement. The charter of the
Remuneration and Nomination Committee is available on the
Company’s website.
Each of the above committees review matters on behalf of the
Board and, subject to the terms of the committees’ charter, refers
matters to the Board for decision with a recommendation from the
Committee or determines matters where the Committee acts under
designated authority and then reports the outcome to the Board.
Board Evaluation
The Board engaged an independent consultant to undertake a
Board evaluation in 2009 and 2010. The evaluation included
a review by the independent external consultant of each of the
Directors individually, the Board Committees, as well as the
Board as an integrated team through the completion of a detailed
questionnaire and the conduct of personal interviews with each
Director and the Company’s Leadership Team. The results have
been considered by the Board as part of its strategic planning
sessions for 2009 and 2010, and the recommendations arising
from the review have been implemented.
Details of the performance review process for Executive Directors
are set out in the Remuneration Report which forms part of the
Directors’ Report.
Principle 3: Promote ethical and responsible decision-
making
Recommendations:
3.1 Companies should establish a code of conduct and disclose
the code or a summary of the code as to:
• The practices necessary to maintain confi dence in the
company’s integrity;
• The practices necessary to take into account their
legal obligations and reasonable expectations of their
stakeholders; and
• The responsibility and accountability of individuals for
reporting and investigating reports of unethical practices.
3.2 Companies should establish a policy concerning diversity
and disclose the policy or a summary of that policy. The
policy should include requirements for the Board to establish
measureable objectives for achieving gender diversity and
for the Board to assess annually both the objectives and
progress in achieving them.
3.3 Companies should disclose in each Annual Report the
measurable objectives for achieving gender diversity set by
the Board in accordance with the diversity policy and progress
towards achieving them.
For
per
sona
l use
onl
y
NIDO PETROLEUM ANNUAL REPORT 2010 43
CORPORATE GOVERNANCE STATEMENT
Compliance with best Practice Recommendations - continued
3.4 Companies should disclose in each Annual Report the
proportion of women employees in the whole organisation,
women in senior executive positions and women on the
Board.
3.5 Companies should provide the information indicated in the
Guide to Reporting on Principle 3.
Code of Conduct
The Board has adopted a Code of Conduct to guide the
Directors and promote high ethical and professional standards
and responsible decision-making. In particular, it addresses the
Company’s responsibilities to shareholders, the community and
individuals, and the obligations of Directors and staff to act with
integrity and honesty, engage in fair trading practices, comply
with the law, avoid confl icts of interest, protect the assets of the
Company, maintain the confi dentiality of confi dential information
and comply with the code of conduct. The Code of Conduct
also outlines the process by which breaches of the code may be
reported and dealt with. The Board’s code of conduct is consistent
with ASX Principle 3. A summary of the code is available on the
Company’s website.
Diversity
The Board is in the process of formulating an appropriate diversity
policy in accordance with the updated recommendations which
came into effect on 1 January 2010 and will be in a position
to report against and disclose the same for the year ending 31
December 2011.
In the meantime, the proportion of women employees in the entire
organisation, in senior executive positions and on the Board is set
out in the table below:
Proportion of Women
Organisation as a whole (employees) 56%
Senior Executive Positions 20%
Board Nil
Share Trading
The Company’s share trading policy reinforces the requirements
of the Corporations Act 2001 in relation to insider trading. The
policy prohibits all employees and Key Management Personnel
of the Company from trading the Company’s securities if they are
in possession of insider information. The policy also prohibits
Key Management Personnel and employees who participate
in a Company equity-based incentive plan from entering into
arrangements which would have the effect of hedging. The
Company’s share trading policy complies with ASX Listing Rule
12.12 and has been provided to the ASX in accordance with
Listing Rule 12.9. The Company’s share trading policy is also
provided on the Company’s website.
Key Management Personnel of the Company who intend to buy
or sell shares or exercise options advise the Company Secretary
in advance of their intention to trade, confi rm that they do not
hold inside information, and are not otherwise precluded from
trading as advised by the Company Secretary, and secure written
approval from the Chairman of the Board or two Directors to
trade in securities. Directors are advised that any trading in the
Company’s shares or other securities must also be the subject of
a notice to the Company Secretary within two business days of
the trading fi rst occurring and the Share Trading Policy is provided
and accepted as part of the induction process and appointment
documentation.
Disclosure
Details of the Company’s continuous disclosure practices and
procedures are referred to under ASX Principle 5.
Principle 4: Safeguard integrity of fi nancial reporting
Recommendations:
4.1 The Board should establish an Audit Committee;
4.2 The Audit Committee should be structured so that it:
• Consists only of Non-Executive Directors;
• Consists of a majority of independent Directors;
• Is chaired by an independent Chairman who is not the
Chairman of the Board; and
• Has at least three members.
4.3 The Audit Committee should have a formal charter; and
4.4 Companies should provide the information indicated in the
Guide to Reporting on Principle 4.
Audit and Risk Management Committee
The Audit and Risk Management Committee monitors internal
control policies and procedures designed to safeguard Company
assets and maintain the integrity of fi nancial reporting. The
Audit and Risk Management Committee has the following
responsibilities:
(a) Monitor the integrity of the Financial Statements of the
Company, and review signifi cant fi nancial reporting judgments;
(b) Review the Company’s internal fi nancial control system
and, unless expressly addressed by the Board itself, the
Company’s risk management systems;
(c) Monitor and review the effectiveness of the Company’s
internal audit function (if any);
(d) Monitor and review the external audit function including
matters concerning appointment and remuneration,
independence and non-audit services;
(e) Review and assess the corporate risk management
framework for identifying, monitoring and managing signifi cant
business risks; and
(f) Perform such other functions as assigned by law, the
Company’s constitution, or the Board.
For
per
sona
l use
onl
y

NIDO PETROLEUM ANNUAL REPORT 2010 44
CORPORATE GOVERNANCE STATEMENT
Compliance with best Practice Recommendations - continued
The members of the Audit and Risk Management Committee at the
date of this report are:
• Andrew Edwards, Chairman;
• William Bloking, Member; and
• Eduardo Mañalac, Member.
Each of the members of the Audit and Risk Management
Committee is considered to be independent.
Mr Edwards as a chartered accountant possesses the “fi nancial
expertise” required of at least one member of the Audit and
Risk Management Committee. Messrs Mañalac and Bloking are
fi nancially experienced and are otherwise qualifi ed to be members
of the Audit and Risk Management Committee by virtue of their
industry experience. Details of each Director’s qualifi cations are
included in the Directors’ Report. The Company Secretary is also
the Secretary of the Committee and attends the meetings.
The Chief Executive Offi cer, the Chief Financial Offi cer and other
members of the Leadership Team are also invited to attend
the meetings as appropriate. The composition, operations and
responsibilities of the Committee are consistent with ASX Principle 4.
The Committee met three times during the year ended 31
December 2010. The external auditor was in attendance at the
March and September meetings with respect to the approval
of the full year 2009 accounts and the half year accounts for
2010. Details of meeting attendance for Committee members are
set out in the Directors’ Report on page 21. The Audit and Risk
Management Committee’s Charter is available on the Company’s
website.
Independence of the external auditor
The Company’s external auditor is Ernst & Young. The
effectiveness, performance and independence of the external
auditor are reviewed by the Audit and Risk Management
Committee. The procedure for the selection, appointment and
rotation of the external auditor is summarised on the Company’s
website.
The Corporations Act 2001 requires the external auditor to make
an annual independence declaration, addressed to the Board,
declaring that the auditor has maintained its independence in
accordance with the Corporations Act 2001 and the rules of the
professional accounting bodies. Ernst & Young has provided an
Independence Declaration to the Board for the fi nancial year ended
31 December 2010 which forms part of the Directors’ Report on
page 38. The Company’s lead external audit partner is Russell
Curtin who was appointed in 2007.
As part of the Company’s commitment to safeguarding integrity in
fi nancial reporting, the Company monitors the independence and
competence of the external auditor. The provision of non-audit
services by the external auditor is monitored by the Audit and Risk
Management Committee. Details of fees paid or payable to Ernst
& Young for non-audit services provided to the Company in the
year ended 31 December 2010 are set out in the Directors’ Report
on page 37.
The Board has considered the nature of the non-audit services
provided by the external auditor during the year and has
determined that the services provided and the amount paid
for those services are compatible with the general standard of
independence for auditors imposed by the Corporations Act 2001
and that the auditor’s independence has not been compromised.
In accordance with ASX Principle 6 and the Corporations Act
2001, Ernst & Young attend and are available to answer questions
at the Company’s Annual General Meetings.
Principle 5: Make timely and balanced disclosure
Recommendations:
5.1 Companies should establish written policies designed
to ensure compliance with ASX Listing Rule disclosure
requirements and to ensure accountability at a senior
executive level for that compliance and disclose those policies
or a summary of those policies; and
5.2 Companies should provide the information indicated in the
Guide to Reporting on Principle 5.
Disclosure
The Company understands that timely disclosure of price sensitive
information is central to the effi cient operation of the securities
market and has adopted a Continuous Disclosure Policy in relation
to compliance with the ASX Listing Rule disclosure requirements.
The Company Secretary has responsibility for compliance
oversight and coordination of the disclosure of information by the
Company to the ASX and for administering the Policy. A summary
of the Company’s Continuous Disclosure Policy appears on the
Company’s website.
Principle 6: Respect the rights of shareholders
Recommendations:
6.1 Companies should design a communications policy for
promoting effective communication with shareholders and
encouraging their participation at general meetings and
disclose their policy or a summary of that policy; and
6.2 Companies should provide the information indicated in Guide
to Reporting on Principle 6.
The Company prioritises effective communications with
shareholders. All shareholders receive the Company’s Annual
Report (either in hard copy or electronically), and may also
request copies of the Company’s half-yearly and quarterly
reports. The Company’s annual general meeting is a major forum
for shareholders to ask questions about the performance of
the Company and provides an opportunity for shareholders to
provide feedback to the Company about information provided
to shareholders. The Company encourages full shareholder
participation at the Annual General Meeting.
In addition, the Company maintains a website at www.nido.
com.au, on which the Company makes the following information
available on a regular and up to date basis:
• Company announcements released to the ASX (for the last two
years);
For
per
sona
l use
onl
y

NIDO PETROLEUM ANNUAL REPORT 2010 45
CORPORATE GOVERNANCE STATEMENT
Compliance with best Practice Recommendations - continued
• Most recent information briefi ngs to the media and analysts;
• Notices of meetings and explanatory materials;
• Financial information (for last three years); and
• Annual Reports (for last three years).
The Company regularly reviews its communication policy
and processes to ensure that effective communication with
shareholders is maintained. A summary of the Company’s
communication policy appears on the Company’s website.
Principle 7: Recognise and manage risk
Recommendations:
7.1 Companies should establish policies for the oversight and
management of material business risks and disclose a
summary of those policies;
7.2 The Board should require management to design and
implement the risk management and internal control system to
manage the Company’s material business risks and report to
it on whether those risks are being managed effectively. The
Board should disclose that management has reported to it
as to the effectiveness of the Company’s management of its
material business risks;
7.3 The Board should disclose whether it has received assurance
from the Chief Executive Offi cer (or equivalent) and the Chief
Financial Offi cer (or equivalent) that the declaration provided
in accordance with section 259A of the Corporations Act is
founded on a sound system of risk management and internal
control and that the system is operating effectively in all
material respects in relation to fi nancial reporting risks; and
7.4 Companies should provide the information indicated in Guide
to Reporting on Principle 7.
Risk management
The Company has a program in place to identify, monitor and
manage material risks associated with its business activities
and has adopted and continually reviews its risk management
controls. The Board determines the Company’s risk profi le and
is responsible for overseeing and approving risk management
strategy and policies, internal compliance and internal control.
The Audit and Risk Management Committee provides assistance
and support to the Board in its review and oversight of the
adequacy and integrity of Nido’s risk management framework and
the effectiveness of Nido’s internal control structure.
The Audit and Risk Management Committee is specifi cally tasked
with the responsibility for:
• Reviewing and assessing the corporate risk management
framework for identifying, monitoring and managing signifi cant
business risks;
• Reviewing the effectiveness of the system for monitoring
compliance with laws, regulations, internal policies and industry
standards;
• considering the effectiveness of the Company’s internal control
structure;
• reviewing the adequacy of Nido’s insurance program; and
• receiving and referring to the Board any reports and
recommendations from Nido’s management on signifi cant legal,
compliance or regulatory matters that may have a material effect
on the Company’s risk framework and internal control structure,
or its strategy, operations or reputation.
The tasks of undertaking and assessing risk management and
internal control effectiveness are delegated to management
through the Chief Executive Offi cer, including responsibility for
the day to day design and implementation of the Company’s risk
management and internal control system.
Management reports to the Audit and Risk Management
Committee and ultimately the Board on the Company’s key risks
and the extent to which it believes these risks are being adequately
managed.
The risk management controls adopted by the Company currently
include:
• A risk register identifying the material risks facing the Company
and the mitigation strategies in place to reduce or limit those
risks;
• A health, safety, security and environment policy, a
comprehensive HSSE Management System and associated
procedures, including emergency response procedures;
• Limits for approval of capital expenditure and investments;
• Limits on authorities applicable to the execution of contracts and
other instruments;
• Compliance processes in relation to legal liability, fi nancial
controls and treasury matters;
• An insurance program to address insurable risks associated with
corporate and operational activities including the periodic review
and audit of the insurance program to ensure its integrity;
• Strategic and business planning;
• Annual budgeting and monthly reporting systems enabling the
monitoring of progress and cashfl ows; and
• Appropriate due diligence procedures for acquisitions,
divestments and fi nancing.
The Company’s risk management policy appears on the
Company’s website.
Role of the Audit and Risk Management Committee
The Audit and Risk Management Committee assists the Board in
relation to risk management issues. Further details in relation to the
Audit and Risk Management Committee’s role appear under ASX
Principle 4.
CEO and CFO Declaration
Consistent with ASX Principle 7 and section 295A of the
Corporations Act 2001, the Chief Executive Offi cer and Chief
Financial Offi cer provided a written statement to the Board that, in
their opinion:
For
per
sona
l use
onl
y
NIDO PETROLEUM ANNUAL REPORT 2010 46
CORPORATE GOVERNANCE STATEMENT
Compliance with best Practice Recommendations - continued
• The Company’s Financial Report presents a true and fair view of
the Company’s fi nancial condition and operating results and are in
accordance with applicable accounting standards; and
• The Company’s fi nancial records for the fi nancial year have
been properly maintained in accordance with section 286 of the
Corporations Act 2001.
With regard to the fi nancial records and systems of risk management
and internal compliance in this written statement, the Board received
assurance from the Chief Executive Offi cer and Chief Financial
Offi cer that their declaration was founded on a sound system of
risk management and internal controls and that the system was
operating effectively in all material aspects in relation to the reporting
of fi nancial risks.
Principle 8: Remunerate fairly and responsibly
Recommendations:
8.1 The Board should establish a Remuneration Committee;
8.2 The remuneration committee should be structured so that it:
• Consists of a majority of Independent Directors;
• Is chaired by an Independent Director; and
• Has at least three members.
8.3 Companies should clearly distinguish the structure of non-
executive Directors’ remuneration from that of executive
Directors and senior executives; and
8.4 Companies should provide the information indicated in Guide to
Reporting on Principle 8.
Remuneration Committee
The Remuneration and Nomination Committee’s role with respect to
remuneration is to make recommendations to the Board to assist the
Board in fulfi lling its responsibilities with respect to the Company’s
remuneration, recruitment, retention and termination policies.
The members of the Remuneration and Nomination Committee at
the date of this Report are:
• William Bloking, Chairman;
• David Whitby, Member; and
• Eduardo Mañalac, Member.
Messrs Bloking and Mañalac are considered to be independent.
Mr Whitby is deemed not to be independent by virtue of his prior
role, held within the last three years, as Managing Director of the
Company.
Nido’s HR Consultant and other Independent Consultants are also
invited to attend the meetings as appropriate.
The charter of the Remuneration and Nomination Committee is
available on the Company’s website. The composition, operation
and responsibilities of the Remuneration and Nomination Committee,
where they relate to remuneration matters, are consistent with ASX
Principle 8.
The Committee met twice during the year ended 31 December
2010. Details of meeting attendance for Committee members are
set out in the Directors’ Report on page 21. The Remuneration
and Nomination Committee’s Charter is available on the Company’s
website.
Non Executive Director Remuneration
Details of the remuneration of Non Executive Directors are set out in
the Remuneration Report which forms part of the Directors’ Report.
Remuneration of Chief Executive Offi cer and Senior
Executives
Details of the remuneration of the Chief Executive Offi cer and senior
Executives are set out in the Remuneration Report which forms part
of the Directors’ Report.
Corporate Governance Documents
Please visit our website (www.nido.com.au) to view our corporate
governance documents including our Board Charter, Audit and Risk
Management Committee Charter, Remuneration and Nomination
Committee Charter, Code of Conduct, Share Trading Policy,
Communications Strategy and Compliance Procedures.
Other
Skills, Experience, Expertise and Term of Offi ce of each
Director
A profi le of each Director containing the skills, experience, expertise
and term of offi ce of each Director is set out in the Directors’ Report.
Existence and Terms of any Schemes for Retirement Benefi ts
for Non-Executive Directors
There are no termination or retirement benefi ts for Non-Executive
Directors.
For
per
sona
l use
onl
y

NIDO PETROLEUM ANNUAL REPORT 2010 47
DIRECTORS’ DECLARATION
In accordance with a resolution of Directors of Nido Petroleum Limited, in the opinion of the Directors, I state that:
(a) the Financial Statements, Notes and additional disclosures included in the Directors’ Report designated as audited, of the consolidated
entity are in accordance with the Corporations Act 2001, including:
(i) giving a true and fair view of the consolidated entity’s fi nancial position as at 31 December 2010 and of its performance for the year
ended on that date; and
(ii) complying with Accounting Standards (including the Australian Accounting Interpretations) and Corporations Regulations 2001;
(b) the Financial Statements and Notes also comply with International Financial Reporting Standards as disclosed in note 1; and
(c) at the date of this statement there are reasonable grounds to believe that the Company will be able to pay its debts as and when they
fall due and payable.
This declaration has been made after receiving the declarations required to be made to the Directors in accordance with Section 295A of the
Corporations Act 2001 for the fi nancial year ended 31 December 2010.
For and on behalf of the Board
William Bloking FAICD
Chairman
22 March 2011
For
per
sona
l use
onl
y
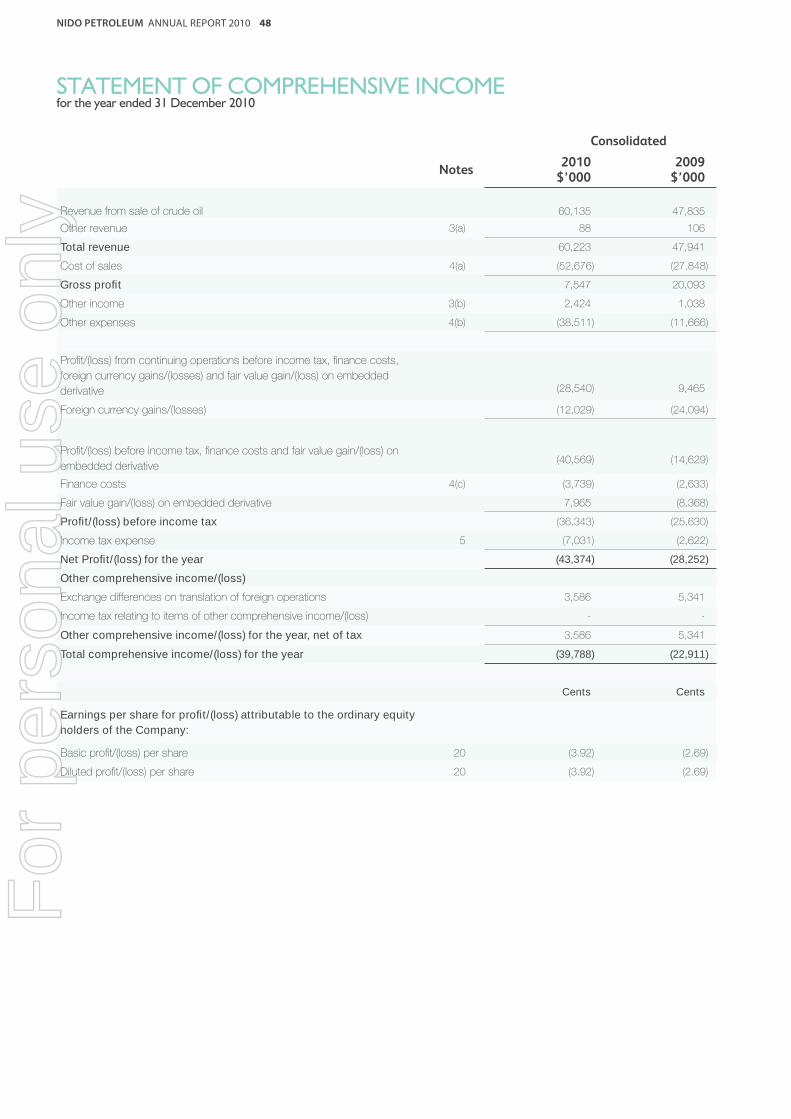
NIDO PETROLEUM ANNUAL REPORT 2010 48
STATEMENT OF COMPREHENSIVE INCOMEfor the year ended 31 December 2010
Consolidated
Notes2010
$’0002009
$’000
Revenue from sale of crude oil 60,135 47,835
Other revenue 3(a) 88 106
Total revenue 60,223 47,941
Cost of sales 4(a) (52,676) (27,848)
Gross profi t 7,547 20,093
Other income 3(b) 2,424 1,038
Other expenses 4(b) (38,511) (11,666)
Profi t/(loss) from continuing operations before income tax, fi nance costs,
foreign currency gains/(losses) and fair value gain/(loss) on embedded
derivative (28,540) 9,465
Foreign currency gains/(losses) (12,029) (24,094)
Profi t/(loss) before income tax, fi nance costs and fair value gain/(loss) on
embedded derivative(40,569) (14,629)
Finance costs 4(c) (3,739) (2,633)
Fair value gain/(loss) on embedded derivative 7,965 (8,368)
Profi t/(loss) before income tax (36,343) (25,630)
Income tax expense 5 (7,031) (2,622)
Net Profi t/(loss) for the year (43,374) (28,252)
Other comprehensive income/(loss)
Exchange differences on translation of foreign operations 3,586 5,341
Income tax relating to items of other comprehensive income/(loss) - -
Other comprehensive income/(loss) for the year, net of tax 3,586 5,341
Total comprehensive income/(loss) for the year (39,788) (22,911)
Cents Cents
Earnings per share for profi t/(loss) attributable to the ordinary equity
holders of the Company:
Basic profi t/(loss) per share 20 (3.92) (2.69)
Diluted profi t/(loss) per share 20 (3.92) (2.69)
For
per
sona
l use
onl
y

NIDO PETROLEUM ANNUAL REPORT 2010 49
BALANCE SHEETas at 31 December 2010
Consolidated
Notes2010
$’0002009
$’000
ASSETS
Current Assets
Cash and cash equivalents 6 24,216 17,091
Trade and other receivables 7 11,439 7,705
Inventories 8 5,326 2,169
Other fi nancial assets 9 3,186 50
Total Current Assets 44,167 27,015
Non-Current Assets
Plant and equipment 10 420 651
Oil and gas properties 11 19,220 45,127
Exploration and evaluation expenditure 12 25,761 26,142
Other fi nancial assets 9 140 140
Total Non-Current Assets 45,541 72,060
Total Assets 89,708 99,075
LIABILITIES
Current Liabilities
Trade and other payables 14 18,911 5,907
Income tax payable 5 391 724
Provisions 15 4,649 292
Convertible Note 17 9,083 21,217
Total Current Liabilities 33,034 28,140
Non-Current Liabilities
Provisions 16 5,083 5,468
Convertible Note 17 - 6,766
Total Non-Current Liabilities 5,083 12,234
Total Liabilities 38,117 40,374
Net Assets 51,591 58,701
EQUITY
Contributed equity 18 149,805 117,236
Other reserves 19 12,965 9,270
Accumulated losses (111,179) (67,805)
Total Equity 51,591 58,701
For
per
sona
l use
onl
y

NIDO PETROLEUM ANNUAL REPORT 2010 50
STATEMENT OF CASH FLOWSfor the year ended 31 December 2010
Consolidated
Notes
2010$’000
2009$’000
Cash Flows From Operating Activities
Receipts from customers 63,440 43,306
Payments to suppliers and employees (51,030) (29,484)
Interest received 88 102
Interest paid (2,663) (2,462)
Proceeds received insurance 472 -
Income tax paid (7,112) (1,863)
Net cash from/(used in) operating activities 25(a) 3,195 9,599
Cash Flows From Investing Activities
Expenditure on oil and gas properties (13,356) (2,049)
Expenditure on exploration and evaluation (5,756) (6,745)
Proceeds from farmout 5,640 8,118
Payments for plant and equipment (131) (80)
Payment for security deposits and bonds (3,211) 1,038
Net cash from/(used in) investing activities (16,814) 282
Cash Flows From Financing Activities
Proceeds from issues of equity securities 29,135 -
Payments for equity issue costs (1,103) (11)
Repayment of borrowings (6,377) (3,019)
Net cash from/(used in) fi nancing activities 21,655 (3,030)
Net increase in cash and cash equivalents 8,036 6,851
Effect of foreign exchange rates (911) (2,033)
Cash and cash equivalents at beginning of year 17,091 12,273
Cash and cash equivalents at end of year 6 24,216 17,091
For
per
sona
l use
onl
y

NIDO PETROLEUM ANNUAL REPORT 2010 51
STATEMENT OF CHANGES IN EQUITYfor the year ended 31 December 2010
ContributedEquity$’000
Share BasedPayment
Reserve$’000
Foreign Currency
Translation Reserve
$’000
Accumulated Losses$’000
Total Equity$’000
Consolidated
At 1 January 2009 117,247 6,584 (3,676) (39,553) 80,602
Profi t/(loss) for the year - - - (28,252) (28,252)
Other comprehensive income/(loss) - - 5,341 - 5,341
Total comprehensive loss for the period,
net of tax - - 5,341 (28,252)
(22,911)
Transactions with owners in their capacity
as owners:
Cost of issue of share capital (11) - - - (11)
Share based payments - 1,021 - - 1,021
(11) 1,021 - - 1,010
As at 31 December 2009 117,236 7,605 1,665 (67,805) 58,701
At 1 January 2010 117,236 7,605 1,665 (67,805) 58,701
Profi t/(loss) for the year - - - (43,374) (43,374)
Other comprehensive income/(loss) - - 3,586 - 3,586
Total comprehensive loss for the period,
net of tax - - 3,586 (43,374) (39,788)
Transactions with owners in their capacity
as owners:
Issue of share capital 29,135 - - - 29,135
Exercise of options 4,539 - - - 4,539
Cost of issue of share capital (1,105) - - - (1,105)
Share based payments - 109 - - 109
32,569 109 - - 32,678
As at 31 December 2010 149,805 7,714 5,251 (111,179) 51,591
For
per
sona
l use
onl
y

NIDO PETROLEUM ANNUAL REPORT 2010 52
NOTES TO THE FINANCIAL STATEMENTSFor the year ended 31 December 2010
1. Summary of Signifi cant Accounting Policies
Corporate InformationThis Financial Report of Nido Petroleum Limited for the year
ended 31 December 2010 was authorised for issue in
accordance with a resolution of the Directors on 11 March
2011.
Nido Petroleum Limited is a company limited by shares
incorporated in Australia whose shares are publicly traded on
the Australian Securities Exchange.
The nature of the operations and principal activities of the
Group are described in the Directors’ Report.
(a) Basis of Preparation The Financial Report is a general purpose Financial Report
which has been prepared in accordance with the requirements
of the Corporations Act 2001, Australian Accounting Standards
and authoritative pronouncements of the Australian Accounting
Standards Board. The Financial Report has also been
prepared on a historical cost basis, with the exception of
derivative fi nancial instruments which have been measured at
fair value.
The Financial Report is presented in Australian dollars and all
values are rounded to the nearest thousand dollars ($’000)
unless otherwise stated.
The accounting policies set out below have been consistently
applied to all periods presented in the Financial Report.
The Group has adopted the following new and amended
Australian Accounting Standards and AASB Interpretations as
of 1 January 2010.
– AASB 2009-8 Amendments to Australian Accounting
Standards — Group Cash-settled Share-based Payment
Transactions [AASB 2] effective 1 January 2010
– AASB 2009-5 Further Amendments to Australian Accounting
Standards arising from the Annual Improvements Project
[AASB 5, 8, 101, 107, 117, 118, 136 & 139] effective 1
January 2010
– AASB 3 Business Combinations (revised 2008) effective 1
July 2009
– AASB 127 Consolidated and Separate Financial Statements
(revised 2008) effective 1 July 2009
– AASB 2009-4 Amendments to Australian Accounting
Standards arising from the Annual Improvements Project
effective 1 July 2009
– AASB 2008-6 Further Amendments to Australian Accounting
Standards arising from the Annual Improvements Project
[AASB 1 & AASB 5] effective 1 July 2009
– AASB 2008-3 Amendments to Australian Accounting
Standards arising from AASB 3 and AASB 127 effective 1
July 2009
When the adoption of the Standard or Interpretation is deemed
to have an impact on the Financial Statements or performance
of the Group, its impact is described below:
Annual Improvements Project
In May 2009 and June 2010 the AASB issued amendments
to its Standards as part of the Annual Improvements Project,
primarily with a view to removing inconsistencies and clarifying
wording. There are separate transitional provisions and
application dates for each amendment. The adoption of
amendments resulting from the Annual Improvements Project
did not have any impact on the accounting policies, fi nancial
position or performance of the Group.
(b) Statement of Compliance The Financial Report complies with Australian Accounting
Standards as issued by the Australian Accounting Standards
Board and International Financial Reporting Standards (IFRS) as
issued by the International Accounting Standards Board.
(c) New Accounting Standards Not Yet EffectiveApplicable Australian Accounting Standards and Interpretations
that have recently been issued or amended but are not yet
effective and have not been adopted by the Group for the
annual reporting period ended 31 December 2010.
For
per
sona
l use
onl
y

NIDO PETROLEUM ANNUAL REPORT 2010 53
NOTES TO THE FINANCIAL STATEMENTSFor the year ended 31 December 2010
1. Summary of Signifi cant Accounting Policies - continued
Reference Title Summary Application Date of Standard
Impact on Group Financial Report
Application Date for Group
AASB 9 Financial Instruments AASB 9 includes requirements for the
classifi cation and measurement of
fi nancial assets resulting from the fi rst
part of Phase 1 of the lASB’s project to
replace IAS 39 Financial Instruments:
Recognition and Measurement (AASB
139 Financial Instruments: Recognition
and Measurement). These requirements
improve and simplify the approach
for classifi cation and measurement
of fi nancial assets compared with the
requirements of AASB 139. The main
changes from AASB 139 are described
below.
(a) Financial assets are classifi ed
based on (1) the objective of
the entity’s business model for
managing the fi nancial assets; (2)
the characteristics of the contractual
cash fl ows. This replaces the
numerous categories of fi nancial
assets in AASB 139, each of which
had its own classifi cation criteria.
(b) AASB 9 allows an irrevocable
election on initial recognition to
present gains and losses on
investments in equity instruments
that are not held for trading in other
comprehensive income. Dividends
in respect of these investments that
are a return on investment can be
recognised in profi t or loss and there
is no impairment or recycling on
disposal of the instrument.
1 January 2013 The Group has not
yet determined the
extent of the impact
of the amendments,
if any.
1 January 2013
For
per
sona
l use
onl
y

NIDO PETROLEUM ANNUAL REPORT 2010 54
NOTES TO THE FINANCIAL STATEMENTSFor the year ended 31 December 2010
1. Summary of Signifi cant Accounting Policies - continued
Reference Title Summary Application Date of Standard
Impact on Group Financial Report
Application Date for Group
AASB 9 Financial Instruments (c) Financial assets can be designated
and measured at fair value through
profi t or loss at initial recognition if
doing so eliminates or signifi cantly
reduces a measurement or
recognition inconsistency that would
arise from measuring assets or
liabilities, or recognising the gains
and losses on them, on different
bases.
1 January 2013 The Group has not
yet determined the
extent of the impact
of the amendments,
if any.
1 January 2013
AASB
2009-11
Amendments to
Australian Accounting
Standards arising from
AASB 9
[AASB 1, 3, 4, 5, 7,
101, 102, 108, 112,
118, 121, 127, 128,
131, 132, 136, 139,
1023 & 1038 and
Interpretations 10 &
12]
❯ These amendments arise from
the issuance of AASB 9 Financial
Instruments that sets out requirements
for the classifi cation and measurement
of fi nancial assets. The requirements in
AASB 9 form part of the fi rst phase of
the International Accounting Standards
Board’s project to replace IAS 39
Financial Instruments: Recognition and
Measurement.
❯ This Standard shall be applied when
AASB 9 is applied
1 January 2013 The Group has not
yet determined the
extent of the impact
of the amendments,
if any.
1 January 2013
AASB 124
(Revised)
Related Party
Disclosures
(December 2009)
The revised AASB 124 simplifi es the
defi nition of a related party, clarifying
its intended meaning and eliminating
inconsistencies from the defi nition,
including:
(a) The defi nition now identifi es a
subsidiary and an associate with the
same investor as related parties of
each other
(b) Entities signifi cantly infl uenced by
one person and entities signifi cantly
infl uenced by a close member of the
family of that person are no longer
related parties of each other
(c) The defi nition now identifi es that,
whenever a person or entity has
both joint control over a second
entity and joint control or signifi cant
infl uence over a third party, the
second and third entities are related
to each other
A partial exemption is also provided
from the disclosure requirements for
government-related entities. Entities that
are related by virtue of being controlled
by the same government can provide
reduced related party disclosures.
1 January 2011 The Group has not
yet determined the
extent of the impact
of the amendments,
if any.
1 January 2011
For
per
sona
l use
onl
y

NIDO PETROLEUM ANNUAL REPORT 2010 55
NOTES TO THE FINANCIAL STATEMENTSFor the year ended 31 December 2010
1. Summary of Signifi cant Accounting Policies - continued
Reference Title Summary Application Date of Standard
Impact on Group Financial Report
Application Date for Group
AASB
2009-12
Amendments to
Australian Accounting
Standards
[AASBs 5, 8, 108,
110, 112, 119,
133, 137, 139,
1023 & 1031 and
Interpretations 2, 4,
16, 1039 & 1052]
This amendment makes numerous
editorial changes to a range of
Australian Accounting Standards and
Interpretations.
❯ In particular, it amends AASB 8
Operating Segments to require
an entity to exercise judgement in
assessing whether a government
and entities known to be under
the control of that government are
considered a single customer for the
purposes of certain operating segment
disclosures. It also makes numerous
editorial amendments to a range of
Australian Accounting Standards and
Interpretations, including amendments
to refl ect changes made to the text of
IFRS by the IASB.
1 January 2011 The Group has not
yet determined the
extent of the impact
of the amendments,
if any.
1 January 2011
AASB
2010-3
Amendments to
Australian Accounting
Standards arising
from the Annual
Improvements Project
[AASB 3, AASB 7,
AASB 121, AASB
128, AASB 131,
AASB 132 & AASB
139]
Limits the scope of the measurement
choices of non-controlling interest to
instruments that are present ownership
interests and entitle their holders to a
proportionate share of the entity’s net
assets in the event of liquidation. Other
components of NCI are measured at fair
value.
Requires an entity (in a business
combination) to account for the
replacement of the acquiree’s share-
based payment transactions (whether
obliged or voluntarily), in a consistent
manner i.e., allocate between
consideration and post combination
expenses.
Clarifi es that contingent consideration
from a business combination that
occurred before the effective date of
AASB 3 Revised is not restated.
Clarifi es that the revised accounting for
loss of signifi cant infl uence or joint control
(from the issue of IFRS 3 Revised) is only
applicable prospectively.
1 July 2010 The Group has not
yet determined the
extent of the impact
of the amendments,
if any.
1 January 2011
For
per
sona
l use
onl
y
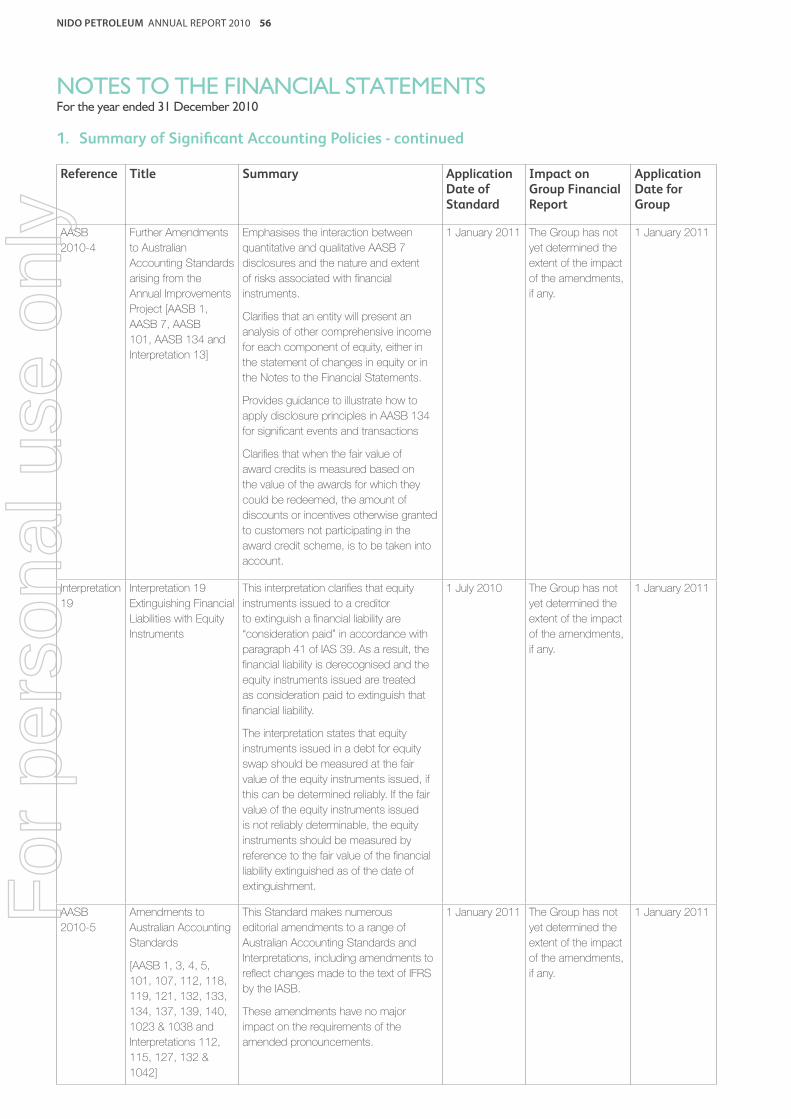
NIDO PETROLEUM ANNUAL REPORT 2010 56
NOTES TO THE FINANCIAL STATEMENTSFor the year ended 31 December 2010
1. Summary of Signifi cant Accounting Policies - continued
Reference Title Summary Application Date of Standard
Impact on Group Financial Report
Application Date for Group
AASB
2010-4
Further Amendments
to Australian
Accounting Standards
arising from the
Annual Improvements
Project [AASB 1,
AASB 7, AASB
101, AASB 134 and
Interpretation 13]
Emphasises the interaction between
quantitative and qualitative AASB 7
disclosures and the nature and extent
of risks associated with fi nancial
instruments.
Clarifi es that an entity will present an
analysis of other comprehensive income
for each component of equity, either in
the statement of changes in equity or in
the Notes to the Financial Statements.
Provides guidance to illustrate how to
apply disclosure principles in AASB 134
for signifi cant events and transactions
Clarifi es that when the fair value of
award credits is measured based on
the value of the awards for which they
could be redeemed, the amount of
discounts or incentives otherwise granted
to customers not participating in the
award credit scheme, is to be taken into
account.
1 January 2011 The Group has not
yet determined the
extent of the impact
of the amendments,
if any.
1 January 2011
Interpretation
19
Interpretation 19
Extinguishing Financial
Liabilities with Equity
Instruments
This interpretation clarifi es that equity
instruments issued to a creditor
to extinguish a fi nancial liability are
“consideration paid” in accordance with
paragraph 41 of IAS 39. As a result, the
fi nancial liability is derecognised and the
equity instruments issued are treated
as consideration paid to extinguish that
fi nancial liability.
The interpretation states that equity
instruments issued in a debt for equity
swap should be measured at the fair
value of the equity instruments issued, if
this can be determined reliably. If the fair
value of the equity instruments issued
is not reliably determinable, the equity
instruments should be measured by
reference to the fair value of the fi nancial
liability extinguished as of the date of
extinguishment.
1 July 2010 The Group has not
yet determined the
extent of the impact
of the amendments,
if any.
1 January 2011
AASB
2010-5
Amendments to
Australian Accounting
Standards
[AASB 1, 3, 4, 5,
101, 107, 112, 118,
119, 121, 132, 133,
134, 137, 139, 140,
1023 & 1038 and
Interpretations 112,
115, 127, 132 &
1042]
This Standard makes numerous
editorial amendments to a range of
Australian Accounting Standards and
Interpretations, including amendments to
refl ect changes made to the text of IFRS
by the IASB.
These amendments have no major
impact on the requirements of the
amended pronouncements.
1 January 2011 The Group has not
yet determined the
extent of the impact
of the amendments,
if any.
1 January 2011For
per
sona
l use
onl
y
NIDO PETROLEUM ANNUAL REPORT 2010 57
NOTES TO THE FINANCIAL STATEMENTSFor the year ended 31 December 2010
1. Summary of Signifi cant Accounting Policies - continued
Reference Title Summary Application Date of Standard
Impact on Group Financial Report
Application Date for Group
AASB
2010-6
Amendments
to Australian
Accounting
Standards –
Disclosures on
Transfers of Financial
Assets [AASB 1 &
AASB 7]
The amendments increase the
disclosure requirements for transactions
involving transfers of fi nancial assets.
Disclosures require enhancements
to the existing disclosures in IFRS
7 where an asset is transferred but
is not derecognised and introduce
new disclosures for assets that are
derecognised but the entity continues to
have a continuing exposure to the asset
after the sale.
1 July 2011 The Group has not
yet determined the
extent of the impact
of the amendments,
if any.
1 January
2012
**** Amendments to IFRS
9: Fair Value Option
for Financial Liabilities
The requirements for classifying and
measuring fi nancial liabilities were added
to AASB 9. The existing requirements
for the classifi cation of fi nancial liabilities
and the ability to use the fair value option
have been retained. However, where
the fair value option is used for fi nancial
liabilities the change in fair value is
accounted for as follows:
❯ The change attributable to changes
in credit risk are presented in other
comprehensive income (OCI)
❯ The remaining change is presented in
profi t or loss
If this approach creates or enlarges an
accounting mismatch in the profi t or loss,
the effect of the changes in credit risk
are also presented in profi t or loss.
1 January
2013
The Group has not
yet determined the
extent of the impact
of the amendments,
if any.
1 January
2013
For
per
sona
l use
onl
y
NIDO PETROLEUM ANNUAL REPORT 2010 58
NOTES TO THE FINANCIAL STATEMENTSFor the year ended 31 December 2010
1. Summary of Signifi cant Accounting Policies - continued
(d) Basis of Consolidation
The consolidated Financial Statements comprise the Financial
Statements of Nido Petroleum Limited and its subsidiaries as
at 31 December each year (the Group or Consolidated Entity).
The Financial Statements of subsidiaries are prepared for
the same reporting period as the parent company, using
consistent accounting policies.
All intercompany balances and transactions have been
eliminated in full.
Subsidiaries are consolidated from the date on which control
is transferred to the Group and cease to be consolidated from
the date on which control is transferred out of the Group.
Where there is a loss of control of a subsidiary, the
consolidated Financial Statements include the results of the
part of the reporting period during which Nido Petroleum
Limited has had control.
Investments in subsidiaries held by Nido Petroleum Limited
are recognised at cost in the separate Financial Statements of
the parent entity less any impairment charges.
The acquisition of subsidiaries is accounted for using the
purchase method of accounting. The purchase method
of accounting involves allocating the cost of the business
combination to the fair value of assets acquired and the
liabilities and contingent liabilities assumed at the date of
acquisition.
(e) Signifi cant Accounting Judgments, Estimates and
Assumptions
Signifi cant accounting judgmentsIn the process of applying the Group’s accounting policies,
management has made the following judgments, apart from
those involving estimations, which have the most signifi cant
effect on the amounts recognised in the Financial Statements.
(i) Exploration and evaluation assets and oil and gas
properties
The Group’s accounting policy for exploration and
evaluation expenditure and oil and gas properties
is set out at Note 1(m) and Note 1(l) respectively.
The application of this policy necessarily requires
management to make certain estimates and assumptions
as to future events and circumstances, in particular, the
assessment of whether economic quantities of reserves
have been found. Any such estimates and assumptions
may change as new information becomes available. If,
after having capitalised expenditure under the policy,
it is concluded that the expenditures are unlikely to be
recovered by future exploitation or sale, then the relevant
capitalised amount will be written off to the Income
Statement.
(ii) Recovery of deferred tax assets
Deferred tax assets are recognised for deductible
temporary differences as management considers that
it is probable that future taxable profi ts will be available
to utilise those temporary differences. Signifi cant
management judgement is required to determine the
amount of deferred tax assets that can be recognised,
based upon the likely timing and the level of future
taxable profi ts together with future tax planning strategies.
The group has not recognised any deferred tax assets at
31 December 2010.
Signifi cant accounting estimates and assumptionsThe carrying amounts of certain assets and liabilities are often
determined based on estimates and assumptions of future
events. The key estimates and assumptions that have a
signifi cant risk of causing a material adjustment to the carrying
amounts of certain assets and liabilities within the next annual
reporting period are:
(i) Impairment of assets
In determining the recoverable amount of assets,
estimations are made regarding the present value of
future cash fl ows using asset-specifi c discount rates
and a “value in use” discounting cash fl ow methodology.
Additional disclosures are provided about the discount
rate and any other signifi cant assumptions in the Notes.
For oil and gas properties, expected future cash fl ow
estimation is based on reserves, future production
profi les, commodity prices and costs.
(ii) Restoration obligations
Where a restoration obligation exists, the Group
estimates the future removal costs of offshore oil and
gas platforms, production facilities, wells and pipelines at
the time of installation of the assets. In most instances,
removal of assets occurs many years into the future.
This requires judgmental assumptions regarding
removal date, future environmental legislation, the
extent of reclamation activities required, the engineering
methodology for estimating cost, future removal
technologies in determining the removal cost and liability
specifi c discount rates to determine the present value of
these cash fl ows. For more detail regarding the policy in
respect of the provision for restoration refer to Note 1(q).
(iii) Share-based payment transactions
The Group measures the cost of equity-settled
transactions with employees by reference to the fair value
of the equity instruments at the date at which they are
granted. The fair value of options is determined using a
Black Scholes model, and the fair value of Performance
Rights is determined using a Monte Carlo simulation
model.
(iv) Estimates of reserves quantities
The estimated quantities of Proved plus Probable
hydrocarbon reserves reported by the Company are
integral to the calculation of depletion and depreciation
expense and to assessment of possible impairment
of assets. Estimate reserve quantities are based upon
interpretation of geological and geo-physical models
and assessments of technical feasibility and commercial
viability of producing the reserves. These assessments
require assumptions to be made
For
per
sona
l use
onl
y

NIDO PETROLEUM ANNUAL REPORT 2010 59
NOTES TO THE FINANCIAL STATEMENTSFor the year ended 31 December 2010
1. Summary of Signifi cant Accounting Policies - continued
regarding future development and production costs,
commodity prices, exchange rates and fi scal regimes.
The estimates of reserves may change from period to
period as the economic assumptions used to estimate
the reserves can change from period to period, and
as additional geological data is generated during the
course of operations. Reserves estimates are prepared in
accordance with the Company’s policies and procedures
for reserve estimation which conform to guidelines
prepared by the Society of Petroleum Engineers.
(v) Valuation of embedded derivative
The Group issued a Convertible Note on 1 September
2006 which contains a holder call option embedded
derivative. The fair value of the call option embedded
derivative in the Convertible Note has been determined
using the Black Scholes model taking into account the
terms and conditions of the option.
(f) Foreign Currency Translation
Both the functional and presentation currency of Nido
Petroleum Limited and its Australian subsidiaries is Australian
Dollars, while for the subsidiaries with operations overseas,
namely Nido Petroleum Philippines Pty Ltd, it is United States
Dollars.
Transactions in foreign currencies are initially recorded in
the functional currency at the exchange rates prevailing at
the date of the transaction. Monetary assets and liabilities
denominated in foreign currencies are converted at the rate of
exchange prevailing at the Balance Sheet date.
As at the reporting date the assets and liabilities of the
subsidiaries operating overseas are translated into the
presentation currency of Nido Petroleum Limited at the rate
of exchange prevailing at the Balance Sheet date and the
Income Statements are translated at the average exchange
rates for the period.
The exchange differences arising on the retranslation are
taken directly to a separate component of equity. On disposal
of a foreign entity, the deferred cumulative amount recognised
in equity relating to that particular foreign operation is
recognised in the Income Statement.
(g) Interests in Joint Ventures
Interests in jointly controlled assets are reported in the
Financial Statements by including the consolidated entity’s
share of assets employed in the Joint Ventures, the share
of liabilities incurred in relation to the Joint Ventures and the
share of any expenses and revenues in relation to the Joint
Ventures in their respective categories.
(h) Cash and Cash Equivalents
Cash and short-term deposits in the Balance Sheet comprise
cash at bank and in hand, short-term deposits with an
original maturity of three months or less and money market
investments readily convertible to cash within two working
days.
For the purposes of the cash fl ow statement, cash and cash
equivalents consist of cash and cash equivalents as defi ned
above, net of outstanding bank overdrafts.
(i) Trade and Other Receivables
Trade receivables are carried at the amounts due. Specifi c
allowance is made for any amounts when collection is
considered doubtful. Bad debts are written off when
identifi ed.
Receivables from related parties are recognised and carried at
amortised cost.
Collectability of trade and other receivables is reviewed on
an ongoing basis. Individual debts that are known to be
uncollectible are written off when identifi ed. An impairment
allowance is recognised when there is objective evidence that
the Group will not be able to collect the receivable. Financial
diffi culties of the debtor, default payments or debts more
than 90 days overdue are considered objective evidence of
impairment. The amount of impairment loss is the receivable
carrying amount compared to the present value of estimated
cash fl ow, discounted at the original effective interest rate.
(j) Inventories
Inventories are valued at the lower of cost and net realisable
value. Cost is determined as follows:
(i) Materials, which include drilling and maintenance stocks,
are valued at cost; and
(ii) Petroleum products, comprising extracted crude oil
stored in FPSO tanks, are valued using the full absorption
cost method.
Inventories and material stocks are accounted for on a FIFO
(fi rst in, fi rst out) basis.
(k) Plant and Equipment
Plant and equipment are stated at cost less accumulated
depreciation and any impairment in value.
Depreciation of plant and equipment is calculated on a
straight line basis over the expected useful life to estimated
residual value. The estimated useful lives, residual values and
depreciation method are reviewed at the end of each annual
reporting period.
The following estimated useful lives are used in the calculation
of depreciation
Plant and Equipment 2 – 3 years
Disposal
Any item of property, plant and equipment is derecognised
upon disposal or when no further economic benefi ts are
expected from its use or disposal.
Any gain or loss arising on derecognising of the asset
(calculated as the difference between the net disposal
proceeds and the carrying amount of the asset) is included in
the Income Statement in the year the asset is derecognised.
For
per
sona
l use
onl
y

NIDO PETROLEUM ANNUAL REPORT 2010 60
NOTES TO THE FINANCIAL STATEMENTSFor the year ended 31 December 2010
1. Summary of Signifi cant Accounting Policies - continued
(l) Oil and Gas Properties
Assets in DevelopmentWhen the technical and commercial feasibility of an
undeveloped oil or gas fi eld has been demonstrated the fi eld
enters its development phase. The costs of oil and gas assets
are transferred from exploration and evaluation expenditure
and reclassifi ed into development phase and include past
exploration and evaluation costs, development drilling and
other subsurface expenditures, surface plant and equipment,
and any associated land and buildings.
Producing assetsThe costs of oil and gas assets in production are separately
accounted for as tangible assets, and include past exploration
and evaluation costs, pre-production development costs
and the ongoing costs of continuing to develop reserves for
production and to expand or replace plant and equipment and
any associated land and buildings.
Depletion charges are calculated using a unit of production
method which will amortise the cost of carried forward
exploration, evaluation and development expenditure over the
life of the estimated Proved plus Probable reserves (2P), in a
cash generating unit.
Provisions for future restoration are made where there is a
present obligation as a result of development or production
activity, and is capitalised as a component of the cost of those
activities. The provision for restoration policy is discussed in
full at Note 1(q).
(m) Exploration and Evaluation Expenditure
Deferred ExpenditureCosts related to the acquisition of properties that contain
resources are allocated separately to specifi c areas of
interest. These costs are capitalised until the viability of the
area of interest is determined.
Exploration and evaluation expenditure is stated at cost and is
accumulated in respect of each identifi able area of interest.
Such costs are only carried forward to the extent that
they are expected to be recouped through the successful
development of the area of interest (or alternatively by its sale);
or where activities in the area have not yet reached a stage
which permits a reasonable assessment of the existence of
economically recoverable reserves.
Accumulated costs in relation to an abandoned area are
written off to the Income Statement in the period in which the
decision to abandon the area is made.
The Directors review the carrying value of each area of interest
as at the balance date and any exploration expenditure which
no longer satisfi es the above policy is written off.
Once an area of interest enters the development phase,
all capitalised acquisition, exploration and evaluation
expenditures are transferred to oil and gas properties.
FarmoutsThe Group does not record any expenditure made by the
farmee on its account. It also does not recognise any gain or
loss on its exploration and evaluation farm out arrangements
but redesignates any costs previously capitalised in relation
to the whole interest as relating to the partial interest retained
and any consideration received directly from the farmee is
credited against costs previously capitalised.
(n) Impairment of Non-Financial Assets
On each reporting date, the Group assesses whether there
is any indication that an asset may be impaired. Where an
indicator of impairment exists, the Group makes a formal
estimate of recoverable amount. Where the carrying amount
of an asset exceeds its recoverable amount the asset is
considered impaired and is written down to its recoverable
amount.
Recoverable amount is the greater of fair value less costs to
sell and value in use. It is determined for an individual asset,
unless it does not generate cash infl ows that are largely
independent of those from other assets or groups of assets,
in which case, the recoverable amount is determined for the
cash-generating unit to which the asset belongs.
In assessing value in use, the estimated future cash fl ows are
discounted to their present value using a pre tax discount rate
that refl ects current market assessments of the time value of
money and the risks specifi c to the asset.
Where an impairment loss subsequently reverses, the carrying
amount of the asset is increased to the revised estimate of its
recoverable amount, but only to the extent that the increased
carrying amount does not exceed the carrying amount that
would have been determined had no impairment loss been
recognised for the asset in prior years.
(o) Investments and Other Financial Assets
Investments and fi nancial assets within the scope of AASB
139 Financial Instruments: Recognition and Measurement
are categorised as either fi nancial assets at fair value
through profi t or loss, loans and receivables, held-to-
maturity investments, or available-for-sale fi nancial assets.
The classifi cation depends on the purpose for which the
investments were acquired. Designation is re-evaluated
at each fi nancial year end, but there are restrictions on
reclassifying to other categories.
When fi nancial assets are recognised initially, they are
measured at fair value plus, in the case of assets not at fair
value through profi t or loss, directly attributable transaction
costs.
Recognition and De-recognitionAll regular way purchases and sales of fi nancial assets are
recognised on the trade date, i.e. the date that the Group
commits to purchase the asset. Regular way purchases
or sales are purchases or sales of fi nancial assets under
contracts that require delivery of the assets within the period
established generally by regulation or convention in the market
place. Financial assets are derecognised when the right to
receive cash fl ows from the fi nancial assets have expired or
have been transferred.
For
per
sona
l use
onl
y

NIDO PETROLEUM ANNUAL REPORT 2010 61
NOTES TO THE FINANCIAL STATEMENTSFor the year ended 31 December 2010
1. Summary of Signifi cant Accounting Policies - continued
Available for sale investmentsAvailable-for-sale investments are those non-derivative
fi nancial assets, principally equity securities, that are
designated as available-for-sale or are not classifi ed as any
of the other categories of fi nancial assets as set out in AASB
139 Financial Instruments Recognition & Measurement. After
initial recognition available-for sale securities are measured at
fair value with gains or losses being recognised as a separate
component of equity until the investment is de-recognised or
until the investment is determined to be impaired, at which
time the cumulative gain or loss previously reported in equity is
recognised in profi t or loss.
The fair values of investments that are actively traded in
organised fi nancial markets are determined by reference to
quoted market bid prices at the close of business on the
Balance Sheet date. For investments with no active market,
fair values are determined using valuation techniques.
Such techniques include: using recent arm’s length market
transactions; reference to the current market value of another
instrument that is substantially the same; discounted cash
fl ow analysis and option pricing models making as much use
of available and supportable market data as possible and
keeping judgemental inputs to a minimum.
(p) Trade and Other Payables
Trade and other payables are carried at amortised cost and
represent liabilities for goods and services provided to the
Group prior to the end of the fi nancial year that are unpaid
and arise when the Group becomes obliged to make future
payments in respect of the purchase of these goods and
services.
(q) Provisions
Provisions are recognised when the Group has a present
obligation (legal or constructive) as a result of a past event;
it is probable that an outfl ow of resources embodying
economic benefi ts will be required to settle the obligation and
a reasonable estimate can be made of the amount of the
obligation.
When the Group expects some or all of a provision to be
reimbursed, the reimbursement is recognised as a separate
asset but only when the reimbursement is virtually certain.
The expense relating to any provision is presented in the
Income Statement net of any reimbursement.
The amount recognised as a provision is the best estimate of
the consideration required to settle the present obligation at
reporting date, taking into account the risks and uncertainties
surrounding the obligation. Where a provision is measured
using the cash fl ows estimated to settle the present obligation,
its carrying amount is the present value of those cash fl ows.
Restoration ProvisionsThe Group recognises any legal or constructive restoration
obligation as a liability at its present value at the time a
legal liability or constructive obligation exists and when a
reliable estimate of the amount of the obligation can be
made. The carrying amount of the long lived assets to which
the obligation relates is increased by the asset retirement
obligation costs and amortised over the producing life of the
asset. Restoration provisions are based on the estimated
cost of restoration work required at the end of the useful life
of the producing fi elds, including removal of facilities and
equipment required or intended to be removed, together
with abandonment of producing wells. These estimates
of the asset retirement obligations are based on current
technology, legal requirements and future costs, which have
been discounted to their present value. In determining the
asset retirement obligations, the Company has assumed
no signifi cant changes will occur in the relevant legislation in
relation to restoration of sites in the future.
Where a restoration obligation is assumed as part of the
acquisition of an asset or obligation, the liability is initially
measured at the present value of the future cash fl ows to
settle the present obligation as at the acquisition date.
Over time, the liability is accreted to its present value
each period based on a risk adjusted pretax discount rate
appropriate to the risks inherent in the liability. The unwinding
of the discount is recorded within fi nance costs. Upon
settlement of the liability, the Company either settles the
obligation for its recorded amount or incurs a gain or loss
upon settlement.
(r) Share Based Payment Transactions
The Group provides benefi ts to employees (including
Directors) of the Group in the form of share based payment
transactions, whereby employees render services in
exchange for shares or rights over shares (“equity-settled
transactions”).
The cost of equity-settled transactions is recognised, together
with a corresponding increase in equity, over the period in
which the performance conditions are fulfi lled, ending on the
date on which the relevant employee becomes fully entitled to
the award (vesting date).
The cumulative expense recognised for equity-settled
transactions at each reporting date until vesting date refl ects:
(i) The grant date fair value of the award;
(ii) The extent to which the vesting period has expired; and
(iii) The number of awards that, in the opinion of the
Directors of the Group, will ultimately vest taking into
account such factors as the likelihood of non-market
performance conditions being met.
This opinion is formed based on the best available information
at balance date.
No expense is recognised for awards that do not ultimately
vest, except for awards where vesting is conditional upon a
market condition. The dilutive effect, if any, of outstanding
awards is refl ected as additional share dilution in the
computation of earnings per share.
For
per
sona
l use
onl
y

NIDO PETROLEUM ANNUAL REPORT 2010 62
NOTES TO THE FINANCIAL STATEMENTSFor the year ended 31 December 2010
1. Summary of Signifi cant Accounting Policies - continued
If the terms of an equity-settled award are modifi ed, as a
minimum an expense is recognised as if the terms had not
been modifi ed. An additional expense is recognised for any
modifi cation that increases the total fair value of the share-
based payment arrangement, or is otherwise benefi cial to the
employee, as measured at the date of modifi cation.
If an equity-settled award is cancelled, it is treated as if it had
vested on the date of cancellation, and any expense not yet
recognised for the award is recognised immediately. However,
if a new award is substituted for the cancelled award and
designated as a replacement award on the date that it is
granted, the cancelled and new award are treated as if they
were a modifi cation of the original award, as described in the
previous paragraph.
Equity settled awards granted by the Parent to employees of
Subsidiaries are recognised in the Parent’s separate Financial
Statements. The expense recognised by the Group is the total
expense associated with such award.
OptionsThere are currently two Employee Share Option Plans (ESOP)
providing these benefi ts to employees, the fi rst (2005 ESOP)
being applicable to option grants prior to 7 December 2007,
and the second being applicable to option grants on and from
7 December 2007 (2007 ESOP). In addition to the ESOP,
options are issued to Directors with terms and conditions
which vary from the ESOP.
The cost of these equity-settled transactions is measured
by reference to the fair value at the date at which they are
granted. The fair value is determined using a Black Scholes
model.
Performance RightsPerformance Rights are issued under the 2010 Employee
Performance Rights Plan. Subject to Shareholder approval,
Directors may be issued Performance Rights under the same
terms and conditions as the plan.
The cost of these equity-settled transactions is measured
by reference to the fair value at the date at which they are
granted. The fair value is determined using a Monte Carlo
simulation model.
(s) Employee Benefi ts
(i) Wages, salaries and annual leave
Liabilities for wages and salaries, including non-monetary
benefi ts and annual leave expected to be settled within
12 months of the reporting date are recognised in
respect of employees’ services up to the reporting date.
These are measured at the amounts expected to be
paid when the liabilities are settled. Expenses for non-
accumulating sick leave are recognised when the leave is
taken and are measured at the rates paid or payable.
(ii) Long service leave
Long service leave entitlements are not recognised until
the service period of an employee extends beyond four
years.
(iii) Defi ned contribution plan
Contributions to employee superannuation funds, being
defi ned contribution plans of choice, are expensed as
incurred.
(t) Leases
The determination of whether an arrangement is or contains
a lease is based on the substance of the arrangement and
requires an assessment of whether the fulfi lment of the
arrangement is dependent on the use of a specifi c asset or
assets and the arrangement conveys a right to use the asset.
Finance leases, which transfer to the Group substantially all
the risks and benefi ts incidental to ownership of the leased
item, are capitalised at the inception of the lease at the fair
value of the leased asset or, if lower, at the present value of
the minimum lease payments.
Operating lease payments are recognised as an expense in
the Income Statement on a straight-line basis over the lease
term. Operating lease incentives are recognised as a liability
when received and subsequently reduced by allocating lease
payments between rental expense and reduction of the
liability.
(u) Revenue
Revenue is recognised in the Income Statement when
the signifi cant risks and rewards of ownership have been
transferred to the buyer. Revenue is recognised and
measured at the fair value of the consideration received or
receivable, to the extent it is probable that the economic
benefi ts will fl ow to the Group and the revenue can be reliably
measured.
Sales Revenue
Sales revenue is recognised on the basis of the Group’s
interest in a producing fi eld (“entitlements” method), when
the physical product and associated risks and rewards of
ownership pass to the purchaser, which is generally at the
time of ship or truck loading, or on the product entering the
pipeline. Revenue earned under a service contract (“SC”) is
recognised on a net entitlements basis according to the terms
of the SC and the Farm-in Agreements.
Interest
Revenue is recognised as interest accrues using the effective
interest method.
(v) Borrowing Costs
Borrowing costs are expensed in the period in which
they are incurred except borrowing costs that are directly
attributable to the acquisition, construction, or production of a
qualifying asset that necessarily takes a substantial period to
get ready for its intended use or sale. In this case, borrowing
costs are capitalised as part of the cost of such a qualifying
asset.
For
per
sona
l use
onl
y

NIDO PETROLEUM ANNUAL REPORT 2010 63
NOTES TO THE FINANCIAL STATEMENTSFor the year ended 31 December 2010
1. Summary of Signifi cant Accounting Policies - continued
(w) Income Tax
Current tax assets and liabilities for the current and prior
periods are measured at the amount expected to be
recovered from or paid to the taxation authorities based on the
current period’s taxable income. The tax rates and tax laws
used to compute the amount are those that are enacted or
substantively enacted at the Balance Sheet date.
Deferred income tax is provided on all temporary differences
at the balance date between the tax bases of assets and
liabilities and their carrying amounts for fi nancial reporting
purposes.
Deferred income tax liabilities are recognised for all taxable
temporary differences except:
• When the deferred income tax liability arises from the initial
recognition of an asset or liability in a transaction that is not
a business combination and, at the time of the transaction,
affects neither the accounting profi t nor taxable profi t or
loss; and
• When the taxable temporary differences are associated
with investments in subsidiaries, associates and interests
in Joint Ventures, except where the timing of the reversal
of the temporary differences can be controlled and it is
probable that the temporary differences will not reverse in
the foreseeable future.
Deferred income tax assets are recognised for all deductible
temporary differences, carry-forward of unused tax assets
and unused tax losses, to the extent that it is probable that
taxable profi t will be available against the deductible temporary
differences, and the carry-forward of unused tax assets and
unused tax losses, can be utilised except:
• When the deferred income tax asset relating to the
deductible temporary differences arises from the initial
recognition of an asset or liability in a transaction that is not
a business combination and, at the time of the transaction,
affects neither the accounting profi t nor taxable profi t or
loss; and
• When the deductible temporary differences are associated
with investments in subsidiaries, associates and interests
in Joint Ventures, in which case deferred tax assets are
only recognised to the extent that it is probable that the
temporary differences will reverse in the foreseeable
future and taxable profi t will be available against which the
temporary differences can be utilised.
The carrying amounts of deferred income tax assets are
reviewed at each balance date and reduced to the extent
that it is no longer probable that suffi cient taxable profi t will be
available to allow all or part of the deferred income tax assets
to be utilised.
Deferred income tax assets and liabilities are measured at
the tax rates that are expected to apply to the year when
the asset is realised or the liability is settled, based on tax
rates (and tax laws) that have been enacted or substantively
enacted at the Balance Sheet date.
Income taxes relating to items recognised directly in equity are
recognised in equity and not in the Income Statement.
Deferred tax assets and deferred tax liabilities are offset only
if a legally enforceable right exists to set off current tax assets
against current tax liabilities and the deferred tax assets
and liabilities relate to the same taxable entity and the same
taxation authority.
Unrecognised deferred income tax assets are reassessed at
each Balance Sheet date and are recognised to the extent
that it has become probable that future taxable profi t will allow
the deferred tax asset to be recovered.
(x) Other Taxes
Revenues, expenses and assets are recognised net of the
amount of GST except:
• Where the amount of the GST incurred is not recoverable
from the taxation authority. In these circumstances the GST
is recognised as part of the cost of acquisition of the asset
or as part of the expense; and
• Receivables and payables are stated with the amount of
GST included.
The net amount of GST recoverable from, or payable to, the
taxation authority in included as a current asset or liability in
the Balance Sheet.
Cash fl ows are included in the cash fl ow statement on a gross
basis. The GST components of each cash fl ow arising from
investing activities which are recoverable from or payable to
the taxation authority are classed as operating cash fl ows.
Commitments and contingencies are disclosed net
of the amount of GST recoverable from, or payable to, the
taxation authority.
(y) Contributed Equity
Contributed equity is recognised at the fair value of the
consideration received by the Company. Any transaction
costs arising on the issue of ordinary shares are recognised
directly in equity as a reduction of the proceeds received.
(z) Earnings per Share
Basic EPS is calculated as net loss attributable to members,
adjusted to include costs of servicing equity other than
dividends, divided by the weighted average number of
ordinary shares, adjusted for any bonus element.
Diluted EPS is calculated as net loss attributable to members,
adjusted for:
(i) Costs of servicing equity (other than dividends);
(ii) The after tax effect of dividends and interest associated
with the dilutive potential ordinary shares that have been
recognised as expenses; and
(iii) Other non-discretionary changes in revenues or
expenses during the period that would result from the
dilution of potential ordinary shares,
For
per
sona
l use
onl
y
NIDO PETROLEUM ANNUAL REPORT 2010 64
NOTES TO THE FINANCIAL STATEMENTSFor the year ended 31 December 2010
1. Summary of Signifi cant Accounting Policies - continued
divided by the weighted average number of ordinary shares
and dilutive potential ordinary shares, adjusted for any bonus
element.
(aa) Financial Instruments Issued by the Company
Debt and equity instruments are classifi ed as either liabilities or
as equity in accordance with the substance of the contractual
arrangement.
Transaction costs arising on the issue of equity instruments,
net of associated tax, are recognised directly in equity as a
reduction of the proceeds of the equity instrument to which
the costs relate. Transaction costs are the costs that are
incurred directly in connection with the issue of those equity
instruments and which would not have been incurred had
those instruments not been issued.
Convertible Note The Convertible Note is split into two components: a debt
component and a component representing the embedded
derivatives in the Convertible Note. The debt component
represents the Group’s liability for future interest coupon
payments and the redemption amount. The embedded
derivatives represent the value of the option that note holders
have to convert into ordinary shares in the Company.
The debt component of the Convertible Note is measured at
amortised cost and therefore increases as the present value
of the interest coupon payments and redemption amount
increases, with a corresponding charge to fi nance cost. The
debt component decreases by the cash interest coupon
payments made. The embedded derivative is measured at
fair value at each Balance Sheet date, and the change in the
fair value is recognised in the Income Statement.
Interest and dividends Interest and dividends are classifi ed as expenses or as
distributions of profi t consistent with the Balance Sheet
classifi cation of the related debt or equity instrument or
component parts of compound instruments.
(bb) Non-current Assets and Disposal Groups Held for Sale
and Discontinued Operations
Non-current assets and disposal groups are classifi ed as held
for sale and measured at the lower of their carrying amount
and fair value less costs to sell if their carrying amount will
be recovered principally through a sale transaction. They
are not depreciated or amortised. For an asset or disposal
group to be classifi ed as held for sale, it must be available for
immediate sale in its present condition and its sale must be
highly probable.
An impairment loss is recognised for any initial or subsequent
write-down of the asset (or disposal group) to fair value
less costs to sell. A gain is recognised for any subsequent
increase in fair value less costs to sell of an asset (or disposal
group), but not in excess of any cumulative impairment
loss previously recognised. A gain or loss not previously
recognised by the date of the sale of the non-current asset (or
disposal group) is recognised at the date of de-recognition.
A discontinued operation is a component of the entity that
has been disposed of or is classifi ed as held for sale and that
represents a separate major line of business or geographical
area of operations, is part of a single coordinated plan to
dispose of such line of business or area of operations, or is
a subsidiary acquired exclusively with a view to resale. The
results of discontinued operations are presented separately
on the face of the Income Statement.
(cc) Operating Segments
An operating segment is a component of an entity that
engages in business activities from which it may earn
revenues and incur expenses (including revenues and
expenses relating to transactions with other components
of the same entity), whose operating results are regularly
reviewed by the entity’s chief operating decision maker to
make decisions about resources to be allocated to the
segment and assess its performance and for which discrete
fi nancial information is available. This includes start up
operations which are yet to earn revenues. Management will
also consider other factors in determining operating segments
such as the existence of a line manager and the level of
segment information presented to the board of Directors.
Operating segments have been identifi ed based on the
information provided to the chief operating decision makers –
being the executive management team.
The group aggregates two or more operating segments when
they have similar economic characteristics, and the segments
are similar in each of the following respects:
• Nature of the products and services,
• Nature of the production processes,
• Type or class of customer for the products and services,
• Methods used to distribute the products or provide the
services, and if applicable
• Nature of the regulatory environment.
Operating segments that meet the quantitative criteria as
prescribed by AASB 8 are reported separately. However,
an operating segment that does not meet the quantitative
criteria is still reported separately where information about the
segment would be useful to users of the Financial Statements.
For
per
sona
l use
onl
y

NIDO PETROLEUM ANNUAL REPORT 2010 65
NOTES TO THE FINANCIAL STATEMENTSFor the year ended 31 December 2010 Consolidated
2010$’000
2009
$’000
2. Earnings
Earnings before interest, tax, depreciation, depletion, exploration and impairment
(“EBITDAX”) is calculated as follows:
Continuing operations:
Profi t/(loss) for the year from continuing operations before income tax (36,343) (25,630)
Add back:
Finance costs 3,739 2,633
Interest received (88) (101)
Earnings before interest and tax (“EBIT”) (32,692) (23,098)
Add back:
Depreciation and depletion 344 425
Amortisation of oil and gas properties 8,624 6,209
Impairment write-down of oil and gas properties 29,722 -
Exploration and evaluation expensed 93 191
EBITDAX 6,091 (16,273)
The EBITDAX measure provides additional information that may be used to better understand Nido’s operations. EBITDAX is one measure
commonly used as a supplemental fi nancial measurement in the evaluation of Oil & Gas operations and should not be considered as an
alternative to, or more meaningful than, net profi t / (loss), as an indicator of the Company’s operating performance. Certain items excluded
from EBITDAX are signifi cant components in understanding and assessing a company’s fi nancial performance, such as a company’s cost of
capital and tax structure, as well as the historic cost of depreciable assets, none of which are components of EBITDAX.
The EBITDAX profi t for the year ended 31 December 2010 of $6,091,000 includes unrealised foreign exchange losses of $12,029,000 and
non-cash fair value gain on embedded derivative of $7,965,000. EBITDAX (before foreign exchange gains/(losses) and fair value gain/loss
on embedded derivative) for the year ended 31 December 2010 is $10,155,000 (2009: loss of $16,189,000).
3. Revenues
(a) Other Revenue
Interest received – other parties88 101
Other - 5
Total Other Revenue 88 106
(b) Other Income
Net gain on farmout 1,915 -
Insurance proceeds 472 -
Gain on disposal of investment in associate. - 1,038
Other 37 -
Total Other Income 2,424 1,038
For
per
sona
l use
onl
y

NIDO PETROLEUM ANNUAL REPORT 2010 66
NOTES TO THE FINANCIAL STATEMENTSFor the year ended 31 December 2010
Consolidated
2010$’000
2009$’000
4. Expenses
(a) Cost of Sales
Amortisation of oil and gas properties 8,624 6,209
Other production costs net of inventory movement(*) 44,052 21,639
Total cost of sales 52,676 27,848
(*) Other production costs expense include SC14 Galoc oil fi eld payments for the FPSO of $9,700,000 (2009: $7,780,000) and
in relation to the SC54A Tindalo oil fi eld other production costs include $17,438,000 for the FSO, Rig, Helicopter, Production
Kit, Charter Vessels and other equipment rental. It is impracticable to split other non-lease components from the operating
lease payments.
(b) Other Expenses
(i) General and administrative expenses
Employee Benefi ts
Wages and salaries 4,317 4,393
Defi ned contribution superannuation expense 383 409
Share based payments expense 109 1,021
Other employee benefi ts 784 1,093
Total employee benefi ts 5,593 6,916
Offi ce and other expenses
Offi ce and other expenses 2,262 3,283
Total general and administrative expense 7,855 10,199
(ii) Depreciation, amortisation and impairment expenses
Depreciation of plant and equipment 344 425
Amortisation of oil and gas properties 8,624 6,209
Impairment write-down of oil and gas properties 29,722 -
Total Depreciation, amortisation and impairment 38,690 6,634
Less: amortisation included in cost of sale (8,624) (6,209)
Total Depreciation, amortisation and impairment included in other
expenses 30,066 425
(iii) Lease payments
Operating lease rental 496 464
(iv) Other
Loss on disposal of plant and equipment 1 -
Loss on disposal of long lead inventory - 387
Exploration and evaluation expenditure expensed 93 191
Total other 94 578
Total Other Expenses 38,511 11,666For
per
sona
l use
onl
y

NIDO PETROLEUM ANNUAL REPORT 2010 67
NOTES TO THE FINANCIAL STATEMENTSFor the year ended 31 December 2010
Consolidated
2010$’000
2009
$’000
4. Expenses - continued
(c) Finance Costs
(i) Convertible Note fi nance costs
Interest expense 3,693 2,529
(ii) Other fi nance costs
Unwind of the effect of discounting on provisions 46 104
Total fi nance costs 3,739 2,633
(d) Disposal of investment in associate
Nido entered into a Sale and Purchase Agreement with Shell Technology Ventures Fund 1 B.V. dated 16 January 2009 to
dispose of its 25.7% interest in Cool Energy Limited. The consideration for the sale of ordinary shares in Cool Energy Limited was
$504,000 (3,600,000 ordinary shares at $0.14). The remaining 3,880,000 redeemable convertible preference shares were sold
in February 2009, consideration being $543,200 (3,880,000 redeemable convertible preference shares at $0.14). Net proceeds
(after selling costs) were $1,038,000.
Investment acquisition – cost - -
Allowance for impairment - -
- -
Net proceeds on sale - 1,038
Gain on sale of investment - 1,038
5. Income Tax
(a) Income tax expense
The major components of income tax expense are:
Current income tax
Current income tax charge/(benefi t) (764) (388)
Prior year under/(over) provision 335 456
Current income tax benefi t not recognised 7,460 2,554
Deferred income tax
Temporary differences originating and reversing (8,161) (447)
Prior year under/(over) provision (1,001) (51)
Deferred tax benefi t not recognised 9,162 498
Income tax expense reported in Income Statement 7,031 2,622
There is no income tax expense in relation to items charged or credited directly to equity.
For
per
sona
l use
onl
y

NIDO PETROLEUM ANNUAL REPORT 2010 68
NOTES TO THE FINANCIAL STATEMENTSFor the year ended 31 December 2010
Consolidated
2010$’000
2009$’000
5. Income Tax - continued
(b) Numerical reconciliation between aggregate tax
expense recognised in the Income Statement and
tax expense calculated per the statutory income
tax rate
Total accounting profi t/(loss) before income tax (36,343) (25,630)
At the Group’s statutory income tax rate Australia 30%,
Philippines 30% (2009: Australia 30%, Philippines 30%) (10,903) (7,689)
Adjustments in respect of current year income tax
Non-deductible expenses 2,221 11,119
Foreign tax on revenue basis 23 92
Other assessable income 662 194
Non-assessable income (927) (993)
Prior year over/(under)-provision (667) 404
Utilisation of unrecognised tax losses - (3,558)
Deferred tax assets not recognised 16,622 3,053
Income tax expense for the year 7,031 2,622
Aggregate income tax is attributed to:
Continuing operations 7,031 2,622
(c) Recognised Income Tax Payable
Opening balance (724) -
Charged to Income Statement (7,031) (2,622)
Other payments 7,237 1,905
Currency translation difference 127 (7)
(391) (724)
BalanceSheet
Balance Sheet
Income Statement
IncomeStatement
2010$’000
2009$’000
2010$’000
2009$’000
(d) Unrecognised deferred tax assets and liabilities
Consolidated
(i) Deferred tax liabilities
Convertible Note 1,905 998 (907) (998)
Set-off of deferred tax assets (1,905) (998) 907 998
- - - -
(ii) Deferred tax assets
Provisions 94 87 (7) (23)
Other 87 87 - 142
Rehabilitation 2,786 1,640 (1,146) (201)
Exploration Assets 1,414 1,414 - (1,414)
Oil and Gas Assets 8,917 - (8,917) -
Revenue tax losses 19,725 12,227 (7,498) 2,026
Set-off against deferred tax liabilities (1,905) (998) 907 998
Unrecognised deferred tax asset (31,118) (14,457) 16,661 (1,528)
- - - -
For
per
sona
l use
onl
y

NIDO PETROLEUM ANNUAL REPORT 2010 69
NOTES TO THE FINANCIAL STATEMENTSFor the year ended 31 December 2010
5. Income Tax - continued
The deferred tax assets not brought to account for the 2010 year will only be obtained if:
(i) Future assessable income is derived of a nature and of an amount suffi cient to enable the benefi t to be realised;
(ii) The conditions for deductibility imposed by the tax legislation continue to be complied with; and
(iii) The companies are able to meet the continuity of ownership and/or continuity of business tests.
Australian revenue tax losses are available indefi nitely for offsetting against future Australian taxable profi ts subject to continuing to meet
relevant statutory tests.
Revenue tax losses due to operations in the Philippines are available indefi nitely for offset against future Philippine taxable profi ts subject
to continuing to meet relevant statutory tests.
(e) No Tax Consolidated Group
As at the reporting date, a consolidated group for tax purposes has not been formed.
Consolidated
2010$’000
2009$’000
6. Cash and Cash Equivalents
Cash at bank and in hand 23,432 16,331
Short term deposits 784 760
24,216 17,091
Cash at bank and in hand earns interest at fl oating rates based on daily bank deposit rates. Short term deposits are made for varying
periods of between one day and one month depending on the immediate cash requirements of the Group and earn interest at the
respective short term deposit rates.
7. Receivables
Trade and Other Receivables - Current
Receivable from Joint Venture partner 5,929 665
Crude oil receivables 227 6,215
Cash held by Joint Ventures 3,189 457
GST receivables 128 97
Farmout receivable 122 -
Other 1,844 271
11,439 7,705
Fair Value and Risk Exposures
(i) Due to the short term nature of these receivables, t heir carrying value approximates their fair value;
(ii) The maximum exposure to credit risk is the fair value of receivables. Collateral is not held as security;
(iii) Details regarding foreign exchange and interest rate risk exposure are disclosed in Note 31;
(iv) Other receivables generally have repayments between 30 and 90 days.
Ageing analysis of current receivables: Total 0-30 days 31-60 days
2010 11,439 11,311 128
2009 7,705 7,559 146
Current receivables do not contain past due or impaired assets as at 31 December 2010 (2009: none).
8. Inventories
Casing, pipe and drilling inventory 789 548
Oil in storage 4,537 1,621
Total inventories at lower of cost and net realisable value 5,326 2,169
Inventories recognised as an expense for the year was nil (2009: $387,000) for the
Group.
For
per
sona
l use
onl
y
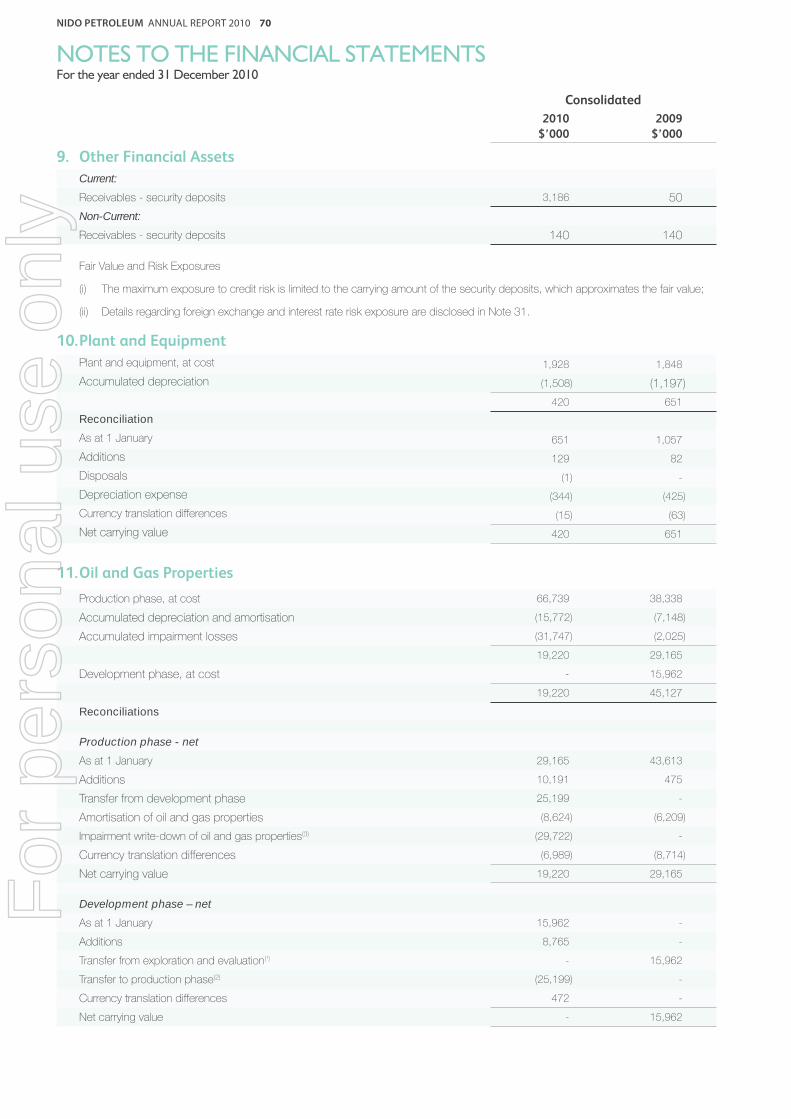
NIDO PETROLEUM ANNUAL REPORT 2010 70
NOTES TO THE FINANCIAL STATEMENTSFor the year ended 31 December 2010
Consolidated
2010
$’000
2009
$’000
9. Other Financial Assets
Current:
Receivables - security deposits 3,186 50
Non-Current:
Receivables - security deposits 140 140
Fair Value and Risk Exposures
(i) The maximum exposure to credit risk is limited to the carrying amount of the security deposits, which approximates the fair value;
(ii) Details regarding foreign exchange and interest rate risk exposure are disclosed in Note 31.
10. Plant and Equipment
Plant and equipment, at cost 1,928 1,848
Accumulated depreciation (1,508) (1,197)
420 651
Reconciliation
As at 1 January 651 1,057
Additions 129 82
Disposals (1) -
Depreciation expense (344) (425)
Currency translation differences (15) (63)
Net carrying value 420 651
11. Oil and Gas Properties
Production phase, at cost 66,739 38,338
Accumulated depreciation and amortisation (15,772) (7,148)
Accumulated impairment losses (31,747) (2,025)
19,220 29,165
Development phase, at cost - 15,962
19,220 45,127
Reconciliations
Production phase - net
As at 1 January 29,165 43,613
Additions 10,191 475
Transfer from development phase 25,199 -
Amortisation of oil and gas properties (8,624) (6,209)
Impairment write-down of oil and gas properties(3) (29,722) -
Currency translation differences (6,989) (8,714)
Net carrying value 19,220 29,165
Development phase – net
As at 1 January 15,962 -
Additions 8,765 -
Transfer from exploration and evaluation(¹) - 15,962
Transfer to production phase(2) (25,199) -
Currency translation differences 472 -
Net carrying value - 15,962
For
per
sona
l use
onl
y
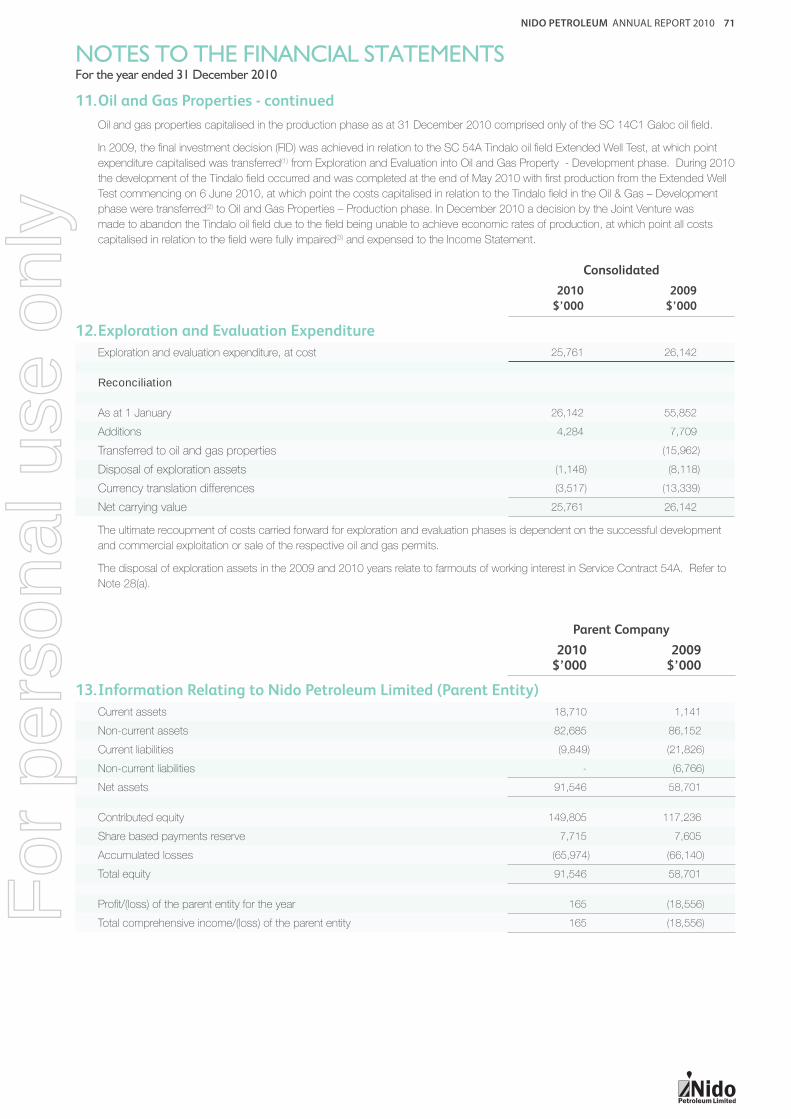
NIDO PETROLEUM ANNUAL REPORT 2010 71
NOTES TO THE FINANCIAL STATEMENTSFor the year ended 31 December 2010
11. Oil and Gas Properties - continued
Oil and gas properties capitalised in the production phase as at 31 December 2010 comprised only of the SC 14C1 Galoc oil fi eld.
In 2009, the fi nal investment decision (FID) was achieved in relation to the SC 54A Tindalo oil fi eld Extended Well Test, at which point
expenditure capitalised was transferred(1) from Exploration and Evaluation into Oil and Gas Property - Development phase. During 2010
the development of the Tindalo fi eld occurred and was completed at the end of May 2010 with fi rst production from the Extended Well
Test commencing on 6 June 2010, at which point the costs capitalised in relation to the Tindalo fi eld in the Oil & Gas – Development
phase were transferred(2) to Oil and Gas Properties – Production phase. In December 2010 a decision by the Joint Venture was
made to abandon the Tindalo oil fi eld due to the fi eld being unable to achieve economic rates of production, at which point all costs
capitalised in relation to the fi eld were fully impaired(3) and expensed to the Income Statement.
Consolidated
2010
$’000
2009
$’000
12. Exploration and Evaluation Expenditure
Exploration and evaluation expenditure, at cost 25,761 26,142
Reconciliation
As at 1 January 26,142 55,852
Additions 4,284 7,709
Transferred to oil and gas properties (15,962)
Disposal of exploration assets (1,148) (8,118)
Currency translation differences (3,517) (13,339)
Net carrying value 25,761 26,142
The ultimate recoupment of costs carried forward for exploration and evaluation phases is dependent on the successful development
and commercial exploitation or sale of the respective oil and gas permits.
The disposal of exploration assets in the 2009 and 2010 years relate to farmouts of working interest in Service Contract 54A. Refer to
Note 28(a).
Parent Company
2010$’000
2009$’000
13. Information Relating to Nido Petroleum Limited (Parent Entity)
Current assets 18,710 1,141
Non-current assets 82,685 86,152
Current liabilities (9,849) (21,826)
Non-current liabilities - (6,766)
Net assets 91,546 58,701
Contributed equity 149,805 117,236
Share based payments reserve 7,715 7,605
Accumulated losses (65,974) (66,140)
Total equity 91,546 58,701
Profi t/(loss) of the parent entity for the year 165 (18,556)
Total comprehensive income/(loss) of the parent entity 165 (18,556)For
per
sona
l use
onl
y
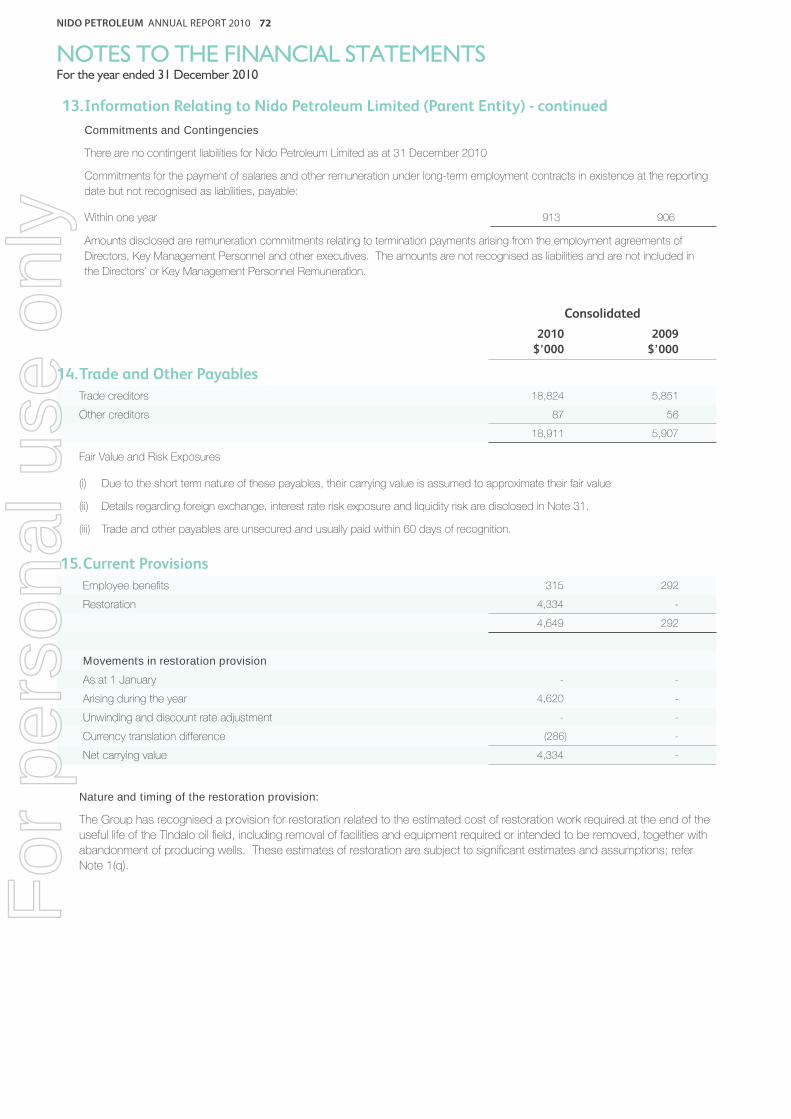
NIDO PETROLEUM ANNUAL REPORT 2010 72
NOTES TO THE FINANCIAL STATEMENTSFor the year ended 31 December 2010
13. Information Relating to Nido Petroleum Limited (Parent Entity) - continued
Commitments and Contingencies
There are no contingent liabilities for Nido Petroleum Limited as at 31 December 2010
Commitments for the payment of salaries and other remuneration under long-term employment contracts in existence at the reporting
date but not recognised as liabilities, payable:
Within one year 913 906
Amounts disclosed are remuneration commitments relating to termination payments arising from the employment agreements of
Directors, Key Management Personnel and other executives. The amounts are not recognised as liabilities and are not included in
the Directors’ or Key Management Personnel Remuneration.
Consolidated
2010
$’000
2009
$’000
14. Trade and Other Payables
Trade creditors 18,824 5,851
Other creditors 87 56
18,911 5,907
Fair Value and Risk Exposures
(i) Due to the short term nature of these payables, their carrying value is assumed to approximate their fair value
(ii) Details regarding foreign exchange, interest rate risk exposure and liquidity risk are disclosed in Note 31.
(iii) Trade and other payables are unsecured and usually paid within 60 days of recognition.
15. Current Provisions
Employee benefi ts 315 292
Restoration 4,334 -
4,649 292
Movements in restoration provision
As at 1 January - -
Arising during the year 4,620 -
Unwinding and discount rate adjustment - -
Currency translation difference (286) -
Net carrying value 4,334 -
Nature and timing of the restoration provision:
The Group has recognised a provision for restoration related to the estimated cost of restoration work required at the end of the
useful life of the Tindalo oil fi eld, including removal of facilities and equipment required or intended to be removed, together with
abandonment of producing wells. These estimates of restoration are subject to signifi cant estimates and assumptions; refer
Note 1(q).
For
per
sona
l use
onl
y

NIDO PETROLEUM ANNUAL REPORT 2010 73
NOTES TO THE FINANCIAL STATEMENTSFor the year ended 31 December 2010
16. Non-Current Provisions
Employee benefi ts 132 -
Restoration 4,951 5,468
5,083 5,468
Movements in restoration provision
As at 1 January 5,468 6,042
Arising during the year - 689
Unwinding and discount rate adjustment 152 104
Currency translation difference (669) (1,367)
Net carrying value 4,951 5,468
Nature and timing of the restoration provision:
The Group has recognised a provision for restoration related to the estimated cost of restoration work required at the end of the useful
life of the producing fi elds, including removal of facilities and equipment required or intended to be removed, together with abandonment
of producing wells. These estimates of restoration are subject to signifi cant estimates and assumptions; refer Note 1(q).
17. Convertible Note
Current
Accrued interest 77 153
Derivative fi nancial instrument 1,775 9,740
Financial liability measured at amortised cost 7,231 11,324
9,083 21,217
Non-Current
Financial liability measured at amortised cost - 6,766
The debt component of the note is recorded at amortised cost. The fair value of the debt component as at 31 December 2010 is
$7,717,935 (2009: $17,169,000).
(a) Nature and fair value
The Company issued an unsecured, unsubordinated Convertible Note (“Note”) with a principal amount of US$22 million ($27.8 million)
and a term of fi ve years at 8.5% interest pursuant to a private placement on 1 September 2006. The principal terms and conditions of
the Convertible Note are as follows:
(i) Bond holder – Merrill Lynch International (Australia) Limited;
(ii) Maturity date – September 2011 (5 years from issue) – US$22 million principal amount if not converted. Repaid in 8 instalments in
Years 4 and 5;
(iii) Interest payable at 8.5% per annum with interest accruing but unpaid in the fi rst 18 months and thereafter payable quarterly;
(iiii) Initial conversion price is $0.26. The initial conversion price of $0.26 can be reset downwards if the volume weighted average
share price is below the conversion price on the reset date. The reset date occurs every six months. The reset is restricted to a
maximum of 114,307,091 shares;
(iv) On 1 March 2009 the conversion price was reset from $0.23 to $A0.08 per share, with the bond now convertible into a maximum
of 114,307,091 shares;
(v) Early redemption is at the option of the Company - At any time after March 2008, the Company can redeem the Convertible Note
if the share price is 190% above the initial conversion price. This option does not apply if Merrill Lynch elects to disapply the reset
provision.
During the fi rst half of 2010 the Company negotiated and completed a restructuring of the Notes held by Merrill Lynch International
(Australia) Limited. The key amendments to the terms of the Notes include:
1. Option to defer principal repayments of US$ 2.75 million due on 1 March 2010 and / or 1 June 2010 (total potential deferral of
US$ 5.5 million);
2. Repayment of any principal amounts deferred will be six months after the original due date (1 September and 1 December 2010);
3. Interest rate specifi cally relating to the deferred principal repayments of 10.95%. All other amounts payable under the Note still
accrue interest at 8.5%.
For
per
sona
l use
onl
y

NIDO PETROLEUM ANNUAL REPORT 2010 74
NOTES TO THE FINANCIAL STATEMENTSFor the year ended 31 December 2010
17. Convertible Note - continued
The Company elected to defer both the March and June 2010 principal repayments of US$ 2.75 million each during the year.
In September 2010 the company further renegotiated and completed a restructuring of the Notes held by Merrill Lynch International
(Australia) Limited. The key amendments to the terms of the Notes from the second restructure include:
1. Each of the repayments due in September and December 2010 was reduced to US$3.0 million (originally US$5.5 million for each
payment);
2. In 2011 the quarterly repayments will be restructured as follows: March 2011 US$3.5 million (originally US$2.75 million), June
2011 US$2.0 million (originally US$2.75 million) and September 2011 the balance due net after any further conversions made;
3. Interest rate specifi cally relating to the deferred balance of principal repayments originally due of 10.95%. All other amounts payable
under the Bond continue to accrue interest at 8.5%;
4. No change has occurred to the underlying debt due to the restructure, and the debt remains to be paid in full by 1 September
2011. In addition, the Convertible Notes at restructure date was still only convertible into a maximum of 114,307,091 shares at
AU$0.08 per share.
In addition, Merrill Lynch International (Australia) Limited made the following conversions during the 2010 year:
1. US$1 million worth of Notes on 9 June 2010 resulting in the issuance of 15,247,621 ordinary shares;
2. US$1 million worth of Notes on 16 June 2010 resulting in the issuance of 14,595,983 ordinary shares;
3. US$2 million worth of Notes on 7 October 2010 resulting in the issuance of 26,891,943 ordinary shares.
The impact of the conversions resulted in a total of 56,735,547 shares being issued in 2010, with the remaining Notes convertible into
a maximum of 57,571,544 shares. The conversion proceeds were applied directly against the remaining underlying outstanding debt.
The note has been classifi ed into two components: a debt component (a contractual arrangement to deliver cash) and an embedded
derivative call option component (a call option granting the holder the right, for a specifi ed period of time, to convert it into a number of
ordinary shares of Nido, based on the outstanding balance at date of conversion).
The carrying value of the embedded derivative is carried at its fair value. The value of the embedded derivative has been determined
using a Black Scholes option pricing model taking into account factors such as share price volatility, expected life, exercise price and
current share price. The assumptions used were as follows:
2010 2009
Dividend yield (%) - -
Expected volatility (%) 70% 80%
Risk-free interest rate (%) 4.85% 3.7% to 4.5%
Expected life of note (years) 0.7 years 0.4 to 1.7 years
Note exercise price ($) 0.08 0.08
Share price at year end ($) 0.115 0.185
Over the term of the note, the call option will be fair valued at each balance date and the movement in fair value will be recorded through
the Income Statement. For example, if the share price in the Company increases, the value of the call option will increase, resulting in an
increase to the liability reported in the Balance Sheet and an expense in the Income Statement.
Over the term of the note, the carrying value of the debt component will be accreted to US$ 18 million (the US$22 million original
principal amount less US$ 4 million in conversions) using the effective interest rate method. This accretion and exchange rate
differences between the US dollar and the Australian dollar will be charged or credited to the Income Statement.
At 31 December 2010 the underlying debt due to Merrill Lynch, assuming no further conversion of Notes will occur or the remaining
Notes are not previously redeemed, is US$9.2 million plus interest (2009: US$19.2 million), subject to terms and conditions detailed
above.
Note, subsequent to year end Merrill Lynch International (Australia) Limited converted a further US$ 2.6 million in Notes, Refer to Note 32.
For
per
sona
l use
onl
y

NIDO PETROLEUM ANNUAL REPORT 2010 75
NOTES TO THE FINANCIAL STATEMENTSFor the year ended 31 December 2010
(b) Risk exposures
Details regarding foreign exchange, interest rate risk exposure and liquidity risk are disclosed in Note 31.
Consolidated
2010$’000
2009
$’000
18. Contributed Equity
Issued and fully paid ordinary shares 149,805 117,236
The Company’s shares have no par value and there is no limit to the amount of authorised capital. Fully paid ordinary shares carry one
vote per share and carry the right to dividends.
(a) Movement of shares on issue
2010 2009
Number of Shares
$’000 Number of Shares
$’000
Beginning of the year
Issued during the year: 1,050,814,774 117,236 1,050,814,774 117,247
• Conversion of convertible bonds (Note 17) 56,735,547 4,539 - -
• Issues of new shares (i) 233,080,000 29,135 - -
• Exercise of options and Performance Rights(ii) - - - -
• Less transaction costs - (1,105) - (11)
End of the year 1,340,630,321 149,805 1,050,814,774 117,236
(i) On 4 November 2010, Nido completed a placement of 159,000,000 shares at 12.5 cents each (2009: no placements). A Share
purchase plan was completed on 8 December 2010 with the issue of 74,080,000 shares.
(ii) There were no unlisted options or Performance Rights exercised for the period ended 31 December 2010 (2009: none).
(b) Options and Performance Rights on Issue
The total number of options and Performance Rights on issue as at 31 December 2010 is 16,750,000 options and 7,027,738
Performance Rights (2009: 26,550,000 options). Refer to Notes 20 and 23.
When managing capital, management’s objective is to ensure the entity continues as a going concern as well as to maintain
optimal returns to shareholders and benefi ts for other stakeholders. Management also aims to maintain a capital structure that
ensures the lowest cost of capital available to the entity.
Management may in the future adjust the capital structure to take advantage of favourable costs of capital and issue further shares
in the market. Management has no current plans to adjust the capital structure. There are no plans to distribute dividends in the
next year.
The Group is not subject to any externally imposed capital requirements.
The gearing ratios based on operations at 31 December 2010 and 2009 were as follows:
Consolidated
2010$’000
2009
$’000
Total borrowings * 26,219 24,150
Less cash and cash equivalents (24,216) (17,091)
Net debt 2,003 7,059
Total equity 51,591 58,701
Total capital 53,594 65,760
* Includes interest bearing loans and borrowings and trade and other payables. Trade and other payables for the group as at 31 December
2010 is $18,911,000 (2009: $5,907,000).
Gearing ratio ** 4% 11%
** Gearing excluding trade and other payables for the group is (49)% (2009: 1.9%).
For
per
sona
l use
onl
y

NIDO PETROLEUM ANNUAL REPORT 2010 76
NOTES TO THE FINANCIAL STATEMENTSFor the year ended 31 December 2010
19. Reserves
Share-based payment reserve 7,714 7,605
Foreign currency translation reserve 5,251 1,665
12,965 9,270
Nature and purpose of reserves:
Share-based payment reserve
The share-based payment reserve is used to record the value of share based payments provided to employees, including Key
Management Personnel, as part of their remuneration. Refer to Note 23 for further details of employee share based remuneration plans.
Foreign currency translation reserve
The foreign currency translation reserve is used to record exchange differences arising from the translation of the fi nancial statement of
foreign subsidiaries.
20. Earnings Per Share
The following refl ects the income and share data used in the calculations of basic and diluted earnings per share. Details of options are
set out in Note 23.
(a) Earnings used in calculating earnings per share
For basic earnings per share:
Net profi t/(loss) (43,374) (28,252)
(b) Weighted average number of shares
2010#
2009#
Weighted average number of ordinary shares used in the calculation of the basic
earnings per share. 1,107,619,862 1,050,814,774
Options and Performance Rights to employees, including key management personnel, totalling 23,777,738 and the shares to be issued
for the conversion of the Convertible Notes are excluded from the calculation of diluted earnings per share because they are anti-dilutive.
There have been no transactions involving ordinary shares or potential ordinary shares that would signifi cantly change the number
of ordinary shares or potential ordinary shares outstanding between the reporting date and the date of completion of these Financial
Statements.
(c) Information on the classifi cation of securities
(i) Options and Performance Rights
Options and Performance Rights granted to employees (including key management personnel) as described in Note 23 are
considered to be potential ordinary shares but have been excluded in the determination of diluted earnings per share as they
are considered to be anti-dilutive for the periods presented.
(ii) Convertible Notes
The Convertible Notes as described in Note 17 are considered to be potential ordinary shares but have been excluded in the
determination of diluted earnings per share as they are considered to be anti-dilutive for the periods presented.
21. Dividends paid and proposed
No dividend has been paid or declared during the 2010 and 2009 fi nancial years.For
per
sona
l use
onl
y

NIDO PETROLEUM ANNUAL REPORT 2010 77
NOTES TO THE FINANCIAL STATEMENTSFor the year ended 31 December 2010
22. Operating Segments
Identifi cation of reportable segments
The Group has identifi ed its operating segments based on the internal reports that are reviewed and used by the Chief Executive
Offi cer and his management team (the chief operating decision makers) in assessing performance and in determining the allocation of
resources.
The operating segments are identifi ed by management based on the phase of operation within the oil and gas industry. Discrete
fi nancial information about each of these operating businesses is reported to the Chief Executive Offi cer and his management team on
at least a monthly basis.
The reportable segments are based on aggregated operating segments determined by the similarity of activity type and phase of
operations, as these are the sources of the Group’s major risks and have the most effect on the rates of return.
Reportable Operating Segments Identifi ed
For management purposes, the Group has organised its operating segments into two reportable segments as follows:
• Production & Development Assets Segment: This segment includes oil producing assets and assets and activities that are in the
development phase but have not yet achieved fi rst oil and/or gas production
• Exploration and Evaluation Assets Segment: This segment includes assets and activities that are associated with the determination
and assessment of the existence of commercial economic reserves.
Management monitors the operating results of its business units separately for the purpose of making decisions about resource
allocation and performance assessment. Segment performance is evaluated based on operating profi t or loss and is measured
consistently with operating profi t or loss in the consolidated Financial Statements. However, the Group’s fi nancing (including fi nance
costs, fi nance income and foreign exchange movements) are managed on a group basis and are not allocated to operating segments.
Accounting Policies
The accounting policies used by the Group in reporting segments internally are the same as those contained in Note 1 to the accounts.
Income tax expense is allocated to the appropriate segments based on the taxable profi ts generated by each segment.
There have been no inter-segment transactions.
It is the Group’s policy that if items of revenue and expense are not allocated to operating segments then any associated assets and
liabilities are also not allocated to segments. This is to avoid asymmetrical allocations within segments which management believe would
be inconsistent.
The following items are not allocated to segments as they are not considered part of core operations of any segment and are managed
on a Group basis.
• Fair value gain/(loss) on embedded derivatives
• Net gains on disposal of available for sale of assets
• Finance costs and revenues
• Interest revenue
• Foreign currency gains/(losses)
• Corporate costs
For
per
sona
l use
onl
y
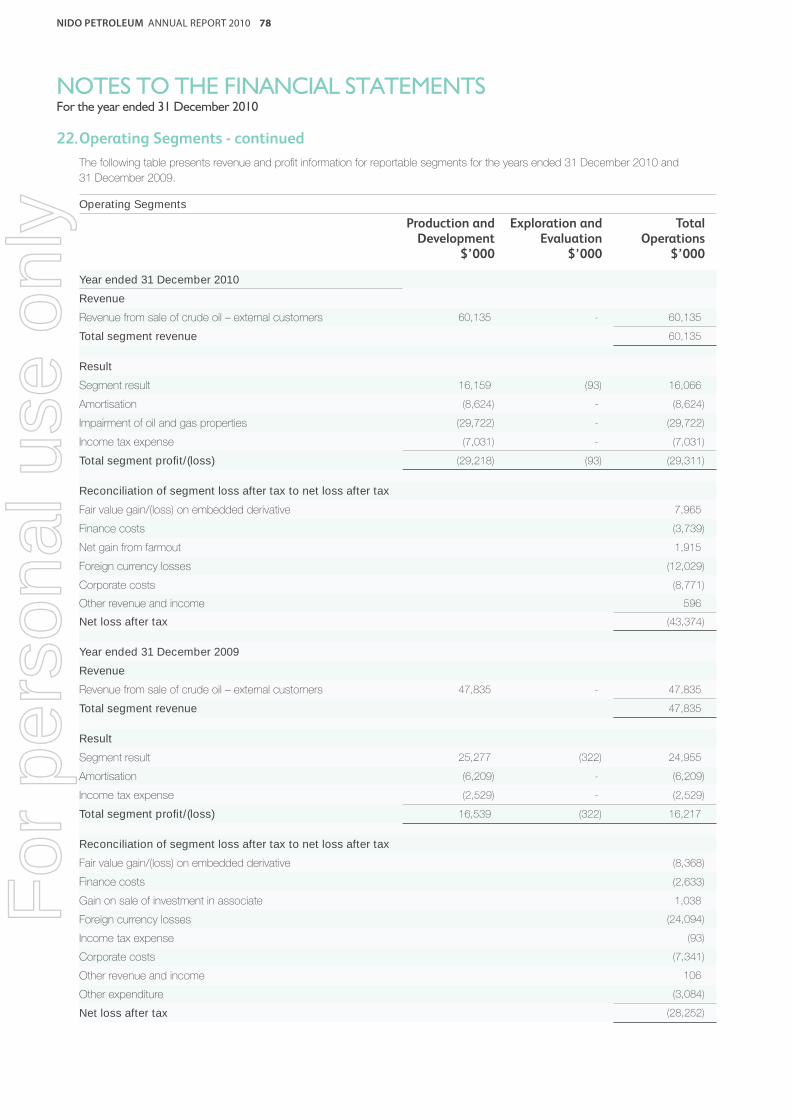
NIDO PETROLEUM ANNUAL REPORT 2010 78
NOTES TO THE FINANCIAL STATEMENTSFor the year ended 31 December 2010
22. Operating Segments - continued
The following table presents revenue and profi t information for reportable segments for the years ended 31 December 2010 and
31 December 2009.
Operating Segments
Production and Development
$’000
Exploration and Evaluation
$’000
Total Operations
$’000
Year ended 31 December 2010
Revenue
Revenue from sale of crude oil – external customers 60,135 - 60,135
Total segment revenue 60,135
Result
Segment result 16,159 (93) 16,066
Amortisation (8,624) - (8,624)
Impairment of oil and gas properties (29,722) - (29,722)
Income tax expense (7,031) - (7,031)
Total segment profi t/(loss) (29,218) (93) (29,311)
Reconciliation of segment loss after tax to net loss after tax
Fair value gain/(loss) on embedded derivative 7,965
Finance costs (3,739)
Net gain from farmout 1,915
Foreign currency losses (12,029)
Corporate costs (8,771)
Other revenue and income 596
Net loss after tax (43,374)
Year ended 31 December 2009
Revenue
Revenue from sale of crude oil – external customers 47,835 - 47,835
Total segment revenue 47,835
Result
Segment result 25,277 (322) 24,955
Amortisation (6,209) - (6,209)
Income tax expense (2,529) - (2,529)
Total segment profi t/(loss) 16,539 (322) 16,217
Reconciliation of segment loss after tax to net loss after tax
Fair value gain/(loss) on embedded derivative (8,368)
Finance costs (2,633)
Gain on sale of investment in associate 1,038
Foreign currency losses (24,094)
Income tax expense (93)
Corporate costs (7,341)
Other revenue and income 106
Other expenditure (3,084)
Net loss after tax (28,252)
For
per
sona
l use
onl
y

NIDO PETROLEUM ANNUAL REPORT 2010 79
NOTES TO THE FINANCIAL STATEMENTSFor the year ended 31 December 2010
22. Operating Segments - continued
Major Customers and Geographical Areas
Revenue received from the sale of crude oil, which is attributable solely to the Production and Development Operating Segment, was
comprised of fi ve different buyers who each on a proportionate basis equated to greater than 10% of total sales of crude oil for the
period.
Customer
2010Revenue received from
Sale of Crude Oil $’000
2009Revenue received from
Sale of Crude Oil $’000
# 1 30,329 14,516
# 2 7,302 10,154
# 3 6,838 9,962
# 4 6,480 6,520
# 5 6,103 5,422
Other 3,083 1,261
Total 60,135 47,835
The principal activities of the consolidated entity during the fi nancial year, which occurred primarily in the Philippines, included:
• Exploration for oil and gas;
• Development of oil properties; and
• Production and sale of oil.
Revenue from external customers by geographical locations is detailed below. Revenue is attributed to geographic locations based on
the location of customers. The company does not have external revenues from external customers that are attributable to any other
foreign country other than as shown.
Country
2010Revenue received from
Sale of Crude Oil $’000
2009Revenue received from
Sale of Crude Oil $’000
South Korea 49,749 21,036
Japan 7,302 5,423
Philippines 2,631 10,154
Thailand 453 9,962
Other foreign countries - 1,260
Total Revenue 60,135 47,835
For
per
sona
l use
onl
y

NIDO PETROLEUM ANNUAL REPORT 2010 80
NOTES TO THE FINANCIAL STATEMENTSFor the year ended 31 December 2010
22. Operating Segments - continued
Segment assets, liabilities and capital expenditure were as follows:
Operating Segments
Production and Development
$’000
Exploration and Evaluation
$’000
Total Operations
$’000
Segment Operating Assets
31 December 2010 41,871 26,550 68,421
Reconciliation of segment assets to total assets
Unallocated other assets 21,287
Total Assets 89,708
Segment Operating Liabilities
31 December 2010 24,639 215 24,854
Reconciliation of segment liabilities to total liabilities
Unallocated liabilities – Convertible Note 9,083
Unallocated liabilities – other 4,180
Total Liabilities 38,117
Segment Capital Expenditure
31 December 2010 13,553 4,284 17,837
Reconciliation of capital expenditure to total capital expenditure
Unallocated additions 129
Total Capital Expenditure 17,966
Assets – 2010
For the year ended 31 December 2010 operating assets for the Production and Development segment amounting to $41,871,000
consisted primarily of oil properties $19,220,000, trade and other receivables $14,290,000, cash and cash equivalents $3,824,000
and crude oil inventory $4,537,000.
Operating assets for the Exploration and Evaluation segment amounting to $26,550,000 consisted primarily of exploration and
evaluation assets $25,761,000 and long lead item inventory $789,000.
Unallocated other assets amounting to $21,287,000 consisted primarily of cash and cash equivalents $20,392,000 and plant and
equipment $420,000, trade and other receivables $335,000 and other non-current fi nancial assets $140,000.
The percentage of the location of non-current assets other than fi nancial instruments for the year ended 31 December 2010 is 99%
within the Philippines and 1% within Australia.
For
per
sona
l use
onl
y

NIDO PETROLEUM ANNUAL REPORT 2010 81
NOTES TO THE FINANCIAL STATEMENTSFor the year ended 31 December 2010
22. Operating Segments - continued
2009
Segment assets, liabilities and capital expenditure were as follows:
Operating Segments
Production and Development
$’000
Exploration and Evaluation
$’000
Total Operations
$’000Segment Operating Assets
31 December 2009 62,049 26,702 88,751
Reconciliation of segment assets to total assets
Unallocated other assets 10,324
Total Assets 99,075
Segment Operating Liabilities
31 December 2009 9,581 2,199 11,780
Reconciliation of segment liabilities to total liabilities
Unallocated liabilities – Convertible Note 27,983
Unallocated liabilities – other 611
Total Liabilities 40,374
Segment Capital Expenditure
31 December 2009 475 7,709 8,184
Reconciliation of capital expenditure
to total capital expenditure
Unallocated additions 82
Total Capital Expenditure 8,266
Assets – 2009
For the year ended 31 December 2009 operating assets for the Production and Development segment amounting to $62,049,000
consisted primarily of oil properties $45,127,000, trade and other receivables $7,083,000, cash and cash equivalents $8,218,000 and
crude oil inventory $1,621,000.
Operating assets for the Exploration and Evaluation segment amounting to $26,702,000 consisted primarily of exploration and
evaluation assets $26,142,000, cash held in Joint Venture $12,000 and long lead item inventory $548,000.
Unallocated other assets amounting to $10,324,000 consisted primarily of cash and cash equivalents $8,873,000 and plant and
equipment $651,000, trade and other receivables $610,000, other current fi nancial assets $50,000 and other non-current fi nancial
assets $140,000.
The percentage of the location of non-current assets other than fi nancial instruments for the year ended 31 December 2009 is 99%
within the Philippines and 1% within Australia.
For
per
sona
l use
onl
y
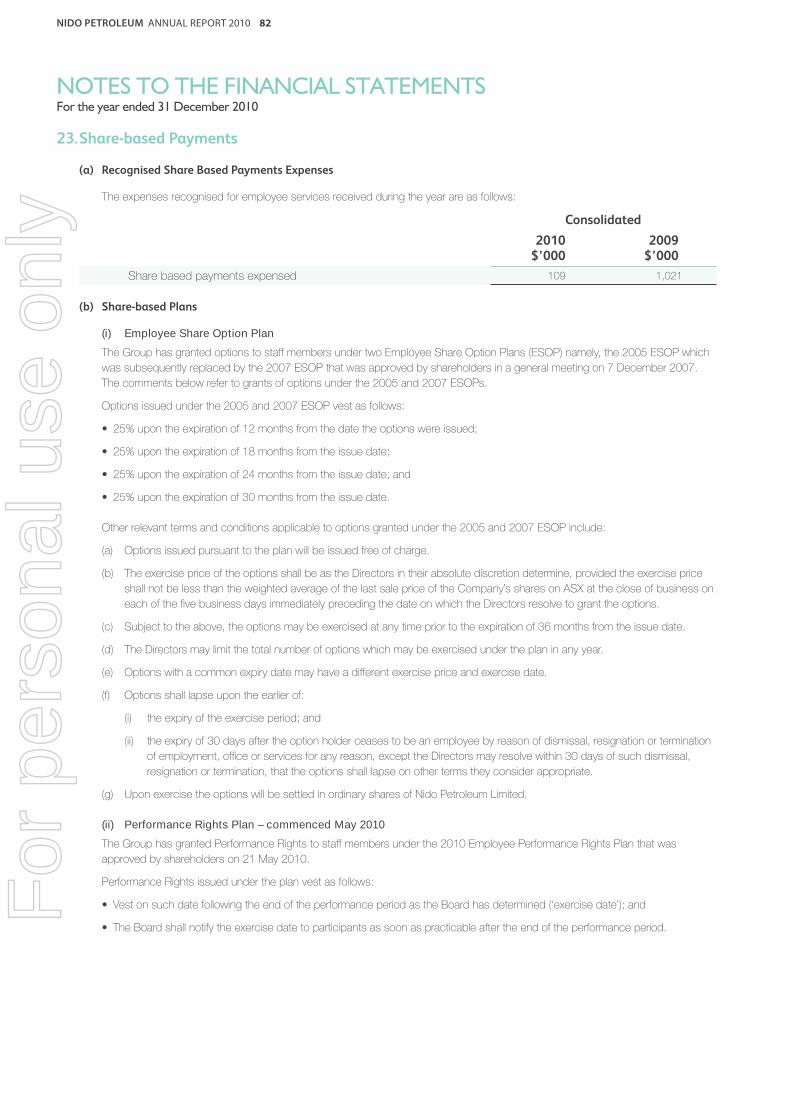
NIDO PETROLEUM ANNUAL REPORT 2010 82
NOTES TO THE FINANCIAL STATEMENTSFor the year ended 31 December 2010
23. Share-based Payments
(a) Recognised Share Based Payments Expenses
The expenses recognised for employee services received during the year are as follows:
Consolidated
2010$’000
2009$’000
Share based payments expensed 109 1,021
(b) Share-based Plans
(i) Employee Share Option Plan
The Group has granted options to staff members under two Employee Share Option Plans (ESOP) namely, the 2005 ESOP which
was subsequently replaced by the 2007 ESOP that was approved by shareholders in a general meeting on 7 December 2007.
The comments below refer to grants of options under the 2005 and 2007 ESOPs.
Options issued under the 2005 and 2007 ESOP vest as follows:
• 25% upon the expiration of 12 months from the date the options were issued;
• 25% upon the expiration of 18 months from the issue date;
• 25% upon the expiration of 24 months from the issue date; and
• 25% upon the expiration of 30 months from the issue date.
Other relevant terms and conditions applicable to options granted under the 2005 and 2007 ESOP include:
(a) Options issued pursuant to the plan will be issued free of charge.
(b) The exercise price of the options shall be as the Directors in their absolute discretion determine, provided the exercise price
shall not be less than the weighted average of the last sale price of the Company’s shares on ASX at the close of business on
each of the fi ve business days immediately preceding the date on which the Directors resolve to grant the options.
(c) Subject to the above, the options may be exercised at any time prior to the expiration of 36 months from the issue date.
(d) The Directors may limit the total number of options which may be exercised under the plan in any year.
(e) Options with a common expiry date may have a different exercise price and exercise date.
(f) Options shall lapse upon the earlier of:
(i) the expiry of the exercise period; and
(ii) the expiry of 30 days after the option holder ceases to be an employee by reason of dismissal, resignation or termination
of employment, offi ce or services for any reason, except the Directors may resolve within 30 days of such dismissal,
resignation or termination, that the options shall lapse on other terms they consider appropriate.
(g) Upon exercise the options will be settled in ordinary shares of Nido Petroleum Limited.
(ii) Performance Rights Plan – commenced May 2010
The Group has granted Performance Rights to staff members under the 2010 Employee Performance Rights Plan that was
approved by shareholders on 21 May 2010.
Performance Rights issued under the plan vest as follows:
• Vest on such date following the end of the performance period as the Board has determined (‘exercise date’); and
• The Board shall notify the exercise date to participants as soon as practicable after the end of the performance period.
For
per
sona
l use
onl
y

NIDO PETROLEUM ANNUAL REPORT 2010 83
NOTES TO THE FINANCIAL STATEMENTSFor the year ended 31 December 2010
23. Share-based Payments - continued
(b) Share-based Plans - continued
(ii) Performance Rights Plan – continued
Other relevant terms and conditions applicable to Performance Rights granted under the plan include:
• The number of Performance Rights exercisable on an exercise date will be solely determined by Nido’s Performance Ranking
over the Performance Period and to the extent that any Performance Rights do not become exercisable on an Exercise Date,
those remaining Rights (in the Tranche) shall automatically lapse.
• The Performance Period will be the period commencing on the Commencement Date and ending 36 months later.
• Nido’s Performance Ranking for a Performance Period is determined by reference to the Total Shareholder Return of Nido during
the Performance Period as compared to the Total Shareholder Return for each company in the Peer Group of Companies. A
Peer Group Company shall be excluded from the Peer Group if it is not listed on the ASX for the entire Performance Period.
If the number of companies in the Peer Group of Companies falls below sixteen, the Board shall have discretion to nominate
additional companies to be included in the Peer Group of Companies, provided that the number of companies in the Peer Group
of Companies shall not exceed eighteen. Nido’s ranking within that group of companies at the end of the relevant Performance
Period determines the number of Performance Rights in the particular Tranche that become exercisable (if any) on the following
basis:
Performance Ranking Range Number of Performance Rights exercisable
Below 50th percentile No Rights exercisable
50th percentile50% of the Rights in the Tranche available to be
exercised
51st percentile to 74th percentile For each Performance Ranking Range percentile
increase above 50%, the number of Performance
Rights exercisable in the Tranche increases by 2%
For example, if the Performance Ranking Range is at
the 52nd percentile, 54% of the Rights in the Tranche
are available to be exercised.
75th percentile or higher100% of Rights in the Tranche available to be
exercised.
The Peer Group comprises – Woodside Petroleum Limited, Otto Energy Limited, Kairiki Energy Limited, AWE Limited, Horizon Oil
Limited, Karoon Gas Limited, Mosaic Oil Limited, Victoria Petroleum NL, Nexus Energy Limited, New Zealand Oil and Gas Limited,
Tap Oil Limited, Oilex Limited, Oil Search Limited, Pan Pacifi c Petroleum NL, Roc Oil Limited, Stuart Petroleum Limited, AED Oil
Limited and Santos Limited.
• Where a Employee ceases to be employed by a company within the Group (and is not immediately employed by another
company within the Group) other than because of a qualifying reason (which includes total disability, or other circumstance
determined by the Board), subject to the exceptions noted below, any Rights of the Employee and any Associate Performance
Right Holder of the Employee relating to Performance Rights which have not already become exercisable will automatically lapse.
• Where an Employee ceases to be employed by a company within the Group (and is not immediately employed by another
company within the Group) for any reason after the Employee’s Performance Rights have vested but before Shares have been
allocated, Nido must allocate the number of Shares to which the Employee is entitled.
• The Board may, in its absolute discretion, allocate Shares, or the cash equivalent, to Employees at the end of the Performance
Period where, in the Board’s view, there are special circumstances under which it would be unfair not to allocate Shares.For
per
sona
l use
onl
y

NIDO PETROLEUM ANNUAL REPORT 2010 84
NOTES TO THE FINANCIAL STATEMENTSFor the year ended 31 December 2010
23. Share-based Payments - continued
(c) Summary of options and Performance Rights issued
Options
The following table summarises the number (No.) and the weighted average exercise price (WAEP) of, and movements in, share
options issued during the year to employees other than to key management personnel which have been disclosed in (i) below.
2010No.
2010WAEP
2009No.
2009WAEP
Outstanding at the beginning of the year 6,750,000 0.43 9,875,000 0.39
Granted during the year - - - -
Cancelled during the year - - (1,550,000) 0.39
Exercised during the year - - - -
Expired during the year (2,000,000) 0.34 (1,575,000) 0.25
Outstanding at the end of the year 4,750,000 0.47 6,750,000 0.43
Exercisable at the end of the year 4,262,500 0.46 3,587,500 0.39
The outstanding balance as at 31 December 2010 is represented by the following options over ordinary shares, exercisable upon
meeting the above terms and conditions:
• 2,600,000 options with an exercise price of $0.40 each, and varying expiry dates between 22 February 2011 and 19 March 2011.
• 2,150,000 options with an exercise price of $0.55 each, and varying expiry dates between 17 June 2011 and 8 September 2011.
Performance Rights
The following table summarises the number (No.) and movements in Performance Rights issued during the year to employees
other than to key management personnel which have been disclosed in (i) below.
2010No.
2009No.
Outstanding at the beginning of the year - -
Granted during the year 4,116,650 -
Cancelled during the year (1,000,783) -
Exercised during the year - -
Expired during the year - -
Outstanding at the end of the year 3,115,867 -
Exercisable at the end of the year - -
The outstanding balance as at 31 December 2010 is represented by the following performance shares, exercisable upon meeting
the performance terms and conditions:
• Issued on 30 April 2010 were 3,115,867 Performance Rights with no exercise price, and an expiry date of 30 April 2013.
(d) Weighted average remaining contractual life
The weighted average remaining contractual life for the share options outstanding at the end of the year is less than one year
(2009: 1-3 years ) and Performance Rights outstanding at the end of the year is 2.3 years (2009: nil).
(e) Weighted average fair value of options and Performance Rights granted
The weighted average fair value for the share options outstanding at the end of the year is $0.10 (2009: $0.10). The weighted
average fair value for the Performance Rights outstanding at the end of the year is $0.122 (2009: nil).
(f) Range of exercise prices
The range of exercise prices for options outstanding at the end of the year was $0.40-$0.55 (2009: $0.25-$0.55). The
Performance Rights have no exercise price.
For
per
sona
l use
onl
y
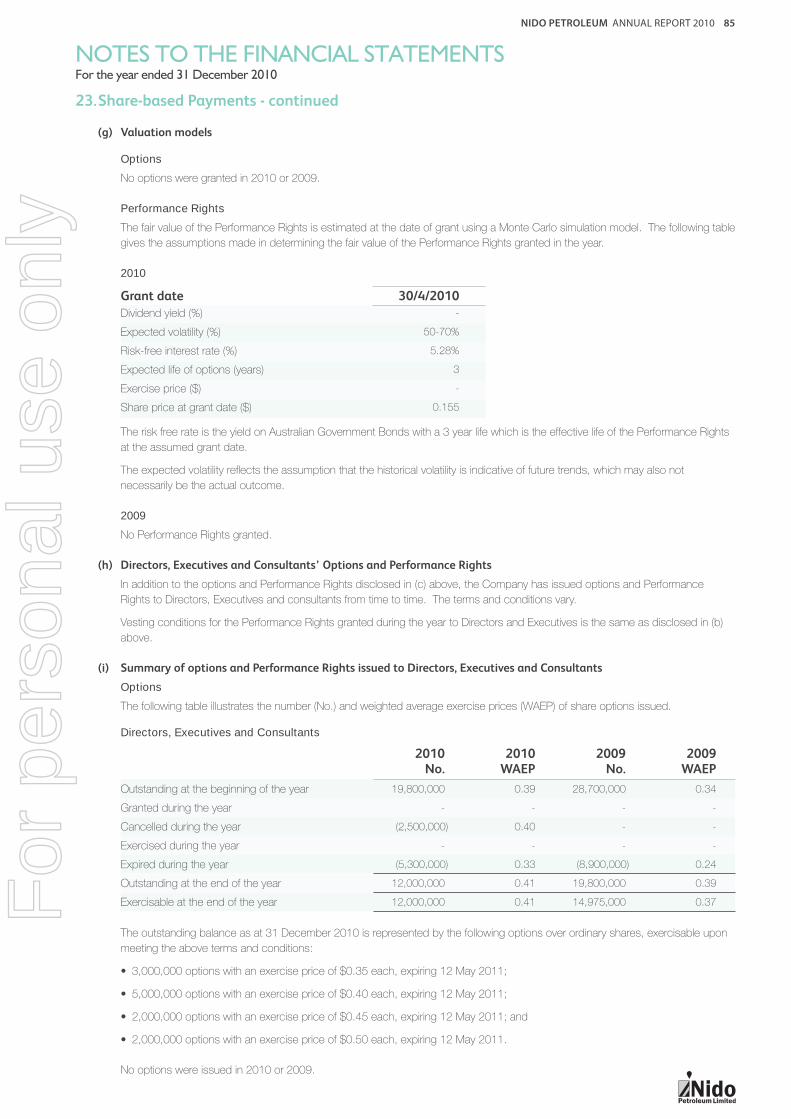
NIDO PETROLEUM ANNUAL REPORT 2010 85
NOTES TO THE FINANCIAL STATEMENTSFor the year ended 31 December 2010
23. Share-based Payments - continued
(g) Valuation models
Options
No options were granted in 2010 or 2009.
Performance Rights
The fair value of the Performance Rights is estimated at the date of grant using a Monte Carlo simulation model. The following table
gives the assumptions made in determining the fair value of the Performance Rights granted in the year.
2010
Grant date 30/4/2010
Dividend yield (%) -
Expected volatility (%) 50-70%
Risk-free interest rate (%) 5.28%
Expected life of options (years) 3
Exercise price ($) -
Share price at grant date ($) 0.155
The risk free rate is the yield on Australian Government Bonds with a 3 year life which is the effective life of the Performance Rights
at the assumed grant date.
The expected volatility refl ects the assumption that the historical volatility is indicative of future trends, which may also not
necessarily be the actual outcome.
2009
No Performance Rights granted.
(h) Directors, Executives and Consultants’ Options and Performance Rights
In addition to the options and Performance Rights disclosed in (c) above, the Company has issued options and Performance
Rights to Directors, Executives and consultants from time to time. The terms and conditions vary.
Vesting conditions for the Performance Rights granted during the year to Directors and Executives is the same as disclosed in (b)
above.
(i) Summary of options and Performance Rights issued to Directors, Executives and Consultants
Options
The following table illustrates the number (No.) and weighted average exercise prices (WAEP) of share options issued.
Directors, Executives and Consultants
2010No.
2010WAEP
2009No.
2009WAEP
Outstanding at the beginning of the year 19,800,000 0.39 28,700,000 0.34
Granted during the year - - - -
Cancelled during the year (2,500,000) 0.40 - -
Exercised during the year - - - -
Expired during the year (5,300,000) 0.33 (8,900,000) 0.24
Outstanding at the end of the year 12,000,000 0.41 19,800,000 0.39
Exercisable at the end of the year 12,000,000 0.41 14,975,000 0.37
The outstanding balance as at 31 December 2010 is represented by the following options over ordinary shares, exercisable upon
meeting the above terms and conditions:
• 3,000,000 options with an exercise price of $0.35 each, expiring 12 May 2011;
• 5,000,000 options with an exercise price of $0.40 each, expiring 12 May 2011;
• 2,000,000 options with an exercise price of $0.45 each, expiring 12 May 2011; and
• 2,000,000 options with an exercise price of $0.50 each, expiring 12 May 2011.
No options were issued in 2010 or 2009.
For
per
sona
l use
onl
y
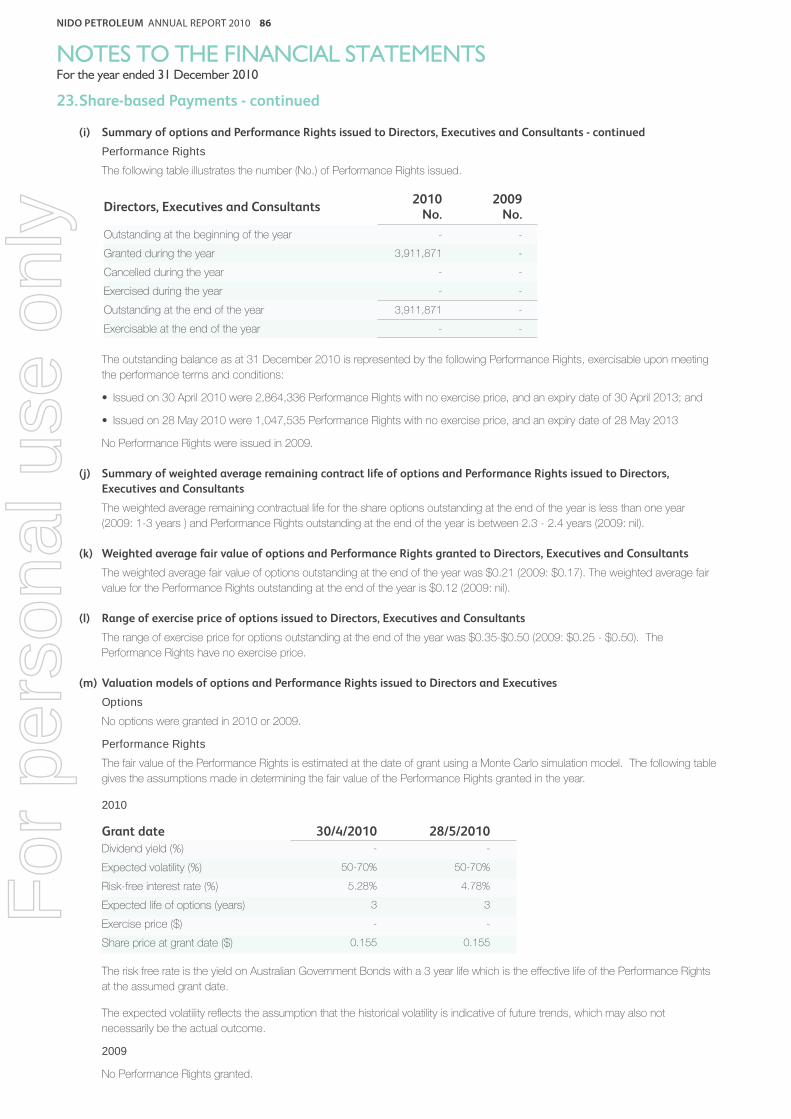
NIDO PETROLEUM ANNUAL REPORT 2010 86
NOTES TO THE FINANCIAL STATEMENTSFor the year ended 31 December 2010
23. Share-based Payments - continued
(i) Summary of options and Performance Rights issued to Directors, Executives and Consultants - continued
Performance Rights
The following table illustrates the number (No.) of Performance Rights issued.
Directors, Executives and Consultants2010
No.2009
No.
Outstanding at the beginning of the year - -
Granted during the year 3,911,871 -
Cancelled during the year - -
Exercised during the year - -
Outstanding at the end of the year 3,911,871 -
Exercisable at the end of the year - -
The outstanding balance as at 31 December 2010 is represented by the following Performance Rights, exercisable upon meeting
the performance terms and conditions:
• Issued on 30 April 2010 were 2,864,336 Performance Rights with no exercise price, and an expiry date of 30 April 2013; and
• Issued on 28 May 2010 were 1,047,535 Performance Rights with no exercise price, and an expiry date of 28 May 2013
No Performance Rights were issued in 2009.
(j) Summary of weighted average remaining contract life of options and Performance Rights issued to Directors,
Executives and Consultants
The weighted average remaining contractual life for the share options outstanding at the end of the year is less than one year
(2009: 1-3 years ) and Performance Rights outstanding at the end of the year is between 2.3 - 2.4 years (2009: nil).
(k) Weighted average fair value of options and Performance Rights granted to Directors, Executives and Consultants
The weighted average fair value of options outstanding at the end of the year was $0.21 (2009: $0.17). The weighted average fair
value for the Performance Rights outstanding at the end of the year is $0.12 (2009: nil).
(l) Range of exercise price of options issued to Directors, Executives and Consultants
The range of exercise price for options outstanding at the end of the year was $0.35-$0.50 (2009: $0.25 - $0.50). The
Performance Rights have no exercise price.
(m) Valuation models of options and Performance Rights issued to Directors and Executives
Options
No options were granted in 2010 or 2009.
Performance Rights
The fair value of the Performance Rights is estimated at the date of grant using a Monte Carlo simulation model. The following table
gives the assumptions made in determining the fair value of the Performance Rights granted in the year.
2010
Grant date 30/4/2010 28/5/2010
Dividend yield (%) - -
Expected volatility (%) 50-70% 50-70%
Risk-free interest rate (%) 5.28% 4.78%
Expected life of options (years) 3 3
Exercise price ($) - -
Share price at grant date ($) 0.155 0.155
The risk free rate is the yield on Australian Government Bonds with a 3 year life which is the effective life of the Performance Rights
at the assumed grant date.
The expected volatility refl ects the assumption that the historical volatility is indicative of future trends, which may also not
necessarily be the actual outcome.
2009
No Performance Rights granted.
For
per
sona
l use
onl
y

NIDO PETROLEUM ANNUAL REPORT 2010 87
NOTES TO THE FINANCIAL STATEMENTSFor the year ended 31 December 2010
Consolidated
24. Auditor’s Remuneration2010
$2009
$
The auditor of Nido Petroleum Limited is Ernst & Young.
Amounts received or due and receivable by Ernst & Young (Australia) for:
An audit or review of the Financial Report of the entity and any other entity in the
consolidated entity108,768 100,940
Other services in relation to the entity and any other entity in the consolidated
entity (tax and related services)64,490 92,644
173,258 193,584
Amounts received as due and receivable by related practices of Ernst & Young
(Australia) for:
Audit services - 19,433
Tax and related services - -
- 19,433
173,258 213,017
25. Notes to the Cash Flow Statement
(a) Reconciliation of profi t/(loss) from ordinary activities:
Profi t/(loss) from ordinary activities after income tax (43,374) (28,252)
Adjustments for:
Depreciation of plant and equipment 344 425
Amortisation of oil and gas properties 8,624 6,209
Unwind of the effect of discounting on provisions 46 104
Borrowing costs 61 146
Accretion expense 1,013 4
Fair value of Convertible Note (7,965) 8,368
Net exchange (gains)/losses 12,029 24,094
Share based payments 109 1,021
Loss/(gain) on disposal of plant and equipment 1 -
Gain on disposal of investments - (1,038)
Net gain from farmout (1,915) -
Exploration expenditure expensed 93 191
Loss on disposal of inventories 387
Impairment write-down of oil and gas properties 29,722 -
Changes in assets and liabilities:
(Increase)/decrease in receivables (8,333) (4,017)
(Increase)/decrease in inventories (3,736) 464
(Increase)/decrease in other fi nancial assets 12 1
Increase in payables 16,410 812
Increase in provisions 54 680
Net cash from/(used in) operating activities 3,195 9,599
(b) Non-cash fi nancing and investing activities:
Proceeds from issues of equity securities from conversion of Notes 4,538 -
Repayment of borrowings (4,538) -
During the year ended 31 December 2010, the Company reduced underlying debt outstanding to the Merrill Lynch Convertible
Note by US$4.0 million from the conversion of Notes resulting in the issuance of 56,735,547 ordinary shares. No cash was directly
received or paid by the Company.
For
per
sona
l use
onl
y

NIDO PETROLEUM ANNUAL REPORT 2010 88
NOTES TO THE FINANCIAL STATEMENTSFor the year ended 31 December 2010
26. Key Management Personnel Disclosures
(a) Compensation of Key Management Personnel
Consolidated
2010$
2009$
Short-term employment benefi ts 2,700,645 2,941,768
Post-employment benefi ts 260,451 281,271
Share based payment (49,033) 868,621
2,912,063 4,091,660
(b) Option Holdings of Key Management Personnel
2010Balance at 1 January
Granted asRemuneration
Options Exercised
Cancelled / Expired
Change due to Appointment /
(resignation)Balance at
31 DecVested and Exercisable
NonVested
Directors
W Bloking 5,000,000 - - - - 5,000,000 5,000,000 -
J de Dios 9,000,000 - - (2,000,000) - 7,000,000 7,000,000 -
Executives
J Pattillo 2,500,000 - - (2,500,000) - - - -
A Gilbert 800,000 - - (800,000) - - - -
A Francis 2,500,000 - - (2,500,000) - - - -
19,800,000 - - (7,800,000) - 12,000,000 12,000,000 -
2009
Directors
W Bloking 5,000,000 - - - - 5,000,000 5,000,000 -
J de Dios 9,000,000 - - - - 9,000,000 5,000,000 4,000,000
D Whitby 1,000,000 - - (1,000,000) - - - -
V Pérez 2,000,000 - - (2,000,000) - - - -
J Brown 1,000,000 - - (1,000,000) - - - -
Executives
J Williams 3,000,000 - - (3,000,000) - - - -
J Pattillo 2,500,000 - - - - 2,500,000 2,500,000 -
A Francis 2,500,000 - - - - 2,500,000 1,875,000 625,000
A Gilbert 1,850,000 - - (1,050,000) - 800,000 600,000 200,000
M Lamattina 250,000 - - (250,000) - - - -
28,100,000 - - (8,300,000) - 19,800,000 14,975,000 4,825,000
(c) Performance Rights Holdings of Key Management Personnel
2010Balance at 1 January
Granted asRemuneration
Performance Rights
ExercisedCancelled /
Expired
Change due to Appointment /
(Resignation)Balance at
31 DecVested and Exercisable
NonVested
Directors
J de Dios - 1,047,535 - - - 1,047,535 - 1,047,535
Executives
J Williams - 788,732 - - - 788,732 - 788,732
J Pattillo - 930,704 - - - 930,704 - 930,704
J Newman - 492,958 - - - 492,958 - 492,958
A Gilbert - 651,942 - - - 651,942 - 651,942
- 3,911,871 - - - 3,911,871 - 3,911,871
No Performance Rights were held in 2009.
For
per
sona
l use
onl
y

NIDO PETROLEUM ANNUAL REPORT 2010 89
NOTES TO THE FINANCIAL STATEMENTSFor the year ended 31 December 2010
26. Key Management Personnel Disclosures – continued
(d) Shareholdings of Key Management Personnel
2010Balance at1 January
On exercise of options /
Performance Rights
Change due to Appointment /
(Resignation)Net change
OtherBalance at
31 December
Directors
W Bloking - - - 1,320,000 1,320,000
J de Dios - - - 1,120,000 1,120,000
D Whitby 18,527,500 - - (1,000,000) 17,527,500
V Pérez - - - 1,000,000 1,000,000
A Edwards - - - 470,000 470,000
Executives
J Williams 2,650,000 - - 120,000 2,770,000
2010 Total 21,177,500 - - 3,030,000 24,207,500
2009
Directors
D Whitby 22,527,500 - - (4,000,000) 18,527,500
J Brown 3,000,000 - (3,000,000) - -
Executives
J Williams 4,200,000 - - (1,550,000) 2,650,000
M Lamattina 40,500 - - (40,500) -
P Quaife 5,000,000 - - (5,000,000) -
2009 Total 34,768,000 - (3,000,000) (10,590,500) 21,177,500
All equity transactions with Key Management Personnel other than those arising from the exercise of remuneration options and
Performance Rights have been entered into under terms and conditions no more favourable than those the entity would have
adopted if dealing at arm’s-length.
(e) Other transactions and balances with Directors and Executives
Transactions between related parties are on normal commercial terms and conditions no more favourable than those available to
other parties:
(i) Merritt Partners Pte Ltd, an entity in which V Pérez is a Non-Executive Director, was paid $71,300 (2009: $18,447) in
consultancy fees. At the end of the fi nancial year nil was payable (2009: nil);
(ii) Merritt Advisory Partners, Inc. an entity in which V Pérez is a Non-Executive Director, received no payment (2009: $62,702).
At the end of the fi nancial year nil was payable (2009: nil);
(iii) Vital Holdings Limited, an entity controlled by V Pérez, received no payment (2009: $29,250) in consultancy fees. At the end
of the fi nancial year nil was payable (2009: nil);
(iv) Australia Asia Energy Pty Ltd, an entity controlled by W Bloking, was paid $25,000 (2009: nil) in consultancy fees. At the end
of the fi nancial year nil was payable (2009: nil);
(v) TransEnergy International Ltd, an entity controlled by E Mañalac, was paid $15,000 (2009: nil) in consultancy fees. At the end
of the fi nancial year nil was payable (2009: nil);
Where applicable these amounts have been disclosed in the Remuneration Report as part of the Directors’ remuneration.
For
per
sona
l use
onl
y

NIDO PETROLEUM ANNUAL REPORT 2010 90
NOTES TO THE FINANCIAL STATEMENTSFor the year ended 31 December 2010
27. Expenditure Commitments
(a) Exploration Commitments
In order to maintain current rights of tenure to exploration permits, the consolidated entity has certain obligations to perform
minimum exploration work and expend minimum amounts of money. These commitments may be varied as a result of
renegotiations, relinquishments, farmouts, sales or carrying out work in excess of the permit obligations. The following exploration
expenditure requirements have not been provided for in the Financial Report and are payable:
Consolidated
2010 2009
$’000 $’000
Within one year 7,083 3,719
More than one year but not later than fi ve years 2,962 67
10,045 3,786
(b) Joint Venture Commitments
All of the consolidated entity’s commitments arise from its interest in Joint Ventures. The consolidated entity’s share of expenditures
contracted for at the balance date for which no amounts have been provided for in the Financial Statements are payable:
Within one year 2,861 15,465
(c) Non-cancellable Operating Lease Commitments
The consolidated entity has entered into non-cancellable operating leases for offi ce premises and its Galoc operations FPSO.
Commitments are as follows:
Within one year 9,581 10,470
More than one year but not later than fi ve years 138 35,238
9,719 45,708
(d) Remuneration Commitments
Commitments for the payment of salaries and other remuneration under long-term employment contracts in existence at the
reporting date but not recognised as liabilities, payable:
Within one year 913 906
Amounts disclosed are remuneration commitments relating to termination payments arising from the employment agreements of
employees other than Directors, Key Management Personnel and other executives. The amounts are not recognised as liabilities
and are not included in the Directors’ or Key Management Personnel Remuneration.
28. Interests in Joint Ventures
(a) Joint Venture details
The consolidated entity has the following Joint Venture interests:
Permit Country Principal Activity Average Interest
SC 14 Block A Philippines Oil and gas exploration 22.486%
SC 14 Block B Philippines Oil and gas exploration 28.283%
SC 14 Block C Philippines Oil and gas exploration 22.879%
SC 14 Block D Philippines Oil and gas exploration 31.417%
SC 6B Philippines Oil and gas exploration 7.812%
SC 54A Philippines Oil and gas exploration 42.4%(¹)
SC 54B Philippines Oil and gas exploration 60%(²)
SC 58 Philippines Oil and gas exploration 50%(3)
SC 63 Philippines Oil and gas exploration 50%
For
per
sona
l use
onl
y
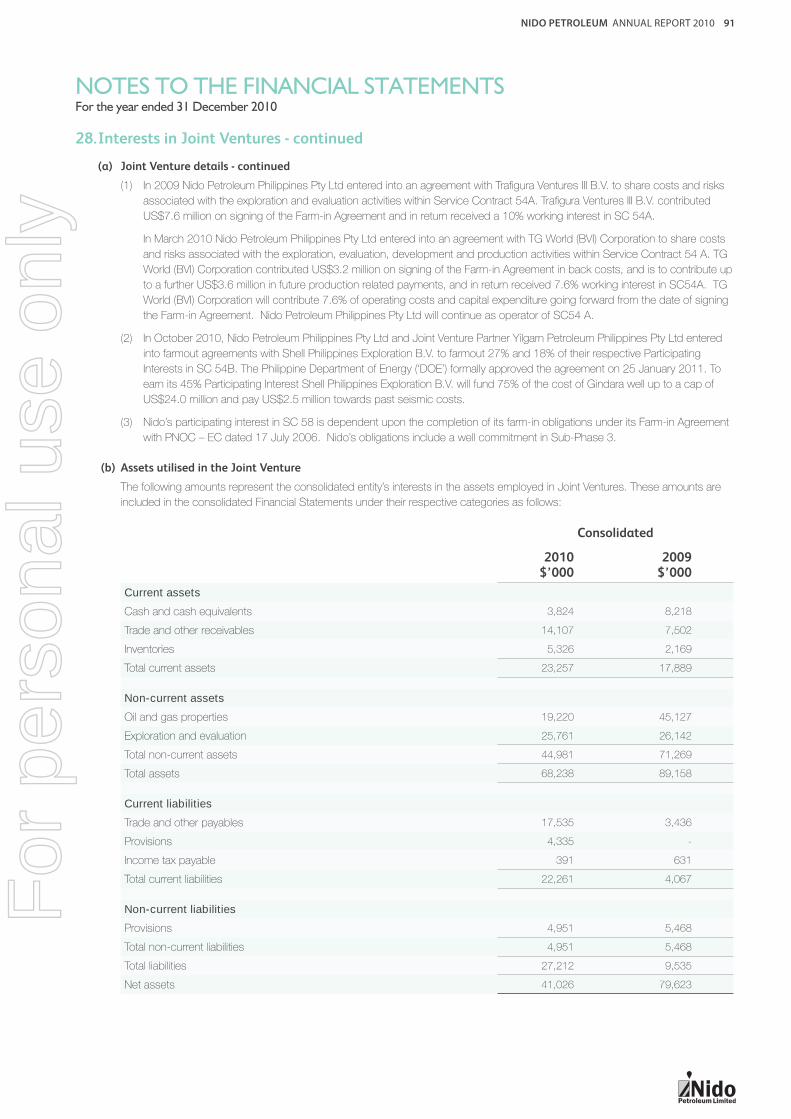
NIDO PETROLEUM ANNUAL REPORT 2010 91
NOTES TO THE FINANCIAL STATEMENTSFor the year ended 31 December 2010
28. Interests in Joint Ventures - continued
(a) Joint Venture details - continued
(1) In 2009 Nido Petroleum Philippines Pty Ltd entered into an agreement with Trafi gura Ventures III B.V. to share costs and risks
associated with the exploration and evaluation activities within Service Contract 54A. Trafi gura Ventures III B.V. contributed
US$7.6 million on signing of the Farm-in Agreement and in return received a 10% working interest in SC 54A.
In March 2010 Nido Petroleum Philippines Pty Ltd entered into an agreement with TG World (BVI) Corporation to share costs
and risks associated with the exploration, evaluation, development and production activities within Service Contract 54 A. TG
World (BVI) Corporation contributed US$3.2 million on signing of the Farm-in Agreement in back costs, and is to contribute up
to a further US$3.6 million in future production related payments, and in return received 7.6% working interest in SC54A. TG
World (BVI) Corporation will contribute 7.6% of operating costs and capital expenditure going forward from the date of signing
the Farm-in Agreement. Nido Petroleum Philippines Pty Ltd will continue as operator of SC54 A.
(2) In October 2010, Nido Petroleum Philippines Pty Ltd and Joint Venture Partner Yilgarn Petroleum Philippines Pty Ltd entered
into farmout agreements with Shell Philippines Exploration B.V. to farmout 27% and 18% of their respective Participating
Interests in SC 54B. The Philippine Department of Energy (‘DOE’) formally approved the agreement on 25 January 2011. To
earn its 45% Participating Interest Shell Philippines Exploration B.V. will fund 75% of the cost of Gindara well up to a cap of
US$24.0 million and pay US$2.5 million towards past seismic costs.
(3) Nido’s participating interest in SC 58 is dependent upon the completion of its farm-in obligations under its Farm-in Agreement
with PNOC – EC dated 17 July 2006. Nido’s obligations include a well commitment in Sub-Phase 3.
(b) Assets utilised in the Joint Venture
The following amounts represent the consolidated entity’s interests in the assets employed in Joint Ventures. These amounts are
included in the consolidated Financial Statements under their respective categories as follows:
Consolidated
2010$’000
2009$’000
Current assets
Cash and cash equivalents 3,824 8,218
Trade and other receivables 14,107 7,502
Inventories 5,326 2,169
Total current assets 23,257 17,889
Non-current assets
Oil and gas properties 19,220 45,127
Exploration and evaluation 25,761 26,142
Total non-current assets 44,981 71,269
Total assets 68,238 89,158
Current liabilities
Trade and other payables 17,535 3,436
Provisions 4,335 -
Income tax payable 391 631
Total current liabilities 22,261 4,067
Non-current liabilities
Provisions 4,951 5,468
Total non-current liabilities 4,951 5,468
Total liabilities 27,212 9,535
Net assets 41,026 79,623
For
per
sona
l use
onl
y
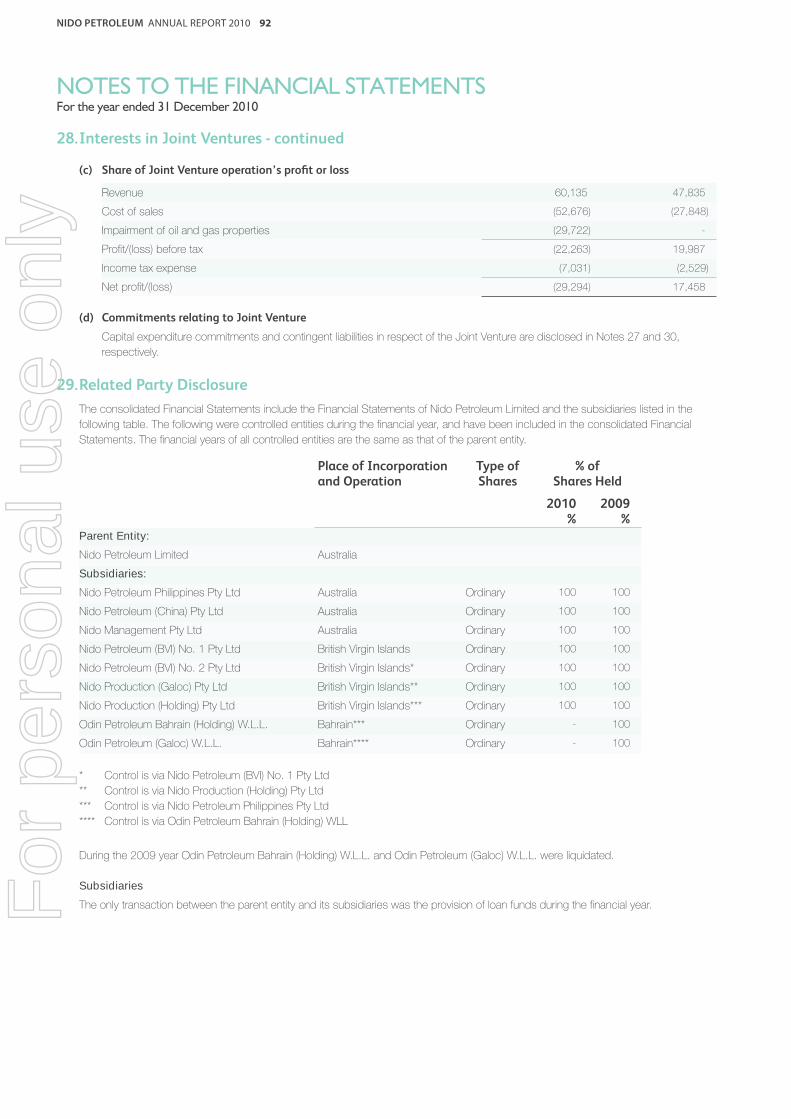
NIDO PETROLEUM ANNUAL REPORT 2010 92
NOTES TO THE FINANCIAL STATEMENTSFor the year ended 31 December 2010
28. Interests in Joint Ventures - continued
(c) Share of Joint Venture operation’s profi t or loss
Revenue 60,135 47,835
Cost of sales (52,676) (27,848)
Impairment of oil and gas properties (29,722) -
Profi t/(loss) before tax (22,263) 19,987
Income tax expense (7,031) (2,529)
Net profi t/(loss) (29,294) 17,458
(d) Commitments relating to Joint Venture
Capital expenditure commitments and contingent liabilities in respect of the Joint Venture are disclosed in Notes 27 and 30,
respectively.
29. Related Party Disclosure
The consolidated Financial Statements include the Financial Statements of Nido Petroleum Limited and the subsidiaries listed in the
following table. The following were controlled entities during the fi nancial year, and have been included in the consolidated Financial
Statements. The fi nancial years of all controlled entities are the same as that of the parent entity.
Place of Incorporationand Operation
Type ofShares
% ofShares Held
2010%
2009%
Parent Entity:
Nido Petroleum Limited Australia
Subsidiaries:
Nido Petroleum Philippines Pty Ltd Australia Ordinary 100 100
Nido Petroleum (China) Pty Ltd Australia Ordinary 100 100
Nido Management Pty Ltd Australia Ordinary 100 100
Nido Petroleum (BVI) No. 1 Pty Ltd British Virgin Islands Ordinary 100 100
Nido Petroleum (BVI) No. 2 Pty Ltd British Virgin Islands* Ordinary 100 100
Nido Production (Galoc) Pty Ltd British Virgin Islands** Ordinary 100 100
Nido Production (Holding) Pty Ltd British Virgin Islands*** Ordinary 100 100
Odin Petroleum Bahrain (Holding) W.L.L. Bahrain*** Ordinary - 100
Odin Petroleum (Galoc) W.L.L. Bahrain**** Ordinary - 100
* Control is via Nido Petroleum (BVI) No. 1 Pty Ltd
** Control is via Nido Production (Holding) Pty Ltd
*** Control is via Nido Petroleum Philippines Pty Ltd
**** Control is via Odin Petroleum Bahrain (Holding) WLL
During the 2009 year Odin Petroleum Bahrain (Holding) W.L.L. and Odin Petroleum (Galoc) W.L.L. were liquidated.
Subsidiaries
The only transaction between the parent entity and its subsidiaries was the provision of loan funds during the fi nancial year. For
per
sona
l use
onl
y
NIDO PETROLEUM ANNUAL REPORT 2010 93
NOTES TO THE FINANCIAL STATEMENTSFor the year ended 31 December 2010
30. Contingent Liabilities
(a) Guarantees
Nido Petroleum Limited has provided a letter of undertaking to the Department of Energy in the Philippines to provide technical and
fi nancial support to Nido Petroleum Philippines Pty Ltd in relation to work obligations in the SC 58 Farm-in Agreement executed
between PNOC Exploration Corporation and Nido Petroleum Philippines Pty Ltd on 17 July 2006.
Nido Petroleum Limited has provided a parent company guarantee to the Department of Energy in respect of the obligations of
Nido Production (Holding) Pty Ltd and Nido Production (Galoc) Pty Ltd under SC 14, to provide technical and fi nancial support to
these entities. Nido Petroleum Philippines Pty Ltd has also provided a letter of undertaking to the Joint Venture partners of SC 14
to guarantee the work obligations of Nido Production (Galoc) Pty Ltd under SC 14.
Nido Petroleum Philippines Pty Ltd has taken out a performance bond with Prudential Guarantee & Assurance Inc in relation to the
commitment well in Sub-Phase 6 in SC 54B for US$6.0 million which provides a guarantee and indemnity in the event of a lack of
performance by Nido Petroleum Philippines Pty Ltd. The performance bond is able to be called upon by the Department of Energy.
The bond will expire on 5 August 2011.
In relation to the commitment well in Sub-Phase 3 of SC 58, Nido Petroleum Philippines Pty Ltd has taken out a performance bond
with Prudential Guarantee & Assurance Inc for US$3.0 million which provides a guarantee and indemnity in the event of a lack of
performance by Nido Petroleum Philippines Pty Ltd. The performance bond is able to be called upon by the DOE. The bond will
expire on 12 January 2012.
(b) Employment Contracts – Change of Control
In the event of a Change of Control, employees, other than offi cers, who entered into employment contracts prior to 2009 have
the option to terminate their employment, in which case the employee will be paid a portion of their remuneration package varying
between six months and one year.
As at 31 December 2010, the total amount that would be payable was $913,232 (2009: $905,898).
Other than the above, as at the date of this Report there were no contingent liabilities.
31. Financial Risk Management Objectives and Policies
The Group’s principal fi nancial instruments comprise cash and short-term deposits and a Convertible Note.
The main purpose of these fi nancial instruments is to provide working capital for the Group’s operations.
The Group has various other fi nancial instruments such as trade debtors and trade creditors, which arise directly from its operations.
It is, and has been throughout the period under review, the Group’s policy that no trading in fi nancial instruments shall be undertaken.
The main risks arising from the Group’s fi nancial instruments are interest rate risk, liquidity risk, foreign currency, commodity risk and
credit risk. The Board reviews and agrees on policies for managing each of these risks.
For
per
sona
l use
onl
y

NIDO PETROLEUM ANNUAL REPORT 2010 94
NOTES TO THE FINANCIAL STATEMENTSFor the year ended 31 December 2010
31. Financial Risk Management Objectives and Policies - continued
Interest Rate Risk
At balance date the Group’s exposure to market risk for changes in interest rates relates primarily to the Company’s short-term cash
deposits. The Group is not exposed to cash fl ow volatility from interest rate changes on borrowings as the Convertible Note carries
a fi xed rate of interest of 8.5% per annum (10.95% per annum for any deferred principal repayments), though it is acknowledged
that there is an interest rate risk exposure that is a by-product of the calculation of the fair value of the derivative component of the
Convertible Note (refer to Note 17).
The Group constantly analyses its exposure to interest rates, with consideration given to potential renewal of existing positions, the mix
of fi xed and variable interest rates and the period to which deposits may be fi xed.
The Group currently manages its fi nance costs using only fi xed rate debt, which removes cash fl ow volatility from interest rate changes.
At balance date, the Group had the following cash fl ow risks arising from fi nancial assets exposed to variable interest rates that are not
designated in cash fl ow hedges:
Consolidated
2010 2009
$’000 $’000
Financial Assets:
Cash and cash equivalents 24,216 17,091
Trade and other receivables 1,685 25
Other fi nancial assets 2,952 6
Net exposure 28,853 17,122
The following sensitivity analysis is based on the interest rate risk exposures in existence at the Balance Sheet date. The 0.5%
sensitivity (2009: 0.5%) is based on reasonably possible changes, over a fi nancial year, using an observed range of historical London
Inter Bank Offer Rate (LIBOR) ($US) and RBA ($AUD) interest rates and movements over the last year.
At 31 December 2010, if interest rates had moved, as illustrated in the Table below, with all other variables held constant, post tax profi t
and equity relating to fi nancial assets of the Group would have been affected as follows:
Judgements of reasonably possible movements:
Post tax profi t - higher / (lower)
+ 0.5% (2009: +0.5%) 104 57
- 0.5% (2009: - 0.5%) (104) (57)
Equity - higher / (lower)
+ 0.5% (2009: +0.5%) - -
- 0.5% (2009: - 0.5%) - -
The movement in profi t in 2010 is greater than in 2009 due to the higher cash balance in 2010.
At 31 December 2010, if the interest rate applied to the fair value calculation of the derivative component of the Convertible Note had
moved, as illustrated in the table below, with all other variables held constant, post tax profi t and equity of the Group would have been
affected as follows:
Judgements of reasonably possible movements:
Post tax profi t - higher / (lower)
+ 0.5% (2009: +0.5%) (43) (108)
- 0.5% (2009: - 0.5%) 44 109
Equity - higher / (lower)
+ 0.5% (2009: +0.5%) - -
- 0.5% (2009: - 0.5%) - -
For
per
sona
l use
onl
y
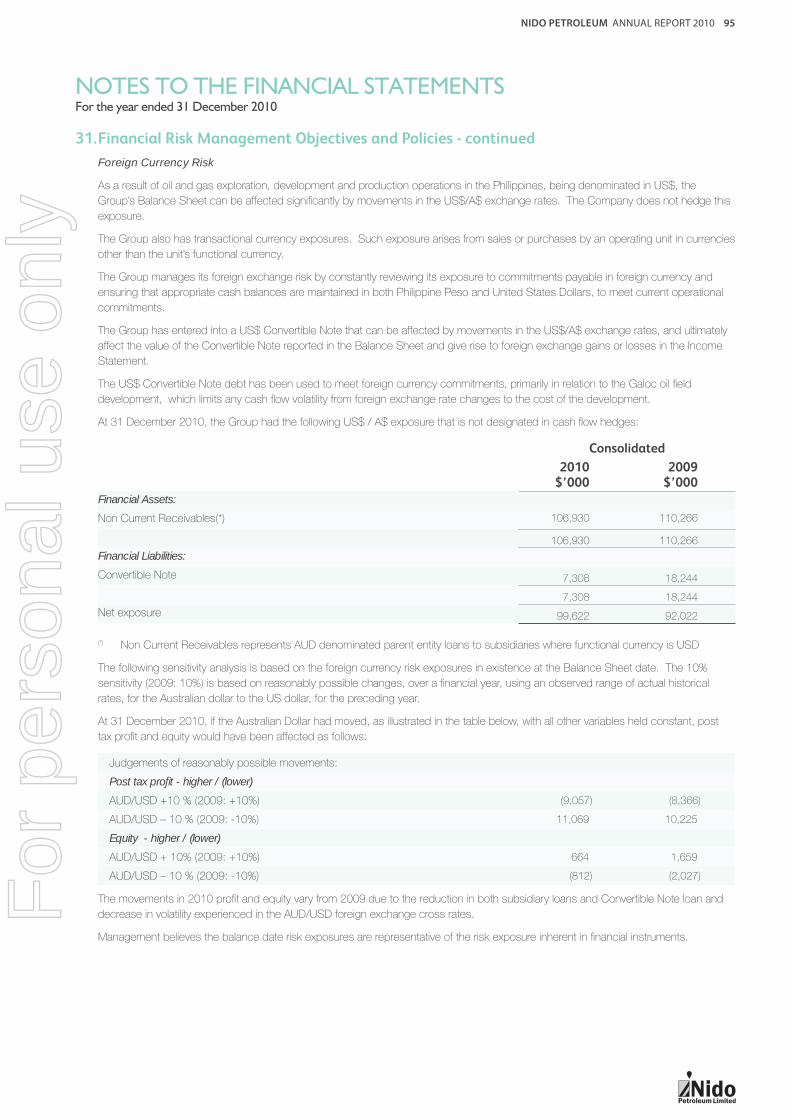
NIDO PETROLEUM ANNUAL REPORT 2010 95
NOTES TO THE FINANCIAL STATEMENTSFor the year ended 31 December 2010
31. Financial Risk Management Objectives and Policies - continued
Foreign Currency Risk
As a result of oil and gas exploration, development and production operations in the Philippines, being denominated in US$, the
Group’s Balance Sheet can be affected signifi cantly by movements in the US$/A$ exchange rates. The Company does not hedge this
exposure.
The Group also has transactional currency exposures. Such exposure arises from sales or purchases by an operating unit in currencies
other than the unit’s functional currency.
The Group manages its foreign exchange risk by constantly reviewing its exposure to commitments payable in foreign currency and
ensuring that appropriate cash balances are maintained in both Philippine Peso and United States Dollars, to meet current operational
commitments.
The Group has entered into a US$ Convertible Note that can be affected by movements in the US$/A$ exchange rates, and ultimately
affect the value of the Convertible Note reported in the Balance Sheet and give rise to foreign exchange gains or losses in the Income
Statement.
The US$ Convertible Note debt has been used to meet foreign currency commitments, primarily in relation to the Galoc oil fi eld
development, which limits any cash fl ow volatility from foreign exchange rate changes to the cost of the development.
At 31 December 2010, the Group had the following US$ / A$ exposure that is not designated in cash fl ow hedges:
Consolidated
2010$’000
2009$’000
Financial Assets:
Non Current Receivables(*) 106,930 110,266
106,930 110,266
Financial Liabilities:
Convertible Note 7,308 18,244
7,308 18,244
Net exposure 99,622 92,022
(*) Non Current Receivables represents AUD denominated parent entity loans to subsidiaries where functional currency is USD
The following sensitivity analysis is based on the foreign currency risk exposures in existence at the Balance Sheet date. The 10%
sensitivity (2009: 10%) is based on reasonably possible changes, over a fi nancial year, using an observed range of actual historical
rates, for the Australian dollar to the US dollar, for the preceding year.
At 31 December 2010, if the Australian Dollar had moved, as illustrated in the table below, with all other variables held constant, post
tax profi t and equity would have been affected as follows:
Judgements of reasonably possible movements:
Post tax profi t - higher / (lower)
AUD/USD +10 % (2009: +10%) (9,057) (8,366)
AUD/USD – 10 % (2009: -10%) 11,069 10,225
Equity - higher / (lower)
AUD/USD + 10% (2009: +10%) 664 1,659
AUD/USD – 10 % (2009: -10%) (812) (2,027)
The movements in 2010 profi t and equity vary from 2009 due to the reduction in both subsidiary loans and Convertible Note loan and
decrease in volatility experienced in the AUD/USD foreign exchange cross rates.
Management believes the balance date risk exposures are representative of the risk exposure inherent in fi nancial instruments.
For
per
sona
l use
onl
y

NIDO PETROLEUM ANNUAL REPORT 2010 96
NOTES TO THE FINANCIAL STATEMENTSFor the year ended 31 December 2010
31. Financial Risk Management Objectives and Policies - continued
Commodity Price Risk
The Group is exposed to commodity price fl uctuations through the sale of crude oil denominated in US dollars. The Group may enter
into commodity crude oil price swap and option contracts to manage its commodity price risk. As at 31 December 2010, the Group
had no open oil price swap and option contracts (2009: nil).
Credit Risk
Credit risk arises from the fi nancial assets of the Group, which comprise cash and cash equivalents, trade and other receivables and
other fi nancial assets and guarantees and undertakings. The Group’s exposure to credit risk arises from potential default of the counter
party, with a maximum exposure equal to the carrying amount of these instruments. Exposure at balance date is addressed in each
applicable Note.
The Group trades only with recognised, creditworthy third parties and has adopted a policy of dealing with creditworthy counterparts
and obtaining suffi cient collateral or other security where appropriate, as a means of mitigating the risk of fi nancial loss from defaults.
Cash balances for the Group are held by two major fi nancial institutions who have credit ratings of AA or greater.
Receivable balances are monitored on an ongoing basis with the result that the Group’s exposure to bad debts is not signifi cant.
Specifi c concentration of credit risk exists primarily within trade debtors in respect of the sale of oil, as well as cash held by non-operator
Joint Venture partners as well as receivables due from Joint Venture partners.
As at 31 December 2010, 100% (2009: 100%) of the consolidated entity’s crude oil receivable was owed by Pilipinas Shell Petroleum
Corporation to the Joint Venture operated by The Philodrill Corporation (“Philodrill”) with respect to the purchase of oil derived from
the Nido and Matinloc oil fi elds. Philodrill also holds cash balances due to the Group and other Joint Venture participants as at 31
December 2010 who have no history of credit default with the Group, and no impairment allowance is considered necessary.
Other than the concentration of credit risk described above, the consolidated entity does not have any signifi cant credit risk exposure to
any single counterparty or any group of counterparties having similar characteristics. The carrying amount of fi nancial assets recorded
in the Financial Statements, net of any provisions for losses, represents the consolidated entity’s maximum exposure to credit risk.
Liquidity Risk
The Group’s objective is to maintain a balance between continuity of funding and fl exibility through the use of its cash and funding
requirements.
The table below refl ects all contractually fi xed pay-offs for settlement, repayment and interest resulting from recognised liabilities as of
31 December 2010. Cash fl ows for fi nancial assets and liabilities without fi xed amount or timing are based on conditions existing at 31
December 2010.
The remaining contractual maturities of the Group’s fi nancial liabilities are:
Consolidated
2010$’000
2009$’000
6 months or less 30,802 19,964
6-12 months 3,766 9,878
1-5 years - 9,766
34,568 39,608
Included within the table above, for 6 months or less, is an amount relating to Convertible Note derivative fi nancial instrument for 2010 of
$1,775,000 (2009: $9,740,000).
The Company has also provided guarantees and undertakings, as described in Note 30. Unless otherwise stated, value of the
guarantee or undertaking cannot be reliably estimated nor can an estimate of maturity date be determined.
The Group manages its liquidity risk by monitoring on a monthly basis expected cash infl ows and outfl ows.
For
per
sona
l use
onl
y

NIDO PETROLEUM ANNUAL REPORT 2010 97
NOTES TO THE FINANCIAL STATEMENTSFor the year ended 31 December 2010
31. Financial Risk Management Objectives and Policies - continued
Equity Price Risk
Equity price risk arises from the Group’s derivative component of the Convertible Note, as the fair value reported in the Balance Sheet is
impacted by the Group’s share price on the Australian Stock Exchange. In addition to this, a conversion price reset mechanism exists
whereby the conversion price can be reset downwards if the volume weighted average share price is below the conversion price on
the reset date. The reset date occurs every six months. As at 31 December 2010, the reset is restricted to a maximum of 57,571,544
shares.
As at 31 December 2010 the conversion price was $0.08 per share (2009: $0.08), with the Notes now convertible into a maximum of
57,571,544 shares (2009: 114,307,091).
Over the term of the Note, the embedded derivative will be fair valued at each balance date and the movement in fair value recorded
through the Income Statement. For example, if the share price in the Company increases, the value of the embedded derivative will
increase, resulting in an increase to the liability reported in the Balance Sheet and an expense in the Income Statement.
The table below discloses the sensitivities in relation to the impact of a share price movement on the valuation of the embedded
derivative. The 5 cent sensitivity is based on reasonably possible change, over a fi nancial year, using an observed range of actual
historical share prices, for the preceding 4 years.
Judgements of reasonably possible movements:
Post tax profi t - higher / (lower)
+ 5 cent movement (2,019) (4,103)
- 5 cent movement 1,478 3,927
Equity - higher / (lower)
+ 5 cent movement - -
- 5 cent movement - -
The movements in 2010 profi t and equity are lower compared to 2009 due to the lower share price as at 31 December 2010 and
56,735,547 options converted by Merrill Lynch International (Australia) Limited during the year, refer to Note 17.
The carrying value of the Convertible Note’s debt component as at 31 December 2010 is $7,308,000 (2009: $18,090,000), while the
fair value of the embedded derivative as at 31 December 2010 is $1,775,000 (2009: $9,740,000).
The value until maturity (undiscounted) for the Convertible Note’s debt component as at 31 December 2010 is $9,068,000.
For
per
sona
l use
onl
y
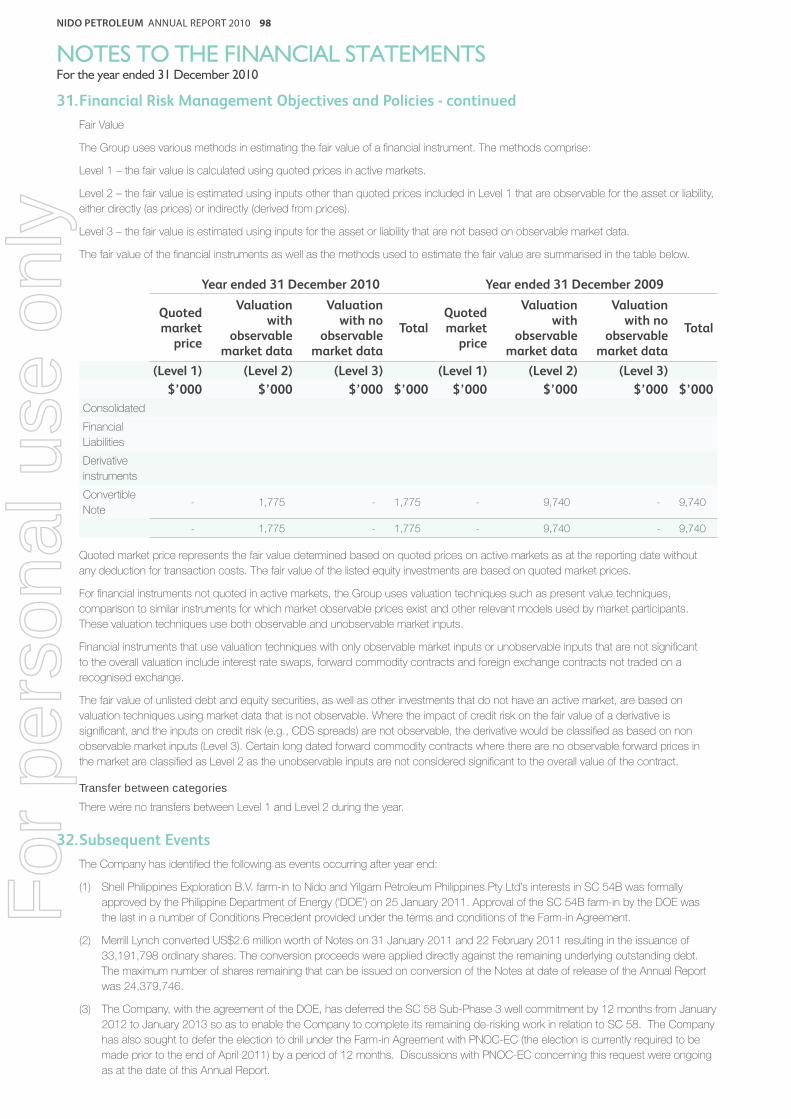
NIDO PETROLEUM ANNUAL REPORT 2010 98
NOTES TO THE FINANCIAL STATEMENTSFor the year ended 31 December 2010
31. Financial Risk Management Objectives and Policies - continued
Fair Value
The Group uses various methods in estimating the fair value of a fi nancial instrument. The methods comprise:
Level 1 – the fair value is calculated using quoted prices in active markets.
Level 2 – the fair value is estimated using inputs other than quoted prices included in Level 1 that are observable for the asset or liability,
either directly (as prices) or indirectly (derived from prices).
Level 3 – the fair value is estimated using inputs for the asset or liability that are not based on observable market data.
The fair value of the fi nancial instruments as well as the methods used to estimate the fair value are summarised in the table below.
Year ended 31 December 2010 Year ended 31 December 2009
Quoted market
price
Valuation with
observable market data
Valuation with no
observable market data
TotalQuoted market
price
Valuation with
observable market data
Valuation with no
observable market data
Total
(Level 1) (Level 2) (Level 3) (Level 1) (Level 2) (Level 3)
$’000 $’000 $’000 $’000 $’000 $’000 $’000 $’000
Consolidated
Financial
Liabilities
Derivative
instruments
Convertible
Note- 1,775 - 1,775 - 9,740 - 9,740
- 1,775 - 1,775 - 9,740 - 9,740
Quoted market price represents the fair value determined based on quoted prices on active markets as at the reporting date without
any deduction for transaction costs. The fair value of the listed equity investments are based on quoted market prices.
For fi nancial instruments not quoted in active markets, the Group uses valuation techniques such as present value techniques,
comparison to similar instruments for which market observable prices exist and other relevant models used by market participants.
These valuation techniques use both observable and unobservable market inputs.
Financial instruments that use valuation techniques with only observable market inputs or unobservable inputs that are not signifi cant
to the overall valuation include interest rate swaps, forward commodity contracts and foreign exchange contracts not traded on a
recognised exchange.
The fair value of unlisted debt and equity securities, as well as other investments that do not have an active market, are based on
valuation techniques using market data that is not observable. Where the impact of credit risk on the fair value of a derivative is
signifi cant, and the inputs on credit risk (e.g., CDS spreads) are not observable, the derivative would be classifi ed as based on non
observable market inputs (Level 3). Certain long dated forward commodity contracts where there are no observable forward prices in
the market are classifi ed as Level 2 as the unobservable inputs are not considered signifi cant to the overall value of the contract.
Transfer between categories
There were no transfers between Level 1 and Level 2 during the year.
32. Subsequent Events
The Company has identifi ed the following as events occurring after year end:
(1) Shell Philippines Exploration B.V. farm-in to Nido and Yilgarn Petroleum Philippines Pty Ltd’s interests in SC 54B was formally
approved by the Philippine Department of Energy (‘DOE’) on 25 January 2011. Approval of the SC 54B farm-in by the DOE was
the last in a number of Conditions Precedent provided under the terms and conditions of the Farm-in Agreement.
(2) Merrill Lynch converted US$2.6 million worth of Notes on 31 January 2011 and 22 February 2011 resulting in the issuance of
33,191,798 ordinary shares. The conversion proceeds were applied directly against the remaining underlying outstanding debt.
The maximum number of shares remaining that can be issued on conversion of the Notes at date of release of the Annual Report
was 24,379,746.
(3) The Company, with the agreement of the DOE, has deferred the SC 58 Sub-Phase 3 well commitment by 12 months from January
2012 to January 2013 so as to enable the Company to complete its remaining de-risking work in relation to SC 58. The Company
has also sought to defer the election to drill under the Farm-in Agreement with PNOC-EC (the election is currently required to be
made prior to the end of April 2011) by a period of 12 months. Discussions with PNOC-EC concerning this request were ongoing
as at the date of this Annual Report.
For
per
sona
l use
onl
y
NIDO PETROLEUM ANNUAL REPORT 2010 99
INDEPENDENT AUDITOR’S REPORT
Independent Auditor’s Report to the members of Nido Petroleum Limited
Report on the Financial Report
We have audited the accompanying Financial Report of Nido Petroleum Limited, which comprises the consolidated Balance Sheet as at
31 December 2010, the consolidated Statement of Comprehensive Income, the consolidated statement of changes in equity and the
consolidated statement of cash fl ows for the year then ended, notes comprising a summary of signifi cant accounting policies and other
explanatory information, and the directors’ declaration of the consolidated entity comprising the company and the entities it controlled at the
year’s end or from time to time during the fi nancial year.
Directors’ responsibility for the Financial Report The directors of the company are responsible for the preparation of the Financial Report that gives a true and fair view in accordance with
Australian Accounting Standards and the Corporations Act 2001 and for such internal controls as the directors determine are necessary to
enable the preparation of the Financial Report that is free from material misstatement, whether due to fraud or error. In Note 1, the directors
also state, in accordance with Accounting Standard AASB 101 Presentation of Financial Statements, that the fi nancial statements comply
with International Financial Reporting Standards.
Auditor’s responsibility Our responsibility is to express an opinion on the Financial Report based on our audit. We conducted our audit in accordance with Australian
Auditing Standards. Those standards require that we comply with relevant ethical requirements relating to audit engagements and plan and
perform the audit to obtain reasonable assurance about whether the Financial Report is free from material misstatement.
An audit involves performing procedures to obtain audit evidence about the amounts and disclosures in the Financial Report.
The procedures selected depend on the auditor’s judgment, including the assessment of the risks of material misstatement of the Financial
Report, whether due to fraud or error. In making those risk assessments, the auditor considers internal controls relevant to the entity’s
preparation and fair presentation of the Financial Report in order to design audit procedures that are appropriate in the circumstances,
but not for the purpose of expressing an opinion on the effectiveness of the entity’s internal controls. An audit also includes evaluating the
appropriateness of accounting policies used and the reasonableness of accounting estimates made by the directors, as well as evaluating
the overall presentation of the Financial Report.
We believe that the audit evidence we have obtained is suffi cient and appropriate to provide a basis for our audit opinion.
Independence In conducting our audit we have complied with the independence requirements of the Corporations Act 2001. We have given to the
directors of the company a written Auditor’s Independence Declaration, a copy of which is included in the Directors’ Report.
Ernst & Young Building 11 Mounts Bay Road Perth WA 6000 Australia GPO Box M939 Perth WA 6843
Tel: +61 8 9429 2222 Fax: +61 8 9429 2436 www.ey.com/au
Liability limited by a scheme approved
under Professional Standards Legislation
For
per
sona
l use
onl
y
NIDO PETROLEUM ANNUAL REPORT 2010 100
INDEPENDENT AUDITOR’S REPORT
Opinion In our opinion:
a. the Financial Report of Nido Petroleum Limited is in accordance with the Corporations Act 2001, including:
i giving a true and fair view of the consolidated entity’s fi nancial positions as at 31 December 2010 and of its performance for the year
ended on that date; and
ii complying with Australian Accounting Standards and the Corporations Regulations 2001; and
b. the Financial Report also complies with International Financial Reporting Standards as disclosed in Note 1.
Report on the Remuneration Report
We have audited the Remuneration Report included in pages 27 to 35 of the Directors’ Report for the year ended 31 December 2010.
The directors of the company are responsible for the preparation and presentation of the Remuneration Report in accordance with section
300A of the Corporations Act 2001. Our responsibility is to express an opinion on the Remuneration Report, based on our audit conducted
in accordance with Australian Auditing Standards.
Opinion In our opinion, the Remuneration Report of Nido Petroleum Limited for the year ended 31 December 2010, complies with section 300A of
the Corporations Act 2001.
Ernst & Young
R J Curtin
Partner
Perth
22 March 2011
Ernst & Young Building 11 Mounts Bay Road Perth WA 6000 Australia GPO Box M939 Perth WA 6843
Tel: +61 8 9429 2222 Fax: +61 8 9429 2436 www.ey.com/au
Liability limited by a scheme approved
under Professional Standards Legislation
For
per
sona
l use
onl
y
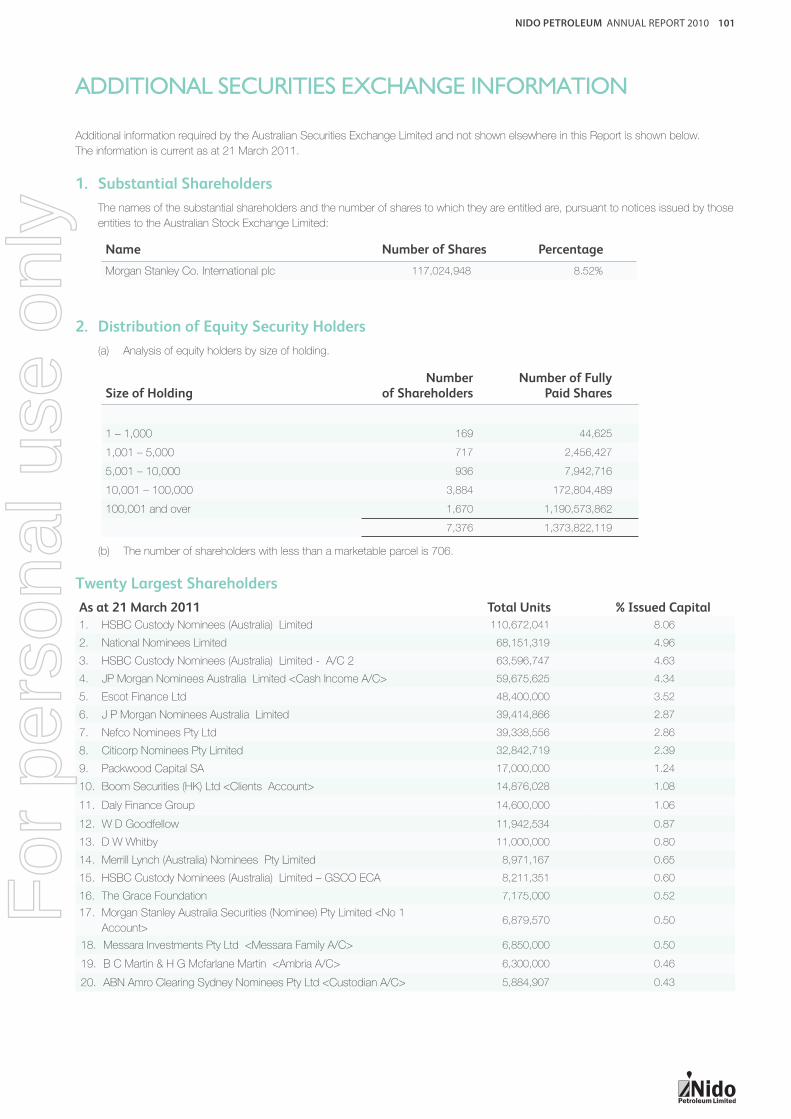
NIDO PETROLEUM ANNUAL REPORT 2010 101
ADDITIONAL SECURITIES EXCHANGE INFORMATION
Additional information required by the Australian Securities Exchange Limited and not shown elsewhere in this Report is shown below.
The information is current as at 21 March 2011.
1. Substantial Shareholders
The names of the substantial shareholders and the number of shares to which they are entitled are, pursuant to notices issued by those
entities to the Australian Stock Exchange Limited:
Name Number of Shares Percentage
Morgan Stanley Co. International plc 117,024,948 8.52%
2. Distribution of Equity Security Holders
(a) Analysis of equity holders by size of holding.
Size of HoldingNumber
of ShareholdersNumber of Fully
Paid Shares
1 – 1,000 169 44,625
1,001 – 5,000 717 2,456,427
5,001 – 10,000 936 7,942,716
10,001 – 100,000 3,884 172,804,489
100,001 and over 1,670 1,190,573,862
7,376 1,373,822,119
(b) The number of shareholders with less than a marketable parcel is 706.
Twenty Largest Shareholders
As at 21 March 2011 Total Units % Issued Capital
1. HSBC Custody Nominees (Australia) Limited 110,672,041 8.06
2. National Nominees Limited 68,151,319 4.96
3. HSBC Custody Nominees (Australia) Limited - A/C 2 63,596,747 4.63
4. JP Morgan Nominees Australia Limited <Cash Income A/C> 59,675,625 4.34
5. Escot Finance Ltd 48,400,000 3.52
6. J P Morgan Nominees Australia Limited 39,414,866 2.87
7. Nefco Nominees Pty Ltd 39,338,556 2.86
8. Citicorp Nominees Pty Limited 32,842,719 2.39
9. Packwood Capital SA 17,000,000 1.24
10. Boom Securities (HK) Ltd <Clients Account> 14,876,028 1.08
11. Daly Finance Group 14,600,000 1.06
12. W D Goodfellow 11,942,534 0.87
13. D W Whitby 11,000,000 0.80
14. Merrill Lynch (Australia) Nominees Pty Limited 8,971,167 0.65
15. HSBC Custody Nominees (Australia) Limited – GSCO ECA 8,211,351 0.60
16. The Grace Foundation 7,175,000 0.52
17. Morgan Stanley Australia Securities (Nominee) Pty Limited <No 1
Account>6,879,570 0.50
18. Messara Investments Pty Ltd <Messara Family A/C> 6,850,000 0.50
19. B C Martin & H G Mcfarlane Martin <Ambria A/C> 6,300,000 0.46
20. ABN Amro Clearing Sydney Nominees Pty Ltd <Custodian A/C> 5,884,907 0.43
For
per
sona
l use
onl
y

NIDO PETROLEUM ANNUAL REPORT 2010 102
ADDITIONAL SECURITIES EXCHANGE INFORMATION
3. Unlisted Options and Performance Rights
As at 21 March 2011, there were 15,450,000 unlisted options and 7,027,738 unlisted Performance Rights outstanding. The holders
do not have any voting rights in their capacity as option or performance right holders. Of these, 3,450,000 options were issued
pursuant to the 2007 Employee Share Option Plan and 5,980,203 pursuant to the 2010 Employee Performance Rights Plan.
The distribution of the remaining options and Performance Rights approved by shareholders is as follows:
Directors’ Options:
Name12 May 2011
35 cents12 May 2011
40 cents12 May 2011
45 cents12 May 2011
50 cents Total
D Whitby - - - - -
J de Dios - 3,000,000 2,000,000 2,000,000 7,000,000
J Brown - - - - -
V Pérez - - - - -
A Edwards - - - - -
W Bloking 3,000,000 2,000,000 - - 5,000,000
3,000,000 5,000,000 2,000,000 2,000,000 12,000,000
Directors’ Performance Rights:
Name 28 May 2013
J de Dios 1,047,535
4. Option and Performance Rights holders
As at 21 March 2011, there were a total of 10 option holders holding unlisted employee or Director options and 25 performance right
holders holding unlisted employee or Director Performance Rights.
Further information on unlisted options and Performance Rights is disclosed in Note 23 to the Financial Statements.
For
per
sona
l use
onl
y
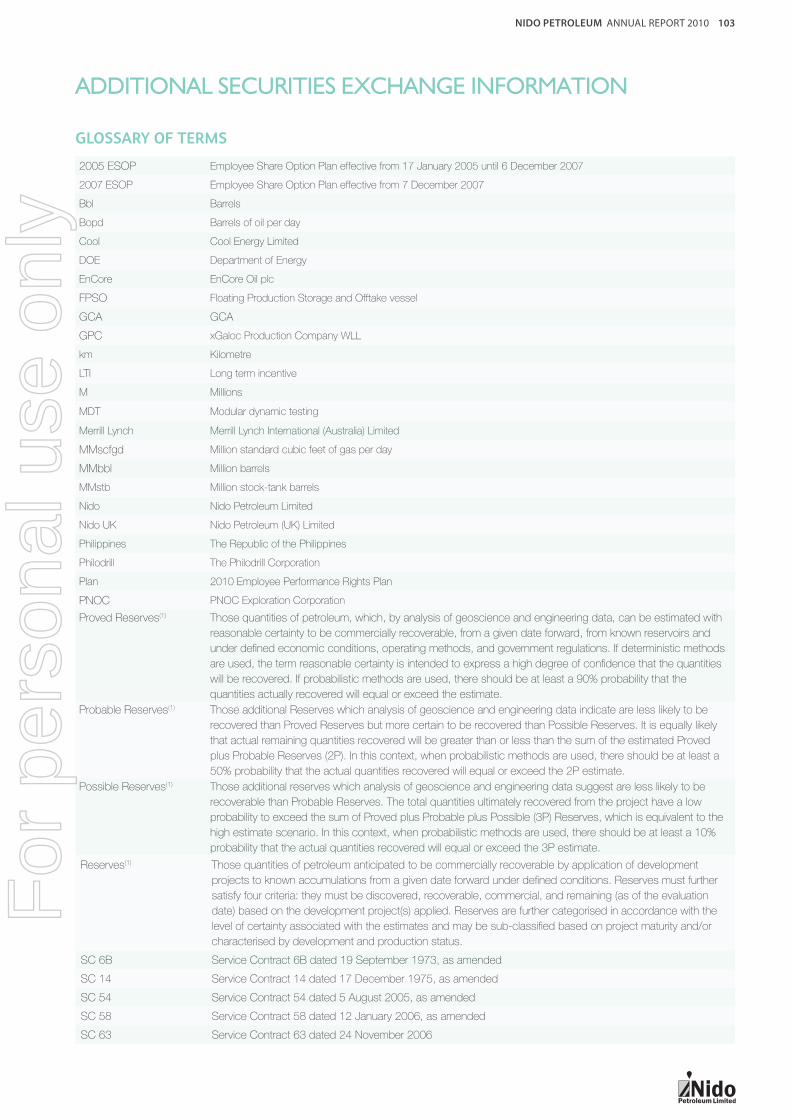
NIDO PETROLEUM ANNUAL REPORT 2010 103
ADDITIONAL SECURITIES EXCHANGE INFORMATION
GLOSSARY OF TERMS
2005 ESOP Employee Share Option Plan effective from 17 January 2005 until 6 December 2007
2007 ESOP Employee Share Option Plan effective from 7 December 2007
Bbl Barrels
Bopd Barrels of oil per day
Cool Cool Energy Limited
DOE Department of Energy
EnCore EnCore Oil plc
FPSO Floating Production Storage and Offtake vessel
GCA GCA
GPC xGaloc Production Company WLL
km Kilometre
LTI Long term incentive
M Millions
MDT Modular dynamic testing
Merrill Lynch Merrill Lynch International (Australia) Limited
MMscfgd Million standard cubic feet of gas per day
MMbbl Million barrels
MMstb Million stock-tank barrels
Nido Nido Petroleum Limited
Nido UK Nido Petroleum (UK) Limited
Philippines The Republic of the Philippines
Philodrill The Philodrill Corporation
Plan 2010 Employee Performance Rights Plan
PNOC PNOC Exploration Corporation
Proved Reserves(1) Those quantities of petroleum, which, by analysis of geoscience and engineering data, can be estimated with
reasonable certainty to be commercially recoverable, from a given date forward, from known reservoirs and
under defi ned economic conditions, operating methods, and government regulations. If deterministic methods
are used, the term reasonable certainty is intended to express a high degree of confi dence that the quantities
will be recovered. If probabilistic methods are used, there should be at least a 90% probability that the
quantities actually recovered will equal or exceed the estimate.
Probable Reserves(1) Those additional Reserves which analysis of geoscience and engineering data indicate are less likely to be
recovered than Proved Reserves but more certain to be recovered than Possible Reserves. It is equally likely
that actual remaining quantities recovered will be greater than or less than the sum of the estimated Proved
plus Probable Reserves (2P). In this context, when probabilistic methods are used, there should be at least a
50% probability that the actual quantities recovered will equal or exceed the 2P estimate.
Possible Reserves(1) Those additional reserves which analysis of geoscience and engineering data suggest are less likely to be
recoverable than Probable Reserves. The total quantities ultimately recovered from the project have a low
probability to exceed the sum of Proved plus Probable plus Possible (3P) Reserves, which is equivalent to the
high estimate scenario. In this context, when probabilistic methods are used, there should be at least a 10%
probability that the actual quantities recovered will equal or exceed the 3P estimate.
Reserves(1) Those quantities of petroleum anticipated to be commercially recoverable by application of development
projects to known accumulations from a given date forward under defi ned conditions. Reserves must further
satisfy four criteria: they must be discovered, recoverable, commercial, and remaining (as of the evaluation
date) based on the development project(s) applied. Reserves are further categorised in accordance with the
level of certainty associated with the estimates and may be sub-classifi ed based on project maturity and/or
characterised by development and production status.
SC 6B Service Contract 6B dated 19 September 1973, as amended
SC 14 Service Contract 14 dated 17 December 1975, as amended
SC 54 Service Contract 54 dated 5 August 2005, as amended
SC 58 Service Contract 58 dated 12 January 2006, as amended
SC 63 Service Contract 63 dated 24 November 2006
For
per
sona
l use
onl
y

NIDO PETROLEUM ANNUAL REPORT 2010 104
ADDITIONAL SECURITIES EXCHANGE INFORMATION
sq. km. Square kilometre
stb Stock-tank barrels
STI short term incentive
STOIIP Stock –tank oil initially in place
TD Total depth
Yilgarn Yilgarn Petroleum Philippines Pty Limited
(1) From Petroleum Resources Management System March 2007 sponsored by the Society of Petroleum Engineers, American
Association of Petroleum Geologists, World Petroleum Council, Society of Petroleum Evaluation.
For
per
sona
l use
onl
y

For
per
sona
l use
onl
y
Perth OfficeAquila Centre Level 31 Preston Street COMO WA 6152 P +61 (0) 8 9474 0000F +61 (0) 8 9474 0099
Manila Office38/F Philamlife Tower8767 Paseo de RoxasMakati City 1226PHILIPPINESP +63 2 856 5910F +63 2 856 5494
www.nido.com.au
ABN 65 086 630 373
For
per
sona
l use
onl
y