Embed Size (px)
Citation preview
1
16 November 2015
Appendix 4E and Annual Report for the Financial Period Ended 30 September 2015
Elders Limited (ASX: ELD) today reports its results for the financial year ended 30 September 2015.
Attached is the Appendix 4E (Results for announcement to the market), and Annual Report for the 12 month financial period ended 30 September 2015.
The final version of the Annual Report (including possible immaterial amendments) will be made available to the ASX and on the Company’s website before Friday 20 November 2015.
Peter Hastings Company Secretary
For
per
sona
l use
onl
y
Elders LimitedAppendix 4E (Rule 4.3A)PRELIMINARY FINANCIAL REPORTRESULTS FOR ANNOUNCEMENT TO THE MARKETFor the year ended 30 September 2015
Attached is the final report for the year ended 30 September 2015. The consolidated profit after tax and non-controlling interests was $38.3 million (2014: $3 million profit).
Additional Appendix 4E disclosure requirements and further details on the results and operations are included in the Annual Report provided to the Australian Securities Exchange.
Result $000
Revenue from continuing operations up 6% to 1,514,739
Profit/(loss) from continuing operations after tax attributable to members up 101% to 38,287
Profit/(loss) from discontinued operations after tax attributable to members
n/m* -
Profit/(loss) after tax for the year attributable to members n/m* 38,287
* percentage movement in result not meaningful
Dividends Amount per security
Franked amount per
security
Final dividend Nil n/a
Previous corresponding period Nil n/a
Net tangible assets 2015 $
2014 $
Net tangible asset backing per ordinary security (83,734,671 ordinary shares)
0.84 0.60
Revenues from continuing operations comprise: 2015 $000
2014 $000
Sales revenue 1,514,217 1,431,540
Equity accounted profits 522 498
Total 1,514,739 1,432,038
For
per
sona
l use
onl
y
Live it.
ELDERS LIMITED
2015 Annual Report
For
per
sona
l use
onl
y
Contents4 We Live it at Killara
6 Chairman’s Remarks
8 CEO’s Report
13 We Live it at Bodallin
14 Year in brief
15 A year of progress
17 Operating & Financial Review
22 Review of Operations
27 Outlook
28 Material Business Risks
30 Board of Directors
32 Directors’ Report
36 Remunerations Report 2015
51 Annual Financial Report 2015
98 Shareholder Information
99 Company Directory
2
Elders. Live it.Annual Report 2015
For
per
sona
l use
onl
y
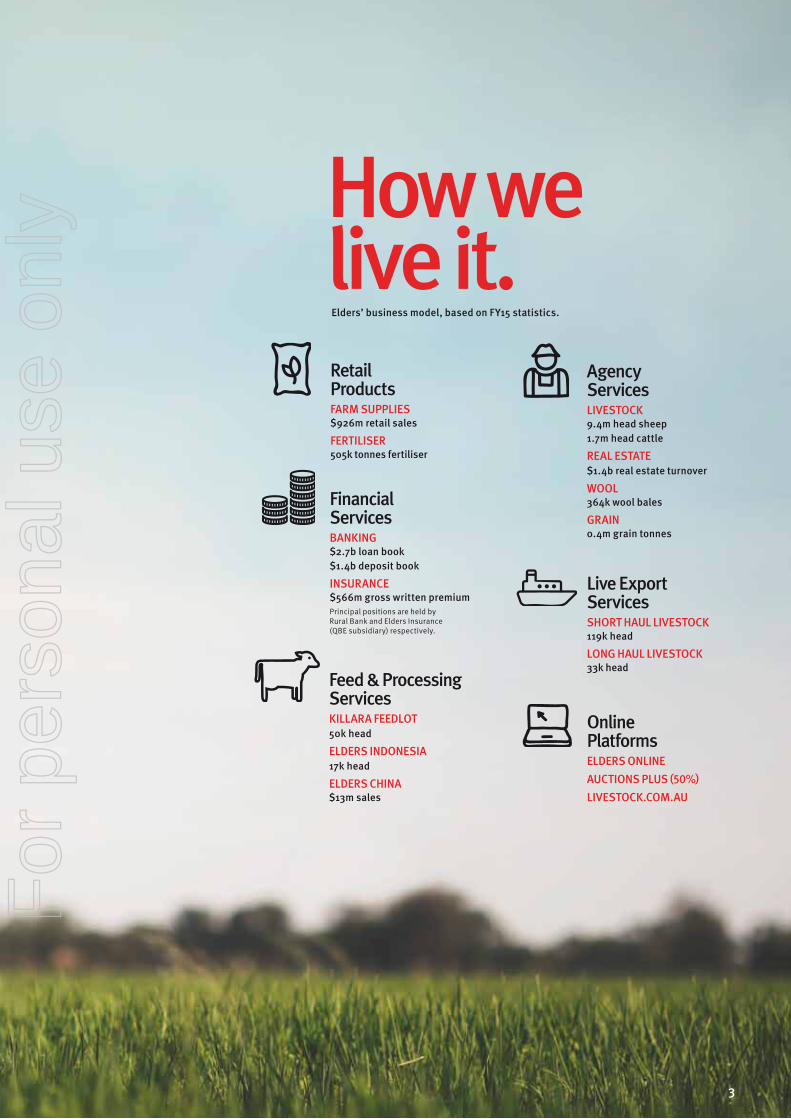
How we live it.Retail ProductsFARM SUPPLIES $926m retail sales
FERTILISER505k tonnes fertiliser
Financial ServicesBANKING$2.7b loan book $1.4b deposit book
INSURANCE $566m gross written premiumPrincipal positions are held by Rural Bank and Elders Insurance (QBE subsidiary) respectively.
Agency ServicesLIVESTOCK9.4m head sheep 1.7m head cattle
REAL ESTATE$1.4b real estate turnover
WOOL364k wool bales
GRAIN0.4m grain tonnes
Live Export ServicesSHORT HAUL LIVESTOCK119k head
LONG HAUL LIVESTOCK33k head
Feed & Processing ServicesKILLARA FEEDLOT 50k head
ELDERS INDONESIA 17k head
ELDERS CHINA $13m sales
Online PlatformsELDERS ONLINEAUCTIONS PLUS (50%)LIVESTOCK.COM.AU
Elders’ business model, based on FY15 statistics.
3
For
per
sona
l use
onl
y
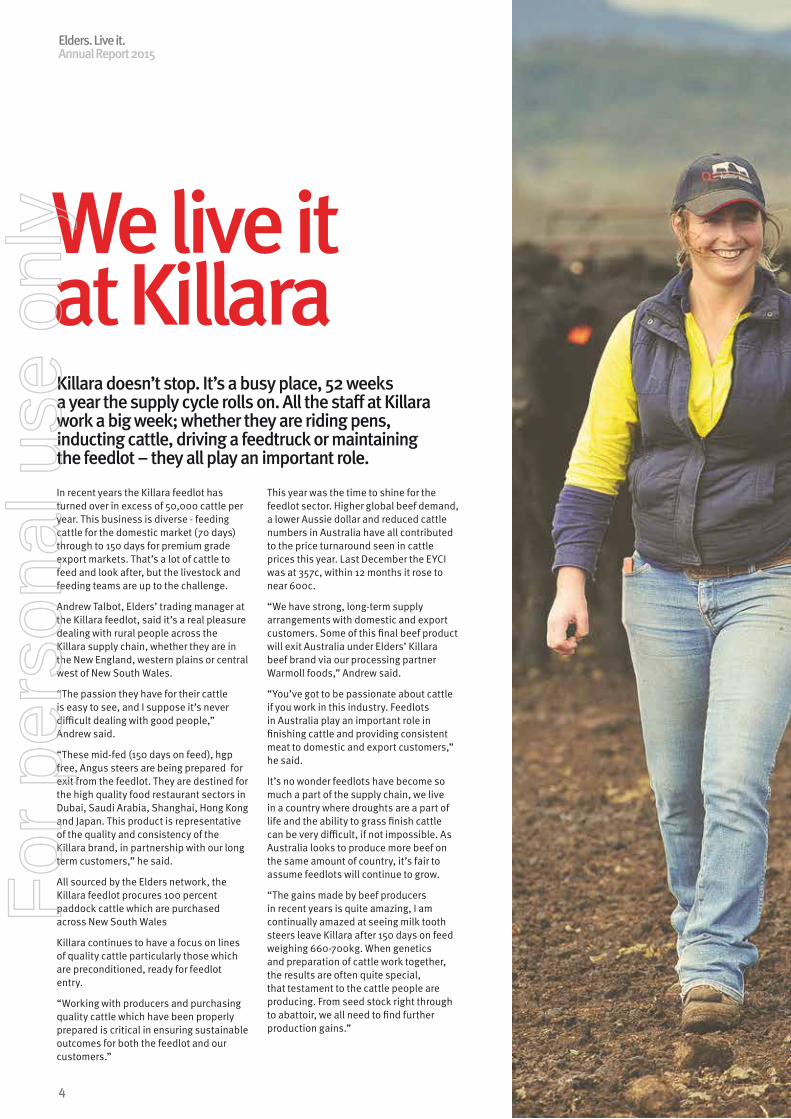
We live it at KillaraKillara doesn’t stop. It’s a busy place, 52 weeks a year the supply cycle rolls on. All the staff at Killara work a big week; whether they are riding pens, inducting cattle, driving a feedtruck or maintaining the feedlot – they all play an important role.
In recent years the Killara feedlot has turned over in excess of 50,000 cattle per year. This business is diverse - feeding cattle for the domestic market (70 days) through to 150 days for premium grade export markets. That’s a lot of cattle to feed and look after, but the livestock and feeding teams are up to the challenge.
Andrew Talbot, Elders’ trading manager at the Killara feedlot, said it’s a real pleasure dealing with rural people across the Killara supply chain, whether they are in the New England, western plains or central west of New South Wales.
“The passion they have for their cattle is easy to see, and I suppose it’s never difficult dealing with good people,” Andrew said.
“These mid-fed (150 days on feed), hgp free, Angus steers are being prepared for exit from the feedlot. They are destined for the high quality food restaurant sectors in Dubai, Saudi Arabia, Shanghai, Hong Kong and Japan. This product is representative of the quality and consistency of the Killara brand, in partnership with our long term customers,” he said.
All sourced by the Elders network, the Killara feedlot procures 100 percent paddock cattle which are purchased across New South Wales
Killara continues to have a focus on lines of quality cattle particularly those which are preconditioned, ready for feedlot entry.
“Working with producers and purchasing quality cattle which have been properly prepared is critical in ensuring sustainable outcomes for both the feedlot and our customers.”
This year was the time to shine for the feedlot sector. Higher global beef demand, a lower Aussie dollar and reduced cattle numbers in Australia have all contributed to the price turnaround seen in cattle prices this year. Last December the EYCI was at 357c, within 12 months it rose to near 600c.
“We have strong, long-term supply arrangements with domestic and export customers. Some of this final beef product will exit Australia under Elders’ Killara beef brand via our processing partner Warmoll foods,” Andrew said.
“You’ve got to be passionate about cattle if you work in this industry. Feedlots in Australia play an important role in finishing cattle and providing consistent meat to domestic and export customers,” he said.
It’s no wonder feedlots have become so much a part of the supply chain, we live in a country where droughts are a part of life and the ability to grass finish cattle can be very difficult, if not impossible. As Australia looks to produce more beef on the same amount of country, it’s fair to assume feedlots will continue to grow.
“The gains made by beef producers in recent years is quite amazing, I am continually amazed at seeing milk tooth steers leave Killara after 150 days on feed weighing 660-700kg. When genetics and preparation of cattle work together, the results are often quite special, that testament to the cattle people are producing. From seed stock right through to abattoir, we all need to find further production gains.”
Elders. Live it.Annual Report 2015
4
For
per
sona
l use
onl
y
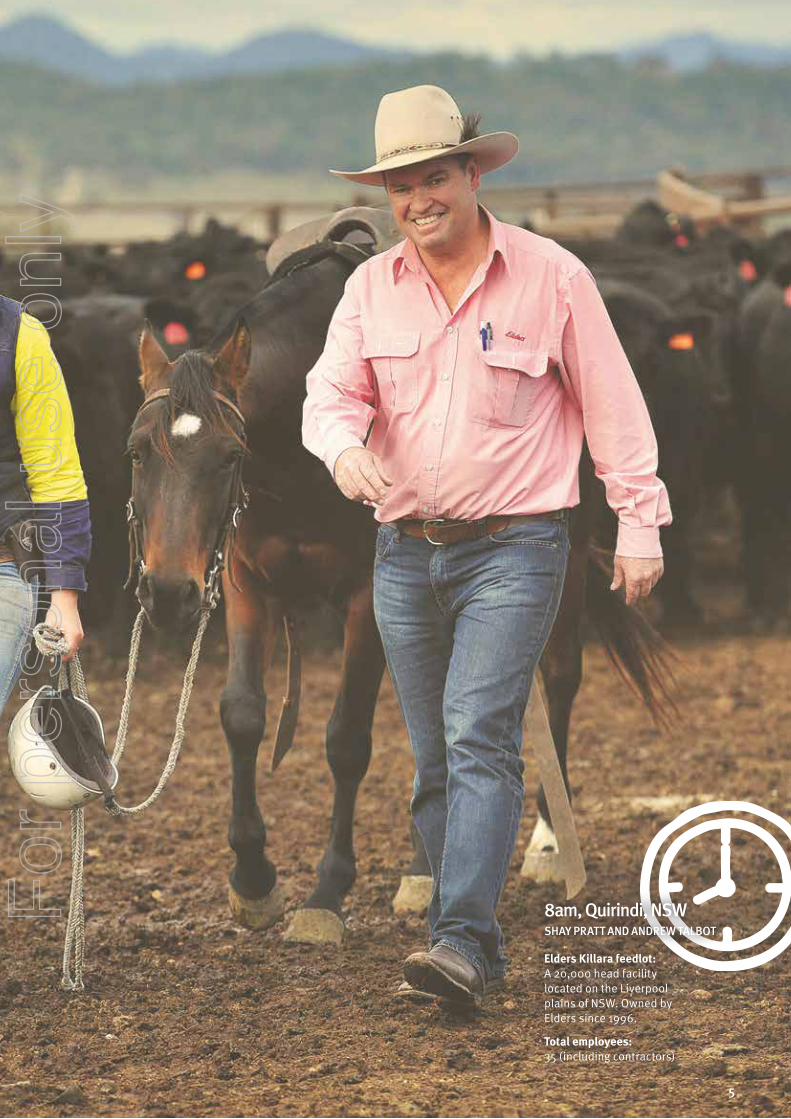
SHAY PRATT AND ANDREW TALBOT8am, Quirindi, NSW
Elders Killara feedlot: A 20,000 head facility located on the Liverpool plains of NSW. Owned by Elders since 1996.
Total employees: 35 (including contractors)
5
For
per
sona
l use
onl
y
Our consistent improvement, year on year, reflects management’s commitment to achieving the key elements of the eight point strategic plan in 2014/2015.
The achievements this financial year are a reflection of the strength and incredible resilience from our people, each of whom have helped Elders achieve its 176 years of continuous operation.
Chairman’s RemarksHUTCH RANCK
The 2015 financial year was one of continued improvements and stability for Elders, as we take another step towards our goal of becoming an agribusiness that creates real value for all of our stakeholders.
Elders. Live it.Annual Report 2015
6
For
per
sona
l use
onl
y
SafetyAs the key business priority for 2015, we saw improvements to the safety culture at Elders. An increased focus on our people and their wellbeing across the business has resulted in a 0.1 percent reduction in the Lost Time Injury Frequency Rate (LTIFR) and a 34% increase in workplace safety discussions.
Whilst the increased engagement of our employees is commendable, I am conscious that this year we again recorded 14 lost time injuries, which means we have held improvements made in 2014. With a goal of operating an injury free workplace, any injury is unsatisfactory. Our Chief Executive Officer will further outline our improvements and goals for a safe workplace in his report.
Financial resultsElders has continued to build on a significant financial turnaround, recording a $38.3 million statutory profit in the 12 months to 30 September 2015, coming from a $3.0 million statutory profit recorded in the previous year.
Elders’ underlying profit was up $23.5 million on last year, to $32.6 million for the 2015 financial year. This was largely achieved through an uplift in retail earnings, strong livestock performance, increase in feed and processing efficiencies and interest cost savings.
Our financial results are discussed in detail in the Chief Executive Officer’s report.
Balance sheet and financeAfter seven successive years of debt reduction, I am pleased to confirm that this financial year saw Elders reach a level of zero term debt. This was a key milestone in the Elders turnaround story which provided us with a platform to focus on value generation for our stakeholders.
In line with our commitment to maintain minimal to zero term debt, Elders enjoys a positive and constructive relationship with its financiers (ANZ, NAB and
Rabobank) and has an improved financing package with extended tenure, lower fees and improved terms.
We are now in a strong position to direct our cash flow back into Eight Point Plan initiatives – and ultimately reinvigorate and strengthen the business to grow earnings and returns.
Capital Structure NormalisationIn order to simplify our capital structure, Elders Finance Pty Ltd (a wholly owned subsidiary of Elders Limited) acquired 375,000 Elders Hybrid shares for a total of $30 million, which together with our refinancing, represented entry to the last phase of normalisation of our capital and debt structures. While we have no immediate plan for dealing with the remaining hybrids, we will continue to assess capital management opportunities as they present themselves and act on those which are in the best interests of Elders and our shareholders.
During the year, we also conducted a small holding sale facility and top-up facility with a total of 709,019 shares either purchased by shareholders, or sold on behalf of shareholders. This process allowed us to reduce the significant administrative cost of managing small shareholdings.
In September 2015, we received another confidence boost as Elders was re-admitted into the S&P/ASX 300 index.
Board and leadership This year we welcomed Robyn Clubb to the Board as a non-executive director, further strengthening our team. Robyn comes to Elders with extensive experience in the agricultural and financial services sector and is a qualified chartered accountant and fellow of the Finance and Securities Institute of Australia.
As a New South Wales beef producer and stonefruit grower, Robyn brings with her significant experience and interest in agriculture, further complementing the strong skill set of our Board, and providing sound support to the Company’s strategic growth plans.
Corporate governanceYour company is committed to high standards of corporate governance, including its continuous disclosure obligations. Elders’ corporate governance framework and practices, which are fully compliant with the 3rd edition of the ASX Corporate Governance Council’s Principles and Recommendations, are detailed in the Corporate Governance Statement available on our website at www.elderslimited.com/about-us/corporate-governance
Elders continues to make progress against our diversity objectives and understands that diversity in our workplace is a critical factor in our turnaround and ongoing success.
In what has traditionally been a male-dominated industry, Elders is taking steps to address the representation of women at Elders, particularly in leadership roles.
Closing remarks I am extremely humbled to have been your Chairman through what has been an incredible year of milestones for Elders. I speak on behalf of the Board when I say that the results outlined in this report, would not have been possible without the hard and disciplined work of the entire Elders team. I am conscious that there is a still a long way for us to go until shareholders will view our performance as fully acceptable. However, over the past 18 months there has been an obvious shift in mindset and culture within the business, and within the communities in which we operate, and we are confident that we are yet another step closer in creating value for all stakeholders.
I look forward to sharing our progress with you.
Hutch Ranck Chairman
This is... a reflection of the strength, and incredible resilience from Elders’ people.”
“
7
For
per
sona
l use
onl
y
For the second year in a row, I am pleased to share with you the positive progress and results that have been made across our business.
Last year I labelled 2014 as a year of survival for Elders. This year, however, was a year of stabilisation and growth. 2015 saw the business rise to the challenge of our new priorities, new expectations and a new level of performance, resulting in another year of solid improvement for Elders.
As I will further detail in my report below, our management team has again delivered against our Eight Point Plan and our four key business priorities:
• Safety performance• Operational performance• Key relationships, and • Efficiency and growth.
For those who are closely following the turnaround and the progress of Elders – there should be nothing new or surprising in my report – ultimately, Elders is on track and we’re doing what we said we would do.
CEO’s ReportMARK ALLISON
Elders. Live it.Annual Report 2015
8
For
per
sona
l use
onl
y
Safety performanceOver the past 12 months, as part of our safety strategy to drive continuous improvement and improve the safety culture, we have implemented an innovative, employee engagement campaign ‘Stand Up Speak Up.’ Recognised by the National Safety Council of Australia as the best work, health and safety improvement in an Australian workplace this year, the Stand Up Speak Up campaign has already contributed to a 34% increase in team safety discussions and an increase in safety initiatives as a business priority.
Elders recorded 14 lost time injuries in 2015, which means we have held our improvement from the previous year. Whilst we did see improvements in our safety culture across the board, any injury is an injury too many, and so I am conscious that our systems, processes and educational efforts will need continuous development in order to achieve further improvements in all safety indicators in 2016, and to reach our ultimate goal of ensuring none of our employees or contractors are injured.
Operational performance2015 saw another strong financial performance from Elders, recording a $38.3 million statutory profit in the 12 months to 30 September 2015, up from the $3.0 million statutory profit recorded in the previous year.
Elders’ underlying profit was up $23.5 million on last year, recording a $32.6 million profit for the 2015 financial year.
Our improved profit was largely due to strong livestock performance, uplift in retail earnings, increase in feed and processing efficiencies and interest cost reductions
Our retail arm saw a $3.7 million improvement on last year, due to improvement in winter crop demand and gains from Eight Point Plan initiatives such as price book management and the consolidation of our supplier base.
The $16.3 million improvement in the agency services business was driven by an increase in strong livestock prices,
and an increase in cattle and wool volumes. In addition, our ‘Welcome Back’ campaign saw 200 lapsed clients successfully return to Elders for their livestock or wool agency services.
Improved efficiency and occupancy in Killara Feedlot, along with a refocused business model for Elders China saw a further $3.1 million improvement in the feed and processing services business on last year’s results.
Net underlying finance costs reduced by $5.7 million on last year with average net debt reducing in 2015.
Strong results from our capital light streams, namely livestock agency and short haul live export, delivered a 21.9% return on capital which is an improvement from 13.6% recorded last year.
And finally, after a lengthy debt-reduction process, our remaining term debt of $34.1 million was reduced to zero, using capital raising proceeds in October 2014.
Key RelationshipsIt is a key understanding at Elders that the business and our brand is built on relationships. With that in mind, this year we prioritised the strengthening of these relationships as a key business deliverable.
Our peopleElders employed 1,838 full time equivalent (FTE) persons at 30 September 2015 compared with 1,811 persons at the end of the previous corresponding period.
In just 12 months, we have seen improved levels of employee effectiveness and enablement across the board. Our annual employee engagement and effectiveness survey conducted by Hay Group showed Elders’ overall engagement and enablement levels remain above other Australian organisations and have improved (+3 and +3 respectively) on our 2014 result.
Significant progress has been made in building a high performance culture within the business. We saw a 97% participation rate in the 2015 performance review process, as well as
the implementation of incentive plans that align shareholder expectations and employee performance with reward.
We are proud to continue our investment in the training and development of our people, with more than 60 front line leaders graduating from our Leadership Development Program, more than 20 trainees inducted into the Stock and Station Agency Traineeship Program, and a further 3 agronomy graduates accepted into a new Agronomy Graduate Program, in the 2015 year.
We continue to work towards improving the diversity of our workforce, particularly in regards to gender diversity. The representation of women within Elders’ workforce is 36% which is comparable to the agricultural sector. However, the representation of women in leadership roles is lower than we desire and we continue to implement our Diversity Action Plan which is outlined in our Corporate Governance Statement available on our website at www.elderslimited.com/about-us/corporate-governance. As our Chairman noted in his remarks, the Board was pleased to welcome Robyn Clubb as a non-executive director, which fulfilled a key objective of maintaining the percentage of female non-executive Board directors at 25% or more.
Our clientsElders’ clients and the communities in which we operate are the bread and butter for our business. To gain a greater insight into their needs and opportunities, this year we conducted client and non-client focus group research across Australia. The results of our research prompted us to deliver the 2015 brand campaign ‘Elders. Live It’ which focussed on our local presence, national network, and industry expertise. In addition, we engaged in regional sponsorship agreements in key focus regions, ensuring we support and invest back into communities in which we operate.
In 2015, Elders supported a number of charities and non-government organisations, including the Royal Flying Doctors Service and their work in
2015 saw... new priorities, new expectations and a new level of performance.”
“
9
For
per
sona
l use
onl
y
providing medical assistance to people living, working and visiting rural and remote Australia. At a corporate level Elders is a sponsor of the Little Heroes Foundation, Ronald McDonald House and also Snowy Hydro SouthCare.
Internationally, Elders has a strong focus on supporting the Indonesian villages in which we operate, with donations to local mosques, events and weekly donations to local rice and tapioca farmers.
At a community level in Australia, Elders branches continue to support a wide range of local initiatives and charities and many of our employees participate in community service activities.
Our suppliersIn the farm supplies and fertiliser space we’ve developed and implemented a capital light/return on capital driven business model. We’ve rationalised and refocused our relationships with our supply partners to develop mutually beneficial business models.
Our customersAs we look for opportunities for growth and new markets, particularly in our livestock and live export businesses, it is important that we work alongside our customers to ensure certain standards are met. In the past 12 months, Elders has made significant investments towards animal welfare, including the appointment of a dedicated animal welfare and ESCAS manager, and the roll-out of automated traceability systems in Vietnam.
Efficiency and GrowthFor us to remain competitive, it is vital that we pursue organic growth and other relevant opportunities in a planned and methodical manner. This year, our own people have been the main drivers in identifying and delivering strategies aligned to our client and customer base, and the Eight Point Plan.
Key achievements include the launch of an online livestock auction platform, the introduction of a livestock financing facility, and the exploration of new live export markets, all providing our clients with increased market opportunity. We have also developed our ‘Killara’, ‘Kooyong’, and ‘Marlee’ branded meat product lines for international markets and customers.
A key priority of 2015 was to improve the performance of our workforce and lift productivity. As such, 45 of our branches implemented a 90 day plan, supporting improved productivity and business growth.
Eight Point PlanIn addition to the progress on our FY15 priorities outlined above, significant progress has been made to our Eight Point Plan.
The Eight Point Plan is our strategic vision for becoming an efficient user of capital and a business that produces acceptable returns for all our stakeholders while servicing our customers’ needs.
After two solid years of progress, we remain on track to fully execute the strategic objectives of the Eight Point Plan.
It is evident from the ideas and initiatives that are being implemented, that we have an experienced team, and the right people within the business to take control of our own future.
Closing remarksAs a result of yet another year of significant tangible progress, in September 2015, Elders was awarded the Turnaround Management Association’s Large Business Turnaround of the Year Award. It was very humbling to accept the award on behalf of all those involved in our turnaround, particularly our employees who have been so dedicated and committed to our future. Whilst our employees are geographically spread across Australian and international locations, it is clear that we are ‘one Elders’ and we are all working towards the same goal.
For me, receiving the TMA award was a great time to reflect on the year that had been, mentally draw a line in the sand, and turn to our next phase - growth.
As shareholders, many of you have continued to support us over a long uncertain period, and for this we extend our gratitude. You can now be confident that Elders is back, we are doing what we said we would do, and we are focussed on the future.
We look forward to another year of growth, success, and value generation for all our stakeholders.
Mark Allison Managing Director
You can now be confident that Elders is back, we are doing what we said we would do, and we are focussed on the future.”
“
Elders. Live it.Annual Report 2015
10
For
per
sona
l use
onl
y
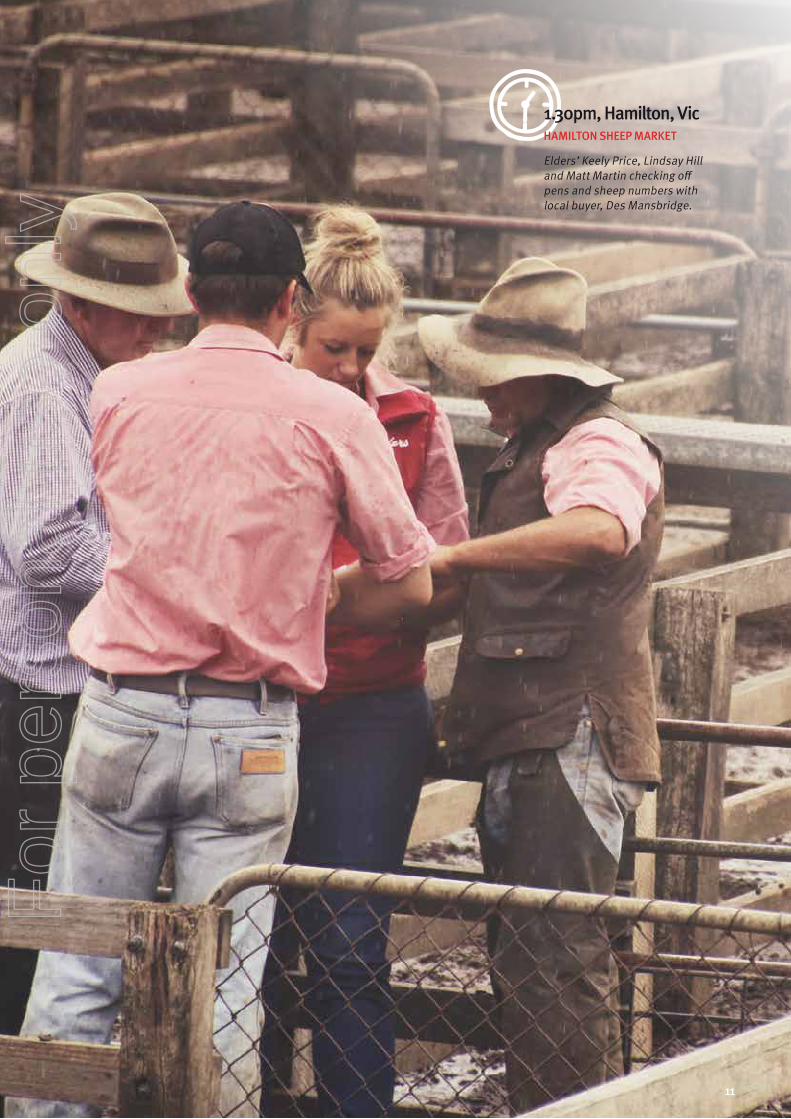
HAMILTON SHEEP MARKET
1.30pm, Hamilton, Vic
Elders’ Keely Price, Lindsay Hill and Matt Martin checking off pens and sheep numbers with local buyer, Des Mansbridge.
11
For
per
sona
l use
onl
y
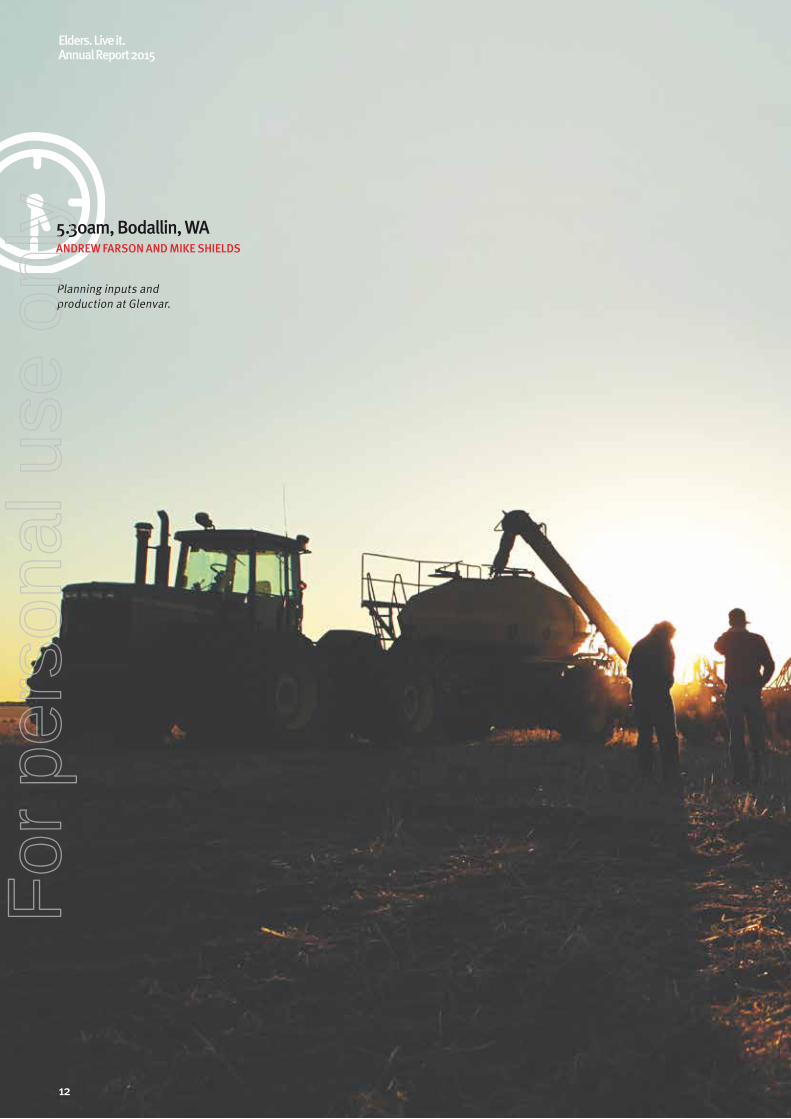
ANDREW FARSON AND MIKE SHIELDS5.30am, Bodallin, WA
Planning inputs and production at Glenvar.
12
Elders. Live it.Annual Report 2015
For
per
sona
l use
onl
y
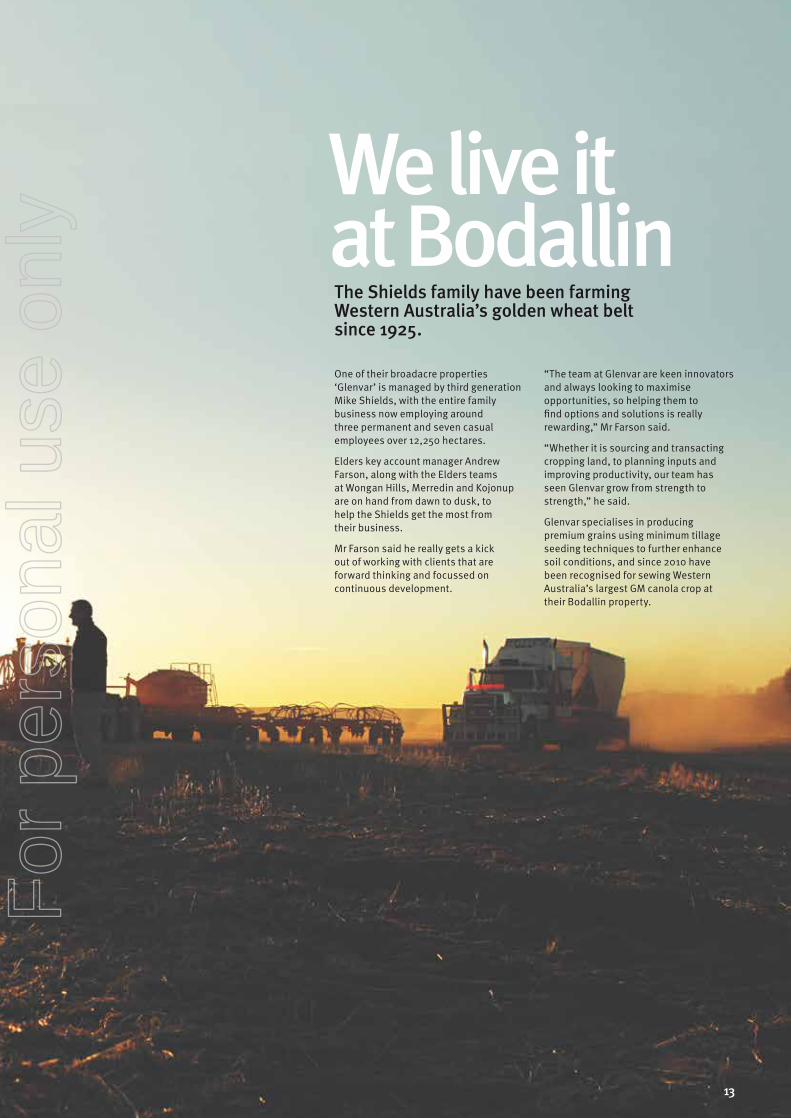
One of their broadacre properties ‘Glenvar’ is managed by third generation Mike Shields, with the entire family business now employing around three permanent and seven casual employees over 12,250 hectares.
Elders key account manager Andrew Farson, along with the Elders teams at Wongan Hills, Merredin and Kojonup are on hand from dawn to dusk, to help the Shields get the most from their business.
Mr Farson said he really gets a kick out of working with clients that are forward thinking and focussed on continuous development.
“The team at Glenvar are keen innovators and always looking to maximise opportunities, so helping them to find options and solutions is really rewarding,” Mr Farson said.
“Whether it is sourcing and transacting cropping land, to planning inputs and improving productivity, our team has seen Glenvar grow from strength to strength,” he said.
Glenvar specialises in producing premium grains using minimum tillage seeding techniques to further enhance soil conditions, and since 2010 have been recognised for sewing Western Australia’s largest GM canola crop at their Bodallin property.
The Shields family have been farming Western Australia’s golden wheat belt since 1925.
We live it at Bodallin
13
For
per
sona
l use
onl
y
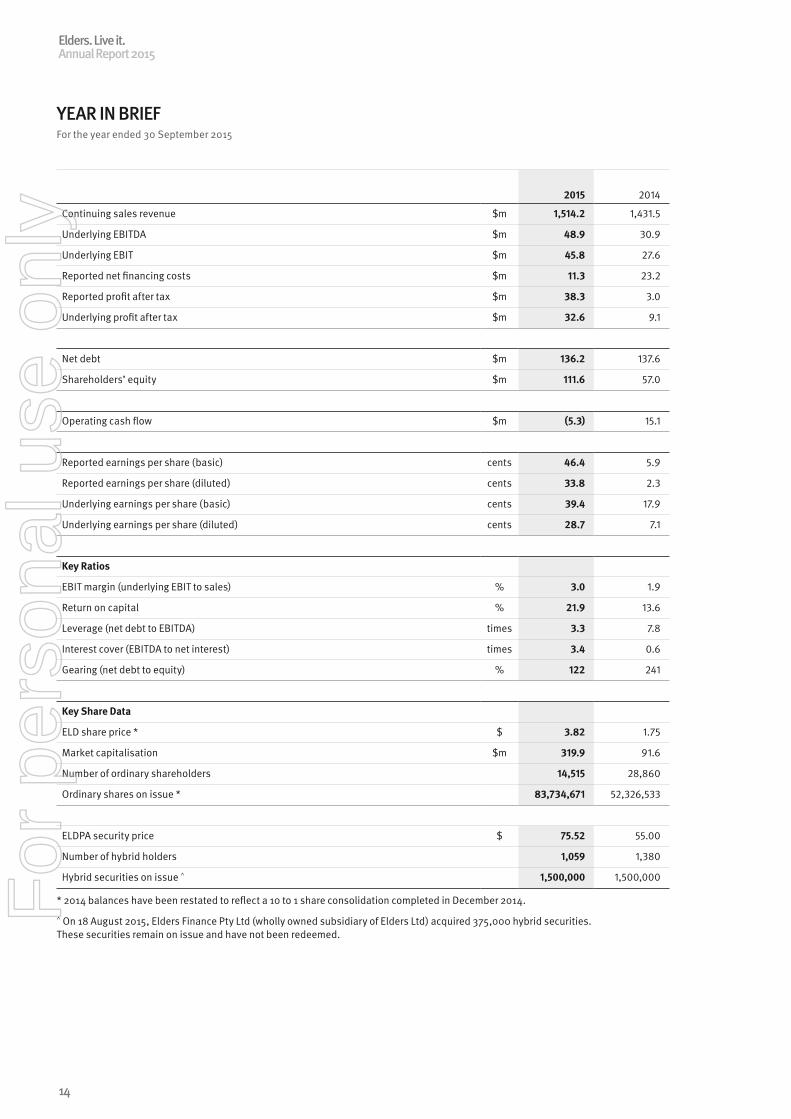
YEAR IN BRIEFFor the year ended 30 September 2015
2015 2014
Continuing sales revenue $m 1,514.2 1,431.5
Underlying EBITDA $m 48.9 30.9
Underlying EBIT $m 45.8 27.6
Reported net financing costs $m 11.3 23.2
Reported profit after tax $m 38.3 3.0
Underlying profit after tax $m 32.6 9.1
Net debt $m 136.2 137.6
Shareholders’ equity $m 111.6 57.0
Operating cash flow $m (5.3) 15.1
Reported earnings per share (basic) cents 46.4 5.9
Reported earnings per share (diluted) cents 33.8 2.3
Underlying earnings per share (basic) cents 39.4 17.9
Underlying earnings per share (diluted) cents 28.7 7.1
Key Ratios
EBIT margin (underlying EBIT to sales) % 3.0 1.9
Return on capital % 21.9 13.6
Leverage (net debt to EBITDA) times 3.3 7.8
Interest cover (EBITDA to net interest) times 3.4 0.6
Gearing (net debt to equity) % 122 241
Key Share Data
ELD share price * $ 3.82 1.75
Market capitalisation $m 319.9 91.6
Number of ordinary shareholders 14,515 28,860
Ordinary shares on issue * 83,734,671 52,326,533
ELDPA security price $ 75.52 55.00
Number of hybrid holders 1,059 1,380
Hybrid securities on issue ^ 1,500,000 1,500,000
* 2014 balances have been restated to reflect a 10 to 1 share consolidation completed in December 2014.
^ On 18 August 2015, Elders Finance Pty Ltd (wholly owned subsidiary of Elders Ltd) acquired 375,000 hybrid securities. These securities remain on issue and have not been redeemed.
Elders. Live it.Annual Report 2015
14
For
per
sona
l use
onl
y
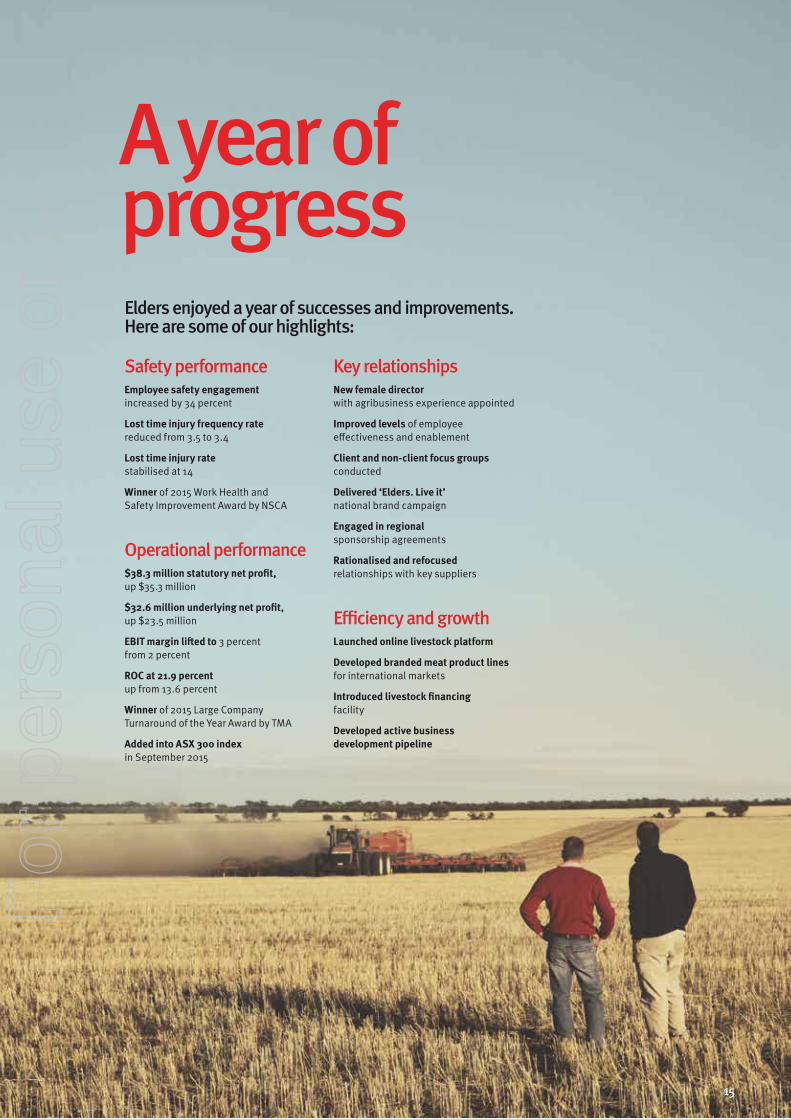
A year of progressElders enjoyed a year of successes and improvements. Here are some of our highlights:
Safety performanceEmployee safety engagement increased by 34 percent
Lost time injury frequency rate reduced from 3.5 to 3.4
Lost time injury rate stabilised at 14
Winner of 2015 Work Health and Safety Improvement Award by NSCA
Operational performance$38.3 million statutory net profit, up $35.3 million
$32.6 million underlying net profit, up $23.5 million
EBIT margin lifted to 3 percent from 2 percent
ROC at 21.9 percent up from 13.6 percent
Winner of 2015 Large Company Turnaround of the Year Award by TMA
Added into ASX 300 index in September 2015
Key relationshipsNew female director with agribusiness experience appointed
Improved levels of employee effectiveness and enablement
Client and non-client focus groups conducted
Delivered ‘Elders. Live it’ national brand campaign
Engaged in regional sponsorship agreements
Rationalised and refocused relationships with key suppliers
Efficiency and growthLaunched online livestock platform
Developed branded meat product lines for international markets
Introduced livestock financing facility
Developed active business development pipeline
15
For
per
sona
l use
onl
y
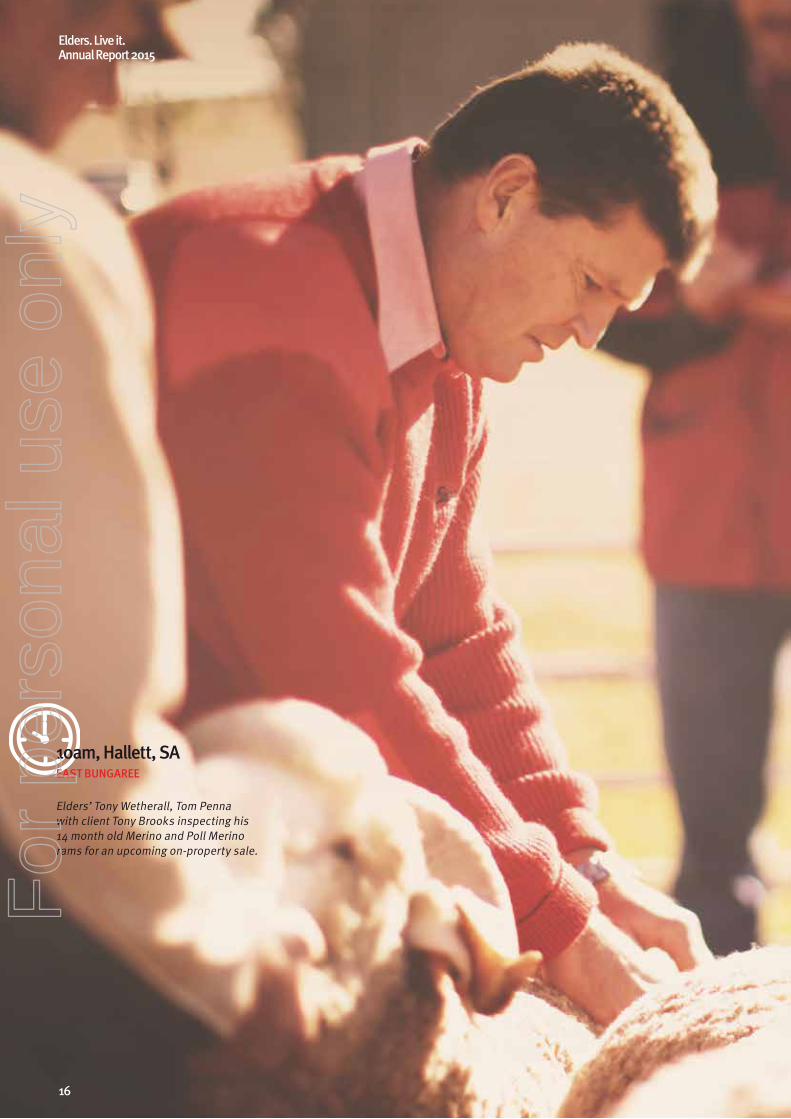
Elders’ Tony Wetherall, Tom Penna with client Tony Brooks inspecting his 14 month old Merino and Poll Merino rams for an upcoming on-property sale.
EAST BUNGAREE10am, Hallett, SA
16
Elders. Live it.Annual Report 2015
For
per
sona
l use
onl
y
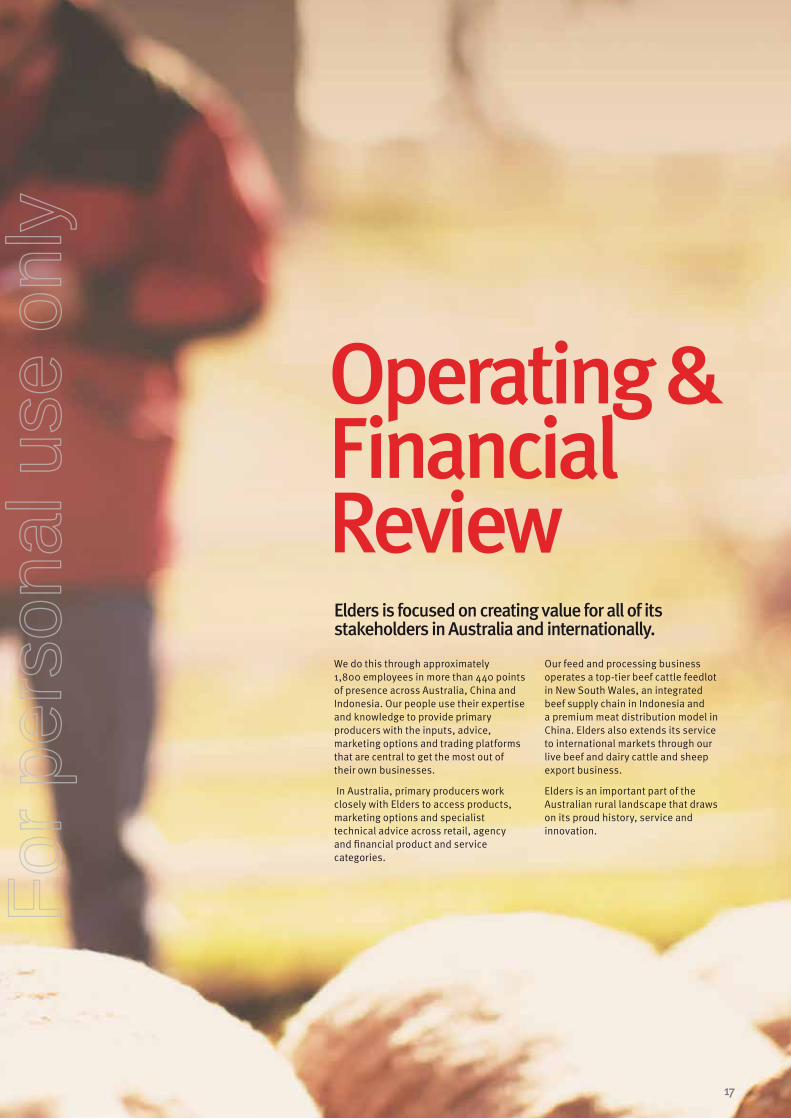
Operating & Financial ReviewElders is focused on creating value for all of its stakeholders in Australia and internationally.
We do this through approximately 1,800 employees in more than 440 points of presence across Australia, China and Indonesia. Our people use their expertise and knowledge to provide primary producers with the inputs, advice, marketing options and trading platforms that are central to get the most out of their own businesses.
In Australia, primary producers work closely with Elders to access products, marketing options and specialist technical advice across retail, agency and financial product and service categories.
Our feed and processing business operates a top-tier beef cattle feedlot in New South Wales, an integrated beef supply chain in Indonesia and a premium meat distribution model in China. Elders also extends its service to international markets through our live beef and dairy cattle and sheep export business.
Elders is an important part of the Australian rural landscape that draws on its proud history, service and innovation.
17
For
per
sona
l use
onl
y
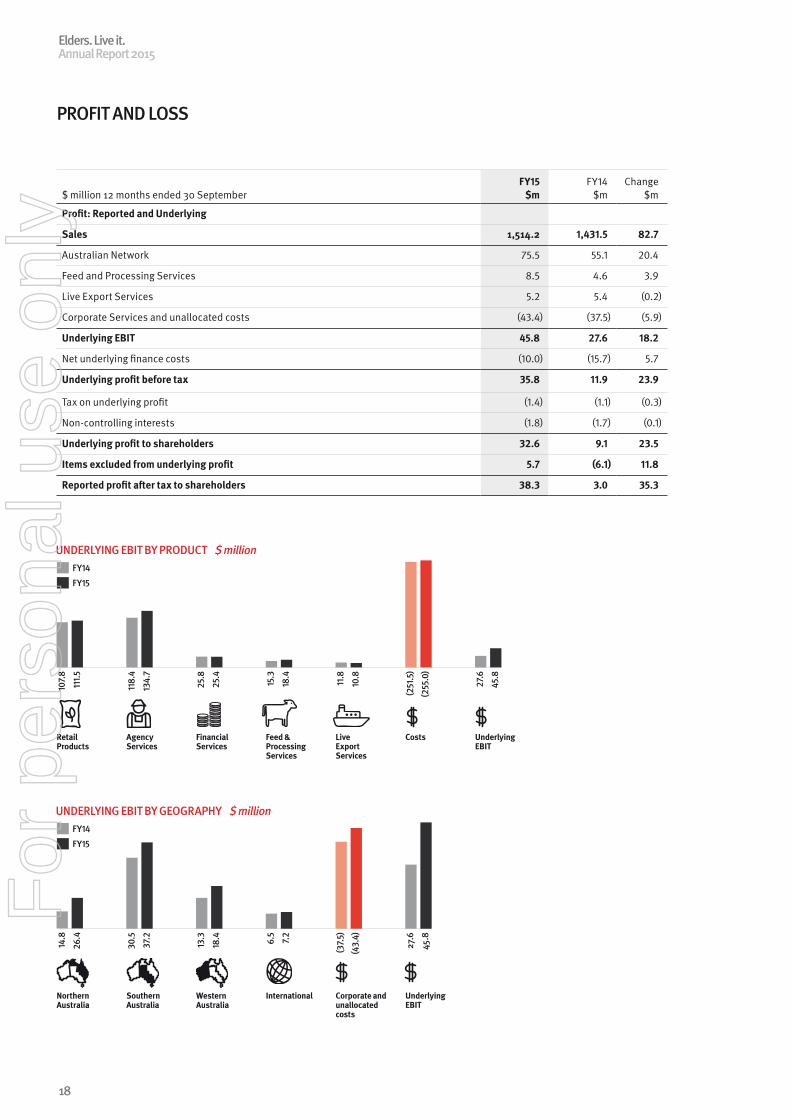
PROFIT AND LOSS
$ million 12 months ended 30 SeptemberFY15
$mFY14
$mChange
$m
Profit: Reported and Underlying
Sales 1,514.2 1,431.5 82.7
Australian Network 75.5 55.1 20.4
Feed and Processing Services 8.5 4.6 3.9
Live Export Services 5.2 5.4 (0.2)
Corporate Services and unallocated costs (43.4) (37.5) (5.9)
Underlying EBIT 45.8 27.6 18.2
Net underlying finance costs (10.0) (15.7) 5.7
Underlying profit before tax 35.8 11.9 23.9
Tax on underlying profit (1.4) (1.1) (0.3)
Non-controlling interests (1.8) (1.7) (0.1)
Underlying profit to shareholders 32.6 9.1 23.5
Items excluded from underlying profit 5.7 (6.1) 11.8
Reported profit after tax to shareholders 38.3 3.0 35.3
UNDERLYING EBIT BY PRODUCT $ million
Retail Products
Agency Services
Financial Services
Feed & Processing Services
Live Export Services
Costs Underlying EBIT
107.
8
118.
4
25.8
15.3
11.8
27.6
111.5
134.
7
25.4
18.4
10.8
(251
.5)
(255
.0)
45.8
FY14
FY15
UNDERLYING EBIT BY GEOGRAPHY $ million
14.8
26.4
FY14
FY15
30.5
13.3 6.5
(37.
5)
37.2
18.4 7.2
(43.
4)
27.6
45.8
Northern Australia
Southern Australia
Western Australia
International Corporate and unallocated costs
Underlying EBIT
Elders. Live it.Annual Report 2015
18
For
per
sona
l use
onl
y
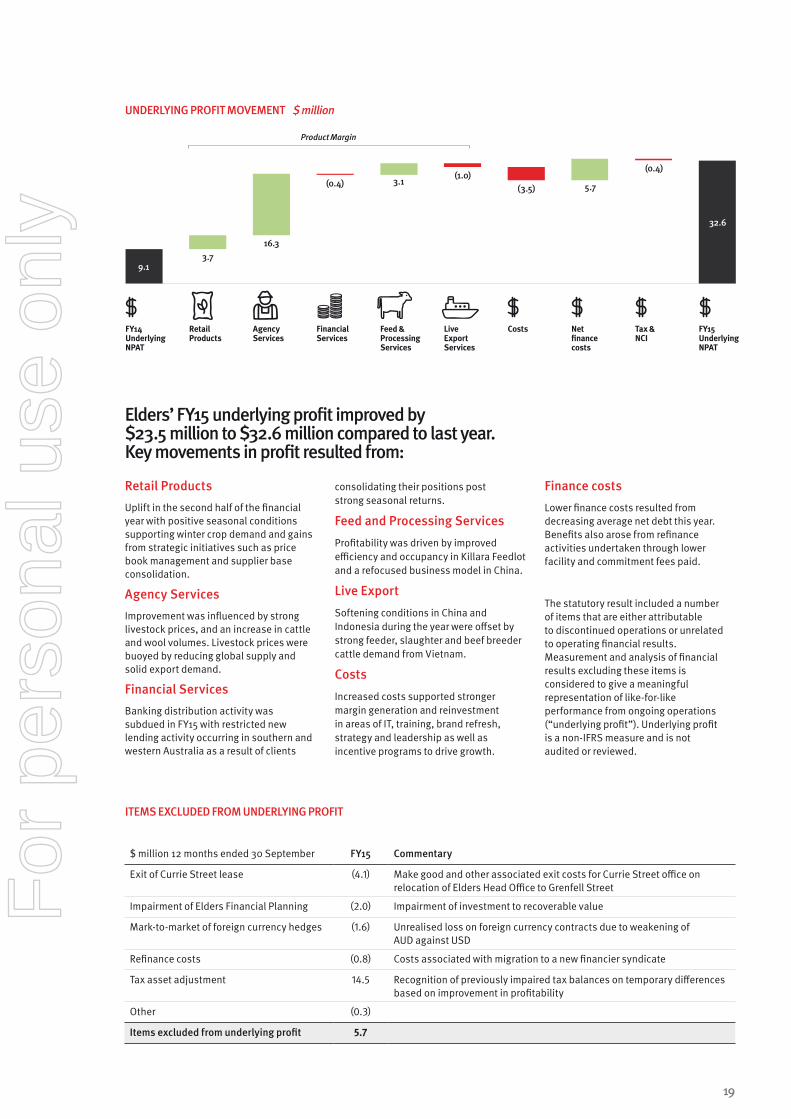
Elders’ FY15 underlying profit improved by $23.5 million to $32.6 million compared to last year. Key movements in profit resulted from:
Retail ProductsUplift in the second half of the financial year with positive seasonal conditions supporting winter crop demand and gains from strategic initiatives such as price book management and supplier base consolidation.
Agency ServicesImprovement was influenced by strong livestock prices, and an increase in cattle and wool volumes. Livestock prices were buoyed by reducing global supply and solid export demand.
Financial ServicesBanking distribution activity was subdued in FY15 with restricted new lending activity occurring in southern and western Australia as a result of clients
consolidating their positions post strong seasonal returns.
Feed and Processing Services
Profitability was driven by improved efficiency and occupancy in Killara Feedlot and a refocused business model in China.
Live Export
Softening conditions in China and Indonesia during the year were offset by strong feeder, slaughter and beef breeder cattle demand from Vietnam.
Costs
Increased costs supported stronger margin generation and reinvestment in areas of IT, training, brand refresh, strategy and leadership as well as incentive programs to drive growth.
Finance costsLower finance costs resulted from decreasing average net debt this year. Benefits also arose from refinance activities undertaken through lower facility and commitment fees paid.
The statutory result included a number of items that are either attributable to discontinued operations or unrelated to operating financial results. Measurement and analysis of financial results excluding these items is considered to give a meaningful representation of like-for-like performance from ongoing operations (“underlying profit”). Underlying profit is a non-IFRS measure and is not audited or reviewed.
$ million 12 months ended 30 September FY15 Commentary
Exit of Currie Street lease (4.1) Make good and other associated exit costs for Currie Street office on relocation of Elders Head Office to Grenfell Street
Impairment of Elders Financial Planning (2.0) Impairment of investment to recoverable value
Mark-to-market of foreign currency hedges (1.6) Unrealised loss on foreign currency contracts due to weakening of AUD against USD
Refinance costs (0.8) Costs associated with migration to a new financier syndicate
Tax asset adjustment 14.5 Recognition of previously impaired tax balances on temporary differences based on improvement in profitability
Other (0.3)
Items excluded from underlying profit 5.7
ITEMS EXCLUDED FROM UNDERLYING PROFIT
UNDERLYING PROFIT MOVEMENT $ million
9.13.7
16.3
(0.4) 3.1(1.0)
(3.5) 5.7
(0.4)
32.6
FY14Underlying NPAT
Retail Products
Agency Services
Financial Services
Feed & Processing Services
Live Export Services
Costs Net finance costs
Tax & NCI
FY15Underlying NPAT
Product Margin
19
For
per
sona
l use
onl
y
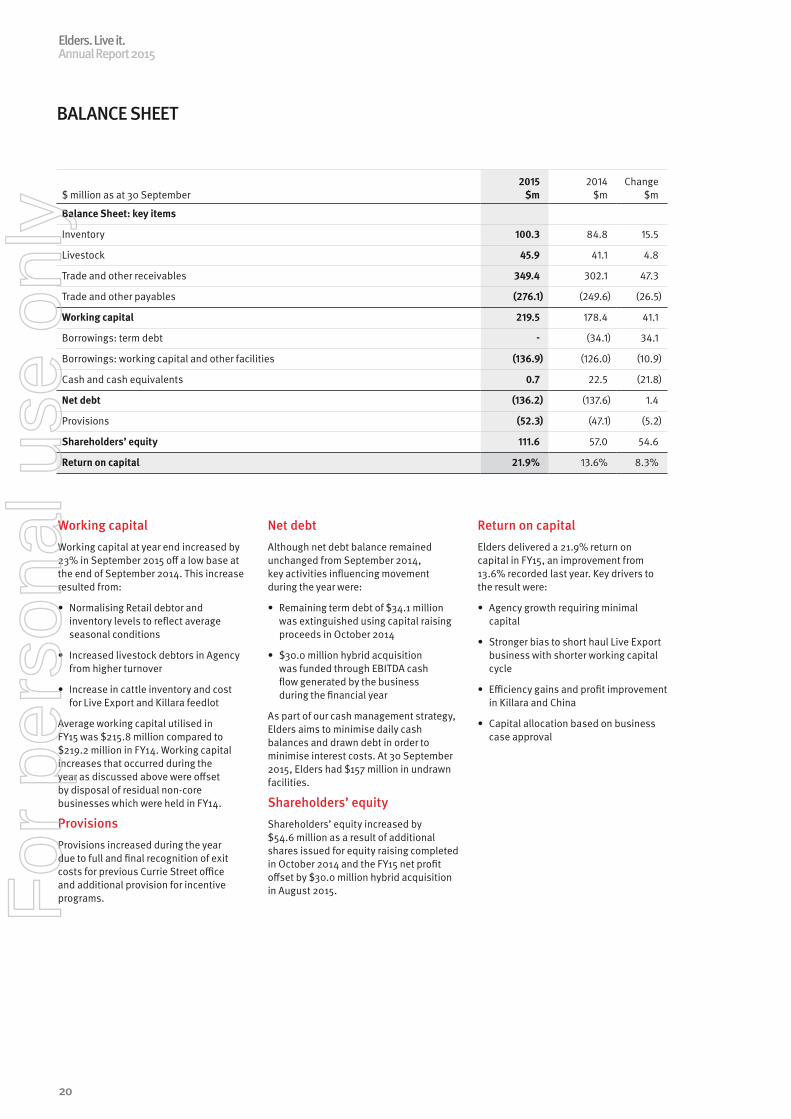
BALANCE SHEET
$ million as at 30 September2015
$m2014
$mChange
$m
Balance Sheet: key items
Inventory 100.3 84.8 15.5
Livestock 45.9 41.1 4.8
Trade and other receivables 349.4 302.1 47.3
Trade and other payables (276.1) (249.6) (26.5)
Working capital 219.5 178.4 41.1
Borrowings: term debt - (34.1) 34.1
Borrowings: working capital and other facilities (136.9) (126.0) (10.9)
Cash and cash equivalents 0.7 22.5 (21.8)
Net debt (136.2) (137.6) 1.4
Provisions (52.3) (47.1) (5.2)
Shareholders’ equity 111.6 57.0 54.6
Return on capital 21.9% 13.6% 8.3%
Working capitalWorking capital at year end increased by 23% in September 2015 off a low base at the end of September 2014. This increase resulted from:
• Normalising Retail debtor and inventory levels to reflect average seasonal conditions
• Increased livestock debtors in Agency from higher turnover
• Increase in cattle inventory and cost for Live Export and Killara feedlot
Average working capital utilised in FY15 was $215.8 million compared to $219.2 million in FY14. Working capital increases that occurred during the year as discussed above were offset by disposal of residual non-core businesses which were held in FY14.
ProvisionsProvisions increased during the year due to full and final recognition of exit costs for previous Currie Street office and additional provision for incentive programs.
Net debtAlthough net debt balance remained unchanged from September 2014, key activities influencing movement during the year were:
• Remaining term debt of $34.1 million was extinguished using capital raising proceeds in October 2014
• $30.0 million hybrid acquisition was funded through EBITDA cash flow generated by the business during the financial year
As part of our cash management strategy, Elders aims to minimise daily cash balances and drawn debt in order to minimise interest costs. At 30 September 2015, Elders had $157 million in undrawn facilities.
Shareholders’ equityShareholders’ equity increased by $54.6 million as a result of additional shares issued for equity raising completed in October 2014 and the FY15 net profit offset by $30.0 million hybrid acquisition in August 2015.
Return on capitalElders delivered a 21.9% return on capital in FY15, an improvement from 13.6% recorded last year. Key drivers to the result were:
• Agency growth requiring minimal capital
• Stronger bias to short haul Live Export business with shorter working capital cycle
• Efficiency gains and profit improvement in Killara and China
• Capital allocation based on business case approval
Elders. Live it.Annual Report 2015
20
For
per
sona
l use
onl
y
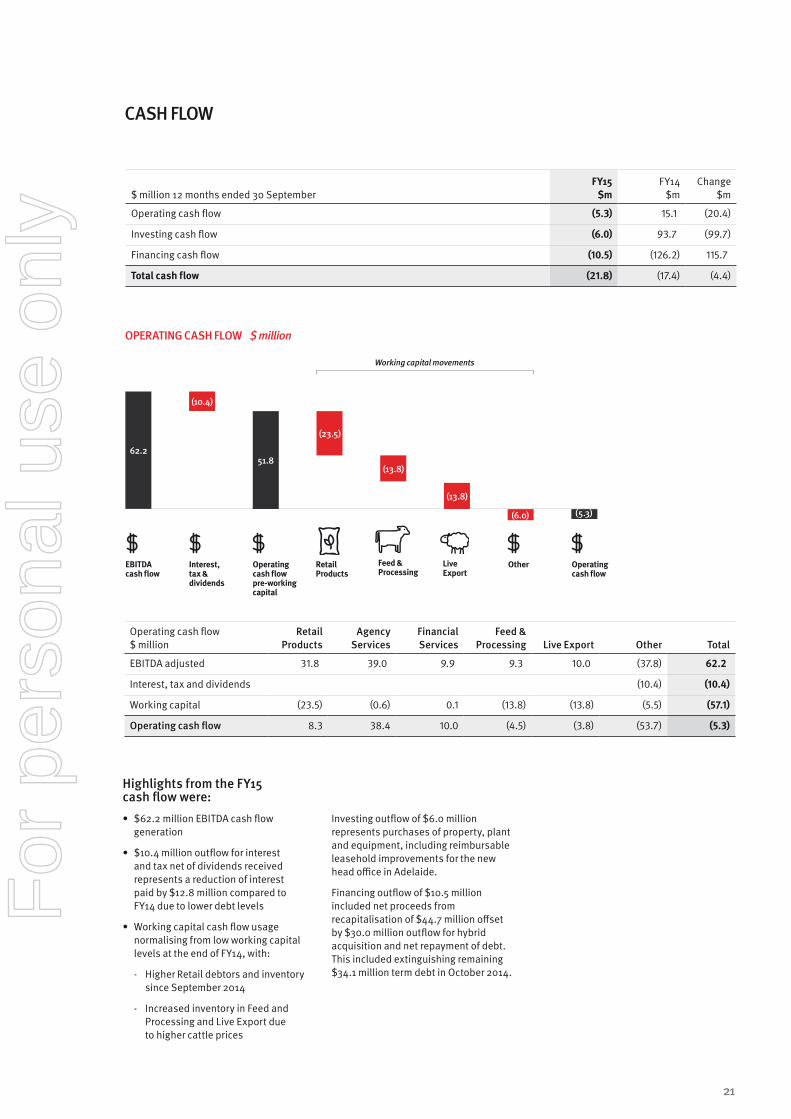
CASH FLOW
Highlights from the FY15 cash flow were: • $62.2 million EBITDA cash flow
generation
• $10.4 million outflow for interest and tax net of dividends received represents a reduction of interest paid by $12.8 million compared to FY14 due to lower debt levels
• Working capital cash flow usage normalising from low working capital levels at the end of FY14, with:
- Higher Retail debtors and inventory since September 2014
- Increased inventory in Feed and Processing and Live Export due to higher cattle prices
Investing outflow of $6.0 million represents purchases of property, plant and equipment, including reimbursable leasehold improvements for the new head office in Adelaide.
Financing outflow of $10.5 million included net proceeds from recapitalisation of $44.7 million offset by $30.0 million outflow for hybrid acquisition and net repayment of debt. This included extinguishing remaining $34.1 million term debt in October 2014.
OPERATING CASH FLOW $ million
(10.4)
Working capital movements
62.251.8
(13.8)
(23.5)
(13.8)
(6.0) (5.3)
EBITDA cash flow
RetailProducts
Live Export
Feed & Processing
Interest, tax & dividends
Operating cash flow pre-working capital
Other Operating cash flow
Operating cash flow $ million
Retail Products
Agency Services
Financial Services
Feed & Processing Live Export Other Total
EBITDA adjusted 31.8 39.0 9.9 9.3 10.0 (37.8) 62.2
Interest, tax and dividends (10.4) (10.4)
Working capital (23.5) (0.6) 0.1 (13.8) (13.8) (5.5) (57.1)
Operating cash flow 8.3 38.4 10.0 (4.5) (3.8) (53.7) (5.3)
$ million 12 months ended 30 SeptemberFY15
$mFY14
$mChange
$m
Operating cash flow (5.3) 15.1 (20.4)
Investing cash flow (6.0) 93.7 (99.7)
Financing cash flow (10.5) (126.2) 115.7
Total cash flow (21.8) (17.4) (4.4)
21
For
per
sona
l use
onl
y
OPERATING & FINANCIAL REVIEW
Review of Operations
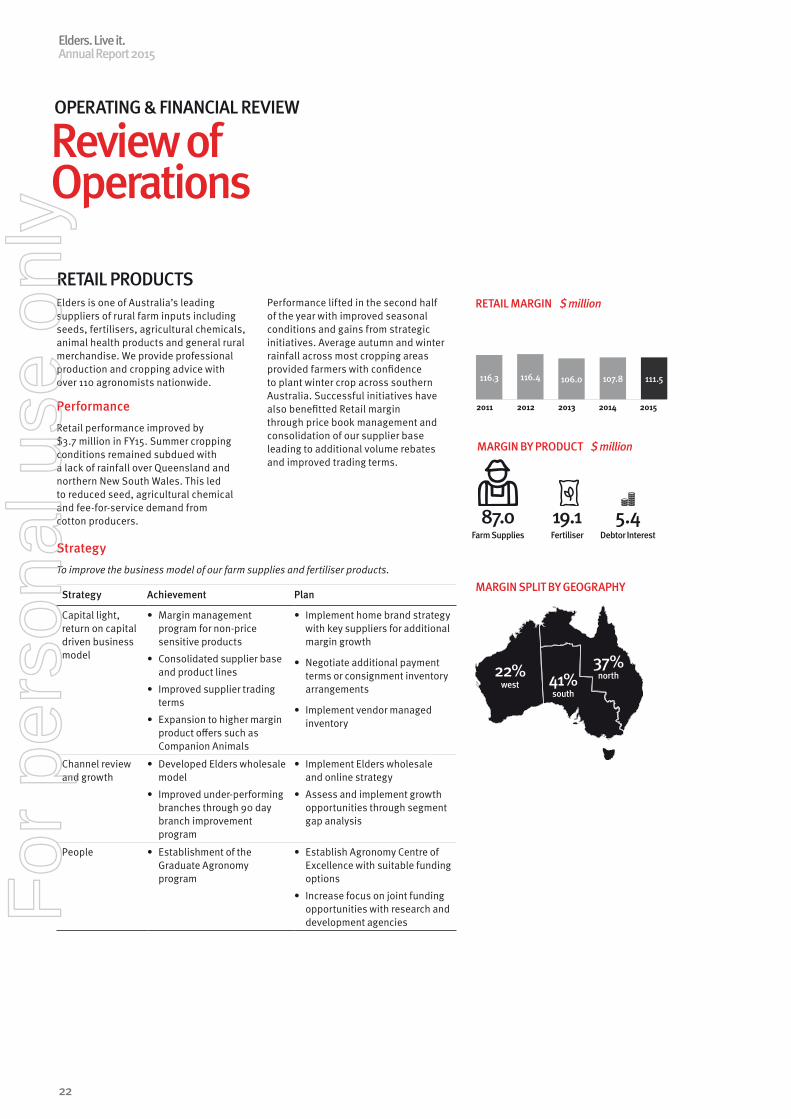
RETAIL PRODUCTSElders is one of Australia’s leading suppliers of rural farm inputs including seeds, fertilisers, agricultural chemicals, animal health products and general rural merchandise. We provide professional production and cropping advice with over 110 agronomists nationwide.
PerformanceRetail performance improved by $3.7 million in FY15. Summer cropping conditions remained subdued with a lack of rainfall over Queensland and northern New South Wales. This led to reduced seed, agricultural chemical and fee-for-service demand from cotton producers.
Performance lifted in the second half of the year with improved seasonal conditions and gains from strategic initiatives. Average autumn and winter rainfall across most cropping areas provided farmers with confidence to plant winter crop across southern Australia. Successful initiatives have also benefitted Retail margin through price book management and consolidation of our supplier base leading to additional volume rebates and improved trading terms.
MARGIN SPLIT BY GEOGRAPHY
MARGIN BY PRODUCT $ million
Farm Supplies
87.0Fertiliser
19.1Debtor Interest
5.4
Strategy Achievement Plan
Capital light, return on capital driven business model
• Margin management program for non-price sensitive products
• Consolidated supplier base and product lines
• Improved supplier trading terms
• Expansion to higher margin product offers such as Companion Animals
• Implement home brand strategy with key suppliers for additional margin growth
• Negotiate additional payment terms or consignment inventory arrangements
• Implement vendor managed inventory
Channel review and growth
• Developed Elders wholesale model
• Improved under-performing branches through 90 day branch improvement program
• Implement Elders wholesale and online strategy
• Assess and implement growth opportunities through segment gap analysis
People • Establishment of the Graduate Agronomy program
• Establish Agronomy Centre of Excellence with suitable funding options
• Increase focus on joint funding opportunities with research and development agencies
StrategyTo improve the business model of our farm supplies and fertiliser products.
RETAIL MARGIN $ million
2011 2014 2015
116.3 106.0 107.8116.4
2012 2013
111.5
22% west 41%
south
37% north
Elders. Live it.Annual Report 2015
22
For
per
sona
l use
onl
y
AGENCY SERVICESElders provides a range of marketing options for livestock, real estate, wool, and grain.
LivestockThe Elders livestock network comprises livestock agents and employees operating across Australia conducting on-farm sales to third parties, regular physical and online public livestock auctions and direct sales into Elders-owned and third-party feedlots and livestock exporters.
Real EstateElders’ real estate agency and property management services are primarily conducted in the broadacre and rural residential markets through its rural branches and real estate offices. Residential and metropolitan real estate services are mostly conducted through Elders’ network of franchise offices.
WoolElders is one of the largest agents for the sale of Australian greasy wool and operates a brokering service for wool growers. Our team of dedicated wool specialists assists clients with wool marketing, in-shed wool preparation, ram selection and sheep classing.
GrainElders offers grain growers a range of cash-based grain marketing options. A new accumulation model supported by multiple buyers will be launched in FY16.
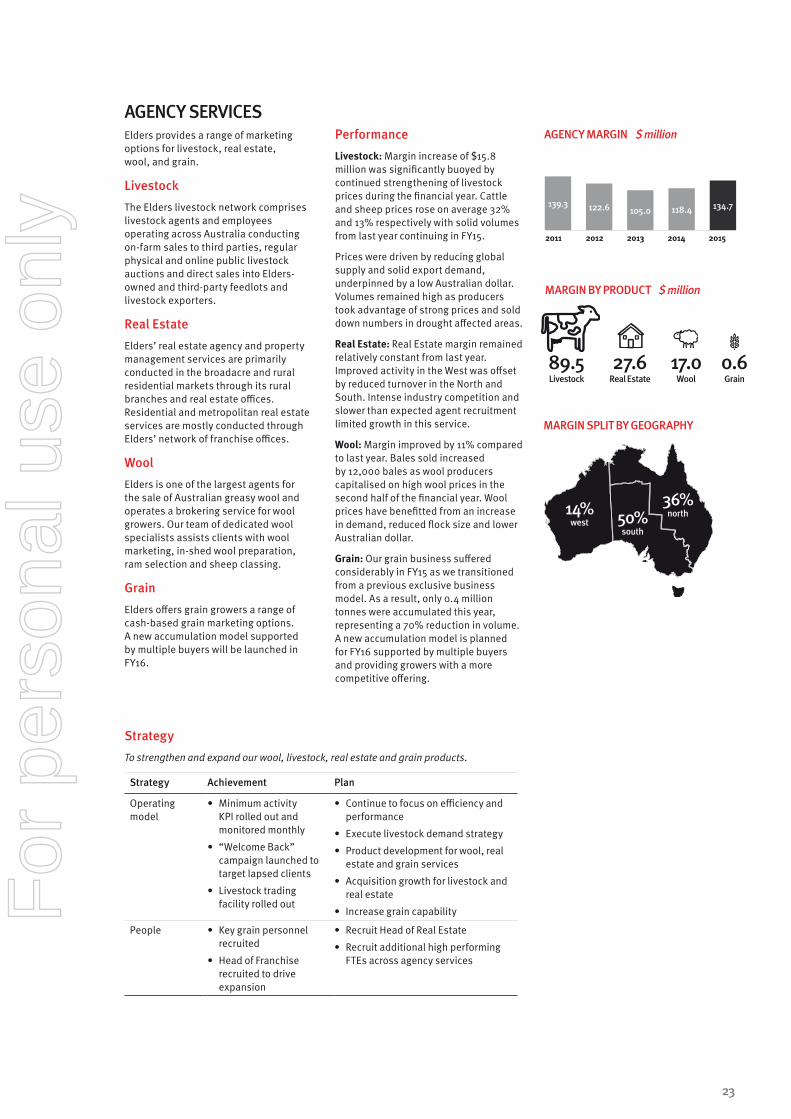
PerformanceLivestock: Margin increase of $15.8 million was significantly buoyed by continued strengthening of livestock prices during the financial year. Cattle and sheep prices rose on average 32% and 13% respectively with solid volumes from last year continuing in FY15.
Prices were driven by reducing global supply and solid export demand, underpinned by a low Australian dollar. Volumes remained high as producers took advantage of strong prices and sold down numbers in drought affected areas.
Real Estate: Real Estate margin remained relatively constant from last year. Improved activity in the West was offset by reduced turnover in the North and South. Intense industry competition and slower than expected agent recruitment limited growth in this service.
Wool: Margin improved by 11% compared to last year. Bales sold increased by 12,000 bales as wool producers capitalised on high wool prices in the second half of the financial year. Wool prices have benefitted from an increase in demand, reduced flock size and lower Australian dollar.
Grain: Our grain business suffered considerably in FY15 as we transitioned from a previous exclusive business model. As a result, only 0.4 million tonnes were accumulated this year, representing a 70% reduction in volume. A new accumulation model is planned for FY16 supported by multiple buyers and providing growers with a more competitive offering.
Strategy Achievement Plan
Operating model
• Minimum activity KPI rolled out and monitored monthly
• “Welcome Back” campaign launched to target lapsed clients
• Livestock trading facility rolled out
• Continue to focus on efficiency and performance
• Execute livestock demand strategy
• Product development for wool, real estate and grain services
• Acquisition growth for livestock and real estate
• Increase grain capability
People • Key grain personnel recruited
• Head of Franchise recruited to drive expansion
• Recruit Head of Real Estate
• Recruit additional high performing FTEs across agency services
StrategyTo strengthen and expand our wool, livestock, real estate and grain products.
AGENCY MARGIN $ million
MARGIN SPLIT BY GEOGRAPHY
MARGIN BY PRODUCT $ million
Livestock89.5
Real Estate27.6
Grain0.6
Wool17.0
2011 2014 2015
139.3105.0 118.4122.6
2012 2013
134.7
14% west 50%
south
36% north
23
For
per
sona
l use
onl
y
FINANCIAL SERVICES Elders distributes a wide range of financial services through its Australian network.
Our banking and insurance activities are undertaken in partnerships with Rural Bank and Elders Insurance (a QBE subsidiary) respectively, whilst Elders Financial Planning is facilitated through a joint venture with the ANZ Group.
Collectively they facilitate a broad spectrum of activities from various banking products such as deposits, loans, seasonal finance and livestock trading facilities; and financial planning products such as risk management, superannuation and wealth creation as well as succession planning.
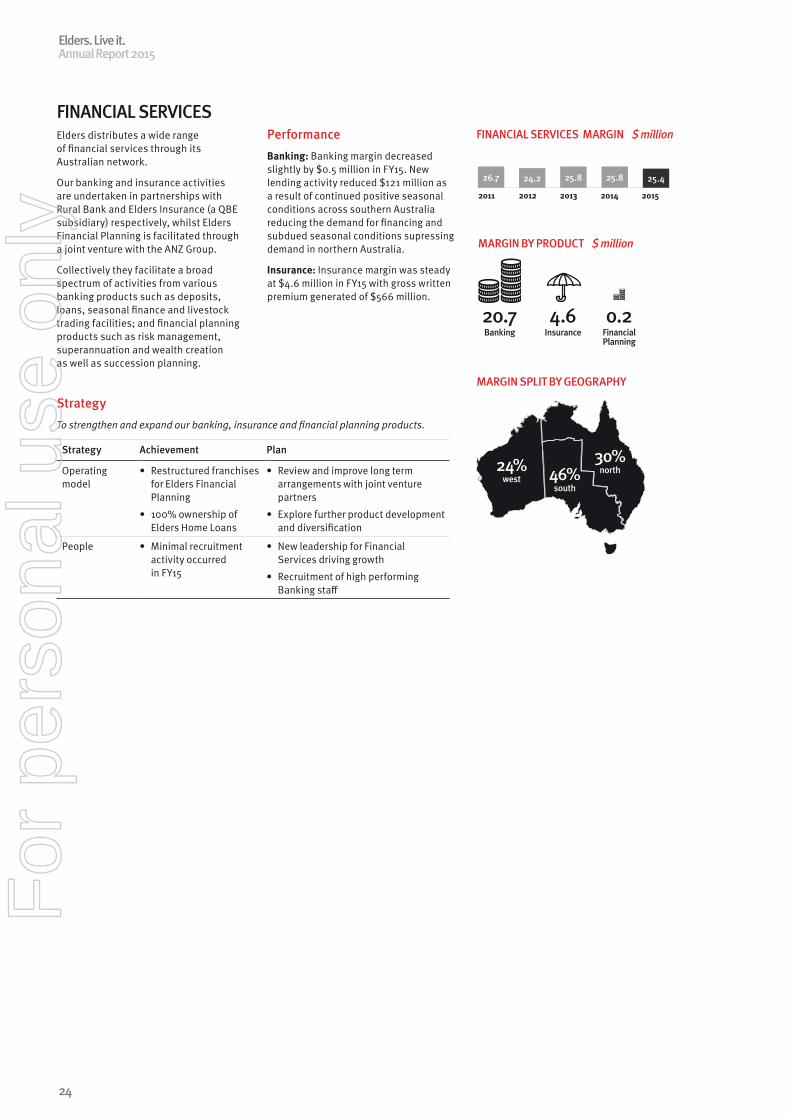
PerformanceBanking: Banking margin decreased slightly by $0.5 million in FY15. New lending activity reduced $121 million as a result of continued positive seasonal conditions across southern Australia reducing the demand for financing and subdued seasonal conditions supressing demand in northern Australia.
Insurance: Insurance margin was steady at $4.6 million in FY15 with gross written premium generated of $566 million.
Strategy Achievement Plan
Operating model
• Restructured franchises for Elders Financial Planning
• 100% ownership of Elders Home Loans
• Review and improve long term arrangements with joint venture partners
• Explore further product development and diversification
People • Minimal recruitment activity occurred in FY15
• New leadership for Financial Services driving growth
• Recruitment of high performing Banking staff
StrategyTo strengthen and expand our banking, insurance and financial planning products.
FINANCIAL SERVICES MARGIN $ million
MARGIN SPLIT BY GEOGRAPHY
MARGIN BY PRODUCT $ million
Banking20.7
Insurance4.6
Financial Planning
0.2
2011 2014 2015
26.7 25.8 25.824.2
2012 2013
25.4
24% west 46%
south
30% north
Elders. Live it.Annual Report 2015
24
For
per
sona
l use
onl
y

FEED & PROCESSING SERVICES In Australia, Elders operates Killara Feedlot, a beef cattle feedlot near Tamworth in New South Wales. In Indonesia, Elders operates an integrated feedlot, abattoir and meat distribution business. Elders imports, processes and distributes premium Australian meat in China.
PerformanceKillara Feedlot: The feedlot achieved solid performance in FY15 with margins increasing by $2.9 million from last year. Despite challenges posed by high livestock prices, strategic portfolio management allowed the business to maximise profitability by increasing efficiency and capacity to 90%. It is anticipated that this high utilisation will ease in FY16 in line with a more sustainable operating model.
Indonesia: Margin for Indonesia was lower by 4% compared to FY14. Activity in Indonesia is reliant on live export quotas issued by the Indonesian government. As a result of domestic policy for self-sustainability, quotas issued reduced by 32,000 heads in FY15 which affected the performance of the feedlot and abattoir through lower occupancy levels. Lower volumes however drove higher market prices for beef in Indonesia.
China: The restructured Elders China business is now focused on premium meat and burger sales. The business is profitable with margin increasing by $0.4 million and costs decreasing by $0.7 million compared to last year. The impact of higher meat prices were largely offset by lower Australian dollar.
Strategy Achievement Plan
Robust systems • Deployed new operating system in Indonesia increasing efficiency and transparency
• Increased oversight and review with quarterly board meetings
• Review and upgrade forecasting and supply chain management systems for China
Return on capital focus
• Minor feedlot expansion in Indonesia completed
• Maximised return for Killara with strategic management
• China business restructure completed and now profitable
• Further expansion of Indonesian feedlot once operating conditions improve
• Growth in Elders China business customers and footprint
Integrated red meat supply chain
• Developed meat brands Killara, Kooyong and Marlee, as premium meat products
• Execute strategy for entry to Vietnam meat supply chain
StrategyTo improve and expand our feed and processing business.
MARGIN BY PRODUCT & GEOGRAPHY $ million
Killara (Australia)
11.2Indonesia4.6
China2.6
2011 2014 2015
8.613.5 15.3
10.9
2012 2013
FEED & PROCESSING MARGIN $ million
18.4
25
For
per
sona
l use
onl
y
LIVE EXPORT SERVICES Elders exports live dairy, feeder, slaughter and breeding cattle and breeding sheep to well-developed and where relevant, ESCAS approved, supply chains in a range of international markets. Livestock are transported by sea or air freight depending on the market requirements.
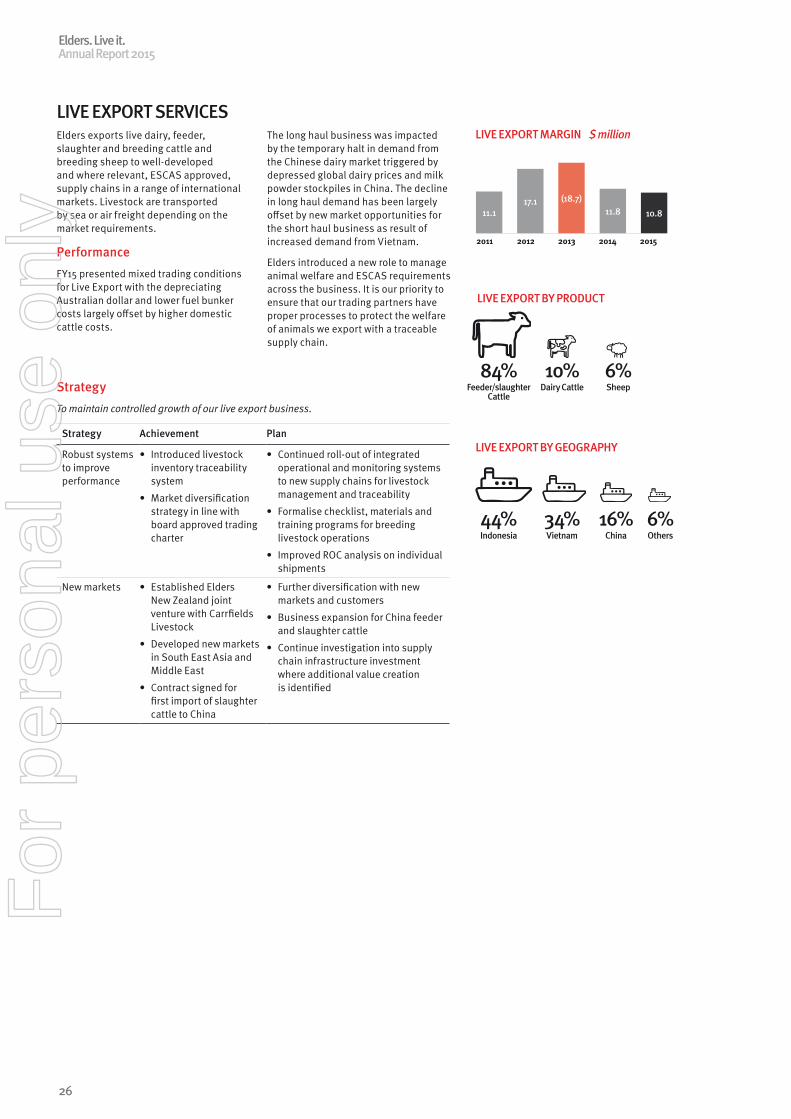
PerformanceFY15 presented mixed trading conditions for Live Export with the depreciating Australian dollar and lower fuel bunker costs largely offset by higher domestic cattle costs.
The long haul business was impacted by the temporary halt in demand from the Chinese dairy market triggered by depressed global dairy prices and milk powder stockpiles in China. The decline in long haul demand has been largely offset by new market opportunities for the short haul business as result of increased demand from Vietnam.
Elders introduced a new role to manage animal welfare and ESCAS requirements across the business. It is our priority to ensure that our trading partners have proper processes to protect the welfare of animals we export with a traceable supply chain.
Strategy Achievement Plan
Robust systems to improve performance
• Introduced livestock inventory traceability system
• Market diversification strategy in line with board approved trading charter
• Continued roll-out of integrated operational and monitoring systems to new supply chains for livestock management and traceability
• Formalise checklist, materials and training programs for breeding livestock operations
• Improved ROC analysis on individual shipments
New markets • Established Elders New Zealand joint venture with Carrfields Livestock
• Developed new markets in South East Asia and Middle East
• Contract signed for first import of slaughter cattle to China
• Further diversification with new markets and customers
• Business expansion for China feeder and slaughter cattle
• Continue investigation into supply chain infrastructure investment where additional value creation is identified
StrategyTo maintain controlled growth of our live export business.
LIVE EXPORT BY PRODUCT
Feeder/slaughter Cattle
84%Dairy Cattle10%
Sheep6%
LIVE EXPORT BY GEOGRAPHY
Indonesia44%
Vietnam34%
China16%
Others6%
2011 2014 2015
11.1(18.7)
11.817.1
2012 2013
LIVE EXPORT MARGIN $ million
10.8
Elders. Live it.Annual Report 2015
26
For
per
sona
l use
onl
y
OPERATING & FINANCIAL REVIEW
Outlook
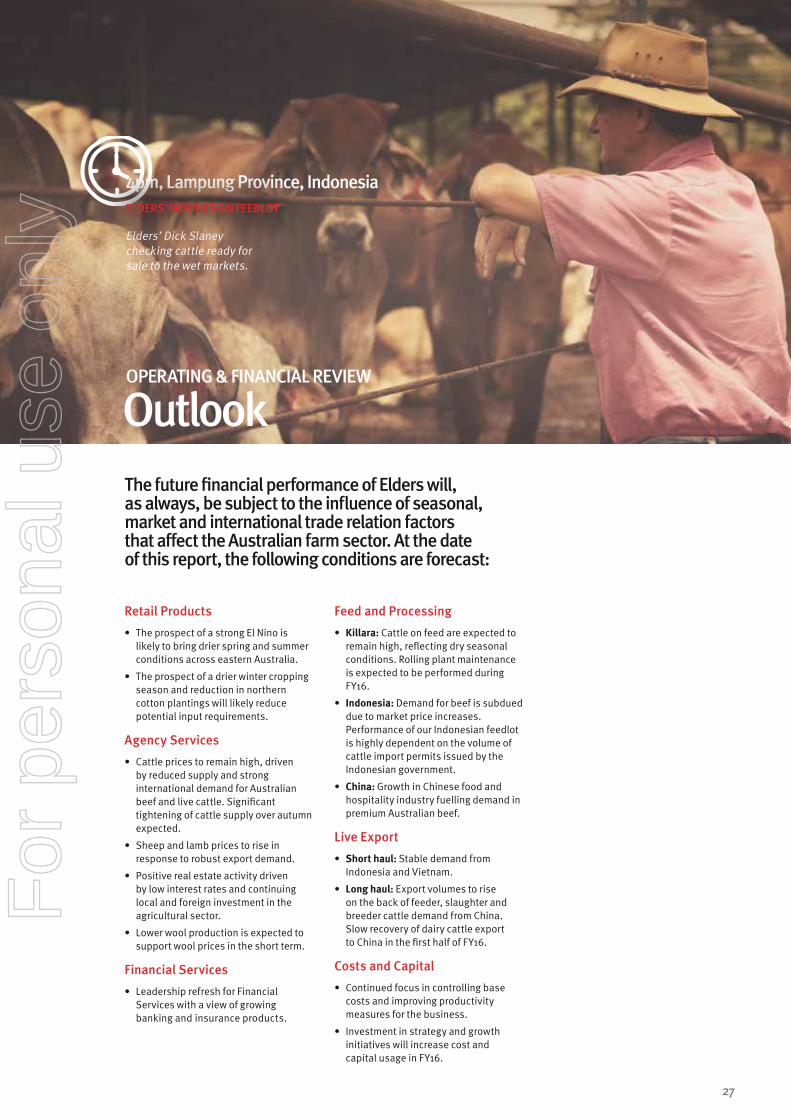
Retail Products• The prospect of a strong El Nino is
likely to bring drier spring and summer conditions across eastern Australia.
• The prospect of a drier winter cropping season and reduction in northern cotton plantings will likely reduce potential input requirements.
Agency Services • Cattle prices to remain high, driven
by reduced supply and strong international demand for Australian beef and live cattle. Significant tightening of cattle supply over autumn expected.
• Sheep and lamb prices to rise in response to robust export demand.
• Positive real estate activity driven by low interest rates and continuing local and foreign investment in the agricultural sector.
• Lower wool production is expected to support wool prices in the short term.
Financial Services • Leadership refresh for Financial
Services with a view of growing banking and insurance products.
Feed and Processing • Killara: Cattle on feed are expected to
remain high, reflecting dry seasonal conditions. Rolling plant maintenance is expected to be performed during FY16.
• Indonesia: Demand for beef is subdued due to market price increases. Performance of our Indonesian feedlot is highly dependent on the volume of cattle import permits issued by the Indonesian government.
• China: Growth in Chinese food and hospitality industry fuelling demand in premium Australian beef.
Live Export • Short haul: Stable demand from
Indonesia and Vietnam.
• Long haul: Export volumes to rise on the back of feeder, slaughter and breeder cattle demand from China. Slow recovery of dairy cattle export to China in the first half of FY16.
Costs and Capital• Continued focus in controlling base
costs and improving productivity measures for the business.
• Investment in strategy and growth initiatives will increase cost and capital usage in FY16.
The future financial performance of Elders will, as always, be subject to the influence of seasonal, market and international trade relation factors that affect the Australian farm sector. At the date of this report, the following conditions are forecast:
4pm, Lampung Province, Indonesia
Elders’ Dick Slaney checking cattle ready for sale to the wet markets.
ELDERS’ INDONESIAN FEEDLOT
27
For
per
sona
l use
onl
y
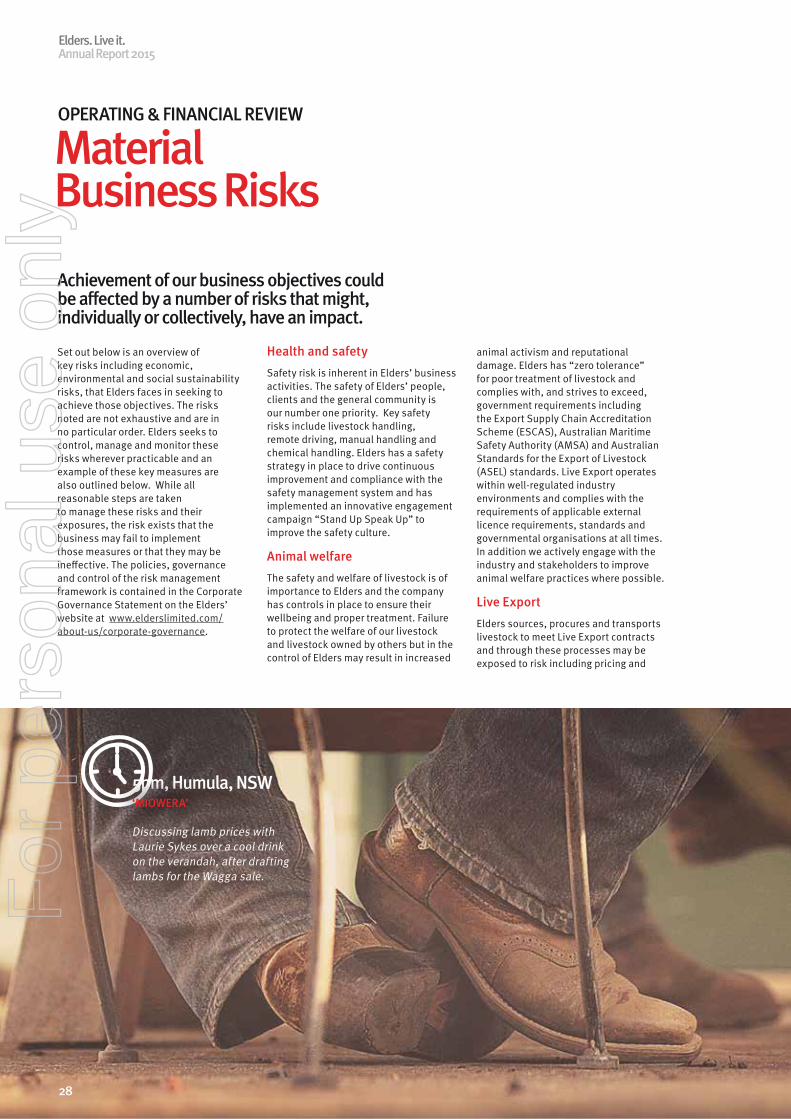
Achievement of our business objectives could be affected by a number of risks that might, individually or collectively, have an impact.
Set out below is an overview of key risks including economic, environmental and social sustainability risks, that Elders faces in seeking to achieve those objectives. The risks noted are not exhaustive and are in no particular order. Elders seeks to control, manage and monitor these risks wherever practicable and an example of these key measures are also outlined below. While all reasonable steps are taken to manage these risks and their exposures, the risk exists that the business may fail to implement those measures or that they may be ineffective. The policies, governance and control of the risk management framework is contained in the Corporate Governance Statement on the Elders’ website at www.elderslimited.com/about-us/corporate-governance.
Health and safetySafety risk is inherent in Elders’ business activities. The safety of Elders’ people, clients and the general community is our number one priority. Key safety risks include livestock handling, remote driving, manual handling and chemical handling. Elders has a safety strategy in place to drive continuous improvement and compliance with the safety management system and has implemented an innovative engagement campaign “Stand Up Speak Up” to improve the safety culture.
Animal welfareThe safety and welfare of livestock is of importance to Elders and the company has controls in place to ensure their wellbeing and proper treatment. Failure to protect the welfare of our livestock and livestock owned by others but in the control of Elders may result in increased
animal activism and reputational damage. Elders has “zero tolerance” for poor treatment of livestock and complies with, and strives to exceed, government requirements including the Export Supply Chain Accreditation Scheme (ESCAS), Australian Maritime Safety Authority (AMSA) and Australian Standards for the Export of Livestock (ASEL) standards. Live Export operates within well-regulated industry environments and complies with the requirements of applicable external licence requirements, standards and governmental organisations at all times. In addition we actively engage with the industry and stakeholders to improve animal welfare practices where possible.
Live Export Elders sources, procures and transports livestock to meet Live Export contracts and through these processes may be exposed to risk including pricing and
5pm, Humula, NSW
Discussing lamb prices with Laurie Sykes over a cool drink on the verandah, after drafting lambs for the Wagga sale.
‘MIOWERA’
OPERATING & FINANCIAL REVIEW
Material Business Risks
28
Elders. Live it.Annual Report 2015Elders. Live it.Annual Report 2015
For
per
sona
l use
onl
y
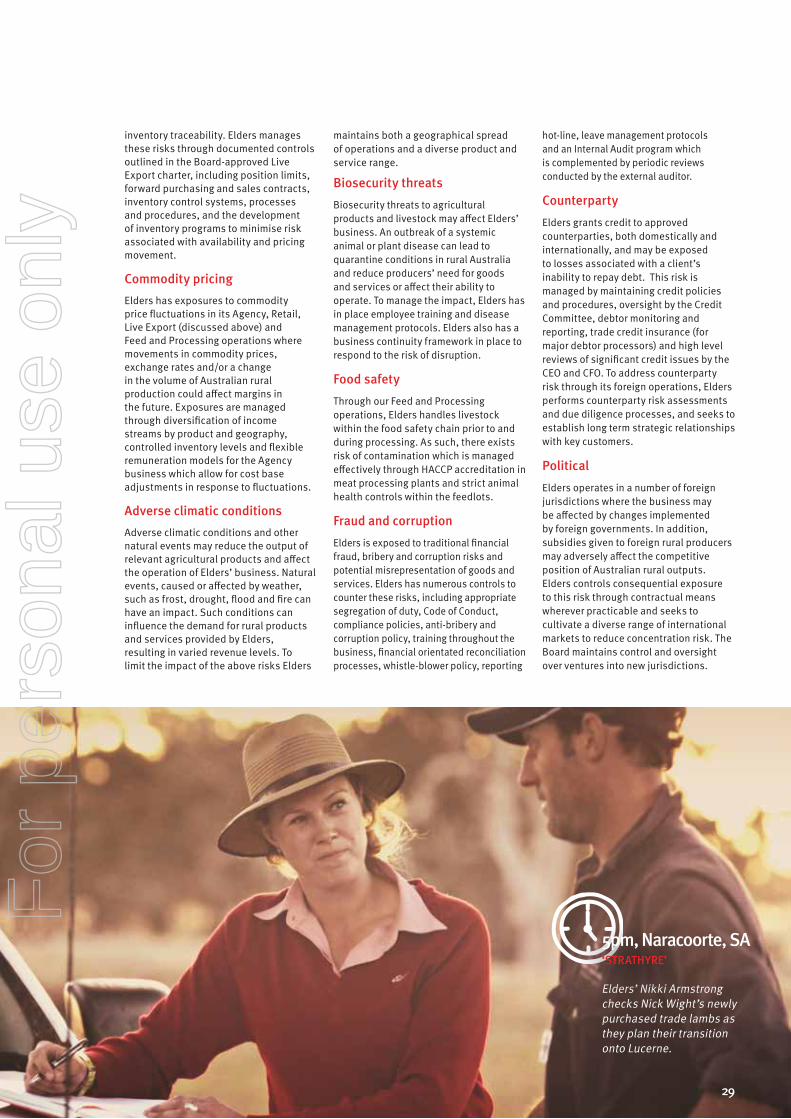
inventory traceability. Elders manages these risks through documented controls outlined in the Board-approved Live Export charter, including position limits, forward purchasing and sales contracts, inventory control systems, processes and procedures, and the development of inventory programs to minimise risk associated with availability and pricing movement.
Commodity pricingElders has exposures to commodity price fluctuations in its Agency, Retail, Live Export (discussed above) and Feed and Processing operations where movements in commodity prices, exchange rates and/or a change in the volume of Australian rural production could affect margins in the future. Exposures are managed through diversification of income streams by product and geography, controlled inventory levels and flexible remuneration models for the Agency business which allow for cost base adjustments in response to fluctuations.
Adverse climatic conditionsAdverse climatic conditions and other natural events may reduce the output of relevant agricultural products and affect the operation of Elders’ business. Natural events, caused or affected by weather, such as frost, drought, flood and fire can have an impact. Such conditions can influence the demand for rural products and services provided by Elders, resulting in varied revenue levels. To limit the impact of the above risks Elders
maintains both a geographical spread of operations and a diverse product and service range.
Biosecurity threats
Biosecurity threats to agricultural products and livestock may affect Elders’ business. An outbreak of a systemic animal or plant disease can lead to quarantine conditions in rural Australia and reduce producers’ need for goods and services or affect their ability to operate. To manage the impact, Elders has in place employee training and disease management protocols. Elders also has a business continuity framework in place to respond to the risk of disruption.
Food safety
Through our Feed and Processing operations, Elders handles livestock within the food safety chain prior to and during processing. As such, there exists risk of contamination which is managed effectively through HACCP accreditation in meat processing plants and strict animal health controls within the feedlots.
Fraud and corruption
Elders is exposed to traditional financial fraud, bribery and corruption risks and potential misrepresentation of goods and services. Elders has numerous controls to counter these risks, including appropriate segregation of duty, Code of Conduct, compliance policies, anti-bribery and corruption policy, training throughout the business, financial orientated reconciliation processes, whistle-blower policy, reporting
hot-line, leave management protocols and an Internal Audit program which is complemented by periodic reviews conducted by the external auditor.
Counterparty
Elders grants credit to approved counterparties, both domestically and internationally, and may be exposed to losses associated with a client’s inability to repay debt. This risk is managed by maintaining credit policies and procedures, oversight by the Credit Committee, debtor monitoring and reporting, trade credit insurance (for major debtor processors) and high level reviews of significant credit issues by the CEO and CFO. To address counterparty risk through its foreign operations, Elders performs counterparty risk assessments and due diligence processes, and seeks to establish long term strategic relationships with key customers.
Political
Elders operates in a number of foreign jurisdictions where the business may be affected by changes implemented by foreign governments. In addition, subsidies given to foreign rural producers may adversely affect the competitive position of Australian rural outputs. Elders controls consequential exposure to this risk through contractual means wherever practicable and seeks to cultivate a diverse range of international markets to reduce concentration risk. The Board maintains control and oversight over ventures into new jurisdictions.
Elders’ Nikki Armstrong checks Nick Wight’s newly purchased trade lambs as they plan their transition onto Lucerne.
‘STRATHYRE’5pm, Naracoorte, SA
29
For
per
sona
l use
onl
y
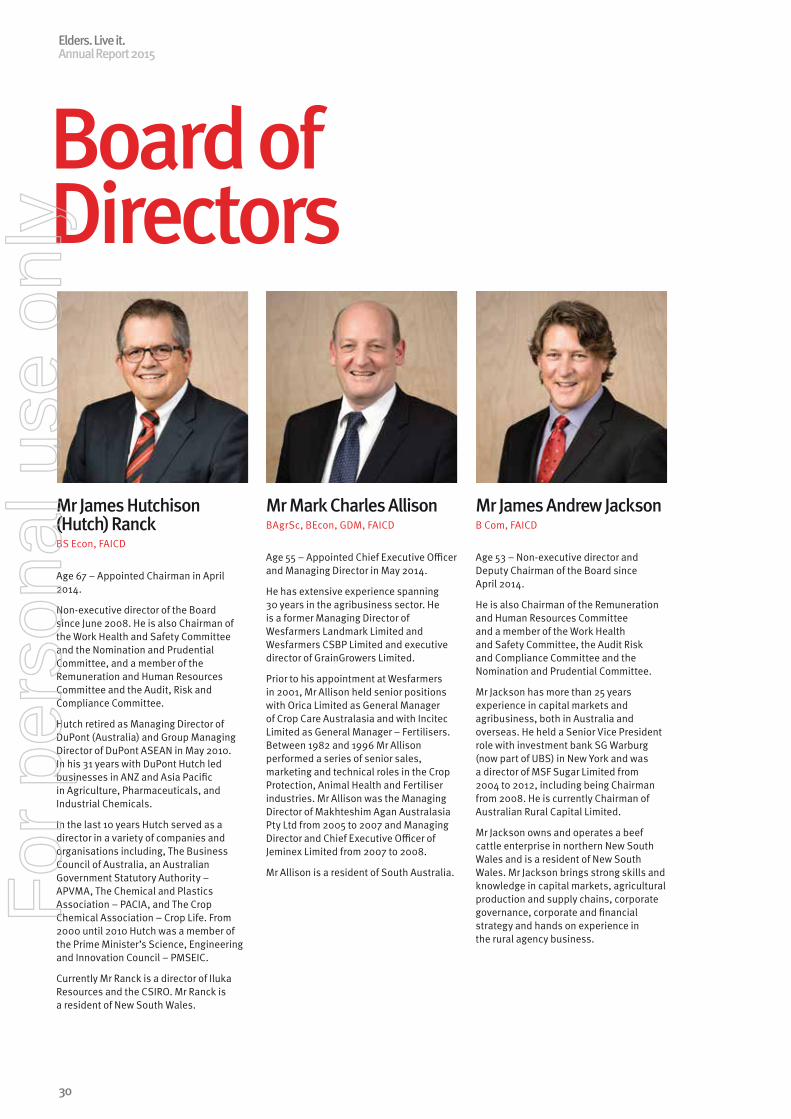
Board of Directors
Mr James Hutchison (Hutch) RanckBS Econ, FAICD
Age 67 – Appointed Chairman in April 2014.
Non-executive director of the Board since June 2008. He is also Chairman of the Work Health and Safety Committee and the Nomination and Prudential Committee, and a member of the Remuneration and Human Resources Committee and the Audit, Risk and Compliance Committee.
Hutch retired as Managing Director of DuPont (Australia) and Group Managing Director of DuPont ASEAN in May 2010. In his 31 years with DuPont Hutch led businesses in ANZ and Asia Pacific in Agriculture, Pharmaceuticals, and Industrial Chemicals.
In the last 10 years Hutch served as a director in a variety of companies and organisations including, The Business Council of Australia, an Australian Government Statutory Authority – APVMA, The Chemical and Plastics Association – PACIA, and The Crop Chemical Association – Crop Life. From 2000 until 2010 Hutch was a member of the Prime Minister’s Science, Engineering and Innovation Council – PMSEIC.
Currently Mr Ranck is a director of Iluka Resources and the CSIRO. Mr Ranck is a resident of New South Wales.
Mr Mark Charles AllisonBAgrSc, BEcon, GDM, FAICD
Age 55 – Appointed Chief Executive Officer and Managing Director in May 2014.
He has extensive experience spanning 30 years in the agribusiness sector. He is a former Managing Director of Wesfarmers Landmark Limited and Wesfarmers CSBP Limited and executive director of GrainGrowers Limited.
Prior to his appointment at Wesfarmers in 2001, Mr Allison held senior positions with Orica Limited as General Manager of Crop Care Australasia and with Incitec Limited as General Manager – Fertilisers. Between 1982 and 1996 Mr Allison performed a series of senior sales, marketing and technical roles in the Crop Protection, Animal Health and Fertiliser industries. Mr Allison was the Managing Director of Makhteshim Agan Australasia Pty Ltd from 2005 to 2007 and Managing Director and Chief Executive Officer of Jeminex Limited from 2007 to 2008.
Mr Allison is a resident of South Australia.
Mr James Andrew JacksonB Com, FAICD
Age 53 – Non-executive director and Deputy Chairman of the Board since April 2014.
He is also Chairman of the Remuneration and Human Resources Committee and a member of the Work Health and Safety Committee, the Audit Risk and Compliance Committee and the Nomination and Prudential Committee.
Mr Jackson has more than 25 years experience in capital markets and agribusiness, both in Australia and overseas. He held a Senior Vice President role with investment bank SG Warburg (now part of UBS) in New York and was a director of MSF Sugar Limited from 2004 to 2012, including being Chairman from 2008. He is currently Chairman of Australian Rural Capital Limited.
Mr Jackson owns and operates a beef cattle enterprise in northern New South Wales and is a resident of New South Wales. Mr Jackson brings strong skills and knowledge in capital markets, agricultural production and supply chains, corporate governance, corporate and financial strategy and hands on experience in the rural agency business.
Elders. Live it.Annual Report 2015
30
For
per
sona
l use
onl
y
Mr Ian WiltonFCPA, FAICD, FCCA (UK)
Age 63 – Non-executive director of the Board since April 2014.
He is also Chairman of the Audit, Risk and Compliance Committee and a member of the Work Health and Safety Committee, the Nomination and Prudential Committee and the Remuneration and Human Resources Committee.
Ian Wilton is a Certified Practising Accountant with senior executive experience across the agricultural sector. He has held Chief Financial Officer positions with the sugar division of CSR Limited, Ridley Corporation Limited and GrainCorp Limited and was President and Chief Executive Officer of GrainCorp Malt. Mr Wilton is currently (until 15 December 2015) Chief Financial Officer for Allied Mills Pty Limited, a joint venture between GrainCorp Limited and Cargill.
Mr Wilton is a resident of New South Wales.
Ms Robyn ClubbBEc, CA, F Fin, MAICD
Age 58 – Non-executive director of the Board since 21 September 2015.
She is also a member of the Audit, Risk and Compliance Committee, Work Health and Safety Committee, Remuneration and Human Resources Committee and Nomination and Prudential Committee.
Robyn is a Chartered Accountant and Fellow of the Finance & Securities Institute of Australia, with senior executive experience of over twenty years in the financial services industry, working for organisations including AMP Limited, and Citibank Limited.
Since 2004 she has held a range of Non-executive directorship with a focus on the agribusiness sector.
Robyn is a beef producer, and until recently a stonefruit grower, in South Eastern NSW. She is currently Chair of the Rice Marketing Board for the State of NSW, non-executive director of Murray Irrigation Limited, and Treasurer of the Royal Agricultural Society of NSW. Robyn is a former non-executive director of Rural Bank Ltd, Beef CRC Limited, and UrbanGrowth (a NSW state-owned corporation responsible for urban land development).
Ms Clubb is a resident of New South Wales.
Company SecretariesMr Peter Gordon HastingsBA LLB GDLP
Mr Hastings was appointed Company Secretary in February 2010. He held the position of Group Solicitor with the Elders Group between 1995 and 1999 and again between 2003 and 2010, and has held the position of General Counsel since February 2010.
Ms Nina Margaret AbbeyBSc, MMgt
Ms Nina Abbey was appointed joint Company Secretary on 20 February 2014. She also holds the position of Head of Risk, Safety and Assurance, since August 2012.
31
For
per
sona
l use
onl
y
Directors’ ReportThe directors present their report for the year ended 30 September 2015.
DIRECTORS Current DirectorsThe directors of the Company in office during the financial year and until the date of this report were:
Non-executive directorsJames Hutchison Ranck (Chairman)
James Andrew Jackson (Deputy Chairman)
Ian Wilton
Robyn Clubb (appointed 21 September 2015)
Executive DirectorMark Charles Allison (Managing Director and Chief Executive Officer)
Company SecretariesPeter Gordon Hastings
Nina Margaret Abbey
A summary of the experience, qualifications and special responsibilities of each Director and Company Secretary is provided on pages 30 and 31 of this annual report.
Principal ActivitiesThe principal activities of Elders during the year were:
(a) the provision of livestock, real estate and wool agency services to rural and regional customers;
(b) the provision of services and farm inputs to the rural sector;
(b) the provision of financial services to rural and regional customers;
(c) real estate franchisor;
(d) live export operations;
(e) feedlotting of cattle; and
(f) red meat supply chains in Indonesia and China
Results and Review of OperationsThe Group recorded a profit for the year, after tax and non-controlling interests, of $38.3m (2014: profit of $3.0m). A review of the operations and results of the consolidated entity and its principal businesses during the year is contained in pages 17 to 29 of this report.
Significant Changes in the State of AffairsThere were no significant changes in the state of affairs of the consolidated entity during the year not otherwise disclosed elsewhere in this annual report.
Events Subsequent to Balance DateThere is no matter or circumstance that has arisen since 30 September 2015 which is not otherwise dealt with in this report or in the consolidated financial statements, that has significantly affected or may significantly affect the operations of Elders, the results of those operations or the state of affairs of Elders in subsequent financial periods.
Likely Developments and Future ResultsDiscussion of likely developments in the operations of the consolidated entity and the expected results for those operations in future financial years is included in the information on page 27 of this report.
Share and Other Equity Issues During the YearNo ordinary shares were issued under the Company’s employee share plans during the year.
Dividends and Other Equity DistributionsNo dividends or hybrid distributions were declared or paid during the 12 months to 30 September 2015.
Share OptionsShare options were issued during the year to company executives under a long term incentive plan forming part of Elders’ remuneration structure. Information on this element of the remuneration structure is provided in the Remuneration Report commencing on page 36 of this annual report.
The total quantity of options on issue as at 30 September 2015 would represent, if exercised, 2.24% of the Group’s issued ordinary shares.
Details of options over unissued shares at the date of this report are as follows:
1) Options on Issue:
All options listed in Table 1 are subject to performance conditions as described on page 44 of the Remuneration Report.
2) Options issued since the end of the previous financial year
1,920,000 options, as set out in Table 1, have been issued since 30 September 2014.
3) Options exercised since the end of the previous financial year
No options have been exercised since 30 September 2014.
4) Options lapsed since the end of previous financial year
No options over unissued shares have lapsed since 30 September 2014. As disclosed in the table 16 appearing on page 50 of the Remuneration Report, 36,591 performance rights held by senior executives have lapsed since 30 September 2014.
Directors’ Interests At the date of this report, the relevant interests of the directors in shares and other equity securities of the Company are detailed in Table 2.
Elders. Live it.Annual Report 2015
32
For
per
sona
l use
onl
y
At the date of this report, there are no options on issue to directors other than to the Managing Director as set out in Table 2.
Directors’ Meetings
Detail of the number of meetings held by the Board of Directors and Board committees and the attendance at those meetings is provided in Table 3.
Indemnification of Officers and Auditors
Insurance arrangements established in previous years concerning officers of the consolidated entity were renewed during the period.
The consolidated entity paid an insurance premium in respect of
a contract insuring each of the directors of the Company named earlier in this report and each full time executive officer, director and secretary of Australian Group entities against all liabilities and expenses arising as a result of work performed in their respective capacities, to the extent permitted by law. The terms of the policy prohibit the disclosure of the premiums paid.
Each director and other officer has entered into a Deed of Access, Insurance and Indemnity which provides:
• that the Company will maintain an insurance policy insuring the officer against any liability incurred by the officer in the officer’s capacity as an officer of the Company to the maximum extent allowed by law;
• for indemnity against liability as an officer, except to the extent of indemnity under the insurance policy or where prohibited by law; and
• for access to company documents and records, subject to undertakings as to confidentiality.
The consolidated entity has provided a limited indemnity to its auditor, Ernst & Young, for loss suffered by Ernst & Young from claims by a third party related to the audit service provided by Ernst & Young, excluding losses resulting from the proven negligent, wrongful or wilful acts or omissions of Ernst & Young.
No payments have been made to indemnify Ernst & Young during or since the financial year.
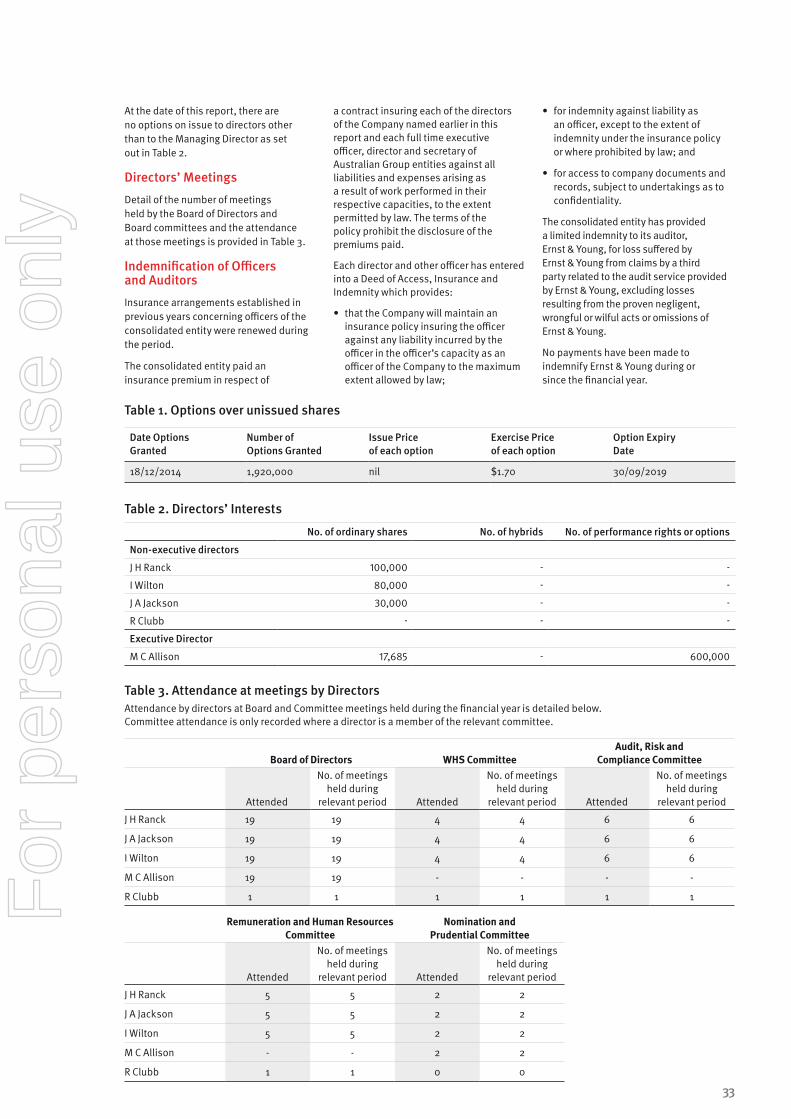
Table 1. Options over unissued shares
Date Options Granted
Number of Options Granted
Issue Price of each option
Exercise Price of each option
Option Expiry Date
18/12/2014 1,920,000 nil $1.70 30/09/2019
Table 2. Directors’ Interests
No. of ordinary shares No. of hybrids No. of performance rights or options
Non-executive directors
J H Ranck 100,000 - -
I Wilton 80,000 - -
J A Jackson 30,000 - -
R Clubb - - -
Executive Director
M C Allison 17,685 - 600,000
Table 3. Attendance at meetings by DirectorsAttendance by directors at Board and Committee meetings held during the financial year is detailed below. Committee attendance is only recorded where a director is a member of the relevant committee.
Board of Directors WHS CommitteeAudit, Risk and
Compliance Committee
Attended
No. of meetings held during
relevant period Attended
No. of meetings held during
relevant period Attended
No. of meetings held during
relevant period
J H Ranck 19 19 4 4 6 6
J A Jackson 19 19 4 4 6 6
I Wilton 19 19 4 4 6 6
M C Allison 19 19 - - - -
R Clubb 1 1 1 1 1 1
Remuneration and Human Resources Committee
Nomination and Prudential Committee
Attended
No. of meetings held during
relevant period Attended
No. of meetings held during
relevant period
J H Ranck 5 5 2 2
J A Jackson 5 5 2 2
I Wilton 5 5 2 2
M C Allison - - 2 2
R Clubb 1 1 0 0
33
For
per
sona
l use
onl
y
Remuneration of Directors and Senior ExecutivesDetails of the remuneration arrangements in place for directors and senior executives of the Group are set out in the Remuneration Report commencing on page 36. In compiling this report the Group has met the disclosure requirements prescribed in the Australian Accounting Standards and the Corporations Act 2001.
Environmental Performance RegulationA number of Elders’ operations are subject to environmental legislation. Such legislation is diverse and varies between state, territory and local authorities and various regulators. Detail of Elders’ performance in relation to the various regulations is as follows.
FeedlotsElders operates a feedlot in Killara (NSW) which is subject to both state and local government environmental legislation, as well as animal welfare legislation. Feedlots can also be subject to quality assurance standards under the National feedlot Accreditation Scheme (NFAS) which is independently administered and audited each year by Aus-Meat. Killara operates under such standards as well conducting its operations according to the Model Code of Practice for the Welfare of Animals – Cattle (2004).
No breaches of any relevant Act, code of practice or accreditation scheme under which Killara was approved or operates were reported during the year ended 30 September 2015 or to the date of this report.
SaleyardsSaleyards are subject to various State, Territory and local government environmental legislation and regulations, particularly relating to effluent management, dust and noise. These obligations vary from state to state and generally only apply to saleyards above a prescribed size. Elders expects its saleyard operations, irrespective of their size, to abide by the applicable laws and regulations.
Elders was served, in September 2015, with a Contaminated Site notice by the WA Department of Environment Regulation in relation to a co-owned livestock saleyard which has been classified as a potentially contaminated site. This is as a result of the site being adjacent to a known contaminated site. The site that is the source of this contamination is not owned by Elders, and the owners of the site are liable for the remediation of the source site itself, and our co owned/managed site, if required.
No other breaches of environmental regulations affecting saleyards were
reported during the year ended 30 September 2015 or to the date of this report.
Retail OperationsElders’ retail operations are subject to state environmental regulations relating to the storage, handling, transport and sale of dangerous goods such as agricultural chemicals, fertilisers and poisons. Although these regulations are based on nationally recognised standards the regulatory environment for the transporting, handling, storage, sale and use of such dangerous goods, chemicals and scheduled poisons is complex and subject to regulations imposed by each state and territory.
The majority of Elders’ retail operations are accredited under the co-regulatory accreditation program operated by Agsafe. The program provides accreditation for premises and training and accreditation for staff in the safe handling, storage and transport of agricultural and veterinary chemicals. Agsafe provides assistance to Elders by providing appropriate training and safety programs including a program of recognised audits.
In March 2015 a minor incident near Carnamagh (WA) involved a spill of glyphosate, after a motor vehicle accident. The local Shire was advised, attended and performed clean up. The Shire also investigated and determined no sanctions or further action were warranted.
No other breaches of these environmental regulations were reported during the year ended 30 September 2015 or to the date of this report.
Live Export ServicesElders is engaged in the export of livestock to international markets, namely the supply of feeder and slaughter cattle to Indonesia and Vietnam as well as long haul live export of dairy, breeding and feeder and slaughter cattle to distant markets such as China and Kazakhstan. Sheep are also exported to a variety of markets.
All live export operations are subject to Australian Government regulations and standards including:
• The Australian Standards on the Export of Livestock (ASEL version 2.3) which provides detailed standards on the sourcing, preparation, management and transportation of livestock throughout the supply chain, until disembarkation. The ASEL also requires exporters to comply with state, territory and local government regulations including animal welfare and environmental regulations.
• The Exporter Supply Chain Assurance System (ESCAS) which requires exporters to have control and
traceability throughout the supply chain up to and including the point of slaughter in the receiving country.
Apart from minor breaches of ESCAS which Elders self-reported (for which regulators took no adverse action against Elders), no breaches of environmental regulations or legislation were recorded by the live export business in the year to 30 September 2015 or the date of this report.
Rounding of AmountsThe parent entity is a Group of the kind specified in Australian Securities and Investments Commission class order 98/0100. In accordance with that class order, amounts in the financial report and Directors’ report have been rounded to the nearest thousand dollars unless specifically stated to be otherwise.
Non-Audit ServicesNon-audit services provided by the Group’s auditor, Ernst & Young, to the Group during the financial year are disclosed below. Based on advice received from the Audit, Risk and Compliance Committee the Directors are satisfied that the provision of non-audit services is compatible with the general standard of independence for auditors imposed under the Corporations Act 2001 for the following reasons:
• all non-audit services have been reviewed by the Audit, Risk and Compliance Committee to ensure they do not impact on the impartiality or objectivity of the auditor; and
• the nature and scope of each type of non-audit service provided means that auditor independence was not compromised.
Ernst & Young received or is due to receive the following amounts for the provision of non-audit services:
• Tax services (primarily compliance) $157,538
• Other compliance and assurance services $118,014
A copy of the auditor’s independence declaration as required under section 307C of the Corporations Act 2001 is set out on the next page.
This report has been made in accordance with a resolution of directors.
J H Ranck Chairman
16 November 2015
M C Allison Managing Director
Elders. Live it.Annual Report 2015
34
For
per
sona
l use
onl
y
M C Allison Managing Director
35
For
per
sona
l use
onl
y
Section 1 38 Key Management Personnel
Section 2 38 Remuneration governance and strategy
Section 3 39 Non-executive director remuneration
Section 4 40 Managing Director & Chief Executive Officer and Senior Executive remuneration
Section 5 46 Managing Director & Chief Executive Officer and Senior Executive contract terms
Section 6 47 Managing Director & Chief Executive Officer and Senior Executive remuneration details
Section 7 48 Equity instruments, loans to and transactions in relation to Key Management Personnel
Remuneration Report 2015The Directors of Elders Limited present the Remuneration Report for the consolidated entity for the year ended 30 September 2015. The information provided in this report has been audited, unless otherwise indicated, as required by the Corporations Act 2001 (Cth) and forms part of the Directors’ Report.
ELDERS LIMITED
Elders. Live it.Annual Report 2015
36
For
per
sona
l use
onl
y

MANAGING DIRECTOR & CHIEF EXECUTIVE OFFICER AND SENIOR EXECUTIVE REMUNERATION OUTCOMESFor the year ended 30 September 2015
Table 1 below sets out certain items of remuneration paid or payable to the Managing Director & Chief Executive Officer (MD & CEO) and Senior Executives in respect of the 2015 financial year. The information in Table 1 is unaudited and is different from and additional to that required by Accounting Standards and statutory requirements.
Table 11 on page 47 provides the audited remuneration disclosures as required under Accounting Standards and statutory requirements. Elders however believes that the information provided in Table 1 is useful to investors as it provides a simple overview of the remuneration paid or payable to the MD & CEO and senior executives, and is consistent with the Productivity Commission’s recommendation in its report on Executive Remuneration in Australia.
Table 1 includes information on base salary, STI, superannuation, other monetary benefits, other non-monetary benefits and termination benefits identical to that contained in Table 11 , but omits the information on the issue of shares, share rights and options and long-term payments contained in Table 11 . Additionally, Table 1 provides information on LTI based on rights vesting or options exercised during the financial year, which is not provided in Table 11.
Table 1. Remuneration outcomes for 2015 (unaudited and non-IFRS)
$Base
Salary STI1 LTI2 SuperannuationOther
(monetary) Other (non- monetary)3
Termination benefits Total
M C Allison 801,580 800,000 0 18,915 0 0 0 1,620,495
R I Davey 404,238 110,000 0 18,915 0 2,596 0 535,749
J H Cornish 328,572 80,000 0 18,915 0 1,351 0 428,838
G J Dunne 345,597 90,000 0 18,915 0 3,640 0 458,152
C C Hall 335,259 70,000 0 18,915 0 2,919 0 427,093
M L Hunt 347,584 90,000 0 18,915 0 15,572 0 472,071
1. STI that will be paid for performance in the 2015 financial year.
2. Value of any performance rights/options that vested during the 2015 financial year based on the closing share price on the date of vesting, and options that were exercised during the 2015 financial year based on the difference between the exercise price and the closing share price on the date of exercise. This figure does not represent the value of rights or options granted during the 2015 financial year.
3. Provision of leased car parking and company leased vehicle.
37
For
per
sona
l use
onl
y
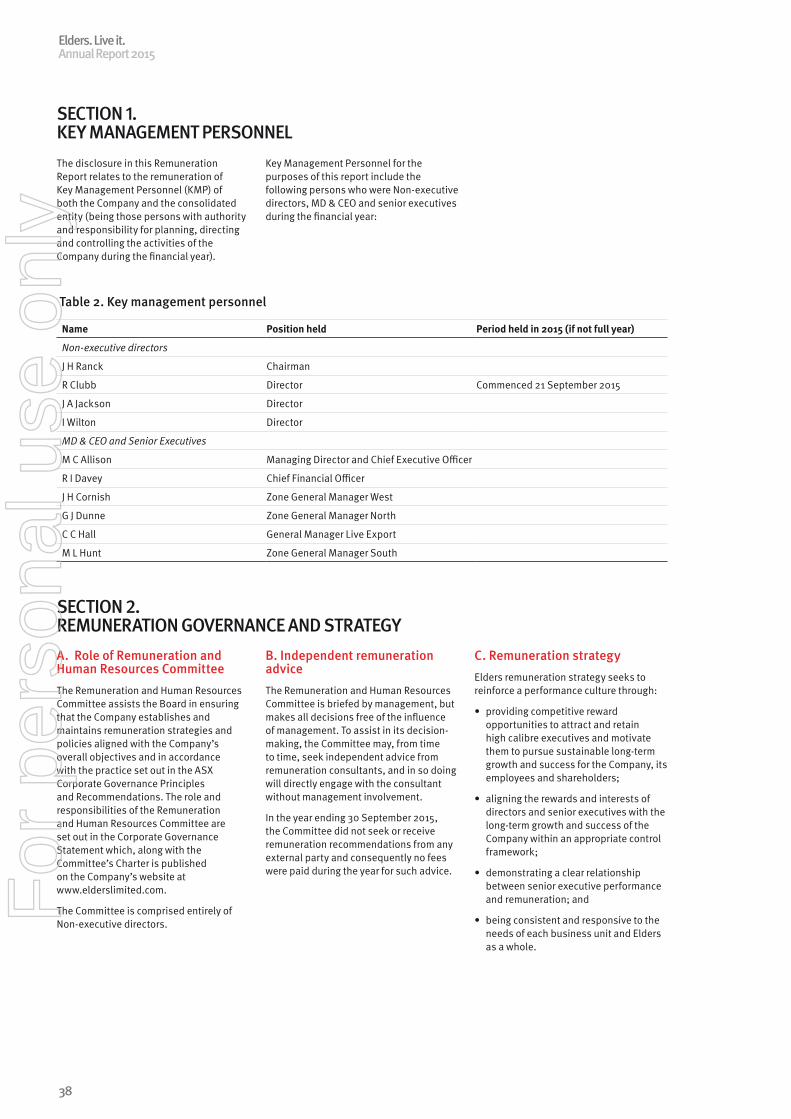
SECTION 1. KEY MANAGEMENT PERSONNEL
The disclosure in this Remuneration Report relates to the remuneration of Key Management Personnel (KMP) of both the Company and the consolidated entity (being those persons with authority and responsibility for planning, directing and controlling the activities of the Company during the financial year).
Key Management Personnel for the purposes of this report include the following persons who were Non-executive directors, MD & CEO and senior executives during the financial year:
Table 2. Key management personnel
Name Position held Period held in 2015 (if not full year)
Non-executive directors
J H Ranck Chairman
R Clubb Director Commenced 21 September 2015
J A Jackson Director
I Wilton Director
MD & CEO and Senior Executives
M C Allison Managing Director and Chief Executive Officer
R I Davey Chief Financial Officer
J H Cornish Zone General Manager West
G J Dunne Zone General Manager North
C C Hall General Manager Live Export
M L Hunt Zone General Manager South
SECTION 2. REMUNERATION GOVERNANCE AND STRATEGY
A. Role of Remuneration and Human Resources CommitteeThe Remuneration and Human Resources Committee assists the Board in ensuring that the Company establishes and maintains remuneration strategies and policies aligned with the Company’s overall objectives and in accordance with the practice set out in the ASX Corporate Governance Principles and Recommendations. The role and responsibilities of the Remuneration and Human Resources Committee are set out in the Corporate Governance Statement which, along with the Committee’s Charter is published on the Company’s website at www.elderslimited.com.
The Committee is comprised entirely of Non-executive directors.
B. Independent remuneration adviceThe Remuneration and Human Resources Committee is briefed by management, but makes all decisions free of the influence of management. To assist in its decision-making, the Committee may, from time to time, seek independent advice from remuneration consultants, and in so doing will directly engage with the consultant without management involvement.
In the year ending 30 September 2015, the Committee did not seek or receive remuneration recommendations from any external party and consequently no fees were paid during the year for such advice.
C. Remuneration strategyElders remuneration strategy seeks to reinforce a performance culture through:
• providing competitive reward opportunities to attract and retain high calibre executives and motivate them to pursue sustainable long-term growth and success for the Company, its employees and shareholders;
• aligning the rewards and interests of directors and senior executives with the long-term growth and success of the Company within an appropriate control framework;
• demonstrating a clear relationship between senior executive performance and remuneration; and
• being consistent and responsive to the needs of each business unit and Elders as a whole.
Elders. Live it.Annual Report 2015
38
For
per
sona
l use
onl
y
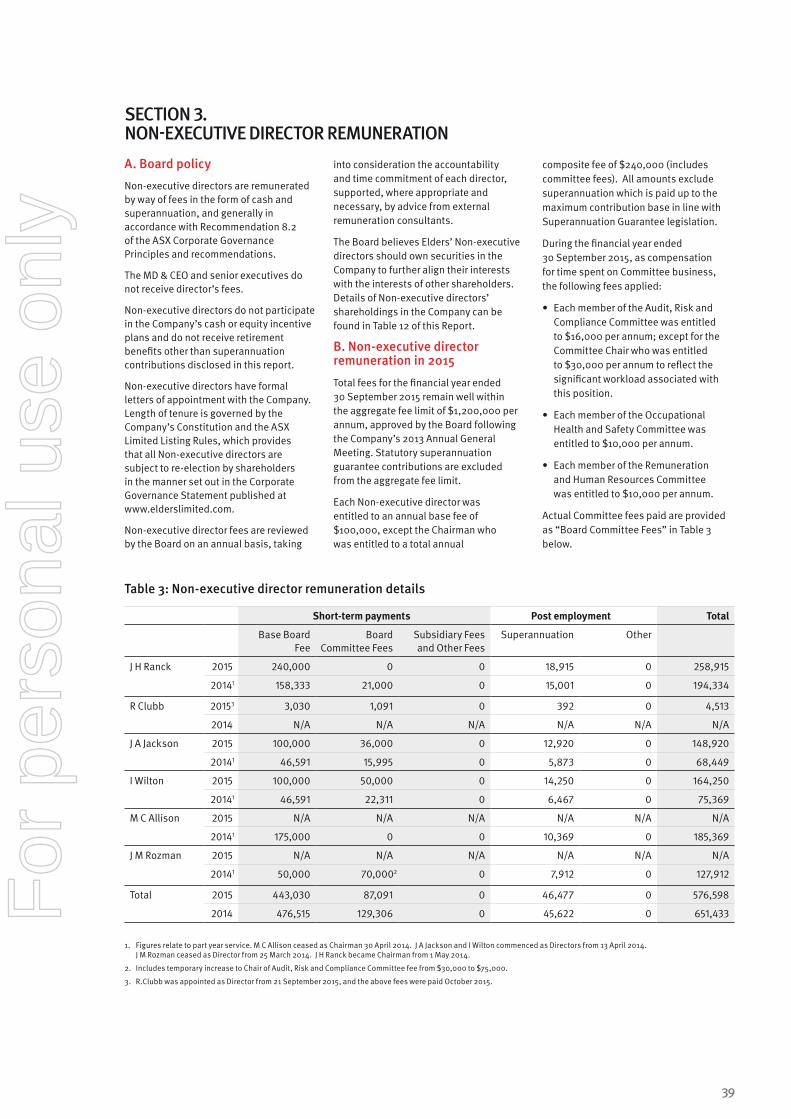
SECTION 3. NON-EXECUTIVE DIRECTOR REMUNERATION
A. Board policy
Non-executive directors are remunerated by way of fees in the form of cash and superannuation, and generally in accordance with Recommendation 8.2 of the ASX Corporate Governance Principles and recommendations.
The MD & CEO and senior executives do not receive director’s fees.
Non-executive directors do not participate in the Company’s cash or equity incentive plans and do not receive retirement benefits other than superannuation contributions disclosed in this report.
Non-executive directors have formal letters of appointment with the Company. Length of tenure is governed by the Company’s Constitution and the ASX Limited Listing Rules, which provides that all Non-executive directors are subject to re-election by shareholders in the manner set out in the Corporate Governance Statement published at www.elderslimited.com.
Non-executive director fees are reviewed by the Board on an annual basis, taking
into consideration the accountability and time commitment of each director, supported, where appropriate and necessary, by advice from external remuneration consultants.
The Board believes Elders’ Non-executive directors should own securities in the Company to further align their interests with the interests of other shareholders. Details of Non-executive directors’ shareholdings in the Company can be found in Table 12 of this Report.
B. Non-executive director remuneration in 2015
Total fees for the financial year ended 30 September 2015 remain well within the aggregate fee limit of $1,200,000 per annum, approved by the Board following the Company’s 2013 Annual General Meeting. Statutory superannuation guarantee contributions are excluded from the aggregate fee limit.
Each Non-executive director was entitled to an annual base fee of $100,000, except the Chairman who was entitled to a total annual
composite fee of $240,000 (includes committee fees). All amounts exclude superannuation which is paid up to the maximum contribution base in line with Superannuation Guarantee legislation.
During the financial year ended 30 September 2015, as compensation for time spent on Committee business, the following fees applied:
• Each member of the Audit, Risk and Compliance Committee was entitled to $16,000 per annum; except for the Committee Chair who was entitled to $30,000 per annum to reflect the significant workload associated with this position.
• Each member of the Occupational Health and Safety Committee was entitled to $10,000 per annum.
• Each member of the Remuneration and Human Resources Committee was entitled to $10,000 per annum.
Actual Committee fees paid are provided as “Board Committee Fees” in Table 3 below.
Table 3: Non-executive director remuneration details
Short-term payments Post employment Total
Base Board Fee
Board Committee Fees
Subsidiary Fees and Other Fees
Superannuation Other
J H Ranck
2015 240,000 0 0 18,915 0 258,915
20141 158,333 21,000 0 15,001 0 194,334
R Clubb 20153 3,030 1,091 0 392 0 4,513
2014 N/A N/A N/A N/A N/A N/A
J A Jackson 2015 100,000 36,000 0 12,920 0 148,920
20141 46,591 15,995 0 5,873 0 68,449
I Wilton 2015 100,000 50,000 0 14,250 0 164,250
20141 46,591 22,311 0 6,467 0 75,369
M C Allison 2015 N/A N/A N/A N/A N/A N/A
20141 175,000 0 0 10,369 0 185,369
J M Rozman
2015 N/A N/A N/A N/A N/A N/A
20141 50,000 70,0002 0 7,912 0 127,912
Total 2015 443,030 87,091 0 46,477 0 576,598
2014 476,515 129,306 0 45,622 0 651,433
1. Figures relate to part year service. M C Allison ceased as Chairman 30 April 2014. J A Jackson and I Wilton commenced as Directors from 13 April 2014. J M Rozman ceased as Director from 25 March 2014. J H Ranck became Chairman from 1 May 2014.
2. Includes temporary increase to Chair of Audit, Risk and Compliance Committee fee from $30,000 to $75,000.
3. R.Clubb was appointed as Director from 21 September 2015, and the above fees were paid October 2015.
39
For
per
sona
l use
onl
y
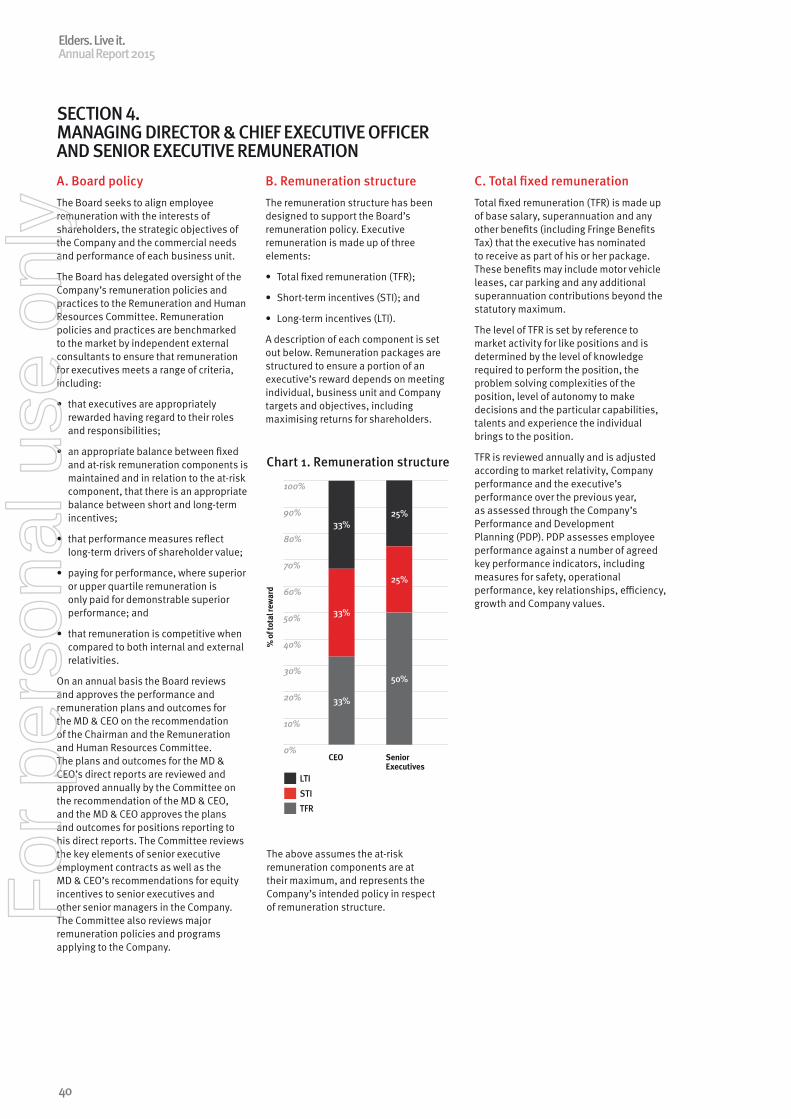
SECTION 4. MANAGING DIRECTOR & CHIEF EXECUTIVE OFFICER AND SENIOR EXECUTIVE REMUNERATIONA. Board policy The Board seeks to align employee remuneration with the interests of shareholders, the strategic objectives of the Company and the commercial needs and performance of each business unit.
The Board has delegated oversight of the Company’s remuneration policies and practices to the Remuneration and Human Resources Committee. Remuneration policies and practices are benchmarked to the market by independent external consultants to ensure that remuneration for executives meets a range of criteria, including:
• that executives are appropriately rewarded having regard to their roles and responsibilities;
• an appropriate balance between fixed and at-risk remuneration components is maintained and in relation to the at-risk component, that there is an appropriate balance between short and long-term incentives;
• that performance measures reflect long-term drivers of shareholder value;
• paying for performance, where superior or upper quartile remuneration is only paid for demonstrable superior performance; and
• that remuneration is competitive when compared to both internal and external relativities.
On an annual basis the Board reviews and approves the performance and remuneration plans and outcomes for the MD & CEO on the recommendation of the Chairman and the Remuneration and Human Resources Committee. The plans and outcomes for the MD & CEO’s direct reports are reviewed and approved annually by the Committee on the recommendation of the MD & CEO, and the MD & CEO approves the plans and outcomes for positions reporting to his direct reports. The Committee reviews the key elements of senior executive employment contracts as well as the MD & CEO’s recommendations for equity incentives to senior executives and other senior managers in the Company. The Committee also reviews major remuneration policies and programs applying to the Company.
B. Remuneration structureThe remuneration structure has been designed to support the Board’s remuneration policy. Executive remuneration is made up of three elements:
• Total fixed remuneration (TFR);
• Short-term incentives (STI); and
• Long-term incentives (LTI).
A description of each component is set out below. Remuneration packages are structured to ensure a portion of an executive’s reward depends on meeting individual, business unit and Company targets and objectives, including maximising returns for shareholders.
C. Total fixed remunerationTotal fixed remuneration (TFR) is made up of base salary, superannuation and any other benefits (including Fringe Benefits Tax) that the executive has nominated to receive as part of his or her package. These benefits may include motor vehicle leases, car parking and any additional superannuation contributions beyond the statutory maximum.
The level of TFR is set by reference to market activity for like positions and is determined by the level of knowledge required to perform the position, the problem solving complexities of the position, level of autonomy to make decisions and the particular capabilities, talents and experience the individual brings to the position.
TFR is reviewed annually and is adjusted according to market relativity, Company performance and the executive’s performance over the previous year, as assessed through the Company’s Performance and Development Planning (PDP). PDP assesses employee performance against a number of agreed key performance indicators, including measures for safety, operational performance, key relationships, efficiency, growth and Company values.
33%
CEO
33%
33%
100%
90%
80%
70%
60%
50%
40%
30%
20%
10%
0%
Chart 1. Remuneration structure
LTI
STI
TFR
The above assumes the at-risk remuneration components are at their maximum, and represents the Company’s intended policy in respect of remuneration structure.
% o
f tot
al re
war
d
Senior Executives
25%
25%
50%
Elders. Live it.Annual Report 2015
40
For
per
sona
l use
onl
y
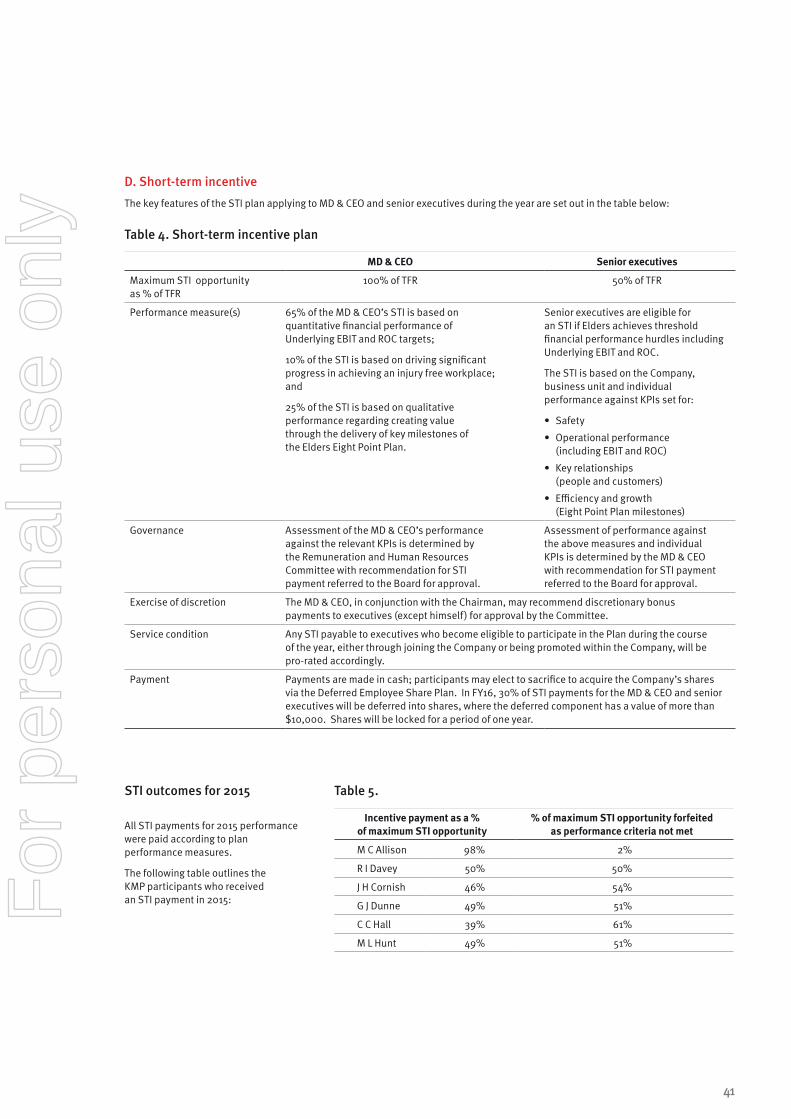
D. Short-term incentiveThe key features of the STI plan applying to MD & CEO and senior executives during the year are set out in the table below: Table 4. Short-term incentive plan
MD & CEO Senior executives
Maximum STI opportunity as % of TFR
100% of TFR 50% of TFR
Performance measure(s) 65% of the MD & CEO’s STI is based on quantitative financial performance of Underlying EBIT and ROC targets;
10% of the STI is based on driving significant progress in achieving an injury free workplace; and
25% of the STI is based on qualitative performance regarding creating value through the delivery of key milestones of the Elders Eight Point Plan.
Senior executives are eligible for an STI if Elders achieves threshold financial performance hurdles including Underlying EBIT and ROC.
The STI is based on the Company, business unit and individual performance against KPIs set for:
• Safety
• Operational performance (including EBIT and ROC)
• Key relationships (people and customers)
• Efficiency and growth (Eight Point Plan milestones)
Governance Assessment of the MD & CEO’s performance against the relevant KPIs is determined by the Remuneration and Human Resources Committee with recommendation for STI payment referred to the Board for approval.
Assessment of performance against the above measures and individual KPIs is determined by the MD & CEO with recommendation for STI payment referred to the Board for approval.
Exercise of discretion The MD & CEO, in conjunction with the Chairman, may recommend discretionary bonus payments to executives (except himself) for approval by the Committee.
Service condition Any STI payable to executives who become eligible to participate in the Plan during the course of the year, either through joining the Company or being promoted within the Company, will be pro-rated accordingly.
Payment Payments are made in cash; participants may elect to sacrifice to acquire the Company’s shares via the Deferred Employee Share Plan. In FY16, 30% of STI payments for the MD & CEO and senior executives will be deferred into shares, where the deferred component has a value of more than $10,000. Shares will be locked for a period of one year.
STI outcomes for 2015 All STI payments for 2015 performance were paid according to plan performance measures.
The following table outlines the KMP participants who received an STI payment in 2015:
Table 5.
Incentive payment as a % of maximum STI opportunity
% of maximum STI opportunity forfeited as performance criteria not met
M C Allison 98% 2%
R I Davey 50% 50%
J H Cornish 46% 54%
G J Dunne 49% 51%
C C Hall 39% 61%
M L Hunt 49% 51%
41
For
per
sona
l use
onl
y
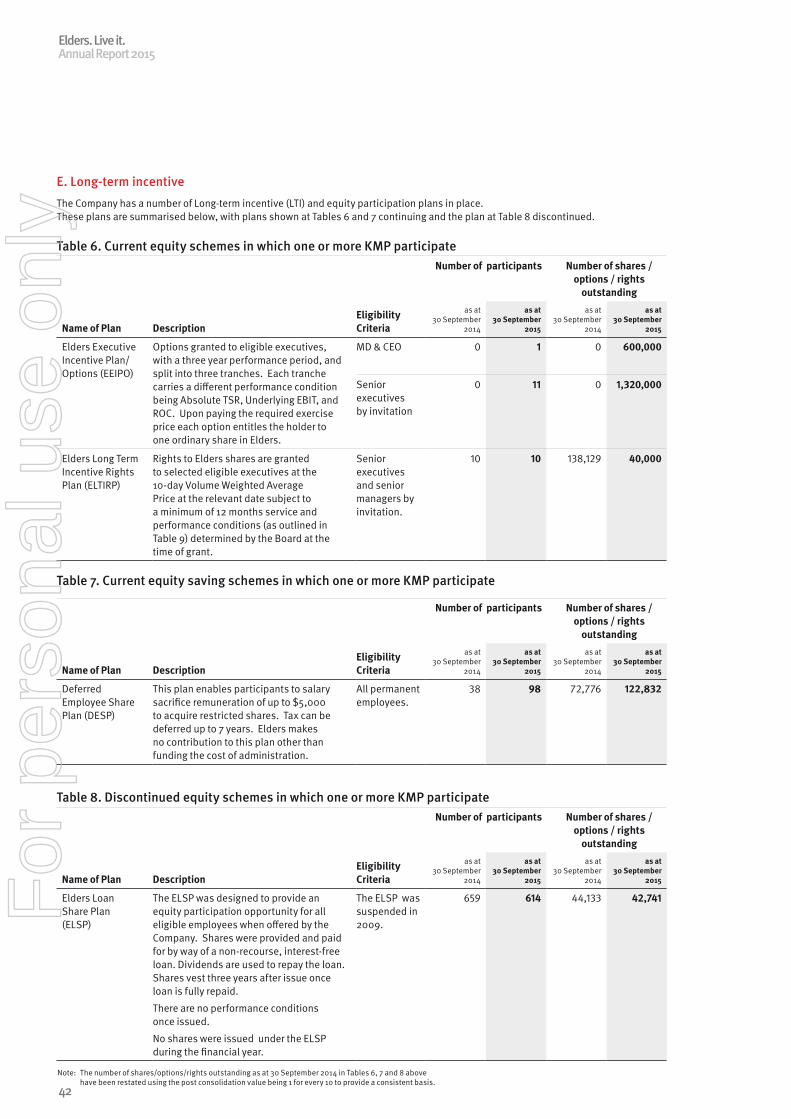
E. Long-term incentive The Company has a number of Long-term incentive (LTI) and equity participation plans in place. These plans are summarised below, with plans shown at Tables 6 and 7 continuing and the plan at Table 8 discontinued.
Table 6. Current equity schemes in which one or more KMP participate
Name of Plan DescriptionEligibility Criteria
Number of participants Number of shares / options / rights
outstanding
as at 30 September
2014
as at 30 September
2015
as at 30 September
2014
as at 30 September
2015
Elders Executive Incentive Plan/Options (EEIPO)
Options granted to eligible executives, with a three year performance period, and split into three tranches. Each tranche carries a different performance condition being Absolute TSR, Underlying EBIT, and ROC. Upon paying the required exercise price each option entitles the holder to one ordinary share in Elders.
MD & CEO 0 1 0 600,000
Senior executives by invitation
0 11 0 1,320,000
Elders Long Term Incentive Rights Plan (ELTIRP)
Rights to Elders shares are granted to selected eligible executives at the 10-day Volume Weighted Average Price at the relevant date subject to a minimum of 12 months service and performance conditions (as outlined in Table 9) determined by the Board at the time of grant.
Senior executives and senior managers by invitation.
10 10 138,129 40,000
Table 8. Discontinued equity schemes in which one or more KMP participate
Name of Plan DescriptionEligibility Criteria
Number of participants Number of shares / options / rights
outstanding
as at 30 September
2014
as at 30 September
2015
as at 30 September
2014
as at 30 September
2015
Elders Loan Share Plan (ELSP)
The ELSP was designed to provide an equity participation opportunity for all eligible employees when offered by the Company. Shares were provided and paid for by way of a non-recourse, interest-free loan. Dividends are used to repay the loan. Shares vest three years after issue once loan is fully repaid.
There are no performance conditions once issued.
No shares were issued under the ELSP during the financial year.
The ELSP was suspended in 2009.
659 614 44,133 42,741
Table 7. Current equity saving schemes in which one or more KMP participate
Name of Plan DescriptionEligibility Criteria
Number of participants Number of shares / options / rights
outstanding
as at 30 September
2014
as at 30 September
2015
as at 30 September
2014
as at 30 September
2015
Deferred Employee Share Plan (DESP)
This plan enables participants to salary sacrifice remuneration of up to $5,000 to acquire restricted shares. Tax can be deferred up to 7 years. Elders makes no contribution to this plan other than funding the cost of administration.
All permanent employees.
38 98 72,776 122,832
Note: The number of shares/options/rights outstanding as at 30 September 2014 in Tables 6, 7 and 8 above have been restated using the post consolidation value being 1 for every 10 to provide a consistent basis.
Elders. Live it.Annual Report 2015
42
For
per
sona
l use
onl
y
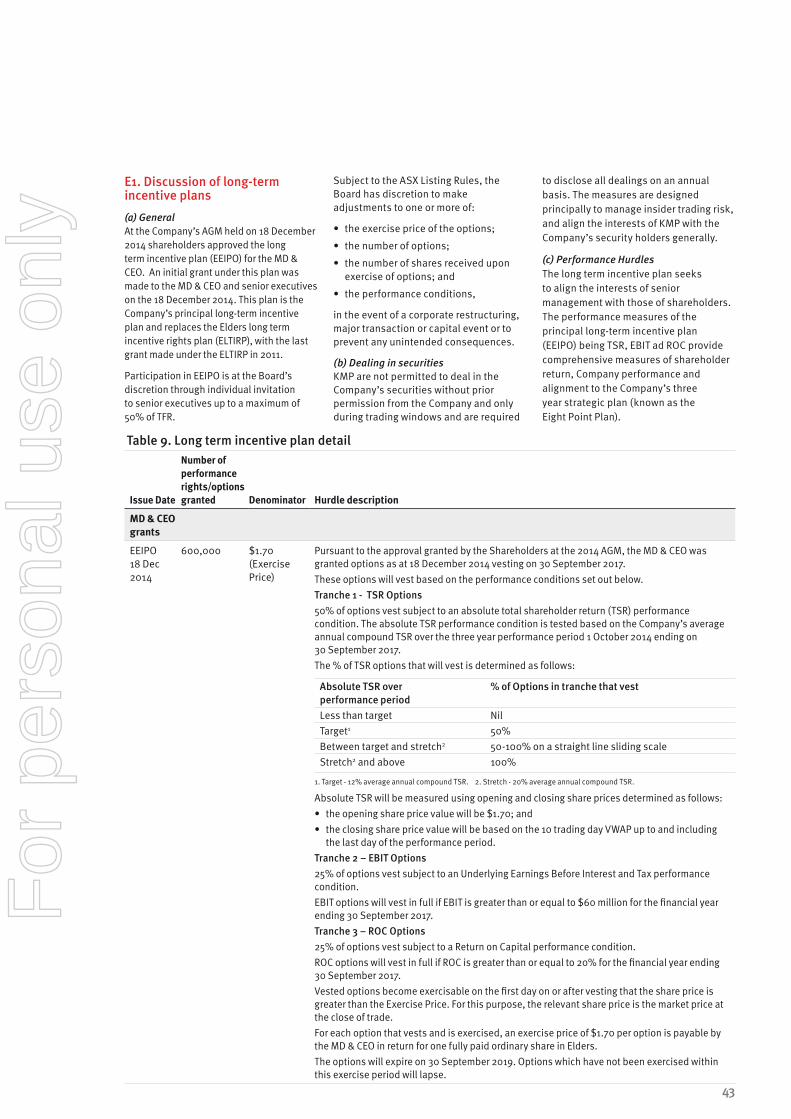
E1. Discussion of long-term incentive plans
(a) GeneralAt the Company’s AGM held on 18 December 2014 shareholders approved the long term incentive plan (EEIPO) for the MD & CEO. An initial grant under this plan was made to the MD & CEO and senior executives on the 18 December 2014. This plan is the Company’s principal long-term incentive plan and replaces the Elders long term incentive rights plan (ELTIRP), with the last grant made under the ELTIRP in 2011.
Participation in EEIPO is at the Board’s discretion through individual invitation to senior executives up to a maximum of 50% of TFR.
Subject to the ASX Listing Rules, the Board has discretion to make adjustments to one or more of:
• the exercise price of the options;
• the number of options;
• the number of shares received upon exercise of options; and
• the performance conditions,
in the event of a corporate restructuring, major transaction or capital event or to prevent any unintended consequences.
(b) Dealing in securitiesKMP are not permitted to deal in the Company’s securities without prior permission from the Company and only during trading windows and are required
to disclose all dealings on an annual basis. The measures are designed principally to manage insider trading risk, and align the interests of KMP with the Company’s security holders generally.
(c) Performance HurdlesThe long term incentive plan seeks to align the interests of senior management with those of shareholders. The performance measures of the principal long-term incentive plan (EEIPO) being TSR, EBIT ad ROC provide comprehensive measures of shareholder return, Company performance and alignment to the Company’s three year strategic plan (known as the Eight Point Plan).
Table 9. Long term incentive plan detail
Issue Date
Number of performance rights/options granted Denominator Hurdle description
MD & CEO grants
EEIPO 18 Dec 2014
600,000 $1.70 (Exercise Price)
Pursuant to the approval granted by the Shareholders at the 2014 AGM, the MD & CEO was granted options as at 18 December 2014 vesting on 30 September 2017.These options will vest based on the performance conditions set out below.Tranche 1 - TSR Options50% of options vest subject to an absolute total shareholder return (TSR) performance condition. The absolute TSR performance condition is tested based on the Company’s average annual compound TSR over the three year performance period 1 October 2014 ending on 30 September 2017.The % of TSR options that will vest is determined as follows:
Absolute TSR over performance period
% of Options in tranche that vest
Less than target NilTarget1 50%Between target and stretch2 50-100% on a straight line sliding scaleStretch2 and above 100%
1. Target - 12% average annual compound TSR. 2. Stretch - 20% average annual compound TSR.
Absolute TSR will be measured using opening and closing share prices determined as follows: • the opening share price value will be $1.70; and • the closing share price value will be based on the 10 trading day VWAP up to and including
the last day of the performance period. Tranche 2 – EBIT Options25% of options vest subject to an Underlying Earnings Before Interest and Tax performance condition. EBIT options will vest in full if EBIT is greater than or equal to $60 million for the financial year ending 30 September 2017.Tranche 3 – ROC Options25% of options vest subject to a Return on Capital performance condition.ROC options will vest in full if ROC is greater than or equal to 20% for the financial year ending 30 September 2017.Vested options become exercisable on the first day on or after vesting that the share price is greater than the Exercise Price. For this purpose, the relevant share price is the market price at the close of trade.For each option that vests and is exercised, an exercise price of $1.70 per option is payable by the MD & CEO in return for one fully paid ordinary share in Elders.The options will expire on 30 September 2019. Options which have not been exercised within this exercise period will lapse.
43
For
per
sona
l use
onl
y
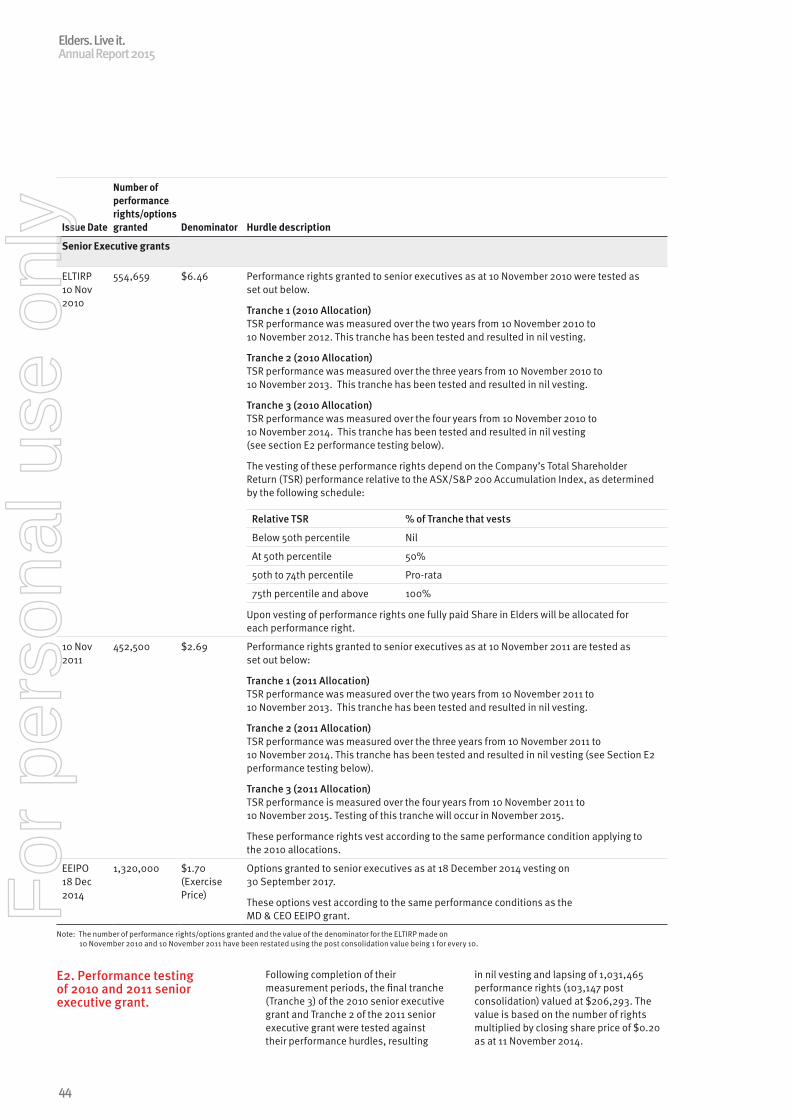
Issue Date
Number of performance rights/options granted Denominator Hurdle description
Senior Executive grants
ELTIRP 10 Nov 2010
554,659 $6.46 Performance rights granted to senior executives as at 10 November 2010 were tested as set out below.
Tranche 1 (2010 Allocation)TSR performance was measured over the two years from 10 November 2010 to 10 November 2012. This tranche has been tested and resulted in nil vesting.
Tranche 2 (2010 Allocation)TSR performance was measured over the three years from 10 November 2010 to 10 November 2013. This tranche has been tested and resulted in nil vesting.
Tranche 3 (2010 Allocation)TSR performance was measured over the four years from 10 November 2010 to 10 November 2014. This tranche has been tested and resulted in nil vesting (see section E2 performance testing below).
The vesting of these performance rights depend on the Company’s Total Shareholder Return (TSR) performance relative to the ASX/S&P 200 Accumulation Index, as determined by the following schedule:
Relative TSR % of Tranche that vests
Below 50th percentile Nil
At 50th percentile 50%
50th to 74th percentile Pro-rata
75th percentile and above 100%
Upon vesting of performance rights one fully paid Share in Elders will be allocated for each performance right.
10 Nov 2011
452,500 $2.69 Performance rights granted to senior executives as at 10 November 2011 are tested as set out below:
Tranche 1 (2011 Allocation)TSR performance was measured over the two years from 10 November 2011 to 10 November 2013. This tranche has been tested and resulted in nil vesting.
Tranche 2 (2011 Allocation)TSR performance was measured over the three years from 10 November 2011 to 10 November 2014. This tranche has been tested and resulted in nil vesting (see Section E2 performance testing below).
Tranche 3 (2011 Allocation)TSR performance is measured over the four years from 10 November 2011 to 10 November 2015. Testing of this tranche will occur in November 2015.
These performance rights vest according to the same performance condition applying to the 2010 allocations.
EEIPO 18 Dec 2014
1,320,000 $1.70 (Exercise Price)
Options granted to senior executives as at 18 December 2014 vesting on 30 September 2017.
These options vest according to the same performance conditions as the MD & CEO EEIPO grant.
Note: The number of performance rights/options granted and the value of the denominator for the ELTIRP made on 10 November 2010 and 10 November 2011 have been restated using the post consolidation value being 1 for every 10.
E2. Performance testing of 2010 and 2011 senior executive grant.
Following completion of their measurement periods, the final tranche (Tranche 3) of the 2010 senior executive grant and Tranche 2 of the 2011 senior executive grant were tested against their performance hurdles, resulting
in nil vesting and lapsing of 1,031,465 performance rights (103,147 post consolidation) valued at $206,293. The value is based on the number of rights multiplied by closing share price of $0.20 as at 11 November 2014.
Elders. Live it.Annual Report 2015
44
For
per
sona
l use
onl
y
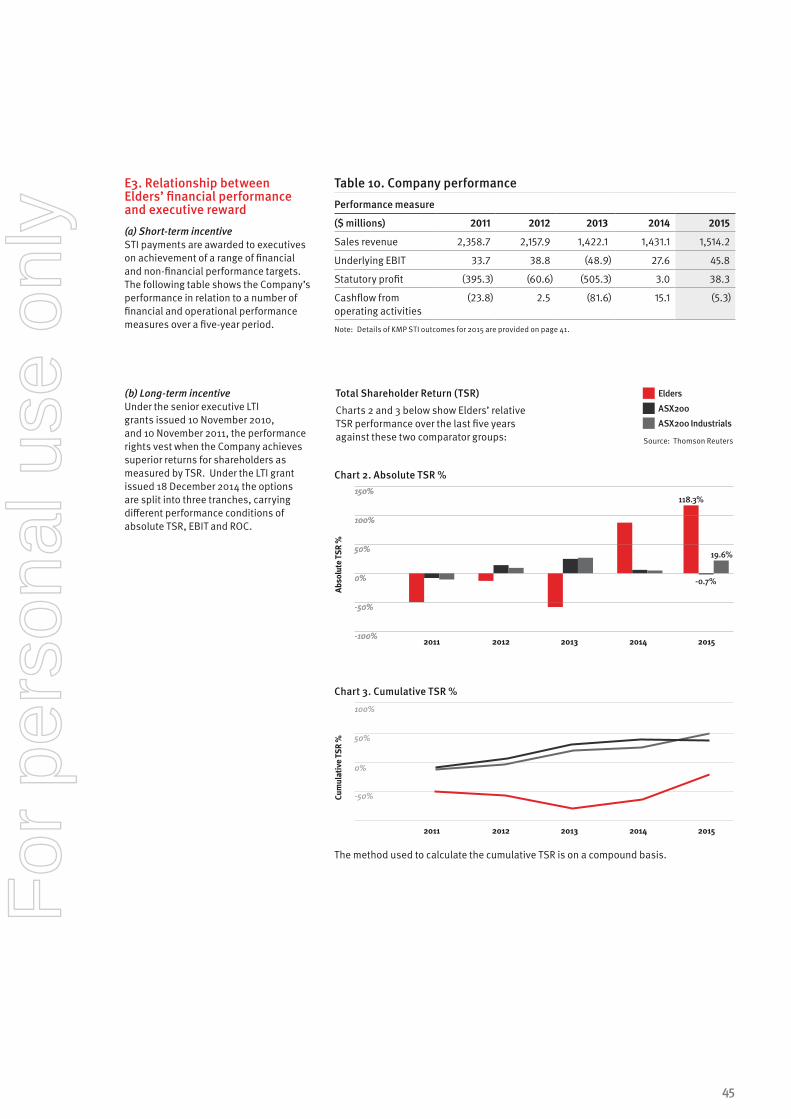
E3. Relationship between Elders’ financial performance and executive reward(a) Short-term incentiveSTI payments are awarded to executives on achievement of a range of financial and non-financial performance targets. The following table shows the Company’s performance in relation to a number of financial and operational performance measures over a five-year period.
Table 10. Company performance
Performance measure
($ millions) 2011 2012 2013 2014 2015
Sales revenue 2,358.7 2,157.9 1,422.1 1,431.1 1,514.2
Underlying EBIT 33.7 38.8 (48.9) 27.6 45.8
Statutory profit (395.3) (60.6) (505.3) 3.0 38.3
Cashflow from operating activities
(23.8) 2.5 (81.6) 15.1 (5.3)
Note: Details of KMP STI outcomes for 2015 are provided on page 41.
(b) Long-term incentiveUnder the senior executive LTI grants issued 10 November 2010, and 10 November 2011, the performance rights vest when the Company achieves superior returns for shareholders as measured by TSR. Under the LTI grant issued 18 December 2014 the options are split into three tranches, carrying different performance conditions of absolute TSR, EBIT and ROC.
Total Shareholder Return (TSR)
Charts 2 and 3 below show Elders’ relative TSR performance over the last five years against these two comparator groups:
Elders
ASX200
ASX200 Industrials
Source: Thomson Reuters
Abso
lute
TSR
%
150%
100%
50%
0%
-50%
-100%2015
118.3%
-0.7%
19.6%
150%
100%
50%
0%
-50%
-100%2011 2012 2013 2014
Chart 2. Absolute TSR %
Cum
ulat
ive
TSR
%
2011 2012 2013 2014 2015
100%
50%
-50%
0%
Chart 3. Cumulative TSR %
The method used to calculate the cumulative TSR is on a compound basis.
45
For
per
sona
l use
onl
y
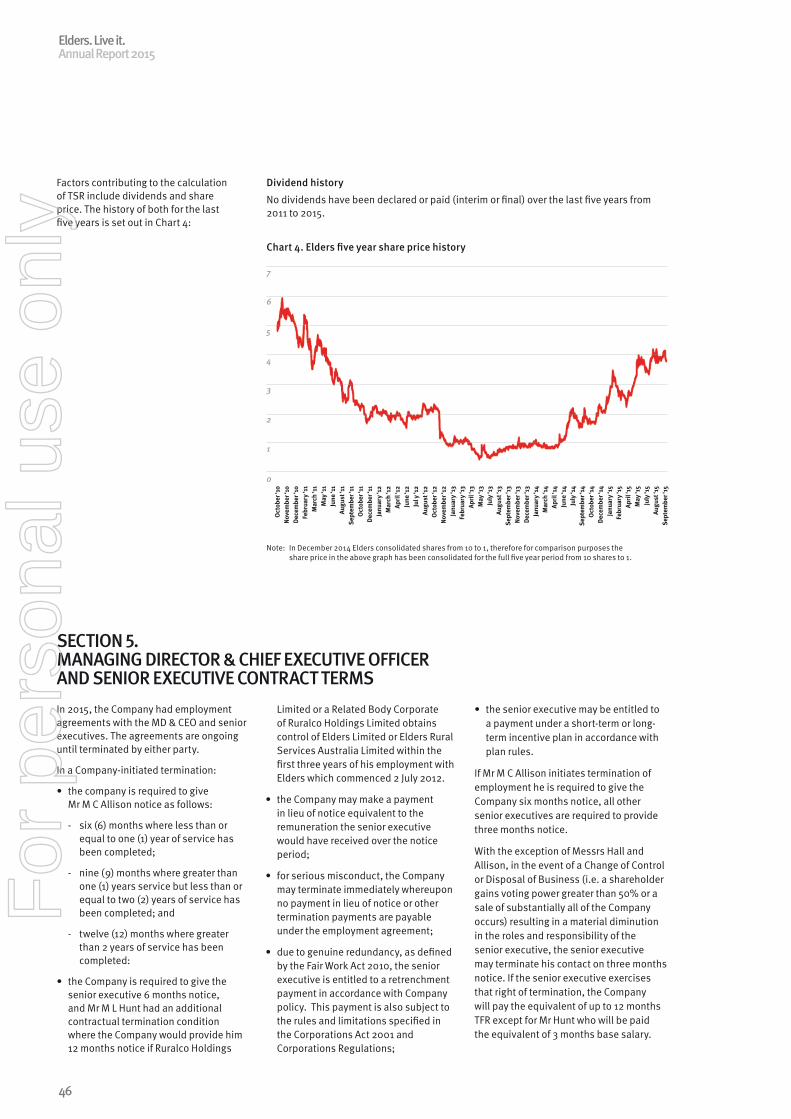
SECTION 5. MANAGING DIRECTOR & CHIEF EXECUTIVE OFFICER AND SENIOR EXECUTIVE CONTRACT TERMSIn 2015, the Company had employment agreements with the MD & CEO and senior executives. The agreements are ongoing until terminated by either party.
In a Company-initiated termination:
• the company is required to give Mr M C Allison notice as follows:
- six (6) months where less than or equal to one (1) year of service has been completed;
- nine (9) months where greater than one (1) years service but less than or equal to two (2) years of service has been completed; and
- twelve (12) months where greater than 2 years of service has been completed:
• the Company is required to give the senior executive 6 months notice, and Mr M L Hunt had an additional contractual termination condition where the Company would provide him 12 months notice if Ruralco Holdings
Limited or a Related Body Corporate of Ruralco Holdings Limited obtains control of Elders Limited or Elders Rural Services Australia Limited within the first three years of his employment with Elders which commenced 2 July 2012.
• the Company may make a payment in lieu of notice equivalent to the remuneration the senior executive would have received over the notice period;
• for serious misconduct, the Company may terminate immediately whereupon no payment in lieu of notice or other termination payments are payable under the employment agreement;
• due to genuine redundancy, as defined by the Fair Work Act 2010, the senior executive is entitled to a retrenchment payment in accordance with Company policy. This payment is also subject to the rules and limitations specified in the Corporations Act 2001 and Corporations Regulations;
• the senior executive may be entitled to a payment under a short-term or long-term incentive plan in accordance with plan rules.
If Mr M C Allison initiates termination of employment he is required to give the Company six months notice, all other senior executives are required to provide three months notice.
With the exception of Messrs Hall and Allison, in the event of a Change of Control or Disposal of Business (i.e. a shareholder gains voting power greater than 50% or a sale of substantially all of the Company occurs) resulting in a material diminution in the roles and responsibility of the senior executive, the senior executive may terminate his contact on three months notice. If the senior executive exercises that right of termination, the Company will pay the equivalent of up to 12 months TFR except for Mr Hunt who will be paid the equivalent of 3 months base salary.
Factors contributing to the calculation of TSR include dividends and share price. The history of both for the last five years is set out in Chart 4:
Dividend history
No dividends have been declared or paid (interim or final) over the last five years from 2011 to 2015.
Chart 4. Elders five year share price history
Note: In December 2014 Elders consolidated shares from 10 to 1, therefore for comparison purposes the share price in the above graph has been consolidated for the full five year period from 10 shares to 1.
Oct
ober
‘10
Nove
mbe
r ‘10
Dece
mbe
r ‘10
Febr
uary
‘11
Mar
ch ‘1
1M
ay ‘1
1Ju
ne ‘1
1Au
gust
‘11
Sept
embe
r ‘11
Oct
ober
‘11
Dece
mbe
r ‘11
Janu
ary
‘12
Mar
ch ‘1
2Ap
ril ‘1
2Ju
ne ‘1
2Ju
l y ‘1
2Au
gust
‘12
Oct
ober
‘12
Nove
mbe
r ‘12
Janu
ary
‘13
Febr
uary
‘13
April
‘13
May
‘13
July
‘13
Augu
st ‘1
3Se
ptem
ber ‘
13No
vem
ber ‘
13De
cem
ber ‘
13Ja
nuar
y ‘1
4M
arch
‘14
April
‘14
June
‘14
July
‘14
Sept
embe
r ‘14
Oct
ober
‘14
Dece
mbe
r ‘14
Janu
ary
‘15
Febr
uary
‘15
April
‘15
May
‘15
July
‘15
Augu
st ‘1
5Se
ptem
ber ‘
15
7
6
5
4
3
2
1
0
Elders. Live it.Annual Report 2015
46
For
per
sona
l use
onl
y
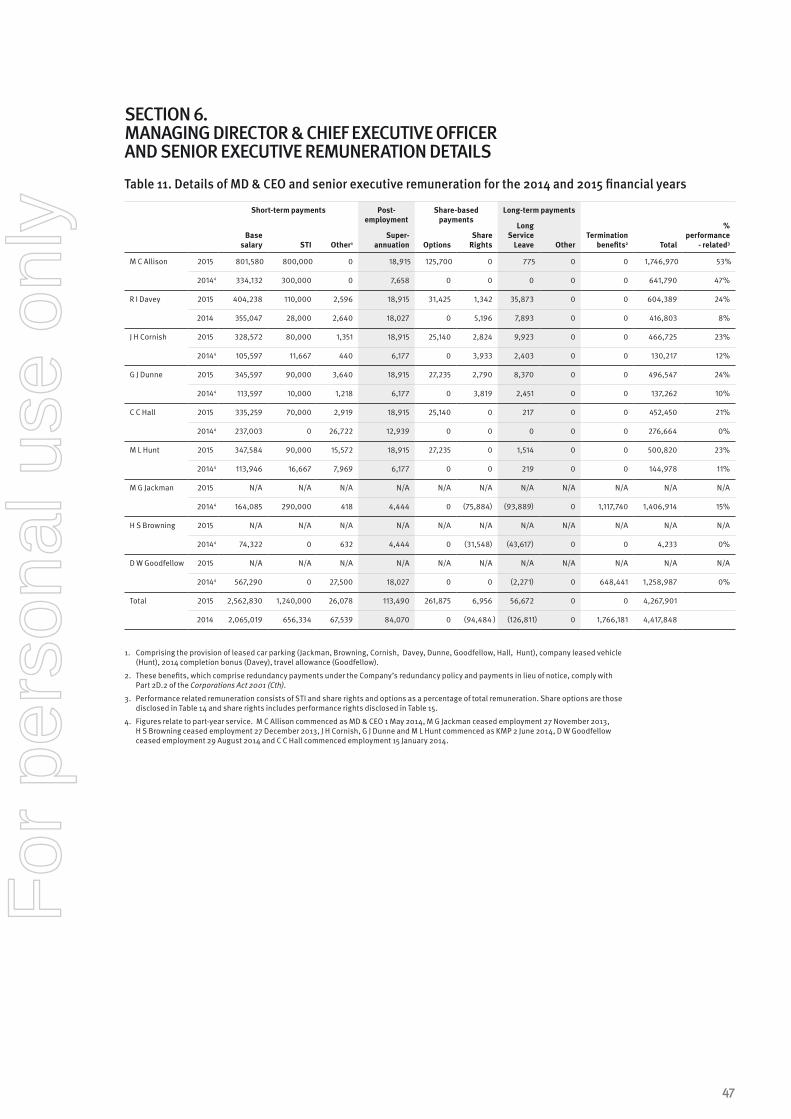
SECTION 6. MANAGING DIRECTOR & CHIEF EXECUTIVE OFFICER AND SENIOR EXECUTIVE REMUNERATION DETAILS Table 11. Details of MD & CEO and senior executive remuneration for the 2014 and 2015 financial years
Short-term payments Post- employment
Share-based payments
Long-term payments
Base salary STI Other1
Super-annuation Options
Share Rights
Long Service
Leave OtherTermination
benefits2
Total
% performance
- related3
M C Allison 2015 801,580 800,000 0 18,915 125,700 0 775 0 0 1,746,970 53%
20144 334,132 300,000 0 7,658 0 0 0 0 0 641,790 47%
R I Davey 2015 404,238 110,000 2,596 18,915 31,425 1,342 35,873 0 0 604,389 24%
2014 355,047 28,000 2,640 18,027 0 5,196 7,893 0 0 416,803 8%
J H Cornish
2015 328,572 80,000 1,351 18,915 25,140 2,824 9,923 0 0 466,725 23%
20144 105,597 11,667 440 6,177 0 3,933 2,403 0 0 130,217 12%
G J Dunne
2015 345,597 90,000 3,640 18,915 27,235 2,790 8,370 0 0 496,547 24%
20144 113,597 10,000 1,218 6,177 0 3,819 2,451 0 0 137,262 10%
C C Hall
2015 335,259 70,000 2,919 18,915 25,140 0 217 0 0 452,450 21%
20144 237,003 0 26,722 12,939 0 0 0 0 0 276,664 0%
M L Hunt
2015 347,584 90,000 15,572 18,915 27,235 0 1,514 0 0 500,820 23%
20144 113,946 16,667 7,969 6,177 0 0 219 0 0 144,978 11%
M G Jackman
2015 N/A N/A N/A N/A N/A N/A N/A N/A N/A N/A N/A
20144 164,085 290,000 418 4,444 0 (75,884) (93,889) 0 1,117,740 1,406,914 15%
H S Browning 2015 N/A N/A N/A N/A N/A N/A N/A N/A N/A N/A N/A
20144 74,322 0 632 4,444 0 (31,548) (43,617) 0 0 4,233 0%
D W Goodfellow 2015 N/A N/A N/A N/A N/A N/A N/A N/A N/A N/A N/A
20144 567,290 0 27,500 18,027 0 0 (2,271) 0 648,441 1,258,987 0%
Total 2015 2,562,830 1,240,000 26,078 113,490 261,875 6,956 56,672 0 0 4,267,901
2014 2,065,019 656,334 67,539 84,070 0 (94,484 ) (126,811) 0 1,766,181 4,417,848
1. Comprising the provision of leased car parking (Jackman, Browning, Cornish, Davey, Dunne, Goodfellow, Hall, Hunt), company leased vehicle (Hunt), 2014 completion bonus (Davey), travel allowance (Goodfellow).
2. These benefits, which comprise redundancy payments under the Company’s redundancy policy and payments in lieu of notice, comply with Part 2D.2 of the Corporations Act 2001 (Cth).
3. Performance related remuneration consists of STI and share rights and options as a percentage of total remuneration. Share options are those disclosed in Table 14 and share rights includes performance rights disclosed in Table 15.
4. Figures relate to part-year service. M C Allison commenced as MD & CEO 1 May 2014, M G Jackman ceased employment 27 November 2013, H S Browning ceased employment 27 December 2013, J H Cornish, G J Dunne and M L Hunt commenced as KMP 2 June 2014, D W Goodfellow ceased employment 29 August 2014 and C C Hall commenced employment 15 January 2014.
47
For
per
sona
l use
onl
y
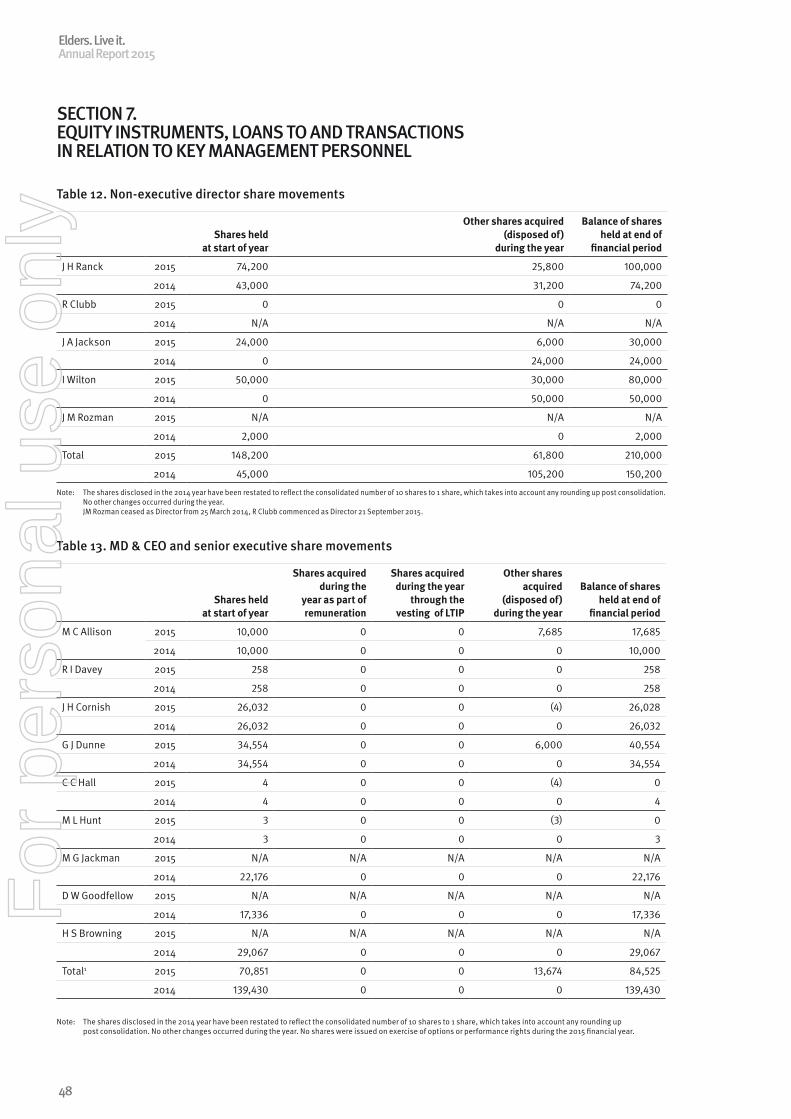
SECTION 7. EQUITY INSTRUMENTS, LOANS TO AND TRANSACTIONS IN RELATION TO KEY MANAGEMENT PERSONNEL
Table 12. Non-executive director share movements
Shares held at start of year
Other shares acquired (disposed of)
during the year
Balance of shares held at end of
financial period
J H Ranck 2015 74,200 25,800 100,000
2014 43,000 31,200 74,200
R Clubb 2015 0 0 0
2014 N/A N/A N/A
J A Jackson 2015 24,000 6,000 30,000
2014 0 24,000 24,000
I Wilton 2015 50,000 30,000 80,000
2014 0 50,000 50,000
J M Rozman 2015 N/A N/A N/A
2014 2,000 0 2,000
Total 2015 148,200 61,800 210,000
2014 45,000 105,200 150,200
Note: The shares disclosed in the 2014 year have been restated to reflect the consolidated number of 10 shares to 1 share, which takes into account any rounding up post consolidation. No other changes occurred during the year. JM Rozman ceased as Director from 25 March 2014, R Clubb commenced as Director 21 September 2015.
Table 13. MD & CEO and senior executive share movements
Shares held at start of year
Shares acquired during the
year as part of remuneration
Shares acquired during the year
through the vesting of LTIP
Other shares acquired
(disposed of) during the year
Balance of shares held at end of
financial period
M C Allison 2015 10,000 0 0 7,685 17,685
2014 10,000 0 0 0 10,000
R I Davey 2015 258 0 0 0 258
2014 258 0 0 0 258
J H Cornish 2015 26,032 0 0 (4) 26,028
2014 26,032 0 0 0 26,032
G J Dunne 2015 34,554 0 0 6,000 40,554
2014 34,554 0 0 0 34,554
C C Hall 2015 4 0 0 (4) 0
2014 4 0 0 0 4
M L Hunt 2015 3 0 0 (3) 0
2014 3 0 0 0 3
M G Jackman 2015 N/A N/A N/A N/A N/A
2014 22,176 0 0 0 22,176
D W Goodfellow 2015 N/A N/A N/A N/A N/A
2014 17,336 0 0 0 17,336
H S Browning 2015 N/A N/A N/A N/A N/A
2014 29,067 0 0 0 29,067
Total1 2015 70,851 0 0 13,674 84,525
2014 139,430 0 0 0 139,430
Note: The shares disclosed in the 2014 year have been restated to reflect the consolidated number of 10 shares to 1 share, which takes into account any rounding up post consolidation. No other changes occurred during the year. No shares were issued on exercise of options or performance rights during the 2015 financial year.
Elders. Live it.Annual Report 2015
48
For
per
sona
l use
onl
y
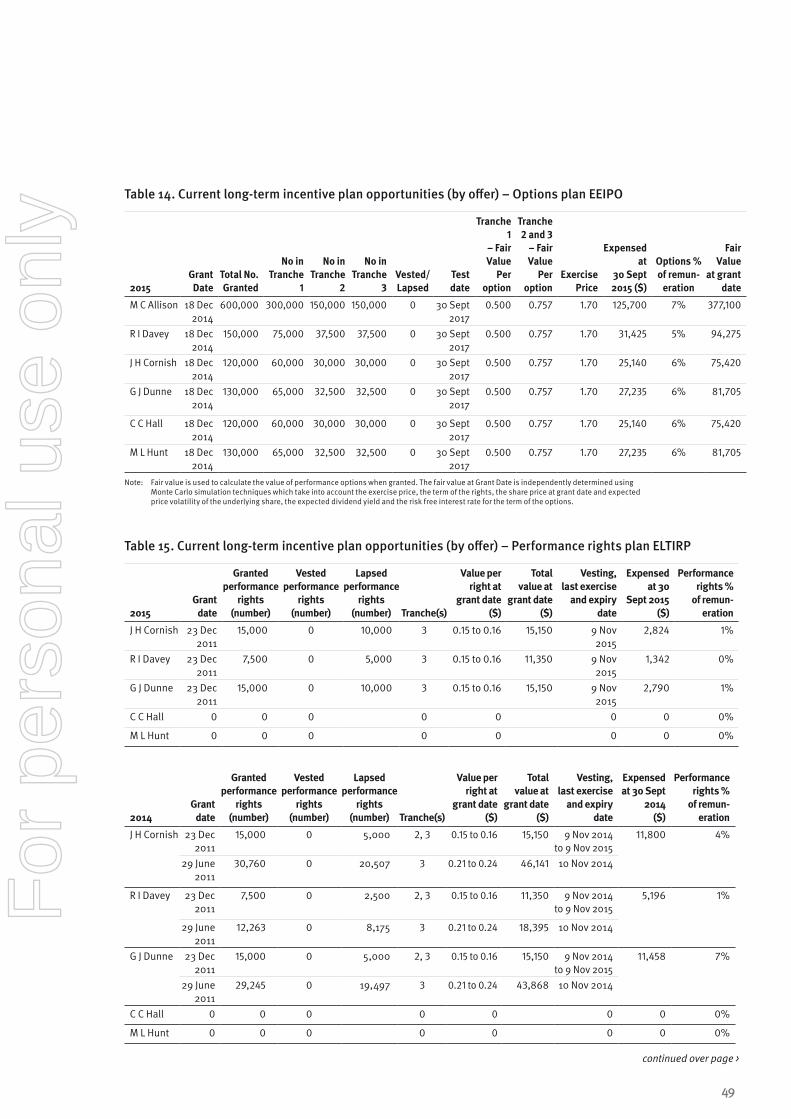
Table 14. Current long-term incentive plan opportunities (by offer) – Options plan EEIPO
2015Grant Date
Total No. Granted
No in Tranche
1
No in Tranche
2
No in Tranche
3 Vested/ Lapsed
Test date
Tranche 1
– Fair Value
Per option
Tranche 2 and 3
– Fair Value
Per option
Exercise Price
Expensed at
30 Sept 2015 ($)
Options % of remun-
eration
Fair Value
at grant date
M C Allison 18 Dec 2014
600,000 300,000 150,000 150,000 0 30 Sept 2017
0.500 0.757 1.70 125,700 7% 377,100
R I Davey 18 Dec 2014
150,000 75,000 37,500 37,500 0 30 Sept 2017
0.500 0.757 1.70 31,425 5% 94,275
J H Cornish 18 Dec 2014
120,000 60,000 30,000 30,000 0 30 Sept 2017
0.500 0.757 1.70 25,140 6% 75,420
G J Dunne 18 Dec 2014
130,000 65,000 32,500 32,500 0 30 Sept 2017
0.500 0.757 1.70 27,235 6% 81,705
C C Hall 18 Dec 2014
120,000 60,000 30,000 30,000 0 30 Sept 2017
0.500 0.757 1.70 25,140 6% 75,420
M L Hunt 18 Dec 2014
130,000 65,000 32,500 32,500 0 30 Sept 2017
0.500 0.757 1.70 27,235 6% 81,705
Note: Fair value is used to calculate the value of performance options when granted. The fair value at Grant Date is independently determined using Monte Carlo simulation techniques which take into account the exercise price, the term of the rights, the share price at grant date and expected price volatility of the underlying share, the expected dividend yield and the risk free interest rate for the term of the options.
Table 15. Current long-term incentive plan opportunities (by offer) – Performance rights plan ELTIRP
2015Grant
date
Granted performance
rights (number)
Vested performance
rights (number)
Lapsed performance
rights (number) Tranche(s)
Value per right at
grant date ($)
Total value at
grant date ($)
Vesting, last exercise
and expiry date
Expensed at 30
Sept 2015 ($)
Performance rights %
of remun-eration
J H Cornish 23 Dec 2011
15,000 0 10,000 3 0.15 to 0.16 15,150 9 Nov 2015
2,824 1%
R I Davey 23 Dec 2011
7,500 0 5,000 3 0.15 to 0.16 11,350 9 Nov 2015
1,342 0%
G J Dunne 23 Dec 2011
15,000 0 10,000 3 0.15 to 0.16 15,150 9 Nov 2015
2,790 1%
C C Hall 0 0 0 0 0 0 0 0%
M L Hunt 0 0 0 0 0 0 0 0%
2014Grant
date
Granted performance
rights (number)
Vested performance
rights (number)
Lapsed performance
rights (number) Tranche(s)
Value per right at
grant date ($)
Total value at
grant date ($)
Vesting, last exercise
and expiry date
Expensed at 30 Sept
2014 ($)
Performance rights %
of remun-eration
J H Cornish 23 Dec 2011
15,000 0 5,000 2, 3 0.15 to 0.16 15,150 9 Nov 2014 to 9 Nov 2015
11,800 4%
29 June 2011
30,760 0 20,507 3 0.21 to 0.24 46,141 10 Nov 2014
R I Davey 23 Dec 2011
7,500 0 2,500 2, 3 0.15 to 0.16 11,350 9 Nov 2014 to 9 Nov 2015
5,196 1%
29 June 2011
12,263 0 8,175 3 0.21 to 0.24 18,395 10 Nov 2014
G J Dunne 23 Dec 2011
15,000 0 5,000 2, 3 0.15 to 0.16 15,150 9 Nov 2014 to 9 Nov 2015
11,458 7%
29 June 2011
29,245 0 19,497 3 0.21 to 0.24 43,868 10 Nov 2014
C C Hall 0 0 0 0 0 0 0 0%
M L Hunt 0 0 0 0 0 0 0 0%
continued over page >
49
For
per
sona
l use
onl
y
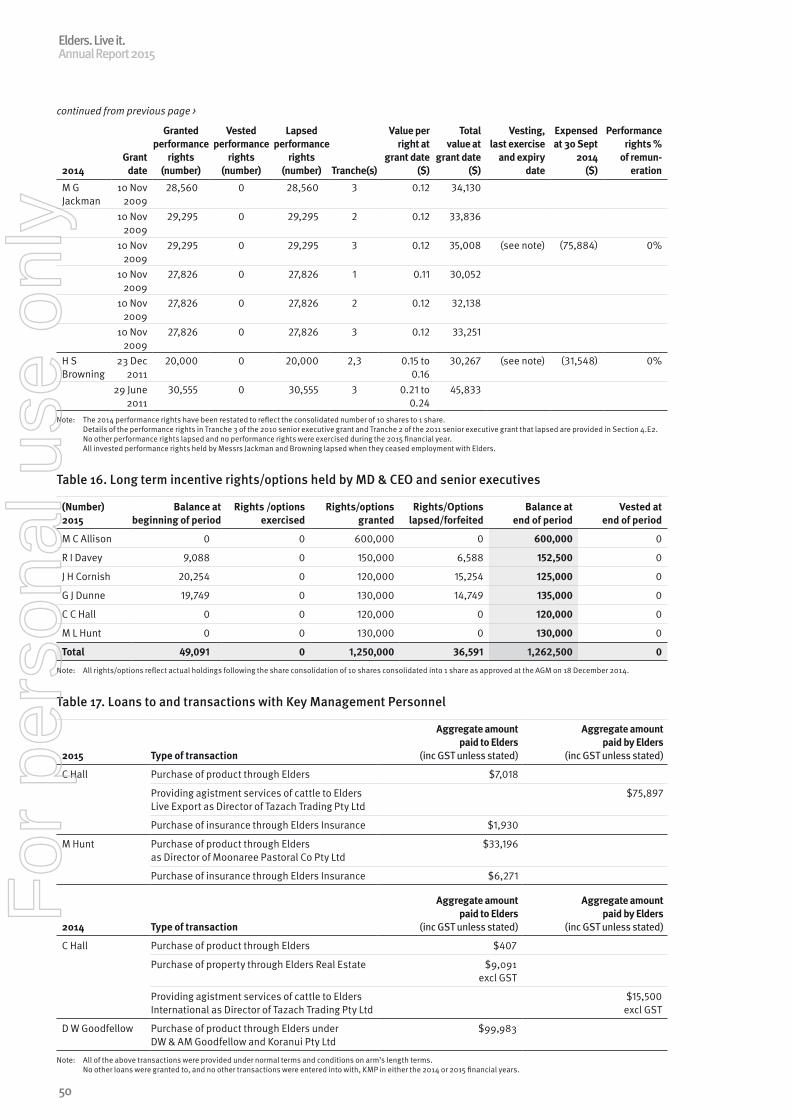
Table 16. Long term incentive rights/options held by MD & CEO and senior executives
(Number) 2015
Balance at beginning of period
Rights /options exercised
Rights/options granted
Rights/Options lapsed/forfeited
Balance at end of period
Vested at end of period
M C Allison 0 0 600,000 0 600,000 0
R I Davey 9,088 0 150,000 6,588 152,500 0
J H Cornish 20,254 0 120,000 15,254 125,000 0
G J Dunne 19,749 0 130,000 14,749 135,000 0
C C Hall 0 0 120,000 0 120,000 0
M L Hunt 0 0 130,000 0 130,000 0
Total 49,091 0 1,250,000 36,591 1,262,500 0
Note: All rights/options reflect actual holdings following the share consolidation of 10 shares consolidated into 1 share as approved at the AGM on 18 December 2014.
Table 17. Loans to and transactions with Key Management Personnel
2015 Type of transaction
Aggregate amount paid to Elders
(inc GST unless stated)
Aggregate amount paid by Elders
(inc GST unless stated)
C Hall Purchase of product through Elders $7,018
Providing agistment services of cattle to Elders Live Export as Director of Tazach Trading Pty Ltd
$75,897
Purchase of insurance through Elders Insurance $1,930
M Hunt Purchase of product through Elders as Director of Moonaree Pastoral Co Pty Ltd
$33,196
Purchase of insurance through Elders Insurance $6,271
2014 Type of transaction
Aggregate amount paid to Elders
(inc GST unless stated)
Aggregate amount paid by Elders
(inc GST unless stated)
C Hall Purchase of product through Elders $407
Purchase of property through Elders Real Estate $9,091 excl GST
Providing agistment services of cattle to Elders International as Director of Tazach Trading Pty Ltd
$15,500 excl GST
D W Goodfellow Purchase of product through Elders under DW & AM Goodfellow and Koranui Pty Ltd
$99,983
Note: All of the above transactions were provided under normal terms and conditions on arm’s length terms. No other loans were granted to, and no other transactions were entered into with, KMP in either the 2014 or 2015 financial years.
2014Grant
date
Granted performance
rights (number)
Vested performance
rights (number)
Lapsed performance
rights (number) Tranche(s)
Value per right at
grant date ($)
Total value at
grant date ($)
Vesting, last exercise
and expiry date
Expensed at 30 Sept
2014 ($)
Performance rights %
of remun-eration
M G Jackman
10 Nov 2009
28,560 0 28,560 3 0.12 34,130
10 Nov 2009
29,295 0 29,295 2 0.12 33,836
10 Nov 2009
29,295 0 29,295 3 0.12 35,008 (see note) (75,884) 0%
10 Nov 2009
27,826 0 27,826 1 0.11 30,052
10 Nov 2009
27,826 0 27,826 2 0.12 32,138
10 Nov 2009
27,826 0 27,826 3 0.12 33,251
H S Browning
23 Dec 2011
20,000 0 20,000 2,3 0.15 to 0.16
30,267 (see note) (31,548) 0%
29 June 2011
30,555 0 30,555 3 0.21 to 0.24
45,833
Note: The 2014 performance rights have been restated to reflect the consolidated number of 10 shares to 1 share. Details of the performance rights in Tranche 3 of the 2010 senior executive grant and Tranche 2 of the 2011 senior executive grant that lapsed are provided in Section 4.E2. No other performance rights lapsed and no performance rights were exercised during the 2015 financial year. All invested performance rights held by Messrs Jackman and Browning lapsed when they ceased employment with Elders.
continued from previous page >
Elders. Live it.Annual Report 2015
50
For
per
sona
l use
onl
y
ELDERS LIMITED
For the year ended 30 September 2015
Annual Financial Report
Live it.
For
per
sona
l use
onl
y
Elders Limited ANNUAL FINANCIAL REPORTFor the year ended 30 September 2015
Consolidated Statement of Comprehensive Income 53
Consolidated Statement of Financial Position 54
Consolidated Statement of Cash Flows 55
Consolidated Statement of Changes in Equity 56
Notes to the Consolidated Financial Statements 57
1 Corporate Information 57
2 Summary of Significant Accounting Policies 57
3 Significant Accounting Judgements, Estimates and Assumptions 63
4 Revenue and Expenses 64
5 Income Tax 65
6 Receivables 67
7 Biological Assets 68
8 Inventory 69
9 Other Financial Assets 69
10 Equity Accounted Investments 69
11 Property, Plant and Equipment 70
12 Brand Name 71
13 Trade and Other Payables 72
14 Interest Bearing Loans and Borrowings 72
15 Provisions 73
16 Contributed Equity 74
17 Hybrid Equity 74
18 Reserves 75
19 Retained Earnings 75
20 Dividends 76
21 Cash Flow Statement Reconciliation 76
22 Expenditure Commitments 77
23 Contingent Liabilities 77
24 Segment Information 78
25 Auditors Remuneration 79
26 Investments in Controlled Entities 80
27 Key Management Personnel 83
28 Related Party Disclosures 83
29 Earnings Per Share 84
30 Financial Instruments 85
31 Business Combinations – Changes in the Composition of the Entity 89
32 Discontinued Operations 90
33 Parent Entity 91
34 Subsequent Events 91
Directors’ Declaration 92
Elders. Live it.Annual Report 2015
52
For
per
sona
l use
onl
y
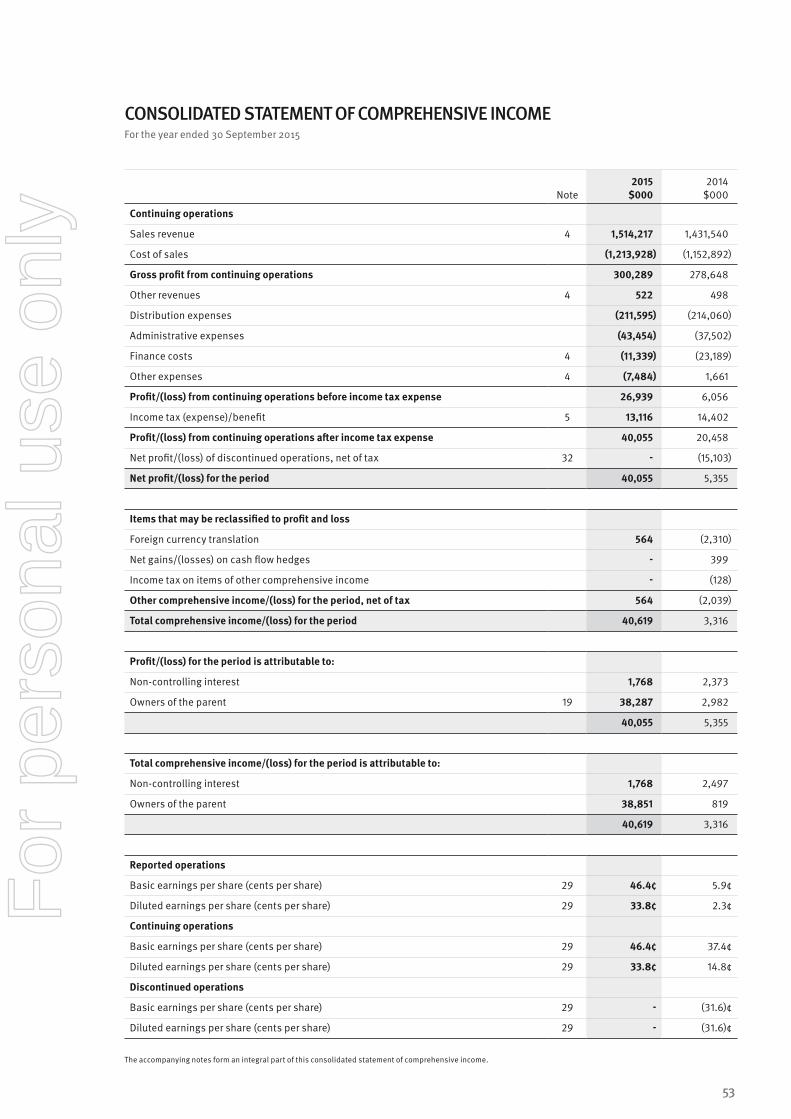
CONSOLIDATED STATEMENT OF COMPREHENSIVE INCOMEFor the year ended 30 September 2015
Note2015
$0002014
$000
Continuing operations
Sales revenue 4 1,514,217 1,431,540
Cost of sales (1,213,928) (1,152,892)
Gross profit from continuing operations 300,289 278,648
Other revenues 4 522 498
Distribution expenses (211,595) (214,060)
Administrative expenses (43,454) (37,502)
Finance costs 4 (11,339) (23,189)
Other expenses 4 (7,484) 1,661
Profit/(loss) from continuing operations before income tax expense 26,939 6,056
Income tax (expense)/benefit 5 13,116 14,402
Profit/(loss) from continuing operations after income tax expense 40,055 20,458
Net profit/(loss) of discontinued operations, net of tax 32 - (15,103)
Net profit/(loss) for the period 40,055 5,355
Items that may be reclassified to profit and loss
Foreign currency translation 564 (2,310)
Net gains/(losses) on cash flow hedges - 399
Income tax on items of other comprehensive income - (128)
Other comprehensive income/(loss) for the period, net of tax 564 (2,039)
Total comprehensive income/(loss) for the period 40,619 3,316
Profit/(loss) for the period is attributable to:
Non-controlling interest 1,768 2,373
Owners of the parent 19 38,287 2,982
40,055 5,355
Total comprehensive income/(loss) for the period is attributable to:
Non-controlling interest 1,768 2,497
Owners of the parent 38,851 819
40,619 3,316
Reported operations
Basic earnings per share (cents per share) 29 46.4¢ 5.9¢
Diluted earnings per share (cents per share) 29 33.8¢ 2.3¢
Continuing operations
Basic earnings per share (cents per share) 29 46.4¢ 37.4¢
Diluted earnings per share (cents per share) 29 33.8¢ 14.8¢
Discontinued operations
Basic earnings per share (cents per share) 29 - (31.6)¢
Diluted earnings per share (cents per share) 29 - (31.6)¢
The accompanying notes form an integral part of this consolidated statement of comprehensive income.
53
For
per
sona
l use
onl
y
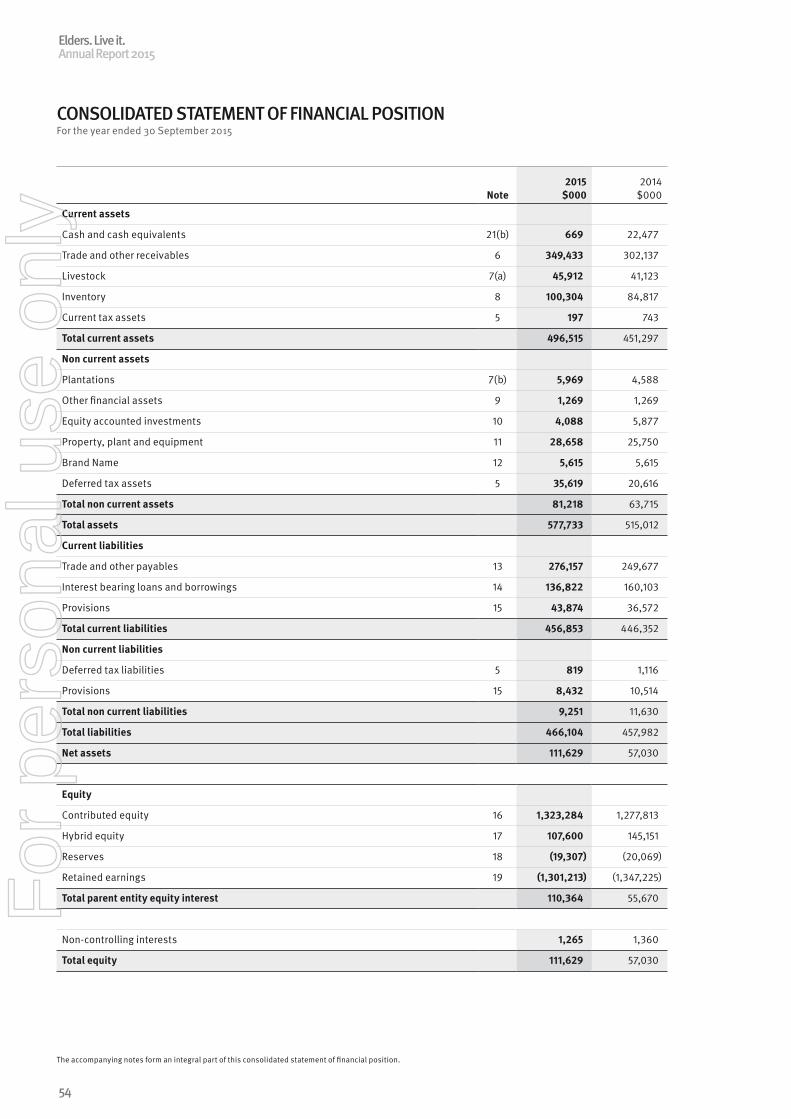
CONSOLIDATED STATEMENT OF FINANCIAL POSITIONFor the year ended 30 September 2015
Note2015
$0002014
$000
Current assets
Cash and cash equivalents 21(b) 669 22,477
Trade and other receivables 6 349,433 302,137
Livestock 7(a) 45,912 41,123
Inventory 8 100,304 84,817
Current tax assets 5 197 743
Total current assets 496,515 451,297
Non current assets
Plantations 7(b) 5,969 4,588
Other financial assets 9 1,269 1,269
Equity accounted investments 10 4,088 5,877
Property, plant and equipment 11 28,658 25,750
Brand Name 12 5,615 5,615
Deferred tax assets 5 35,619 20,616
Total non current assets 81,218 63,715
Total assets 577,733 515,012
Current liabilities
Trade and other payables 13 276,157 249,677
Interest bearing loans and borrowings 14 136,822 160,103
Provisions 15 43,874 36,572
Total current liabilities 456,853 446,352
Non current liabilities
Deferred tax liabilities 5 819 1,116
Provisions 15 8,432 10,514
Total non current liabilities 9,251 11,630
Total liabilities 466,104 457,982
Net assets 111,629 57,030
Equity
Contributed equity 16 1,323,284 1,277,813
Hybrid equity 17 107,600 145,151
Reserves 18 (19,307) (20,069)
Retained earnings 19 (1,301,213) (1,347,225)
Total parent entity equity interest 110,364 55,670
Non-controlling interests 1,265 1,360
Total equity 111,629 57,030
The accompanying notes form an integral part of this consolidated statement of financial position.
Elders. Live it.Annual Report 2015
54
For
per
sona
l use
onl
y
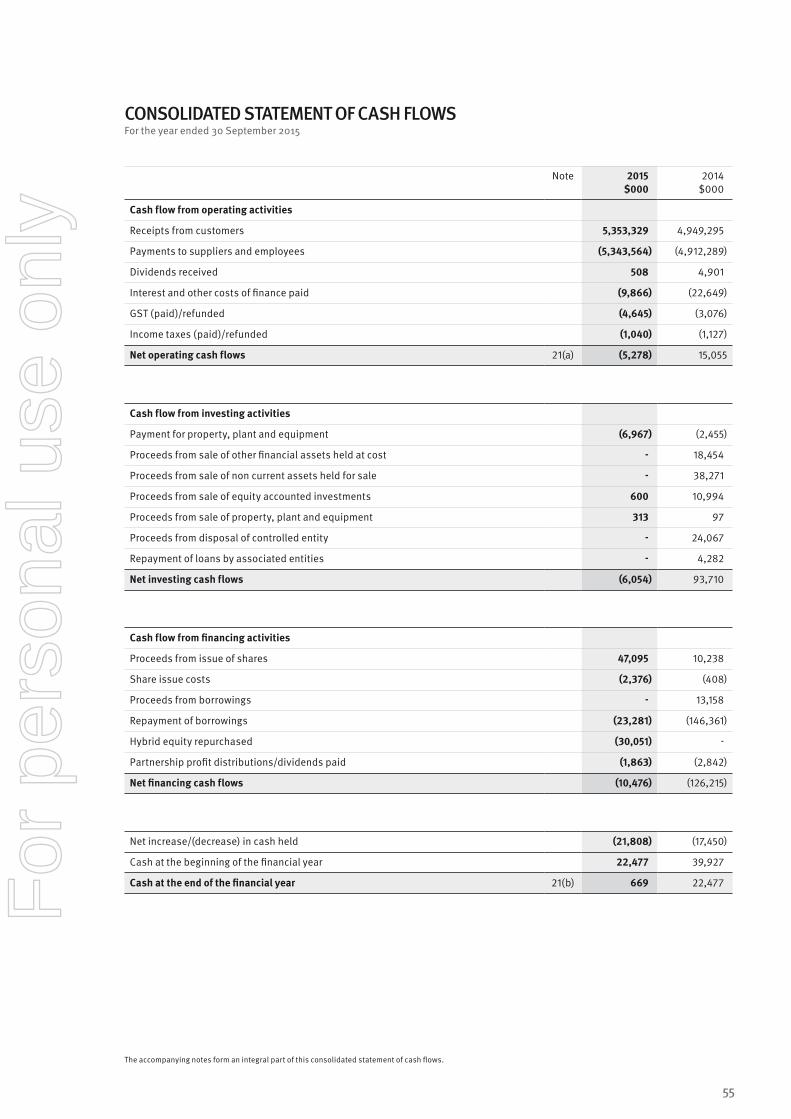
CONSOLIDATED STATEMENT OF CASH FLOWSFor the year ended 30 September 2015
Note 2015 $000
2014 $000
Cash flow from operating activities
Receipts from customers 5,353,329 4,949,295
Payments to suppliers and employees (5,343,564) (4,912,289)
Dividends received 508 4,901
Interest and other costs of finance paid (9,866) (22,649)
GST (paid)/refunded (4,645) (3,076)
Income taxes (paid)/refunded (1,040) (1,127)
Net operating cash flows 21(a) (5,278) 15,055
Cash flow from investing activities
Payment for property, plant and equipment (6,967) (2,455)
Proceeds from sale of other financial assets held at cost - 18,454
Proceeds from sale of non current assets held for sale - 38,271
Proceeds from sale of equity accounted investments 600 10,994
Proceeds from sale of property, plant and equipment 313 97
Proceeds from disposal of controlled entity - 24,067
Repayment of loans by associated entities - 4,282
Net investing cash flows (6,054) 93,710
Cash flow from financing activities
Proceeds from issue of shares 47,095 10,238
Share issue costs (2,376) (408)
Proceeds from borrowings - 13,158
Repayment of borrowings (23,281) (146,361)
Hybrid equity repurchased (30,051) -
Partnership profit distributions/dividends paid (1,863) (2,842)
Net financing cash flows (10,476) (126,215)
Net increase/(decrease) in cash held (21,808) (17,450)
Cash at the beginning of the financial year 22,477 39,927
Cash at the end of the financial year 21(b) 669 22,477
The accompanying notes form an integral part of this consolidated statement of cash flows.
55
For
per
sona
l use
onl
y
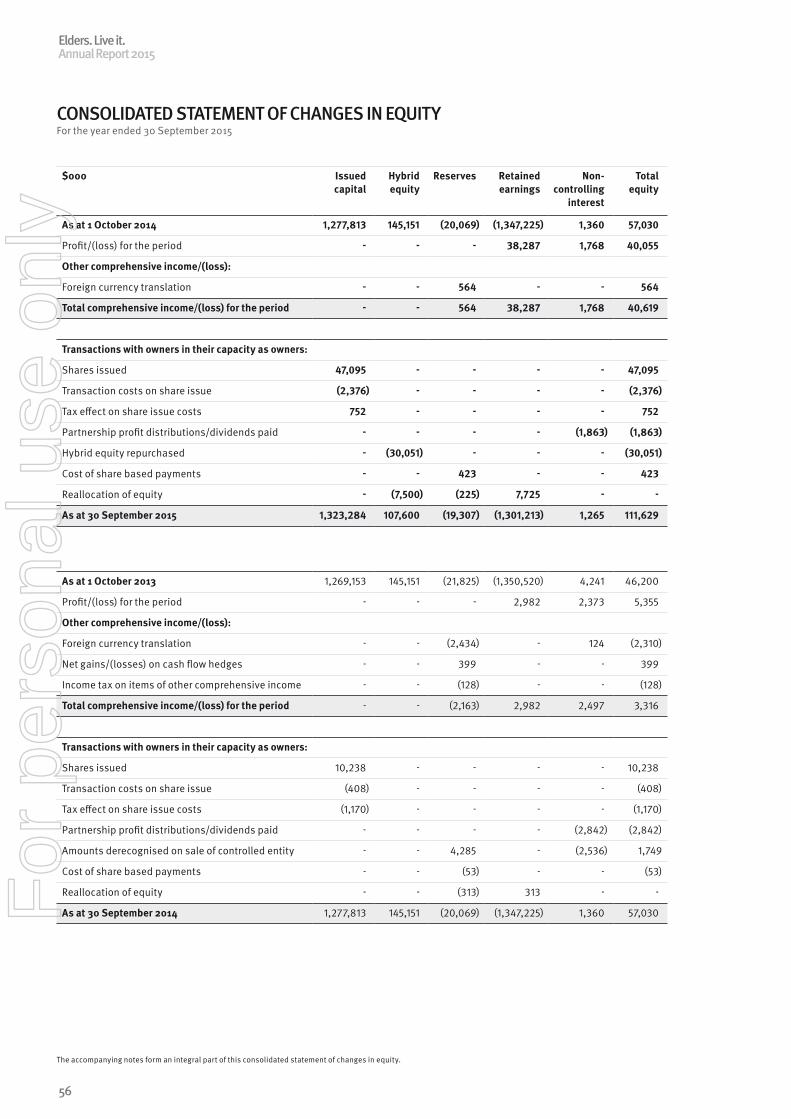
CONSOLIDATED STATEMENT OF CHANGES IN EQUITYFor the year ended 30 September 2015
$000 Issued capital
Hybrid equity
Reserves Retained earnings
Non-controlling
interest
Total equity
As at 1 October 2014 1,277,813 145,151 (20,069) (1,347,225) 1,360 57,030
Profit/(loss) for the period - - - 38,287 1,768 40,055
Other comprehensive income/(loss):
Foreign currency translation - - 564 - - 564
Total comprehensive income/(loss) for the period - - 564 38,287 1,768 40,619
Transactions with owners in their capacity as owners:
Shares issued 47,095 - - - - 47,095
Transaction costs on share issue (2,376) - - - - (2,376)
Tax effect on share issue costs 752 - - - - 752
Partnership profit distributions/dividends paid - - - - (1,863) (1,863)
Hybrid equity repurchased - (30,051) - - - (30,051)
Cost of share based payments - - 423 - - 423
Reallocation of equity - (7,500) (225) 7,725 - -
As at 30 September 2015 1,323,284 107,600 (19,307) (1,301,213) 1,265 111,629
As at 1 October 2013 1,269,153 145,151 (21,825) (1,350,520) 4,241 46,200
Profit/(loss) for the period - - - 2,982 2,373 5,355
Other comprehensive income/(loss):
Foreign currency translation - - (2,434) - 124 (2,310)
Net gains/(losses) on cash flow hedges - - 399 - - 399
Income tax on items of other comprehensive income - - (128) - - (128)
Total comprehensive income/(loss) for the period - - (2,163) 2,982 2,497 3,316
Transactions with owners in their capacity as owners:
Shares issued 10,238 - - - - 10,238
Transaction costs on share issue (408) - - - - (408)
Tax effect on share issue costs (1,170) - - - - (1,170)
Partnership profit distributions/dividends paid - - - - (2,842) (2,842)
Amounts derecognised on sale of controlled entity - - 4,285 - (2,536) 1,749
Cost of share based payments - - (53) - - (53)
Reallocation of equity - - (313) 313 - -
As at 30 September 2014 1,277,813 145,151 (20,069) (1,347,225) 1,360 57,030
The accompanying notes form an integral part of this consolidated statement of changes in equity.
Elders. Live it.Annual Report 2015
56
For
per
sona
l use
onl
y
NOTES TO THE CONSOLIDATED FINANCIAL STATEMENTSFor the year ended 30 September 2015
NOTE 1 – Corporate InformationThe consolidated financial report of Elders Limited for the year ended 30 September 2015 was authorised for issue in accordance with a resolution of the Directors on 16 November 2015. Elders Limited (the Parent) is a for profit company limited by shares incorporated in Australia whose shares are publicly traded on the Australian Securities Exchange.
The nature of the operations and principal activities of the Company are described in the Directors’ Report and note 24. References in this consolidated financial report to ‘Elders’ are to Elders Limited and each of its controlled entities unless the context requires otherwise.
NOTE 2 – Summary of Significant Accounting Policies(a) Basis of preparation The financial report is a general-purpose financial report, which has been prepared in accordance with the requirements of the
Corporations Act 2001, Australian Accounting Standards and other authoritative pronouncements of the Australian Accounting Standards Board (AASB). The financial report has also been prepared on a historical cost basis, except for derivative financial instruments which have been measured at fair value, and biological assets that are measured at fair value less costs to sell.
The financial report is presented in Australian dollars and all values are rounded to the nearest thousand dollars ($000) unless otherwise stated. The financial report has been prepared on a going concern basis.
(b) Compliance with IFRS The financial report also complies with International Financial Reporting Standards (IFRS) as issued by the International
Accounting Standards Board.
(c) New accounting standards and interpretations(i) New and Revised Accounting Standards A number of new amendments to standards and interpretations became operative for the financial year ended 30 September
2015 and have been applied in preparing these consolidated financial statements. None of these have materially impacted Elders and its policies:
• AASB 1031 Materiality• AASB 132 Financial Instruments: Presentation (AASB 2012-3 Amendments – Offsetting Financial Assets and Financial
Liabilities)• AASB 136 Impairment of Assets (AASB 2013-3 Amendments – Recoverable Amount Disclosures for Non-Financial Assets)
The Company has not elected to early adopt any new standard, interpretation or amendment that has been issued but is not yet effective.
(ii) Accounting Standards and Interpretations issued but not yet effective Certain new accounting standards and interpretations have been published that are not mandatory for the financial year
ended 30 September 2015 but are available for early adoption and have not been applied in preparing this report. None are expected to have a significant effect to Elders and its policies. The impact of AASB 9 Financial Instruments and AASB 15 Revenue from Contracts with Customers has not yet been fully assessed.
d) Basis of consolidation The consolidated financial statements comprise the financial statements of Elders Limited and its subsidiaries as at 30
September 2015. Control is achieved when Elders is exposed, or has rights, to variable returns from its involvement with the investee and has the ability to affect those returns through its power over the investee. Specifically, Elders controls an investee if and only if Elders has:• Power over the investee (i.e. existing rights that give it the current ability to direct the relevant activities of the investee)• Exposure, or rights, to variable returns from its involvement with the investee, and• The ability to use its power over the investee to affect its returns
When Elders has less than a majority of the voting or similar rights of an investee, it considers all relevant facts and circumstances in assessing whether it has power over an investee, including:• The contractual arrangement with the other vote holders of the investee• Rights arising from other contractual arrangements• Elders voting rights and potential voting rights
Elders re-assesses whether or not it controls an investee if facts and circumstances indicate that there are changes to one or more of the three elements of control. Consolidation of a subsidiary begins when Elders obtains control over the subsidiary and ceases when it loses control of the subsidiary. Assets, liabilities, income and expenses of a subsidiary acquired or disposed of during the year are included in the statement of comprehensive income from the date Elders gains control until the date Elders ceases to control the subsidiary.
Profit or loss and each component of other comprehensive income (OCI) are attributed to the equity holders of the parent of Elders and to the non-controlling interests, even if this results in the non-controlling interests having a deficit balance. When necessary, adjustments are made to the financial statements of subsidiaries to bring their accounting policies into line with Elders’ accounting policies. All intra-group assets and liabilities, equity, income, expenses and cash flows relating to transactions between members of Elders are eliminated in full on consolidation.
57
For
per
sona
l use
onl
y
NOTES TO THE CONSOLIDATED FINANCIAL STATEMENTSFor the year ended 30 September 2015
NOTE 2 – Summary of Significant Accounting Policies(e) Business combinations Business combinations are accounted for using the acquisition method. The cost of an acquisition is measured as the aggregate
of the consideration transferred, measured at acquisition date fair value and the amount of any non-controlling interest in the acquiree. For each business combination, Elders elects whether it measures the non-controlling interest in the acquiree either at fair value or at the proportionate share of the acquiree’s identifiable net assets. Acquisition costs incurred are expensed and included in administrative expenses.
When Elders acquires a business, it assesses the financial assets and liabilities assumed for appropriate classification and designation in accordance with the contractual terms, economic circumstances and pertinent conditions as at the acquisition date. This includes the separation of embedded derivatives in host contracts by the acquiree.
If the business combination is achieved in stages, the previously held equity interest is remeasured at its acquisition date fair value and any resulting gain or loss is recognised in profit or loss.
Any contingent consideration to be transferred by the acquirer will be recognised at fair value at the acquisition date. Subsequent changes to the fair value of the contingent consideration which is deemed to be an asset or liability will be recognised in accordance with AASB 139 either in profit or loss or as a charge to other comprehensive income. If the contingent consideration is classified as equity, it shall not be remeasured until it is finally settled within equity. In instances where the contingent consideration does not fall within the scope of AASB 139, it is measured in accordance with the appropriate AASB standard.
(f) Foreign currency translation(i) Functional and presentation currency Both the functional and presentation currency of Elders Limited and its Australian subsidiaries is Australian Dollars (AUD).
Subsidiaries incorporated in countries other than Australia (see note 26), which have a functional currency other than Australian Dollars, are translated to the presentation currency.
(ii) Transactions and balances Transactions in foreign currencies are initially recorded by subsidiaries at their respective functional currency rates at the
date the transaction first qualifies for recognition. Monetary assets and liabilities denominated in foreign currencies are retranslated at the rate of exchange ruling at the reporting date.
Differences arising on settlement or translation of monetary items are recognised in profit and loss. Non-monetary items that are measured in terms of historical cost in a foreign currency are translated using the exchange rate as at the date of the initial transaction.
(iii) Translation of Subsidiary Companies’ functional currency to presentation currency The results of subsidiaries incorporated in countries other than Australia, are translated into Australian Dollars (presentation
currency) as at the date of each transaction. Assets and liabilities are translated at exchange rates prevailing at reporting date. Exchange variations resulting from the translation are recognised in the foreign currency translation reserve in equity.
On consolidation, exchange differences arising from the translation of net investments in overseas subsidiaries are taken to the foreign currency translation reserve. If such a subsidiary was sold, the proportionate share of exchange differences would be transferred out of equity and recognised in profit or loss.
(g) Cash and cash equivalents Cash and cash equivalents in the statement of financial position comprise cash at banks and on hand and short-term deposits
with a maturity of three months or less. For the purposes of the consolidated statement of cash flows, cash and cash equivalents consist of cash and cash deposits as defined above, net of outstanding bank overdrafts.
(h) Trade and other receivables Trade receivables are recognised initially at fair value and subsequently measured at amortised cost using the effective interest
rate method, less an allowance for impairment. Collectability of trade receivables is reviewed on an ongoing basis at an operating unit level. Individual debts that are known to be uncollectible are written off when identified. An impairment provision is recognised when there is objective evidence that the Company will not be able to collect the receivable. Financial difficulties of the debtor, default payment or debts greater than 60 days overdue are considered objective evidence of impairment. The amount of the impairment loss is the receivable carrying amount compared to the present value of estimated future cash flows, discounted at the original effective interest rate.
(i) Inventory Inventories are valued at the lower of cost and net realisable value. Costs are assigned to individual items of inventory
predominately on the basis of weighted average cost. Net realisable value is the estimated selling price in the ordinary course of business less the estimated costs necessary to make the sale.
(j) Biological assets Elders holds biological assets in the form of livestock and plantations. Livestock is measured at fair value, which has been
determined based upon various assumptions, including livestock prices, less costs to sell. These assumptions reflect the different categories of livestock held. The market value increments or decrements are recorded in profit and loss. Plantations are measured at anticipated fair value less point of sale costs. These assumptions forecast plantation growth and yields at the current average annual growth rates, prices based on the current price plus indexation and forecast of the net present value of future net cash flows from harvest and costs of maintaining plantations to maturity.
Elders. Live it.Annual Report 2015
58
For
per
sona
l use
onl
y
NOTES TO THE CONSOLIDATED FINANCIAL STATEMENTSFor the year ended 30 September 2015
NOTE 2 – Summary of Significant Accounting Policies(k) Derivative financial instruments and hedging Elders uses forward currency contracts to hedge risks associated with foreign currency rate fluctuations. Such derivative
financial instruments are initially recognised at fair value on the date on which a derivative contract is entered into and are subsequently remeasured to fair value. Derivatives are carried as financial assets when their fair value is positive and as financial liabilities when their fair value is negative. Derivative assets and liabilities are classified as non-current in the statement of financial position when the remaining maturity is more than 12 months, or current when the remaining maturity is less than 12 months.
The fair values of forward currency contracts are calculated by reference to current forward exchange rates for contracts with similar maturity profiles. Any gains or losses arising from changes in fair value of derivatives are taken directly to profit and loss.
(l) Non-current assets and disposal groups held for sale and discontinued operations Non-current assets and disposal groups are classified as held for sale and measured at the lower of their carrying amount and
fair value less costs to sell. Non-current assets and disposal groups are classified as held for sale if their carrying amount will be recovered principally through a sale transaction instead of use. This condition is regarded as met when the sale is highly probable and the asset or disposal group is available for immediate sale in its present condition. Property, plant and equipment and intangible assets once classified as held for sale are not depreciated or amortised.
An impairment loss is recognised for any initial or subsequent write-down of the asset (or disposal group). A gain is recognised for any subsequent increases in fair value less costs to sell of an asset (or disposal group), but not in excess of any cumulative impairment loss previously recognised. A gain or loss not previously recognised by the date of the sale of the non-current asset (or disposal group) is recognised at the date of de-recognition.
A discontinued operation is a component of the entity that has been disposed of or is classified as held for sale and that represents a separate major line of business or geographical area of operations, is part of a single coordinated plan to dispose of such a line of business or area of operations, or is a subsidiary acquired exclusively with a view to resale. The results of discontinued operations are presented separately on the face of the statement of comprehensive income and the assets and liabilities are presented separately on the face of the statement of financial position.
(m) Other financial assets Other financial assets consist of unlisted investments held at historical cost and are classified as available for sale financial assets.
(n) Equity accounted investments Elders’ equity accounted investments are accounted for using the equity method of accounting in the consolidated financial
statements and at cost in the parent. Equity accounted investments are entities over which Elders has significant influence and that are neither subsidiaries nor joint ventures. Elders generally deem they have significant influence if they have over 20% of the voting rights.
Under the equity method, equity accounted investments are carried in the consolidated financial statements at cost plus post acquisition changes in Elders’ share of net assets of the investment. Goodwill relating to the investment is included in the carrying amount of the investment and is neither amortised nor individually tested for impairment.
The income statement reflects Elders’ share of the results of operations of the equity accounted investments.
(o) Property, plant and equipment Property, plant and equipment are stated at historical cost less accumulated depreciation and any accumulated impairment
losses. Such costs include the cost of replacing part of the property, plant and equipment and borrowing costs for long-term construction projects if the recognition criteria are met. When significant parts of property, plant and equipment are required to be replaced at intervals, Elders recognises such parts as individual assets with specific useful lives and depreciates them accordingly. All other repairs and maintenance are recognised in profit or loss as incurred.
Property, plant and equipment, excluding freehold land and assets under construction, are depreciated over the estimated useful economic life of specific assets as follows:
Life Method
Buildings 50 years Straight line
Leasehold improvements Lease term Straight line
Plant and equipment – owned 3 to 10 years Straight line
Plant and equipment – leased Lease term Straight line
Network infrastructure 5 to 25 years Straight line
The useful lives are consistent with those of the prior period. The assets’ residual values, useful lives and amortisation methods are reviewed, and adjusted if appropriate at each financial year end.
Derecognition An item of property, plant and equipment is derecognised upon disposal or when no future economic benefits are expected from
its use or disposal. Gains and losses on disposal are determined by comparing the proceeds with the carrying amount. These are included in the statement of comprehensive income.
59
For
per
sona
l use
onl
y
NOTES TO THE CONSOLIDATED FINANCIAL STATEMENTSFor the year ended 30 September 2015
NOTE 2 – Summary of Significant Accounting Policies(p) Leases The determination of whether an arrangement is, or contains, a lease is based on the substance of the arrangement at inception
date, whether the fulfilment of the arrangement is dependent on the use of a specific asset or assets or the arrangement conveys a right to use the asset, even if that right is not explicitly specified in the arrangement.
(i) Elders as a lessee Finance leases, which transfer substantially all the risks and benefits incidental to ownership of the leased item, are
capitalised at the inception of the lease at the fair value of the leased asset or, if lower, at the present value of the minimum lease payments. Lease payments are apportioned between finance charges and reduction of the lease liability so as to achieve a constant rate of interest on the remaining balance of the liability. Finance charges are recognised as an expense in profit or loss.
Capitalised leased assets are depreciated over the shorter of the estimated useful life of the asset and the lease term if there is no reasonable certainty that Elders will obtain ownership by the end of the lease term.
Operating lease payments are recognised as an expense in the statement of comprehensive income on a straight-line basis over the lease term. Operating lease incentives are recognised as a liability when received and subsequently reduced by allocating lease payments between rental expense and reduction of the liability.
(ii) Elders as a lessor Leases in which Elders retains substantially all the risks and benefits of ownership of the leased asset are classified as
operating leases. Initial direct costs incurred in negotiating an operating lease are added to the carrying amount of the leased asset and recognised as an expense over the lease term on the same basis as rental income. Contingent rents are recognised as revenue in the period in which they are earned.
(q) Impairment of non financial assets other than goodwill and indefinite life intangibles Non financial assets other than goodwill and indefinite life intangibles are tested for impairment whenever events or changes in
circumstances indicate the carrying amount may not be recoverable. At each reporting date, Elders conducts an internal review of asset values, which is used as a source of information to assess for any indicators of impairment. External factors, such as changes in expected future processes, technology and economic conditions, are also monitored to assess for indicators of impairment. If any indication of impairment exists, an estimate of the asset’s recoverable amount is calculated.
An impairment loss is recognised for the amount by which the asset’s carrying value exceeds its recoverable amount. Recoverable amount is the higher of an asset’s fair value less costs to sell and value in use. For the purposes of assessing impairment, assets are grouped at the lowest level for which there are separately identifiable cash inflows that are largely independent of the cash inflows from other assets or groups of assets (cash generating units). Non financial assets other than goodwill that suffered impairment are tested for possible reversal of the impairment whenever events or changes in circumstances indicate that impairment may be reversed.
(r) Brand Name The Brand Name intangible is deemed to have an indefinite useful life and is not amortised. The Brand Name is tested for
impairment at each reporting date. Impairment is determined by assessing the recoverable amount of the group of cash-generating units, to which the Brand Name relates. When the recoverable amount of the group of cash-generating units is less than the carrying amount, an impairment loss is recognised.
The useful life of an intangible asset with an indefinite life is reviewed each reporting period to determine whether the indefinite life assessment continues to be supportable. If not, the change in the useful life assessment from indefinite to finite is accounted for as a change in accounting estimate and is thus accounted for on a prospective basis.
(s) Trade and other payables Trade and other payables are carried at amortised cost and due to their short term nature they are not discounted. They represent
liabilities for goods and services provided by Elders prior to the end of the financial year that remain unpaid and arise when Elders becomes obliged to make future payments in respect of the purchase of these goods and services. The amounts are unsecured and are usually paid within supplier terms.
Financial guarantees Financial guarantee contracts issued by Elders are those contracts that require a payment to be made to reimburse the holder
for a loss it incurs because the specific debtor fails to make a payment when due in accordance with the terms of the debt instrument. Financial guarantee contracts are recognised initially at fair value, adjusted for transaction costs that are directly attributable to the issuance of the guarantee. Subsequently, the liability is measured at the higher of the best estimate of the expenditure required to settle the present obligation at the reporting date and the amount recognised less cumulative amortisation.
Elders. Live it.Annual Report 2015
60
For
per
sona
l use
onl
y
NOTES TO THE CONSOLIDATED FINANCIAL STATEMENTSFor the year ended 30 September 2015
NOTE 2 – Summary of Significant Accounting Policies(t) Interest bearing loans and borrowings All loans and borrowings are initially recognised at the fair value of the consideration received less directly attributable
transaction costs. After initial recognition, interest-bearing loans and borrowings are subsequently measured at amortised cost using the effective interest rate method. Borrowings are classified as current liabilities unless Elders has an unconditional right to defer settlement of the liability for at least 12 months after the reporting date.
Borrowing costs directly attributable to the acquisition, construction or production of a qualifying asset (i.e. an asset that necessarily takes a substantial period of time to get ready for its intended use or sale) are capitalised as part of the cost of that asset. All other borrowing costs are expensed in the period they occur. Borrowing costs consist of interest and other costs that an entity incurs in connection with the borrowing of funds.
(u) Provisions and employee benefits Provisions are recognised when Elders has a present obligation (legal or constructive) as a result of a past event, it is probable
that an outflow of resources embodying economic benefits will be required to settle the obligation and a reliable estimate can be made of the amount of the obligation. When Elders expects some or all of the provision to be reimbursed, for example under an insurance contract, the reimbursement is recognised as a separate asset, but only when the reimbursement is virtually certain. The expense relating to any provision is presented in the statement of comprehensive income net of any reimbursement.
Provisions are measured at the present value of management’s best estimate of the expenditure required to settle the present obligation at the reporting date. The discount rate used to determine the present value reflects current market assessments of the time value of money and the risks specific to the liability. The increase in the provision resulting from the passage of time is recognised in finance costs.
Employee benefits(i) Wages, salaries, annual leave and sick leave Liabilities for wages and salaries, including non-monetary benefits and annual leave expected to be settled within 12 months
of the reporting date are recognised in respect of employees’ service up to the reporting date. They are measured at the amounts expected to be paid when the liabilities are settled. Expenses for non accumulating sick leave are recognised when the leave is taken and are measured at the rates paid or payable.
(ii) Long service leave The liability for long service leave is recognised in the provision for employee benefits and measured as the present value
of expected future payments to be made in respect of services provided by employees up to the reporting date using the projected unit credit method. Consideration is given to expected future wage and salary levels, experience of employee departures, and periods of service. Expected future payments are discounted using market yields at the reporting date on high quality corpoate bonds with terms to maturity and currencies that match, as closely as possible, the estimated future cash outflows.
Restructuring and redundancy Provisions are only recognised when general recognition criteria provisions are fulfilled. Additionally, Elders needs to follow a
detailed formal plan about the business or part of the business concerned, the location and the number of employees affected, a detailed estimate of the associated costs, and appropriate time line. The people affected have a valid expectation that the restructuring is being carried out or the implementation has been initiated already.
Make Good (Restoration) Where Elders has entered leasing arrangements that require the leased asset to be returned at the end of the lease term in its
original condition, an estimate is made of the costs of restoration or dismantling of any improvements and a provision is raised.
Onerous contracts A provision for onerous contracts is recognised when the expected benefits to be derived from a contract are lower than the
unavoidable cost of meeting its obligations under the contract. The provision is measured at the present value of the lower of the expected cost of terminating the contract and the expected net cost of complying with the contract. Before a provision is established, Elders recognises any impairment loss on the assets associated with that contract.
(v) Contributed equity Ordinary shares are classified as equity. Incremental costs directly attributable to the issue of new shares or options are included
in equity as a deduction, net of tax, from the proceeds.
(w) Earnings per share Basic earnings per share amounts are calculated by dividing net profit or loss for the year attributable to ordinary equity holders
of the parent by the weighted average number of ordinary shares outstanding during the period. Diluted earnings per share are calculated by dividing the net profit attributable to ordinary equity holders of the parent by the weighted average of ordinary shares outstanding during the period plus the weighted average number of ordinary shares that would be issued on conversion of all dilutive potential ordinary shares into ordinary shares.
61
For
per
sona
l use
onl
y
NOTES TO THE CONSOLIDATED FINANCIAL STATEMENTSFor the year ended 30 September 2015
NOTE 2 – Summary of Significant Accounting Policies(x) Revenue recognition Revenue is recognised and measured at the fair value of the consideration received or receivable to the extent that it is probable
that economic benefits will flow to Elders and the revenue can be reliably measured. The following specific recognition criteria must also be met before revenue is recognised:
(i) Sale of goods Revenue from the sale of goods is recognised when there has been a transfer of risks and rewards to the customer (through
the execution of a sales agreement at the time of delivery of the goods to the customer), no further work or processing is required, the quantity and quality of the goods has been determined, the price is fixed and generally title has passed (for shipped goods this is the bill of lading).
(ii) Rendering of services Revenue from the rendering of services is recognised as the service is provided.
(iii) Interest income Revenue is recognised as it accrues using the effective interest rate method.
(iv) Dividend income Revenue is recognised when Elders’ right to receive the payment is established. Dividends received from equity accounted
investments are accounted for in accordance with the equity method of accounting.
(y) Income tax and other taxes Current tax assets and liabilities for the current and prior periods are measured at the amount expected to be recovered from
or paid to the taxation authorities based on the current period’s taxable income. The tax rates and tax laws used to compute the amount are those that are enacted or substantively enacted by the reporting date. Current income tax relating to items recognised directly in equity is recognised in equity and not in the income statement. Management periodically evaluates positions taken in the tax returns with respect to situations in which the applicable tax regulations are subject to interpretation and establishes provisions where appropriate.
Deferred income tax is provided on all temporary differences at the reporting date between the tax bases of assets and liabilities and their carrying amounts for financial reporting purposes.
Deferred income tax liabilities are recognised for all taxable temporary differences except: • where the deferred income tax liability arises from the initial recognition of an asset or liability in a transaction that is not a
business combination and, at the time of the transaction, affects neither the accounting profit nor taxable profit or loss; and• when the taxable temporary difference is associated with investments in subsidiaries or equity accounted investments and
the timing of the reversal of the temporary differences can be controlled and it is probable that the temporary differences will not reverse in the foreseeable future.
Deferred income tax assets are recognised for all deductible temporary differences, carry-forward of unused tax credits and unused tax losses, to the extent that it is probable that taxable profit will be available against which the deductible temporary differences and the carry forward of unused tax assets and unused tax losses can be utilised except:• when the deferred income tax asset relating to the deductible temporary difference arises from the initial recognition of an
asset or liability in a transaction that is not a business combination and, at the time of the transaction, affects neither the accounting profit nor taxable profit or loss; and
• when the deductible temporary difference is associated with investments in subsidiaries or equity accounted investments, deferred tax assets are only recognised to the extent that it is probable that the temporary differences will reverse in the foreseeable future and taxable profit will be available against which the temporary differences can be utilised.
The carrying amount of deferred income tax assets is reviewed at each reporting date and reduced to the extent that it is no longer probable that sufficient taxable profit will be available to allow all or part of the deferred income tax asset to be utilised. Unrecognised deferred income tax assets are reassessed at each reporting date and are recognised to the extent that it has become probable that future taxable profit will allow the deferred tax asset to be recovered.
Deferred income tax assets and liabilities are measured at the tax rates that are expected to apply to the year when the asset is realised or the liability is settled, based on tax rates (and tax laws) that have been enacted or substantively enacted at the reporting date.
Deferred tax assets and deferred tax liabilities are offset only if a legally enforceable right exists to set off current tax assets against current tax liabilities and the deferred tax assets and liabilities relate to the same taxable entity and the same taxation authority.
Other taxes Revenues, expenses and assets are recognised net of the amount of GST except:
• where the GST incurred on a purchase of goods and services is not recoverable from the taxation authority, in which case the GST is recognised as part of the cost of acquisition of the asset or as part of the expense item as applicable; and
• receivables and payables are stated with the amount of GST included.
The net amount of GST recoverable from, or payable to, the taxation authority is included as part of receivables or payables in the statement of financial position.
Cash flows are included in the statement of cash flows on a gross basis and the GST component of cash flows arising from investing and financing activities, which is recoverable from, or payable to, the taxation authority are classified as operating cash flows.
Commitments and contingencies are disclosed net of the amount of GST recoverable from, or payable to, the taxation authority.
Elders. Live it.Annual Report 2015
62
For
per
sona
l use
onl
y
NOTES TO THE CONSOLIDATED FINANCIAL STATEMENTSFor the year ended 30 September 2015
NOTE 3 – Significant Accounting Judgements, Estimates and AssumptionsThe preparation of Elders’ consolidated financial statements requires management to make judgements, estimates and assumptions that affect the reported amounts in the financial statements. Management continually evaluates its judgements and estimates in relation to assets, liabilities, contingent liabilities, revenue and expenses. Management bases its judgements and estimates on historical experience and on various other factors it believes to be reasonable under the circumstances, the result of which forms the basis of the carrying value of assets and liabilities that are not readily apparent from other sources.
Management has identified the following critical accounting policies for which significant judgement, estimates and assumptions are made. Actual results may differ from these estimates under different assumptions and conditions and may materially affect the financial result or the financial position reported in future periods. Further details of the nature of these assumptions and conditions may be found in the relevant notes to the financial statements.
Recovery of deferred tax assetsDeferred tax assets are recognised for deductible temporary differences as management considers that it is probable the future taxable profit will be available to utilise those temporary differences. Deferred tax assets are recognised for all unused tax losses to the extent that it is probable that taxable profit will be available against which the losses can be utilised. Significant management judgement is required to determine the amount of deferred tax assets that can be recognised, based on the likely timing and the level of future taxable profits together with future tax planning strategies.
Impairment of non-financial assets other than goodwill and indefinite life intangiblesElders assesses impairment of all assets at each reporting date by evaluating conditions specific to the company and to the particular asset that may lead to impairment. These include product performance, technology, climate, economic and political environments and future product expectations. If an impairment trigger exists the recoverable amount of the asset is determined. It is Elders’ policy to conduct bi-annual internal reviews of asset values, which are used as sources of information to assess for indicators of impairment. Assets have been tested for impairment in accordance with the accounting policies, including the determination of recoverable amounts of assets using the higher of value in use and fair value less cost to sell.
Impairment of Brand NameElders determines whether the Brand Name is impaired on a bi-annual basis. This requires an estimation of the recoverable amount of the associated cash-generating units, using a value in use discounted cash flow methodology, to which the Brand Name is allocated. The assumptions used in this estimation of recoverable amount are discussed in note 12.
Estimation of useful lives of assetsThe estimation of useful lives of assets has been based on historical experience as well as lease terms (for leased assets). In addition, the condition of assets is assessed and considered against the remaining useful life. Adjustments to useful lives are made when considered necessary.
63
For
per
sona
l use
onl
y
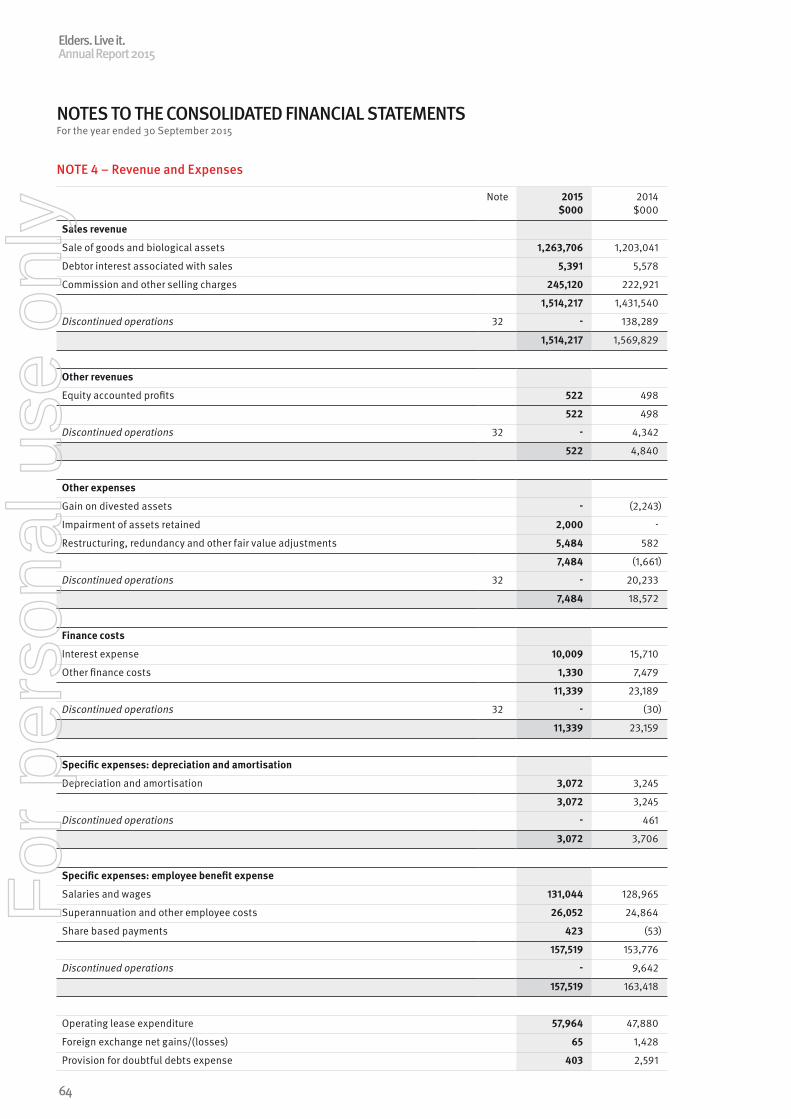
NOTES TO THE CONSOLIDATED FINANCIAL STATEMENTSFor the year ended 30 September 2015
NOTE 4 – Revenue and Expenses
Note 2015 $000
2014 $000
Sales revenue
Sale of goods and biological assets 1,263,706 1,203,041
Debtor interest associated with sales 5,391 5,578
Commission and other selling charges 245,120 222,921
1,514,217 1,431,540
Discontinued operations 32 - 138,289
1,514,217 1,569,829
Other revenues
Equity accounted profits 522 498
522 498
Discontinued operations 32 - 4,342
522 4,840
Other expenses
Gain on divested assets - (2,243)
Impairment of assets retained 2,000 -
Restructuring, redundancy and other fair value adjustments 5,484 582
7,484 (1,661)
Discontinued operations 32 - 20,233
7,484 18,572
Finance costs
Interest expense 10,009 15,710
Other finance costs 1,330 7,479
11,339 23,189
Discontinued operations 32 - (30)
11,339 23,159
Specific expenses: depreciation and amortisation
Depreciation and amortisation 3,072 3,245
3,072 3,245
Discontinued operations - 461
3,072 3,706
Specific expenses: employee benefit expense
Salaries and wages 131,044 128,965
Superannuation and other employee costs 26,052 24,864
Share based payments 423 (53)
157,519 153,776
Discontinued operations - 9,642
157,519 163,418
Operating lease expenditure 57,964 47,880
Foreign exchange net gains/(losses) 65 1,428
Provision for doubtful debts expense 403 2,591
Elders. Live it.Annual Report 2015
64
For
per
sona
l use
onl
y
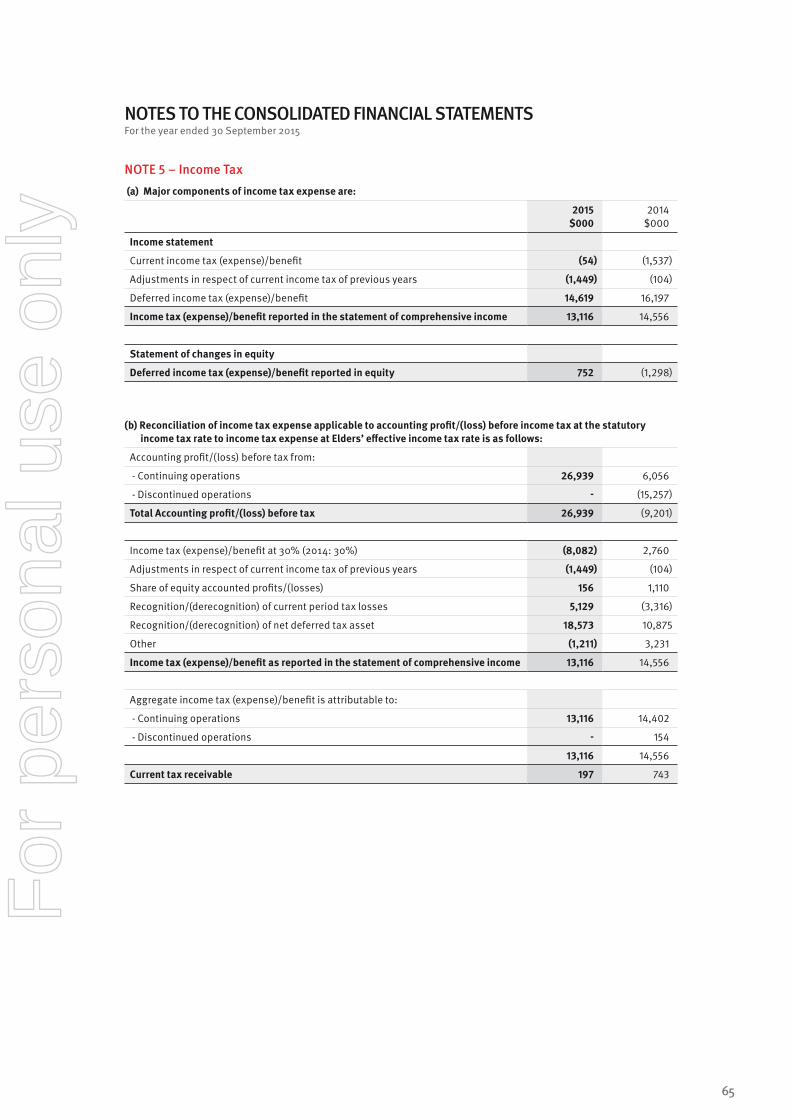
NOTES TO THE CONSOLIDATED FINANCIAL STATEMENTSFor the year ended 30 September 2015
NOTE 5 – Income Tax (a) Major components of income tax expense are:
2015 $000
2014 $000
Income statement
Current income tax (expense)/benefit (54) (1,537)
Adjustments in respect of current income tax of previous years (1,449) (104)
Deferred income tax (expense)/benefit 14,619 16,197
Income tax (expense)/benefit reported in the statement of comprehensive income 13,116 14,556
Statement of changes in equity
Deferred income tax (expense)/benefit reported in equity 752 (1,298)
(b) Reconciliation of income tax expense applicable to accounting profit/(loss) before income tax at the statutory income tax rate to income tax expense at Elders’ effective income tax rate is as follows:
Accounting profit/(loss) before tax from:
- Continuing operations 26,939 6,056
- Discontinued operations - (15,257)
Total Accounting profit/(loss) before tax 26,939 (9,201)
Income tax (expense)/benefit at 30% (2014: 30%) (8,082) 2,760
Adjustments in respect of current income tax of previous years (1,449) (104)
Share of equity accounted profits/(losses) 156 1,110
Recognition/(derecognition) of current period tax losses 5,129 (3,316)
Recognition/(derecognition) of net deferred tax asset 18,573 10,875
Other (1,211) 3,231
Income tax (expense)/benefit as reported in the statement of comprehensive income 13,116 14,556
Aggregate income tax (expense)/benefit is attributable to:
- Continuing operations 13,116 14,402
- Discontinued operations - 154
13,116 14,556
Current tax receivable 197 743
65
For
per
sona
l use
onl
y
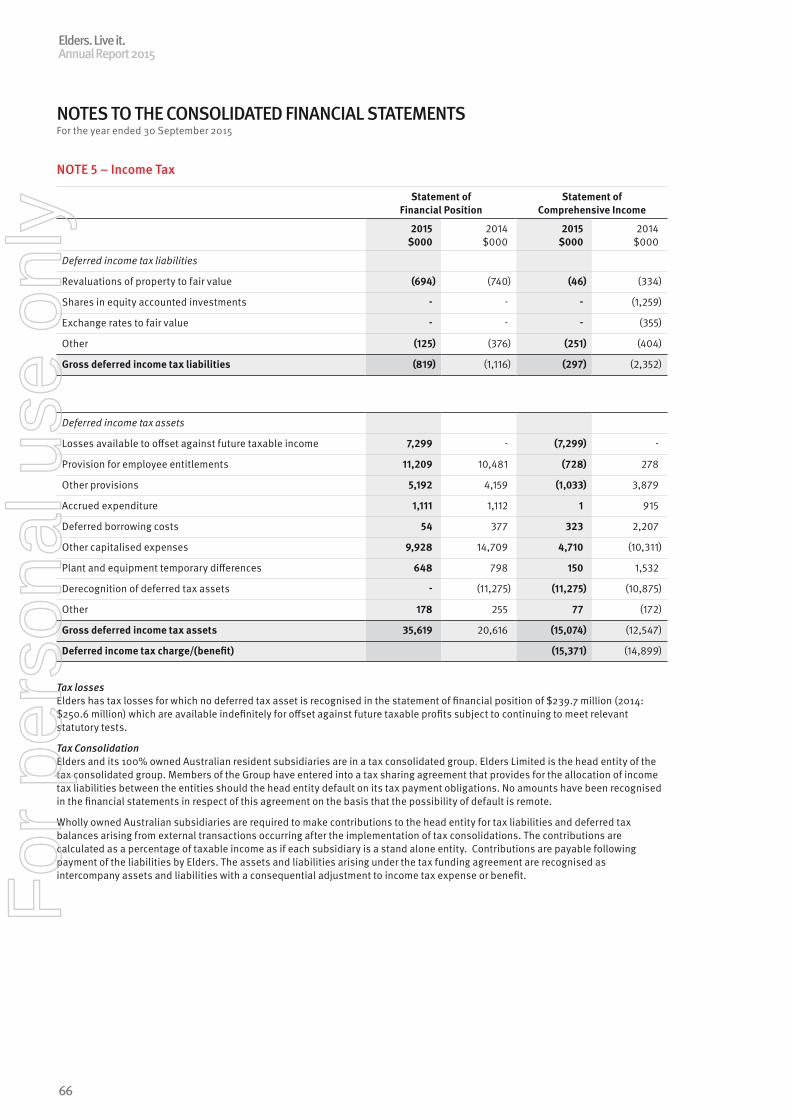
NOTES TO THE CONSOLIDATED FINANCIAL STATEMENTSFor the year ended 30 September 2015
NOTE 5 – Income Tax
Statement of Financial Position
Statement of Comprehensive Income
2015 $000
2014 $000
2015 $000
2014 $000
Deferred income tax liabilities
Revaluations of property to fair value (694) (740) (46) (334)
Shares in equity accounted investments - - - (1,259)
Exchange rates to fair value - - - (355)
Other (125) (376) (251) (404)
Gross deferred income tax liabilities (819) (1,116) (297) (2,352)
Deferred income tax assets
Losses available to offset against future taxable income 7,299 - (7,299) -
Provision for employee entitlements 11,209 10,481 (728) 278
Other provisions 5,192 4,159 (1,033) 3,879
Accrued expenditure 1,111 1,112 1 915
Deferred borrowing costs 54 377 323 2,207
Other capitalised expenses 9,928 14,709 4,710 (10,311)
Plant and equipment temporary differences 648 798 150 1,532
Derecognition of deferred tax assets - (11,275) (11,275) (10,875)
Other 178 255 77 (172)
Gross deferred income tax assets 35,619 20,616 (15,074) (12,547)
Deferred income tax charge/(benefit) (15,371) (14,899)
Tax lossesElders has tax losses for which no deferred tax asset is recognised in the statement of financial position of $239.7 million (2014: $250.6 million) which are available indefinitely for offset against future taxable profits subject to continuing to meet relevant statutory tests.
Tax ConsolidationElders and its 100% owned Australian resident subsidiaries are in a tax consolidated group. Elders Limited is the head entity of the tax consolidated group. Members of the Group have entered into a tax sharing agreement that provides for the allocation of income tax liabilities between the entities should the head entity default on its tax payment obligations. No amounts have been recognised in the financial statements in respect of this agreement on the basis that the possibility of default is remote.
Wholly owned Australian subsidiaries are required to make contributions to the head entity for tax liabilities and deferred tax balances arising from external transactions occurring after the implementation of tax consolidations. The contributions are calculated as a percentage of taxable income as if each subsidiary is a stand alone entity. Contributions are payable following payment of the liabilities by Elders. The assets and liabilities arising under the tax funding agreement are recognised as intercompany assets and liabilities with a consequential adjustment to income tax expense or benefit.
Elders. Live it.Annual Report 2015
66
For
per
sona
l use
onl
y
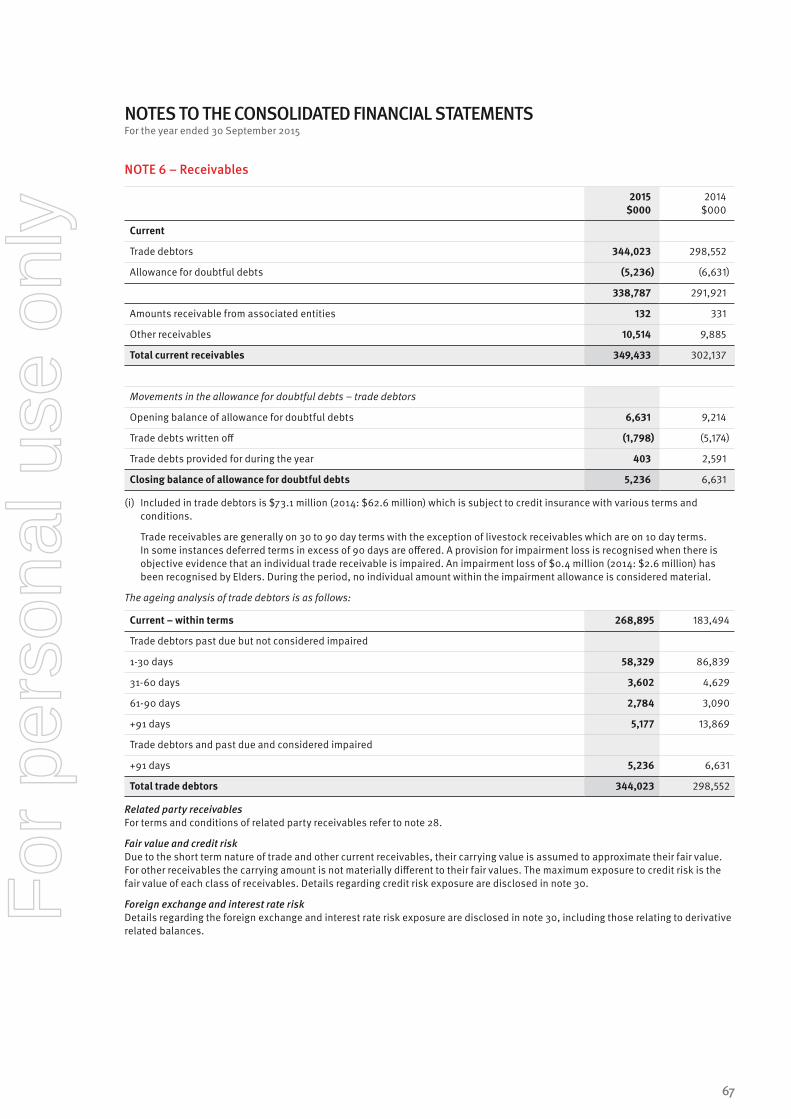
NOTES TO THE CONSOLIDATED FINANCIAL STATEMENTSFor the year ended 30 September 2015
NOTE 6 – Receivables
2015 $000
2014 $000
Current
Trade debtors 344,023 298,552
Allowance for doubtful debts (5,236) (6,631)
338,787 291,921
Amounts receivable from associated entities 132 331
Other receivables 10,514 9,885
Total current receivables 349,433 302,137
Movements in the allowance for doubtful debts – trade debtors
Opening balance of allowance for doubtful debts 6,631 9,214
Trade debts written off (1,798) (5,174)
Trade debts provided for during the year 403 2,591
Closing balance of allowance for doubtful debts 5,236 6,631
(i) Included in trade debtors is $73.1 million (2014: $62.6 million) which is subject to credit insurance with various terms and conditions.
Trade receivables are generally on 30 to 90 day terms with the exception of livestock receivables which are on 10 day terms. In some instances deferred terms in excess of 90 days are offered. A provision for impairment loss is recognised when there is objective evidence that an individual trade receivable is impaired. An impairment loss of $0.4 million (2014: $2.6 million) has been recognised by Elders. During the period, no individual amount within the impairment allowance is considered material.
The ageing analysis of trade debtors is as follows:
Current – within terms 268,895 183,494
Trade debtors past due but not considered impaired
1-30 days 58,329 86,839
31-60 days 3,602 4,629
61-90 days 2,784 3,090
+91 days 5,177 13,869
Trade debtors and past due and considered impaired
+91 days 5,236 6,631
Total trade debtors 344,023 298,552
Related party receivablesFor terms and conditions of related party receivables refer to note 28.
Fair value and credit riskDue to the short term nature of trade and other current receivables, their carrying value is assumed to approximate their fair value. For other receivables the carrying amount is not materially different to their fair values. The maximum exposure to credit risk is the fair value of each class of receivables. Details regarding credit risk exposure are disclosed in note 30.
Foreign exchange and interest rate riskDetails regarding the foreign exchange and interest rate risk exposure are disclosed in note 30, including those relating to derivative related balances.
67
For
per
sona
l use
onl
y
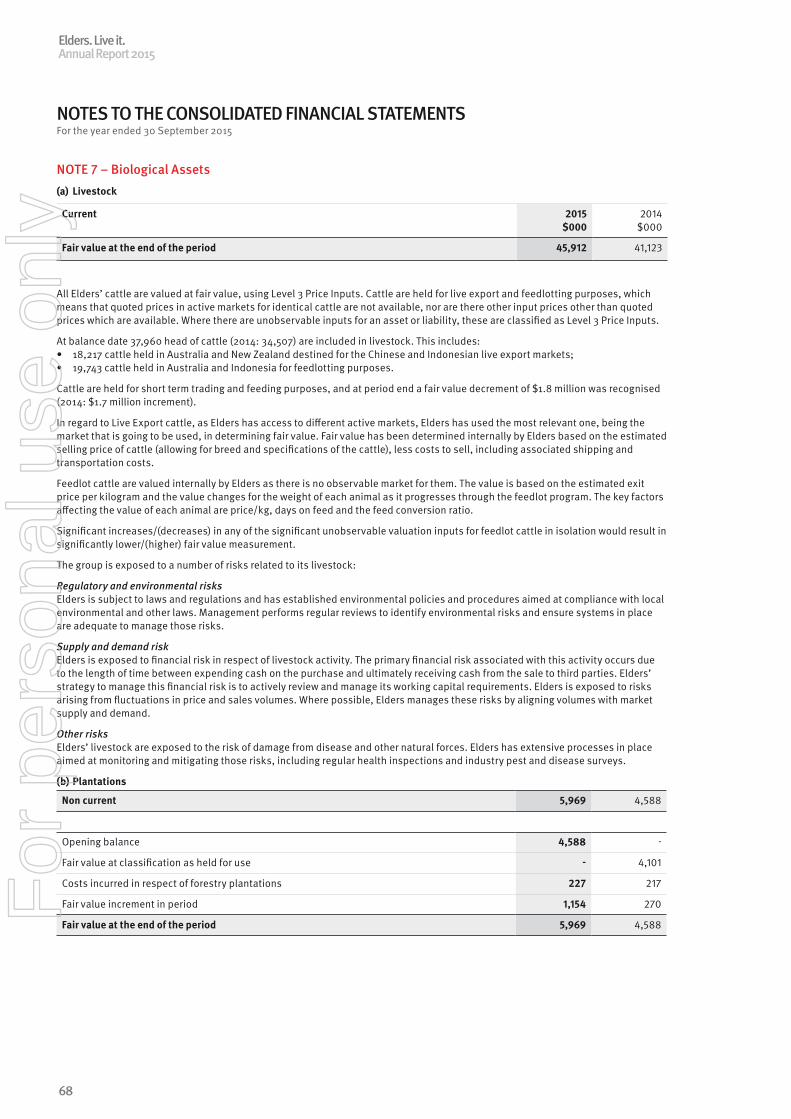
NOTES TO THE CONSOLIDATED FINANCIAL STATEMENTSFor the year ended 30 September 2015
NOTE 7 – Biological Assets(a) Livestock
Current 2015 $000
2014 $000
Fair value at the end of the period 45,912 41,123
All Elders’ cattle are valued at fair value, using Level 3 Price Inputs. Cattle are held for live export and feedlotting purposes, which means that quoted prices in active markets for identical cattle are not available, nor are there other input prices other than quoted prices which are available. Where there are unobservable inputs for an asset or liability, these are classified as Level 3 Price Inputs.
At balance date 37,960 head of cattle (2014: 34,507) are included in livestock. This includes:• 18,217 cattle held in Australia and New Zealand destined for the Chinese and Indonesian live export markets;• 19,743 cattle held in Australia and Indonesia for feedlotting purposes.
Cattle are held for short term trading and feeding purposes, and at period end a fair value decrement of $1.8 million was recognised (2014: $1.7 million increment).
In regard to Live Export cattle, as Elders has access to different active markets, Elders has used the most relevant one, being the market that is going to be used, in determining fair value. Fair value has been determined internally by Elders based on the estimated selling price of cattle (allowing for breed and specifications of the cattle), less costs to sell, including associated shipping and transportation costs.
Feedlot cattle are valued internally by Elders as there is no observable market for them. The value is based on the estimated exit price per kilogram and the value changes for the weight of each animal as it progresses through the feedlot program. The key factors affecting the value of each animal are price/kg, days on feed and the feed conversion ratio.
Significant increases/(decreases) in any of the significant unobservable valuation inputs for feedlot cattle in isolation would result in significantly lower/(higher) fair value measurement.
The group is exposed to a number of risks related to its livestock:
Regulatory and environmental risksElders is subject to laws and regulations and has established environmental policies and procedures aimed at compliance with local environmental and other laws. Management performs regular reviews to identify environmental risks and ensure systems in place are adequate to manage those risks.
Supply and demand riskElders is exposed to financial risk in respect of livestock activity. The primary financial risk associated with this activity occurs due to the length of time between expending cash on the purchase and ultimately receiving cash from the sale to third parties. Elders’ strategy to manage this financial risk is to actively review and manage its working capital requirements. Elders is exposed to risks arising from fluctuations in price and sales volumes. Where possible, Elders manages these risks by aligning volumes with market supply and demand.
Other risksElders’ livestock are exposed to the risk of damage from disease and other natural forces. Elders has extensive processes in place aimed at monitoring and mitigating those risks, including regular health inspections and industry pest and disease surveys.
(b) Plantations
Non current 5,969 4,588
Opening balance 4,588 -
Fair value at classification as held for use - 4,101
Costs incurred in respect of forestry plantations 227 217
Fair value increment in period 1,154 270
Fair value at the end of the period 5,969 4,588
Elders. Live it.Annual Report 2015
68
For
per
sona
l use
onl
y
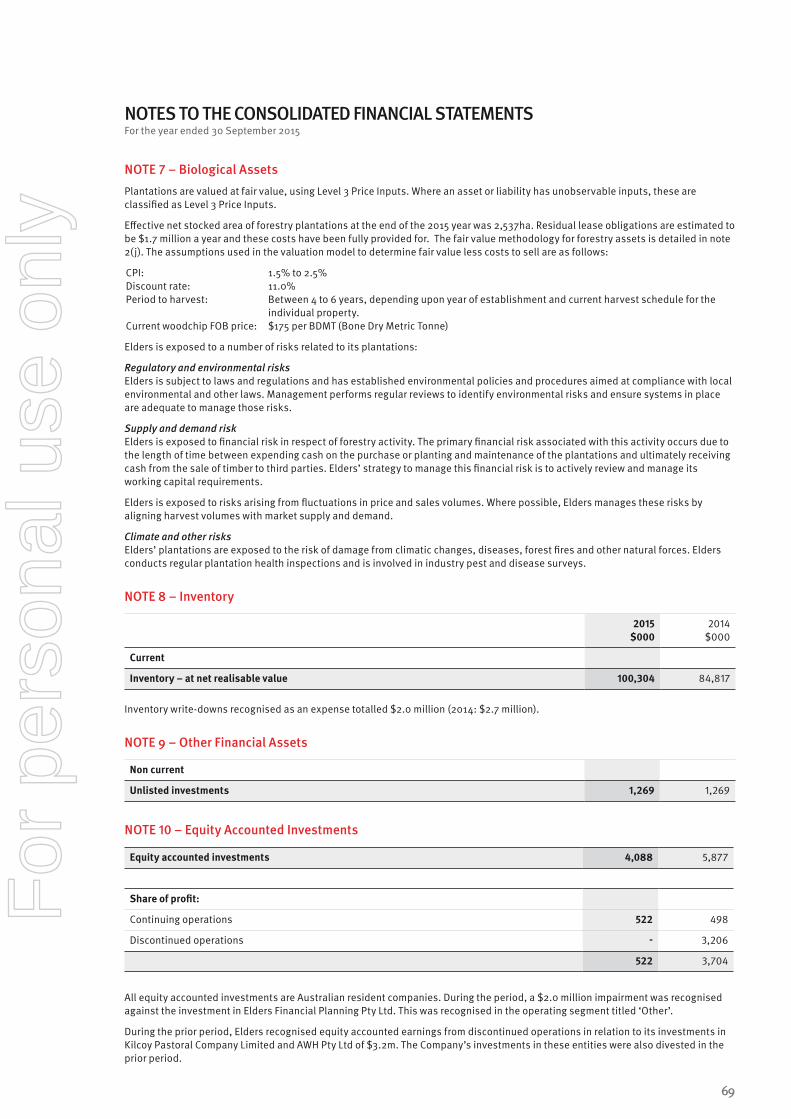
NOTES TO THE CONSOLIDATED FINANCIAL STATEMENTSFor the year ended 30 September 2015
NOTE 7 – Biological AssetsPlantations are valued at fair value, using Level 3 Price Inputs. Where an asset or liability has unobservable inputs, these are classified as Level 3 Price Inputs.
Effective net stocked area of forestry plantations at the end of the 2015 year was 2,537ha. Residual lease obligations are estimated to be $1.7 million a year and these costs have been fully provided for. The fair value methodology for forestry assets is detailed in note 2(j). The assumptions used in the valuation model to determine fair value less costs to sell are as follows:
CPI: 1.5% to 2.5%Discount rate: 11.0%Period to harvest: Between 4 to 6 years, depending upon year of establishment and current harvest schedule for the
individual property. Current woodchip FOB price: $175 per BDMT (Bone Dry Metric Tonne)
Elders is exposed to a number of risks related to its plantations:
Regulatory and environmental risksElders is subject to laws and regulations and has established environmental policies and procedures aimed at compliance with local environmental and other laws. Management performs regular reviews to identify environmental risks and ensure systems in place are adequate to manage those risks.
Supply and demand riskElders is exposed to financial risk in respect of forestry activity. The primary financial risk associated with this activity occurs due to the length of time between expending cash on the purchase or planting and maintenance of the plantations and ultimately receiving cash from the sale of timber to third parties. Elders’ strategy to manage this financial risk is to actively review and manage its working capital requirements.
Elders is exposed to risks arising from fluctuations in price and sales volumes. Where possible, Elders manages these risks by aligning harvest volumes with market supply and demand.
Climate and other risksElders’ plantations are exposed to the risk of damage from climatic changes, diseases, forest fires and other natural forces. Elders conducts regular plantation health inspections and is involved in industry pest and disease surveys.
NOTE 8 – Inventory
2015 $000
2014 $000
Current
Inventory – at net realisable value 100,304 84,817
Inventory write-downs recognised as an expense totalled $2.0 million (2014: $2.7 million). NOTE 9 – Other Financial Assets
Non current
Unlisted investments 1,269 1,269
NOTE 10 – Equity Accounted Investments
Equity accounted investments 4,088 5,877
Share of profit:
Continuing operations 522 498
Discontinued operations - 3,206
522 3,704
All equity accounted investments are Australian resident companies. During the period, a $2.0 million impairment was recognised against the investment in Elders Financial Planning Pty Ltd. This was recognised in the operating segment titled ‘Other’.
During the prior period, Elders recognised equity accounted earnings from discontinued operations in relation to its investments in Kilcoy Pastoral Company Limited and AWH Pty Ltd of $3.2m. The Company’s investments in these entities were also divested in the prior period.
69
For
per
sona
l use
onl
y
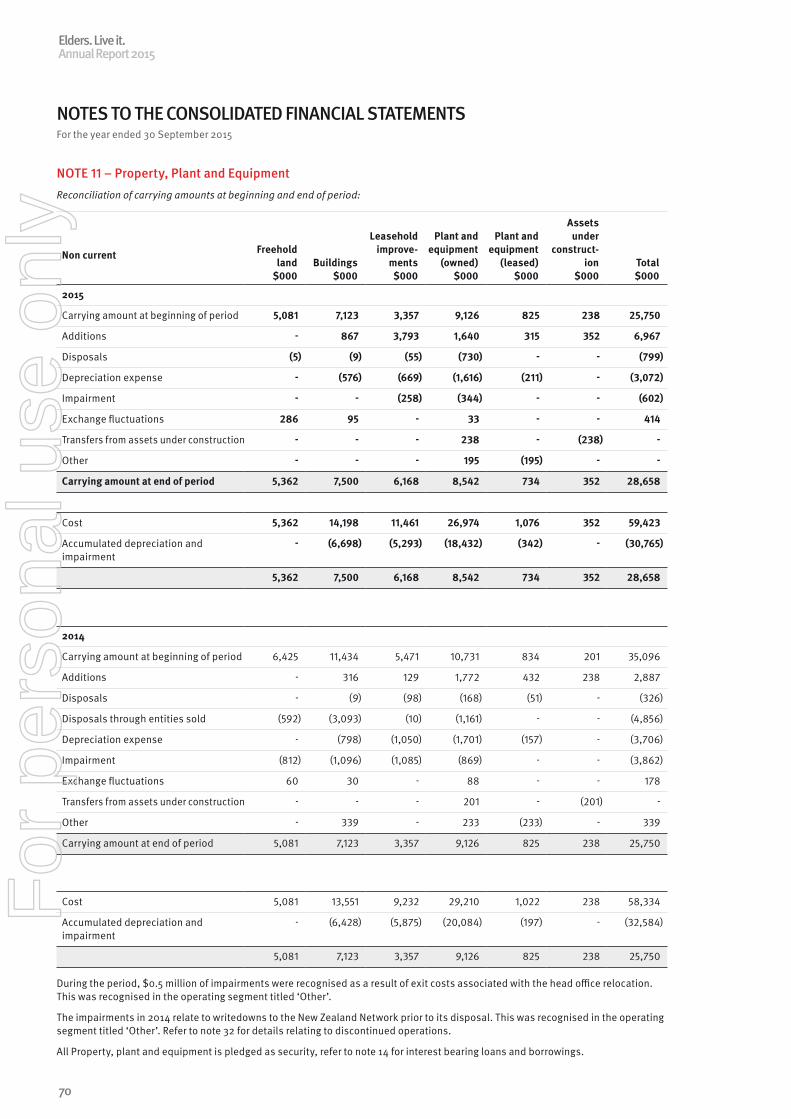
NOTES TO THE CONSOLIDATED FINANCIAL STATEMENTSFor the year ended 30 September 2015
NOTE 11 – Property, Plant and EquipmentReconciliation of carrying amounts at beginning and end of period:
Non current Freehold land
$000Buildings
$000
Leasehold improve-
ments $000
Plant and equipment
(owned) $000
Plant and equipment
(leased) $000
Assets under
construct- ion
$000Total $000
2015
Carrying amount at beginning of period 5,081 7,123 3,357 9,126 825 238 25,750
Additions - 867 3,793 1,640 315 352 6,967
Disposals (5) (9) (55) (730) - - (799)
Depreciation expense - (576) (669) (1,616) (211) - (3,072)
Impairment - - (258) (344) - - (602)
Exchange fluctuations 286 95 - 33 - - 414
Transfers from assets under construction - - - 238 - (238) -
Other - - - 195 (195) - -
Carrying amount at end of period 5,362 7,500 6,168 8,542 734 352 28,658
Cost 5,362 14,198 11,461 26,974 1,076 352 59,423
Accumulated depreciation and impairment
- (6,698) (5,293) (18,432) (342) - (30,765)
5,362 7,500 6,168 8,542 734 352 28,658
2014
Carrying amount at beginning of period 6,425 11,434 5,471 10,731 834 201 35,096
Additions - 316 129 1,772 432 238 2,887
Disposals - (9) (98) (168) (51) - (326)
Disposals through entities sold (592) (3,093) (10) (1,161) - - (4,856)
Depreciation expense - (798) (1,050) (1,701) (157) - (3,706)
Impairment (812) (1,096) (1,085) (869) - - (3,862)
Exchange fluctuations 60 30 - 88 - - 178
Transfers from assets under construction - - - 201 - (201) -
Other - 339 - 233 (233) - 339
Carrying amount at end of period 5,081 7,123 3,357 9,126 825 238 25,750
Cost 5,081 13,551 9,232 29,210 1,022 238 58,334
Accumulated depreciation and impairment
- (6,428) (5,875) (20,084) (197) - (32,584)
5,081 7,123 3,357 9,126 825 238 25,750
During the period, $0.5 million of impairments were recognised as a result of exit costs associated with the head office relocation. This was recognised in the operating segment titled ‘Other’.
The impairments in 2014 relate to writedowns to the New Zealand Network prior to its disposal. This was recognised in the operating segment titled ‘Other’. Refer to note 32 for details relating to discontinued operations.
All Property, plant and equipment is pledged as security, refer to note 14 for interest bearing loans and borrowings.
Elders. Live it.Annual Report 2015
70
For
per
sona
l use
onl
y
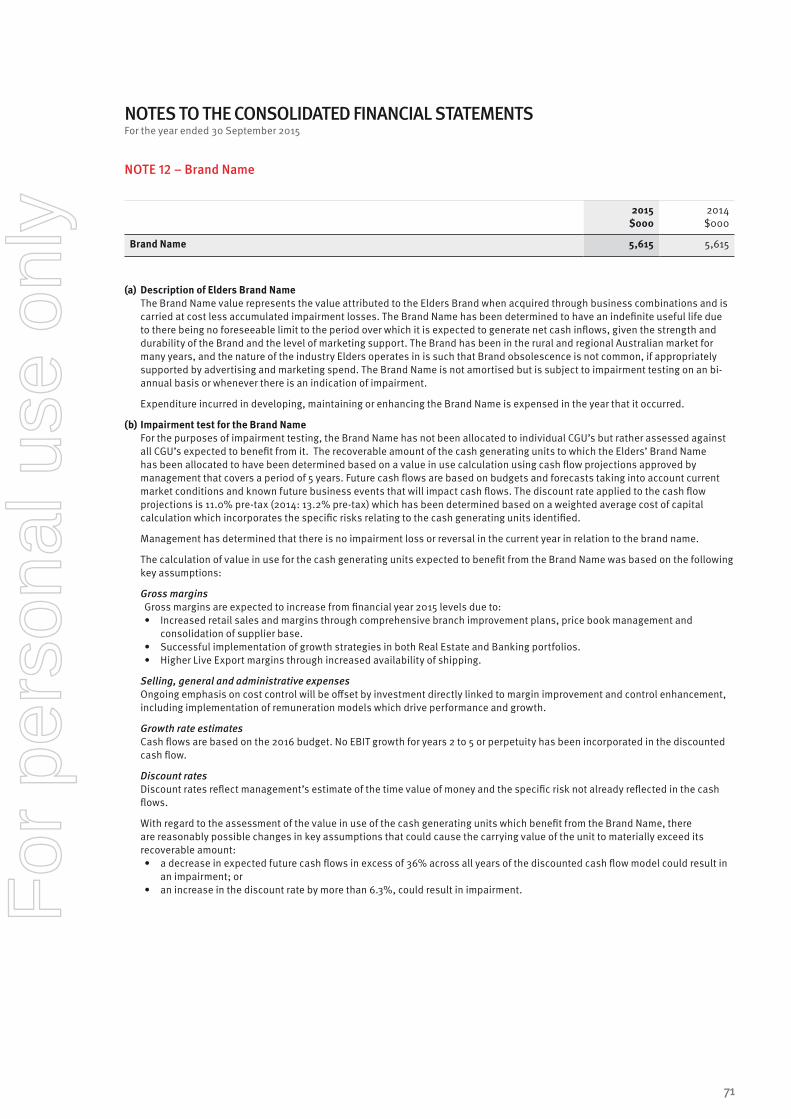
NOTES TO THE CONSOLIDATED FINANCIAL STATEMENTSFor the year ended 30 September 2015
NOTE 12 – Brand Name
2015 $000
2014 $000
Brand Name 5,615 5,615
(a) Description of Elders Brand Name The Brand Name value represents the value attributed to the Elders Brand when acquired through business combinations and is
carried at cost less accumulated impairment losses. The Brand Name has been determined to have an indefinite useful life due to there being no foreseeable limit to the period over which it is expected to generate net cash inflows, given the strength and durability of the Brand and the level of marketing support. The Brand has been in the rural and regional Australian market for many years, and the nature of the industry Elders operates in is such that Brand obsolescence is not common, if appropriately supported by advertising and marketing spend. The Brand Name is not amortised but is subject to impairment testing on an bi-annual basis or whenever there is an indication of impairment.
Expenditure incurred in developing, maintaining or enhancing the Brand Name is expensed in the year that it occurred.
(b) Impairment test for the Brand Name For the purposes of impairment testing, the Brand Name has not been allocated to individual CGU’s but rather assessed against
all CGU’s expected to benefit from it. The recoverable amount of the cash generating units to which the Elders’ Brand Name has been allocated to have been determined based on a value in use calculation using cash flow projections approved by management that covers a period of 5 years. Future cash flows are based on budgets and forecasts taking into account current market conditions and known future business events that will impact cash flows. The discount rate applied to the cash flow projections is 11.0% pre-tax (2014: 13.2% pre-tax) which has been determined based on a weighted average cost of capital calculation which incorporates the specific risks relating to the cash generating units identified.
Management has determined that there is no impairment loss or reversal in the current year in relation to the brand name.
The calculation of value in use for the cash generating units expected to benefit from the Brand Name was based on the following key assumptions:
Gross marginsGross margins are expected to increase from financial year 2015 levels due to:• Increased retail sales and margins through comprehensive branch improvement plans, price book management and
consolidation of supplier base.• Successful implementation of growth strategies in both Real Estate and Banking portfolios.• Higher Live Export margins through increased availability of shipping.
Selling, general and administrative expenses Ongoing emphasis on cost control will be offset by investment directly linked to margin improvement and control enhancement,
including implementation of remuneration models which drive performance and growth.
Growth rate estimates Cash flows are based on the 2016 budget. No EBIT growth for years 2 to 5 or perpetuity has been incorporated in the discounted
cash flow.
Discount rates Discount rates reflect management’s estimate of the time value of money and the specific risk not already reflected in the cash
flows.
With regard to the assessment of the value in use of the cash generating units which benefit from the Brand Name, there are reasonably possible changes in key assumptions that could cause the carrying value of the unit to materially exceed its recoverable amount:• a decrease in expected future cash flows in excess of 36% across all years of the discounted cash flow model could result in
an impairment; or• an increase in the discount rate by more than 6.3%, could result in impairment.
71
For
per
sona
l use
onl
y
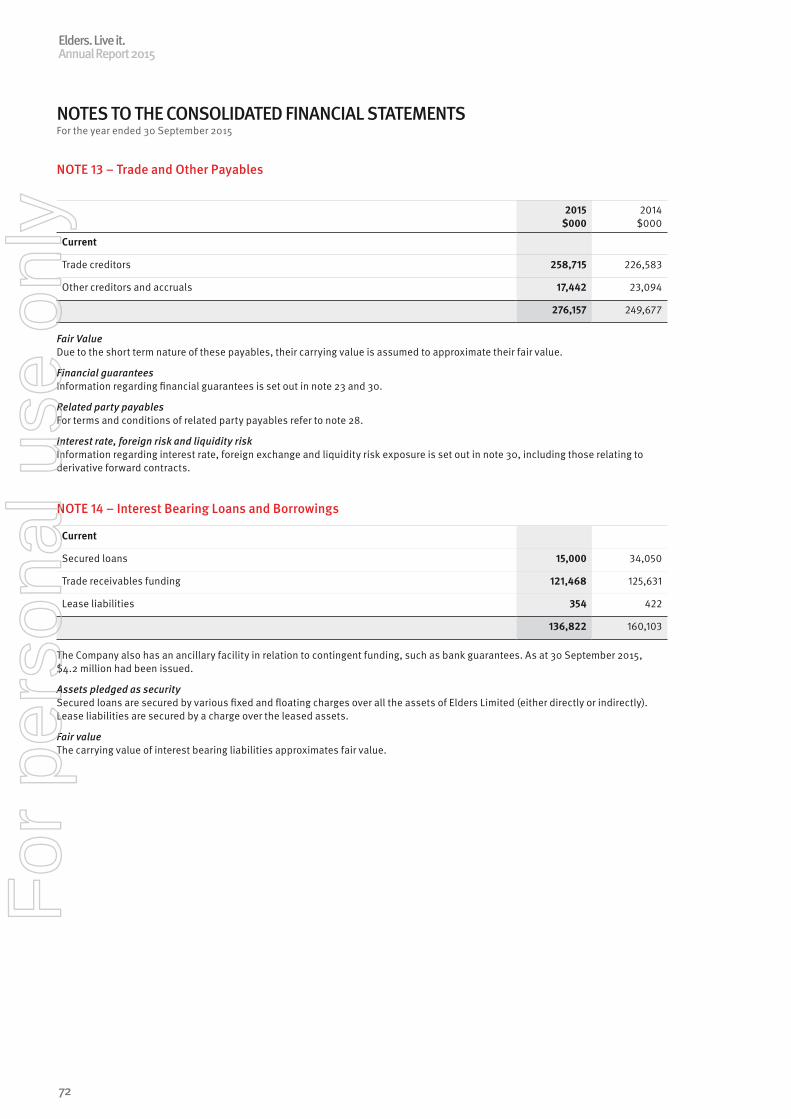
NOTES TO THE CONSOLIDATED FINANCIAL STATEMENTSFor the year ended 30 September 2015
NOTE 13 – Trade and Other Payables
2015 $000
2014 $000
Current
Trade creditors 258,715 226,583
Other creditors and accruals 17,442 23,094
276,157 249,677
Fair ValueDue to the short term nature of these payables, their carrying value is assumed to approximate their fair value.
Financial guaranteesInformation regarding financial guarantees is set out in note 23 and 30.
Related party payablesFor terms and conditions of related party payables refer to note 28.
Interest rate, foreign risk and liquidity riskInformation regarding interest rate, foreign exchange and liquidity risk exposure is set out in note 30, including those relating to derivative forward contracts.
NOTE 14 – Interest Bearing Loans and Borrowings
Current
Secured loans 15,000 34,050
Trade receivables funding 121,468 125,631
Lease liabilities 354 422
136,822 160,103
The Company also has an ancillary facility in relation to contingent funding, such as bank guarantees. As at 30 September 2015, $4.2 million had been issued.
Assets pledged as security Secured loans are secured by various fixed and floating charges over all the assets of Elders Limited (either directly or indirectly). Lease liabilities are secured by a charge over the leased assets.
Fair valueThe carrying value of interest bearing liabilities approximates fair value.
Elders. Live it.Annual Report 2015
72
For
per
sona
l use
onl
y
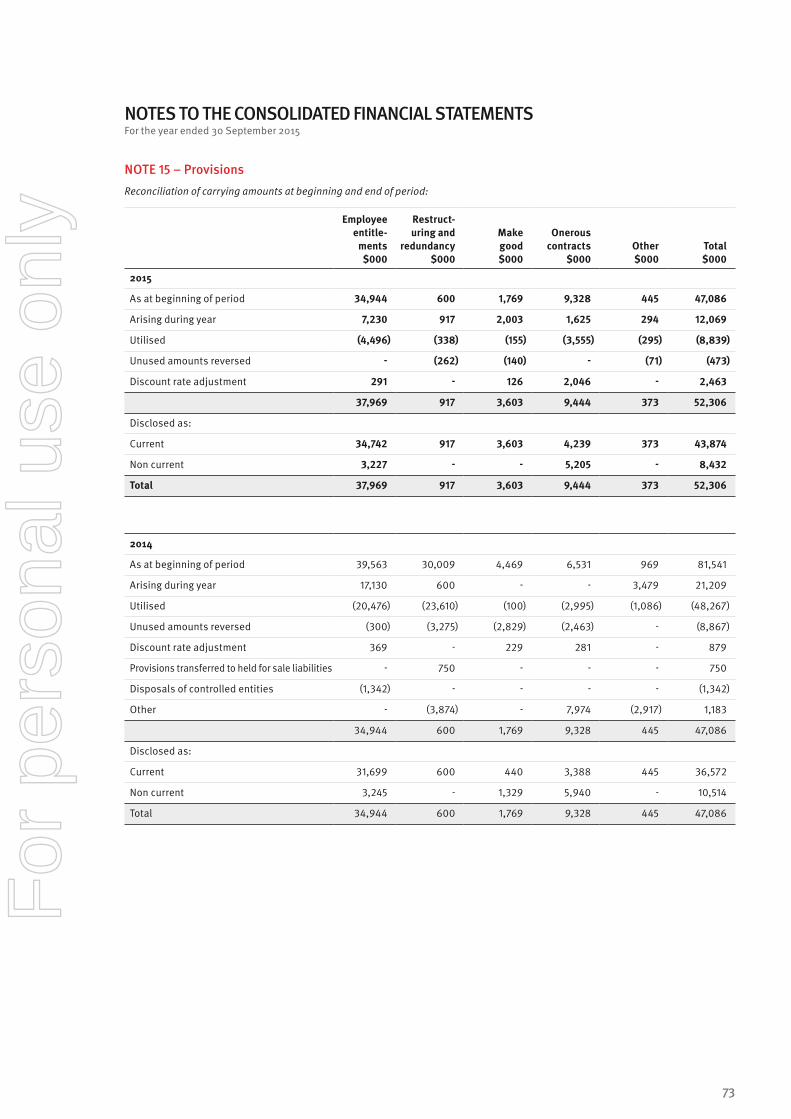
NOTES TO THE CONSOLIDATED FINANCIAL STATEMENTSFor the year ended 30 September 2015
NOTE 15 – Provisions Reconciliation of carrying amounts at beginning and end of period:
Employee entitle-
ments $000
Restruct-uring and
redundancy $000
Make good $000
Onerous contracts
$000Other $000
Total $000
2015
As at beginning of period 34,944 600 1,769 9,328 445 47,086
Arising during year 7,230 917 2,003 1,625 294 12,069
Utilised (4,496) (338) (155) (3,555) (295) (8,839)
Unused amounts reversed - (262) (140) - (71) (473)
Discount rate adjustment 291 - 126 2,046 - 2,463
37,969 917 3,603 9,444 373 52,306
Disclosed as:
Current 34,742 917 3,603 4,239 373 43,874
Non current 3,227 - - 5,205 - 8,432
Total 37,969 917 3,603 9,444 373 52,306
2014
As at beginning of period 39,563 30,009 4,469 6,531 969 81,541
Arising during year 17,130 600 - - 3,479 21,209
Utilised (20,476) (23,610) (100) (2,995) (1,086) (48,267)
Unused amounts reversed (300) (3,275) (2,829) (2,463) - (8,867)
Discount rate adjustment 369 - 229 281 - 879
Provisions transferred to held for sale liabilities - 750 - - - 750
Disposals of controlled entities (1,342) - - - - (1,342)
Other - (3,874) - 7,974 (2,917) 1,183
34,944 600 1,769 9,328 445 47,086
Disclosed as:
Current 31,699 600 440 3,388 445 36,572
Non current 3,245 - 1,329 5,940 - 10,514
Total 34,944 600 1,769 9,328 445 47,086
73
For
per
sona
l use
onl
y
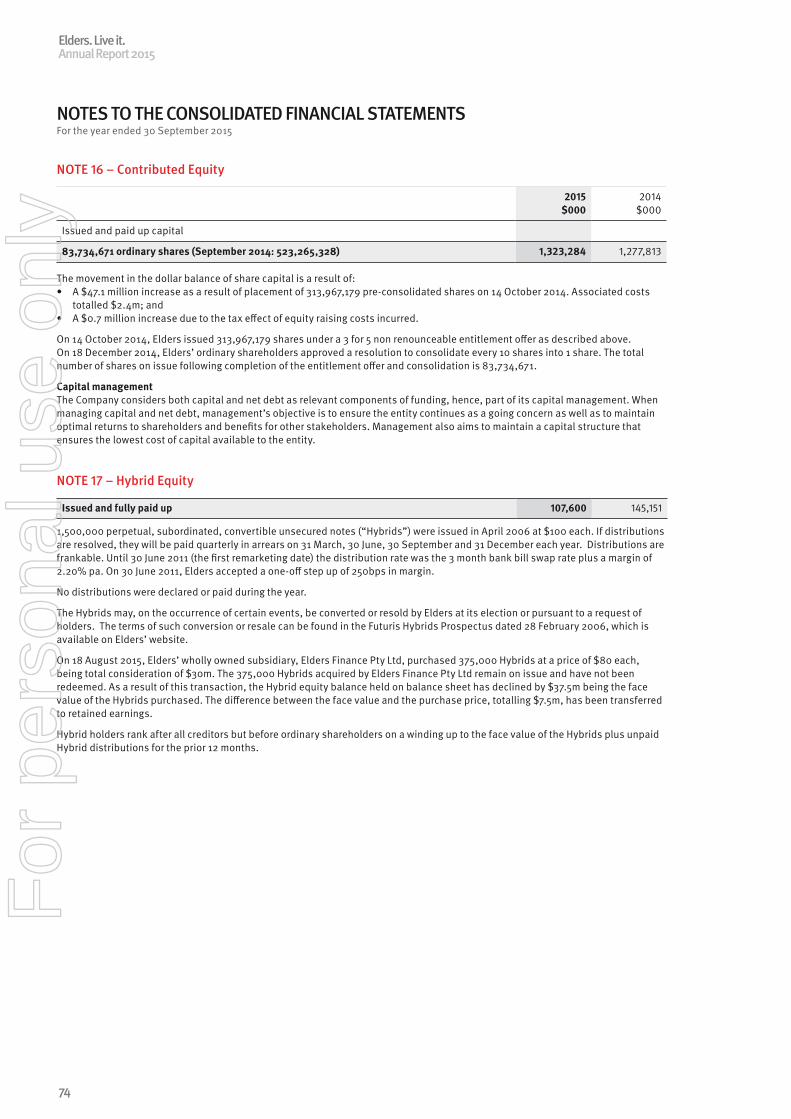
NOTES TO THE CONSOLIDATED FINANCIAL STATEMENTSFor the year ended 30 September 2015
NOTE 16 – Contributed Equity
2015 $000
2014 $000
Issued and paid up capital
83,734,671 ordinary shares (September 2014: 523,265,328) 1,323,284 1,277,813
The movement in the dollar balance of share capital is a result of:• A $47.1 million increase as a result of placement of 313,967,179 pre-consolidated shares on 14 October 2014. Associated costs
totalled $2.4m; and• A $0.7 million increase due to the tax effect of equity raising costs incurred.
On 14 October 2014, Elders issued 313,967,179 shares under a 3 for 5 non renounceable entitlement offer as described above. On 18 December 2014, Elders’ ordinary shareholders approved a resolution to consolidate every 10 shares into 1 share. The total number of shares on issue following completion of the entitlement offer and consolidation is 83,734,671.
Capital managementThe Company considers both capital and net debt as relevant components of funding, hence, part of its capital management. When managing capital and net debt, management’s objective is to ensure the entity continues as a going concern as well as to maintain optimal returns to shareholders and benefits for other stakeholders. Management also aims to maintain a capital structure that ensures the lowest cost of capital available to the entity.
NOTE 17 – Hybrid Equity
Issued and fully paid up 107,600 145,151
1,500,000 perpetual, subordinated, convertible unsecured notes (“Hybrids”) were issued in April 2006 at $100 each. If distributions are resolved, they will be paid quarterly in arrears on 31 March, 30 June, 30 September and 31 December each year. Distributions are frankable. Until 30 June 2011 (the first remarketing date) the distribution rate was the 3 month bank bill swap rate plus a margin of 2.20% pa. On 30 June 2011, Elders accepted a one-off step up of 250bps in margin.
No distributions were declared or paid during the year.
The Hybrids may, on the occurrence of certain events, be converted or resold by Elders at its election or pursuant to a request of holders. The terms of such conversion or resale can be found in the Futuris Hybrids Prospectus dated 28 February 2006, which is available on Elders’ website.
On 18 August 2015, Elders’ wholly owned subsidiary, Elders Finance Pty Ltd, purchased 375,000 Hybrids at a price of $80 each, being total consideration of $30m. The 375,000 Hybrids acquired by Elders Finance Pty Ltd remain on issue and have not been redeemed. As a result of this transaction, the Hybrid equity balance held on balance sheet has declined by $37.5m being the face value of the Hybrids purchased. The difference between the face value and the purchase price, totalling $7.5m, has been transferred to retained earnings.
Hybrid holders rank after all creditors but before ordinary shareholders on a winding up to the face value of the Hybrids plus unpaid Hybrid distributions for the prior 12 months.
Elders. Live it.Annual Report 2015
74
For
per
sona
l use
onl
y
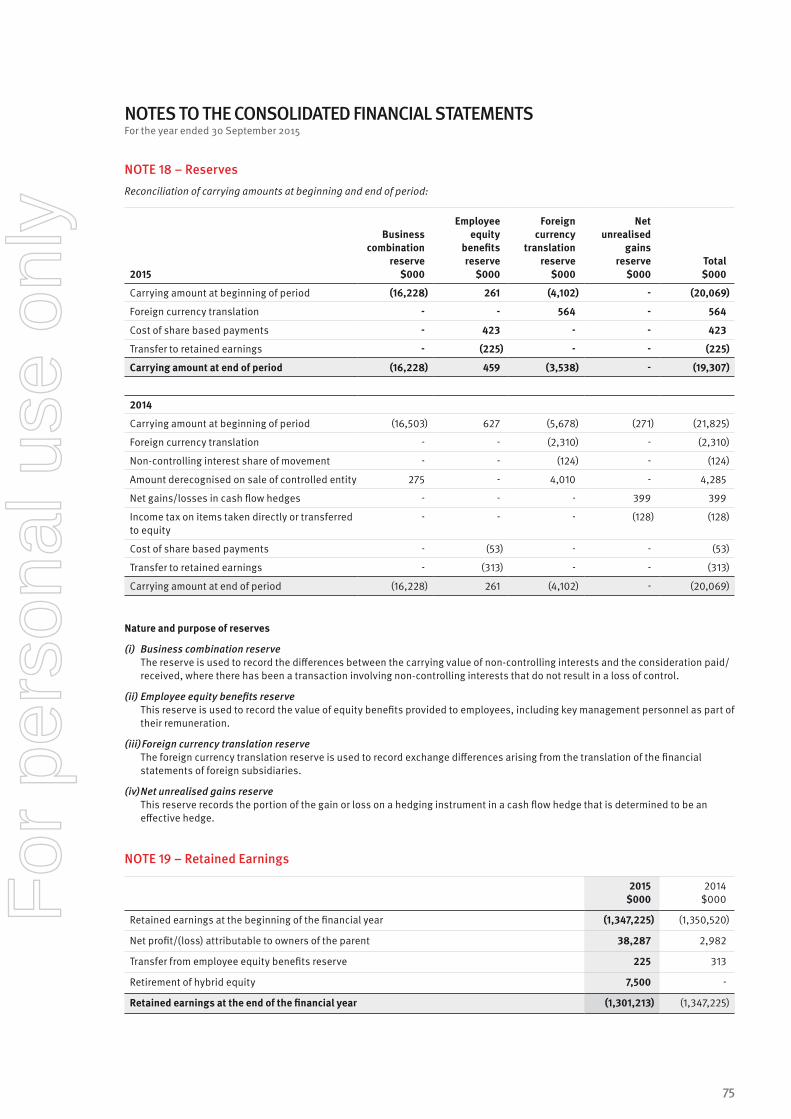
NOTES TO THE CONSOLIDATED FINANCIAL STATEMENTSFor the year ended 30 September 2015
NOTE 18 – Reserves Reconciliation of carrying amounts at beginning and end of period:
2015
Business combination
reserve $000
Employee equity
benefits reserve
$000
Foreign currency
translation reserve
$000
Net unrealised
gains reserve
$000Total $000
Carrying amount at beginning of period (16,228) 261 (4,102) - (20,069)
Foreign currency translation - - 564 - 564
Cost of share based payments - 423 - - 423
Transfer to retained earnings - (225) - - (225)
Carrying amount at end of period (16,228) 459 (3,538) - (19,307)
2014
Carrying amount at beginning of period (16,503) 627 (5,678) (271) (21,825)
Foreign currency translation - - (2,310) - (2,310)
Non-controlling interest share of movement - - (124) - (124)
Amount derecognised on sale of controlled entity 275 - 4,010 - 4,285
Net gains/losses in cash flow hedges - - - 399 399
Income tax on items taken directly or transferred to equity
- - - (128) (128)
Cost of share based payments - (53) - - (53)
Transfer to retained earnings - (313) - - (313)
Carrying amount at end of period (16,228) 261 (4,102) - (20,069)
Nature and purpose of reserves
(i) Business combination reserve The reserve is used to record the differences between the carrying value of non-controlling interests and the consideration paid/
received, where there has been a transaction involving non-controlling interests that do not result in a loss of control.
(ii) Employee equity benefits reserve This reserve is used to record the value of equity benefits provided to employees, including key management personnel as part of
their remuneration.
(iii) Foreign currency translation reserve The foreign currency translation reserve is used to record exchange differences arising from the translation of the financial
statements of foreign subsidiaries.
(iv) Net unrealised gains reserve This reserve records the portion of the gain or loss on a hedging instrument in a cash flow hedge that is determined to be an
effective hedge.
NOTE 19 – Retained Earnings
2015 $000
2014 $000
Retained earnings at the beginning of the financial year (1,347,225) (1,350,520)
Net profit/(loss) attributable to owners of the parent 38,287 2,982
Transfer from employee equity benefits reserve 225 313
Retirement of hybrid equity 7,500 -
Retained earnings at the end of the financial year (1,301,213) (1,347,225)
75
For
per
sona
l use
onl
y
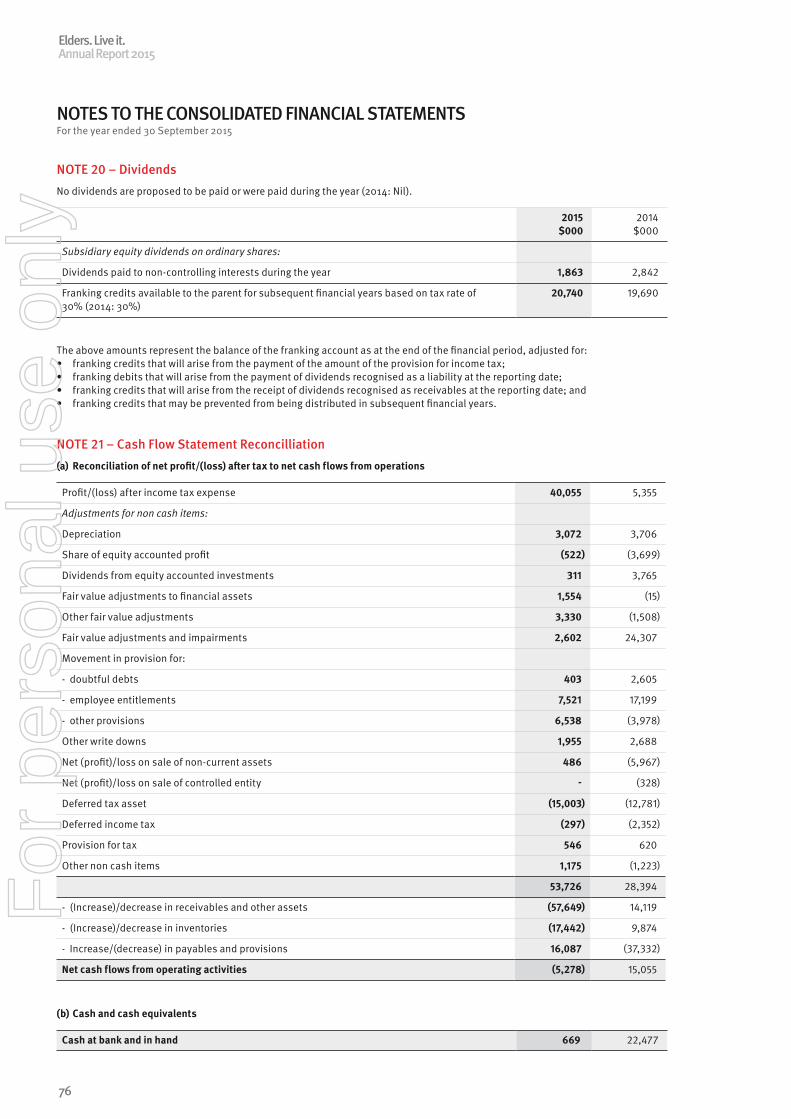
NOTES TO THE CONSOLIDATED FINANCIAL STATEMENTSFor the year ended 30 September 2015
NOTE 20 – DividendsNo dividends are proposed to be paid or were paid during the year (2014: Nil).
2015 $000
2014 $000
Subsidiary equity dividends on ordinary shares:
Dividends paid to non-controlling interests during the year 1,863 2,842
Franking credits available to the parent for subsequent financial years based on tax rate of 30% (2014: 30%)
20,740 19,690
The above amounts represent the balance of the franking account as at the end of the financial period, adjusted for:• franking credits that will arise from the payment of the amount of the provision for income tax;• franking debits that will arise from the payment of dividends recognised as a liability at the reporting date;• franking credits that will arise from the receipt of dividends recognised as receivables at the reporting date; and• franking credits that may be prevented from being distributed in subsequent financial years.
NOTE 21 – Cash Flow Statement Reconcilliation (a) Reconciliation of net profit/(loss) after tax to net cash flows from operations
Profit/(loss) after income tax expense 40,055 5,355
Adjustments for non cash items:
Depreciation 3,072 3,706
Share of equity accounted profit (522) (3,699)
Dividends from equity accounted investments 311 3,765
Fair value adjustments to financial assets 1,554 (15)
Other fair value adjustments 3,330 (1,508)
Fair value adjustments and impairments 2,602 24,307
Movement in provision for:
- doubtful debts 403 2,605
- employee entitlements 7,521 17,199
- other provisions 6,538 (3,978)
Other write downs 1,955 2,688
Net (profit)/loss on sale of non-current assets 486 (5,967)
Net (profit)/loss on sale of controlled entity - (328)
Deferred tax asset (15,003) (12,781)
Deferred income tax (297) (2,352)
Provision for tax 546 620
Other non cash items 1,175 (1,223)
53,726 28,394
- (Increase)/decrease in receivables and other assets (57,649) 14,119
- (Increase)/decrease in inventories (17,442) 9,874
- Increase/(decrease) in payables and provisions 16,087 (37,332)
Net cash flows from operating activities (5,278) 15,055
(b) Cash and cash equivalents
Cash at bank and in hand 669 22,477
Elders. Live it.Annual Report 2015
76
For
per
sona
l use
onl
y
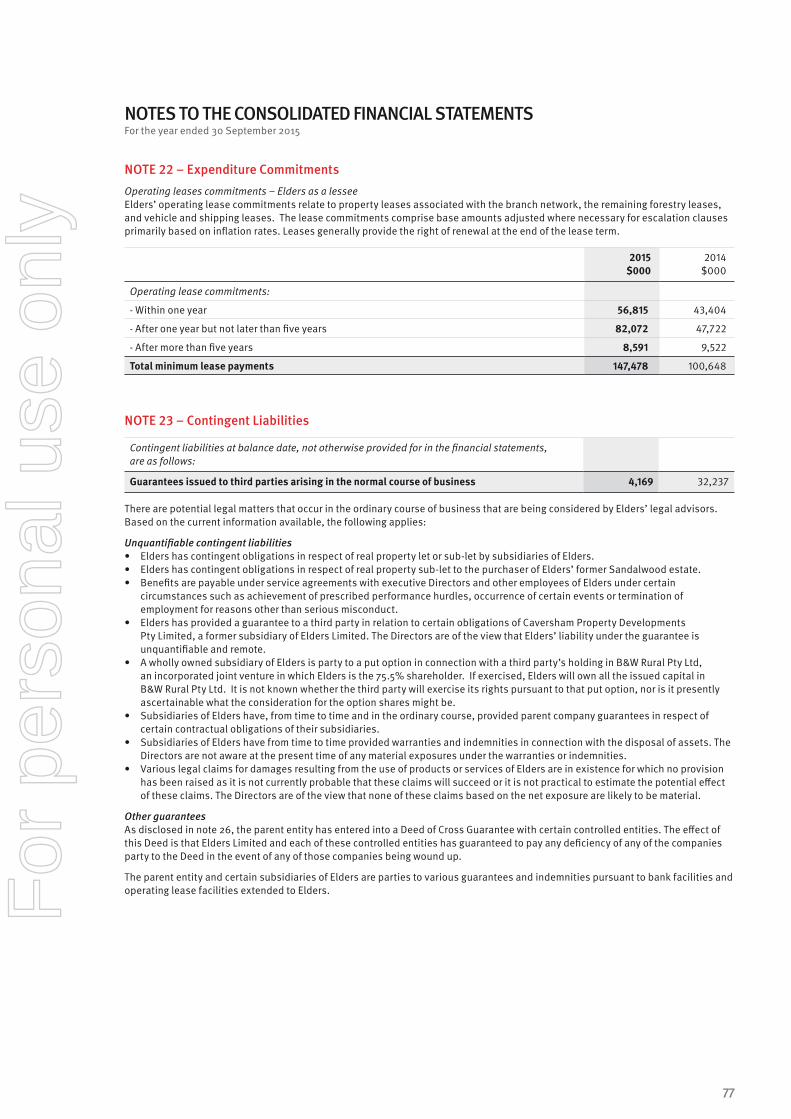
NOTES TO THE CONSOLIDATED FINANCIAL STATEMENTSFor the year ended 30 September 2015
NOTE 22 – Expenditure CommitmentsOperating leases commitments – Elders as a lesseeElders’ operating lease commitments relate to property leases associated with the branch network, the remaining forestry leases, and vehicle and shipping leases. The lease commitments comprise base amounts adjusted where necessary for escalation clauses primarily based on inflation rates. Leases generally provide the right of renewal at the end of the lease term.
2015 $000
2014 $000
Operating lease commitments:
- Within one year 56,815 43,404
- After one year but not later than five years 82,072 47,722
- After more than five years 8,591 9,522
Total minimum lease payments 147,478 100,648
NOTE 23 – Contingent Liabilities
Contingent liabilities at balance date, not otherwise provided for in the financial statements, are as follows:
Guarantees issued to third parties arising in the normal course of business 4,169 32,237
There are potential legal matters that occur in the ordinary course of business that are being considered by Elders’ legal advisors. Based on the current information available, the following applies:
Unquantifiable contingent liabilities• Elders has contingent obligations in respect of real property let or sub-let by subsidiaries of Elders.• Elders has contingent obligations in respect of real property sub-let to the purchaser of Elders’ former Sandalwood estate.• Benefits are payable under service agreements with executive Directors and other employees of Elders under certain
circumstances such as achievement of prescribed performance hurdles, occurrence of certain events or termination of employment for reasons other than serious misconduct.
• Elders has provided a guarantee to a third party in relation to certain obligations of Caversham Property Developments Pty Limited, a former subsidiary of Elders Limited. The Directors are of the view that Elders’ liability under the guarantee is unquantifiable and remote.
• A wholly owned subsidiary of Elders is party to a put option in connection with a third party’s holding in B&W Rural Pty Ltd, an incorporated joint venture in which Elders is the 75.5% shareholder. If exercised, Elders will own all the issued capital in B&W Rural Pty Ltd. It is not known whether the third party will exercise its rights pursuant to that put option, nor is it presently ascertainable what the consideration for the option shares might be.
• Subsidiaries of Elders have, from time to time and in the ordinary course, provided parent company guarantees in respect of certain contractual obligations of their subsidiaries.
• Subsidiaries of Elders have from time to time provided warranties and indemnities in connection with the disposal of assets. The Directors are not aware at the present time of any material exposures under the warranties or indemnities.
• Various legal claims for damages resulting from the use of products or services of Elders are in existence for which no provision has been raised as it is not currently probable that these claims will succeed or it is not practical to estimate the potential effect of these claims. The Directors are of the view that none of these claims based on the net exposure are likely to be material.
Other guaranteesAs disclosed in note 26, the parent entity has entered into a Deed of Cross Guarantee with certain controlled entities. The effect of this Deed is that Elders Limited and each of these controlled entities has guaranteed to pay any deficiency of any of the companies party to the Deed in the event of any of those companies being wound up.
The parent entity and certain subsidiaries of Elders are parties to various guarantees and indemnities pursuant to bank facilities and operating lease facilities extended to Elders.
77
For
per
sona
l use
onl
y
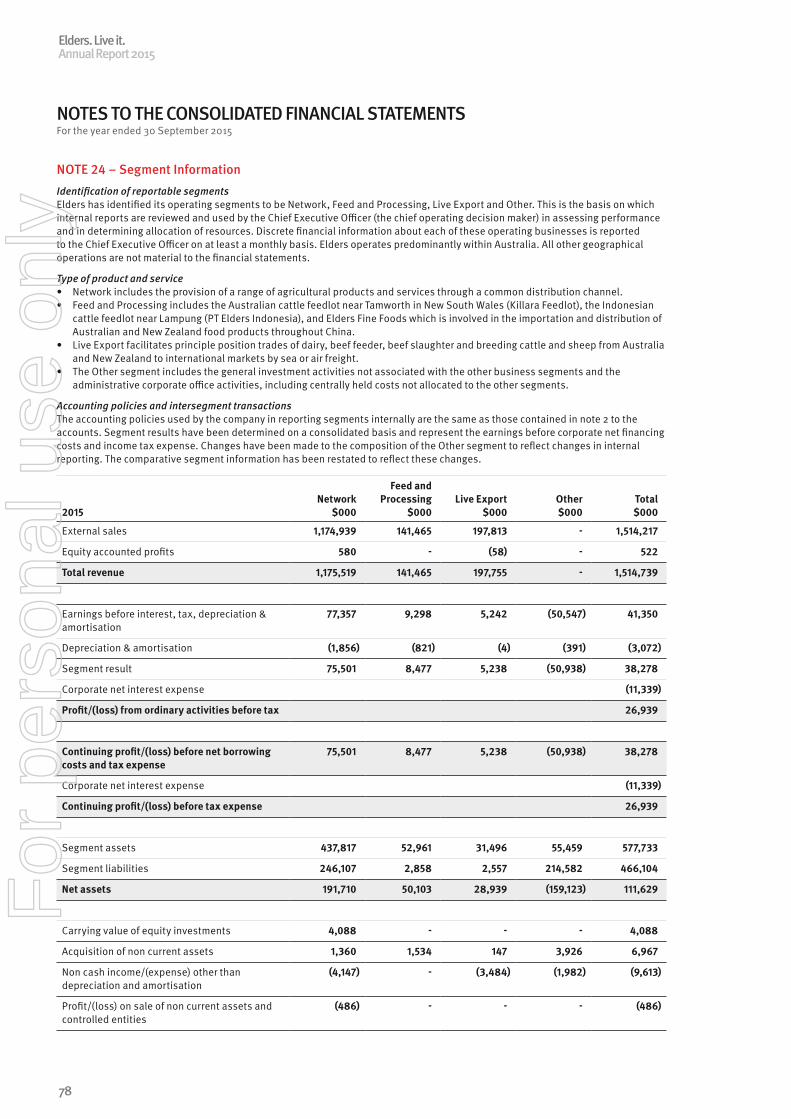
NOTES TO THE CONSOLIDATED FINANCIAL STATEMENTSFor the year ended 30 September 2015
NOTE 24 – Segment Information Identification of reportable segmentsElders has identified its operating segments to be Network, Feed and Processing, Live Export and Other. This is the basis on which internal reports are reviewed and used by the Chief Executive Officer (the chief operating decision maker) in assessing performance and in determining allocation of resources. Discrete financial information about each of these operating businesses is reported to the Chief Executive Officer on at least a monthly basis. Elders operates predominantly within Australia. All other geographical operations are not material to the financial statements.
Type of product and service• Network includes the provision of a range of agricultural products and services through a common distribution channel. • Feed and Processing includes the Australian cattle feedlot near Tamworth in New South Wales (Killara Feedlot), the Indonesian
cattle feedlot near Lampung (PT Elders Indonesia), and Elders Fine Foods which is involved in the importation and distribution of Australian and New Zealand food products throughout China.
• Live Export facilitates principle position trades of dairy, beef feeder, beef slaughter and breeding cattle and sheep from Australia and New Zealand to international markets by sea or air freight.
• The Other segment includes the general investment activities not associated with the other business segments and the administrative corporate office activities, including centrally held costs not allocated to the other segments.
Accounting policies and intersegment transactionsThe accounting policies used by the company in reporting segments internally are the same as those contained in note 2 to the accounts. Segment results have been determined on a consolidated basis and represent the earnings before corporate net financing costs and income tax expense. Changes have been made to the composition of the Other segment to reflect changes in internal reporting. The comparative segment information has been restated to reflect these changes.
2015Network
$000
Feed and Processing
$000Live Export
$000Other $000
Total $000
External sales 1,174,939 141,465 197,813 - 1,514,217
Equity accounted profits 580 - (58) - 522
Total revenue 1,175,519 141,465 197,755 - 1,514,739
Earnings before interest, tax, depreciation & amortisation
77,357 9,298 5,242 (50,547) 41,350
Depreciation & amortisation (1,856) (821) (4) (391) (3,072)
Segment result 75,501 8,477 5,238 (50,938) 38,278
Corporate net interest expense (11,339)
Profit/(loss) from ordinary activities before tax 26,939
Continuing profit/(loss) before net borrowing costs and tax expense
75,501 8,477 5,238 (50,938) 38,278
Corporate net interest expense (11,339)
Continuing profit/(loss) before tax expense 26,939
Segment assets 437,817 52,961 31,496 55,459 577,733
Segment liabilities 246,107 2,858 2,557 214,582 466,104
Net assets 191,710 50,103 28,939 (159,123) 111,629
Carrying value of equity investments 4,088 - - - 4,088
Acquisition of non current assets 1,360 1,534 147 3,926 6,967
Non cash income/(expense) other than depreciation and amortisation
(4,147) - (3,484) (1,982) (9,613)
Profit/(loss) on sale of non current assets and controlled entities
(486) - - - (486)
Elders. Live it.Annual Report 2015
78
For
per
sona
l use
onl
y
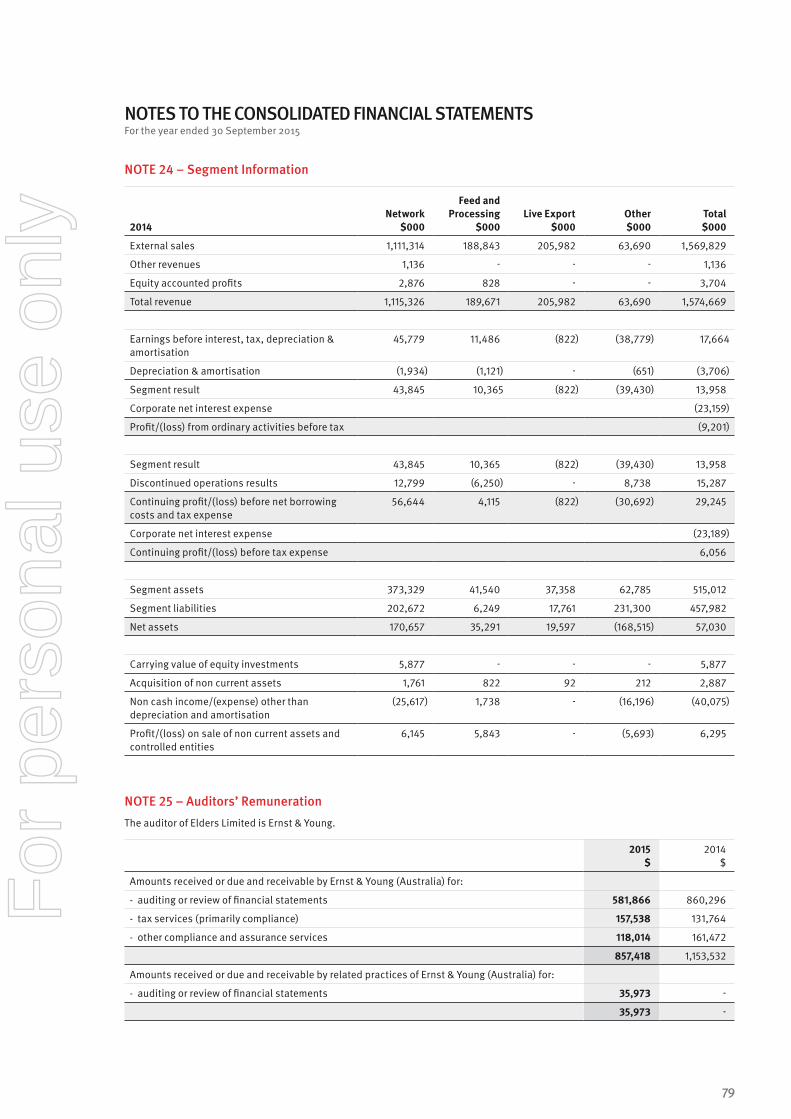
NOTES TO THE CONSOLIDATED FINANCIAL STATEMENTSFor the year ended 30 September 2015
NOTE 24 – Segment Information
2014Network
$000
Feed and Processing
$000Live Export
$000Other $000
Total $000
External sales 1,111,314 188,843 205,982 63,690 1,569,829
Other revenues 1,136 - - - 1,136
Equity accounted profits 2,876 828 - - 3,704
Total revenue 1,115,326 189,671 205,982 63,690 1,574,669
Earnings before interest, tax, depreciation & amortisation
45,779 11,486 (822) (38,779) 17,664
Depreciation & amortisation (1,934) (1,121) - (651) (3,706)
Segment result 43,845 10,365 (822) (39,430) 13,958
Corporate net interest expense (23,159)
Profit/(loss) from ordinary activities before tax (9,201)
Segment result 43,845 10,365 (822) (39,430) 13,958
Discontinued operations results 12,799 (6,250) - 8,738 15,287
Continuing profit/(loss) before net borrowing costs and tax expense
56,644 4,115 (822) (30,692) 29,245
Corporate net interest expense (23,189)
Continuing profit/(loss) before tax expense 6,056
Segment assets 373,329 41,540 37,358 62,785 515,012
Segment liabilities 202,672 6,249 17,761 231,300 457,982
Net assets 170,657 35,291 19,597 (168,515) 57,030
Carrying value of equity investments 5,877 - - - 5,877
Acquisition of non current assets 1,761 822 92 212 2,887
Non cash income/(expense) other than depreciation and amortisation
(25,617) 1,738 - (16,196) (40,075)
Profit/(loss) on sale of non current assets and controlled entities
6,145 5,843 - (5,693) 6,295
NOTE 25 – Auditors’ Remuneration The auditor of Elders Limited is Ernst & Young.
2015 $
2014 $
Amounts received or due and receivable by Ernst & Young (Australia) for:
- auditing or review of financial statements 581,866 860,296
- tax services (primarily compliance) 157,538 131,764
- other compliance and assurance services 118,014 161,472
857,418 1,153,532
Amounts received or due and receivable by related practices of Ernst & Young (Australia) for:
- auditing or review of financial statements 35,973 -
35,973 -
79
For
per
sona
l use
onl
y
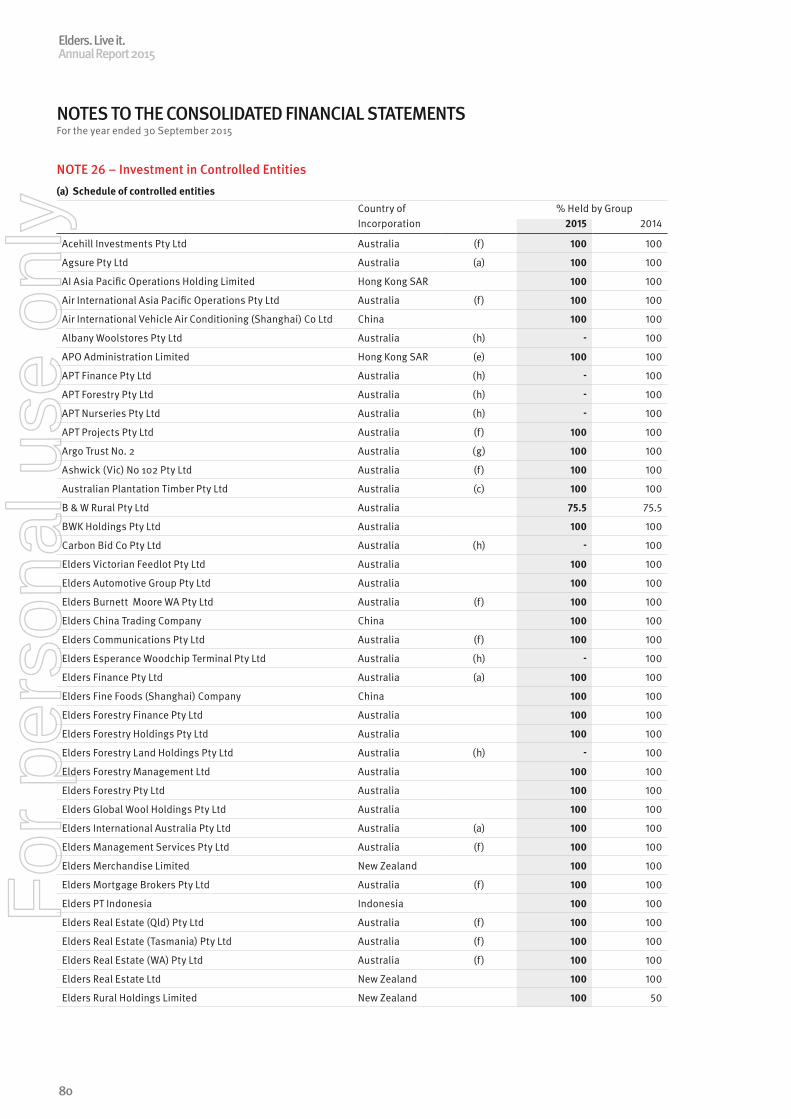
NOTES TO THE CONSOLIDATED FINANCIAL STATEMENTSFor the year ended 30 September 2015
NOTE 26 – Investment in Controlled Entities (a) Schedule of controlled entities
Country of % Held by GroupIncorporation 2015 2014
Acehill Investments Pty Ltd Australia (f) 100 100
Agsure Pty Ltd Australia (a) 100 100
AI Asia Pacific Operations Holding Limited Hong Kong SAR 100 100
Air International Asia Pacific Operations Pty Ltd Australia (f) 100 100
Air International Vehicle Air Conditioning (Shanghai) Co Ltd China 100 100
Albany Woolstores Pty Ltd Australia (h) - 100
APO Administration Limited Hong Kong SAR (e) 100 100
APT Finance Pty Ltd Australia (h) - 100
APT Forestry Pty Ltd Australia (h) - 100
APT Nurseries Pty Ltd Australia (h) - 100
APT Projects Pty Ltd Australia (f) 100 100
Argo Trust No. 2 Australia (g) 100 100
Ashwick (Vic) No 102 Pty Ltd Australia (f) 100 100
Australian Plantation Timber Pty Ltd Australia (c) 100 100
B & W Rural Pty Ltd Australia 75.5 75.5
BWK Holdings Pty Ltd Australia 100 100
Carbon Bid Co Pty Ltd Australia (h) - 100
Elders Victorian Feedlot Pty Ltd Australia 100 100
Elders Automotive Group Pty Ltd Australia 100 100
Elders Burnett Moore WA Pty Ltd Australia (f) 100 100
Elders China Trading Company China 100 100
Elders Communications Pty Ltd Australia (f) 100 100
Elders Esperance Woodchip Terminal Pty Ltd Australia (h) - 100
Elders Finance Pty Ltd Australia (a) 100 100
Elders Fine Foods (Shanghai) Company China 100 100
Elders Forestry Finance Pty Ltd Australia 100 100
Elders Forestry Holdings Pty Ltd Australia 100 100
Elders Forestry Land Holdings Pty Ltd Australia (h) - 100
Elders Forestry Management Ltd Australia 100 100
Elders Forestry Pty Ltd Australia 100 100
Elders Global Wool Holdings Pty Ltd Australia 100 100
Elders International Australia Pty Ltd Australia (a) 100 100
Elders Management Services Pty Ltd Australia (f) 100 100
Elders Merchandise Limited New Zealand 100 100
Elders Mortgage Brokers Pty Ltd Australia (f) 100 100
Elders PT Indonesia Indonesia 100 100
Elders Real Estate (Qld) Pty Ltd Australia (f) 100 100
Elders Real Estate (Tasmania) Pty Ltd Australia (f) 100 100
Elders Real Estate (WA) Pty Ltd Australia (f) 100 100
Elders Real Estate Ltd New Zealand 100 100
Elders Rural Holdings Limited New Zealand 100 50
Elders. Live it.Annual Report 2015
80
For
per
sona
l use
onl
y
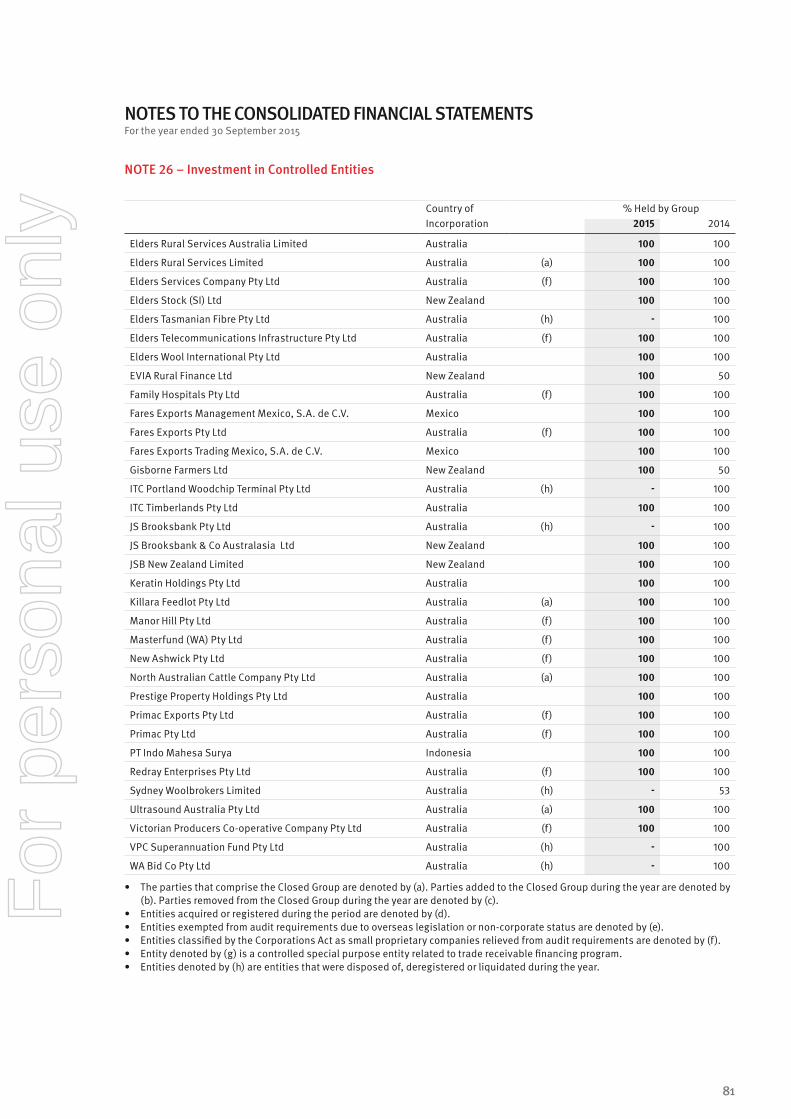
Country of % Held by GroupIncorporation 2015 2014
Elders Rural Services Australia Limited Australia 100 100
Elders Rural Services Limited Australia (a) 100 100
Elders Services Company Pty Ltd Australia (f) 100 100
Elders Stock (SI) Ltd New Zealand 100 100
Elders Tasmanian Fibre Pty Ltd Australia (h) - 100
Elders Telecommunications Infrastructure Pty Ltd Australia (f) 100 100
Elders Wool International Pty Ltd Australia 100 100
EVIA Rural Finance Ltd New Zealand 100 50
Family Hospitals Pty Ltd Australia (f) 100 100
Fares Exports Management Mexico, S.A. de C.V. Mexico 100 100
Fares Exports Pty Ltd Australia (f) 100 100
Fares Exports Trading Mexico, S.A. de C.V. Mexico 100 100
Gisborne Farmers Ltd New Zealand 100 50
ITC Portland Woodchip Terminal Pty Ltd Australia (h) - 100
ITC Timberlands Pty Ltd Australia 100 100
JS Brooksbank Pty Ltd Australia (h) - 100
JS Brooksbank & Co Australasia Ltd New Zealand 100 100
JSB New Zealand Limited New Zealand 100 100
Keratin Holdings Pty Ltd Australia 100 100
Killara Feedlot Pty Ltd Australia (a) 100 100
Manor Hill Pty Ltd Australia (f) 100 100
Masterfund (WA) Pty Ltd Australia (f) 100 100
New Ashwick Pty Ltd Australia (f) 100 100
North Australian Cattle Company Pty Ltd Australia (a) 100 100
Prestige Property Holdings Pty Ltd Australia 100 100
Primac Exports Pty Ltd Australia (f) 100 100
Primac Pty Ltd Australia (f) 100 100
PT Indo Mahesa Surya Indonesia 100 100
Redray Enterprises Pty Ltd Australia (f) 100 100
Sydney Woolbrokers Limited Australia (h) - 53
Ultrasound Australia Pty Ltd Australia (a) 100 100
Victorian Producers Co-operative Company Pty Ltd Australia (f) 100 100
VPC Superannuation Fund Pty Ltd Australia (h) - 100
WA Bid Co Pty Ltd Australia (h) - 100
• The parties that comprise the Closed Group are denoted by (a). Parties added to the Closed Group during the year are denoted by (b). Parties removed from the Closed Group during the year are denoted by (c).
• Entities acquired or registered during the period are denoted by (d).• Entities exempted from audit requirements due to overseas legislation or non-corporate status are denoted by (e).• Entities classified by the Corporations Act as small proprietary companies relieved from audit requirements are denoted by (f). • Entity denoted by (g) is a controlled special purpose entity related to trade receivable financing program.• Entities denoted by (h) are entities that were disposed of, deregistered or liquidated during the year.
NOTES TO THE CONSOLIDATED FINANCIAL STATEMENTSFor the year ended 30 September 2015
NOTE 26 – Investment in Controlled Entities
81
For
per
sona
l use
onl
y
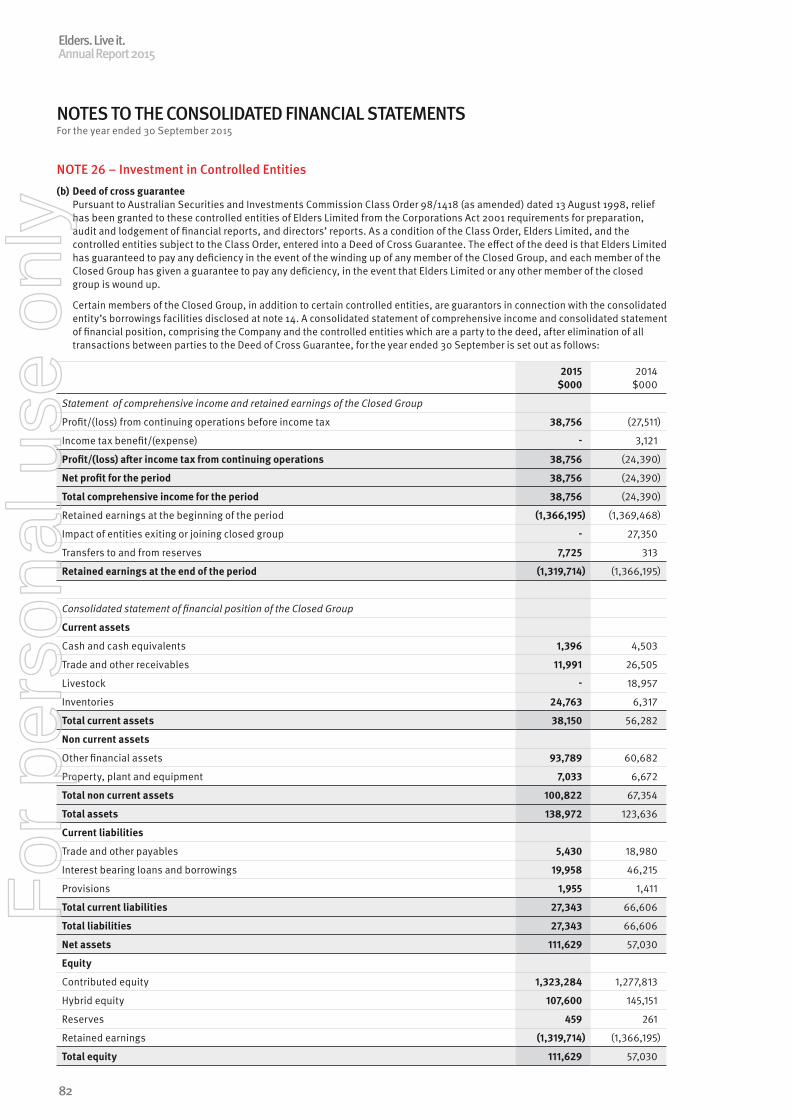
NOTES TO THE CONSOLIDATED FINANCIAL STATEMENTSFor the year ended 30 September 2015
NOTE 26 – Investment in Controlled Entities (b) Deed of cross guarantee Pursuant to Australian Securities and Investments Commission Class Order 98/1418 (as amended) dated 13 August 1998, relief
has been granted to these controlled entities of Elders Limited from the Corporations Act 2001 requirements for preparation, audit and lodgement of financial reports, and directors’ reports. As a condition of the Class Order, Elders Limited, and the controlled entities subject to the Class Order, entered into a Deed of Cross Guarantee. The effect of the deed is that Elders Limited has guaranteed to pay any deficiency in the event of the winding up of any member of the Closed Group, and each member of the Closed Group has given a guarantee to pay any deficiency, in the event that Elders Limited or any other member of the closed group is wound up.
Certain members of the Closed Group, in addition to certain controlled entities, are guarantors in connection with the consolidated entity’s borrowings facilities disclosed at note 14. A consolidated statement of comprehensive income and consolidated statement of financial position, comprising the Company and the controlled entities which are a party to the deed, after elimination of all transactions between parties to the Deed of Cross Guarantee, for the year ended 30 September is set out as follows:
2015 $000
2014 $000
Statement of comprehensive income and retained earnings of the Closed Group
Profit/(loss) from continuing operations before income tax 38,756 (27,511)
Income tax benefit/(expense) - 3,121
Profit/(loss) after income tax from continuing operations 38,756 (24,390)
Net profit for the period 38,756 (24,390)
Total comprehensive income for the period 38,756 (24,390)
Retained earnings at the beginning of the period (1,366,195) (1,369,468)
Impact of entities exiting or joining closed group - 27,350
Transfers to and from reserves 7,725 313
Retained earnings at the end of the period (1,319,714) (1,366,195)
Consolidated statement of financial position of the Closed Group
Current assets
Cash and cash equivalents 1,396 4,503
Trade and other receivables 11,991 26,505
Livestock - 18,957
Inventories 24,763 6,317
Total current assets 38,150 56,282
Non current assets
Other financial assets 93,789 60,682
Property, plant and equipment 7,033 6,672
Total non current assets 100,822 67,354
Total assets 138,972 123,636
Current liabilities
Trade and other payables 5,430 18,980
Interest bearing loans and borrowings 19,958 46,215
Provisions 1,955 1,411
Total current liabilities 27,343 66,606
Total liabilities 27,343 66,606
Net assets 111,629 57,030
Equity
Contributed equity 1,323,284 1,277,813
Hybrid equity 107,600 145,151
Reserves 459 261
Retained earnings (1,319,714) (1,366,195)
Total equity 111,629 57,030
Elders. Live it.Annual Report 2015
82
For
per
sona
l use
onl
y

NOTES TO THE CONSOLIDATED FINANCIAL STATEMENTSFor the year ended 30 September 2015
NOTE 27 – Key Management PersonnelRemuneration of specified Directors and other Key Management PersonnelFor information on the Remuneration Policy, Structure and the relationship between remuneration payment and performance please refer to the Remuneration Report.
2015 $
2014 $
Short term 4,359,029 3,394,703
Long term 56,672 (126,811)
Post employment 159,967 129,692
Termination benefits - 1,766,181
Share based payments 268,831 (94,484)
4,844,499 5,069,281
NOTE 28 – Related Party Disclosures(a) Ultimate controlling entity The ultimate controlling entity of the Group is Elders Limited.
(b) Transactions between Elders Limited (Parent Entity) and related parties in the wholly owned group There are no balances or transactions between the parent entity and related parties in the wholly owned group.
(c) Transactions between controlled entities wholly owned and controlled entities not wholly owned Details of entities not wholly owned are set out in note 26.
2015 $000
2014 $000
Transactions with controlled entities not wholly owned:
Intercompany loan movements (1,621) (3,937)
Dividends received 1,951 2,917
Balances with controlled entities not wholly owned:
Owing to the Group 4,386 4,056
Owing from the Group - (654)
4,386 3,402
Transactions with controlled entities not wholly owned are made in arms length transactions both at normal market prices and on normal commercial terms.
(d) Transactions between controlled entities and partly owned entities (equity accounted investments)
Transactions with partly owned entities:
Loan movements (199) (4,494)
Dividends received 311 3,765
Impairment of loans - (436)
Balances with partly owned entities:
Owing to the Group 132 331
132 331
Loans made to partly owned entities are priced on an arms length basis. None of the balances are secured.
Transactions with partly owned entities are made in arms length transactions both at normal market prices and normal commercial terms.
83
For
per
sona
l use
onl
y
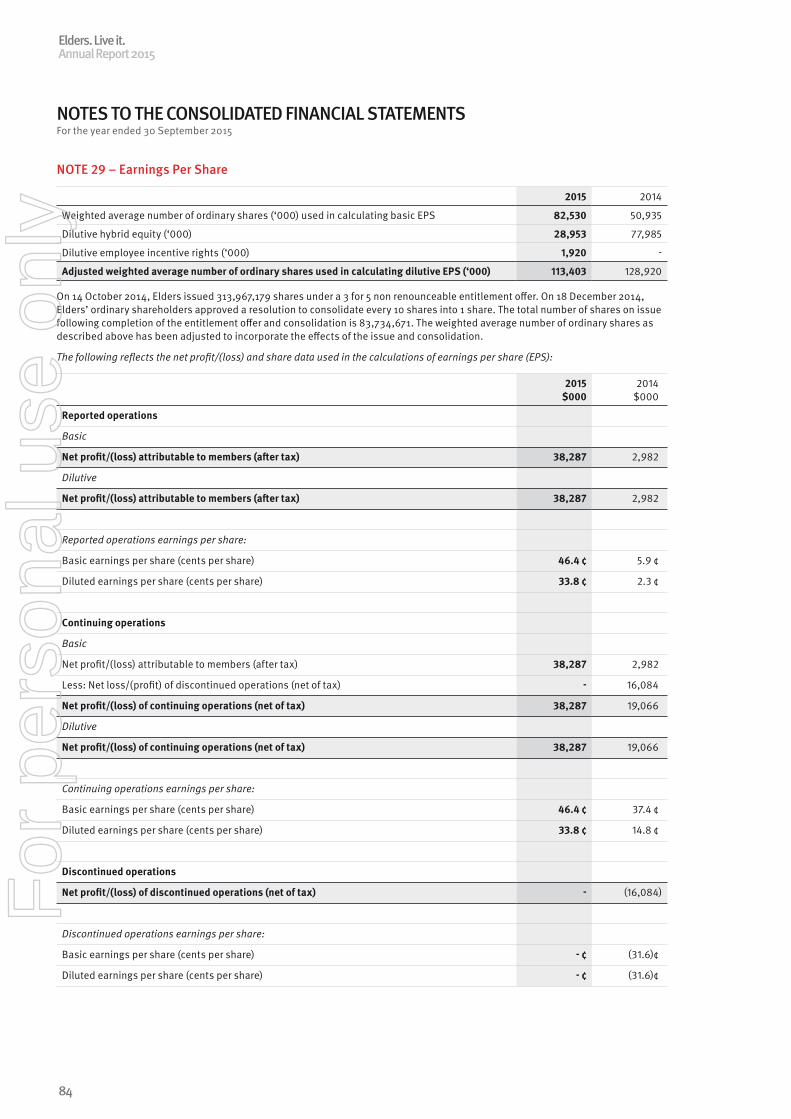
NOTES TO THE CONSOLIDATED FINANCIAL STATEMENTSFor the year ended 30 September 2015
NOTE 29 – Earnings Per Share
2015 2014
Weighted average number of ordinary shares (‘000) used in calculating basic EPS 82,530 50,935
Dilutive hybrid equity (‘000) 28,953 77,985
Dilutive employee incentive rights (‘000) 1,920 -
Adjusted weighted average number of ordinary shares used in calculating dilutive EPS (‘000) 113,403 128,920
On 14 October 2014, Elders issued 313,967,179 shares under a 3 for 5 non renounceable entitlement offer. On 18 December 2014, Elders’ ordinary shareholders approved a resolution to consolidate every 10 shares into 1 share. The total number of shares on issue following completion of the entitlement offer and consolidation is 83,734,671. The weighted average number of ordinary shares as described above has been adjusted to incorporate the effects of the issue and consolidation.
The following reflects the net profit/(loss) and share data used in the calculations of earnings per share (EPS):
2015 $000
2014 $000
Reported operations
Basic
Net profit/(loss) attributable to members (after tax) 38,287 2,982
Dilutive
Net profit/(loss) attributable to members (after tax) 38,287 2,982
Reported operations earnings per share:
Basic earnings per share (cents per share) 46.4 ¢ 5.9 ¢
Diluted earnings per share (cents per share) 33.8 ¢ 2.3 ¢
Continuing operations
Basic
Net profit/(loss) attributable to members (after tax) 38,287 2,982
Less: Net loss/(profit) of discontinued operations (net of tax) - 16,084
Net profit/(loss) of continuing operations (net of tax) 38,287 19,066
Dilutive
Net profit/(loss) of continuing operations (net of tax) 38,287 19,066
Continuing operations earnings per share:
Basic earnings per share (cents per share) 46.4 ¢ 37.4 ¢
Diluted earnings per share (cents per share) 33.8 ¢ 14.8 ¢
Discontinued operations
Net profit/(loss) of discontinued operations (net of tax) - (16,084)
Discontinued operations earnings per share:
Basic earnings per share (cents per share) - ¢ (31.6)¢
Diluted earnings per share (cents per share) - ¢ (31.6)¢
Elders. Live it.Annual Report 2015
84
For
per
sona
l use
onl
y
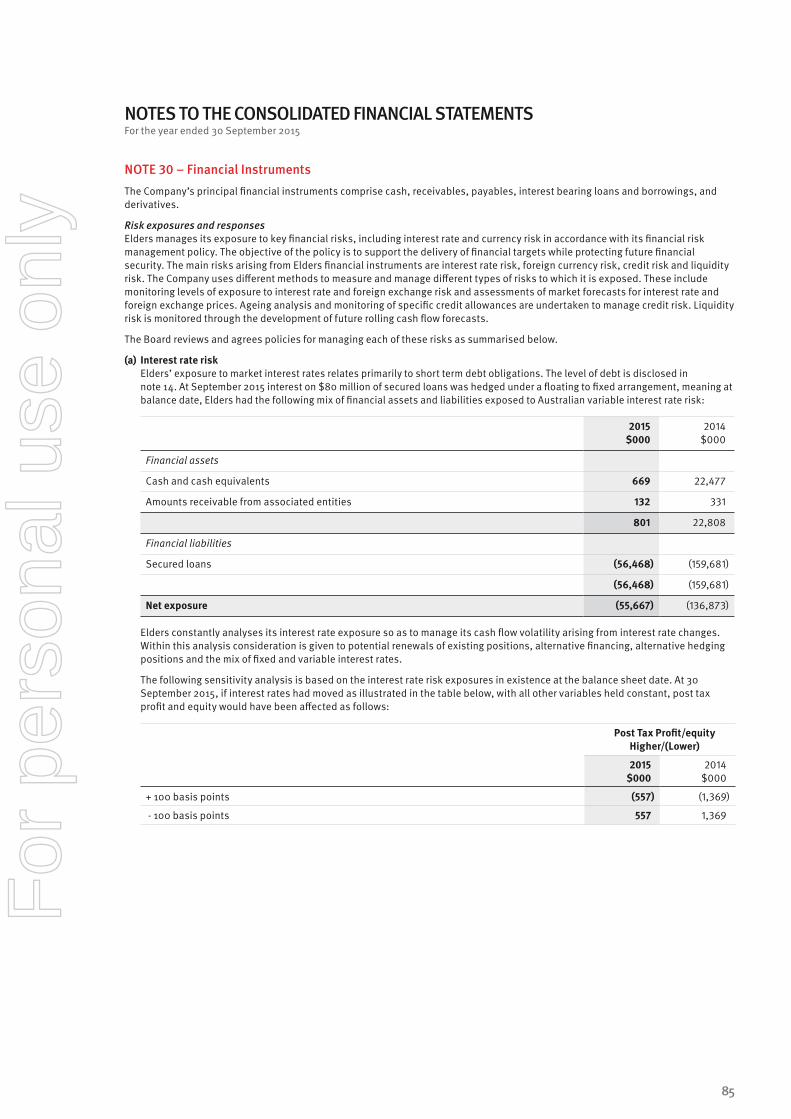
NOTES TO THE CONSOLIDATED FINANCIAL STATEMENTSFor the year ended 30 September 2015
NOTE 30 – Financial Instruments The Company’s principal financial instruments comprise cash, receivables, payables, interest bearing loans and borrowings, and derivatives.
Risk exposures and responsesElders manages its exposure to key financial risks, including interest rate and currency risk in accordance with its financial risk management policy. The objective of the policy is to support the delivery of financial targets while protecting future financial security. The main risks arising from Elders financial instruments are interest rate risk, foreign currency risk, credit risk and liquidity risk. The Company uses different methods to measure and manage different types of risks to which it is exposed. These include monitoring levels of exposure to interest rate and foreign exchange risk and assessments of market forecasts for interest rate and foreign exchange prices. Ageing analysis and monitoring of specific credit allowances are undertaken to manage credit risk. Liquidity risk is monitored through the development of future rolling cash flow forecasts.
The Board reviews and agrees policies for managing each of these risks as summarised below.
(a) Interest rate risk Elders’ exposure to market interest rates relates primarily to short term debt obligations. The level of debt is disclosed in
note 14. At September 2015 interest on $80 million of secured loans was hedged under a floating to fixed arrangement, meaning at balance date, Elders had the following mix of financial assets and liabilities exposed to Australian variable interest rate risk:
2015 $000
2014 $000
Financial assets
Cash and cash equivalents 669 22,477
Amounts receivable from associated entities 132 331
801 22,808
Financial liabilities
Secured loans (56,468) (159,681)
(56,468) (159,681)
Net exposure (55,667) (136,873)
Elders constantly analyses its interest rate exposure so as to manage its cash flow volatility arising from interest rate changes. Within this analysis consideration is given to potential renewals of existing positions, alternative financing, alternative hedging positions and the mix of fixed and variable interest rates.
The following sensitivity analysis is based on the interest rate risk exposures in existence at the balance sheet date. At 30 September 2015, if interest rates had moved as illustrated in the table below, with all other variables held constant, post tax profit and equity would have been affected as follows:
Post Tax Profit/equity Higher/(Lower)
2015 $000
2014 $000
+ 100 basis points (557) (1,369)
- 100 basis points 557 1,369
85
For
per
sona
l use
onl
y

NOTES TO THE CONSOLIDATED FINANCIAL STATEMENTSFor the year ended 30 September 2015
NOTE 30 – Financial Instruments (b) Liquidity risk Liquidity risk arises from Elders’ financial liabilities and the subsequent ability to meet our obligations to repay their financial
liabilities as and when they fall due. Elders’ objective is to maintain a balance between continuity of funding and flexibility through the use of bank overdrafts, bank loans and committed available lines of credit. Elders manages its liquidity risk by monitoring the total cash inflows and outflows expected on a weekly basis. Elders has established comprehensive risk reporting covering its business units that reflect expectations of management of the expected settlement of financial assets and liabilities.
A. Non derivative financial liabilities The following liquidity risk disclosures reflect all contractually fixed pay-offs, repayments and interest resulting from the
recognised financial liabilities and financial guarantees as of 30 September 2015. For the other obligations the respective undiscounted cash flows for the respective upcoming fiscal years are presented. The timing of cash flows for liabilities is based on the contractual terms of the underlying contract.
However, where the counterparty has a choice of when the amount is paid, the liability is allocated to the earliest period in which we can be required to pay. When Elders is committed to make amounts available in instalments, each instalment is allocated to the earliest period in which we are required to pay. For financial guarantee contracts, the maximum amount of the guarantee is allocated to the earliest period in which the guarantee can be called. The risk implied from the values shown in the table below, reflects a balanced view of cash inflows and outflows of non-derivative financial instruments.
Carrying amount
$000
Contractual cash flows
$000
6 months or less
$000
6-12 months
$0001-5 years
$000
2015
Non derivative financial assets:
Cash and cash equivalents 669 669 669 - -
Trade and other receivables 354,669 354,669 354,669 - -
355,338 355,338 355,338 - -
Non derivative financial liabilities:
Interest bearing loans and borrowings (136,822) (136,881) (136,881) - -
Trade and other payables (276,157) (276,157) (276,157) - -
Financial guarantees - (4,169) (4,169) - -
(412,979) (417,207) (417,207) - -
Net inflow/(outflow) (57,641) (61,869) (61,869) - -
2014
Non derivative financial assets:
Cash and cash equivalents 22,477 22,477 22,477 - -
Trade and other receivables 308,768 308,768 308,768 - -
331,245 331,245 331,245 - -
Non derivative financial liabilities:
Interest bearing loans and borrowings (160,103) (160,757) (160,757) - -
Trade and other payables (249,545) (249,545) (249,545) - -
Financial guarantees - (32,237) (32,237) - -
(409,648) (442,539) (442,539) - -
Net inflow/(outflow) (78,403) (111,294) (111,294) - -
B. Derivative financial instruments Due to the unique characteristics and inherent risks to derivative instruments, Elders separately monitors liquidity risk arising
from transacting in derivative instruments. The table below details the liquidity risk arising from derivative financial liabilities held by Elders at balance date. Net settled derivative liabilities comprise forward exchange and interest rate hedges.
Elders. Live it.Annual Report 2015
86
For
per
sona
l use
onl
y
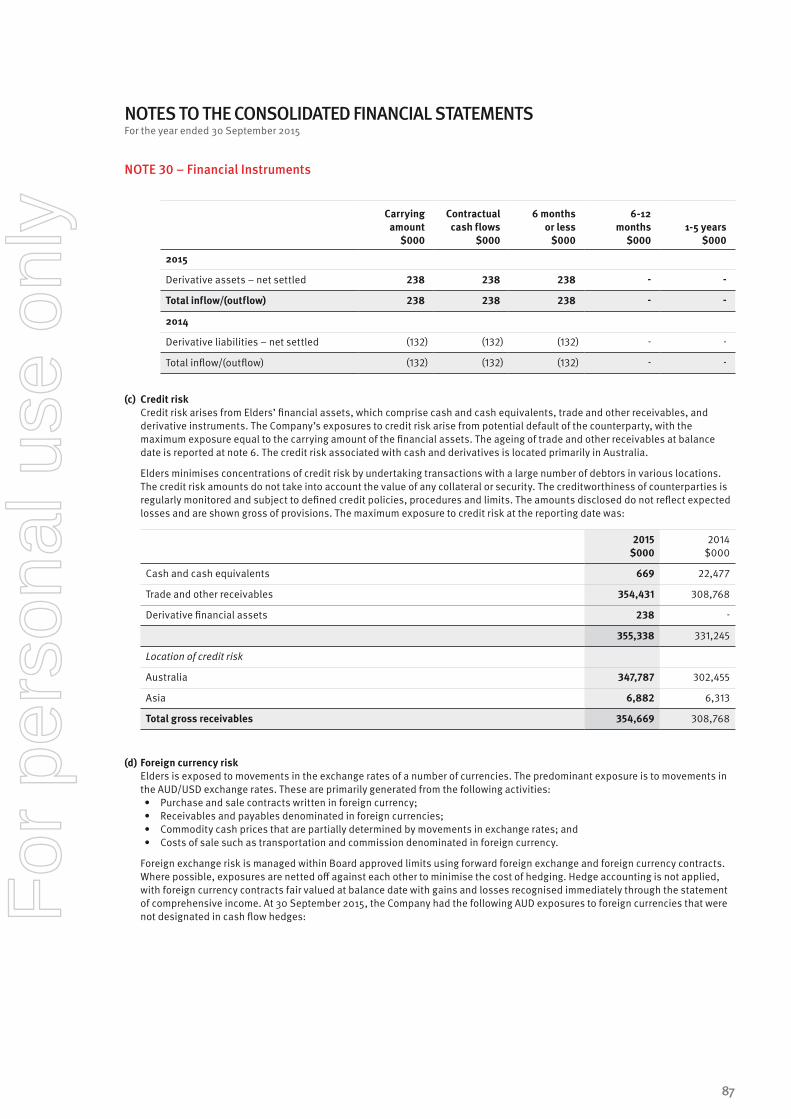
NOTES TO THE CONSOLIDATED FINANCIAL STATEMENTSFor the year ended 30 September 2015
NOTE 30 – Financial Instruments
Carrying amount
$000
Contractual cash flows
$000
6 months or less
$000
6-12 months
$0001-5 years
$000
2015
Derivative assets – net settled 238 238 238 - -
Total inflow/(outflow) 238 238 238 - -
2014
Derivative liabilities – net settled (132) (132) (132) - -
Total inflow/(outflow) (132) (132) (132) - -
(c) Credit risk Credit risk arises from Elders’ financial assets, which comprise cash and cash equivalents, trade and other receivables, and
derivative instruments. The Company’s exposures to credit risk arise from potential default of the counterparty, with the maximum exposure equal to the carrying amount of the financial assets. The ageing of trade and other receivables at balance date is reported at note 6. The credit risk associated with cash and derivatives is located primarily in Australia.
Elders minimises concentrations of credit risk by undertaking transactions with a large number of debtors in various locations. The credit risk amounts do not take into account the value of any collateral or security. The creditworthiness of counterparties is regularly monitored and subject to defined credit policies, procedures and limits. The amounts disclosed do not reflect expected losses and are shown gross of provisions. The maximum exposure to credit risk at the reporting date was:
2015 $000
2014 $000
Cash and cash equivalents 669 22,477
Trade and other receivables 354,431 308,768
Derivative financial assets 238 -
355,338 331,245
Location of credit risk
Australia 347,787 302,455
Asia 6,882 6,313
Total gross receivables 354,669 308,768
(d) Foreign currency risk Elders is exposed to movements in the exchange rates of a number of currencies. The predominant exposure is to movements in
the AUD/USD exchange rates. These are primarily generated from the following activities:• Purchase and sale contracts written in foreign currency; • Receivables and payables denominated in foreign currencies;• Commodity cash prices that are partially determined by movements in exchange rates; and• Costs of sale such as transportation and commission denominated in foreign currency.
Foreign exchange risk is managed within Board approved limits using forward foreign exchange and foreign currency contracts. Where possible, exposures are netted off against each other to minimise the cost of hedging. Hedge accounting is not applied, with foreign currency contracts fair valued at balance date with gains and losses recognised immediately through the statement of comprehensive income. At 30 September 2015, the Company had the following AUD exposures to foreign currencies that were not designated in cash flow hedges:
87
For
per
sona
l use
onl
y
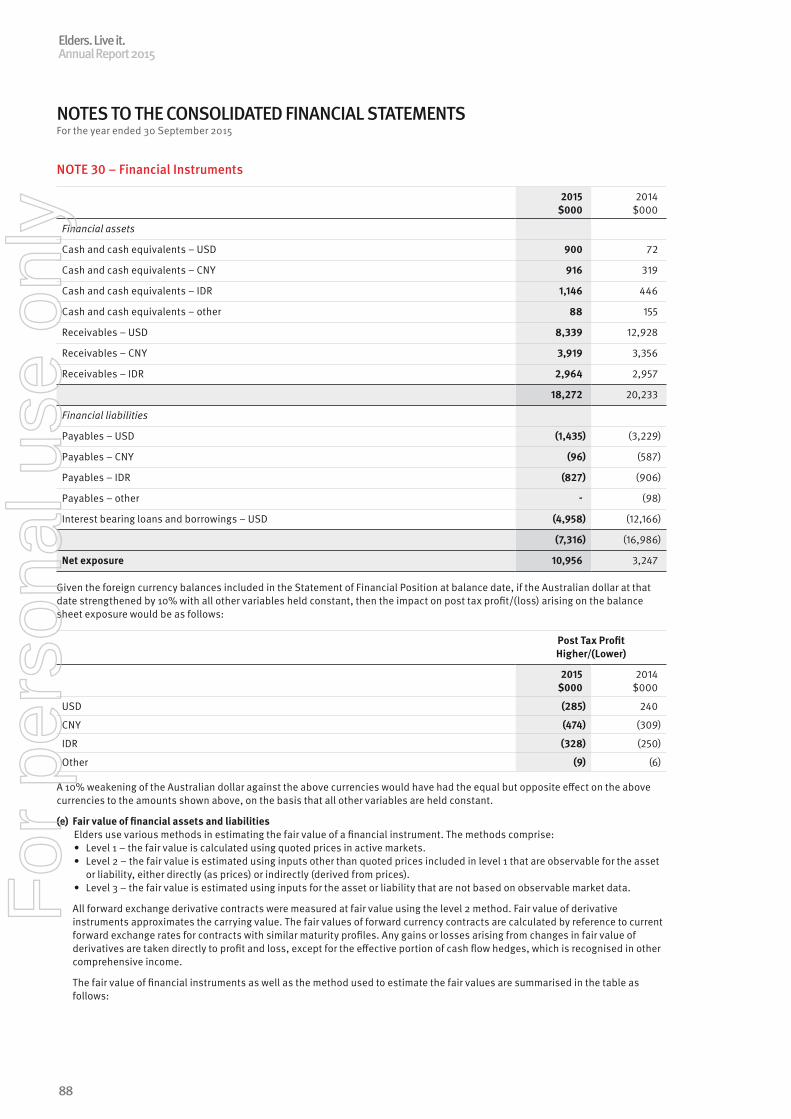
NOTES TO THE CONSOLIDATED FINANCIAL STATEMENTSFor the year ended 30 September 2015
NOTE 30 – Financial Instruments
2015 $000
2014 $000
Financial assets
Cash and cash equivalents – USD 900 72
Cash and cash equivalents – CNY 916 319
Cash and cash equivalents – IDR 1,146 446
Cash and cash equivalents – other 88 155
Receivables – USD 8,339 12,928
Receivables – CNY 3,919 3,356
Receivables – IDR 2,964 2,957
18,272 20,233
Financial liabilities
Payables – USD (1,435) (3,229)
Payables – CNY (96) (587)
Payables – IDR (827) (906)
Payables – other - (98)
Interest bearing loans and borrowings – USD (4,958) (12,166)
(7,316) (16,986)
Net exposure 10,956 3,247
Given the foreign currency balances included in the Statement of Financial Position at balance date, if the Australian dollar at that date strengthened by 10% with all other variables held constant, then the impact on post tax profit/(loss) arising on the balance sheet exposure would be as follows:
Post Tax Profit Higher/(Lower)
2015 $000
2014 $000
USD (285) 240
CNY (474) (309)
IDR (328) (250)
Other (9) (6)
A 10% weakening of the Australian dollar against the above currencies would have had the equal but opposite effect on the above currencies to the amounts shown above, on the basis that all other variables are held constant.
(e) Fair value of financial assets and liabilitiesElders use various methods in estimating the fair value of a financial instrument. The methods comprise:• Level 1 – the fair value is calculated using quoted prices in active markets.• Level 2 – the fair value is estimated using inputs other than quoted prices included in level 1 that are observable for the asset
or liability, either directly (as prices) or indirectly (derived from prices).• Level 3 – the fair value is estimated using inputs for the asset or liability that are not based on observable market data.
All forward exchange derivative contracts were measured at fair value using the level 2 method. Fair value of derivative instruments approximates the carrying value. The fair values of forward currency contracts are calculated by reference to current forward exchange rates for contracts with similar maturity profiles. Any gains or losses arising from changes in fair value of derivatives are taken directly to profit and loss, except for the effective portion of cash flow hedges, which is recognised in other comprehensive income.
The fair value of financial instruments as well as the method used to estimate the fair values are summarised in the table as follows:
Elders. Live it.Annual Report 2015
88
For
per
sona
l use
onl
y
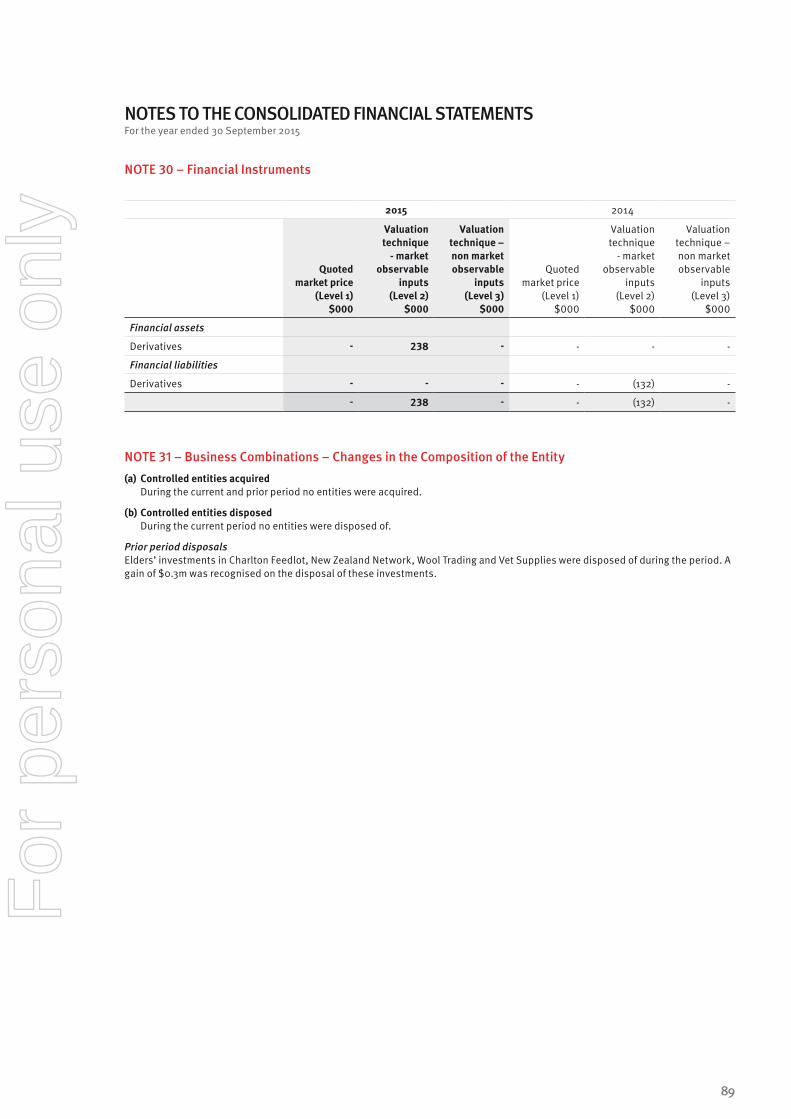
NOTES TO THE CONSOLIDATED FINANCIAL STATEMENTSFor the year ended 30 September 2015
NOTE 30 – Financial Instruments
2015 2014
Quoted market price
(Level 1) $000
Valuation technique
- market observable
inputs (Level 2)
$000
Valuation technique – non market observable
inputs (Level 3)
$000
Quoted market price
(Level 1) $000
Valuation technique
- market observable
inputs (Level 2)
$000
Valuation technique – non market observable
inputs (Level 3)
$000
Financial assets
Derivatives - 238 - - - -
Financial liabilities
Derivatives - - - - (132) -
- 238 - - (132) -
NOTE 31 – Business Combinations – Changes in the Composition of the Entity(a) Controlled entities acquired During the current and prior period no entities were acquired.
(b) Controlled entities disposed During the current period no entities were disposed of.
Prior period disposalsElders’ investments in Charlton Feedlot, New Zealand Network, Wool Trading and Vet Supplies were disposed of during the period. A gain of $0.3m was recognised on the disposal of these investments.
89
For
per
sona
l use
onl
y
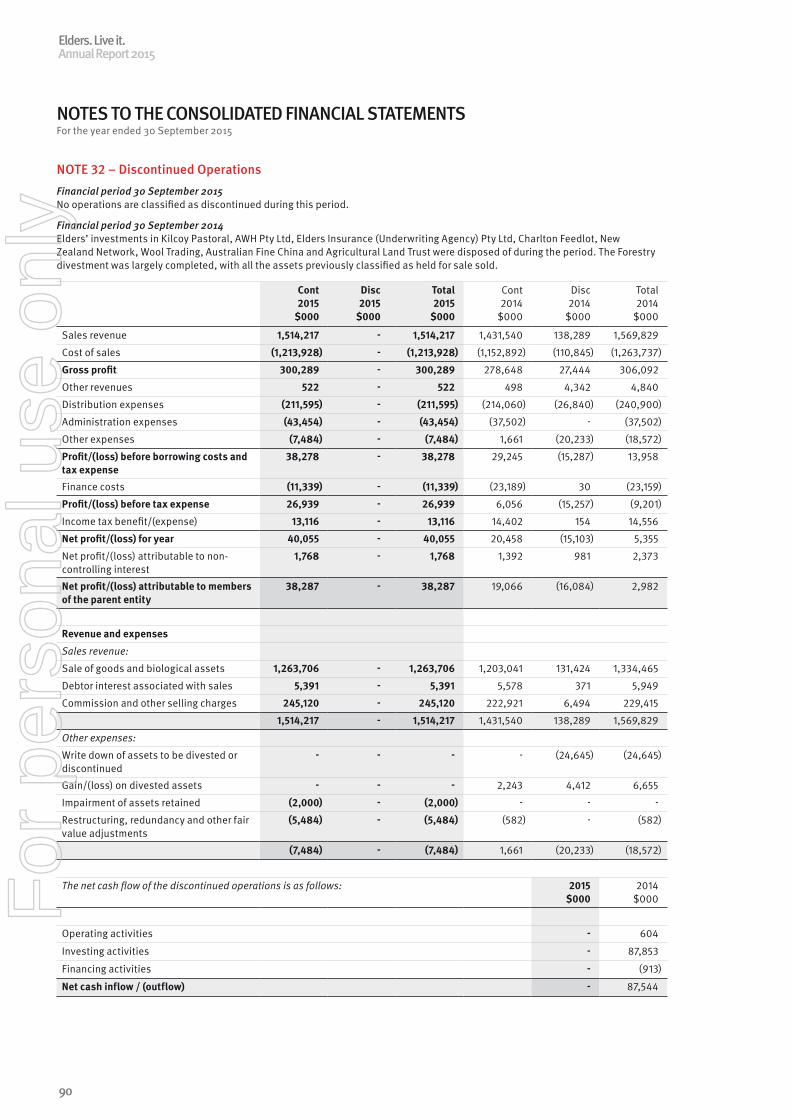
NOTES TO THE CONSOLIDATED FINANCIAL STATEMENTSFor the year ended 30 September 2015
NOTE 32 – Discontinued Operations Financial period 30 September 2015No operations are classified as discontinued during this period.
Financial period 30 September 2014Elders’ investments in Kilcoy Pastoral, AWH Pty Ltd, Elders Insurance (Underwriting Agency) Pty Ltd, Charlton Feedlot, New Zealand Network, Wool Trading, Australian Fine China and Agricultural Land Trust were disposed of during the period. The Forestry divestment was largely completed, with all the assets previously classified as held for sale sold.
Cont 2015
$000
Disc 2015
$000
Total 2015
$000
Cont 2014
$000
Disc 2014
$000
Total 2014
$000
Sales revenue 1,514,217 - 1,514,217 1,431,540 138,289 1,569,829
Cost of sales (1,213,928) - (1,213,928) (1,152,892) (110,845) (1,263,737)
Gross profit 300,289 - 300,289 278,648 27,444 306,092
Other revenues 522 - 522 498 4,342 4,840
Distribution expenses (211,595) - (211,595) (214,060) (26,840) (240,900)
Administration expenses (43,454) - (43,454) (37,502) - (37,502)
Other expenses (7,484) - (7,484) 1,661 (20,233) (18,572)
Profit/(loss) before borrowing costs and tax expense
38,278 - 38,278 29,245 (15,287) 13,958
Finance costs (11,339) - (11,339) (23,189) 30 (23,159)
Profit/(loss) before tax expense 26,939 - 26,939 6,056 (15,257) (9,201)
Income tax benefit/(expense) 13,116 - 13,116 14,402 154 14,556
Net profit/(loss) for year 40,055 - 40,055 20,458 (15,103) 5,355
Net profit/(loss) attributable to non-controlling interest
1,768 - 1,768 1,392 981 2,373
Net profit/(loss) attributable to members of the parent entity
38,287 - 38,287 19,066 (16,084) 2,982
Revenue and expenses
Sales revenue:
Sale of goods and biological assets 1,263,706 - 1,263,706 1,203,041 131,424 1,334,465
Debtor interest associated with sales 5,391 - 5,391 5,578 371 5,949
Commission and other selling charges 245,120 - 245,120 222,921 6,494 229,415
1,514,217 - 1,514,217 1,431,540 138,289 1,569,829
Other expenses:
Write down of assets to be divested or discontinued
- - - - (24,645) (24,645)
Gain/(loss) on divested assets - - - 2,243 4,412 6,655
Impairment of assets retained (2,000) - (2,000) - - -
Restructuring, redundancy and other fair value adjustments
(5,484) - (5,484) (582) - (582)
(7,484) - (7,484) 1,661 (20,233) (18,572)
The net cash flow of the discontinued operations is as follows: 2015 $000
2014 $000
Operating activities - 604
Investing activities - 87,853
Financing activities - (913)
Net cash inflow / (outflow) - 87,544
Elders. Live it.Annual Report 2015
90
For
per
sona
l use
onl
y
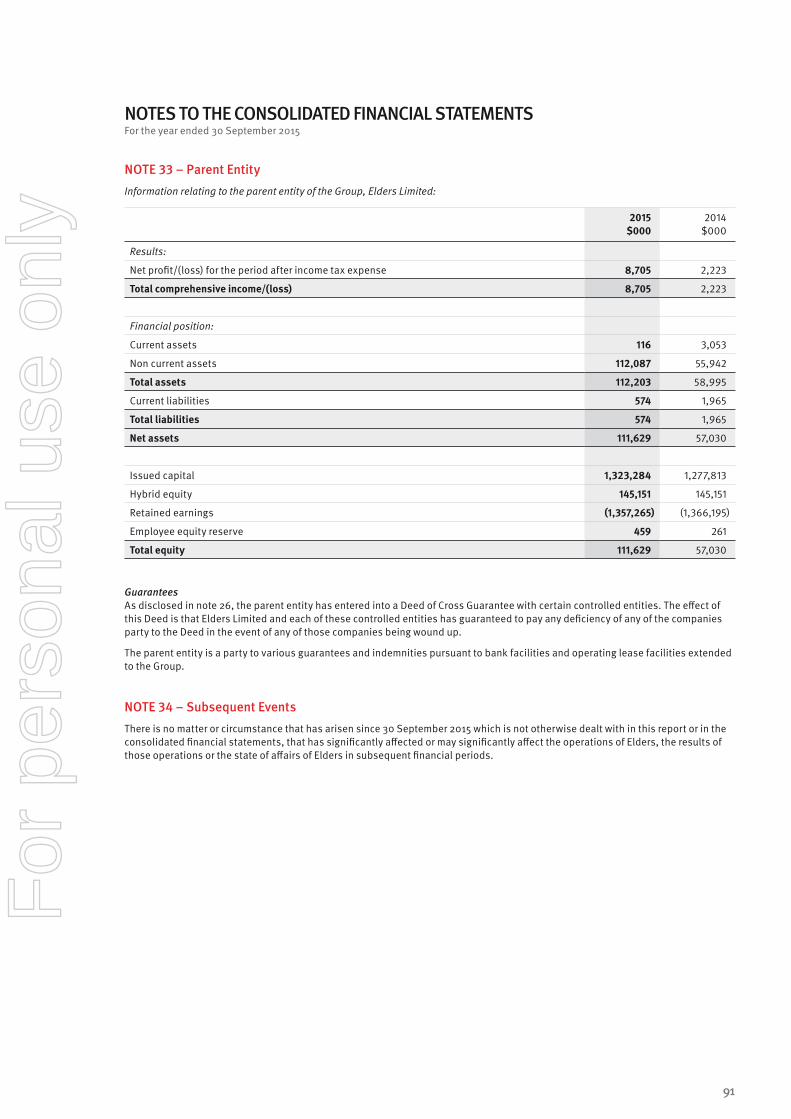
NOTES TO THE CONSOLIDATED FINANCIAL STATEMENTSFor the year ended 30 September 2015
NOTE 33 – Parent Entity Information relating to the parent entity of the Group, Elders Limited:
2015 $000
2014 $000
Results:
Net profit/(loss) for the period after income tax expense 8,705 2,223
Total comprehensive income/(loss) 8,705 2,223
Financial position:
Current assets 116 3,053
Non current assets 112,087 55,942
Total assets 112,203 58,995
Current liabilities 574 1,965
Total liabilities 574 1,965
Net assets 111,629 57,030
Issued capital 1,323,284 1,277,813
Hybrid equity 145,151 145,151
Retained earnings (1,357,265) (1,366,195)
Employee equity reserve 459 261
Total equity 111,629 57,030
GuaranteesAs disclosed in note 26, the parent entity has entered into a Deed of Cross Guarantee with certain controlled entities. The effect of this Deed is that Elders Limited and each of these controlled entities has guaranteed to pay any deficiency of any of the companies party to the Deed in the event of any of those companies being wound up.
The parent entity is a party to various guarantees and indemnities pursuant to bank facilities and operating lease facilities extended to the Group.
NOTE 34 – Subsequent Events There is no matter or circumstance that has arisen since 30 September 2015 which is not otherwise dealt with in this report or in the consolidated financial statements, that has significantly affected or may significantly affect the operations of Elders, the results of those operations or the state of affairs of Elders in subsequent financial periods.
91
For
per
sona
l use
onl
y
DIRECTORS’ DECLARATION
In accordance with a resolution of the Directors of Elders Limited, the Directors declare:
1. In the opinion of the Directors:
(a) the financial statements and notes of Elders Limited for the financial year ended 30 September 2015 are in accordance with the Corporations Act 2001, including:
(i) Giving a true and fair view of its financial position as at 30 September 2015 and of its performance for the year ended on that date; and
(ii) Complying with Australian Accounting Standards (including the Australian Accounting Interpretations) and the Corporations Regulations 2001
(b) the financial statements and notes also comply with International Financial Reporting Standards as disclosed in note 2(b)
(c) there are reasonable grounds to believe that the Company will be able to pay its debts as and when they become due and payable.
2. This declaration has been made after receiving the declarations required to be made to the Directors in accordance with section 295A of the Corporations Act 2001 for the year ended 30 September 2015.
3. In the opinion of the Directors, as at the date of this declaration, there are reasonable grounds to believe that the members of the Closed Group identified in note 26 will be able to meet any obligations or liabilities to which they are or may become subject, by virtue of the deed of cross guarantee.
On behalf of the Board
Hutch Ranck Chairman
Mark Allison Managing Director
Adelaide16 November 2015
Elders. Live it.Annual Report 2015
92
For
per
sona
l use
onl
y
93
For
per
sona
l use
onl
y
94
For
per
sona
l use
onl
y

NOTES
95
For
per
sona
l use
onl
y
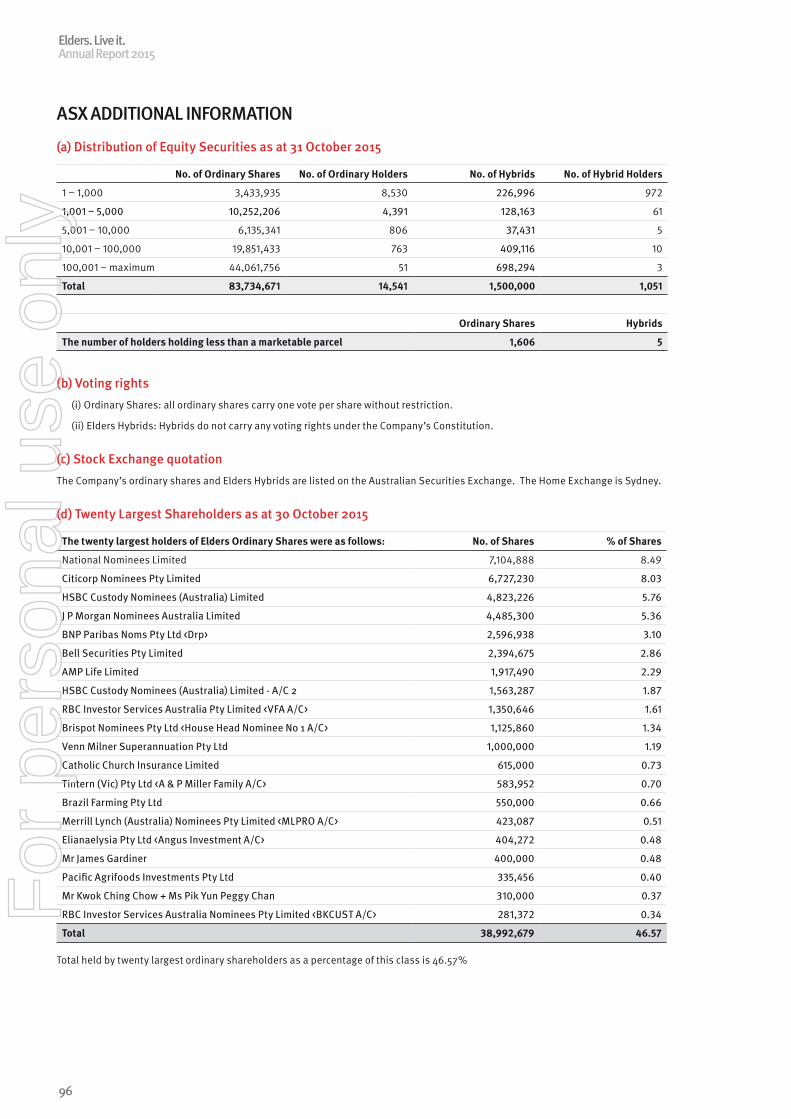
ASX ADDITIONAL INFORMATION
(a) Distribution of Equity Securities as at 31 October 2015
No. of Ordinary Shares No. of Ordinary Holders No. of Hybrids No. of Hybrid Holders
1 – 1,000 3,433,935 8,530 226,996 972
1,001 – 5,000 10,252,206 4,391 128,163 61
5,001 – 10,000 6,135,341 806 37,431 5
10,001 – 100,000 19,851,433 763 409,116 10
100,001 – maximum 44,061,756 51 698,294 3
Total 83,734,671 14,541 1,500,000 1,051
Ordinary Shares Hybrids
The number of holders holding less than a marketable parcel 1,606 5
(b) Voting rights(i) Ordinary Shares: all ordinary shares carry one vote per share without restriction.
(ii) Elders Hybrids: Hybrids do not carry any voting rights under the Company’s Constitution.
(c) Stock Exchange quotationThe Company’s ordinary shares and Elders Hybrids are listed on the Australian Securities Exchange. The Home Exchange is Sydney.
(d) Twenty Largest Shareholders as at 30 October 2015
The twenty largest holders of Elders Ordinary Shares were as follows: No. of Shares % of Shares
National Nominees Limited 7,104,888 8.49
Citicorp Nominees Pty Limited 6,727,230 8.03
HSBC Custody Nominees (Australia) Limited 4,823,226 5.76
J P Morgan Nominees Australia Limited 4,485,300 5.36
BNP Paribas Noms Pty Ltd <Drp> 2,596,938 3.10
Bell Securities Pty Limited 2,394,675 2.86
AMP Life Limited 1,917,490 2.29
HSBC Custody Nominees (Australia) Limited - A/C 2 1,563,287 1.87
RBC Investor Services Australia Pty Limited <VFA A/C> 1,350,646 1.61
Brispot Nominees Pty Ltd <House Head Nominee No 1 A/C> 1,125,860 1.34
Venn Milner Superannuation Pty Ltd 1,000,000 1.19
Catholic Church Insurance Limited 615,000 0.73
Tintern (Vic) Pty Ltd <A & P Miller Family A/C> 583,952 0.70
Brazil Farming Pty Ltd 550,000 0.66
Merrill Lynch (Australia) Nominees Pty Limited <MLPRO A/C> 423,087 0.51
Elianaelysia Pty Ltd <Angus Investment A/C> 404,272 0.48
Mr James Gardiner 400,000 0.48
Pacific Agrifoods Investments Pty Ltd 335,456 0.40
Mr Kwok Ching Chow + Ms Pik Yun Peggy Chan 310,000 0.37
RBC Investor Services Australia Nominees Pty Limited <BKCUST A/C> 281,372 0.34
Total 38,992,679 46.57 Total held by twenty largest ordinary shareholders as a percentage of this class is 46.57%
Elders. Live it.Annual Report 2015
96
For
per
sona
l use
onl
y
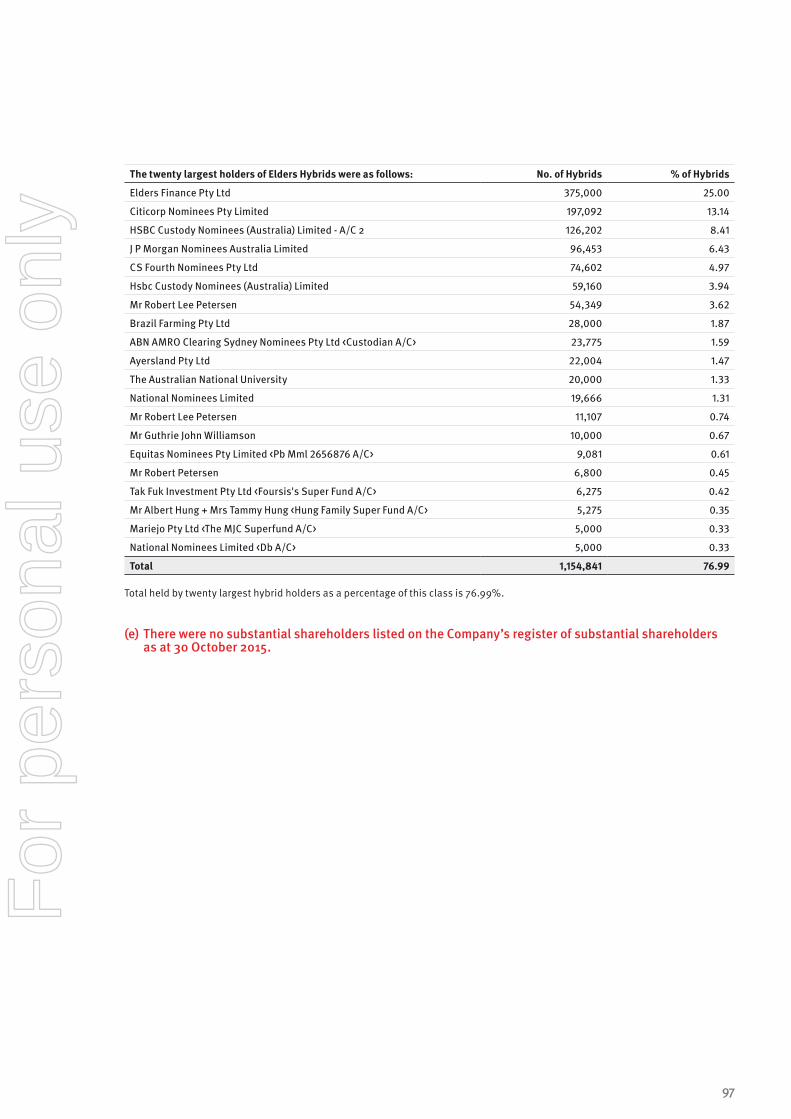
The twenty largest holders of Elders Hybrids were as follows: No. of Hybrids % of Hybrids
Elders Finance Pty Ltd 375,000 25.00
Citicorp Nominees Pty Limited 197,092 13.14
HSBC Custody Nominees (Australia) Limited - A/C 2 126,202 8.41
J P Morgan Nominees Australia Limited 96,453 6.43
CS Fourth Nominees Pty Ltd 74,602 4.97
Hsbc Custody Nominees (Australia) Limited 59,160 3.94
Mr Robert Lee Petersen 54,349 3.62
Brazil Farming Pty Ltd 28,000 1.87
ABN AMRO Clearing Sydney Nominees Pty Ltd <Custodian A/C> 23,775 1.59
Ayersland Pty Ltd 22,004 1.47
The Australian National University 20,000 1.33
National Nominees Limited 19,666 1.31
Mr Robert Lee Petersen 11,107 0.74
Mr Guthrie John Williamson 10,000 0.67
Equitas Nominees Pty Limited <Pb Mml 2656876 A/C> 9,081 0.61
Mr Robert Petersen 6,800 0.45
Tak Fuk Investment Pty Ltd <Foursis's Super Fund A/C> 6,275 0.42
Mr Albert Hung + Mrs Tammy Hung <Hung Family Super Fund A/C> 5,275 0.35
Mariejo Pty Ltd <The MJC Superfund A/C> 5,000 0.33
National Nominees Limited <Db A/C> 5,000 0.33
Total 1,154,841 76.99 Total held by twenty largest hybrid holders as a percentage of this class is 76.99%.
(e) There were no substantial shareholders listed on the Company’s register of substantial shareholders as at 30 October 2015.
97
For
per
sona
l use
onl
y
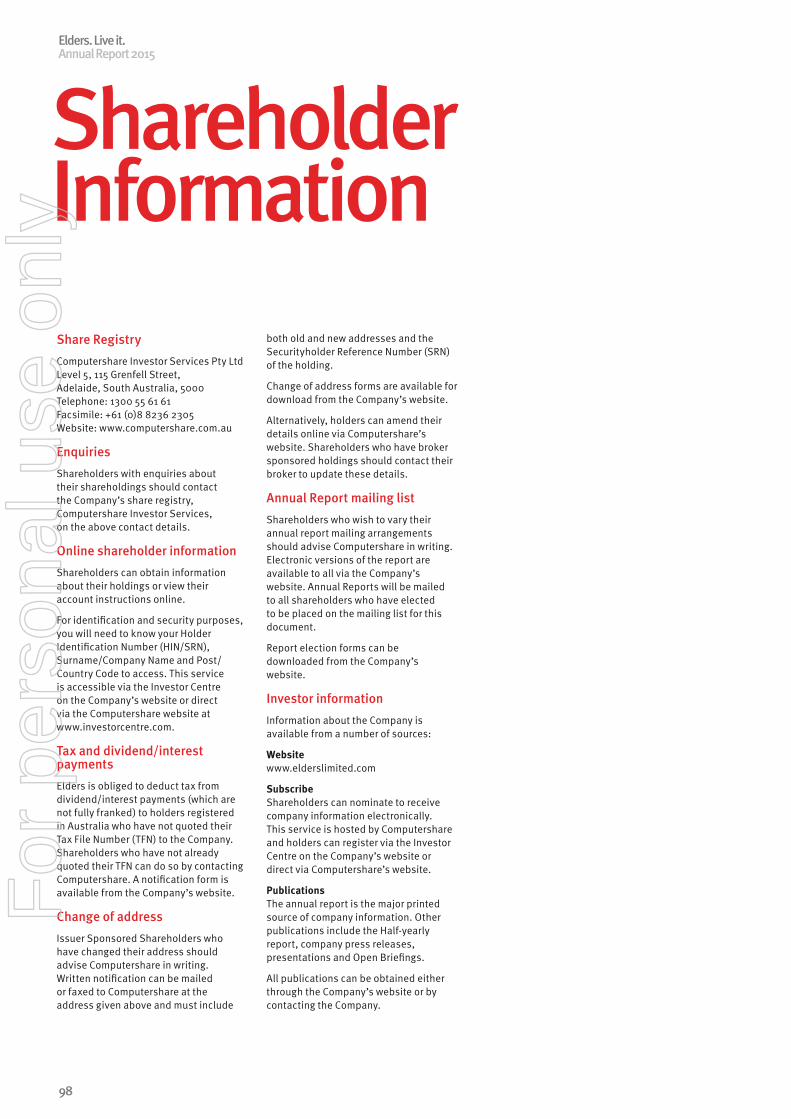
Share RegistryComputershare Investor Services Pty LtdLevel 5, 115 Grenfell Street,Adelaide, South Australia, 5000Telephone: 1300 55 61 61Facsimile: +61 (0)8 8236 2305Website: www.computershare.com.au
EnquiriesShareholders with enquiries about their shareholdings should contact the Company’s share registry, Computershare Investor Services, on the above contact details.
Online shareholder informationShareholders can obtain information about their holdings or view their account instructions online.
For identification and security purposes, you will need to know your Holder Identification Number (HIN/SRN), Surname/Company Name and Post/Country Code to access. This service is accessible via the Investor Centre on the Company’s website or direct via the Computershare website at www.investorcentre.com.
Tax and dividend/interest paymentsElders is obliged to deduct tax from dividend/interest payments (which are not fully franked) to holders registered in Australia who have not quoted their Tax File Number (TFN) to the Company. Shareholders who have not already quoted their TFN can do so by contacting Computershare. A notification form is available from the Company’s website.
Change of addressIssuer Sponsored Shareholders who have changed their address should advise Computershare in writing. Written notification can be mailed or faxed to Computershare at the address given above and must include
both old and new addresses and the Securityholder Reference Number (SRN) of the holding.
Change of address forms are available for download from the Company’s website.
Alternatively, holders can amend their details online via Computershare’s website. Shareholders who have broker sponsored holdings should contact their broker to update these details.
Annual Report mailing listShareholders who wish to vary their annual report mailing arrangements should advise Computershare in writing. Electronic versions of the report are available to all via the Company’s website. Annual Reports will be mailed to all shareholders who have elected to be placed on the mailing list for this document.
Report election forms can be downloaded from the Company’s website.
Investor informationInformation about the Company is available from a number of sources:
Website www.elderslimited.com
Subscribe Shareholders can nominate to receive company information electronically. This service is hosted by Computershare and holders can register via the Investor Centre on the Company’s website or direct via Computershare’s website.
Publications The annual report is the major printed source of company information. Other publications include the Half-yearly report, company press releases, presentations and Open Briefings.
All publications can be obtained either through the Company’s website or by contacting the Company.
Shareholder Information
Elders. Live it.Annual Report 2015
98
For
per
sona
l use
onl
y
COMPANY DIRECTORY DirectorsMr James H Ranck BS Econ, FAICD Chairman
Mr Mark C Allison BAgrSC, BEcon, GDM, FAICD
Mr James A Jackson BCom, FAICD
Mr Ian Wilton FCPA, FAICD, FCCA(UK)
Ms Robyn Clubb BEc, CA, F Fin, MAICD
SecretariesMr Peter G Hastings BA LLB GDLP
Ms Nina M Abbey BSc, MMgt
Registered OfficeLevel 10, 80 Grenfell Street Adelaide, South Australia, 5000
Telephone (08) 8425 4000 Facsimile (08) 8410 1597 Email [email protected] Website www.elderslimited.com
Share RegistryComputershare Investor Services Pty Ltd Level 5, 115 Grenfell Street Adelaide, South Australia, 5000
Telephone 1300 55 61 61 Facsimile +61 (0)8 8236 2305 Website www.computershare.com.au
AuditorsErnst & Young
BankersAustralia & New Zealand Banking Group
National Australia Bank
Coöperative Centrale Raiffeisen – Boerenleenbank (Rabobank Australia)
Stock Exchange ListingsElders Limited ordinary shares and subordinated convertible unsecured notes (Elders Hybrids) are listed on the Australian Securities Exchange under the ticker codes “ELD” and “ELDPA”
Trustee for Elders HybridsPerpetual Trustee Company Limited Level 12, 123 Pitt Street Sydney, NSW 2000
For
per
sona
l use
onl
y

Live it.
For
per
sona
l use
onl
y