1
Canada United States of America Mexico Guatemala Belize Honduras El Salvador Nicaragua Costa Rica Panama Cuba Jamaica Dom. Republic Puerto Rico (US) Trinidad and Tobago Venezuela Guyana Colombia Suriname French Guyana Ecuador Peru Bolivia Chile Argentina Uruguay Paraguay Brazil Galapagos Isl. (Ec.) Israel Jordan Egypt Saudi Arabia Kuwait Bahrain Qatar UAE Oman Yemen Ethiopia Somalia Djibouti Eritrea Kenya Tanzania Rwanda Burundi Uganda Congo (Dem. Rep.) Gabon Congo Cameroon Eq. Guinea S. Tomé and Principe B e n i n T o g o Ghana Nigeria Burkina Faso Côte d’Ivoire Mauritania Senegal Guinea Guinea Bissau Gambia Sierra Leone Liberia Morocco W. Sahara Canary Islands (Sp.) Cape Verde Angola Zambia Zimbabwe Botswana Namibia South Africa Lesotho Swaziland M o z a m b iqu e M a l a w i Madagascar Comoros Mauritius Réunion (Fr.) Seychelles Maldives Sudan Chad Libya Tunisia Algeria Niger Central African Rep. Mali Iraq Iran Uzbekistan Afghanistan Kyrgyzstan Tajikistan Pakistan India Nepal Bhutan Bangla- desh Myanmar Laos Thailand Cambodia China Mongolia Japan North Korea South Korea Taiwan Philippines Brunei Singapore Indonesia Papua New Guinea Vanuatu Australia East Timor New Zealand Sri Lanka Atlantic Ocean Hawaii Kazakhstan Sea of Japan South China Sea Pacific Ocean Tasman Sea Indian Ocean Arabian Sea Gulf of Bengal Atlantic Ocean Pacific Ocean Hudson Bay Baffin Bay Equator Tropic of Cancer Tropic of Capricorn Gulf of Mexico France Spain Portugal Italy Poland Norway Ireland Sweden Finland Nether- lands Belgium EU Austria Switzer- land Czech Rep. Slovakia Hungary Romania Turkey Greece Bulgaria Lebanon Syria Denmark Iceland United Kingdom Estonia Latvia Lithuania Belarus Russia Moldova Ukraine Georgia Azerbaijan Armenia Turkmenistan Croatia Slov. Bosnia Herz. Serbia Albania Mac. Mon. Kos. Greenland (Den.) Solomon Islands South Sudan L. Vietnam Sea of Okhotsk M a l a y s i a $2,928 $3,860 $1,028 1,825 $818 $636 $542 208 $535 978 101 1,127 $1,380 200 376 1,335 $992 $1,112 115 $1,171 $1,096 125 $760 99 57 105 252 $1,811 98 194 674 224 308 297 118 $630 83 57 270 266 $929 595 808 $569 193 62 473 286 113 218 113 181 96 113 170 155 152 157 167 101 58 61 70 91 464 1,332 $1,833 $1,065 $921 $880 $845 664 252 217 219 79 65 109 86 181 145 143 117 110 165 133 54 90 125 58 52 171 56 56 174 190 170 751 158 304 583 184 97 226 222 123 106 53 314 77 105 188 328 304 143 652 210 120 257 86 77 193 75 Grapefruit juice concentrate Grapefruit juice NFC 75 75 Grape juice concentrate Grape juice NFC 75 75 75 Pineapple juice concentrate Pineapple juice NFC 75 75 Orange juice NFC Orange juice concentrate 75 Apple juice concentrate Apple juice NFC 75 The minimum requirement for drawing a tradeline is 20,000 tonnes. Fruit juice concentrate is frozen concentrated juice, NFC is not-from-concentrate frozen juice. EU Poland 33 36 N B F Spain UK Italy Turkey Israel Au Moldova Ukraine 132 24 27 137 26 45 29 24 22 44 32 36 86 28 33 30 G 77 23 21 20 516 952 90 20 122 Canada 255 49 24 257 41 36 24 121 153 388 154 20 Costa Rica Mexico US Russia 51 South Korea 29 China 33 Philippines Thailand 60 49 Japan 24 South Africa 38 Australia Argentina Chile Brazil Poland Austria Italy Spain France Ireland United Kingdom Slovakia Czech Republic Hungary Greece Portugal Latvia Lithuania Slovenia Croatia Bulgaria from Ecuador to Egypt to Egypt to Saudi Arabia Ecuador to Belarus to Kazakhstan Costa Rica Costa Rica from: Colombia Ecuador Colombia Ecuador from: from: Costa Rica Costa Rica Cameroon Colombia Ecuador from: Cameroon Morocco Côte d’Ivoire from: Colombia Dominican Republic Costa Rica Ecuador South Africa South Africa South Africa South Africa India Panama South Africa South Africa from: North Sea Baltic Sea Netherlands Belgium Denmark Mediterranean Sea Atlantic Ocean Romania Sweden Germany $2,070 $962 $606 430 210 147 857 729 141 52 104 91 71 111 174 104 129 114 197 103 240 64 94 55 50 53 $544 $527 $1,715 $1,613 $1,067 114 57 122 71 243 173 167 327 $579 452 169 120 199 154 121 76 55 262 202 159 114 68 67 308 145 143 130 208 147 171 202 322 104 358 474 509 74 Total fresh fruit, excluding nuts, frozen fruits, and provisionally preserved (USD million) The minimum requirement for drawing a tradeline for total fresh fruit excluding nuts, frozen fruits, and provisionally preserved is USD 500 million, for bananas and plantains and citrus 100,000 tonnes, and for apples and grapes 50,000 tonnes. $1,000 150 150 150 Bananas and plantains (150,000 tonnes) Apples (150,000 tonnes) Grapes (150,000 tonnes) Citrus (150,000 tonnes) 150 Export and import to, from, and within the European Union 0 10 20 30 40 50 60 70 80 100 China India Brazil Mexico Spain Morocco Russia UAE US Italy UK Japan Germany percent 90 France South Africa Australia packaged unpackaged Packaged vs. unpackaged whole fresh fruit retail volume, 2016 Inputs (seeds or seedlings, fertilisers, etc.) Distribution Food retail Foodservice Primary production fruits 10% Fresh packaging, wholesale, trade & distribution Processing Feed & waste Fruit juice Frozen fruit Preserved fruit (mainly canned) Other processing (fresh-cut, dried, jams, etc.) 75% 2% 10% 13% 80% 10% 0 2,000 4,000 6,000 8,000 16,000 14,000 12,000 10,000 US India Belgium Russia Canada France Netherlands UK Germany China 2016 2006 0 2,000 4,000 6,000 8,000 10,000 Spain Belgium South Africa Ecuador Italy Mexico China Chile Netherlands US 2016 2006 USD million USD million 2016 2006 0 50 100 150 200 250 300 350 Morocco Belgium Netherlands US Chile Canada China Serbia Poland Mexico thousand tonnes 2016: 711,000 tonnes Mexico Germany Greece Netherlands Spain Argentina Philippines US Thailand China 0 500 750 250 1,000 1,250 1,500 thousand tonnes 2016 2006 ROW 2006: 434,000 tonnes 2016: 2.017m tonnes ROW 2006: 1.764m tonnes million tonnes thousand tonnes 600 500 200 300 100 400 0 2007 2017 3,500 3,000 2,500 2,000 1,500 1,000 500 0 2007 2017 Whole fresh fruit ROW Australia + NZ EU US ROW Australia + NZ EU US Preserved fruit 1,000 800 600 400 200 0 2007 2017 thousand tonnes ROW Australia + NZ EU US Frozen fruit million tonnes 80 60 40 20 0 2007 2017 ROW Australia + NZ EU US Fruit juice thousand tonnes 2,000 1,750 1,500 1,250 1,000 750 500 250 thousand tonnes 500 350 400 450 300 250 200 150 100 50 0 2006 2007 2008 2009 2010 2011 2012 2013 2014 2015 2016 ROW Spain Chile Netherlands Peru Mexico Israel New Zealand Dom. Republic US South Africa ROW Peru Spain US Canada Chile Mexico Poland Morocco Argentina Netherlands Global avocado exports by top 10 export countries, 2006-2016 Global blueberry and cranberry exports by top 10 export countries, 2006-2016 32% 30% 38% 5% 37% 4% 10% 11% 9% 40% 6% 26% Global production volume Global export volume million tonnes 1,000 800 600 400 200 0 2007 2012 2017 ROW Turkey US Brazil India China Philippines Italy Indonesia Spain Mexico Top 10 fruit-producing countries, 2007-2017 0 2006 2007 2008 2009 2010 2011 2012 2013 2014 2015 2016 0-49 50-99 ROW = Rest of world A bold printed country name indicates an export country. 200-1,295 State boundary EU boundary unknown uninhabited 150 150 150 Trade flows of specific fresh fruit (volume) Bananas and plantains (150,000 tonnes) Apples (150,000 tonnes) Grapes (150,000 tonnes) Citrus (150,000 tonnes) 150 The data in the map refers to 2016. The data for fresh fruit (excluding nuts, frozen fruit, and provisionally preserved) is presented in US dollars per year. The data for bananas and plantains, apples, grapes, and citrus is presented in metric tonnes per year. The minimum requirement for drawing a trade line for the total of fresh fruit is USD 500 million, for bananas and plantains and citrus 100,000 tonnes, and for apples and grapes 50,000 tonnes. The data in the map refers to 2016. The data for fresh fruit (excluding nuts, frozen fruit, and provisionally preserved) is presented in US dollars per year. The data for bananas and plantains, apples, grapes, and citrus is presented in metric tonnes per year. The minimum requirement for drawing a trade line for the total of fresh fruit is USD 500 million, for bananas and plantains and citrus 100,000 tonnes, and for apples and grapes 50,000 tonnes. Fruit production per country in kg/capita Trade flows of total fresh fruit, excluding nuts, frozen fruit, and provisionally preserved (value) USD 1,000 million $1,000 100-199 Intra-EU trade 150 100 50 million tonnes 0 5. Oranges 4. Grapes 3. Apples 2. Melons 1. Bananas and plantains 150 100 50 million tonnes 0 10. Peaches and nectarines 9. Pineapples 8. Pears 7. Mandarins 6. Mangoes Top 10 fruit types by global production volume, 2016 Legend Simplified fruit production chain Top 10 fresh fruit import countries, 2006 vs. 2016 World fruit juice concentrate and NFC trade Top 10 fresh fruit export countries, 2006 vs. 2016 Fruit market volume development by category, 2007 vs. 2017 Switzerland Sweden Austria Denmark US Germany Netherlands Norway Australia UK Finland Spain Italy France China Russia Poland Brazil 18 16 14 12 10 8 6 4 2 0 % organic income (x 1,000) 0 10 20 30 40 70 60 50 Note: Income is gross national income in purchasing power parity, expressed in current international USD. Share of organic fresh fruit and vegetable sales vs. income, 2016 Top 10 frozen fruit export countries, 2006 vs. 2016 Top 10 preserved fruit export countries, 2006 vs. 2016 The superfoods trend Belgium Czech Republic Utrecht, January 2018 Published Cover Photo Shutterstock Printing De Groot Drukkerij bv, Goudriaan, the Netherlands UN Comtrade, Food and Agriculture Organization of the United Nations, Euromonitor, Eurostat, World Bank, USDA, IFOAM, Rabobank, 2018. Sources Availability This map is published in line with Rabobank’s long-term commitment to international food and agribusiness. It is one of the products undertaken by RaboResearch Food & Agribusiness. Clients of Rabobank can obtain a copy of this map from their Relationship Manager. Copyright © Rabobank 2018. No reproduction of this map or any part thereof is permitted without prior consent of the copyright owners. The international and other boundaries in this map are taken from authoritative sources and are believed to be accurate as of the date of publication of this map. Disclaimer The information on this map is based upon or drawn from various authoritative sources and whilst all reasonable care has been taken in the preparation of this map no warranties can be given as to its accuracy and/or no reliance should be placed upon the same without further detailed inspection and survey. Therefore, the publishers cannot accept any liability or responsibility for any loss or damage and indeed would be grateful to receive notification of any errors or inconsistencies. Cartography G-O graphics, Wijk bij Duurstede & Kaartbeeld, Scherpenzeel, the Netherlands DeVink MapDesign, Leigh-on-Sea, United Kingdom RaboResearch Food & Agribusiness World Fruit Map far.rabobank.com Rabobank Group is a Netherlands-based international financial services provider focused on F&A, with operations in 42 countries. Visit far.rabobank.com to learn more about our knowledge and services in the various F&A sectors.

World Fruit Map - Rabobank

  • Upload
    others

  • View
    2

  • Download
    0

Embed Size (px)

Citation preview

Canada

United Statesof America

Mexico

Guatemala

Belize

HondurasEl Salvador

Nicaragua

CostaRica Panama

Cuba

Jamaica Dom.Republic

PuertoRico (US)

Trinidadand Tobago

Venezuela

Guyana

Colombia

Suriname

FrenchGuyana

Ecuador

Peru

Bolivia

Chile

Argentina

Uruguay

Paraguay

Brazil

GalapagosIsl. (Ec.)

Israel

Jordan

Egypt

SaudiArabia

Kuwait

BahrainQatar

UAEOman

Yemen

Ethiopia

Somalia

Djibouti

Eritrea

Kenya

Tanzania

RwandaBurundi

UgandaCongo

(Dem. Rep.)Gabon Congo

Cameroon

Eq. Guinea

S. Tomé andPrincipe

Beni

nTo

go

Ghana

Nigeria

BurkinaFaso

Côted’Ivoire

Mauritania

Senegal

GuineaGuinea Bissau

Gambia

SierraLeone

Liberia

Morocco

W. Sahara

CanaryIslands

(Sp.)

Cape Verde

Angola

Zambia

Zimbabwe

BotswanaNamibia

South Africa Lesotho

Swaziland

Moz

ambique

Malaw

i

Madagascar

Comoros

Mauritius

Réunion (Fr.)

Seychelles

Maldives

SudanChad

Libya

Tunisia

Algeria

Niger

CentralAfrican

Rep.

Mali

Iraq

Iran

Uzbekistan

Afghanistan

Kyrgyzstan

Tajikistan

PakistanIndia

Nepal Bhutan

Bangla-desh Myanmar

LaosThailand

Cambodia

China

Mongolia

Japan

NorthKorea

SouthKorea

Taiwan

Philippines

Brunei

Singapore

Indonesia PapuaNew

Guinea

Vanuatu

Australia

EastTimor

NewZealand

Sri Lanka

A t l a n t i c

O c e a n

Hawaii

Kazakhstan

S e ao f

J a p a n

S o u t hC h i n a

S e a

P a c i f i c

O c e a n

Ta s m a nS e a

I n d i a n

O c e a n

A r a b i a nS e a

G u l f o fB e n g a l

A t l a n t i c

O c e a n

P a c i f i c

O c e a n

H u d s o nB a y

B a f f i nB a y

Equator

Tropic of Cancer

Tropic of Capricorn

G u l fo f

M e x i c o

France

Spain

Portugal

Italy

Poland

Norway

Ireland

Sweden Finland

Nether-lands

Belgium EU

AustriaSwitzer-land

Czech Rep.Slovakia

HungaryRomania

Turkey

Greece

Bulgaria

Lebanon

Syria

Denmark

Iceland

UnitedKingdom

Estonia

LatviaLithuania

Belarus

Russia

Moldova

Ukraine

Georgia

AzerbaijanArmenia Turkmenistan

Croatia

Slov.BosniaHerz. Serbia

Albania Mac.

Mon.Kos.

Greenland(Den.)

SolomonIslands

SouthSudan

L.

Vietnam

S e ao f

O k h o t s k

M a l a y s i a

$2,928

$3,860$1,0281,825 $818

$636

$542208

$535978

101

1,127

$1,380

200

376

1,335

$992

$1,112

115

$1,171

$1,096

125

$76099

57

105252

$1,811

98194

674

224308

297118

$63083

57270

266$929

595

808

$569

19362 473

286113

218

113

181

96

113

170

155

152

157

167

101

58 61

70

91464

1,332

$1,833

$1,065

$921

$880

$845

664

252217

219

79

65109

86181

145

143 117

110165

133

54

90

12558

52

171

56

56

174 190

170

751

158304

583

184

97

226

222123

106

53

314

77

105 188

328

304143652

210

120257

86

77

193

75Grapefruit juice concentrate

Grapefruit juice NFC75

75Grape juice concentrate

Grape juice NFC75

75

75

Pineapple juice concentrate

Pineapple juice NFC

75

75Orange juice NFC

Orange juice concentrate75

Apple juice concentrate

Apple juice NFC75

The minimum requirement for drawing a tradeline is 20,000 tonnes.Fruit juice concentrate is frozen concentrated juice, NFC is not-from-concentrate frozen juice.

EU

Poland

33 36

NB

F

Spain

UK

Italy Turkey

Israel

Au MoldovaUkraine

132

2427

13726

45

29

2422

44

3236

8628

3330

G7723

21

20

516

952

90 20

122

Canada255 49

24

257

41 36 24 121 153 388 154 20

Costa Rica

Mexico

US

Russia51

SouthKorea29

China33

PhilippinesThailand

6049Japan

24

South Africa

38

Australia

Argentina

Chile

Brazil

Poland

Austria

ItalySpain

France

Ireland

UnitedKingdom

Slovakia

CzechRepublic

Hungary

Greece

Portugal

Latvia

Lithuania

SloveniaCroatia

Bulgaria

from Ecuadorto Egypt

to Egypt to Saudi Arabia

Ecuador toBelarus

toKazakhstan

Costa Rica

Costa Ricafrom:

ColombiaEcuador

Colombia

Ecuadorfrom:

from:

Costa Rica

Costa RicaCameroon

ColombiaEcuador

from:

Cameroon

Morocco

Côte d’Ivoirefrom:

Colombia

Dominican Republic

Costa Rica

Ecuador

South Africa

South Africa

South Africa

South AfricaIndia

Panama

South Africa

South Africa

from:

N o r t h

S e aB a l t i c

S e a

Netherlands

Belgium

Denmark

M e d i t e r r a n e a n S e a

A t l a n t i c

O c e a n

Romania

Sweden

Germany

$2,070

$962$606

430

210147

857

729

14152

104

91

71

111

174

104

129

114197

103

24064

94

5550

53

$544

$527$1,715

$1,613

$1,067

11457122

71

243

173

167

327

$579

452169

120199

154121 76 55

262

202

159

11468

67 308

145

143130

208147

171

202

322

104

358

474

509

74

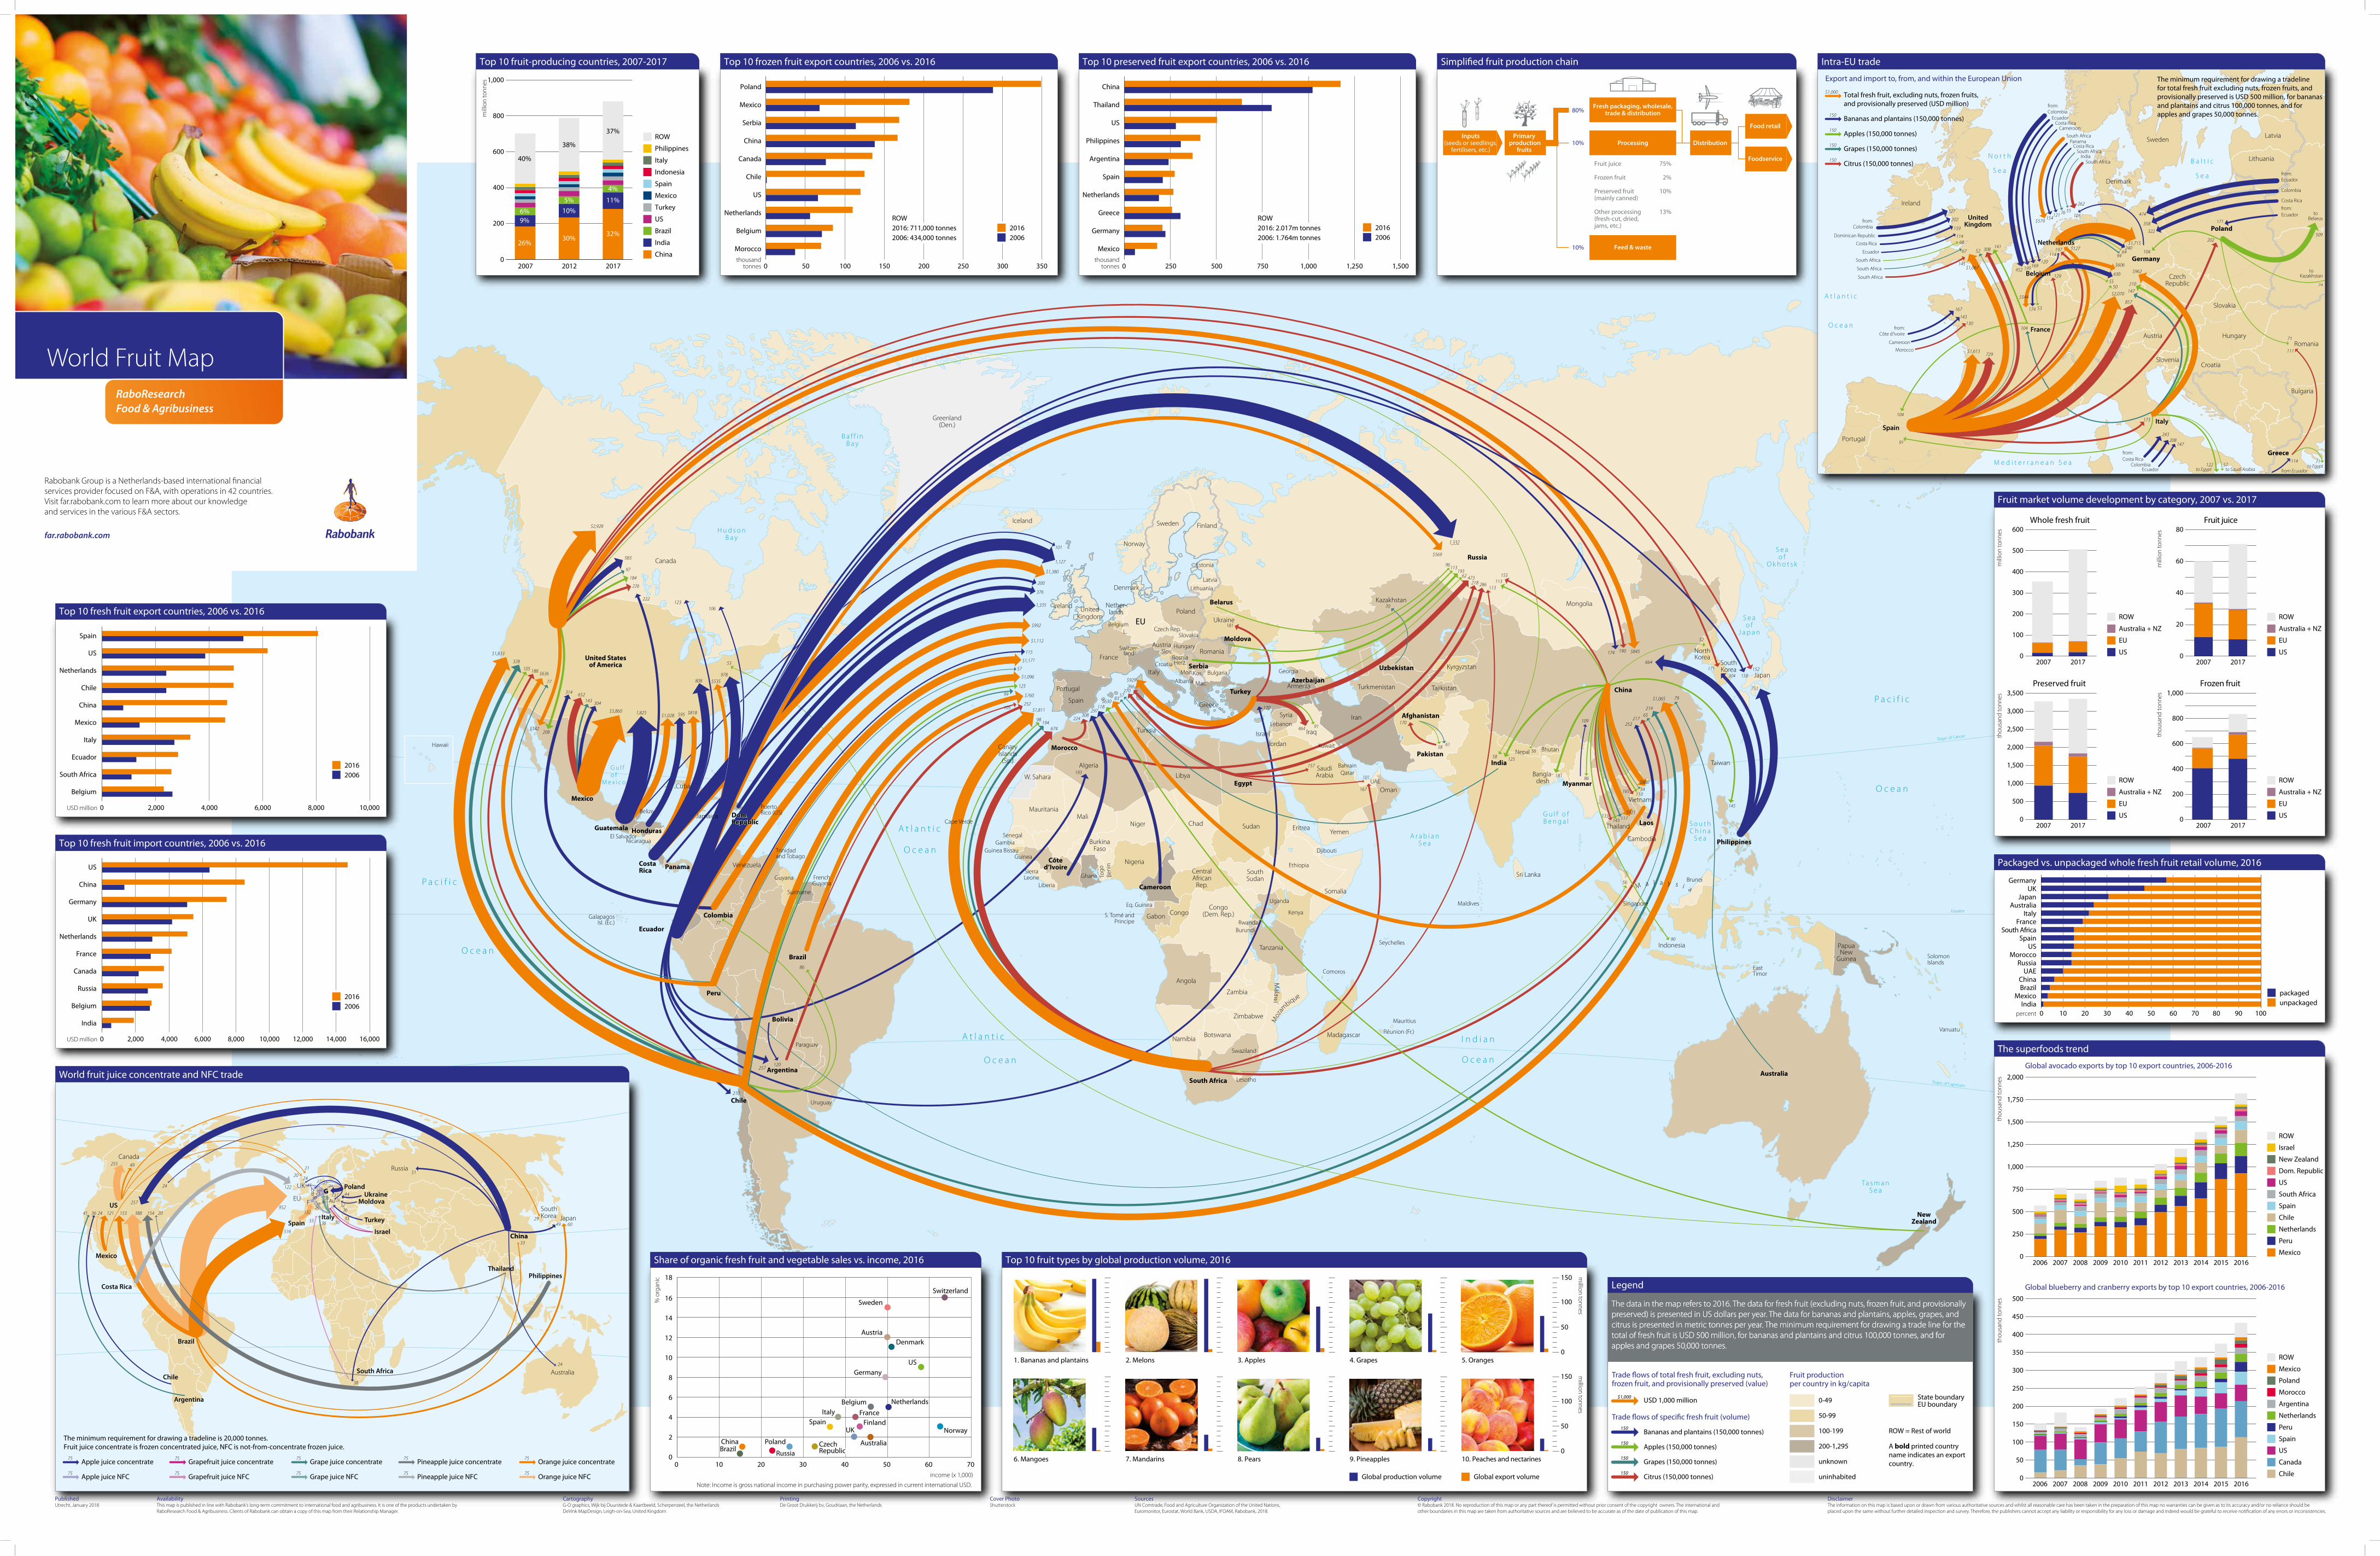
Total fresh fruit, excluding nuts, frozen fruits,and provisionally preserved (USD million)

The minimum requirement for drawing a tradelinefor total fresh fruit excluding nuts, frozen fruits, andprovisionally preserved is USD 500 million, for bananasand plantains and citrus 100,000 tonnes, and forapples and grapes 50,000 tonnes.

$1,000

150

150

150

Bananas and plantains (150,000 tonnes)

Apples (150,000 tonnes)

Grapes (150,000 tonnes)

Citrus (150,000 tonnes)150

Export and import to, from, and within the European Union

0 10 20 30 40 50 60 70 80 100

China

India

BrazilMexico

Spain

MoroccoRussia

UAE

US

Italy

UKJapan

Germany

percent 90

FranceSouth Africa

Australia

packagedunpackaged

Packaged vs. unpackaged whole fresh fruit retail volume, 2016

Inputs(seeds or seedlings,

fertilisers, etc.)Distribution

Food retail

Foodservice

Primary production

fruits10%

Fresh packaging, wholesale,trade & distribution

Processing

Feed & waste

Fruit juice

Frozen fruit

Preserved fruit(mainly canned)

Other processing(fresh-cut, dried, jams, etc.)

75%

2%

10%

13%

80%

10%

0 2,000 4,000 6,000 8,000 16,00014,00012,00010,000

US

India

Belgium

Russia

Canada

France

Netherlands

UK

Germany

China

2016200620162006

0 2,000 4,000 6,000 8,000 10,000

Spain

Belgium

South Africa

Ecuador

Italy

Mexico

China

Chile

Netherlands

US

2016200620162006

USD million

USD million

20162006

0 50 100 150 200 250 300 350

Morocco

Belgium

Netherlands

US

Chile

Canada

China

Serbia

Poland

Mexico

thousandtonnes

2016: 711,000 tonnes

Mexico

Germany

Greece

Netherlands

Spain

Argentina

Philippines

US

Thailand

China

0 500 750250 1,000 1,250 1,500thousand

tonnes

20162006

ROW

2006: 434,000 tonnes2016: 2.017m tonnesROW

2006: 1.764m tonnes

mill

ion

tonn

esth

ousa

nd to

nnes

600

500

200

300

100

400

02007 2017

3,500

3,000

2,500

2,000

1,500

1,000

500

02007 2017

Whole fresh fruit

ROW

Australia + NZ

EU

US

ROW

Australia + NZ

EU

US

Preserved fruit1,000

800

600

400

200

02007 2017

thou

sand

tonn

es

ROW

Australia + NZ

EU

US

Frozen fruit

mill

ion

tonn

es

80

60

40

20

02007 2017

ROW

Australia + NZ

EU

US

Fruit juice

thou

sand

tonn

es 2,000

1,750

1,500

1,250

1,000

750

500

250

thou

sand

tonn

es 500

350

400

450

300

250

200

150

100

50

0

2006 2007 2008 2009 2010 2011 2012 2013 2014 2015 2016

ROW

Spain

Chile

Netherlands

Peru

Mexico

Israel

New Zealand

Dom. Republic

US

South Africa

ROW

Peru

Spain

US

Canada

Chile

Mexico

Poland

Morocco

Argentina

Netherlands

Global avocado exports by top 10 export countries, 2006-2016

Global blueberry and cranberry exports by top 10 export countries, 2006-2016

32%30%

38%

5%

37%

4%

10%

11%

9%

40%

6%

26%

Global production volume Global export volume

mill

ion

tonn

es 1,000

800

600

400

200

02007 2012 2017

ROW

Turkey

US

Brazil

India

China

Philippines

Italy

Indonesia

Spain

Mexico

Top 10 fruit-producing countries, 2007-2017

0

2006 2007 2008 2009 2010 2011 2012 2013 2014 2015 2016

0-49

50-99

ROW = Rest of world

A bold printed country name indicates an exportcountry.

200-1,295

State boundaryEU boundary

unknown

uninhabited

150

150

150

Trade flows of specific fresh fruit (volume)

Bananas and plantains (150,000 tonnes)

Apples (150,000 tonnes)

Grapes (150,000 tonnes)

Citrus (150,000 tonnes)150

The data in the map refers to 2016. The data for fresh fruit (excluding nuts, frozen fruit, and provisionally preserved) is presented in US dollars per year. The data for bananas and plantains, apples, grapes, and citrus is presented in metric tonnes per year. The minimum requirement for drawing a trade line for the total of fresh fruit is USD 500 million, for bananas and plantains and citrus 100,000 tonnes, and for apples and grapes 50,000 tonnes.

The data in the map refers to 2016. The data for fresh fruit (excluding nuts, frozen fruit, and provisionally preserved) is presented in US dollars per year. The data for bananas and plantains, apples, grapes, and citrus is presented in metric tonnes per year. The minimum requirement for drawing a trade line for the total of fresh fruit is USD 500 million, for bananas and plantains and citrus 100,000 tonnes, and for apples and grapes 50,000 tonnes.

Fruit productionper country in kg/capita

Trade flows of total fresh fruit, excluding nuts,frozen fruit, and provisionally preserved (value)

USD 1,000 million$1,000

100-199

Intra-EU trade

150

100

50

million tonnes

05. Oranges4. Grapes3. Apples2. Melons1. Bananas and plantains

150

100

50

million tonnes

010. Peaches and nectarines9. Pineapples8. Pears7. Mandarins6. Mangoes

Top 10 fruit types by global production volume, 2016

Legend

Simplified fruit production chain

Top 10 fresh fruit import countries, 2006 vs. 2016

World fruit juice concentrate and NFC trade

Top 10 fresh fruit export countries, 2006 vs. 2016

Fruit market volume development by category, 2007 vs. 2017

Switzerland

Sweden

AustriaDenmark

USGermany

Netherlands

Norway

Australia

UKFinlandSpain

Italy France

China

Russia

PolandBrazil

18

16

14

12

10

8

6

4

2

0

% o

rgan

ic

income (x 1,000)

0 10 20 30 40 706050

Note: Income is gross national income in purchasing power parity, expressed in current international USD.

Share of organic fresh fruit and vegetable sales vs. income, 2016

Top 10 frozen fruit export countries, 2006 vs. 2016 Top 10 preserved fruit export countries, 2006 vs. 2016

The superfoods trend

Belgium

CzechRepublic

Utrecht, January 2018Published Cover Photo

ShutterstockPrintingDe Groot Drukkerij bv, Goudriaan, the Netherlands UN Comtrade, Food and Agriculture Organization of the United Nations,

Euromonitor, Eurostat, World Bank, USDA, IFOAM, Rabobank, 2018.

SourcesAvailabilityThis map is published in line with Rabobank’s long-term commitment to international food and agribusiness. It is one of the products undertaken byRaboResearch Food & Agribusiness. Clients of Rabobank can obtain a copy of this map from their Relationship Manager.

Copyright© Rabobank 2018. No reproduction of this map or any part thereof is permitted without prior consent of the copyright owners. The international andother boundaries in this map are taken from authoritative sources and are believed to be accurate as of the date of publication of this map.

DisclaimerThe information on this map is based upon or drawn from various authoritative sources and whilst all reasonable care has been taken in the preparation of this map no warranties can be given as to its accuracy and/or no reliance should beplaced upon the same without further detailed inspection and survey. Therefore, the publishers cannot accept any liability or responsibility for any loss or damage and indeed would be grateful to receive notification of any errors or inconsistencies.

CartographyG-O graphics, Wijk bij Duurstede & Kaartbeeld, Scherpenzeel, the NetherlandsDeVink MapDesign, Leigh-on-Sea, United Kingdom

RaboResearchFood & Agribusiness

World Fruit Map

far.rabobank.com

Rabobank Group is a Netherlands-based international financialservices provider focused on F&A, with operations in 42 countries.Visit far.rabobank.com to learn more about our knowledge and services in the various F&A sectors.