Embed Size (px)
Citation preview
Thomas Ramsauer
GENE EXPRESSION PROFILING OF CYTOKINE
ACTIVATED T-CELLS
MASTER THESIS
Conducted at the Institute for Biomedical Engineering, University ofTechnology, Graz, Austria and the
Institut National de la Santé et de la Recherche Médical Unité 255, Centrede Recherches Biomédicales des Cordeliers, Paris, France
Supervisor (Graz): ao. Univ-Prof. Dipl.-Ing. Dr. techn. Zlatko Trajanoski
Supervisor (Paris): Jérôme Galon, Ph.D.
Graz, January 2003

FOR MY FAMILY
Abstract
Understanding the regulatory mechanisms of immune cells is a major topic in immunol-
ogy research today. With high throughput methods like cDNA microarray technology it
is possible to collect large amount of data and to gain insights into cellular regulatory
mechanisms. T-cells are the major producers of cytokines and they also possess the cor-
responding cytokine receptors. Class 1 cytokine receptors share the � chain which is a
signal transducing subunit that activates the Janus kinase (JAK). Signal transducer and
activator of transcription (STAT) molecules get phosphorylated and act inside the nucleus
as transcription factors.
The aim of this study was to perform gene expression studies of cytokine activated T-
cells. Class 1 cytokine receptor activating cytokines like IL-2, IL-4, IL-7 and IL-15 were
utilized to stimulate the T-cells. Isolated mRNA from unstimulated reference T-cells and
from cytokine stimulated T-cells were used for DNA microarray analysis with cDNA
slides that have 10.000 genes spotted. The obtained data, after scanning and raw data
analysis, was imported in a database management system, where the data was filtered and
sorted. Sophisticated clustering software was utilized to group similar gene expression ra-
tios together. Comprehensive public databases for functional analyses like the GO (Gene
Ontology) database were used to append additional information to the genes. Immuno-
logical methods were used to analyze T-cell purification, activation and proliferation.
It was shown that cytokine stimulation alters gene expression of T-cells, cell-proliferation
related genes were identified to be regulated and it was demonstrated that genes with
related function cluster together. This study shows the feasibility of using high-throughput
technologies for identifying cytokine induced genes in T-cells and opens new paths to
analyze regulated but yet uncharacterized genes.
Keywords: immune system, T-cell, � chain cytokine receptor family, cDNA microarray,
gene expression analyses
Kurzfassung
Die regulatorischen Mechanismen von Immunzellen zu verstehen ist ein Hauptthema der
heutigen immunologischen Forschung. Mit Hochdurchsatz Methoden wie der cDNA Mi-
croarray Technologie ist es möglich viele Daten zu sammeln, auszuwerten und Einblicke
in die zellulären Regulationsmechanismen zu gewinnen. T-Zellen sind die Hauptpro-
duzenten von Zytokinen und sie besitzen auch die entsprechenden Rezeptoren. Klasse 1
Zytokinrezeptoren teilen sich die � Kette, welche eine Signalweiterleitungseinheit darstellt
und die Janus Kinase (JAK) aktiviert. Signal transducer and activator of transcription
(STAT) Moleküle werden phosphoryliert und agieren innerhalb des Nukleus als Tran-
skriptionsfaktoren.
Das Ziel der vorliegenden Arbeit war die Durchführung von Genexpressionsstudien von
Zytokin aktivierten T-Zellen. Klasse 1 Zytokin Rezeptor aktivierende Zytokine wie IL-2,
IL-4, IL-7 und IL-15 wurden zur Stimulierung der T-Zellen verwendet. Isolierte mRNA
von unstimulierten Referenz T-Zellen und Zytokin stimulierten T-Zellen wurde für die
DNA Microarray Analysen mit cDNA chips, auf denen 10.000 Gene gespottet waren,
verwendet. Die erhaltenen Daten wurden nach dem Scannen und der Rohdatenanalyse
in ein Datenbank Management System importiert, wo sie gefiltert und sortiert wurden.
Spezifische Cluster-Software wurde eingesetzt um ähnliche Genexpressionsverhältnisse
zu gruppieren. Umfangreiche öffentliche Datenbanken für funktionelle Analysen, wie
die GO (Gene Ontology) Datenbank, wurden benutzt um zusätzliche Informationen der
Gene zu erhalten. Zur Untersuchung der T-Zell Reinigung, Aktivierung und Proliferation
wurden immunologische Methoden herangezogen.
Es wurde gezeigt, dass eine Zytokinstimulierung die Genexpression von T-Zellen verän-
dert, Gene, die im Zusammenhang mit Proliferation stehen, reguliert werden und Gene
mit ähnliche Funktionen zusammenclustern. Diese Studie zeigt, dass mit Hochdurch-
satz Technologien Zytokin induzierte Gene in T-Zellen identifiziert werden können und
sie eröffnet neue Wege um regulierte aber bisher noch nicht charakterisierte Gene zu
analysieren.
Schlüsselwörter: Immunsystem, T-Zelle, � -c Zytokinrezeptorfamilie, cDNA microarray,
Genexpressionsanalysen
Contents
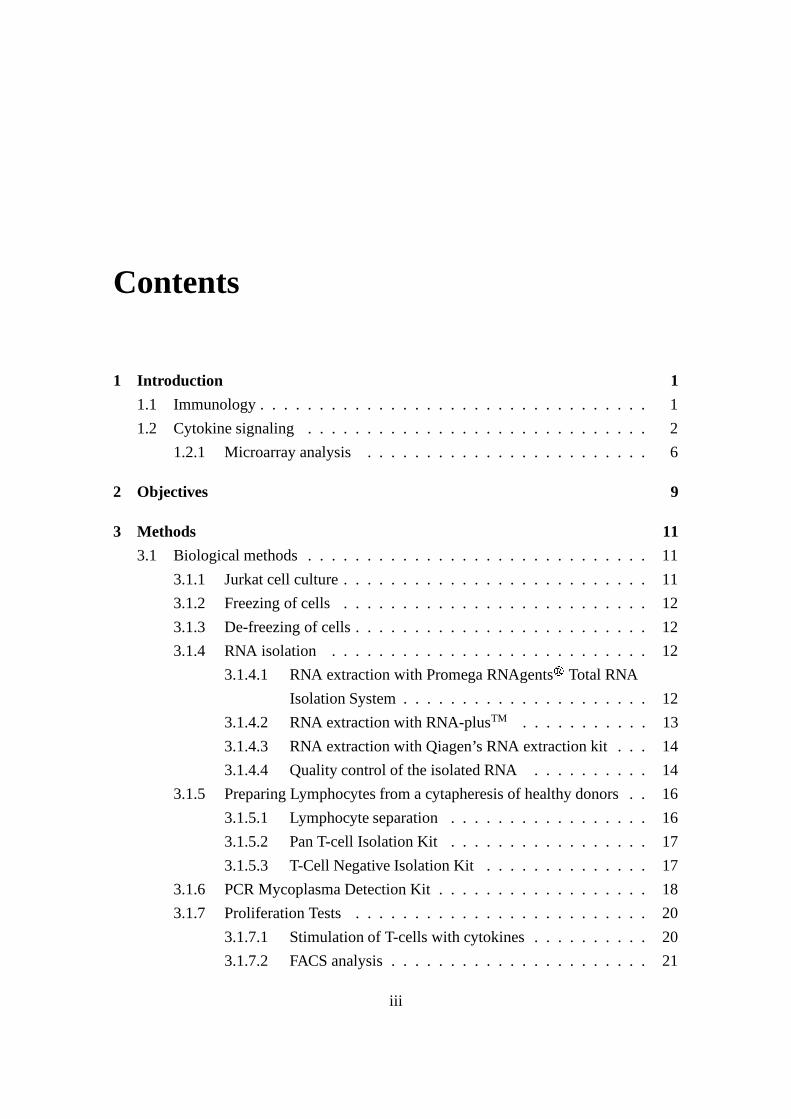
1 Introduction 1
1.1 Immunology . . . . . . . . . . . . . . . . . . . . . . . . . . . . . . . . . 1
1.2 Cytokine signaling . . . . . . . . . . . . . . . . . . . . . . . . . . . . . 2
1.2.1 Microarray analysis . . . . . . . . . . . . . . . . . . . . . . . . 6
2 Objectives 9
3 Methods 11
3.1 Biological methods . . . . . . . . . . . . . . . . . . . . . . . . . . . . . 11
3.1.1 Jurkat cell culture . . . . . . . . . . . . . . . . . . . . . . . . . . 11
3.1.2 Freezing of cells . . . . . . . . . . . . . . . . . . . . . . . . . . 12
3.1.3 De-freezing of cells . . . . . . . . . . . . . . . . . . . . . . . . . 12
3.1.4 RNA isolation . . . . . . . . . . . . . . . . . . . . . . . . . . . 12
3.1.4.1 RNA extraction with Promega RNAgents�
Total RNA
Isolation System . . . . . . . . . . . . . . . . . . . . . 12
3.1.4.2 RNA extraction with RNA-plusTM . . . . . . . . . . . 13
3.1.4.3 RNA extraction with Qiagen’s RNA extraction kit . . . 14
3.1.4.4 Quality control of the isolated RNA . . . . . . . . . . 14
3.1.5 Preparing Lymphocytes from a cytapheresis of healthy donors . . 16
3.1.5.1 Lymphocyte separation . . . . . . . . . . . . . . . . . 16
3.1.5.2 Pan T-cell Isolation Kit . . . . . . . . . . . . . . . . . 17
3.1.5.3 T-Cell Negative Isolation Kit . . . . . . . . . . . . . . 17
3.1.6 PCR Mycoplasma Detection Kit . . . . . . . . . . . . . . . . . . 18
3.1.7 Proliferation Tests . . . . . . . . . . . . . . . . . . . . . . . . . 20
3.1.7.1 Stimulation of T-cells with cytokines . . . . . . . . . . 20
3.1.7.2 FACS analysis . . . . . . . . . . . . . . . . . . . . . . 21
iii
CONTENTS iv
3.2 Computational analysis . . . . . . . . . . . . . . . . . . . . . . . . . . . 21
3.2.1 Microarrays . . . . . . . . . . . . . . . . . . . . . . . . . . . . . 22
3.2.2 Data analysis . . . . . . . . . . . . . . . . . . . . . . . . . . . . 22
3.2.3 Clustering gene expression ratios . . . . . . . . . . . . . . . . . 24
3.2.3.1 Hierarchical clustering (HCL) . . . . . . . . . . . . . . 25
3.2.3.2 Principal component analysis (PCA) . . . . . . . . . . 25
3.2.4 GO - Gene Ontology . . . . . . . . . . . . . . . . . . . . . . . . 25
4 Results 27
4.1 Lymphocyte Preparation and T-cell purification . . . . . . . . . . . . . . 27
4.2 Mycoplasma PCR Test . . . . . . . . . . . . . . . . . . . . . . . . . . . 28
4.3 RNA isolation . . . . . . . . . . . . . . . . . . . . . . . . . . . . . . . . 29
4.4 FACS . . . . . . . . . . . . . . . . . . . . . . . . . . . . . . . . . . . . 29
4.5 Data management and analysis . . . . . . . . . . . . . . . . . . . . . . . 32
4.5.1 Data interpretation . . . . . . . . . . . . . . . . . . . . . . . . . 34
4.5.2 Database filtering . . . . . . . . . . . . . . . . . . . . . . . . . . 38
4.5.3 GO database . . . . . . . . . . . . . . . . . . . . . . . . . . . . 40
4.5.4 Data consistency check . . . . . . . . . . . . . . . . . . . . . . . 41
4.6 Microarray data clustering . . . . . . . . . . . . . . . . . . . . . . . . . 41
4.6.1 Cluster analysis with Genesis . . . . . . . . . . . . . . . . . . . 41
4.6.2 HCL . . . . . . . . . . . . . . . . . . . . . . . . . . . . . . . . 41
4.6.2.1 Genes uniquely/commonly up- or downregulated . . . 42
4.6.2.2 Comparison between cytokines and glucocorticoids . . 44
4.6.2.3 Combination of GO database and hierarchical clustering 44
5 Discussion 47
Bibliography 51
List of Figures
1.1 CFSE passes cell membrane spontaneously . . . . . . . . . . . . . . . . 3
1.2 FACS output of CFSE labeled cells . . . . . . . . . . . . . . . . . . . . . 4
1.3 Class 1 cytokine receptor family . . . . . . . . . . . . . . . . . . . . . . 5
1.4 Gene expression overview . . . . . . . . . . . . . . . . . . . . . . . . . 6
1.5 cDNA microarray overview . . . . . . . . . . . . . . . . . . . . . . . . . 8
3.1 Bioanalyzer 2100 from Agilent Technologies . . . . . . . . . . . . . . . 15
3.2 Databaseschema . . . . . . . . . . . . . . . . . . . . . . . . . . . . . . . 23
4.1 FACS T-cell purification . . . . . . . . . . . . . . . . . . . . . . . . . . 28
4.2 Mycoplasm PCR test with Jurkat T-cell culture . . . . . . . . . . . . . . 29
4.3 Jurkat RNA isolation Agarose gel . . . . . . . . . . . . . . . . . . . . . 30
4.4 Quality and quantity test of Jurkat T-cell RNA with Bioanalyzer 2100 . . 31
4.5 Biosizing software’s artificial electropherogram . . . . . . . . . . . . . . 32
4.6 FACS T-cell proliferation analysis . . . . . . . . . . . . . . . . . . . . . 33
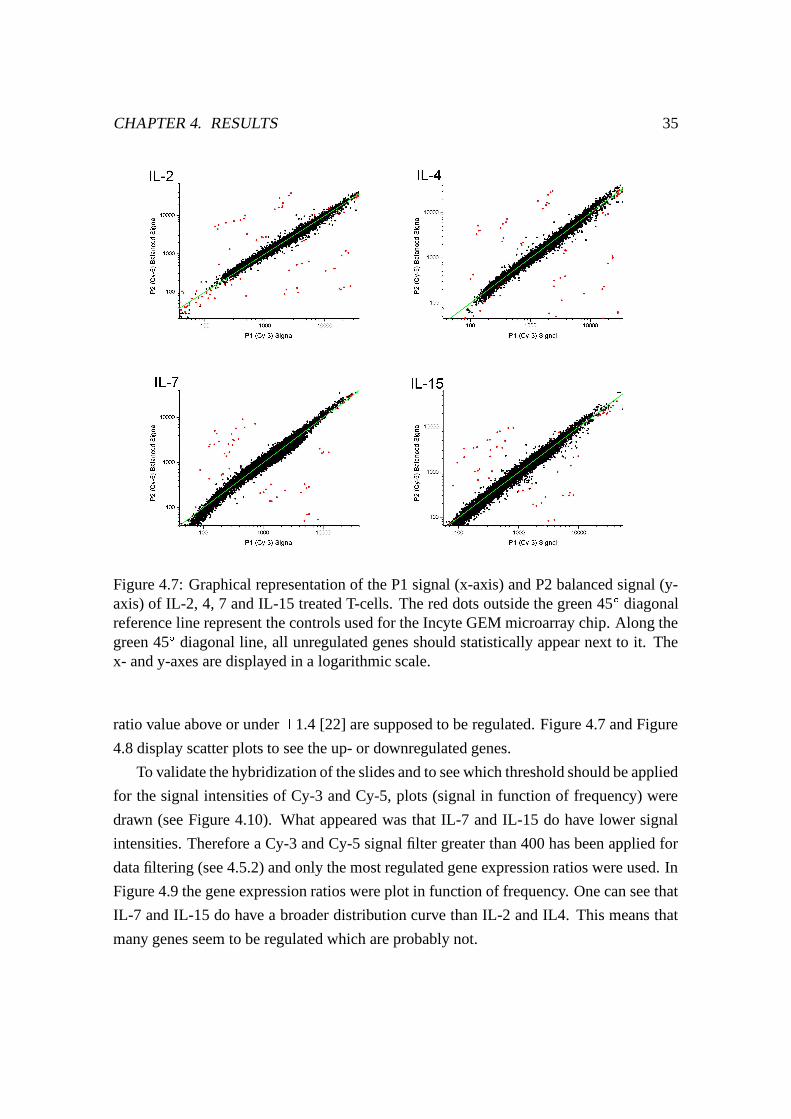
4.7 Function of P1 signal against P2 Balanced signal . . . . . . . . . . . . . 35
4.8 MA-plot of microarray data . . . . . . . . . . . . . . . . . . . . . . . . . 36
4.9 Ratio Histogram plots . . . . . . . . . . . . . . . . . . . . . . . . . . . . 37
4.10 Signal in function of frequency plots . . . . . . . . . . . . . . . . . . . . 37
4.11 Total number of genes regulated . . . . . . . . . . . . . . . . . . . . . . 38
4.12 Genes uniquely regulated in comparison to different cytokine stimulation 39
4.13 HCL cluster analysis with Genesis of IL-2, IL-4, IL-7 and IL-15 T-cell
cytokine stimulation . . . . . . . . . . . . . . . . . . . . . . . . . . . . . 43
4.14 Comparison of cytokine and glucocorticoid stimulation . . . . . . . . . . 45
v
vi
Glossary
Antibody A protein that is produced in response to an antigen.
Antigen A substance (e.g. a virus or bacterium) that causes an immune system response.
APC (allophycocyanin) is a fluorescent dye used for FACS analysis.
ATP Adenosine triphosphate is the most important molecule in all living things since it
serves as the currency for energy in biological systems and is used to drive chemical
reactions.
Bioanalyzer The Agilent 2100 bioanalyzer improves analysis of DNA, RNA, proteins
and cells with the lab-on-a-chip technology.
BLAST/NCBI Basic Local Alignment Search Tool is a set of similarity search programs
designed to explore all of the available sequence databases regardless of whether the
query is protein or DNA.
BSA Bovine serum albumin.
cDNA DNA synthesized from an RNA template using reverse transcriptase (copy DNA).
CD Cluster of differentiation or cluster determinant is a cell surface marker used to
characterize cells.
Cell line is a cultured cell type that can be reproduced indefinitely (immortalized).
vii
CFSE 5-(and-6)-carboxyfluorescein diacetate, succinimidyl ester is a
fixable-cell-permeant, fluorescein-based tracer for very long-term cell labeling.
Cy-3, Cy-5 Fluorescent dyes (Cy-3 green, Cy-5 red) used for labeling RNA in
microarray experiments.
Cytokine In immunology, any of many soluble molecules that cells produce to control
reactions between cells.
DMSO Dimethyl sulfoxide is a substance used as a cryoprotectant to protect cultured
animal cells from the damaging effects of cryopreservation (storage by freezing). It is
also used in transfection to increase the chances that the target eukaryotic cells will
actually pick up, incorporate and express the DNA.
DNA Deoxyribonucleic acid is the molecule that encodes genetic information. DNA is a
double-stranded molecule. The four nucleotides in DNA contain the bases: adenine (A),
guanine (G), cytosine (C), and thymine (T). In nature, base pairs form only between A
and T and between G and C.
EDTA Ethylene diamine tetra acetate is a chemical that is used to remove all traces of
magnesium and calcium ions from a solution in order to control unwanted side reactions
with these metals during a laboratory process.
Electrophoresis is a method of separating large molecules (such as DNA fragments or
proteins) from a mixture of similar molecules. Agarose and acrylamide gels are the
media commonly used for electrophoresis of proteins and nucleic acids.
EST Expressed sequence tags are short fragments of an expressed sequence, which
serves as a landmark for gene mapping. ESTs are sequence tagged sites derived from
cDNAs.
viii
FACS The fluorescence-activated cell sorting technique applied to analysis and/or
separation of cells by their physical and biological characteristics.
FCS Fetal calf serum.
Ficoll A ficoll gradient is a density gradient with synthetic sucrose polymer in solution.
It is often used to separate different types of cells from each other during the process of
sedimentation (lymphocyte separation).
FITC Fluoresceinisocyanat or -isothiocyanat is a fluorescent dye used for FACS
analysis.
GEM Gene expression microarray.
Glucocorticoid is one of the three groups of steroid hormones which are produced by
the adrenal cortex. These hormones decrease the inflammatory response.
GO Gene Ontology database developed by the Gene Ontology Consortium.
HCL Hierarchical clustering.
HGP Human genome project.
Ig (immunglobulin) is an antibody or a heavy or light polypeptide chain that is part of an
antibody molecule.
IL (interleukin) Any of a group of protein factors which are produced by T lymphocytes
and macrophages in the presence of antigens or mitogens. They cause the T lymphocytes
to activate and proliferate.
ix
Immune system The cells and tissues which are responsible for recognizing and
attacking foreign microbes and substances in the body.
JAK Janus kinase belong to the protein tyrosine kinases and they interact with the
cytosolic tail of the receptor molecules.
Jurkat is a T-cell line often used as a model cell line in immunological studies.
Mitogen A substance which is able to induce mitosis of certain eukaryotic cells.
Mitosis The process of nuclear division in eukaryotic cells that produces two daughter
cells from one mother cell.
mRNA messenger RNA serves as a template for protein synthesis.
Mycoplasma Very tiny microorganisms which are able to slip through most filters and
are therefore often found as contaminating organisms in culture preparations.
Mycoplasma contamination is an important problem in biotechnology.
PBMC Peripheral blood mononuclear cells.
PBS Phosphate buffered saline.
PCA Principal component clustering.
PCR The polymerase chain reaction is a method for amplifying a DNA base sequence
using a heat- stable polymerase and two primers, one complementary to the (+)-strand at
one end of the sequence to be amplified and the other complementary to the (- )-strand at
the other end.
x
PE (phycoerythrin) is a fluorescent dye used for FACS analysis.
PerCP (peridinin chlorophyll protein) is a fluorescent dye used for FACS analysis.
Perl is a practical extraction and report language and is a powerful interpreter language
which is available for many computer platforms.
PFA Paraformaldehyde is used to fix the cells for FACS analysis.
PHA Phytohemagglutinin is a lectin derived from plants and a very effective T-cell
mitogen.
Polymerase (for DNA or RNA) Polymerases are enzymes that catalyze the synthesis of
nucleic acids on preexisting nucleic acid templates, assembling RNA from
ribonucleotides or DNA from deoxyribonucleotides.
Proliferation cell division.
RNA Ribonucleic acid is a chemical found in the nucleus and cytoplasm of cells. It
plays an important role in protein synthesis and other chemical activities of the cell. The
structure of RNA is similar to that of DNA. There are several classes of RNA molecules,
including messenger RNA, transfer RNA, ribosomal RNA, and other small RNA’s, each
serving a different purpose.
RPMI - 1640 is a cell culturing medium and was developed by Moore et. al. at Roswell
Park Memorial Institute.
STAT Signal transducer and activator of transcription. These molecules play an essential
role in the transduction of cytokine signals.
TBE Tris-Borate-EDTA buffer.
T-cell The T lymphocyte is a type of cell produced by the thymus that plays a major role
in immune reactions.
TCR The T-cell receptor is antigen-specific receptor on the surface of T lymphocytes.
TIGR The Institute for Genomic Research.
Chapter 1
Introduction
1.1 Immunology
The immune system prevents the human body from all foreign agents which may harm the
body. Research on immunology is being done since the late 18th century, when E. v. Jen-
ner started vaccination with cowpox against the human form called variola or smallpox.
He was one of the first scientists who worked in the field of immunology. In the late 19th
century, L. Pasteur continued with those vaccination experiments and immunized success-
fully sheep and cattle against anthrax. The austrian pathologist Karl Landsteiner described
the AB0 blood groups in 1900 and the immunochemical basis of antigenic specificity. He
got the Nobel Prize in medicine for this discovery in 1930. Many milestones followed in
the field of immunology research.
In 1944, DNA has been discovered to be the basis of genetic information and in 1953
James Watson and Francis Crick [54] proposed the double helical structure of DNA. A
few years later the first recombinant DNA molecule has been created by Paul Berg [28]
who got the Nobel Prize in 1980 for his fundamental studies of the biochemistry of nucleic
acids. In 1977 Allan Maxam, Walter Gilbert [33] and Frederick Sanger [42] developed
independently new methods for DNA sequencing.
The bioinformatic age began soon after sequences of different organisms were avail-
able. Biological methods for DNA sequencing developed more and more and because of
this huge amount of upcoming data, researchers had to look for new technologies to deal
with this. Software for sequence analyses has been developed [45]. Many competence
centers, like the National Center of Biotechnology Information (NCBI, USA) 1988 [36]
1
CHAPTER 1. INTRODUCTION 2
and the European partner EMBL & EBI European Molecular Biology Laboratory and
European Bioinformatics Institute (1994) [14], have been founded. General and special-
ized databases were formed [40]. In 1995, Fleischmann et al. [16] closed for the first
time in history the last gaps of the 1.8 Mb genome sequence of the free living organism
Haemophilus influenzae at Craig Venter’s The Institute of Genomic Research (TIGR) [52]
and published the results. Also in 1995, Shena et al. [43] introduced the first time cDNA
microarrays with 45 Arabidopsis genes and 3 control genes from other organisms.
The year 2001 was a turning point in life science because on February, 15th the HGP
(Human Genome Project) consortium published its human sequence working drafts in
Nature [26, 27] and Celera published its draft in Science [53]. Today many researchers
use the new microarray technology for analyzing gene expression of thousands of genes
in parallel of certain cells. With microarray technology it is possible to explore expression
patterns of the whole genome at once. 10.000 genes and more can be spotted on one mi-
croscope glass slide. The technology is comparable with other hybridizing experiments
like northern blots, but the amount of information is much higher. Because many different
components are involved in the regulation and stimulation of the immune system, scien-
tists have to search for tools that allow to view hundreds of genes which are regulated and
expressed in parallel.
1.2 Cytokine signaling
There are two major branches of immunity - the innate, like skin barriers or mucous mem-
branes, and the acquired immunity which is more specialized. The latter has again two
branches. One is the humoral and the other one is the cellular branch. B-cells and the pro-
duced antibodies belong to the humoral, T-cells which recognize foreign antigen through
the T-cell receptor (TCR) belong to the cellular immune system. These cells produce low
molecular weight proteins called cytokines. Secreted cytokines from CD4+ T-cells (also
called lymphokines) can take effect on themselves (autocrine), on other cells (paracrine)
as well as distantly on organs (endocrine, comparable with hormones). Naive CD4+ T-
cells will differentiate into T-helper cells which are the major producers of cytokines
beside macrophages.
Cytokines are soluble mediators which are necessary for the regulation and devel-
opment of immune cells. The target cells which must possess specific receptors will
CHAPTER 1. INTRODUCTION 3
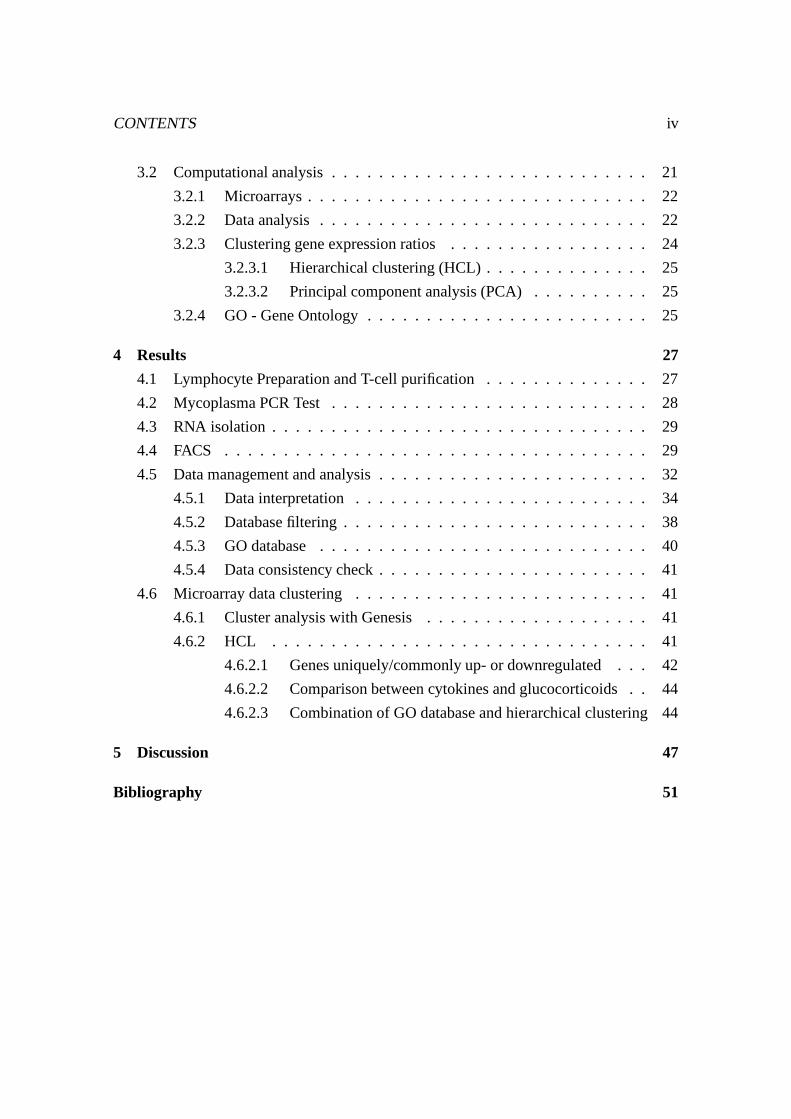
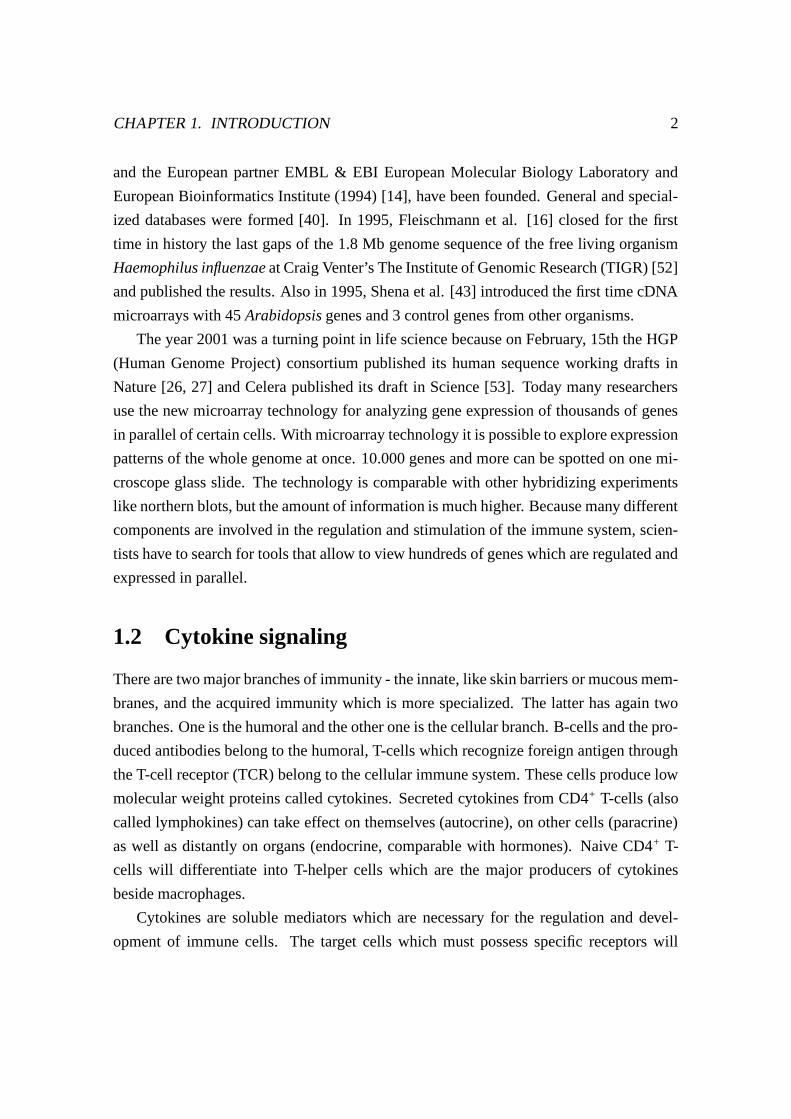
Figure 1.1: CFSE is able to pass the cell membrane spontaneously. Esterases in thecell cytosol modify the chemical structure and the amino terminal end of a protein bindsirreversibly to CFSE [34]
respond to cytokine stimulation in many different ways but finally in different gene ex-
pression. Incyte Genomics did time-course expression experiments with peripheral blood
mononuclear cells (PBMCs) and stimulated these with phorbol myristate acetate (PMA)
and ionomycin [25]. They could show clearly that stimulation with these agents alter the
gene expression level of different genes.
Cytokines may have pleiotropic, redundant and also antagonistic function. That means
that one cytokine may act on different cells (pleiotropic), different cytokines may act on
one cell and have similar effects (redundancy) and different cytokines may act against
each other on the target cell (antagonism). As cytokines are very important for control-
ling cellular proliferation and differentiation, in this study, T-cells derived from PBMC’s
from human donors have been stimulated with different cytokines such as IL-2, IL-4, IL-7
and IL-15. PBMC’s isolated from human organism contain all the major cell types of the
immune system like T-cells, B-cells, NK-cells, monocytes and dendritic cells. For visual-
izing and controlling the proliferation, FACS (fluorescence activated cell sorter, BD Bio-
science, San Jose, CA 95131-1807, USA) analyses were performed. For this procedure
CFSE (carboxyfluorescein diacetate succinimidyl ester) was used. CFSE is a chemical
agent which is able to pass the cell membrane spontaneously. It interacts with the amine
sidechains of cellular proteins and couples with them irreversible (Figure 1.1).
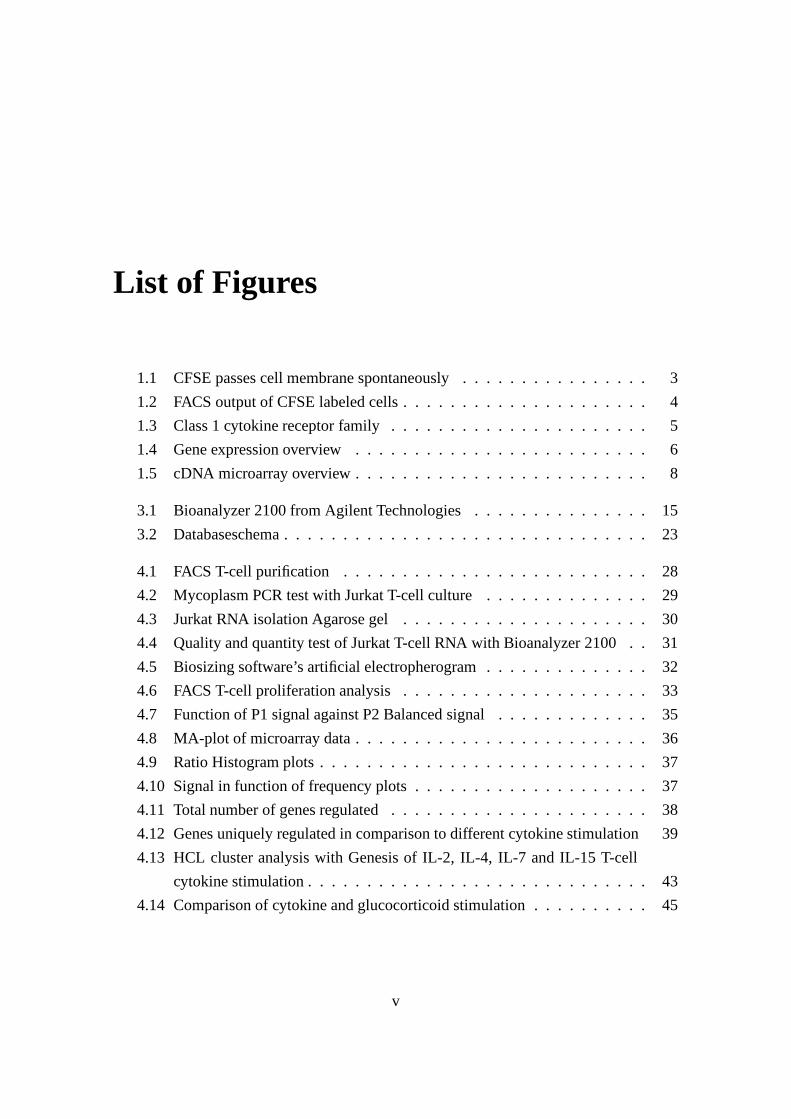
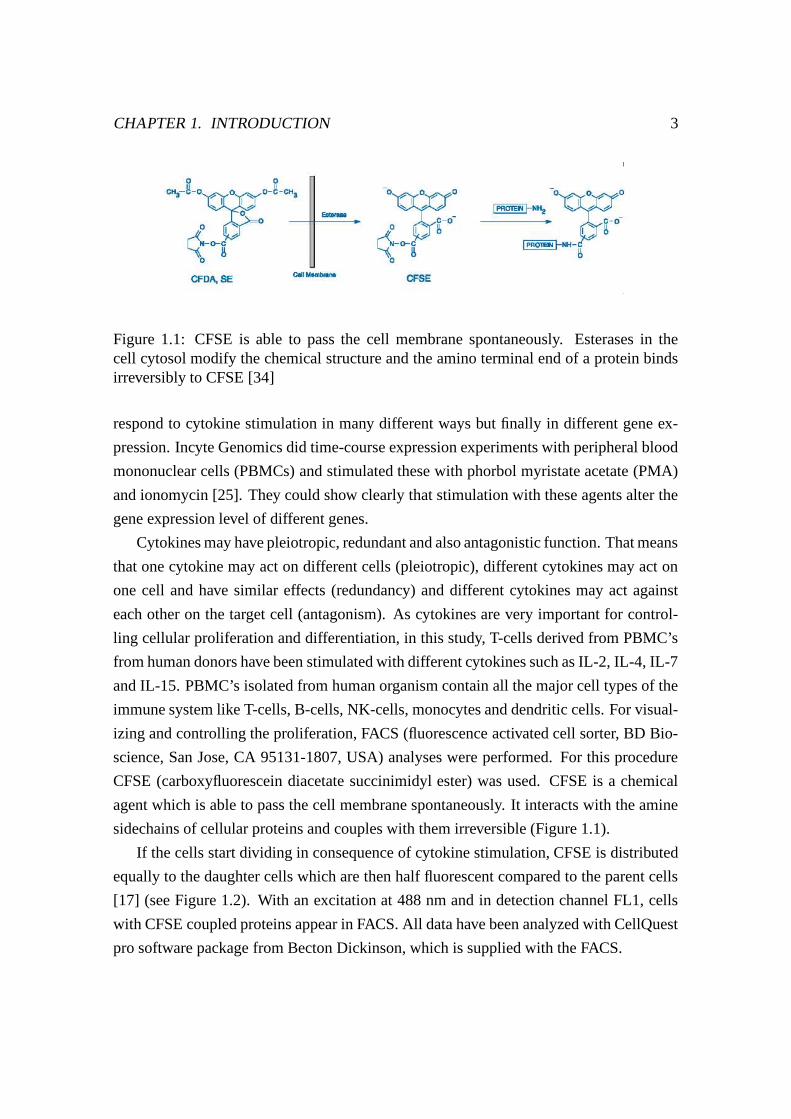
If the cells start dividing in consequence of cytokine stimulation, CFSE is distributed
equally to the daughter cells which are then half fluorescent compared to the parent cells
[17] (see Figure 1.2). With an excitation at 488 nm and in detection channel FL1, cells
with CFSE coupled proteins appear in FACS. All data have been analyzed with CellQuest
pro software package from Becton Dickinson, which is supplied with the FACS.
CHAPTER 1. INTRODUCTION 4
Figure 1.2: This figure shows the FACS output of CFSE labeled B-cells. After each celldivision, the fluorescence signal of CFSE will be halved. It is easy to follow the prolifer-ation of the cells from day 2 to day 4. Each peak from the right to the left represents onecell division step. Figure adapted from [32]
After stimulation with cytokines, total RNA was isolated and used for microarray
analyses. With microarray technology in general it is possible, as mentioned before, to
examine a large number of genes in parallel which are currently up- or downregulated.
The central dogma of molecular biology [10] tells us that DNA is transcribed into
mRNA and, in a further step, translated into proteins. So mRNA reflects the currently
active set of genes in the cell. If cells are stimulated for example with cytokine IL-2 and
RNA is subsequently isolated, it should be possible with microarray analyses to find those
genes up- or downregulated (in comparison with the reference RNA) which are involved
in the IL-2 signaling pathway or at least to identify those genes which are activated or
deactivated by this stimulation.
There are two ways how external stimuli may activate a cell. One is the direct move-
ment of the ligand into the cell, the other one is used by cytokine receptors which do
have kinase activity directly or indirectly, dependent of their intracytoplasmic region. Cy-
tokines may only act on cells which carry the corresponding receptors on their surface.
Cytokine receptors for IL-2 may be expressed on a cell surface in three different forms.
The � chain monomer is a low affinity receptor, � and � chain together is an intermediate
affinity dimer and � , � , � chain together is a high affinity trimer [48]. Studies with hu-
man immune deficiency (HIV) patients and IL-2 cytokine treatment showed this different
CHAPTER 1. INTRODUCTION 5
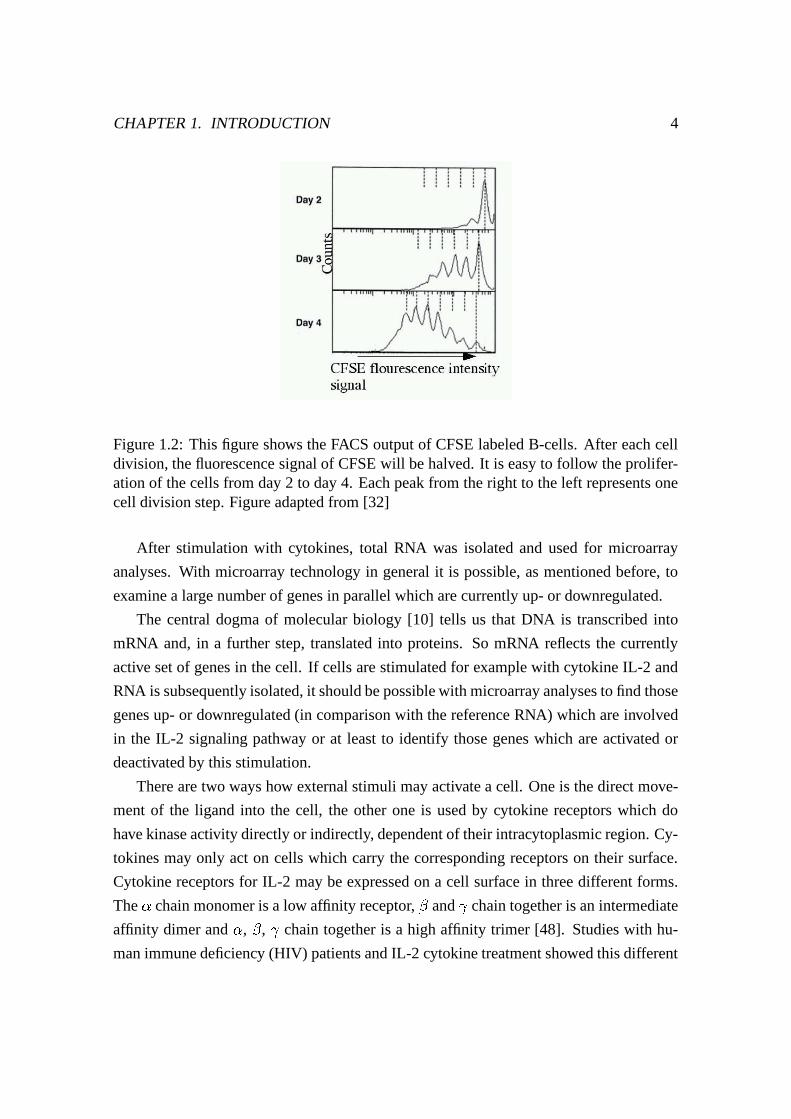
Figure 1.3: Class 1 cytokine receptors like IL-2, IL-4, IL-7 and IL-15 share the � chainwhich acts as a signal transducing subunit where JAK kinases phosphorylate STAT tran-scription factors.
affinity of cytokine receptors effect very clearly. High doses of IL-2 treatment had severe
side effects for the patients because high doses do not only activate the high affinity re-
ceptor on CD4+ T-cells but also cells which have low affinity IL-2 receptors like NK-cell,
which lead to strong inflammatory reaction [29].
Those cytokines which were utilized in this work are reacting with class 1 cytokine re-
ceptor family which share the � chain (Figure 1.3). � and � chains are signal transducing
subunits which activate Janus kinase (JAK). JAKs belong to the protein tyrosine kinases
and they interact with the cytosolic tail of the receptor molecules. JAK kinases phos-
phorylate the tyrosine residues of signal transducer and activators of transcription (STAT)
molecules under ATP consumption which then dimerize, unmask the nuclear localization
signal (NLS) and act inside the nucleus as a transcription factor [30]. Today only four
members of the mammalian JAKs (Jak1, Jak2, Jak3 and Tyk2) and a total of seven STATs
(Stat1-4, 5a, 5b and 6) have been identified [21, 39]. The mechanism how the signaling
works in detail is not well characterized today. However, if STAT molecules are once in
the nucleus, they can bind directly to DNA at regulatory sites, upstream the initial starting
point of transcription and facilitate the binding of RNA polymerase II which is responsible
for transcribing of protein encoding genes [38].
There are also inhibitors of cytokine signaling like suppressor of cytokine signaling
(SOCS), JAK binding protein (JAB) and STAT induced STAT inhibitor (SSI). All these
proteins are also induced by cytokine stimulation and are therefore meant to be an exam-
CHAPTER 1. INTRODUCTION 6
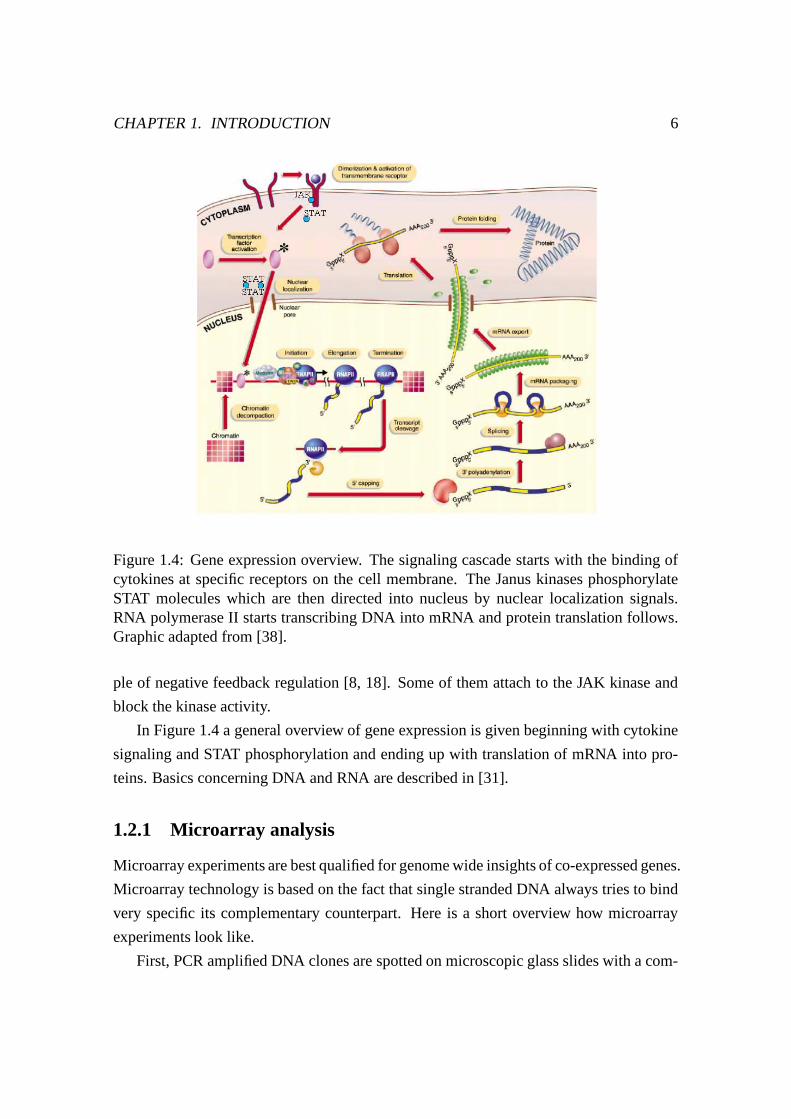
Figure 1.4: Gene expression overview. The signaling cascade starts with the binding ofcytokines at specific receptors on the cell membrane. The Janus kinases phosphorylateSTAT molecules which are then directed into nucleus by nuclear localization signals.RNA polymerase II starts transcribing DNA into mRNA and protein translation follows.Graphic adapted from [38].
ple of negative feedback regulation [8, 18]. Some of them attach to the JAK kinase and
block the kinase activity.
In Figure 1.4 a general overview of gene expression is given beginning with cytokine
signaling and STAT phosphorylation and ending up with translation of mRNA into pro-
teins. Basics concerning DNA and RNA are described in [31].
1.2.1 Microarray analysis
Microarray experiments are best qualified for genome wide insights of co-expressed genes.
Microarray technology is based on the fact that single stranded DNA always tries to bind
very specific its complementary counterpart. Here is a short overview how microarray
experiments look like.
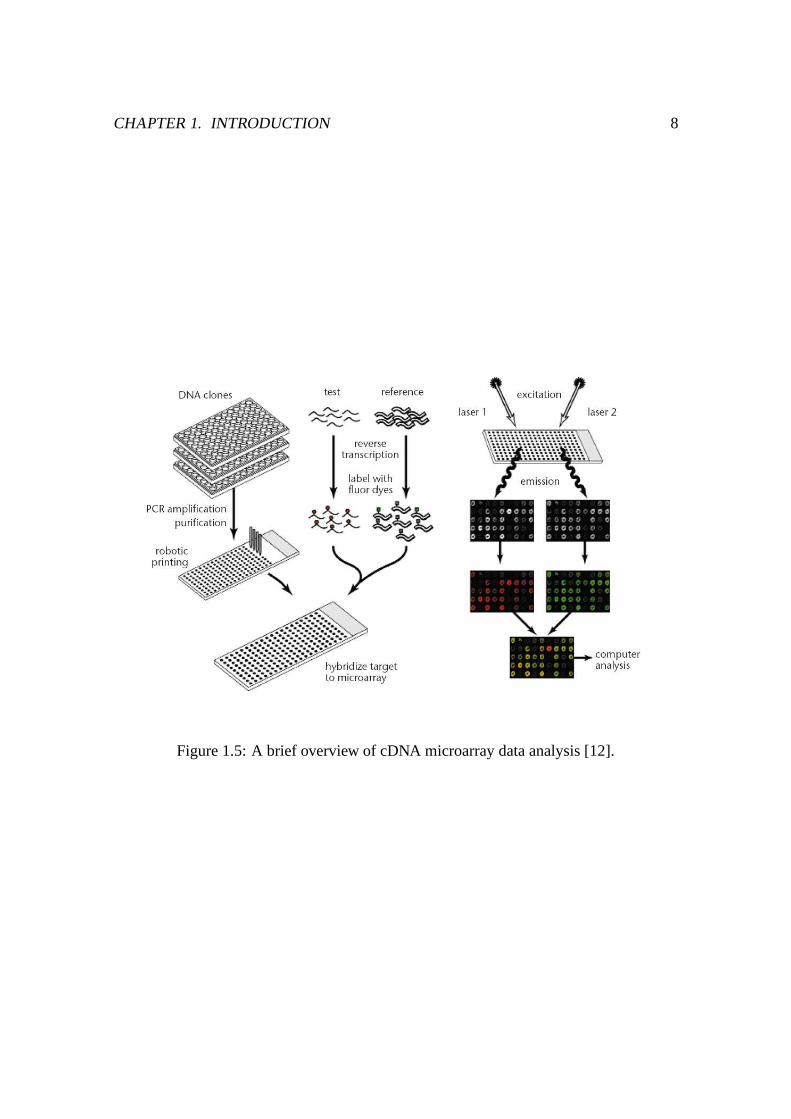
First, PCR amplified DNA clones are spotted on microscopic glass slides with a com-
CHAPTER 1. INTRODUCTION 7
puter controlled spotter. One reference RNA and one sample RNA are marked with dif-
ferent labeled dyes during reverse transcription. Other possibilities are indirect labeling
or labeling with marked oligomers. Normally the fluorescent dyes Cy-3 and Cy-5 dUTP
are used. The two labeled cDNAs are mixed together and will then be hybridized compet-
itively on the previously spotted microarray slide. Laser scanners measure the fluorescent
intensities of each spot and generate for each wavelength an own image. These images
are merged together in one multilayer TIFF-file. With particular graphical software, the
different gray scale layers can be colorized into green, red or yellow spots, whereas yel-
low spots indicate similar levels of expression. The ratio of both wavelengths is calculated
and provide a quantitative measurement of gene expression and the activity of the corre-
sponding gene. All the data are stored in a spreadsheet including gene name, ratio, signal
intensity, GenBank accession numbers and many other variables. These data can be used
for further processing like sorting, filtering and calculating with database programs. One
frequently used database program is Access�
from Microsoft Corporation .
Next step is to cluster these ratios with special clustering software. The general aim of
clustering is to get genes with similar expression ratios together. Sophisticated clustering
algorithms are used today like hierarchical clustering (HCL), principal component analy-
sis (PCA), self organizing maps (SOM), k-means clustering and support vector machine
(SVM). All these algorithms are implemented in a versatile Java program called Genesis
[46, 47]. Figure 1.5 gives a brief overview how cDNA microarray experiments look like.
For the microarray experiments used for this study, T-cells derived from PBMCs of
healthy donors were treated with cytokines, in particular with IL-2, IL-4, IL-7 and IL-15
and hybridized on Incyte GEMTM cDNA microarray chips with 9182 genes spotted.
CHAPTER 1. INTRODUCTION 8
Figure 1.5: A brief overview of cDNA microarray data analysis [12].
Chapter 2
Objectives
The long term objective is to get an insight into signaling pathways and to design ex-
periments and methods for tumor micro-environment studies. One appropriate tool for
gaining insight into this large network of regulation and relationship between genes is to
conduct cDNA microarray studies.
The specific aim of this master thesis was to perform T-cell stimulation experiments
with different cytokines from healthy donors, isolate the RNA, produce microarrays with
human genes spotted on a glass slide and manage and analyze the data yielded from
these experiments. In addition to find gene expression patterns of cytokine activated T-
cells with cytokines that bind to a specific receptor family which share the common �chain (see Figure 1.3). These receptors belong to the class 1 cytokine receptor family.
IL-2, IL-4, IL-7 and IL-15 has been used for T-cell stimulation and TGF � to suppress
T-cells. After clustering gene expression ratios with special software, commonly and/or
uniquely regulated genes should appear. In comparison to cytokine stimulation also a
glucocorticoid was used to show the differences in gene expression between cytokines
and glucocorticoids.
Microarray technology makes possible to get a quick, genome wide, insight in gene
expression [12] of a cell, during a specific treatment. If genes change their expression in
a similar way after different treatments, one may conclude that these genes are related to
each other, or that they have at least some regulatory mechanisms in common like sharing
promotor elements. With the resulting data it should be possible to identify commonly
and uniquely regulated genes. Expressed sequence tags (ESTs) [4] can be identified as
potential new regulated genes which are not yet characterized and classified in a specific
9

CHAPTER 2. OBJECTIVES 10
pathway. After this pilot-study of T-cell stimulation with different cytokines, microarray
experiments with inhibitory cytokines like IL-10 and TGF � will be performed.
Chapter 3
Methods
This chapter describes the methods used to perform the experiments. It is divided into
two parts. In the first one some biological techniques will be explained and the second
part will focus on the computational analysis of the gene expression data.
3.1 Biological methods
3.1.1 Jurkat cell culture
For Jurkat cell cultivation RPMI 1640 with Glutamax-I (Life Technologies CatNo: 61870
010) was used. Alternatively RPMI 1640 without L-Glutamine (Life Technologies CatNo:
31870 025, 500ml) and with adding 1vol% 200mM L-Glutamine (Eurobio Ref:010129)
was used. For completing the medium 5vol% of Penicillin (5units/ml) / Streptomycine
(5 � g/ml) solution (Life Technologies CatNo:15070-063) and 10vol% FCS (Eurobio Ref:
010056) were added. The Jurkat cells were cultivated between 0.5 million and 2 million
cells. Under normal conditions three fold cell count increase was obtained in between
three days. An aliquot of 20 � l cell solution has been mixed up with 20 � l Trypanblue
for counting in a Malassez counting slide. With the vital dye Trypanblue it is possible to
distinguish alive cells from dead ones by coloring the dead cells blue due to membrane
damage. As the Jurkat cells are a cell line, only few or no dead cells should appear in cul-
ture. To estimate the percentage of dead cells in culture, they were counted and divided
by the total number of the cells. The cells were incubated at 37 � C, 100% humidity and
5% CO2. The cells have been diluted and passaged to a new culture flask, if the number
11
CHAPTER 3. METHODS 12
of cells reached approximately 2 million cells per milliliter.
3.1.2 Freezing of cells
10 million cells were frozen in 1ml of freezing medium which consists of 90% FCS (fetal
calf serum) and 10% DMSO (dimethyl sulfoxide). The cells have been centrifuged with
1200rpm for 10 minutes and at 4 � C. The pellet was resuspended with 1ml of freezing
medium. The homogenized pellet has been transferred into NUNC Cryo tubes (NUNCTM,
Denmark). To guarantee not to freeze the cells too fast, the tubes were placed into a special
freezing box which was filled with isopropanol and ensures that the cells slowly get frozen
with 1 � C per minute. The freezing box was placed directly into the -80 � C freezer.
3.1.3 De-freezing of cells
The -80 � C frozen cells should be defrosted very quickly. The frozen tube was put directly
into a 37 � C water bath. Once the cell suspension was defrosted, cultivating medium
(RPMI 1640 with glutamine, antibiotics and FCS) was added to wash them because
DMSO is a toxic agent for cells. After centrifugation (1200rpm, 10 minutes at room
temperature) the 10 million cells were cultivated in 10ml cultivation medium to have an
end-concentration of 1 million cells per milliliter at 37 � C.
3.1.4 RNA isolation
3.1.4.1 RNA extraction with Promega RNAgents�
Total RNA Isolation System
The Promega kit (Promega Corporation, Madison, WI 53711-53399 USA) was used for
Jurkat and for T-cell RNA isolation. In general 50 million cells were used for one ex-
traction. All the following steps were performed on ice or 4 � C, to slow down the activity
of RNAse. The cells were centrifuged with 1200rpm at 4 � C and for 10 minutes, washed
with sterile PBS Dulbecco’s (w/o calcium, magnesium and sodium bicarbonate, Invit-
rogen Corporation, Carlsbad, California 92008, USA, CatNo. 14190-094) and 6ml of
denaturing solution for disrupting the cells were added. After addition of 600 � l sodium
acetate which was enclosed in the extraction kit, 6ml of phenol/chloroform/isoamyl alco-
hol was added to remove contaminants like DNA and proteins. The broken cells rested
for 15 minutes on ice before centrifugation with 10.000g at 4 � C and for 20 minutes. After
CHAPTER 3. METHODS 13
this step the solution was divided into two phases, an aquatic and an organic phase. RNA
resides in the aquatious phase while all other components of the cell reside in the organic
one. The upper (aquatic) phase was precipitated with the same volume of isopropanol in
a new tube and incubated at -20 � C for half an hour up to 2 hours. A further centrifugation
step followed (8310rpm, 4 � C, 10 minutes). The supernatant was removed and the pellet
was resuspended with 600 � l of denaturing solution by pipetting slowly into an Eppendorf
tube (Eppendorf, Hamburg, Germany). After addition of 600 � l isopropanol the tube was
incubated again for 30 minutes at -20 � C. The RNA was centrifuged at 8310rpm at 4 � C for
10 minutes and after this step the RNA pellet was washed with sterilfiltered (Sterivex ���Millipore Corporation, Bedford, MA 01730, USA) 75% Ethanol. One more centrifuga-
tion with 8310rpm at 4 � C and 10 minutes followed, the supernatant was removed com-
pletely and the pellet was dried. At last, 110 � l of the provided nuclease free water was
added to resuspend the RNA. The obtained RNA was stored at -20 � C. The quality control
of the yielded RNA has been done like described in chapter 3.1.4.4 Quality control of the
isolated RNA.
3.1.4.2 RNA extraction with RNA-plusTM
RNA-plus (Qbiogene, Parc d’innovation, 67402 Illkirch Cedex France, Europe) was the
second choice for RNA extraction and used for comparison. It is a fast possibility to
isolate RNA from different cell types. One advantage is that a green dye is present in the
extraction solution to facilitate the visualization of the organic and aqueous phase. For
this RNA-plus kit 30 million cells were used usually to do RNA extraction. All steps
were performed on ice. 1.5ml of RNA-plus solution was added to the cell pellet and
homogenized by pipetting the mix. The tube was placed 5 minutes on ice. After adding
0,3ml of chloroform the solution was vortexed for 15 seconds. After further 5 minutes on
ice, the tube was centrifuged with 12000rpm at 4 � C for 15 minutes. The two phases arise.
The lower one is the organic phase where all cell compartments and DNA reside. The
upper phase is the aquatic phase where the RNA molecules reside. This RNA solution
was transferred into a new Eppendorf tube and precipitated with the same volume of
isopropanol (-20 � C). After putting the tube for 15 minutes on ice, it was centrifuged again
with 12000rpm at 4 � C for 15 minutes. The resulting pellet was the expected RNA which
was washed with 75% ethanol. One centrifugation step followed with 10000rpm at 4 � Cfor 15 minutes. The supernatant was removed completely and the pellet was resuspended
CHAPTER 3. METHODS 14
in 110 � l of RNAse free water. The quality control of the yielded RNA has been done like
described in chapter 3.1.4.4 Quality control of the isolated RNA.
3.1.4.3 RNA extraction with Qiagen’s RNA extraction kit
RNeasy (QIAGEN, Valencia, CA 91355, USA) is an other total RNA isolation kit which
was used for comparison. This isolation kit is very easy to handle. For one isolation
100 million cells were used. The cells were centrifuged and the pellet was lysed with
4ml buffer RLT. A syringe with a proposed 20 gauge needle was used to homogenize the
lysate by passing the lysate 5-10 times through the needle. After adding 70% ethanol
(4ml), the mix was vortexed vigorously. 4ml of the suspension was loaded sequentially
onto the RNeasy midi column. The column was placed in a 15ml centrifugation tube and
centrifuged for 10 minutes with 5000rpm at 4 � C. The flow-through has been discarded.
4ml of buffer RW1 has been loaded onto the column. Once again a centrifugation step was
performed (5000rpm, 5 minutes, 4 � C) and the flow-through has been discarded. As next
step 2.5ml of buffer RPE was put on top of the column. The tube was centrifuged with
5000rpm for 2 minutes and at 4 � C. The flow-through has been kept. Again 2.5ml of RPE
buffer has been loaded onto the column, but now the tube was centrifuged at 5000rpm,
4 � C and 5 minutes to dry the RNeasy silica gel membrane to remove ethanol completely.
For elution of the RNA out of the column 110 � l of RNAse free water has been loaded.
After one minute, the column was centrifuged with 5000rpm for 3 minutes at 4 � C. This
step was performed twice. Alternatively, for a better yield of RNA, the first elution can
be loaded once again onto the same column for a second time.
3.1.4.4 Quality control of the isolated RNA
Agarose gel For RNA quality control 1% agarose gels were used. For preparing the
gels and as running buffer 1x TBE buffer from 10x TBE buffer (Invitrogen life Technolo-
gies, CatNo. 15581-044) has been prepared. Standard agarose (molecular biology grade)
from The Quantum Biotechnologies Group was used. The gel electrophoresis took 1 hour
at 90V.
Spectral photometer The spectral photometer allows to estimate the purity of the RNA
by measuring the RNA sample in a quartz cuvette at 260nm and 280nm. The ratio of the
measured values gives an idea of the purity. It is known that, if the ratio is lower than 1.6,
CHAPTER 3. METHODS 15
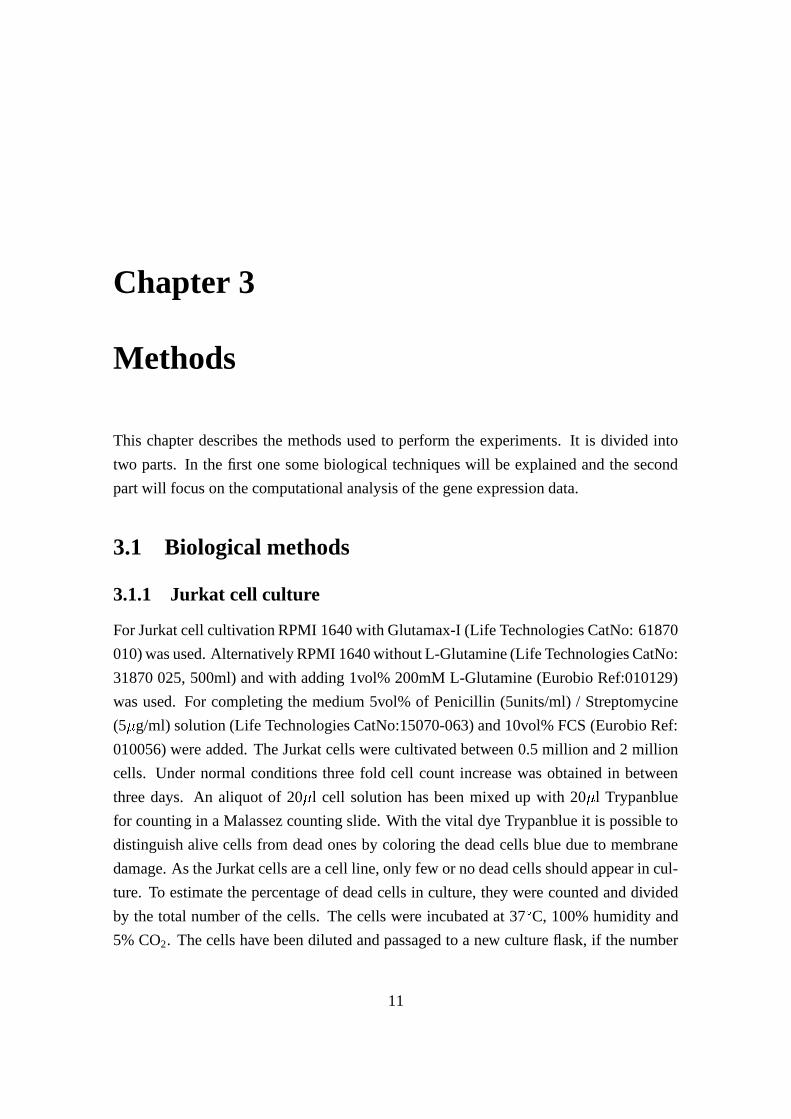
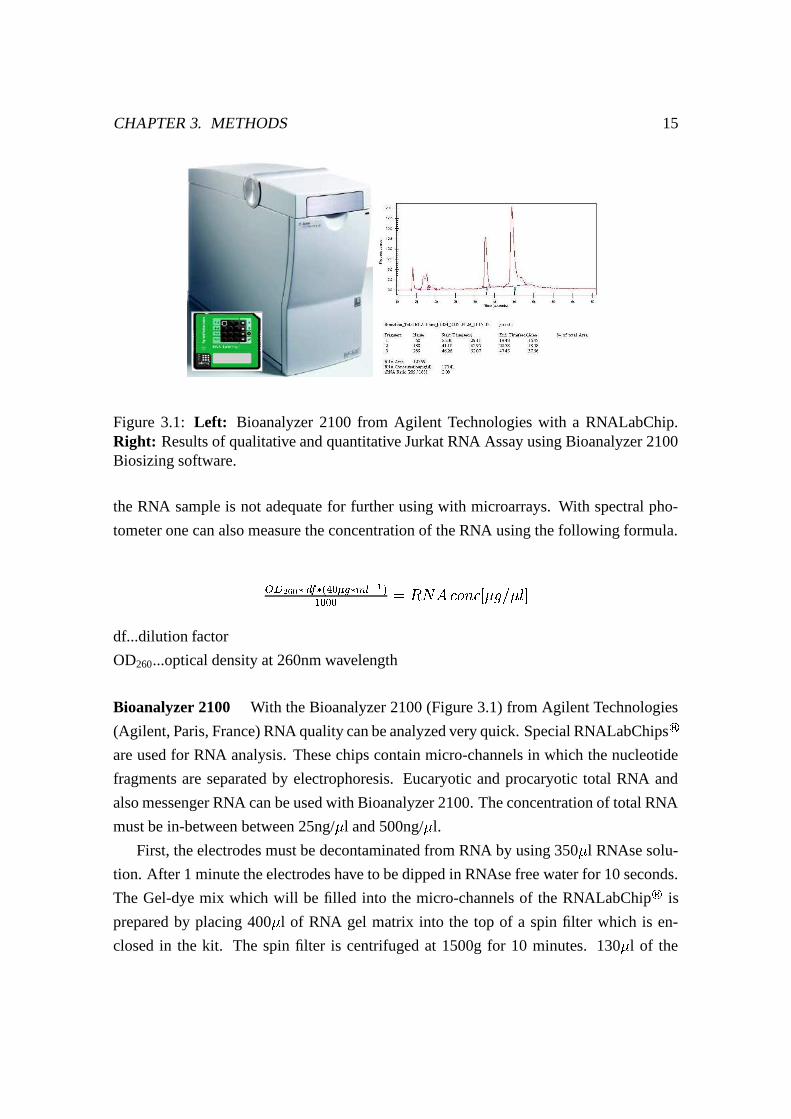
Figure 3.1: Left: Bioanalyzer 2100 from Agilent Technologies with a RNALabChip.Right: Results of qualitative and quantitative Jurkat RNA Assay using Bioanalyzer 2100Biosizing software.
the RNA sample is not adequate for further using with microarrays. With spectral pho-
tometer one can also measure the concentration of the RNA using the following formula.
� ���������������������! ��#"%$'&)(�*+ �,�,� -/.103254!68794): � ;�<)�>=�?df...dilution factor
OD260...optical density at 260nm wavelength
Bioanalyzer 2100 With the Bioanalyzer 2100 (Figure 3.1) from Agilent Technologies
(Agilent, Paris, France) RNA quality can be analyzed very quick. Special RNALabChips�
are used for RNA analysis. These chips contain micro-channels in which the nucleotide
fragments are separated by electrophoresis. Eucaryotic and procaryotic total RNA and
also messenger RNA can be used with Bioanalyzer 2100. The concentration of total RNA
must be in-between between 25ng/ � l and 500ng/ � l.
First, the electrodes must be decontaminated from RNA by using 350 � l RNAse solu-
tion. After 1 minute the electrodes have to be dipped in RNAse free water for 10 seconds.
The Gel-dye mix which will be filled into the micro-channels of the RNALabChip�
is
prepared by placing 400 � l of RNA gel matrix into the top of a spin filter which is en-
closed in the kit. The spin filter is centrifuged at 1500g for 10 minutes. 130 � l of the
CHAPTER 3. METHODS 16
filtered RNA gel matrix and 2 � l of the RNA dye concentrate are mixed together by vor-
texing thoroughly. Next, 9 � l of this mix are placed into each of the marked wells destined
for gel. One is filled with pressure using the "Chip Priming Station" (supplied in the kit).
It should be checked that no air bubbles appear in the micro-channels. The next step is
to place 5 � l of the RNA 6000 Nano Marker into each of the remaining wells (12 sample
wells and one ladder well). 1 � l of the RNA 6000 ladder is dispensed into the ladder well
and at last 1 � l of the samples are pipetted into the corresponding wells. After 30 minutes
of analysis run time, the result is displayed on the computer screen (see Figure 3.1).
3.1.5 Preparing Lymphocytes from a cytapheresis of healthy donors
3.1.5.1 Lymphocyte separation
The initial point was a cytapheresis sample of healthy donors. The cytapheresis was
mixed 1:2 and diluted with PBS w/o (PBS Dulbecco’s without calcium, magnesium and
sodium bicarbonate). Then Falcon (Becton Dickinson Labware, BLUE MAXTM, 50ml
polypropylene conical tubes) tubes filled with 15 ml of Lymphocytes separation medium
(Eurobio, 91953 Les Ulis Cedex B, France, Ref: 914630) were prepared. On top of the
lymphocyte separation (Ficoll) medium with a density of 1.077 g*cm-3, the diluted blood
was pipetted very slowly, not to mix up the two phases. This Falcon tube was put carefully
into the centrifuge, which has to be accelerated very slowly at the beginning and with no
brakes during spin down at the end. The centrifugation itself was done at 2000rpm for 20
minutes and 20 � C. The accumulated inter-phase which represents the enriched lympho-
cytes, was pooled and collected into new Falcon tubes. Another centrifugation step with
1200rpm for 10 minutes at 20 � C followed. The resulting pellets were pooled and washed
twice with PBS w/o and centrifuged with 1200rpm for 10 minutes at 20 � C. After the
second wash, the cells were counted and for the last wash, PBS including EDTA (2mM)
and 5% FCS (Eurobio Ref: 010056) was used. As last step, the cells were centrifuged
with 1200rpm for 10 minutes at 4 � C. The pellet including the separated lymphocytes was
resuspended in the required volume for the Pan T-cell purification (MACS - Pan T-cell
Isolation Kit, Miltenyi Biotec, 75011 Paris, France, Order No. 530-01) or alternatively
for the T-cell negative isolation kit (T-cell Negative Isolation Kit, Dynal, Oslo, Norway,
Prod. No. 113.11). Both, the Pan T-cell Isolation Kit (Miltenyi Biotec) and the T-cell
Negative Isolation Kit (Dynal) will be described in the next sections.
CHAPTER 3. METHODS 17
3.1.5.2 Pan T-cell Isolation Kit
The Pan T-cell Isolation Kit from Miltenyi Biotec is an indirect magnetic labeling system.
With this kit it is possible to separate CD3 positive T-cells from other human peripheral
blood mononuclear cells (PBMC) like B-cells, natural killer cells, dendritic cells, mono-
cytes, basophils, early erythroid cells and platelets. The non T-cells were depleted by us-
ing a cocktail of hapten conjugated CD11b, CD16, CD19, CD36 and CD56 monoclonal
antibodies. The hapten conjugated antibodies are recognized by anti hapten monoclonal
antibodies which are magnetically labeled with MACS microbeads. At first, the cells
were counted and washed in buffer (PBS w/o, 2mM EDTA and 5% fetal calf serum). The
supernatant was removed completely and the pelleted cells were resuspended in a total
volume of 80 � l per 10 million cells. 20 � l Hapten Antibody Cocktail per 10 million cells
was added. The tube was well mixed and incubated for 10 minutes at 4 � C in the refriger-
ator. The mixture was washed twice with 10-20 times the volume of the labeling process.
After the second wash the cells were resuspended in 80 � l per 10 million cells of buffer.
20 � l of MACS Anti Hapten MicroBeads were added per 10 million cells. The tube was
mixed again and incubated for 15 minutes at 4 � C in the refrigerator. Afterwards, the mix-
ture was washed with buffer once again, using 10-20 times the labeling volume. The cell
pellet was resuspended in 500 � l buffer per 100 million cells. Only 100 million positive la-
beled cells can be loaded at once on one MACS midi column. The MidiMACS Separation
Unit (magnet) was attached to the MACS MultiStand. The MACS LS separation column
was placed into the magnet and 3ml of buffer was added to wash the column once. Then
100 million magnetically labeled cells were applied to the column. The effluent which
represents the enriched T-cell fraction was collected in a new Falcon tube. The column
was rinsed 3 times with buffer and the flow through was collected in the same tube. Op-
tionally one can elute all other non T-cells which remain in the column by removing the
column from the magnetic field and rinse them with buffer into another Falcon tube.
3.1.5.3 T-Cell Negative Isolation Kit
The T-cell Negative Isolation Kit from Dynal (Dynal, Oslo, Norway, Prod. No. 113.11) is
another possibility to isolate and purify T-cells from mononuclear cell samples. B-cells,
NK-cells monocytes activated T-cells and granulocytes are removed from the sample by
depletion. This kit uses two major steps for isolating T-cells. First, monoclonal mouse
antibodies against CD14, CD16, CD56 are added to the cell suspension. Then Dynabeads
CHAPTER 3. METHODS 18
which are coated with an Fc specific human IgG4 antibody against mouse IgG are added.
The depletion Dynabeads are polystyrene beads which are uniform and superparamag-
netic. This is a negative isolation kit, which removes unwanted cells in a cell suspension.
The cells were prepared using Lymphocyte separation medium (see 3.1.5.1). Con-
centration of MNC in one sample was 107cells/100 � l. After adding 20 � l FCS and 20 � l
antibody mix (T-cell kit), incubation followed for 10 minutes at 2-8 � C. The cell suspen-
sion was washed with 1ml PBS/0.1%BSA mix and centrifuged. The supernatant was
removed and the pellet was resuspended in 0.9ml PBS/0.1%BSA. 100 � l depletion Dyn-
abeads for 10 million cells were added. Incubation with tightly shaking ensued for up
to 15 minutes at 20 � C. The volume was increased with 1-2ml of PBS/0.1%BSA and the
tube was placed in the Dynal magnetic particle concentrator (MPC) for 2 minutes. The
negatively isolated T-cells in the supernatant were transferred into a new tube.
3.1.6 PCR Mycoplasma Detection Kit
Testing for Mycoplasma is very important for cell cultures. Under normal conditions they
can not be seen under the microscope and they do not cloud the cultivating medium, but
they remove important nutrition and they affect cell proliferation. For testing Mycoplasma
contamination in the Jurkat T-cell line culture, the VenorGeM�
PCR mycoplasma detec-
tion kit from Biovalley (Biovalley, Minerva Biolabs, Berlin Germany) was used. Because
of the polymerase chain reaction (PCR), the kit is very sensitive for mycoplasma DNA (1
to 5 fg are detectable). Primers for a specific region of the 16s RNA, which is a highly
conserved region throughout many Mycoplasma strains, are used to amplify. The result-
ing outcome of a positive test is a 270bp fragment. Templates for this PCR assay were
prepared by boiling 100 � l of cell culture supernatant in a sterile micro-centrifuge tube for
5 minutes. The tube was centrifuged for 5 seconds. Next, a master mix solution for the
PCR was prepared. The total volume for one reaction was 50 � l.
For each assay a positive (enclosed in the kit) and a negative (sterile de-ionized water)
control is needed. An aliquot of 48 � l mastermix was pipetted into one PCR reaction tube.
2 � l from the prepared cell culture samples were added into the corresponding reaction
tube. Also 2 � l of the positive control were added in the positive control tube. The PCR
reaction had a thermal profile which is shown in Table 3.2. Each amplified PCR product
was put on a standard agarose gel (1.5%). 5 � l were used to load one slot. The gel was
prepared as described in chapter 3.1.4.4 except that 1.5% agarose was used instead of 1%.
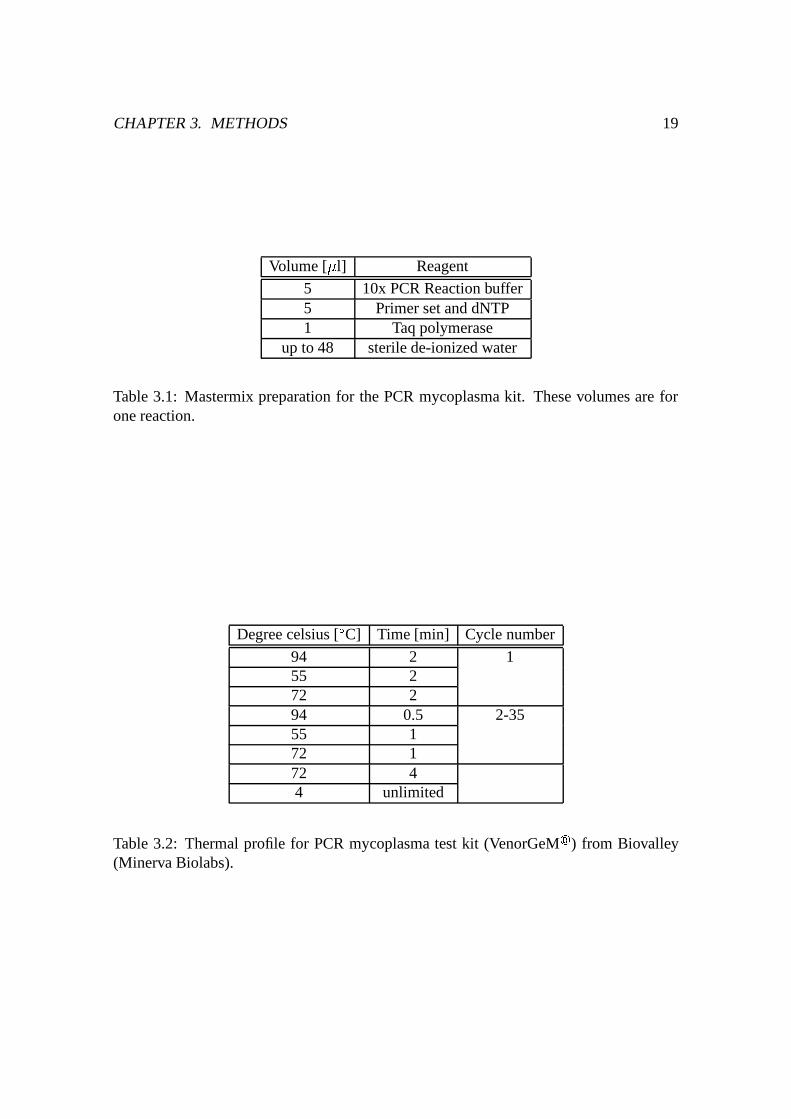
CHAPTER 3. METHODS 19
Volume [ � l] Reagent
5 10x PCR Reaction buffer5 Primer set and dNTP1 Taq polymerase
up to 48 sterile de-ionized water
Table 3.1: Mastermix preparation for the PCR mycoplasma kit. These volumes are forone reaction.
Degree celsius [ � C] Time [min] Cycle number
94 2 155 272 294 0.5 2-3555 172 172 44 unlimited
Table 3.2: Thermal profile for PCR mycoplasma test kit (VenorGeM�
) from Biovalley(Minerva Biolabs).
CHAPTER 3. METHODS 20
Figure 4.2 displays an example gel of such a PCR reaction.
3.1.7 Proliferation Tests
For cell proliferation tests CFSE staining [32] was used. CFSE is a non-polar molecule
which contains a fluorescein molecule and is able to pass the cell membrane sponta-
neously. Inside the cell CFSE will be modified with cytosolic esterases, this makes the
CFSE fluorescent and deforms the molecule in a way that it will no longer be able to
pass the cell membrane. CFSE binds irreversibly to amino ends of the cellular proteins
(see also Figure 1.1). One million cells per milliliter were pelleted and washed twice
with PBS without Ca2+/Mg2+. All centrifugation steps were performed at 4 � C, 1200rpm
for 10 minutes. The cell pellet was resuspended in 1ml, 1x CFSE (CFSE Stock solution
(10.000x) was diluted with PBS to CFSE) and put on a turning wheel for 8 minutes at
room temperature. After incubation, 1ml pure FCS was added to stop the reaction. The
solution was mixed and washed 3 times with RPMI 1640 medium. After these steps, the
cells were ready for proliferation essays and treatment with cytokines.
3.1.7.1 Stimulation of T-cells with cytokines
After T-cell purification with one of the methods described above, T-cells were ready
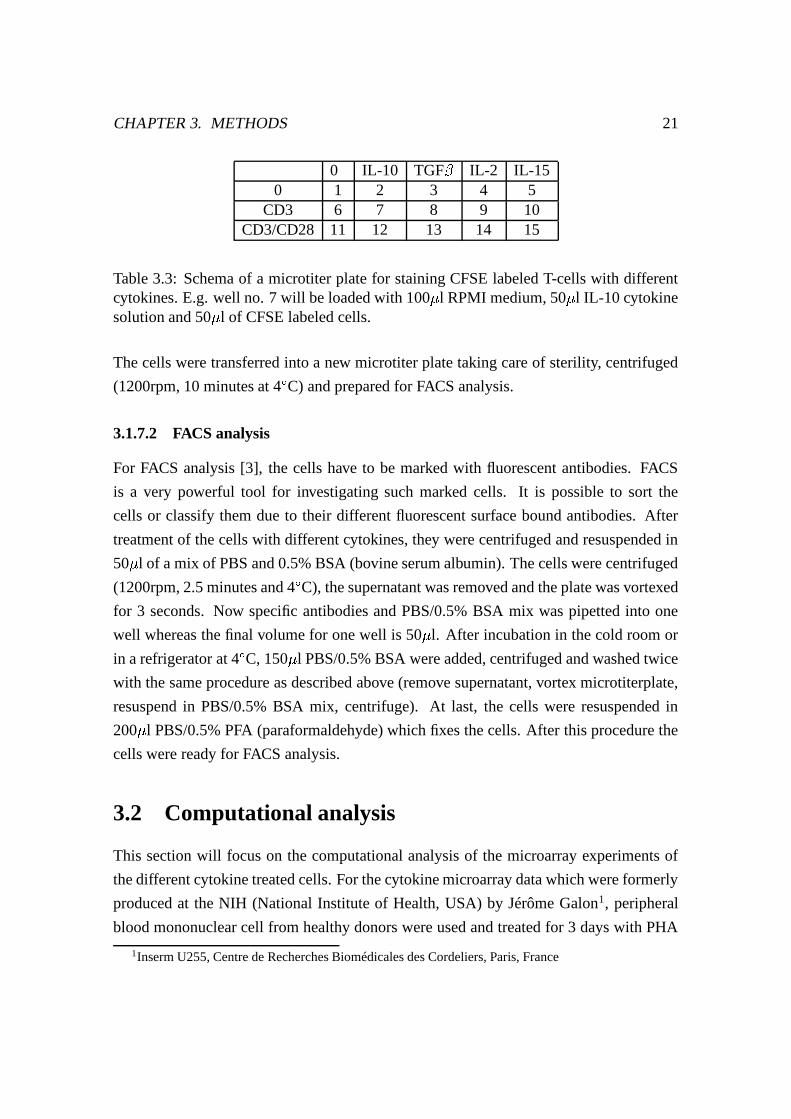
for stimulation with cytokines. For proliferation tests, 96 well microtiterplates were used.
First, the microtiterplate was coated with � CD3 and in a second row, with a � CD3/ � CD28
mixture for 2 hours. The coating is necessary because CD3 and CD28 play an essential
role in TCR signal transduction and co-stimulation of T-cell proliferation. Preparation
of CD3 was done with 10 � l/ml PBS (w/o) and the preparation of CD3/CD28 mix was
performed with 1 � l/ml CD3 and with 5 � l/ml CD28 in 1ml PBS (w/o). The mix was
vortexed and 50 � l of the suspension were pipetted into each of the corresponding wells.
After incubating the wells for 2 hours at 37 � C and 5% CO2, they were washed with 50 � l
PBS. The maximum volume for one microtiter well was 200 � l. For the cytokines, 4 � l/ml
of a 1000x concentrate was used. After RPMI medium, 50 � l of the prepared cytokine mix
was added. Finally 50 � l of the CFSE stained cells were added into the well. The total
cell number in one microtiter well was 200.000. Those plates were put into the incubator
(37 � C, 5%CO2) for 4-8 days. After 4 days it was possible to see even with one’s own
eyes which cells did proliferate and which did not. For accurate analysis FACS was used.
CHAPTER 3. METHODS 21
0 IL-10 TGF � IL-2 IL-150 1 2 3 4 5
CD3 6 7 8 9 10CD3/CD28 11 12 13 14 15
Table 3.3: Schema of a microtiter plate for staining CFSE labeled T-cells with differentcytokines. E.g. well no. 7 will be loaded with 100 � l RPMI medium, 50 � l IL-10 cytokinesolution and 50 � l of CFSE labeled cells.
The cells were transferred into a new microtiter plate taking care of sterility, centrifuged
(1200rpm, 10 minutes at 4 � C) and prepared for FACS analysis.
3.1.7.2 FACS analysis
For FACS analysis [3], the cells have to be marked with fluorescent antibodies. FACS
is a very powerful tool for investigating such marked cells. It is possible to sort the
cells or classify them due to their different fluorescent surface bound antibodies. After
treatment of the cells with different cytokines, they were centrifuged and resuspended in
50 � l of a mix of PBS and 0.5% BSA (bovine serum albumin). The cells were centrifuged
(1200rpm, 2.5 minutes and 4 � C), the supernatant was removed and the plate was vortexed
for 3 seconds. Now specific antibodies and PBS/0.5% BSA mix was pipetted into one
well whereas the final volume for one well is 50 � l. After incubation in the cold room or
in a refrigerator at 4 � C, 150 � l PBS/0.5% BSA were added, centrifuged and washed twice
with the same procedure as described above (remove supernatant, vortex microtiterplate,
resuspend in PBS/0.5% BSA mix, centrifuge). At last, the cells were resuspended in
200 � l PBS/0.5% PFA (paraformaldehyde) which fixes the cells. After this procedure the
cells were ready for FACS analysis.
3.2 Computational analysis
This section will focus on the computational analysis of the microarray experiments of
the different cytokine treated cells. For the cytokine microarray data which were formerly
produced at the NIH (National Institute of Health, USA) by Jérôme Galon1, peripheral
blood mononuclear cell from healthy donors were used and treated for 3 days with PHA
1Inserm U255, Centre de Recherches Biomédicales des Cordeliers, Paris, France
CHAPTER 3. METHODS 22
(phytohemagglutinin) lectin which is a very effective T-cell mitogen [37] derived from
plants. Stimulation with PHA gives more than 95% pure T-cells. The cells were washed
in RPMI medium with 1% FCS and rested for 18 hours before stimulation with 10ng/ml
cytokines for 6 hours.
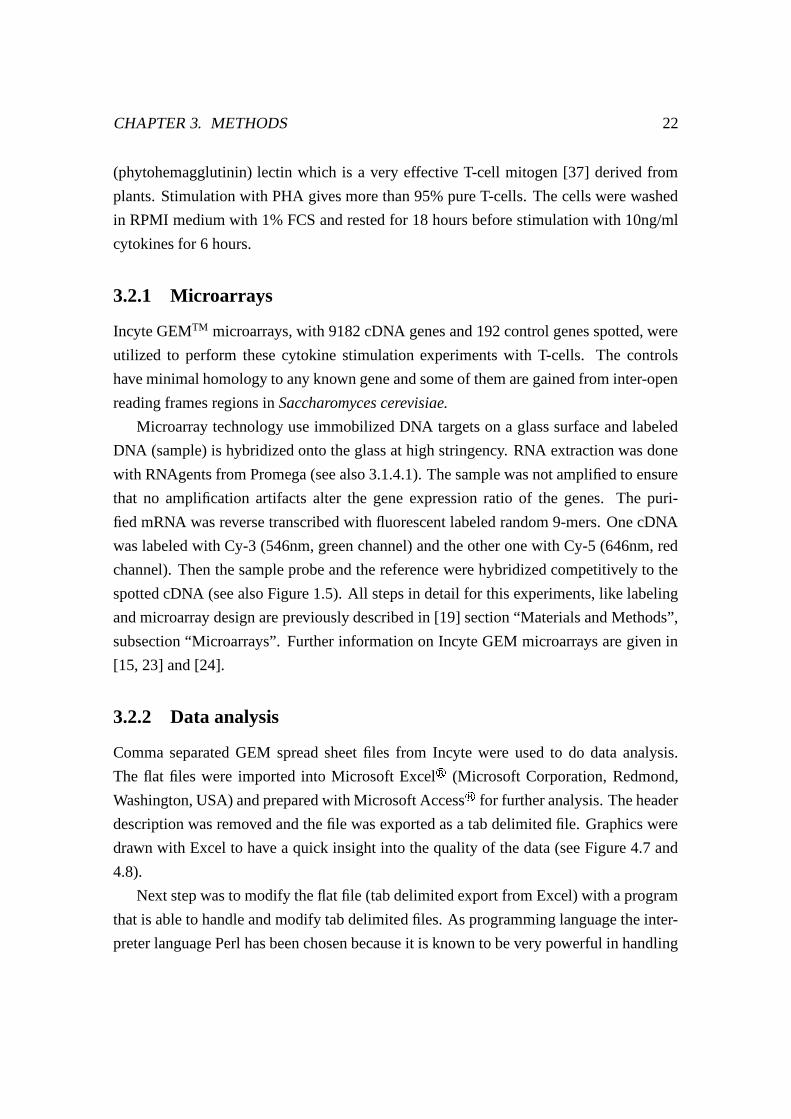
3.2.1 Microarrays
Incyte GEMTM microarrays, with 9182 cDNA genes and 192 control genes spotted, were
utilized to perform these cytokine stimulation experiments with T-cells. The controls
have minimal homology to any known gene and some of them are gained from inter-open
reading frames regions in Saccharomyces cerevisiae.
Microarray technology use immobilized DNA targets on a glass surface and labeled
DNA (sample) is hybridized onto the glass at high stringency. RNA extraction was done
with RNAgents from Promega (see also 3.1.4.1). The sample was not amplified to ensure
that no amplification artifacts alter the gene expression ratio of the genes. The puri-
fied mRNA was reverse transcribed with fluorescent labeled random 9-mers. One cDNA
was labeled with Cy-3 (546nm, green channel) and the other one with Cy-5 (646nm, red
channel). Then the sample probe and the reference were hybridized competitively to the
spotted cDNA (see also Figure 1.5). All steps in detail for this experiments, like labeling
and microarray design are previously described in [19] section “Materials and Methods”,
subsection “Microarrays”. Further information on Incyte GEM microarrays are given in
[15, 23] and [24].
3.2.2 Data analysis
Comma separated GEM spread sheet files from Incyte were used to do data analysis.
The flat files were imported into Microsoft Excel�
(Microsoft Corporation, Redmond,
Washington, USA) and prepared with Microsoft Access�
for further analysis. The header
description was removed and the file was exported as a tab delimited file. Graphics were
drawn with Excel to have a quick insight into the quality of the data (see Figure 4.7 and
4.8).
Next step was to modify the flat file (tab delimited export from Excel) with a program
that is able to handle and modify tab delimited files. As programming language the inter-
preter language Perl has been chosen because it is known to be very powerful in handling
CHAPTER 3. METHODS 23
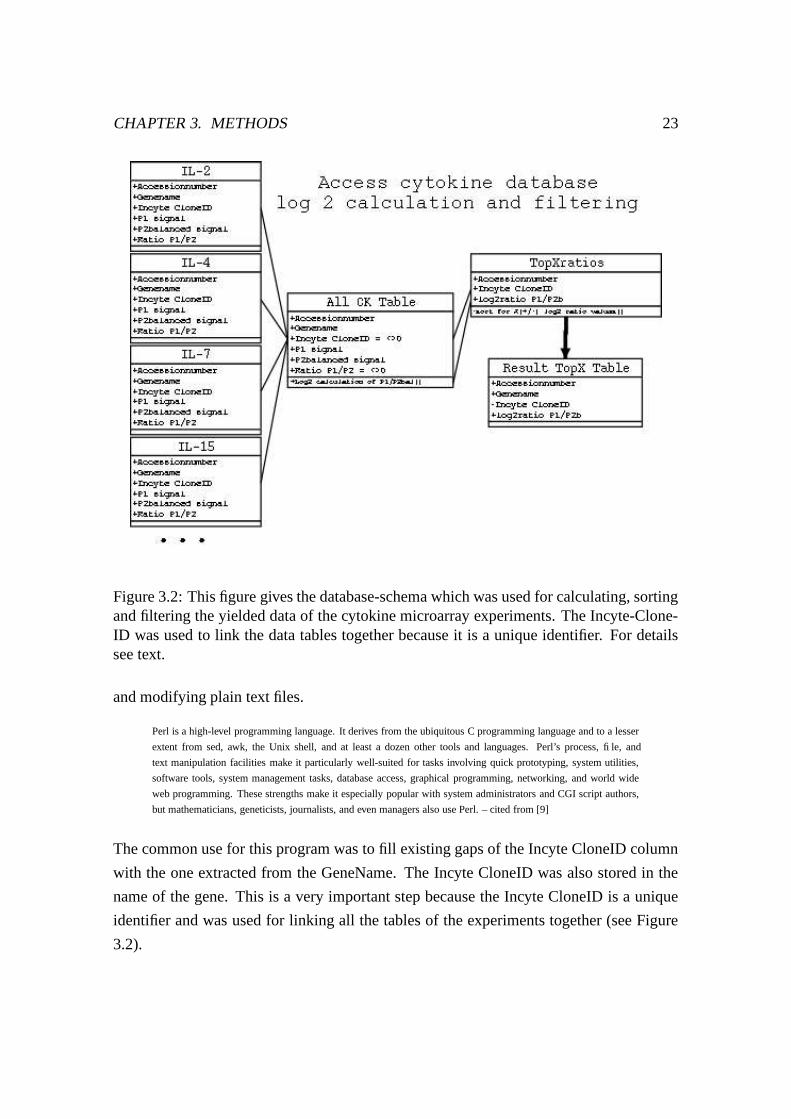
Figure 3.2: This figure gives the database-schema which was used for calculating, sortingand filtering the yielded data of the cytokine microarray experiments. The Incyte-Clone-ID was used to link the data tables together because it is a unique identifier. For detailssee text.
and modifying plain text files.
Perl is a high-level programming language. It derives from the ubiquitous C programming language and to a lesser
extent from sed, awk, the Unix shell, and at least a dozen other tools and languages. Perl’s process, file, and
text manipulation facilities make it particularly well-suited for tasks involving quick prototyping, system utilities,
software tools, system management tasks, database access, graphical programming, networking, and world wide
web programming. These strengths make it especially popular with system administrators and CGI script authors,
but mathematicians, geneticists, journalists, and even managers also use Perl. – cited from [9]
The common use for this program was to fill existing gaps of the Incyte CloneID column
with the one extracted from the GeneName. The Incyte CloneID was also stored in the
name of the gene. This is a very important step because the Incyte CloneID is a unique
identifier and was used for linking all the tables of the experiments together (see Figure
3.2).
CHAPTER 3. METHODS 24
After importing all the tables of the different experiments into Access, the integrity
of the new added column was tested. The database was sorted and filtered by various
parameters which have been chosen to be adequate for our needs. In specific, we looked
at the gene names with the corresponding gene expression value and the biological sense
of these ratios. For instance, if the cells were treated with IL-2, genes responsible for cell
division cycle or cell proliferation were expected to be upregulated (more expressed in
comparison with the reference).
Incyte Genomics did a comprehensive statistical study with 70 hybridization exper-
iments with a wide range of biological materials to monitor the reproducibility of the
LifeArrayTM technology under normal experimental conditions. The limit of detectable
differential expression is a 1.4 fold change in comparison to the reference [22] with a
high degree of confidence. Therefore in this study, the filtering value for the balanced
differential expression was set to 1.4 or 0.4854 in log2 term for the balanced differential
expression.
The Incyte GEM tables use its own computing of the expression ratio. If the P1 value
is greater than the P2 value, the ratio will be calculated with P1 divided by P2. If the P2
value is greater than the P1, then the ratio will be calculated with P2 divided by P1 and the
algebraic sign will be changed. In our case, the P1 value corresponds to the Cy-3 fluores-
cent signal and the P2 value corresponds to the Cy-5 signal. As Cy-5 is less intensive in
fluorescent signaling, this value was normalized which gives the P2 balanced differential
expression. For calculating the ratios, the P1 (Cy-3) and the P2 balanced signal (Cy-5)
were used. For a more natural understanding of double and half the ratios were trans-
formed into log2 scale.
= 6 ;)@8ACB)DFE�G 6)HI- $�J# K�ML +ON L @ *$�J# K� @ *Calculation of log2 from the gene expression ratio. P1 is the Cy-3 signal and P2 is the
balanced Cy-5 signal.
3.2.3 Clustering gene expression ratios
For clustering the gene expression ratios with different advanced clustering methods, Gen-
esis [47, 46] was used. Genesis is a versatile Java program which makes possible to
CHAPTER 3. METHODS 25
display the gene expression ratios in an intuitive way for human beings. All ratios are
displayed colorized - green for downregulated and red for upregulated genes.
Clustering in general allocates genes together which have similar expression ratios.
It is possible to cluster rows and/or columns. As a result, clusters will appear and genes
which have similarities in gene expression ratios, will cluster together. After clustering
genes together one may imply that the genes have functional similarities and/or they are
co-regulated in the cell [13]. Clustering may also be based on existing knowledge (super-
vised cluster). One example is SVM (support vector machine) which uses a previously
defined training set.
3.2.3.1 Hierarchical clustering (HCL)
A very common used algorithm today is hierarchical clustering (HCL) [5, 13]. Hierar-
chical clustering is an unsupervised clustering method and it computes a tree dendrogram
which shows very quickly the relationship between the genes and their corresponding
gene expression ratios. The objective of this algorithm is to assemble all elements into
one single tree. For similarity distance measurement the default adjustment from Genesis
(euclidian distance) and pearson uncentered were chosen.
3.2.3.2 Principal component analysis (PCA)
To compare the results of a glucocorticoid stimulation with cytokine stimulation principal
component analysis (PCA) has been applied. The goal of PCA is to reduce the high
dimensionality of the data matrix [56]. The first three components can be displayed in a
3 dimensional space.
3.2.4 GO - Gene Ontology
After completing the genome sequences of more and more organisms and the insight that
many gene products are functional conserved throughout different organisms, the gene-
ontology-database has been initiated in 1998 by the GO Consortium.
The Gene OntologyTM Consortium’s goal is to create a dynamic controlled vocabulary
that can be applied to all organisms even as knowledge of gene and protein roles in cells
is accumulating and changing. Therefore a database has been developed, available for
download as MySQL, XML or flat files, which provide the vocabulary for the description
CHAPTER 3. METHODS 26
of the molecular function, biological process and cellular component of gene products
[50, 51].
Many different databases like SWISS-PROT/TrEMBL, TIGR, Interpro and the En-
zyme database encourage GO and they supply links from their databases to the Gene
Ontology.
The GO database was used to assign the gene accessionnumbers which are given in
the microarray flat files, to the function of the gene product inside a cell. To retrieve the
GO database entry out of the accessionnumber - an indirect way over the hand curated
SWISS-PROT database has been chosen. The SWISS-PROT database links together both
databases, the GenBank with its accessionnumber and the GO database with the GO-ID.
An advantage of going this way is that all entries which are present in the SWISS-PROT
database are hand curated by curators and that they are more reliable.
The SWISS-PROT database was used on a linux cluster provided by the University
of Technology in Graz, Austria. For querying the database a perl program with the perl
database interface module (DBI) was used. The SWISS-PROT database release version
was 40.
For accessing the Gene Ontology data sources, perl programming language was used
again. The version of the GO database was 11-2002.
Chapter 4
Results
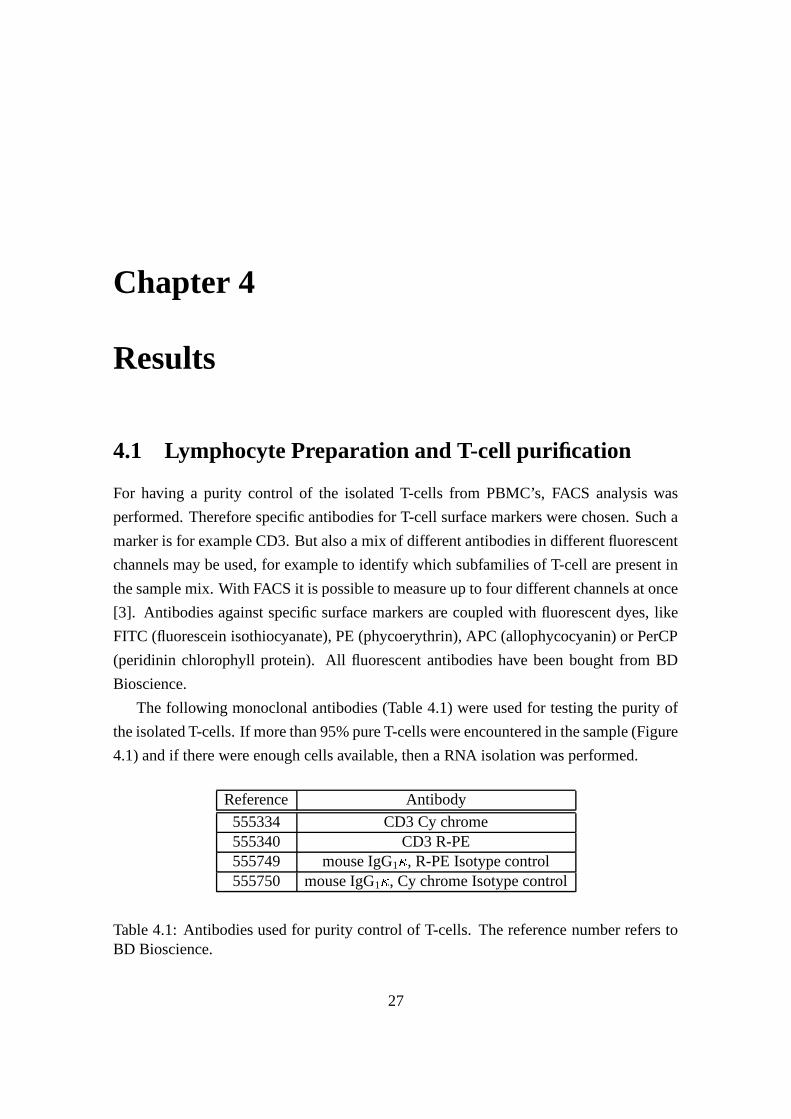
4.1 Lymphocyte Preparation and T-cell purification
For having a purity control of the isolated T-cells from PBMC’s, FACS analysis was
performed. Therefore specific antibodies for T-cell surface markers were chosen. Such a
marker is for example CD3. But also a mix of different antibodies in different fluorescent
channels may be used, for example to identify which subfamilies of T-cell are present in
the sample mix. With FACS it is possible to measure up to four different channels at once
[3]. Antibodies against specific surface markers are coupled with fluorescent dyes, like
FITC (fluorescein isothiocyanate), PE (phycoerythrin), APC (allophycocyanin) or PerCP
(peridinin chlorophyll protein). All fluorescent antibodies have been bought from BD
Bioscience.
The following monoclonal antibodies (Table 4.1) were used for testing the purity of
the isolated T-cells. If more than 95% pure T-cells were encountered in the sample (Figure
4.1) and if there were enough cells available, then a RNA isolation was performed.
Reference Antibody
555334 CD3 Cy chrome555340 CD3 R-PE555749 mouse IgG1 P , R-PE Isotype control555750 mouse IgG1 P , Cy chrome Isotype control
Table 4.1: Antibodies used for purity control of T-cells. The reference number refers toBD Bioscience.
27
CHAPTER 4. RESULTS 28
Figure 4.1: FACS T-cell purification control after negative selection with isotype control.
Isotype controls were used to occupy Fc receptors on the cells surfaces because anti-
bodies can not only bind with their variable region on the cell surface but also with their
Fc part on specific Fc receptors which are also present on the surface. So the isotype
controls were used to show how many antibodies may have bound to the Fc receptor in
comparison to all the other specific fluorescent labeled antibodies.
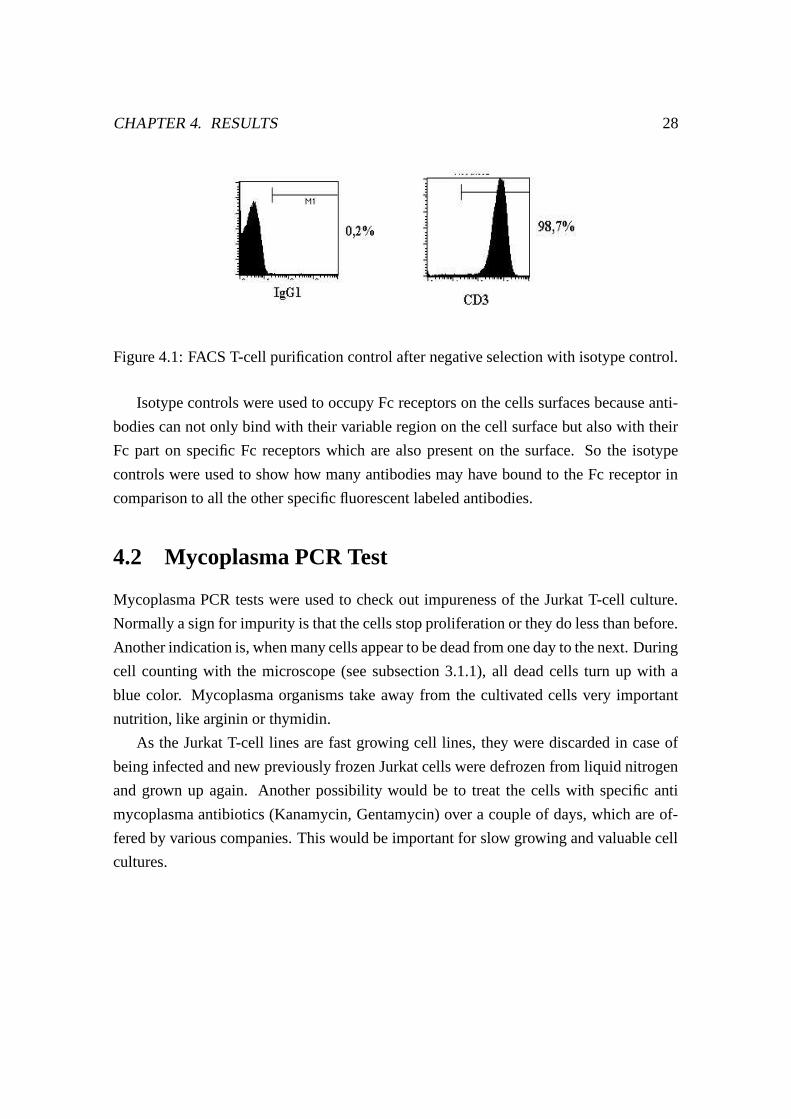
4.2 Mycoplasma PCR Test
Mycoplasma PCR tests were used to check out impureness of the Jurkat T-cell culture.
Normally a sign for impurity is that the cells stop proliferation or they do less than before.
Another indication is, when many cells appear to be dead from one day to the next. During
cell counting with the microscope (see subsection 3.1.1), all dead cells turn up with a
blue color. Mycoplasma organisms take away from the cultivated cells very important
nutrition, like arginin or thymidin.
As the Jurkat T-cell lines are fast growing cell lines, they were discarded in case of
being infected and new previously frozen Jurkat cells were defrozen from liquid nitrogen
and grown up again. Another possibility would be to treat the cells with specific anti
mycoplasma antibiotics (Kanamycin, Gentamycin) over a couple of days, which are of-
fered by various companies. This would be important for slow growing and valuable cell
cultures.
CHAPTER 4. RESULTS 29
Figure 4.2: Mycoplasma PCR test with Jurkat T-cell culture. The lanes from 1-6 aredifferent cell culture samples. A 1,5% agarose gel was used. Culture number 5 and 6were discovered to be infected. The image on the right side is the color inverted picturefrom the left one.
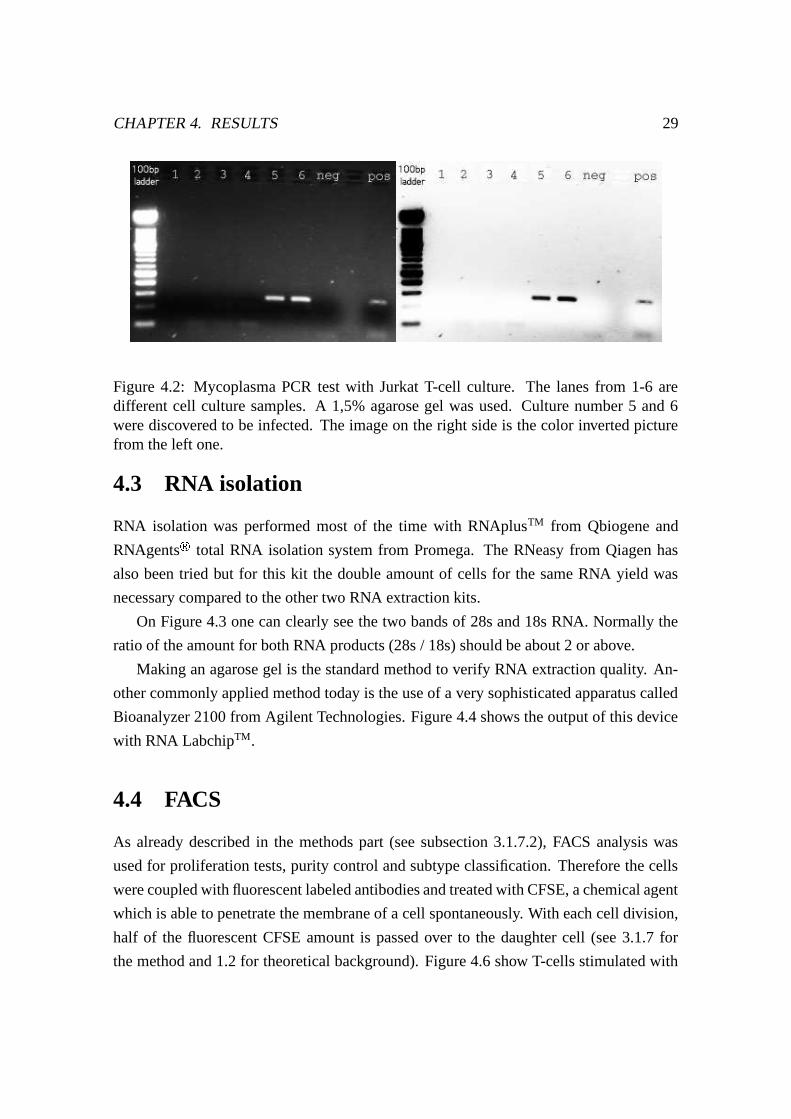
4.3 RNA isolation
RNA isolation was performed most of the time with RNAplusTM from Qbiogene and
RNAgents�
total RNA isolation system from Promega. The RNeasy from Qiagen has
also been tried but for this kit the double amount of cells for the same RNA yield was
necessary compared to the other two RNA extraction kits.
On Figure 4.3 one can clearly see the two bands of 28s and 18s RNA. Normally the
ratio of the amount for both RNA products (28s / 18s) should be about 2 or above.
Making an agarose gel is the standard method to verify RNA extraction quality. An-
other commonly applied method today is the use of a very sophisticated apparatus called
Bioanalyzer 2100 from Agilent Technologies. Figure 4.4 shows the output of this device
with RNA LabchipTM.
4.4 FACS
As already described in the methods part (see subsection 3.1.7.2), FACS analysis was
used for proliferation tests, purity control and subtype classification. Therefore the cells
were coupled with fluorescent labeled antibodies and treated with CFSE, a chemical agent
which is able to penetrate the membrane of a cell spontaneously. With each cell division,
half of the fluorescent CFSE amount is passed over to the daughter cell (see 3.1.7 for
the method and 1.2 for theoretical background). Figure 4.6 show T-cells stimulated with
CHAPTER 4. RESULTS 30
Figure 4.3: Jurkat RNA isolation. This is a 1% standard agarose gel. The first lane on theleft shows a human RNA standard. All other lanes display different Jurkat T-cell RNAisolated with RNAplusTM (see 3.1.4.2). The gel has been loaded with 1 � g standard RNAand with 2 � g Jurkat RNA
CHAPTER 4. RESULTS 31
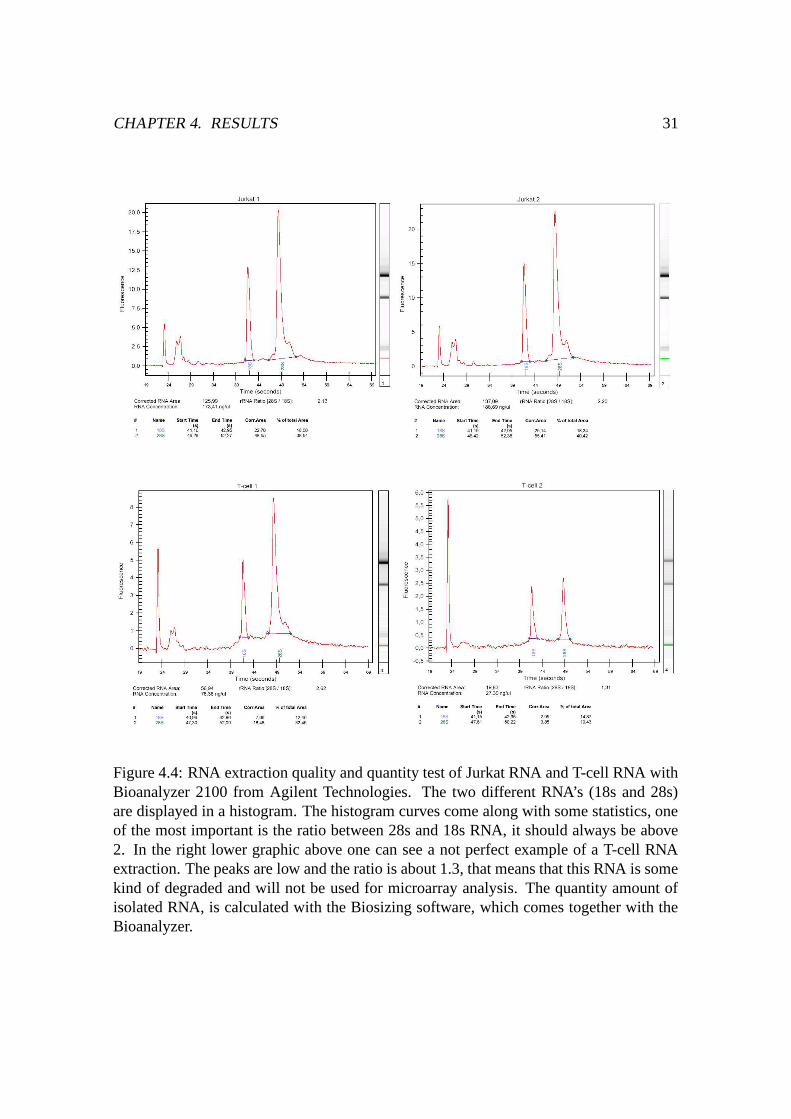
Figure 4.4: RNA extraction quality and quantity test of Jurkat RNA and T-cell RNA withBioanalyzer 2100 from Agilent Technologies. The two different RNA’s (18s and 28s)are displayed in a histogram. The histogram curves come along with some statistics, oneof the most important is the ratio between 28s and 18s RNA, it should always be above2. In the right lower graphic above one can see a not perfect example of a T-cell RNAextraction. The peaks are low and the ratio is about 1.3, that means that this RNA is somekind of degraded and will not be used for microarray analysis. The quantity amount ofisolated RNA, is calculated with the Biosizing software, which comes together with theBioanalyzer.
CHAPTER 4. RESULTS 32
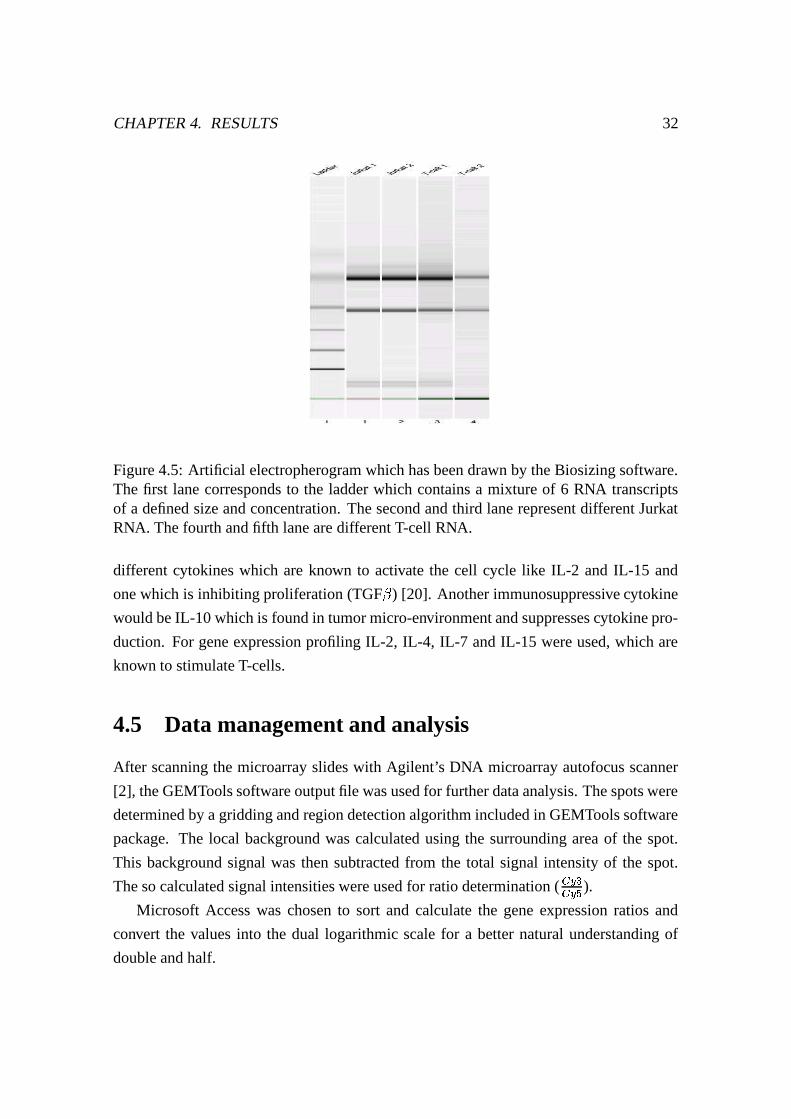
Figure 4.5: Artificial electropherogram which has been drawn by the Biosizing software.The first lane corresponds to the ladder which contains a mixture of 6 RNA transcriptsof a defined size and concentration. The second and third lane represent different JurkatRNA. The fourth and fifth lane are different T-cell RNA.
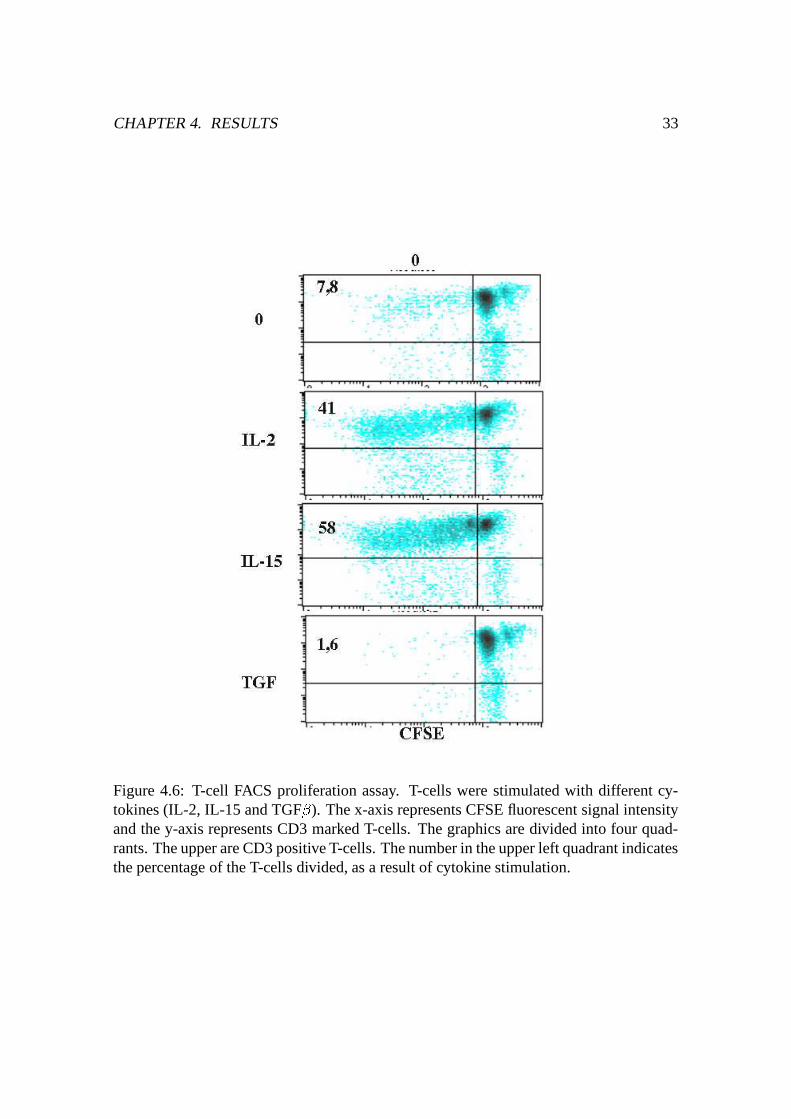
different cytokines which are known to activate the cell cycle like IL-2 and IL-15 and
one which is inhibiting proliferation (TGF � ) [20]. Another immunosuppressive cytokine
would be IL-10 which is found in tumor micro-environment and suppresses cytokine pro-
duction. For gene expression profiling IL-2, IL-4, IL-7 and IL-15 were used, which are
known to stimulate T-cells.
4.5 Data management and analysis
After scanning the microarray slides with Agilent’s DNA microarray autofocus scanner
[2], the GEMTools software output file was used for further data analysis. The spots were
determined by a gridding and region detection algorithm included in GEMTools software
package. The local background was calculated using the surrounding area of the spot.
This background signal was then subtracted from the total signal intensity of the spot.
The so calculated signal intensities were used for ratio determination ( Q�R�SQ�R�T ).Microsoft Access was chosen to sort and calculate the gene expression ratios and
convert the values into the dual logarithmic scale for a better natural understanding of
double and half.
CHAPTER 4. RESULTS 33
Figure 4.6: T-cell FACS proliferation assay. T-cells were stimulated with different cy-tokines (IL-2, IL-15 and TGF � ). The x-axis represents CFSE fluorescent signal intensityand the y-axis represents CD3 marked T-cells. The graphics are divided into four quad-rants. The upper are CD3 positive T-cells. The number in the upper left quadrant indicatesthe percentage of the T-cells divided, as a result of cytokine stimulation.
CHAPTER 4. RESULTS 34
Experiment Balance coefficient
IL-2 1.09IL-4 0.95IL-7 0.87
IL-15 1.07
Table 4.2: Balance coefficient (k) used in the different microarray experiments. Thebalanced coefficient is multiplied with P2 signal which gives the P2 balanced signal whichis further used for calculating the gene expression ratio.
First scatter plots for each experiment of the two signals given by Cy-3 (P1) and Cy-5
(P2) were plotted to estimate the quality of the data. A 45 � curve will statistically appear
if it is considered that in a microarray experiment only a few genes are regulated during a
stimulation with cytokines. Most of the genes will remain unregulated and will therefore
return a ratio value of 1 ( Q�RUSQ�RUT -WV ).
4.5.1 Data interpretation
The P2 signals (Cy-5) were normalized due to the different illuminating power of Cy-
3 and Cy-5 [41]. Cy-3 dye intensity is often higher than Cy-5 fluorescent intensity. A
balanced coefficient A#X H was calculated by the GEMTools software package to correct the
P2 signal by multiplying with this factor, this gives then the P2 balanced signal value
( Y[Z]\ - Y^Z`_aX ). For the signal intensity normalization, a global normalization method
was used by taking the mean value for all Cy-3 and Cy-5 values. Dividing these two
values results then in a ratio AOX H for normalizing the signal intensity. This normalization
method is usually utilized if only a few genes are expected to be differentially expressed
and they have a ratio around b 1.
Normalization in general is used to remove variation in microarray experiments like
varieties in labeling efficiency and therefore in the measured gene expression levels [55],
hence one have to adjust the signal intensity of one dye value with a correcting factor.
To have an idea how many genes are up- or downregulated scatter plots were drawn.
One can quickly see in such a plot all the genes which are differently regulated. In general
all those genes which fall off the 45 � diagonal line represent the regulated genes if they
are outside the range of the self-self hybridization or if they are outside of a previously
statistically defined range. The latter is utilized in this case, all genes which give aL +L @
CHAPTER 4. RESULTS 35
Figure 4.7: Graphical representation of the P1 signal (x-axis) and P2 balanced signal (y-axis) of IL-2, 4, 7 and IL-15 treated T-cells. The red dots outside the green 45 � diagonalreference line represent the controls used for the Incyte GEM microarray chip. Along thegreen 45 � diagonal line, all unregulated genes should statistically appear next to it. Thex- and y-axes are displayed in a logarithmic scale.
ratio value above or under b 1.4 [22] are supposed to be regulated. Figure 4.7 and Figure
4.8 display scatter plots to see the up- or downregulated genes.
To validate the hybridization of the slides and to see which threshold should be applied
for the signal intensities of Cy-3 and Cy-5, plots (signal in function of frequency) were
drawn (see Figure 4.10). What appeared was that IL-7 and IL-15 do have lower signal
intensities. Therefore a Cy-3 and Cy-5 signal filter greater than 400 has been applied for
data filtering (see 4.5.2) and only the most regulated gene expression ratios were used. In
Figure 4.9 the gene expression ratios were plot in function of frequency. One can see that
IL-7 and IL-15 do have a broader distribution curve than IL-2 and IL4. This means that
many genes seem to be regulated which are probably not.
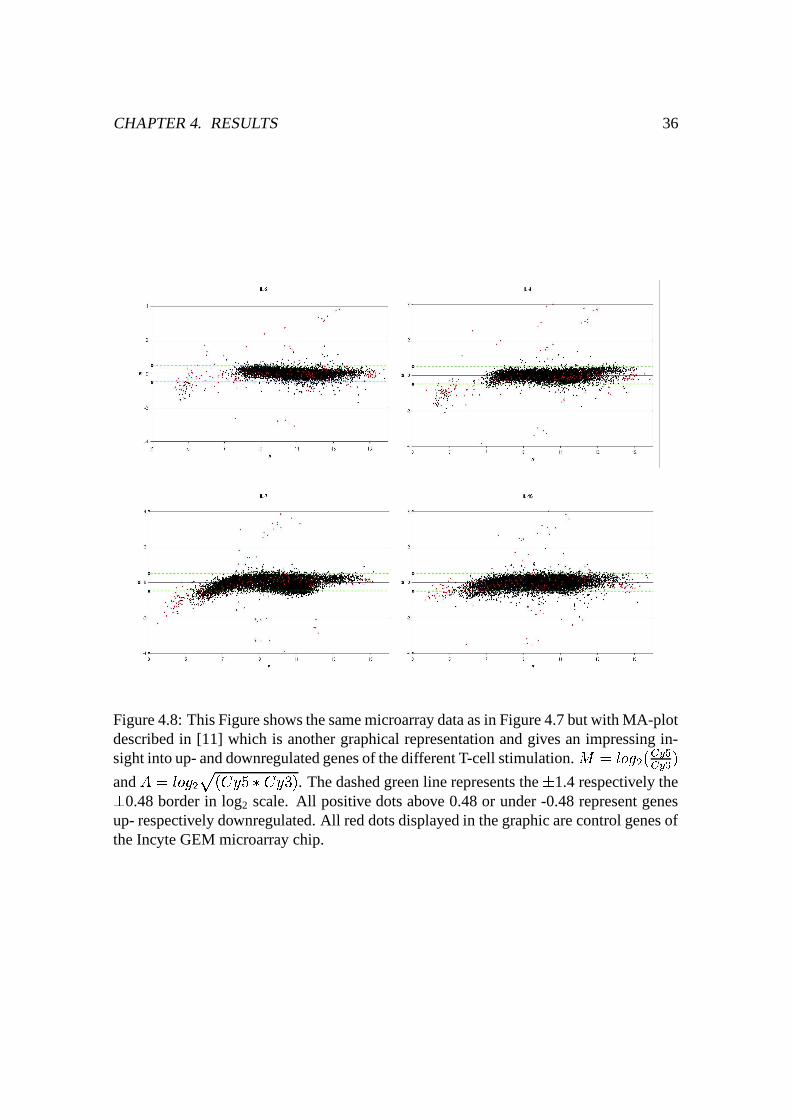
CHAPTER 4. RESULTS 36
Figure 4.8: This Figure shows the same microarray data as in Figure 4.7 but with MA-plotdescribed in [11] which is another graphical representation and gives an impressing in-sight into up- and downregulated genes of the different T-cell stimulation. c - = 6 ;d@]A Q�RUTQ�RUS Hand 2e- = 6 ;)@)f AOgahjik_kgah�l H . The dashed green line represents the b 1.4 respectively theb 0.48 border in log2 scale. All positive dots above 0.48 or under -0.48 represent genesup- respectively downregulated. All red dots displayed in the graphic are control genes ofthe Incyte GEM microarray chip.
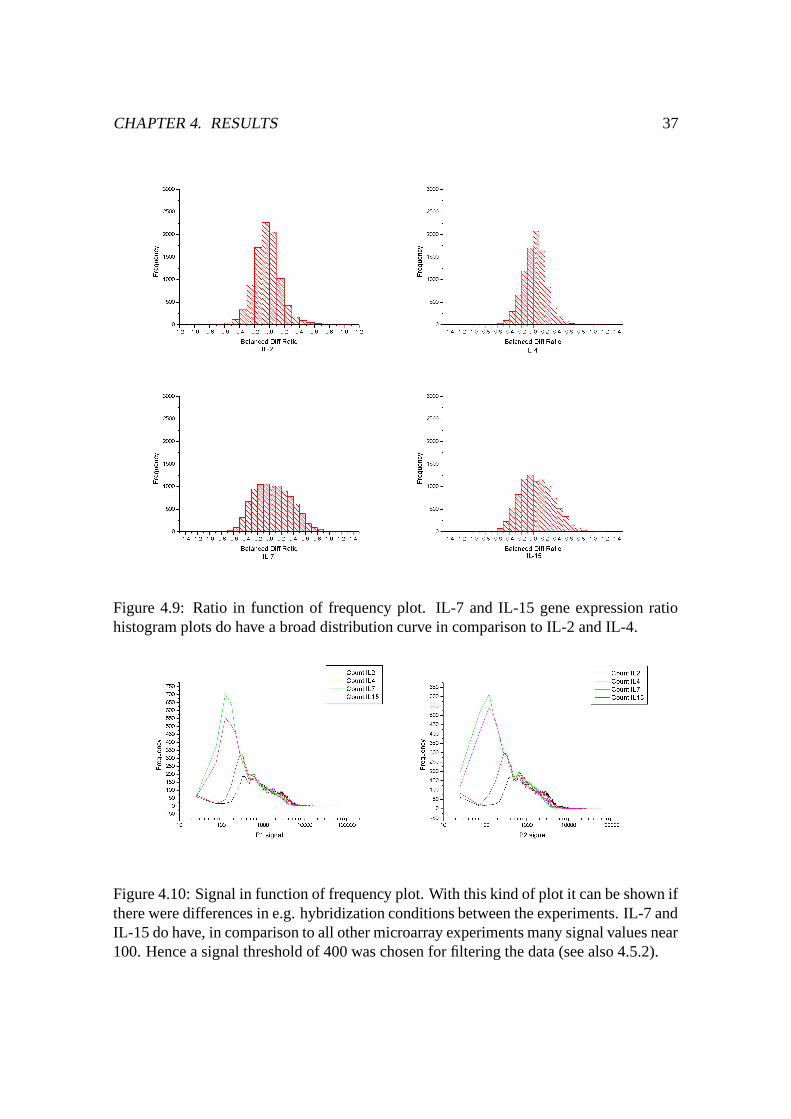
CHAPTER 4. RESULTS 37
Figure 4.9: Ratio in function of frequency plot. IL-7 and IL-15 gene expression ratiohistogram plots do have a broad distribution curve in comparison to IL-2 and IL-4.
Figure 4.10: Signal in function of frequency plot. With this kind of plot it can be shown ifthere were differences in e.g. hybridization conditions between the experiments. IL-7 andIL-15 do have, in comparison to all other microarray experiments many signal values near100. Hence a signal threshold of 400 was chosen for filtering the data (see also 4.5.2).
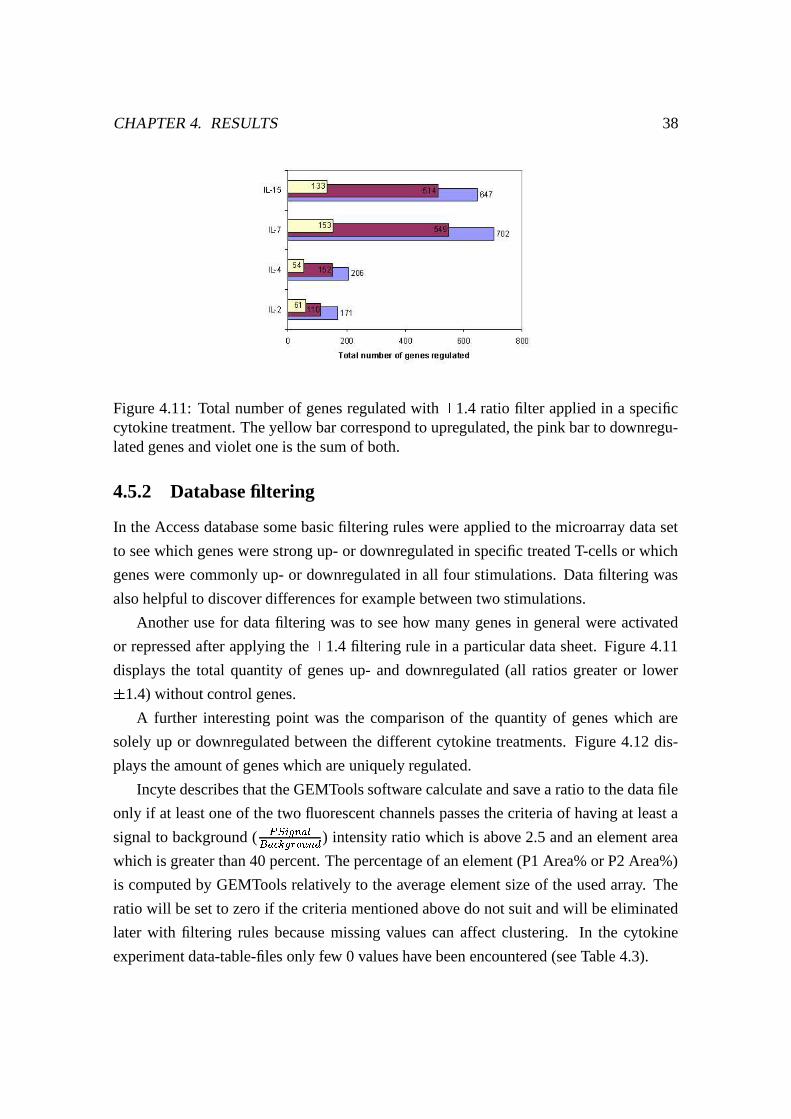
CHAPTER 4. RESULTS 38
Figure 4.11: Total number of genes regulated with b 1.4 ratio filter applied in a specificcytokine treatment. The yellow bar correspond to upregulated, the pink bar to downregu-lated genes and violet one is the sum of both.
4.5.2 Database filtering
In the Access database some basic filtering rules were applied to the microarray data set
to see which genes were strong up- or downregulated in specific treated T-cells or which
genes were commonly up- or downregulated in all four stimulations. Data filtering was
also helpful to discover differences for example between two stimulations.
Another use for data filtering was to see how many genes in general were activated
or repressed after applying the b 1.4 filtering rule in a particular data sheet. Figure 4.11
displays the total quantity of genes up- and downregulated (all ratios greater or lower
b 1.4) without control genes.
A further interesting point was the comparison of the quantity of genes which are
solely up or downregulated between the different cytokine treatments. Figure 4.12 dis-
plays the amount of genes which are uniquely regulated.
Incyte describes that the GEMTools software calculate and save a ratio to the data file
only if at least one of the two fluorescent channels passes the criteria of having at least a
signal to background (L�monp �qsrt$u rtvxwU �y,J#z�qs� ) intensity ratio which is above 2.5 and an element area
which is greater than 40 percent. The percentage of an element (P1 Area% or P2 Area%)
is computed by GEMTools relatively to the average element size of the used array. The
ratio will be set to zero if the criteria mentioned above do not suit and will be eliminated
later with filtering rules because missing values can affect clustering. In the cytokine
experiment data-table-files only few 0 values have been encountered (see Table 4.3).
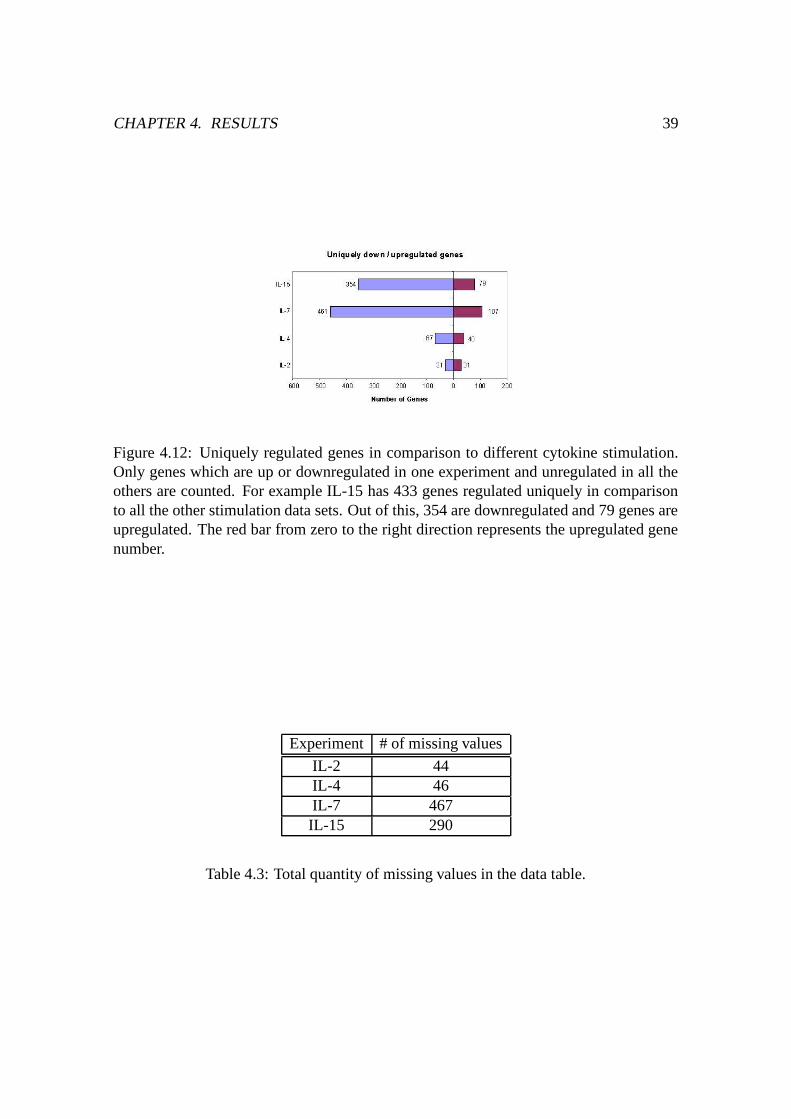
CHAPTER 4. RESULTS 39
Figure 4.12: Uniquely regulated genes in comparison to different cytokine stimulation.Only genes which are up or downregulated in one experiment and unregulated in all theothers are counted. For example IL-15 has 433 genes regulated uniquely in comparisonto all the other stimulation data sets. Out of this, 354 are downregulated and 79 genes areupregulated. The red bar from zero to the right direction represents the upregulated genenumber.
Experiment # of missing values
IL-2 44IL-4 46IL-7 467
IL-15 290
Table 4.3: Total quantity of missing values in the data table.
CHAPTER 4. RESULTS 40
Before clustering the full data set with Genesis software, different filters were applied
to the data set. First approach was to remove all non stimulated genes from the data set
which contained 9182 gene expression ratios. Therefore a query was applied for genes
which were up- or downregulated in at least one out of all experiments and a signal thresh-
old was applied for each experiment and for both signaling channels. So only those genes
which were not regulated in all experiments have been removed for clustering or in other
words only those genes which were regulated in at least one experiment have been kept
for clustering. After this query 2167 genes remained in the table, but most of them did
not seem to be relevant concerning the aim of this study.
Therefore a second approach was to get only the most up- or downregulated genes.
The query was designed to filter out all genes with P1 and P2 balanced signals lower than
400 and to take the top 100 up- and the top 100 downregulated genes of each experiment.
This was the better way because many important genes remained in the dataset. A further
advantage of applying the P-signal threshold with a value of 400 was that all genes with
low P-signal values and high ratios were removed. This was important because the IL-7
and the IL15 microarray had many low signals (see Figure 4.10).
If one gene expression value was 0, what corresponds to a missing value, it was re-
moved from the dataset.
4.5.3 GO database
From 8606 genes (genes without controls and zero values) 2157 genes have at least one
GO entry. After filtering the access database as described above, a dataset with 627 genes
(top 100 ratios of each experiment IL-2, 4, 7 and IL-15) was yielded from a beginning
amount of 9182 genes. 181 genes of 627 had at least one SWISS-PROT entry and one
GO entry, this are 28.9%. The linking from the GenBank accessionnumber to the SWISS-
PROT database is 1 –> n and again 1 –> n to the GO database. After querying the Gen-
Bank accessionnumbers to the SWISS-PROT and GO database, a GO identifier and the
corresponding GO tree has been obtained.
Next, the GO tree was filtered for genes with specific biological functions which are
for interest in this work. For example genes which are “immune” related or involved in
the “proliferation” process of a cell. Other keywords in addition to those mentioned above
were “apoptosis”, “death” and “signal transduction”. 75 genes remained which matched
at least one of the keywords above. These were applied to the 627 genes which were
CHAPTER 4. RESULTS 41
clustered in the Genesis program. This gave us nearly 12 percent of genes mapped to
a function of interest in the GO database. Additional genes which fall into one of the
classification above were marked by using expert knowledge and literature. All in all 156
genes got classified (24.9%) into one of the four keyword clusters mentioned above.
The dataset of 627 genes contained 114 expressed sequence tags (ESTs) whose func-
tion is not known yet. These genes may be potentially new but EST’s with similar expres-
sion values do not necessarily represent similar function [49].
4.5.4 Data consistency check
After data handling, filtering and calculating, a quality check for consistency was per-
formed. The original data was used to compare it with the handled data. A new database
for comparison was built up with the original data tables and the handled one. These
two databases were compared to each other, watching at all gene expression ratios, to
ensure that the data values have not been modified. Problems with data consistency will
appear e.g. if one TAB delimiter is not recognized or removed during data import and
will therefore clutter up the data.
4.6 Microarray data clustering
After preparation of the Incyte GEM file data with Microsoft’s Access database, the query
was exported as a tab delimited flat file, converted into stanford file format [1] and opened
with Genesis for clustering on the gene expression ratios.
4.6.1 Cluster analysis with Genesis
Genesis is able to cluster gene expression data with different clustering methods. Hierar-
chical clustering was used for the experiments described in this thesis.
4.6.2 HCL
Hierarchical clustering is one of the most widely applied clustering method today. HCL
is used to get a tree dendrogram of similar genes which cluster together. The tree dendro-
gram can be used to visualize and select interesting clusters like those genes which are
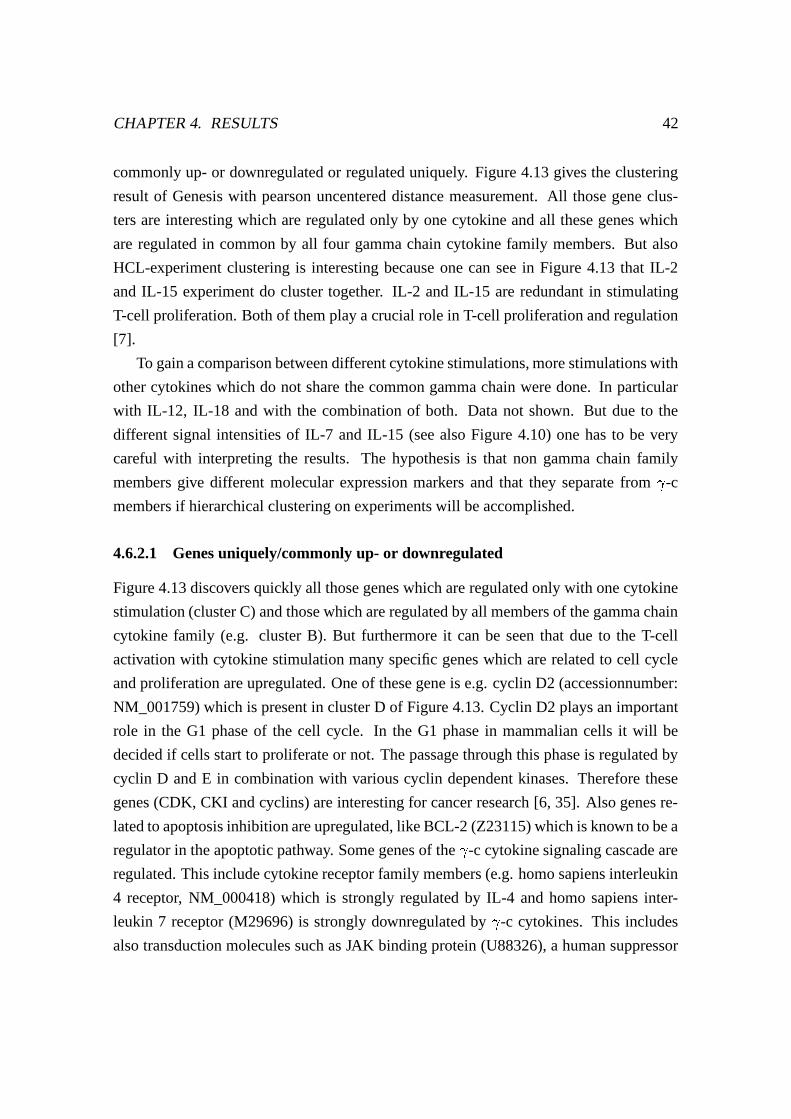
CHAPTER 4. RESULTS 42
commonly up- or downregulated or regulated uniquely. Figure 4.13 gives the clustering
result of Genesis with pearson uncentered distance measurement. All those gene clus-
ters are interesting which are regulated only by one cytokine and all these genes which
are regulated in common by all four gamma chain cytokine family members. But also
HCL-experiment clustering is interesting because one can see in Figure 4.13 that IL-2
and IL-15 experiment do cluster together. IL-2 and IL-15 are redundant in stimulating
T-cell proliferation. Both of them play a crucial role in T-cell proliferation and regulation
[7].
To gain a comparison between different cytokine stimulations, more stimulations with
other cytokines which do not share the common gamma chain were done. In particular
with IL-12, IL-18 and with the combination of both. Data not shown. But due to the
different signal intensities of IL-7 and IL-15 (see also Figure 4.10) one has to be very
careful with interpreting the results. The hypothesis is that non gamma chain family
members give different molecular expression markers and that they separate from � -c
members if hierarchical clustering on experiments will be accomplished.
4.6.2.1 Genes uniquely/commonly up- or downregulated
Figure 4.13 discovers quickly all those genes which are regulated only with one cytokine
stimulation (cluster C) and those which are regulated by all members of the gamma chain
cytokine family (e.g. cluster B). But furthermore it can be seen that due to the T-cell
activation with cytokine stimulation many specific genes which are related to cell cycle
and proliferation are upregulated. One of these gene is e.g. cyclin D2 (accessionnumber:
NM_001759) which is present in cluster D of Figure 4.13. Cyclin D2 plays an important
role in the G1 phase of the cell cycle. In the G1 phase in mammalian cells it will be
decided if cells start to proliferate or not. The passage through this phase is regulated by
cyclin D and E in combination with various cyclin dependent kinases. Therefore these
genes (CDK, CKI and cyclins) are interesting for cancer research [6, 35]. Also genes re-
lated to apoptosis inhibition are upregulated, like BCL-2 (Z23115) which is known to be a
regulator in the apoptotic pathway. Some genes of the � -c cytokine signaling cascade are
regulated. This include cytokine receptor family members (e.g. homo sapiens interleukin
4 receptor, NM_000418) which is strongly regulated by IL-4 and homo sapiens inter-
leukin 7 receptor (M29696) is strongly downregulated by � -c cytokines. This includes
also transduction molecules such as JAK binding protein (U88326), a human suppressor
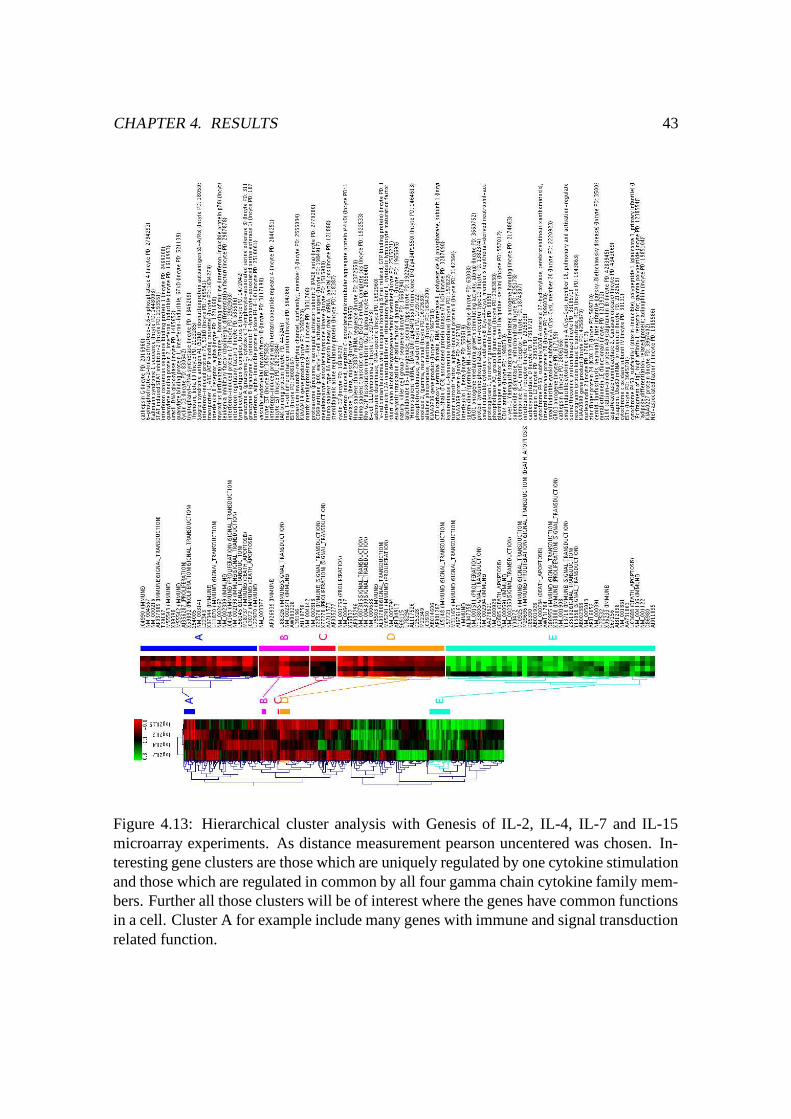
CHAPTER 4. RESULTS 43
Figure 4.13: Hierarchical cluster analysis with Genesis of IL-2, IL-4, IL-7 and IL-15microarray experiments. As distance measurement pearson uncentered was chosen. In-teresting gene clusters are those which are uniquely regulated by one cytokine stimulationand those which are regulated in common by all four gamma chain cytokine family mem-bers. Further all those clusters will be of interest where the genes have common functionsin a cell. Cluster A for example include many genes with immune and signal transductionrelated function.
CHAPTER 4. RESULTS 44
of cytokine signaling-1 (SOCS-1) which is strongly upregulated due to the activation with
cytokines. Also homo sapiens mal T-cell differentiation protein (NM_002371) which is
also part of T-cell maturation and signal transduction is upregulated by al � -c cytokines,
both are shown in Figure 4.13 cluster B. Interestingly some of the signaling molecules are
specifically regulated by one � -c cytokine. For example SSI-2 (AF037989), an inhibitor
of the JAK/STAT pathway is strongly upregulated by IL-2 not regulated by IL-4 and
downregulated by IL-7. Several STAT molecules are phosphorylated by � -c cytokines. It
is known that IL-2, IL-7 and IL-15 induce STAT-5 whereas IL-4 induce STAT-6. Inter-
estingly some genes are regulated by IL-2, IL-7 and IL-15 but not by IL-4 such as genes
found in cluster A and D. For example interferon regulatory factor 1 (NM_002198) has a
STAT-5 binding site in his promotor and shows a clear upregulation following IL-2, IL-7
and IL-15 but not IL-4 stimulation.
A further result is that the clusters A-E include many genes which are somehow im-
mune and signal transduction related. Furthermore 11 totally unknown genes were reg-
ulated by these cytokines and are therefore of interest for further investigation. The in-
formation about the function was retrieved from the GO database. One may obtain many
genes which are turned on or off with a stimulation and give ratios up- or downregulated
out of the dataset. To verify the plausibility, additional analyses have to be performed.
4.6.2.2 Comparison between cytokines and glucocorticoids
Glucocorticoids sometimes referred to as corticosteroids are substances which possess
anti-inflammatory and immunosuppressive properties. Therefore these drugs (hormones)
are mostly used for reducing the number and the activity of immune cells. In comparison
to the cytokine stimulation the glucocorticoid stimulation with e.g. dexamethasone (DEX)
has different gene expressions. After clustering the experiments with the 3 dimensional
principal component clustering algorithm, it can be shown that DEX stimulation fells
apart in comparison to the cytokine stimulation (see Figure 4.14).
4.6.2.3 Combination of GO database and hierarchical clustering
The GO database identifier and the GO tree description was assigned to all genes with
known function. Eisen et al. [13] described in Saccharomyces cerevisiae, that genes
of known similar function will cluster together. They also found similar tendencies in
human. In Figure 4.13 one can see that this is also the case with the different cytokine
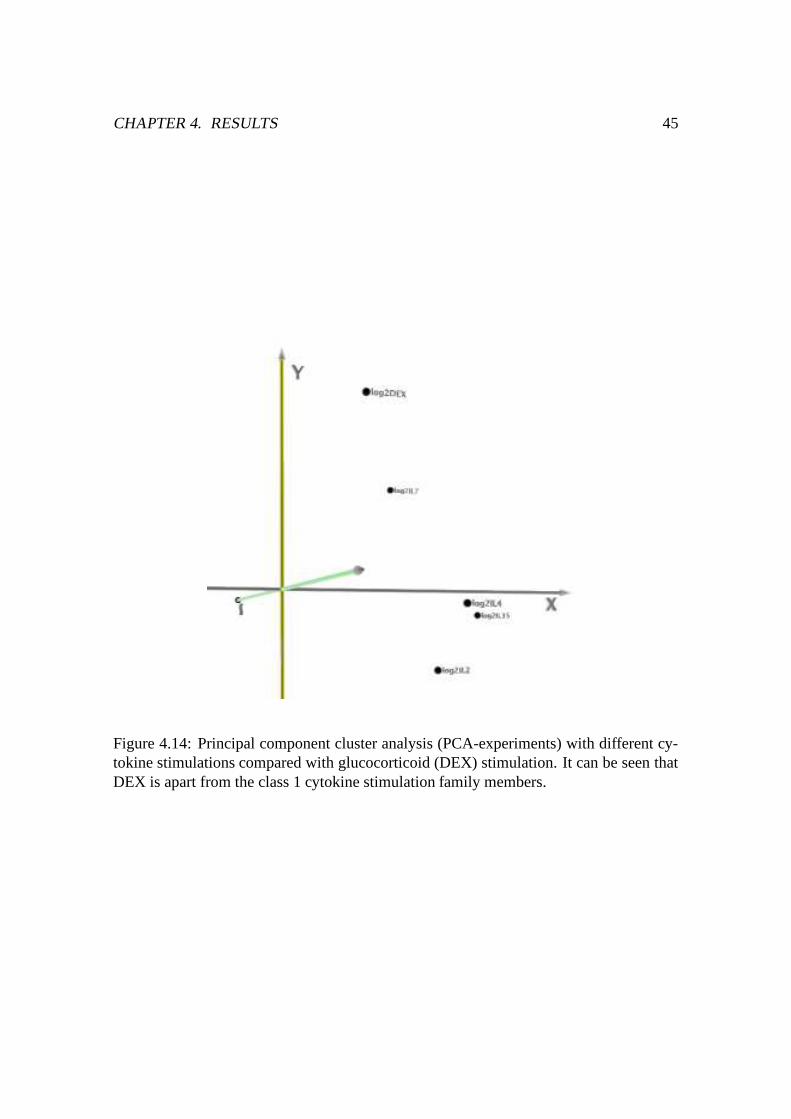
CHAPTER 4. RESULTS 45
Figure 4.14: Principal component cluster analysis (PCA-experiments) with different cy-tokine stimulations compared with glucocorticoid (DEX) stimulation. It can be seen thatDEX is apart from the class 1 cytokine stimulation family members.

CHAPTER 4. RESULTS 46
stimulations used in this work. Using the GO database combined with HCL might be
a way to find genes with unknown function by clustering them together with genes of
known functions. But one has to be careful, because opinions about EST’s and their
biological functions are divided as already mentioned.
Chapter 5
Discussion
This master thesis demonstrate that stimulation of T-cells with cytokines that activate the
common � chain receptor family, have specific effects on gene expression. It is shown that
many cell-proliferation related genes will be strongly regulated, if the cytokine stimulus
gets in contact with the cell surface. This result is in excellent accordance with existing
literature. Genes related to signaling cascades, apoptosis and genes related to the immune
system have been discovered to be regulated. Cytokine stimulation alters T-cell prolifer-
ation behavior. Some inhibit the cell proliferation like TGF � , others like IL-2 and IL-15
turned out to be strong activators of cell proliferation.
For deeper insights into the biological processes, molecular function and cellular com-
ponents the GO database with 46199 entries (November 2002) was used. In combination
with up to date clustering methods, this database will be a potentially useful tool in future.
The functional databases like GO as a tool for unification of biology, will get more and
more entries and the different software tools will develop to facilitate the database access
for biologists.
Because of the lower signal intensities and broad ratio histogram curve of the IL-7
and IL-15 microarrays, one has to be cautious with the results of these two slides despite
filtering with signal intensities. But for these microarray pilot study the data has been
kept to show a way for analyzing the huge amount of data which is being produced with
microarray experiments. Due to the fact that microarray science is evolving very quick,
many things have to be reconsidered and improved in future. Additional tests have to be
performed. The results of the microarray data has to be confirmed with molecular stan-
dard methods like northern blot, PCR or, for additional quantification of gene expression,
47
CHAPTER 5. DISCUSSION 48
real time PCR. Many important things have changed since the year 2001. Today more du-
plicates and also more chips will be used for one stimulation experiment for comparison
to each other. Statistician’s are working with up to date methods on the normalization of
the generated data. Global normalization like it was used with these microarrays is not
the first choice any more.
An interesting point in future will be to perform microarray time series with different
stimulations and to look how genes alter their gene expression over time. After a stimu-
lation, mRNA concentration in a cell may be changed very quick and the mRNA lifetime
will not be the same for all genes. The mRNA lifetime depends on the biological function.
One example are mRNA’s encoding for cytokines. Inducible genes require rapid up- or
downregulation to respond to a stimulus and also to terminate this response afterwards.
A further, very promising approach to discover unknown genes will be the support
vector (SVM) clustering algorithm. SVM is a supervised clustering method. The support
vector machine can be trained with a gene dataset of known function. Many classified
genes have been published in the literature [19, 44, 49] and can be used to generate a
positive training set where genes are defined as a member of a specific category. The only
drawback is that SVM is a very sophisticated clustering algorithm where many parameters
can be changed which may complicate getting reasonable results.
Working with microarrays in the field of immunology is very interesting because im-
munology is a very extensive science and the regulatory mechanisms are very complex.
Understanding the large and complex regulation of the immune system is not an easy task.
Many genes are involved in a specific mechanism and many regulate their own expression
(feedback regulation). To gain comprehensive insights for one specific interesting or not
yet known gene, many additional procedures have to be performed like searching in litera-
ture and sequence databases (with e.g. BLAST) or map the gene product to a biochemical
pathway if there are similarities to enzymes in sequence and in structure. If the gene of
interest is thought to be a e.g. transcription factor, additional gene expression studies will
be necessary. The dataset for this study was filtered with parameters which are described
above. Many other interesting genes may turn up, if other filters will be applied. It is a
crucial point to select those filters very carefully and one may alter the filtering method to
his own need.
In summary, this master thesis demonstrates the feasibility of using high-throughput
technologies for identifying mechanisms of cytokine stimulation. cDNA microarray tech-
nology is a very good first approach for getting ideas and quick insights into possible

CHAPTER 5. DISCUSSION 49
molecular regulation but further studies are necessary to gain comprehensive insights into
the biological processes of a cell.

Acknowledgment
I would like to thank my supervisors Zlatko Trajanoski in Graz and Jérôme Galon in
Paris for their guidance of this work. Both have given me the possibility to do my master
thesis abroad.
I am grateful to all members of Inserm U255 from whom I could learn a lot in the field of
immunology and I am especially grateful to my colleagues of the Bioinformatics-group
at the Institute of Biomedical Engineering in Graz who took the time, listened and
discussed with me queries that came up and who gave me valuable inputs for my work.
Special thanks are directed to my family and my companion Margit, they supported me
all the time during this work.
Bibliography
[1] Stanford file format. http://genome-www5.stanford.edu/MicroArray/help/formats.shtml.
[2] Agilent Technologies. Agilent DNA Microarray Scanner.
http://www.chem.agilent.com/scripts/pds.asp?lPage=398.
[3] BD Bioscience. Introduction to Flow Cytometry. (Manual Part Number: 11-11032-
01), April 2000. http://www.bdbiosciences.com/.
[4] Boguski Mark S. The turning point in genome research. Trends in Biochemical
Sciences, 20(8):295–296, 1995.
[5] Brazma Alvis and Vilo Jaak. Gene expression data analysis. FEBS Letters, 480:17–
24, 2000.
[6] Brooks Alan R., Shiffman Dov, Chan Christine S., Brooks Eric E., and Milner Peter
G. Functional Analysis of the Human Cyclin D2 and Cyclin D3 Promoters. The
Journal of Biological Chemistry, 271(15):9090–9099, 12 April 1996.
[7] Chang Li Xian, Demirci Gulcin, Ferrari-Lacraz Sylvie, Groves Chris, Coyle An-
thony, Malek Thomas R., and Strom Terry B. IL-15 and IL-2: a matter of life and
death for T cells in vivo. Nature Medicine, 7(1):114–118, January 2001.
[8] Chen Elbert H., Gadina Massimo, Galon Jérôme, Chen Min, and O’Shea John J. Not
just another meeting: the coming of age of JAKs and STATs. Immunology Today,
(19):338–341, 1998.
[9] Christiansen Tom and Torkington Nathan. Perl 5.6 Documentation.
http://www.perldoc.com/perl5.6/pod/perlfaq1.html#What-is-Perl-.
[10] Crick F. Central dogma of molecular biology. Nature, 227(258):561–563, 1970.
51
BIBLIOGRAPHY 52
[11] Dudoit Sandrine, Yang Yee Hwa, Callow Matthew J., and Speed
Terence P. Statistical methods for identifying differentially ex-
pressed genes in replicated cDNA microarray experiments. http://stat-
www.berkeley.edu/users/terry/zarray/TechReport/578.pdf, August 2000. Technical
report # 578, August 2000.
[12] Duggan David J., Bittner Michael, Chen Yidong, Meltzer Paul, and Trent Jeffrey M.
Expression profiling using cDNA microarrays. Nature genetics, 21:10–14, January
1999.
[13] Eisen M. B., Spellman P. T., Brown P. O., and Botstein D. Cluster analysis and
display of genome-wide expression patterns. Proc Natl Acad Sci, 95:14863–14868,
1998.
[14] European Molecular Biology Laboratory. WWW. http://www.embl-heidelberg.de/.
[15] Evertsz Elisabeth, Starink Pascual, Gupta Robert, and Watson Drew. Technology
and Application of Gene Expression Microarrays, volume Microarray biochip tech-
nology. 2000.
[16] Fleischmann R.D., Adams M.D., and White O. Whole-genome random sequencing
and assembly of Haemophilus influenzae Rd. Science, 269(5223):496–512, 28 June
1995.
[17] Fulcher D. and Wong S. Carboxyfluorescein succinimidyl ester-based proliferative
assays for assessment of T cell function in the diagnostic laboratory. Immunology
and Cell Biology, 77(6):559–564, December 1999.
[18] Gadina Massimo, Hilton Douglas, Johnston James A., Morinobu Akio, Lighvani
Arash, Zhou Yong-Jie, Visconti Roberta, and O’Shea John J. Signaling by Type I
and II cytokine receptors: ten years after. Current Opinion in Immunology, 13:363–
373, 2001.
[19] Galon Jérôme, Franchimont Denis, Hiroi Naoki, Frey Gregory, Boettner Antje,
Ehrhart-Bornstein Monika, O’Shea John J., Chrousos George P., and Bornstein Ste-
fan R. Gene profiling reveals unknown enhancing and suppressive actions of gluco-
corticoids on immune cells. The FASEB Journal, 16:61–71, January 2002.
BIBLIOGRAPHY 53
[20] Goldsby Richard, Kindt Thomas J, and Osborne Barbara A. Kuby Immunology 4.
Edition. W. H. Freeman, 2000.
[21] Ihle James N. Cytokine receptor signalling. Nature, 377:591–594, October 1995.
[22] Incyte Pharmaceuticals Inc. LifeArray Chip Validation. http://www.incyte.com.
IncyteGenomics Internet Resource.
[23] Incyte Pharmaceuticals Inc. GEM Microarray Reproducibility Study.
http://www.incyte.com, 1999. INCYTE Technical survival PN 99-0169 9/99.
[24] Incyte Pharmaceuticals Inc. LifeArray Microarray Technology.
http://www.incyte.com, June 1999. INCYTE Technology Overview PN 99-
0062 6/99.
[25] Incyte Pharmaceuticals Inc. UniGEM V Experiment Analysis.
http://www.incyte.com, 1999. INCYTE Technical Application PN xx-xxxx
x/99.
[26] International Human Genome Sequencing Consortium. Initial sequencing and anal-
ysis of the human genome. Nature, 409:860–921, February 2001.
[27] International Human Genome Sequencing Consortium. A physical map of the hu-
man genome. Nature, 409:934–941, 15 February 2001.
[28] Jackson David A., Symons Robert H., and Berg Paul. A Biochemical Method for In-
serting New Genetic Information into SV40 DNA: Circular SV40 DNA Molecules
Containing Lambda Phage Genes and the Galactose Operon of E. coli. PNAS,
69(2904), 1972.
[29] Jacobson, Pilaro, and Smith. Rational Interleukin 2 Therapy for HIV Positive Indi-
viduals: Daily Low Doses Enhance Immune Function without Toxicity. Proc. Natl.
Acad. Sci., 93 (19): 10405-10410, 17 September 1996.
[30] Leonard Warren J. and O’Shea John J. JAKS AND STATS: Biological Implications.
Annu. Rev. Immunol., (16):293–322, 1998.
[31] Lewin Benjamin. Genes VI. Oxford University Press, April 1997. 6 edition.
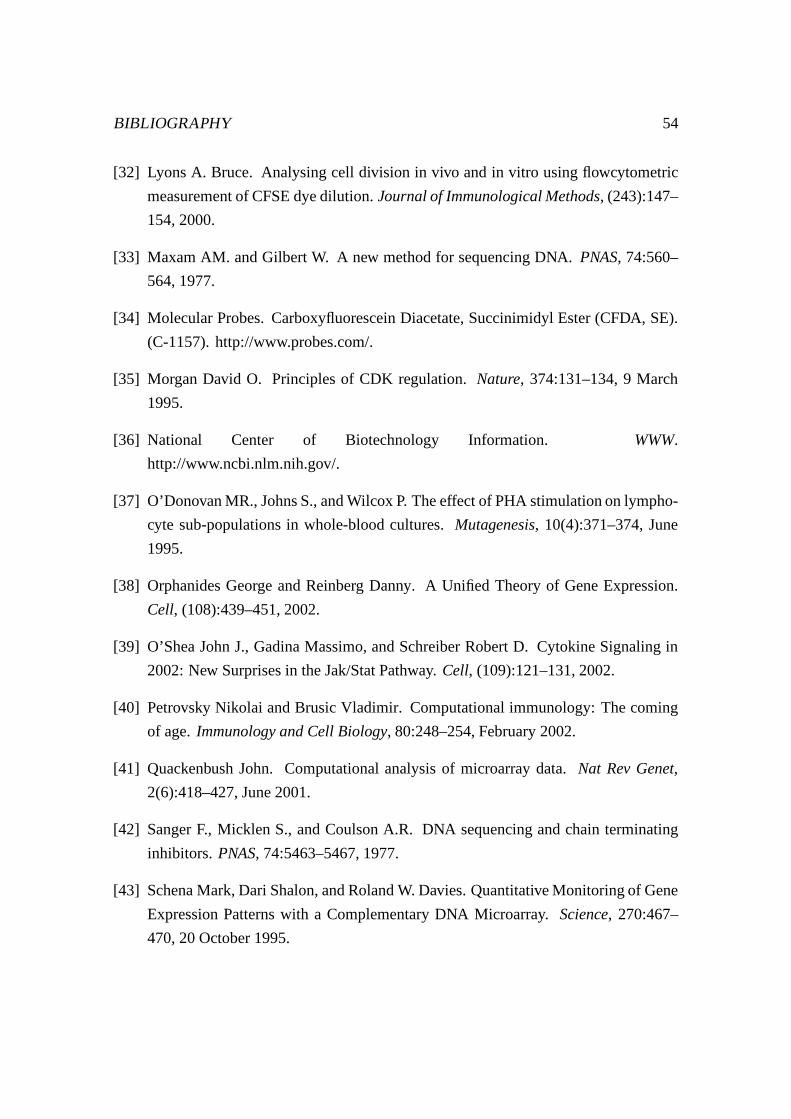
BIBLIOGRAPHY 54
[32] Lyons A. Bruce. Analysing cell division in vivo and in vitro using flowcytometric
measurement of CFSE dye dilution. Journal of Immunological Methods, (243):147–
154, 2000.
[33] Maxam AM. and Gilbert W. A new method for sequencing DNA. PNAS, 74:560–
564, 1977.
[34] Molecular Probes. Carboxyfluorescein Diacetate, Succinimidyl Ester (CFDA, SE).
(C-1157). http://www.probes.com/.
[35] Morgan David O. Principles of CDK regulation. Nature, 374:131–134, 9 March
1995.
[36] National Center of Biotechnology Information. WWW.
http://www.ncbi.nlm.nih.gov/.
[37] O’Donovan MR., Johns S., and Wilcox P. The effect of PHA stimulation on lympho-
cyte sub-populations in whole-blood cultures. Mutagenesis, 10(4):371–374, June
1995.
[38] Orphanides George and Reinberg Danny. A Unified Theory of Gene Expression.
Cell, (108):439–451, 2002.
[39] O’Shea John J., Gadina Massimo, and Schreiber Robert D. Cytokine Signaling in
2002: New Surprises in the Jak/Stat Pathway. Cell, (109):121–131, 2002.
[40] Petrovsky Nikolai and Brusic Vladimir. Computational immunology: The coming
of age. Immunology and Cell Biology, 80:248–254, February 2002.
[41] Quackenbush John. Computational analysis of microarray data. Nat Rev Genet,
2(6):418–427, June 2001.
[42] Sanger F., Micklen S., and Coulson A.R. DNA sequencing and chain terminating
inhibitors. PNAS, 74:5463–5467, 1977.
[43] Schena Mark, Dari Shalon, and Roland W. Davies. Quantitative Monitoring of Gene
Expression Patterns with a Complementary DNA Microarray. Science, 270:467–
470, 20 October 1995.
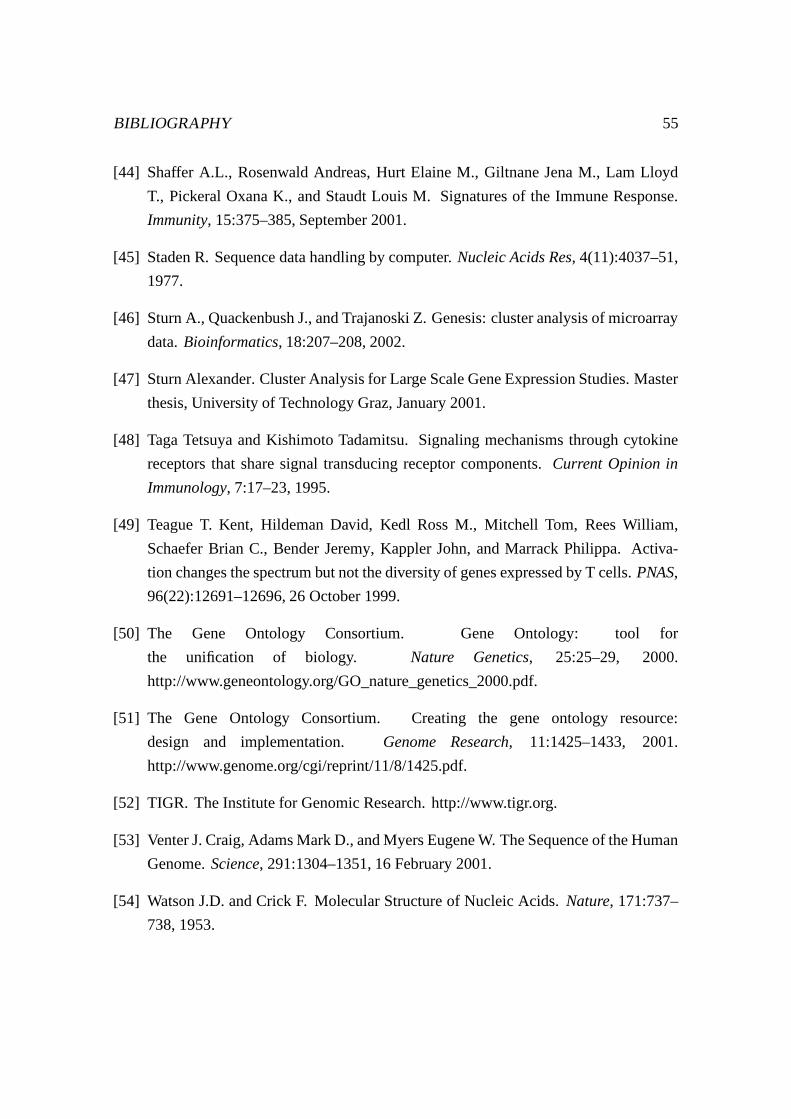
BIBLIOGRAPHY 55
[44] Shaffer A.L., Rosenwald Andreas, Hurt Elaine M., Giltnane Jena M., Lam Lloyd
T., Pickeral Oxana K., and Staudt Louis M. Signatures of the Immune Response.
Immunity, 15:375–385, September 2001.
[45] Staden R. Sequence data handling by computer. Nucleic Acids Res, 4(11):4037–51,
1977.
[46] Sturn A., Quackenbush J., and Trajanoski Z. Genesis: cluster analysis of microarray
data. Bioinformatics, 18:207–208, 2002.
[47] Sturn Alexander. Cluster Analysis for Large Scale Gene Expression Studies. Master
thesis, University of Technology Graz, January 2001.
[48] Taga Tetsuya and Kishimoto Tadamitsu. Signaling mechanisms through cytokine
receptors that share signal transducing receptor components. Current Opinion in
Immunology, 7:17–23, 1995.
[49] Teague T. Kent, Hildeman David, Kedl Ross M., Mitchell Tom, Rees William,
Schaefer Brian C., Bender Jeremy, Kappler John, and Marrack Philippa. Activa-
tion changes the spectrum but not the diversity of genes expressed by T cells. PNAS,
96(22):12691–12696, 26 October 1999.
[50] The Gene Ontology Consortium. Gene Ontology: tool for
the unification of biology. Nature Genetics, 25:25–29, 2000.
http://www.geneontology.org/GO_nature_genetics_2000.pdf.
[51] The Gene Ontology Consortium. Creating the gene ontology resource:
design and implementation. Genome Research, 11:1425–1433, 2001.
http://www.genome.org/cgi/reprint/11/8/1425.pdf.
[52] TIGR. The Institute for Genomic Research. http://www.tigr.org.
[53] Venter J. Craig, Adams Mark D., and Myers Eugene W. The Sequence of the Human
Genome. Science, 291:1304–1351, 16 February 2001.
[54] Watson J.D. and Crick F. Molecular Structure of Nucleic Acids. Nature, 171:737–
738, 1953.

BIBLIOGRAPHY 56
[55] Yang Y. H., Dudoit S., Luu P., Lin D. M., Peng V., Ngai J., and Speed T. P. Nor-
malization for cDNA microarray data: a robust composite method addressing single
and multiple slide systematic variation. Nucleic Acids Res, 30(4):e15, 15 February
2002.
[56] Yeung K. Y. and Ruzzo W. L. Principal component analysis for clustering gene
expression data. Bioinformatics, 17:763–774, May 2001.
Index
16s RNA, 18
Agarose gel, 14, 29
apoptosis, 42
B-cells, 2
Bioanalyzer, 15, 31
bioinformatic, 1
cDNA, 22
cDNA microarray, 7
cell cycle, 32, 42
central dogma, 4
CFSE, 3, 20
clustering, 24
clustering software, 7
commonly regulated, 38
cowpox, 1
cytapheresis, 16
Database filtering, 38
database-schema, 23
dexamethasone (DEX), 44
DMSO, 12
DNA, 1
EBI, 2
EST, 41
expression ratio, 24
FACS, 3, 21, 29, 33
Fc receptors, 28
Ficoll, 16
gamma chain, 5, 42
Gene Ontology, 25
Genesis, 7, 24, 41
glucocorticoid, 44
GO, 25, 40
hierarchical cluster, 43
hierarchical clustering, 25, 41
Incyte GEM, 7, 22
isopropanol, 13
Isotype controls, 28
JAK, 5, 42
Java, 24
Jurkat, 11, 30
kinase, 4
LifeArray, 24
lymphocyte separation medium, 16
lymphocytes, 16
lymphokines, 2
MA-plot, 36
macrophages, 2
MACS, 17
Mastermix, 19
57
INDEX 58
microarray technology, 2
microbeads, 17
microtiterplates, 20
mRNA, 4
Mycoplasma, 18, 28
NCBI, 1
negative feedback regulation, 6
Normalization, 34
northern blot, 2, 47
nuclear localization signal (NLS), 5
PBMC, 3, 7
PCR, 6, 18
Perl, 23, 26
principal component analysis, 25
proliferation, 20
Promega, 12, 22
RNA isolation, 29
RNA polymerase, 5
RNA-plus, 13
RNALabChip, 15
RNAse, 12
RNeasy, 14
signal transducing subunits, 5
SOCS, 5
spectral photometer, 14
STAT, 5, 44
STAT induced STAT inhibitor (SSI), 5
SWISS-PROT, 26, 40
T-cell isolation, 17
T-cell negative isolation, 17
T-cell purification, 16
T-cell receptor (TCR), 2
T-cells, 2
T-helper cells, 2
TCR signal transduction, 20
TIGR, 2
transcription factor, 5
Trypanblue, 11
uniquely regulated, 39
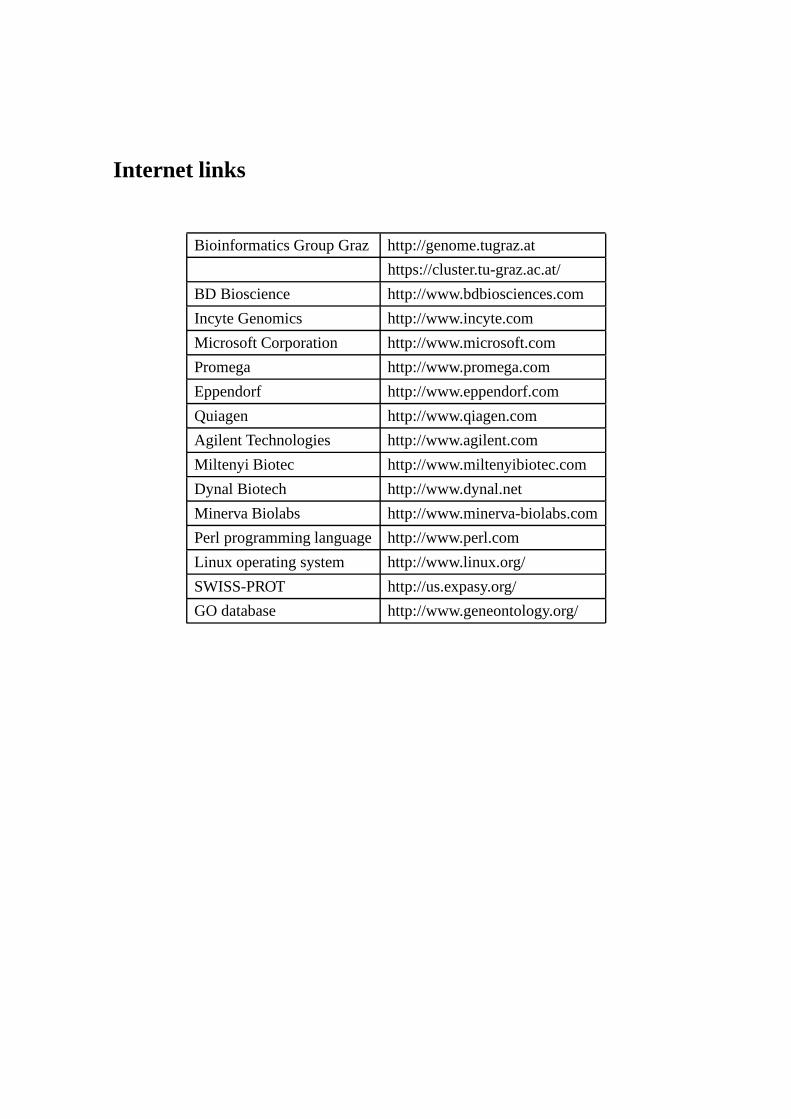
Internet links
Bioinformatics Group Graz http://genome.tugraz.at
https://cluster.tu-graz.ac.at/
BD Bioscience http://www.bdbiosciences.com
Incyte Genomics http://www.incyte.com
Microsoft Corporation http://www.microsoft.com
Promega http://www.promega.com
Eppendorf http://www.eppendorf.com
Quiagen http://www.qiagen.com
Agilent Technologies http://www.agilent.com
Miltenyi Biotec http://www.miltenyibiotec.com
Dynal Biotech http://www.dynal.net
Minerva Biolabs http://www.minerva-biolabs.com
Perl programming language http://www.perl.com
Linux operating system http://www.linux.org/
SWISS-PROT http://us.expasy.org/
GO database http://www.geneontology.org/
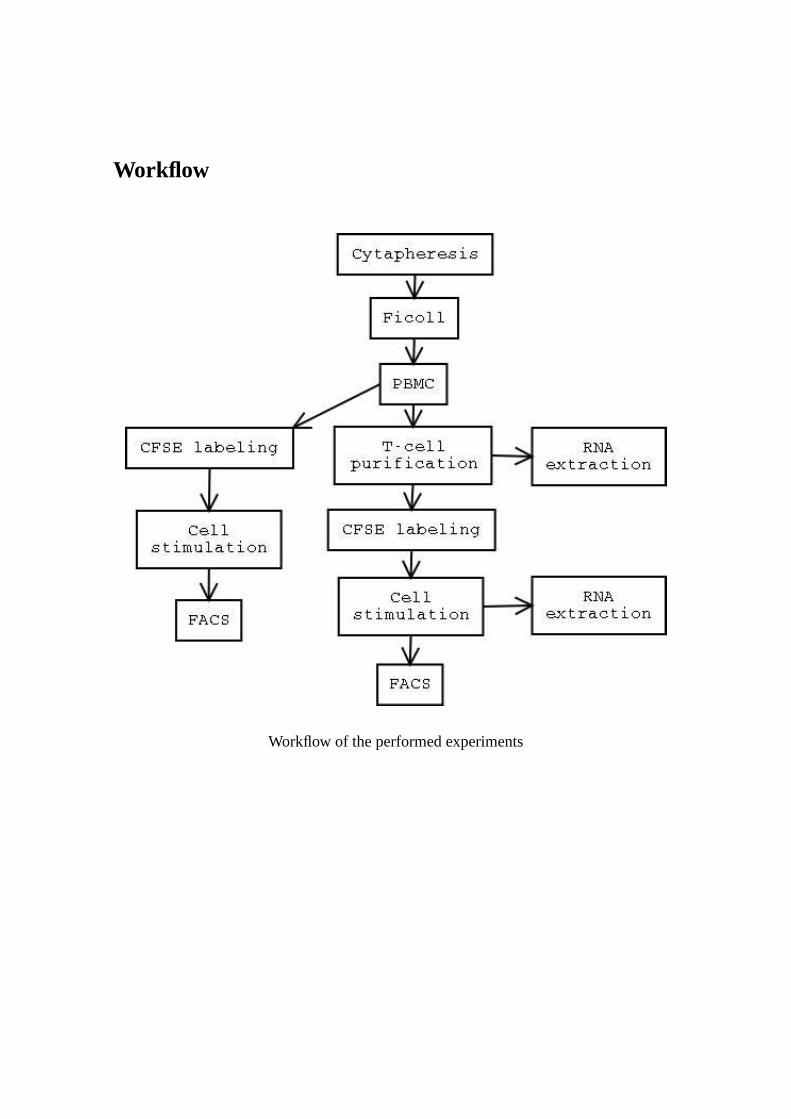
Workflow
Workflow of the performed experiments