Embed Size (px)
Citation preview
Prefatory Note
The attached document represents the most complete and accurate version available based on original copies culled from the files of the FOMC Secretariat at the Board of Governors of the Federal Reserve System. This electronic document was created through a comprehensive digitization process which included identifying the best-preserved paper copies, scanning those copies,1 and then making the scanned versions text-searchable.2 Though a stringent quality assurance process was employed, some imperfections may remain.
Please note that this document may contain occasional gaps in the text. These gaps are the result of a redaction process that removed information obtained on a confidential basis. All redacted passages are exempt from disclosure under applicable provisions of the Freedom of Information Act.
1 In some cases, original copies needed to be photocopied before being scanned into electronic format. All scanned images were deskewed (to remove the effects of printer- and scanner-introduced tilting) and lightly cleaned (to remove dark spots caused by staple holes, hole punches, and other blemishes caused after initial printing). 2 A two-step process was used. An advanced optimal character recognition computer program (OCR) first created electronic text from the document image. Where the OCR results were inconclusive, staff checked and corrected the text as necessary. Please note that the numbers and text in charts and tables were not reliably recognized by the OCR process and were not checked or corrected by staff.
Strictly Confidential (FR) Class II FOMC
May 8, 1991
SUMMARY AND OUTLOOK
Prepared for the Federal Open Market Committee
By the staff of the Board of Governors of the Federal Reserve System
DOMESTIC NONFINANCIAL DEVELOPMENTS
Overview of the Staff Forecast
Although there are signs that the trough of the recession is near--and
might even be here now--a decisive upturn in economic activity still appears
a little way off. On the positive side, the production of motor vehicles
has increased from the extremely low level of the first quarter, and
activity appears to be picking up in the housing market. However, layoffs
continue to be numerous, and the prices of industrial materials give no hint
of a significant stepup in overall industrial production. On balance, the
data in hand, as well as the thrust of the available anecdotal evidence,
suggest to us that the average level of real GNP will not change materially
in the current quarter.
The exact monthly timing of the trough notwithstanding, the recovery is
expected to be fully under way by this summer and to continue through 1992.
Real GNP is projected to expand at about a 4 percent annual rate in the
third and fourth quarters of this year, before moderating to a 3 percent
pace on average next year. Nonetheless, with considerable slack in labor
and product markets expected through 1992, wage and price inflation is
expected to slow significantly by the end of 1992.
The projected recovery is relatively mild by historical standards. In
part, this reflects the stance of economic policy. There has been no
discretionary countercyclical fiscal action at the federal level; indeed,
fiscal policy is expected to remain on the restrictive side over the next
two years. The financial position of state and local governments also will
impose an unusual drag on aggregate demand. Monetary policy has moved to
I-2
counter the downturn, but it is assumed that no further easing actions will
be taken--in contrast to what has occurred in the initial phases of some
other recoveries. Meanwhile, troubled financial institutions are
constrained in their provision of credit, and this situation will improve
only gradually. A large overhang of unoccupied real estate represents a
basic impediment to a typically robust recovery.
Near-term Economic Conditions
The Commerce Department's advance estimate of real GNP growth in the
first quarter indicated a more pronounced drop in final sales than we had
been projecting. Although consumer spending held up better than we
expected, residential investment and business capital spending were notably
weaker. The inventory picture also appears to be a bit less favorable than
we anticipated; stocks were drawn down somewhat less than we expected, and
they appear to be high enough in a few areas to cause some hesitancy in
orders and production in the near term.
One sector in which inventories appear to be largely under control is
the motor vehicle industry. Production cuts in the first quarter pushed
inventories to unusually low levels despite sluggish sales. Output of cars
and trucks in the second quarter is scheduled to rise to an 8.9 million unit
annual rate, versus 7.6 million units in the first quarter. In the March
Greenbook, we had projected some overshooting of these plans. However,
sales in April came in below our forecast, and manufacturers clearly are
being very cautious as they close out the 1991 model year. As a result, we
now are projecting an underbuild for the remainder of the quarter. Even so,
higher motor vehicle production is likely to contribute about a percentage
point to real GNP growth in the current quarter.
I-3
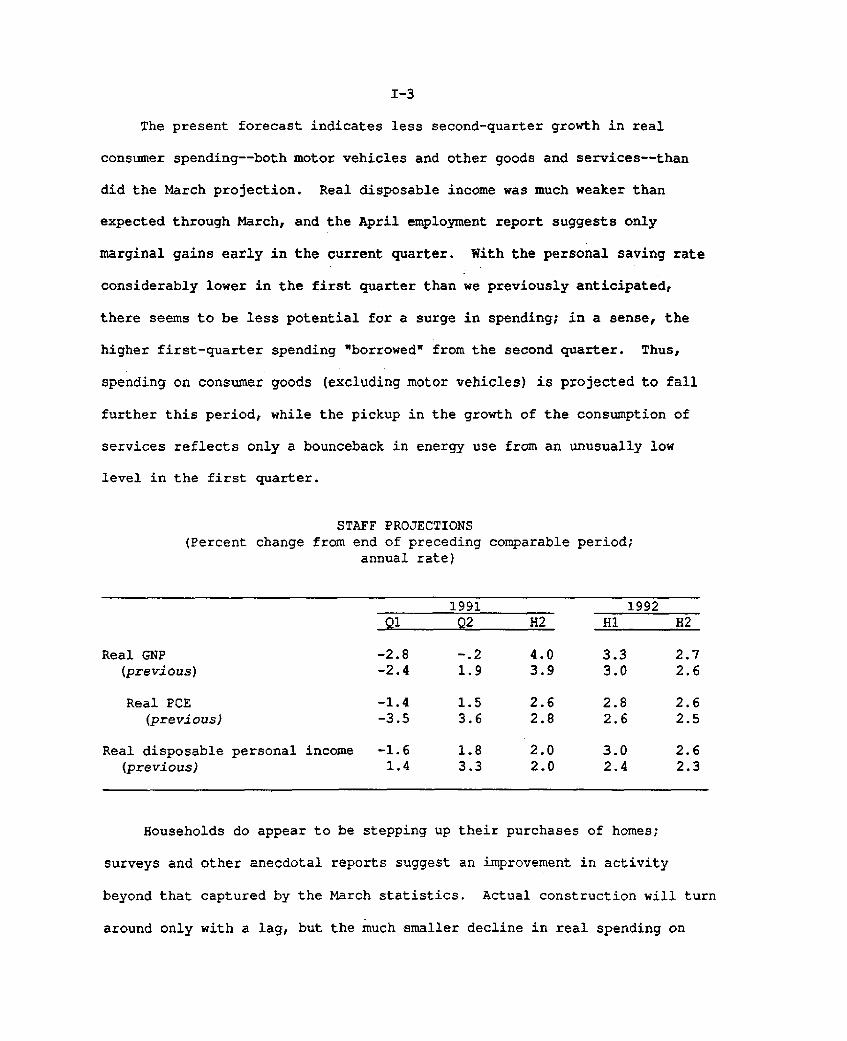
The present forecast indicates less second-quarter growth in real
consumer spending--both motor vehicles and other goods and services--than
did the March projection. Real disposable income was much weaker than
expected through March, and the April employment report suggests only
marginal gains early in the current quarter. With the personal saving rate
considerably lower in the first quarter than we previously anticipated,
there seems to be less potential for a surge in spending; in a sense, the
higher first-quarter spending "borrowed" from the second quarter. Thus,
spending on consumer goods (excluding motor vehicles) is projected to fall
further this period, while the pickup in the growth of the consumption of
services reflects only a bounceback in energy use from an unusually low
level in the first quarter.
STAFF PROJECTIONS(Percent change from end of preceding comparable period;
annual rate)
1991 1992Q1 Q2 H2 H1 H2
Real GNP -2.8 -.2 4.0 3.3 2.7(previous) -2.4 1.9 3.9 3.0 2.6
Real PCE -1.4 1.5 2.6 2.8 2.6(previous) -3.5 3.6 2.8 2.6 2.5
Real disposable personal income -1.6 1.8 2.0 3.0 2.6(previous) 1.4 3.3 2.0 2.4 2.3
Households do appear to be stepping up their purchases of homes;
surveys and other anecdotal reports suggest an improvement in activity
beyond that captured by the March statistics. Actual construction will turn
around only with a lag, but the much smaller decline in real spending on
I-4
residential investment this quarter implies a decidedly reduced subtraction
from real GNP.
In the business sector, recent orders and contracts point to further
declines in outlays for industrial equipment and nonresidential structures.
As noted above, some additional liquidation of inventories also appears
likely in the second quarter. Net exports still appear to be benefiting
from the 1989-90 depreciation of the dollar, but the underlying improvement
this quarter likely will be masked by a restocking of imported oil.
On the inflation front, key measures of labor costs and prices in the
first quarter came in about as expected in the March Greenbook. The
employment cost index for private-industry workers rose at a 4-1/2 percent
annual rate in the first quarter. Contributing to the stepup in the pace of
ECI increases relative to the fourth quarter were higher payroll tax rates
and a large jump in commissions for sales workers in the financial sector.
Basically, wages and total compensation still appear to be on the
decelerating trend we anticipated would accompany higher unemployment. The
March CPI confirmed our analysis that the bulge in "core" inflation earlier
in the year was something of a fluke, attributable to a variety of one-time
price hikes (such as the increase in the federal excise tax on alcoholic
beverages) and seasonal adjustment problems in a few key components
(apparel, in particular). Competitive pressures remain intense in the
goods-producing sector, and with import prices rising only slowly, there is
less scope for domestic price increases. Although tightness in supplies is
expected to put upward pressure on gasoline prices, the continued pass-
through of the earlier decline in energy prices should hold down other
prices (e.g., airline fares). In addition, the seasonal adjustment problems
I-5
that boosted prices in the first quarter are expected to depress them in the
second quarter. On balance, increases in the CPI of about 0.3 percent per
month are expected in the second quarter.
Outlook Beyond Midyear
Real GNP is projected to grow at a 4 percent annual rate in the second
half of this year and to taper off thereafter, averaging 3 percent for 1992
as a whole. The dynamics of the recovery are similar in many respects to
those of other postwar upturns: Lower interest rates stimulate
homebuilding, inventory decumulation runs its course and is succeeded by
stock accumulation, and over time capital spending exhibits an accelerator
effect as sales trends improve. However, consumer spending rises only
moderately in the forecast; the increase in stock prices has bolstered
household wealth, but with house prices subdued, a decline in the personal
saving rate from its already low level seems unlikely. Government spending
is weak, and the external sector is not expected to be an important
contributor to growth over the next year and a half.
The forecast anticipates considerable progress in reducing inflation.
The civilian unemployment rate is expected to remain relatively high,
averaging 6-3/4 percent in the current quarter and declining only to
6-1/4 percent in 1992. As a result of this slack and further reductions in
inflation expectations, increases in hourly compensation slow steadily over
the forecast horizon. Consumer price inflation averages about 3-1/2 percent
through the end of this year, as the slowdown in labor costs begins to be
passed through to the retail level, energy costs decline, and capacity
utilization in manufacturing remains low. The CPI decelerates to about a
I-6
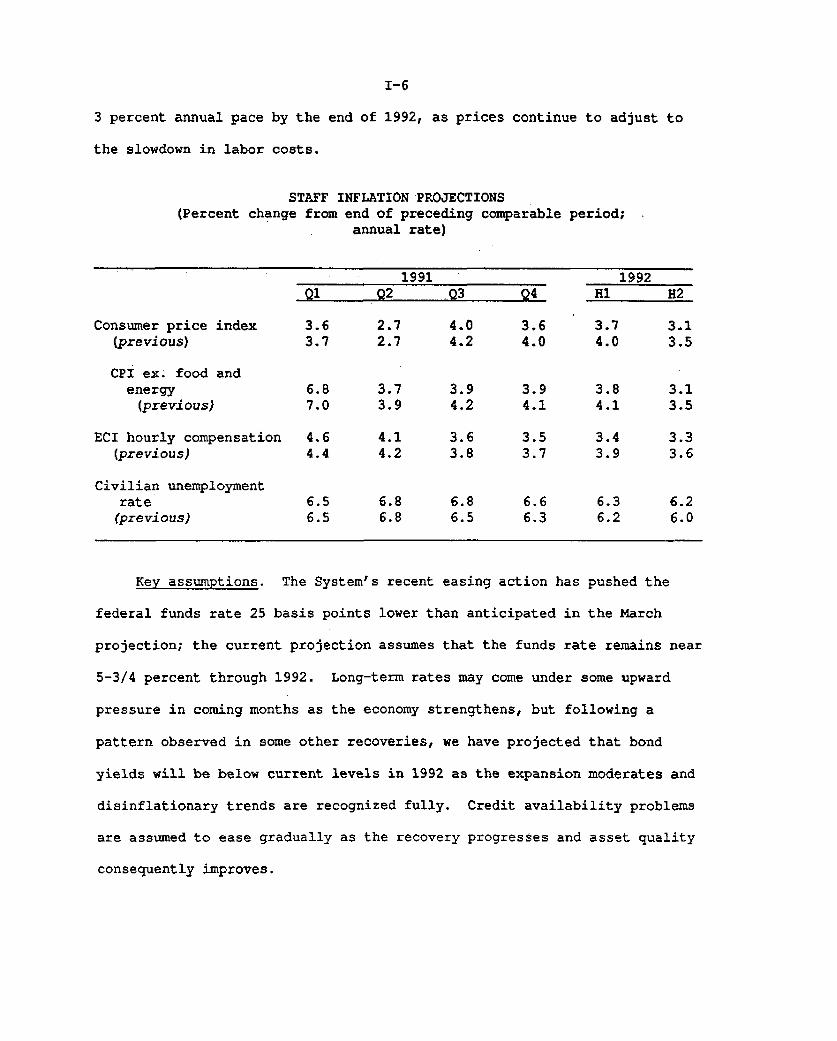
3 percent annual pace by the end of 1992, as prices continue to adjust to
the slowdown in labor costs.
STAFF INFLATION PROJECTIONS(Percent change from end of preceding comparable period;
annual rate)
1991
Consumer price index(previous)
CPI ex. food andenergy
(previous)
ECI hourly compensation(previous)
Civilian unemploymentrate(previous)
Q1
3.63.7
Q2
2.72.7
3.73.9
4.14.2
6.86.8
Q3
4.04.2
3.94.2
3.63.8
6.86.5
Q4
3.64.0
3.94.1
3.53.7
6.66.3
Key assumptions. The System's recent easing action has
federal funds rate 25 basis points lower than anticipated in
1992H1 H2
3.7 3.14.0 3.5
3.84.1
3.43.9
6.36.2
3.13.5
3.33.6
6.26.0
pushed the
the March
projection; the current projection assumes that the funds rate remains near
5-3/4 percent through 1992. Long-term rates may come under some upward
pressure in coming months as the economy strengthens, but following a
pattern observed in some other recoveries, we have projected that bond
yields will be below current levels in 1992 as the expansion moderates and
disinflationary trends are recognized fully. Credit availability problems
are assumed to ease gradually as the recovery progresses and asset quality
consequently improves.
I-7
As in the last Greenbook, growth in M2 over this year is anticipated to
be about in line with the growth of nominal GNP, as the effects of declines
in short-term interest rates since the fourth quarter about offset the
impact of the continuing constriction in depository institutions; this would
place the aggregate just in the upper half of its range of 2-1/2 to
6-1/2 percent. The growth of M3 in 1991 is projected at around the midpoint
of its 1 to 5 percent range, as it continues to be held down by modest bank
credit growth and sizable RTC activity for the year as a whole. The staff
foresees M2 in 1992 growing slightly more rapidly than in 1991; with short-
term interest rates flat and no longer boosting money demand, that pace of
M2 growth still is somewhat below the faster growth of nominal income. M3
will likely maintain this year's pace as the restructuring of the thrift
industry continues.
The foreign exchange value of the dollar is expected to decline
somewhat from its recent highs. However, relative to the path in the March
Greenbook, the dollar now is expected to be about 6 percent higher, on
average, over the forecast period. The staff also has lowered its
projection for growth in the other G-10 countries slightly, but the general
pattern remains much the same: Economic activity abroad is expected to
strengthen in the second half of this year from its recent weakness and to
continue to expand at a fairly brisk pace in 1992. Crude oil prices have
firmed since the time of the March Greenbook, and we now anticipate that the
spot price of West Texas Intermediate will average $20.75 per barrel in the
second quarter, instead of $19. Oil prices then fall gradually over the
second half and stabilize at $19.50 per barrel in 1992.
I-8
Consumer spending and income. Real personal consumption expenditures
are projected to rise at a 2-1/2 percent annual rate in the second half of
1991 and at a 2-3/4 percent pace in 1992.. This is moderate by the standards
of past recoveries, reflecting slow growth in real disposable income and our
assessment that the personal saving rate probably has fallen about as far as
is likely in the present economic environment. Rising profits and falling
bond yields suggest that the stock market may retain its recent gains, but
residential real estate values probably will not rise substantially until
the market digests a good part of the current excess supply. Overall,
household net worth is not expected to change materially relative to income.
As a result, consumer spending is projected to grow in line with real DPI,
and the personal saving rate is flat over the forecast horizon.
Among the components of PCE, sales of cars and light trucks are
expected to increase substantially in the second half from their depressed
first-half levels, but sales growth moderates noticeably in 1992. In
general, we do not think that a great deal of pent-up demand has developed
during this recession, and as a result, the pickup in sales of durable goods
is well below that in an "average" cyclical recovery.
Business fixed investment. Real BFI is projected to increase at about
a 1-1/2 percent annual pace in the second half of this year. The recovery
is concentrated in producers' durable equipment, while spending on
nonresidential structures continues to contract rapidly. Within PDE, recent
orders figures suggest that the demand for computers may already be firming,
and business purchases of motor vehicles are expected to edge up in the
second half. However, the upturn in industrial machinery and other types of
I-9
equipment with longer lead times is not expected to begin until the end of
the year.
Real BFI is projected to rise 5 percent in 1992, as rising sales
expectations and improving cash flows prompt broad advances in equipment
spending; PDE is forecast to rise 7-3/4 percent next year. The decline in
structures investment is expected to slow to a 4-3/4 percent pace next year,
as industrial building picks up a bit. Although the availability of credit
to this sector may begin to ease next year as the overhang of office and
commercial space begins to be absorbed in some markets, the level of
activity still is likely to remain depressed.
Housing. Absent a significant upturn in residential real estate
prices, the investment motive in this sector is likely to remain weak even
with mortgage interest rates at the low end of the range observed since the
mid-1970s. Nonetheless, affordability in cash flow terms has improved
appreciably, and as real income growth resumes, construction activity is
expected to increase moderately. However, the magnitude of the upturn is
considerably smaller than typically occurs in a business recovery, and by
the end of 1992, starts are projected to move back only to the weak
1.2 million unit pace seen last year. Apart from financial factors,
building is likely to be damped by a slower pace of household formation and
by the large overhang of unoccupied units in some parts of the country. The
demographic trends are least unfavorable to the single-family sector; it is
this segment of the market in which almost all of the projected increase in
construction occurs. In the multifamily area, high vacancy rates,
relatively slow growth in the young-adult population, and continued lender
I-10
caution in funding new projects are expected to hold starts to only a meager
gain over the projection period.
Government sector. As mentioned in the overview, the staff continues
to expect federal fiscal policy to be somewhat restrictive over the next
year and a half. The FY1992 budget is assumed to adhere closely to the
budget act (OBRA) of last year; new tax and spending legislation is expected
to have only marginal effects on the deficit. As a result of defense
cutbacks, real purchases are projected to fall 1 percent over the four
quarters of 1991 and another 4-1/4 percent in 1992.
The staff estimate of the unified federal budget deficit for FY1991 is
$264 billion--up $7 billion from the March Greenbook. Tax receipts in
recent months have lagged expectations, and lower projected income growth
has reduced revenue estimates for the balance of the fiscal year; this has
been partially offset by lower outlays for the RTC and Bank Insurance Fund.
In FY1992, the deficit is expected to rise to $303 billion, $12 billion
higher than in the March Greenbook. Some Desert Storm contributions that
had been expected in the second half of FY1991 now likely will spill over
into FY1992. However, the FY1992 receipts forecast has been reduced by
lower projected income and the recent tax collections experience, and
outlays for deposit insurance are somewhat greater than in the March
Greenbook.
In the state and local sector, continued fiscal stress is expected to
prompt a small decline in real purchases this year. States are coping with
budgetary imbalances in part through financial gimmicks (such as sales-
leaseback agreements with special authorities), but also by trimming staff
and construction budgets. These cuts are expected to be sufficient to hold
I-11
the state and local NIPA deficit (excluding social insurance funds) this
year at $35 billion--close to its 1990 level. In 1992, real purchases are
expected to rise slowly, while receipts are projected to be boosted by
higher tax rates and by a pickup in revenues as the economy recovers. As a
result, the fiscal position of state and local governments is expected to
improve next year, with the NIPA deficit falling to about $7 billion.
Net exports. The external sector is not expected to be a major
contributor to real GNP growth later this year and in 1992. The outlook for
net exports is weaker mainly because of the higher path for the dollar in
this forecast. Growth in nonagricultural merchandise exports is expected to
slow a bit in the second and third quarters of this year and to pick up
thereafter as activity abroad recovers. Non-oil merchandise imports are
projected to be flat in the first half of 1991, reflecting the weakness in
U.S. economic activity, but they bounce back in the second half and in 1992
as the recovery begins and import price increases remain small. A more
detailed discussion of these projections is presented in the International
Developments section, below.
Labor costs and prices. Despite the hike in the federal minimum wage
to $4.25 per hour on April 1, hourly compensation (as measured by the
employment cost index) is expected to slow to about a 4 percent annual pace
in the second quarter. Hourly compensation is projected to rise at only a
3-1/2 percent annual pace in the second half of this year, and further
deceleration is anticipated in 1992, although, with the recession over and
unemployment declining, the downward pressure on wages is expected to be a
bit less than in 1991. Overall, increases in hourly compensation slow to a
3-1/4 percent annual pace by the fourth quarter of 1992.
I-12
Consumer price inflation is expected to slow significantly over the
forecast horizon. Food prices are projected to rise at about the overall
rate of inflation, assuming an absence of major supply or demand shocks.
Energy prices are projected to fall 6-1/2 percent in 1991, as the prices of
refined petroleum products retrace much of the runup in 1990, and to rise
only 3 percent next year. Excluding food and energy, the CPI is forecast to
slow from the 6-3/4 percent increase during the first quarter of 1991 to a
4 percent annual pace by the end of this year and to under 3-1/4 percent
annual rate by the fourth quarter of 1992. As noted above, much of the
deceleration during 1991 reflects the absence or the reversal of special
factors that boosted inflation in the first quarter. In 1992, the
improvement in underlying price performance reflects slack in labor and
product markets as well as continued intense competition from foreign
producers.
I-13
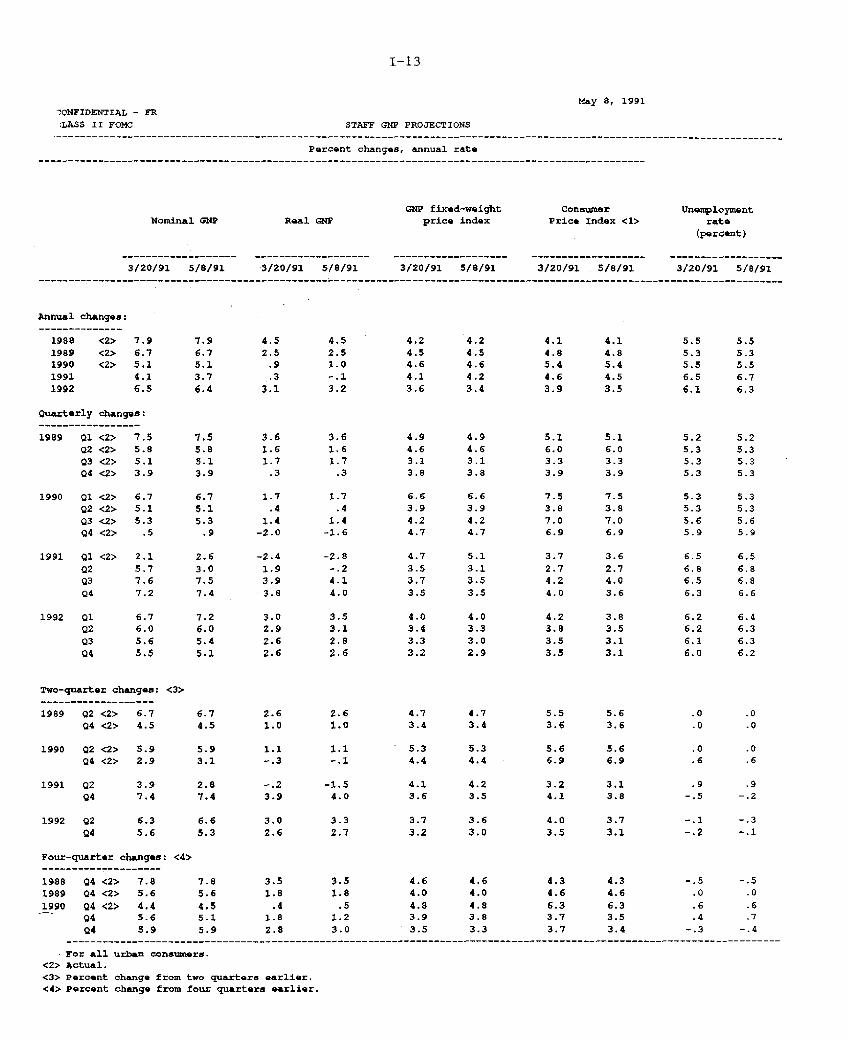
May 8, 1991CONFIDENTIAL - FRCLASS II FOMC STAFF GNP PROJECTIONS
Percent changes, annual rate.....................................................................................................
Nominal GNP
3/20/91 5/8/91
Real GNP
3/20/91 5/8/91
GNP fixed-weightprice index
3/20/91 5/8/91
ConwsuerPrice Index <1>
3/20/91 5/8/91
Unenploymentrate
(percent)
3/20/91 5/8/91
Annual changes:
1988 <2> 7.9
1989 <2> 6.71990 <2> 5.1
1991 4.11992 6.5
Quarterly changes:
1989 01 <2> 7.5
Q2 <2> 5.8Q3 <2> 5.104 <2> 3.9
1990 Q1 <2> 6.702 <2> 5.1
03 <2> 5.3Q4 <2> .5
1991 Q1 <2> 2.1
Q2 5.703 7.6
04 7.2
1992 01 6.7Q2 6.0
03 5.6
04 5.5
Two-quarter changes;
1989 Q2 <2> 6.704 <2> 4.5
1990 Q2 <2> 5.994 <2> 2.9
1991 02 3.9Q4 7.4
1992 Q2 6.3 6.604 5.6 5.3
Four-quarter changes: <4>
1988 04 <2> 7.8 7.81989 04 <2> 5.6 5.6
1990 Q4 <2> 4.4 4.504 5.6 5.1Q4 5.9 5.9
3.61.61.7
.3
1.7.4
1.4-2.0
-2.41.93.93.8
3.02.92.62.6
3.61.61.7
.3
1.7.4
1.4-1.6
-2.8-. 24.14.0
3.53.12,8
2.6
6.7 2.6 2.64.5 1.0 1.0
5.9 1.1 1.13.1 -. 3 -. 1
4.7 4.73.4 3.4
5.3 5.34.4 4.4
-1.54.0
3.7 3.63.2 3.0
5.5 5.63.6 3.6
5.6 5.66.9 6.9
3.2 3.14.1 3.8
4.0 3.7
3.5 3.1
5.2 5.25.3 5.35.3 5.35.3 5.3
5.3 5.35.3 5.35.6 5.65.9 5.9
.0 .0
.0 .0
.0 .0
.6 .6
.9 .9-. 5 -. 2
-. 1 -. 3-. 2 -. 1
SFor all urban consumers.<2> Actual.<3> Percent change from two quarters earlier,<4> Percent change from four quarters earlier.
I-14
CONFIDENTIAL - FR
CLASS II FOMC
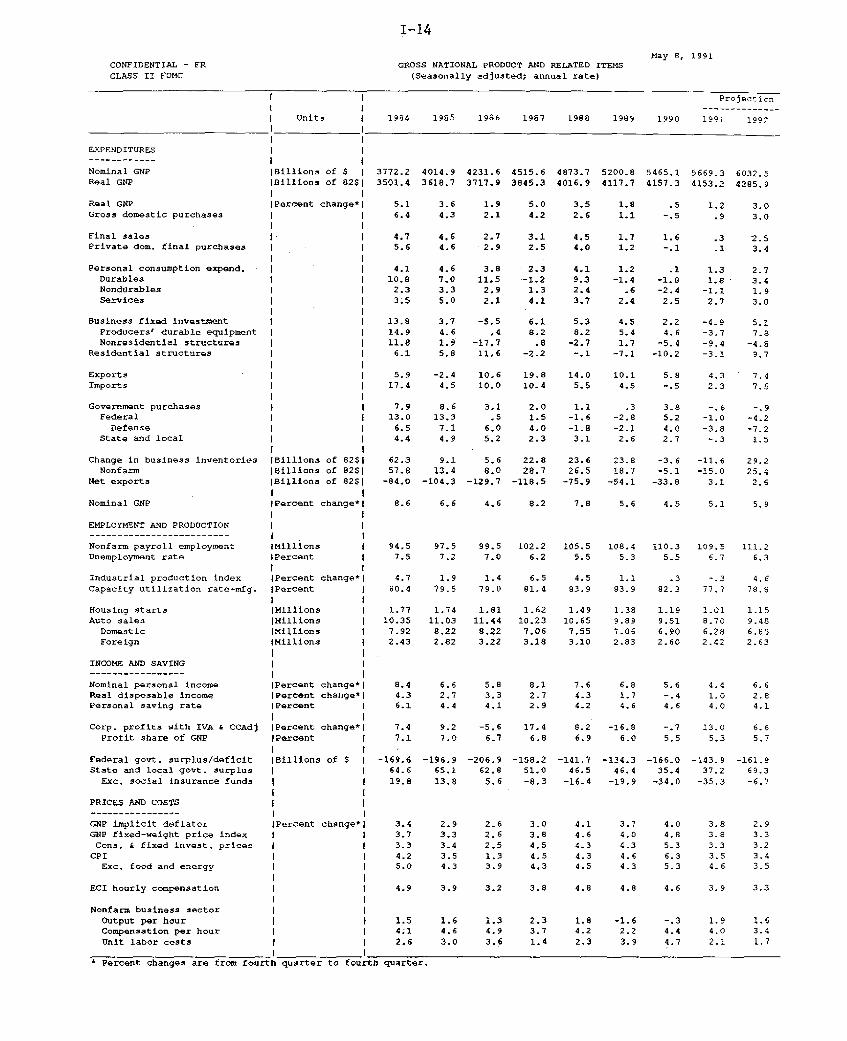
May 8, 1991GROSS NATIONAL PRODUCT AND RELATED ITEMS
(Seasonally adjusted; annual rate)
Projection
Units 1984 1985 1986 1987 1988 1989 1990 1991 1992
EXPENDITURES
Nominal GNP Billions of $ 3772.2 4014.9 4231.6 4515.6 4873.7 5200.8 5465.1 5669.3 6032.5Real GNP Billions of 82SI 3501.4 3618.7 3717.9 3845.3 4016.9 4117.7 4157.3 4153.2 4285.9
I IReal GNP Percent change*l 5.1 3.6 1.9 5.0 3.5 1.8 .5 1.2 3.0Gross domestic purchases 6.4 4.3 2.1 4.2 2.6 1.1 -.5 .9 3.0
Final sales 4.7 4,6 2.7 3.1 4.5 1.7 1.6 .3 2.5Private dom. final purchases I 5.6 4.6 2.9 2.5 4.0 1.2 -. 1 .1 3.4
Personal consumption expend. 4.1 4.6 3.8 2.3 4.1 1.2 .1 1.3 2.7Durables 1 10.8 7.0 11.5 -1.2 9.3 -1.4 -1.8 1.8 3.4Nondurables 2.3 3.3 2.9 1.3 2.4 .6 -2.4 -1.1 1.9Services 3.5 5.0 2.1 4.1 3.7 2.4 2.5 2.7 3.0
Business fixed investment 13.8 3.7 -5.5 6.1 5.3 4.5 2.2 -4.9 5.1Producers' durable equipment 14.9 4.6 .4 8.2 8.2 5.4 4.6 -3.7 7.8Nonresidential structures 11.8 1.9 -17,7 .8 -2.7 1.7 -5.4 -9.4 -4.8
Residential structures 6.1 5.8 11,6 -2.2 -.1 -7.1 -10.2 -3.1 9.7
Exports I 5.9 -2.4 10.6 19.8 14.0 10.1 5.8 4.3 7.4Imports 17.4 4.5 10.0 10.4 5.5 4.5 -. 5 2.3 7.5
Government purchases 7.9 8.6 3.1 2.0 1.1 .3 3.8 -. 6 -.9Federal 13.0 13.3 .5 1.5 -1.6 -2.8 5.2 -1.0 -4.2Defense 6.5 7.1 6.0 4.0 -1.8 -2.1 4.0 -3.8 -7.2
State and local 4.4 4.9 5.2 2.3 3.1 2.6 2.7 -.3 1.5
Change in business inventories (Billions of 82$1 62.3 9.1 5.6 22.8 23.6 23.8 -3.6 -11.6 29.2Nonfarm jBillions of 82$1 57.8 13.4 8.0 28.7 26.5 18.7 -5.1 -15.0 25.4
Net exports IBillions of 8251 -84.0 -104.3 -129.7 -118.5 -75.9 -54.1 -33.8 3.1 2.6
Nominal GNP (Percent change*! 8.6 6.6 4.6 8.2 7.8 5.6 4.5 5.1 5.9
EMPLOYMENT AND PRODUCTION
Nonfarm payroll employment IMillions 94.5 97.5 99.5 102.2 105.5 108.4 110.3 109.5 111.2Unemployment rate IPercent 7.5 7.2 7.0 6.2 5.5 5.3 5.5 6.7 6.3
Industrial production index IPercent change* 4.7 1.9 1.4 6.5 4.5 1.1 .3 -.3 4.6Capacity utilization rate-mfg. IPercent 80.4 79.5 79.0 81.4 83.9 83.9 82.3 77.7 78.8
Housing starts |Millions 1.77 1.74 1.81 1.62 1.49 1.38 1.19 1.01 1.15Auto sales IMillions 10.35 11.03 11.44 10.23 10.65 9.89 9.51 8.70 9.48
Domestic IMillions 1 7.92 8.22 8.22 7.06 7,55 7.06 6.90 6.28 6.65Foreign IMillions 2.43 2.82 3.22 3.18 3.10 2.83 2.60 2.42 2.63
INCOME AND SAVING
Nominal personal income IPercent change*I 8.4 6.6 5.8 8.1 7.6 6.8 5.6 4.4 6.6Real disposable income IPercent change*l 4.3 2.7 3.3 2.7 4.3 1.7 -. 4 1.0 2.8Personal saving rate IPercent 1 6.1 4.4 4.1 2.9 4.2 4.6 4.6 4.0 4.1
I ICorp. profits with IVA & CCAdj IPercent change*l 7.4 9.2 -5.6 17.4 6.2 -16.8 -. 7 13.0 6.6Profit share of GNP IPercent 7.1 7.0 6.7 6.8 6.9 6.0 5.5 5.3 5.7
I IFederal govt. surplus/deficit IBillions of $ -169.6 -196.9 -206.9 -158.2 -141.7 -134.3 -166.0 -143.9 -161.9State and local govt. surplus 64.6 65.1 62.8 51.0 46.5 46.4 35.4 37.2 69.3
Exc. social insurance funds 19.8 13.8 5.6 -8.3 -16.4 -19.9 -34.0 -35.3 -6.7
PRICES AND COSTS
GNP implicit deflator Percent change* 3.4 2.9
GNP fixed-weight price index 3.7 3.3
Cons. t fixed invest, prices 3.3 3.4
CPI 4.2 3.5
Exc. food and energy 5.0 4.3
ECI hourly compensation 4.9 3.9
Nonfarm business sectorOutput per hour 1.5 1.6Compensation per hour 4.1 4.6Unit labor costs 2.6 3.0
* Percent changes are from fourth quarter to fourth quarter,
2.6 3.02.6 3.82.5 4.51.3 4.53.9 4.3
3.2 3.8
4.1 3.7 4.0 3.8 2.94.6 4.0 4.8 3.8 3.34.3 4.3 5.3 3.3 3.24.3 4.6 6.3 3.5 3.44.5 4.3 5.3 4.6 3.5
4.8 4.8 4.6 3.9 3.3
1.3 2.3 1.8 -1.6 -.3 1.9 1.64.9 3.7 4.2 2.2 4.4 4.0 3.4
3.6 1.4 2.3 3.9 4.7 2.1 1.7
I-15
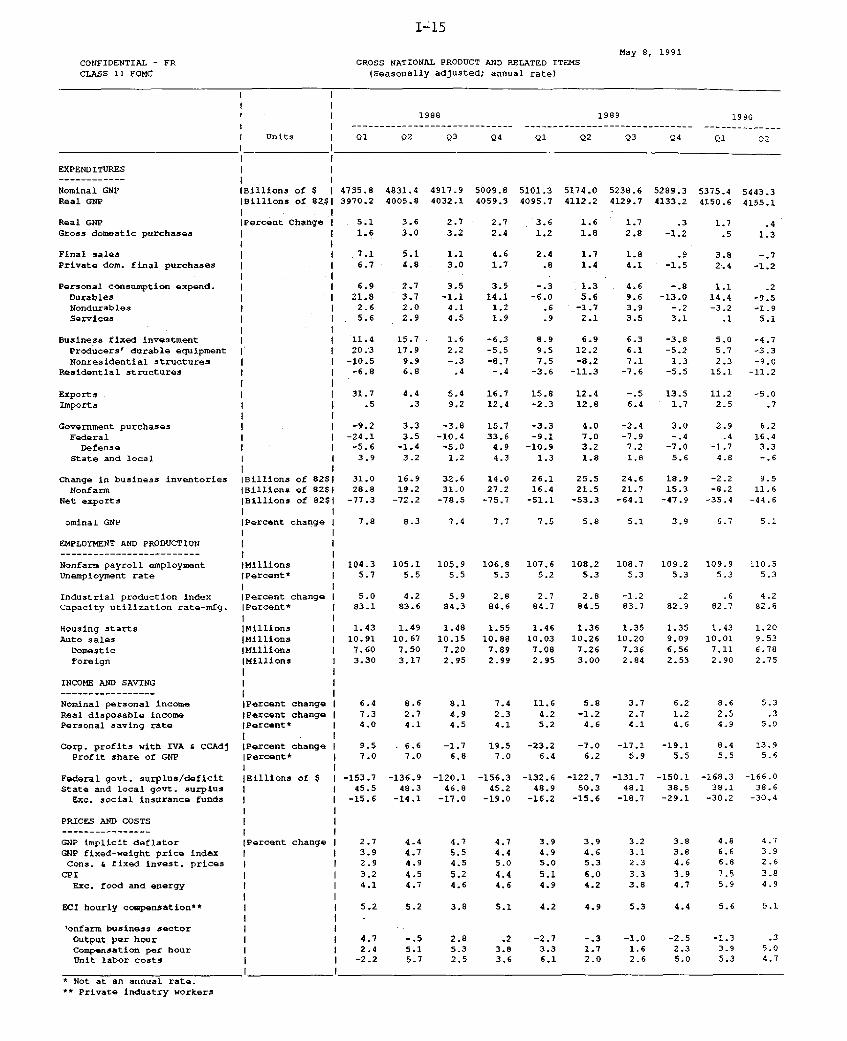
May 8, 1991CONFIDENTIAL - FR GROSS NATIONAL PRODUCT AND RELATED ITEMS
CLASS II FOMC (Seasonally adjusted; annual rate)
1988 1989 1990----------------------------- -----------------------------.... ---......
I Units I 01 02 Q3 Q4 Q1 02 Q3 Q4 Q1 02
EXPENDITURES
Nominal GNP IBillions of S 4735.8 4831.4 4917.9 5009.8 5101.3 5174.0 5238.6 5289.3 5375.4 5443.3Real GNP Billions of 82$1 3970.2 4005.8 4032.1 4059.3 4095.7 4112.2 4129.7 4133.2 4150.6 4155.1
Real GNP [Percent Change 5.1 3.6 2.7 2.7 3.6 1.6 1.7 .3 1.7 .4Gross domestic purchases 1.6 3.0 3.2 2.4 1.2 1.8 2.8 -1.2 .5 1.3
Final sales 7.1 5.1 1.1 4.6 2.4 1.7 1.8 .9 3.8 -.7Private dom. final purchases 6.7 4.8 3.0 1.7 .8 1-4 4.1 -1.5 2.4 -1.2
Personal consumption expend. 6.9 2.7 3.5 3.5 -.3 1.3 4.6 -.8 1.1 .2Durables 21.8 3.7 -1.1 14.1 -6.0 5.6 9.6 -13.0 14.4 -9.5Nondurables 1 2.6 2.0 4.1 1.2 .6 -1.7 3.9 -.2 -3.2 -1.9Services 5.6 2.9 4.5 1.9 .9 2.1 3.5 3.1 .1 5.1
Business fixed investment 11.4 15.7 1.6 -6.3 8.9 6.9 6.3 -3.8 5.0 -4.7
Producers' durable equipment 20.3 17.9 2.2 -5.5 9.5 12.2 6.1 -5.2 5.7 -3.3Nonresidential structures -10.5 9.9 -.3 -8.7 7.5 -8.2 7.1 1.3 2.3 -9.0
Residential structures -6.8 6.8 .4 -.4 -3.6 -11.3 -7.6 -5.5 15.1 -11.2
Exports 31.7 4.4 5.4 16.7 15.8 12.4 -.5 13.5 11.2 -5.0Imports .5 .3 9,2 12.4 -2.3 12.8 6.4 1.7 2.5 .7
Government purchases -9.2 3.3 -3.8 15.7 -3.3 4.0 -2.4 3.0 2.9 6.2
Federal -24.1 3.5 -10.4 33.6 -9.1 7.0 -7.9 -. 4 .4 16.4
Defense -5.6 -1.4 -5.0 4.9 -10.9 3.2 7.2 -7.0 -1.7 3.3
State and local 3.9 3.2 1.2 4.3 1.3 1.8 1.8 5.6 4.8 -. 6
Change in business inventories IBillions of 82$1 31.0 16.9 32.6 14.0 26.1 25.5 24.6 18.9 -2.2 9.5
Nonfarm IBillions of 82$1 28.8 19.2 31.0 27.2 16.4 21.5 21.7 15.3 -8.2 11.6
Net exports IBillions of 825$ -77.3 -72.2 -78.5 -75.7 -51.1 -53.3 -64.1 -47.9 -35.4 -44.6
1 1ominal GNP IPercent change 7.8 8.3 7.4 7.7 7.5 5.8 5.1 3.9 6.7 5.1
EMPLOYMENT AND PRODUCTION-----------„--»--------
Nonfarm payroll employment Millions 104.3 105.1 105.9 106.8 107.6 108.2 108.7 109.2 109.9 110.5
Unemployment rate IPercent* 5.7 5.5 5.5 5.3 5.2 5.3 5.3 5.3 5.3 5.3
Industrial production index IPercent change I 5.0 4.2 5,9 2.8 2.7 2.8 -1.2 .2 .6 4.2
Capacity utilization rate-mfg. IPercent* I 83.1 83.6 84.3 84.6 84.7 84.5 83.7 82.9 82.7 82.8
Housing starts Millions I 1.43 1.49 1.48 1.55 1.46 1.36 1.35 1.35 1.43 1.20Auto sales Millions 10.91 10.67 10.15 10.88 10.03 10.26 10.20 9.09 10.01 9.53
Domestic IMillions 7,60 7.50 7.20 7.89 7.08 7.26 7.36 6.56 7.11 6.78
Foreign IMillions 1 3.30 3.17 2.95 2.99 2.95 3.00 2.84 2.53 2.90 2.75
INCOME AND SAVING---------------- -Nominal personal income Percent change 6.4 8.6 8.1 7.4 11.6 5.8 3.7 6.2 8.6 5.3Real disposable income Percent change 7.3 2.7 4.9 2.3 4.2 -1.2 2.7 1.2 2.5 .3
Personal saving rate IPercent* 4.0 4.1 4.5 4.1 5.2 4.6 4.1 4.6 4.9 5.0
Corp. profits with IVA & CCAdj [Percent change 9.5 - 6.6 -1.7 19.5 -23.2 -7.0 -17.1 -19.1 8.4 13.9Profit share of GNP |Percent* 7.0 7.0 6.8 7.0 6.4 6.2 5.9 5.5 5.5 5.6
Federal govt. surplus/deficit Billions of $ -153.7 -136.9 -120.1 -156.3 -132.6 -122.7 -131.7 -150.1 -168.3 -166.0State and local govt. surplus 45.5 48.3 46.8 45.2 48.9 50.3 48.1 38.5 38.1 38.6
Exc. social insurance funds -15.6 -14.1 -17.0 -19.0 -16.2 -15.6 -18,7 -29.1 -30.2 -30.4
PRICES AND COSTS
GNP implicit deflator Percent change 2.7 4.4 4.7 4.7 3.9 3.9 3.2 3.8 4.8 4.7
GNP fixed-weight price index 3.9 4.7 5.5 4.4 4.9 4.6 3.1 3.8 6.6 3.9
Cons. & fixed invest, prices F 2.9 4.9 4.5 5.0 5.0 5.3 2.3 4.6 6.8 2.6
CPI 1 3.2 4.5 5.2 4.4 5.1 6.0 3.3 3.9 7.5 3.8
Exc. food and energy 4.1 4.7 4.6 4.6 4.9 4.2 3.8 4.7 5.9 4.9
ECI hourly compensation** 5.2 5.2 3.8 5.1 4.2 4.9 5.3 4.4 5.6 5.1
'onfarm business sectorOutput per hour 4.7 -. 5 2.8 .2 -2.7 -.3 -1.0 -2.5 -1.3 .3
Compensation per hour 2.4 5.1 5.3 3.8 3.3 1.7 1.6 2.3 3.9 5.0Unit labor costs -2.2 5.7 2.5 3.6 6.1 2.0 2.6 5.0 5.3 4.7
* Not at an annual rate.** Private industry workers
I-16
CONFIDENTIAL - FR
CLASS II FOMC
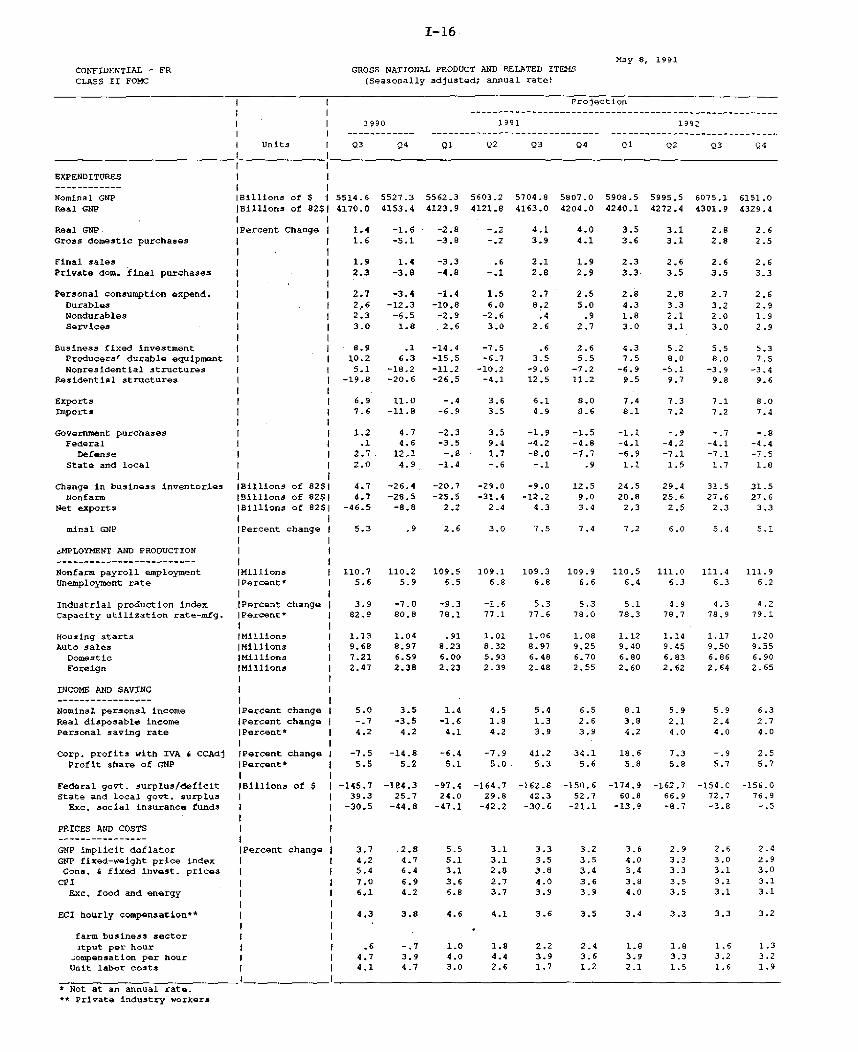
GROSS NATIONAL PRODUCT AND RELATED ITEMS
(Seasonally adjusted; annual rate)
Projection
1990 1991 1992-- - - - - - - - - - - - - - - - - - - - - --- - - - - - - - - - - - - -
S Units I Q3 Q4 Q1 02 03 04 01 Q2 Q3 Q4
EXPENDITURES--- --------- I
Nominal GNP Billions of $ I 5514.6 5527.3 5562.3 5603.2 5704.8 5807.0 5908.5 5995.5 6075.1 6151.0Real GNP ]Billions of 82$ 4170.0 4153.4 4123.9 4121.8 4163.0 4204.0 4240.1 4272.4 4301.9 4329.4
Real GNP JPercent Change 1.4 -1.6 -2.8 -.2 4.1 4.0 3.5 3.1 2.8 2.6Gross domestic purchases 1.6 -5.1 -3.8 -.2 3.9 4.1 3.6 3.1 2.8 2.5
Final sales 1.9 1.4 -3.3 .6 2.1 1.9 2.3 2.6 2.6 2.6Private dom. final purchases I 2.3 -3.8 -4.8 -.1 2.8 2.9 3.3 3.5 3.5 3.3
Personal consumption expend. 2.7 -3.4 -1.4 1.5 2.7 2.5 2.8 2,8 2.7 2.6
Durables 2,6 -12.3 -10.8 6.0 8.2 5.0 4.3 3.3 3.2 2.9Nondurables 2.3 -6.5 -2.9 -2.6 .4 .9 1.8 2.1 2.0 1.9Services 3.0 1.8 2.6 3.0 2.6 2.7 3.0 3.1 3.0 2.9
Business fixed investment 8.9 .1 -14.4 -7.5 .6 2.6 4.3 5.2 5.5 5.3Producers' durable equipment 1 10.2 6.3 -15.5 -6.7 3.5 5.5 7.5 8.0 8.0 7.5Nonresidential structures 5.1 -18.2 -11.2 -10.2 -9.0 -7.2 -6.9 -5.1 -3.9 -3.4
Residential structures -19.8 -20.6 -26.5 -4.1 12.5 11.2 9.5 9.7 9.8 9.6
Exports 6.9 11.0 -.4 3.6 6.1 8.0 7.4 7.3 7.1 8.0Imports 7.6 -11.8 -6.9 3.5 4.9 8.6 8.1 7.2 7.2 7.4
Government purchases 1.2 4.7 -2.3 3.5 -1.9 -1.5 -1.1 -. 9 -. 7 -. 8Federal .1 4.6 -3.5 9.4 -4.2 -4.8 -4.1 -4.2 -4.1 -4.4
Defense 2.7 12,1 -. 8 1.7 -8.0 -7.7 -6.9 -7.1 -7.1 -7.5
State and local I 2.0 4.9 -1.4 -. 6 -. 1 .9 1.1 1.5 1.7 1.8
Change in business inventories JBillions of 82$1 4.7 -26.4 -20.7 -29.0 -9.0 12.5 24.5 29.4 31.5 31.5Nonfarm IBillions of 82$1 4.7 -28.5 -25.5 -31.4 -12.2 9.0 20.8 25.6 27.6 27.6
Net exports IBillions of 82$1 -46.5 -8.8 2.2 2.4 4.3 3.4 2.3 2.5 2.3 3.3
[Percent change I 5.3 .9 2.6 3.0 7.5 7.4 7,2 6.0 5.4 5.1
iMPLOYMENT AND PRODUCTION I------ --------------- INonfarm payroll employment (Millions 110.7 110.2 109.5 109.1 109.3 109.9 110.5 111.0 111.4 111.9Unemployment rate Percent* I 5.6 5.9 6.5 6.8 6.8 6.6 6.4 6.3 6.3 6.2
Industrial production index Percent change 3.9 -7.0 -9.3 -1.6 5.3 5.3 5.1 4.9 4.3 4.2Capacity utilization rate-mfg. IPercent* 82.9 80.8 78.1 77.1 77.6 78.0 78.3 78.7 78.9 79.1
Housing starts Millions 1.13 1.04 .91 1.01 1.06 1.08 1.12 1.14 1.17 1.20Auto sales Millions 9.68 8.97 8.23 8.32 8.97 9.25 9.40 9.45 9.50 9.55
Domestic Millions 7.21 6.59 6.00 5.93 6.48 6.70 6.80 6.83 6.86 6.90Foreign IMillions I 2.47 2.38 2.23 2.39 2.48 2.55 2.60 2.62 2.64 2.65
INCOME AND SAVING.------------- ,----
Nominal personal income FPercent change 5.0 3.5 1.4 4.5 5.4 6.5 8.1 5.9 5.9 6.3Real disposable income IPercent change -.7 -3.5 -1.6 1.8 1.3 2.6 3.8 2.1 2.4 2.7Personal saving rate IPercent* 4.2 4.2 4.1 4.2 3.9 3.9 4.2 4.0 4.0 4.0
Corp. profits with IVA 6 CCAdj IPercent change -7.5 -14.8 -6.4 -7.9 41.2 34.1 18.6 7.3 -.9 2.5Profit share of GNP IPercent* 5.5 5.2 5.1 5.0 . 5.3 5.6 5.8 5.8 5.7 5.7
Federal govt. surplus/deficit Billions of $ -145.7 -184.3 -97.4 -164.7 -162.8 -150.6 -174.9 -162.7 -154.0 -156.0state and local govt. surplus 1 39.3 25.7 24.0 29.8 42.3 52.7 60.8 66.9 72.7 76.9
Exc. social insurance funds I -30.5 -44.8 -47.1 -42.2 -30.6 -21.1 -13.9 -8.7 -3.8 -.5
PRICES AND COSTS
GNP implicit deflatorGNP fixed-weight price indexCons. & fixed invest, prices
CPIExc. food and energy
ECI hourly compensation**
farm business sectoritput per hour.ompensation per hourUnit labor costs
* Not at an annual rate.** Private industry workers
IPercent change 3,7 .2.84.2 4.75.4 6.47.0 6.96.1 4.2
4.3 3.8
.6 -.74.7 3.94.1 4.7
5.5
5.13.13.66.8
4.6
3.1 3.3 3.23.1 3.5 3.52.8 3.8 3.4
2.7 4.0 3.63.7 3.9 3.9
4.1 3.6 3.5
1.0 1.8 2.24.0 4.4 3.93.0 2.6 1.7
3.6 2.9 2.64.0 3.3 3.03.4 3.3 3.1
3.8 3.5 3.14.0 3.5 3.1
3.4 3.3 3.3
1.8 1.8 1.6 1.3
3.9 3.3 3.2 3.22.1 1.5 1.6 1.9
May 8, 1991
minal GNP
CONFIDENTIAL - FRCLASS II FOMC
GROSS NATIONAL PRODUCT AND RELATED ITEMS(Net changes, billions of 1982 dollars)
I 1988 1989 1990 1987 19988 1989 1990| ----------------------------- --------- --------------- -------------- (fourth quarter to fourth quarter,
Real GNPGross domestic purchases
Final salesPrivate dom. final purchases
Personal consutption expend.DurablesNondurablesServices
Business fixed investmentProducers' durable equipmentNonresidential structures
Residential structures
Change in business inventoriesNonfarmFarm
Net exportsExportsImports
Government purchasesFederal
DefenseNondefenee
State and local
Ql Q2 Q3 Q4 01 Q2 03 04 Q1 Q2
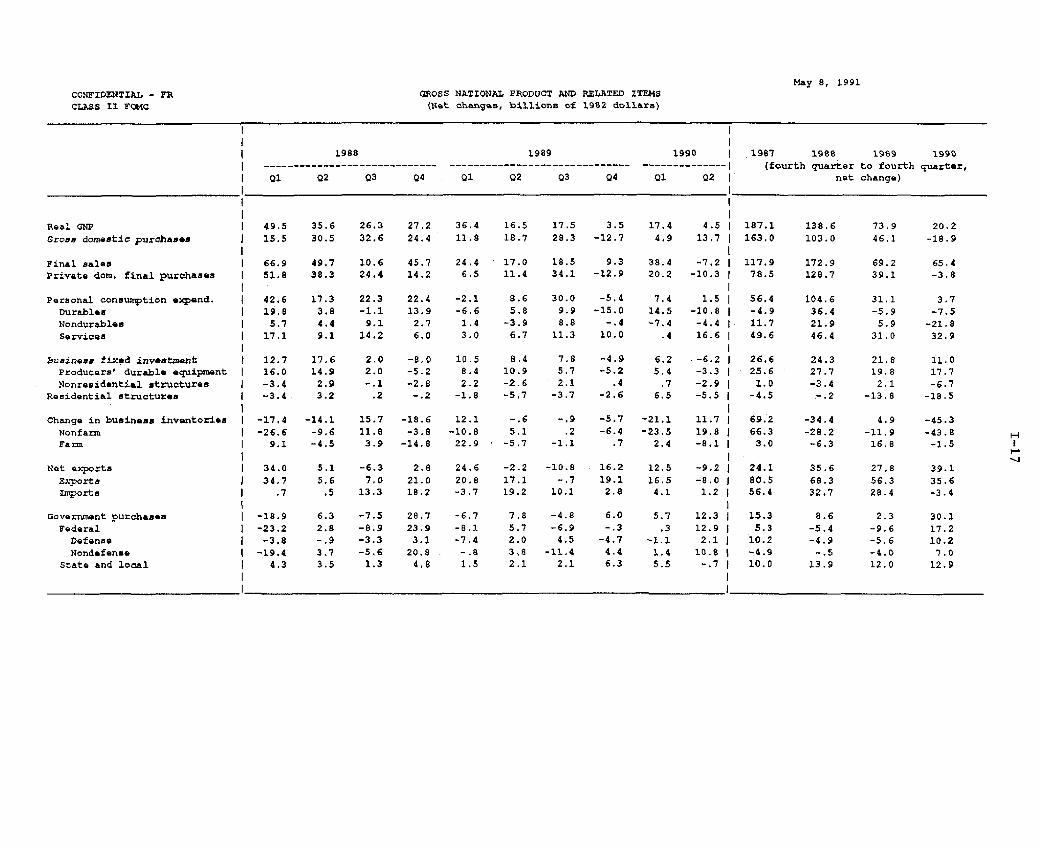
49.5 35.6 26.3 27.2 36.4 16.5 17.5 3.5 17.4 4.5
15.5 30.5 32.6 24.4 11.8 18.7 28.3 -12.7 4.9 13.7
66.9 49.7 10.6 45.7 24.4 17.0 18.5 9.3 38.4 -7.2
51.8 38.3 24.4 14.2 6.5 11.4 34.1 -12.9 20.2 -10.3
42.6 17.3 22.3 22.4 -2.1 8.6 30.0 -5.4 7.4 1.519.8 3.8 -1.1 13.9 -6.6 5.8 9.9 -15.0 14.5 -10.85.7 4.4 9.1 2.7 1.4 -3.9 8.8 -.4 -7.4 -4.4
17.1 9.1 14.2 6.0 3.0 6.7 11.3 10.0 .4 16.6
12.7 17,6 2.0 -8,0 10.5 8.4 7.8 -4.9 6.2 -6.2
16.0 14.9 2.0 -5.2 8.4 10.9 5.7 -5.2 5.4 -3.3
-3.4 2.9 -.1 -2.8 2.2 -2.6 2.1 .4 .7 -2.9-3,4 3.2 .2 -.2 -1.8 -5,7 -3.7 -2.6 6.5 -5.5
-17.4 -14.1 15.7 -18.6 12.1 -.6 -.9 -5.7 -21.1 11.7
-26.6 -9,6 11.8 -3.8 -10.8 5.1 .2 -6.4 -23.5 19.89.1 -4.5 3.9 -14.8 22.9 -5.7 -1.1 .7 2.4 -8.1
34.0 5.1 -6.3 2.8 24.6 -2.2 -10.8 16.2 12.5 -9.2
34.7 5.6 7.0 21.0 20.8 17.1 -. 7 19.1 16.5 -8.0.7 .5 13.3 18.2 -3.7 19.2 10.1 2.8 4.1 1.2
-18.9 6.3 -7.5 28.7 -6.7 7.8 -4,8 6.0 5.7 12.3
-23.2 2.8 -8.9 23.9 -8.1 5.7 -6,9 -.3 .3 12.9
-3.8 -.9 -3.3 3.1 -7.4 2.0 4.5 -4.7 -1.1 2.1
-19.4 3.7 -5.6 20.8 -.8 3,8 -11.4 4.4 1.4 10.84.3 3.5 1.3 4,8 1.5 2.1 2.1 6.3 5.5 -.7
187.1163.0
117.978.5
56,4
-4.911.749.6
26.625.6
1.0-4.5
69.2
66.33.0
24.180.556.4
15.35.3
10.2
-4.910.0
138.6103.0
172.9
128.7
104.6
36.421.946.4
24.327.7-3.4
-.2
-34.4
-28.2-6.3
net change)
73.9 20.246.1 -18.9
69.2 65.439.1 -3.8
31.1-5.9
5.931.0
21.819.8
2.1-13.8
4.9
-11.916.8
3.7-7.5
-21.8
32.9
11.017.7-6.7
-18.5
-45.3-43.8-1.5
35.6 27.8 39.168.3 56.3 35.632.7 28.4 -3.4
8.6-5.4
-4.9-. 5
13.9
2.3-9.6-5.6-4.012.0
30.117,210.2
7.012.9
May 8, 1991
-- ---
CONFIDENTIAL - FRCLASS II FOMC
GROSS NATIONAL PRODUCT AND RELATED ITEMS(Net changes, billions of 1982 dollars)
Projection.--.-------------.-----------.-....----.-----...--.....
1990 1991 1992------- ------------------ -------------------------
03 04 01 02 03 04 Q01 Q2 03. - 4 |
Projection
1989 1990 1991 1992
(fourth quarter to fourth quarter,net change)
Real GNPGross domestic purchases
Final salesPrivate dom. final purchases
Personal consumption expend.DurablesNondurablesServices
BuBineas fixed investmentProducers' durable equipmentNonresidential structures
Residential structures
change in business inventoriesNonfarmFarm
Net exports
ExportsImports
Government purchasesFederal
DefenseNondefense
State and local
14.9 -16.6 -:
16.8 -54.3 -
19.7 14,5 -:19.1 -32.8 -
18.0 -23.22.7 -13.95.2 -15.2
10.0 5.9
10.99.5
1.5-9.8
.1 -6.1 -
-6.0-9.7 -
-4.8 -31.1-6.9 -33.2
2.1 2.1
-1.9 37.710.4 16,712.3 -21.0
2.5.1
1.7-1.6
2.4
-1
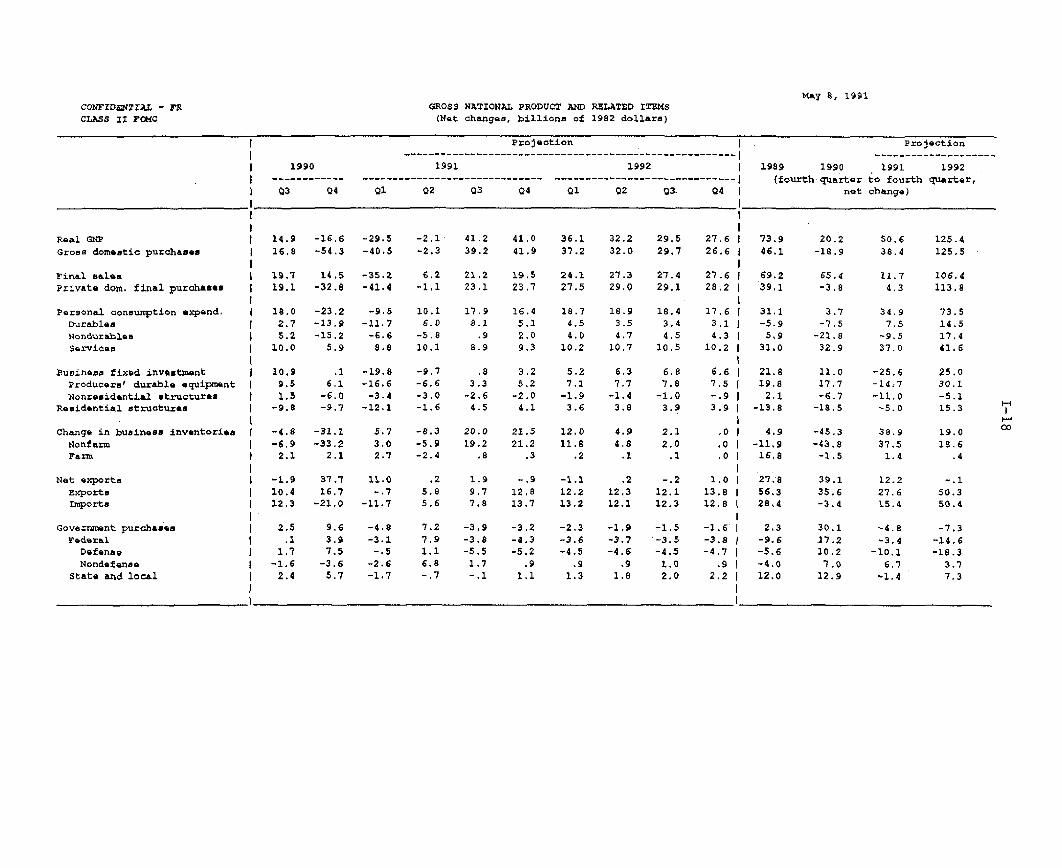
29.5 -2.1 41.2 41.0 36.1 32.2 29.5 27.640.5 -2.3 39.2 41.9 37.2 32.0 29.7 26.6
35.2 6.2 21,2 19.5 24.1 27.3 27.4 27.641.4 -1.1 23.1 23.7 27.5 29.0 29.1 28.2
-9.5 10.1 17.9 16.4 18.7 18.9 18.4 17.6
11.7 6.0 9.1 5.1 4,5 3.5 3.4 3.1-6.6 -5.8 .9 2.0 4.0 4.7 4.5 4.38.8 10.1 8,9 9.3 10.2 10.7 10.5 10.2
19.8 -9.7 .8 3.2 5.2 6.3 6.8 6.616.6 -6.6 3.3 5.2 7.1 7.7 7.8 7.5-3.4 -3.0 -2.6 -2.0 -1.9 -1.4 -1.0 -.912.1 -1.6 4.5 4.1 3.6 3.8 3.9 3.9
5.7 -8.3 20.0 21.5 12.0 4.9 2.1 .03.0 -5.9 19.2 21.2 11.8 4.8 2,0 ,02.7 -2.4 .8 .3 .2 .1 .1 .0
11.0 .2 1.9 -.9 -1.1 .2 -.2 1.0-. 7 5.8 9.7 12.8 12.2 12,3 12.1 13.8
11.7 5.6 7.8 13.7 13.2 12.1 12.3 12.8
9.6
3,97.5
-3.6
5.7
-3,9-3.8-5.5
1.7-. 1
-3.2-4.3-5.2
.91.1
-2.3
-3,6-4.5
,91,3
-1.5-3.5-4.51.02.0
-1.6-3.8-4.7
.92.2
73.946.1
69.2
39.1
31.1-5.95.9
31.0
21.819.8
2.1-13.8
4.9-11.916,8
27,8
56,328,4
2.3
-9.6-5.6-4,012.0
20.2-18.9
65.4-3.8
3.7-7.5
-21.832.9
11.017.7-6.7
-18.5
-45.3-43.8
-1.5
39.135.6-3.4
30.117.210.27.0
12.9
50.6 125.438.4 125.5
11.7 106.44.3 113.8
34.9 73.57.5 14.5
-9.5 17.437.0 41.6
-25.6-14,7
-11.0-5.0
25.030.1-5.115.3
38.9 19.037.5 18.6
1.4 .4
12.227.615.4
-4.8-3.4
-10.16.7
-1.4
-. 150.350.4
-7.3-14.6-18.3
3.77.3
May 8, 1991
I
-i
CONFIDENTIAL -FR CLASS II
FEDERAL SECTOR ACCOUNTS 1(Billions of dollars)
Fiscal years1990 1991 1992
1989a 1990a 1991 1992 la IIa IIIa IVa Ia II III IV I II III IV
BUDGET Not seasonally adjusted
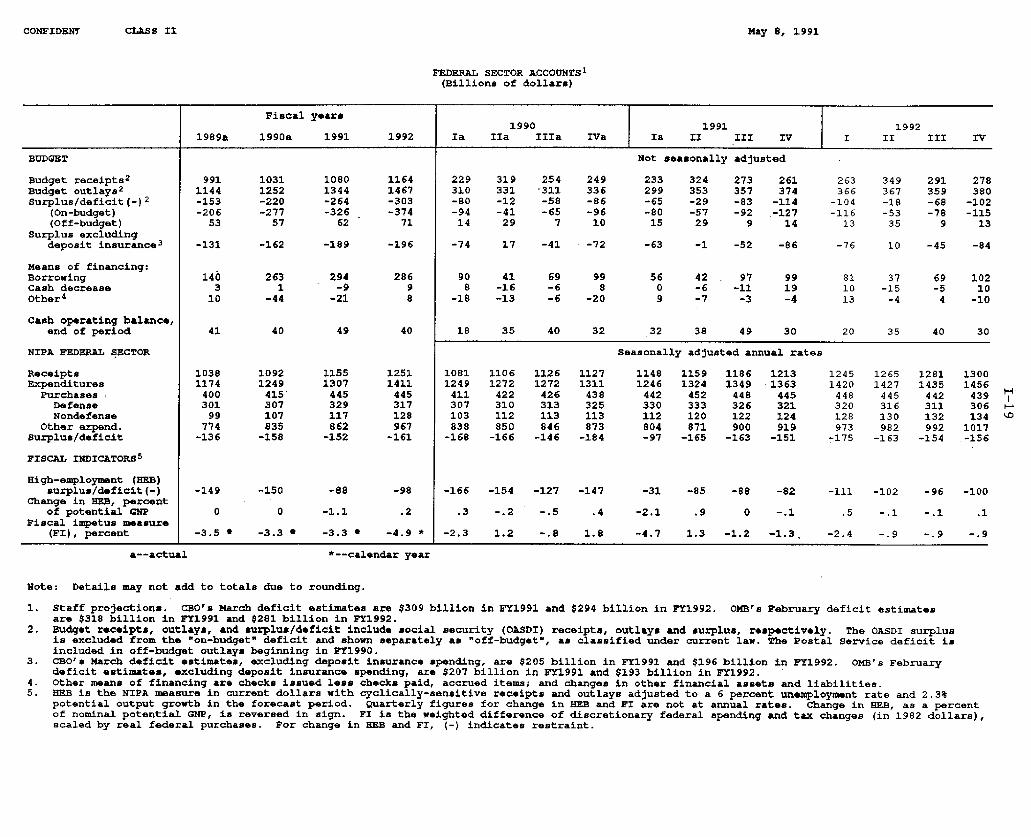
Budget receipts2 991 1031 1080 1164 229 319 254 249 233 324 273 261 263 349 291 278Budget outlays 2 1144 1252 1344 1467 310 331 '311 336 299 353 357 374 366 367 359 380Surplus/deficit(-) 2 -153 -220 -264 -303 -80 -12 -58 -86 -65 -29 -83 -114 -104 -18 -68 -102
(On-budget) -206 -277 -326 -374 -94 -41 -65 -96 -80 -57 -92 -127 -116 -53 -78 -115(Off-budget) 53 57 62 71 14 29 7 10 15 29 9 14 13 35 9 13
Surplus excludingdeposit insurance 3 -131 -162 -189 -196 -74 17 -41 -72 -63 -1 -52 -86 -76 10 -45 -84
Means of financing:Borrowing 140 263 294 286 90 41 69 99 56 42 97 99 81 37 69 102Cash decrease 3 1 -9 9 8 -16 -6 8 0 -6 -11 19 10 -15 -5 10Other 4 10 -44 -21 8 -18 -13 -6 -20 9 -7 -3 -4 13 -4 4 -10
Cash operating balance,end of period 41 40 49 40 18 35 40 32 32 38 49 30 20 35 40 30
NIPA FEDERAL SECTOR Seasonally adjusted annual rates
Receipts 1038 1092 1155 1251 1081 1106 1126 1127 1148 1159 1186 1213 1245 1265 1281 1300Expenditures 1174 1249 1307 1411 1249 1272 1272 1311 1246 1324 1349 1363 1420 1427 1435 1456
Purchases 400 415' 445 445 411 422 426 438 442 452 448 445 448 445 442 439Defense 301 307 329 317 307 310 313 325 330 333 326 321 320 316 311 306Nondefense 99 107 117 128 103 112 113 113 112 120 122 124 128 130 132 134
Other expend. 774 835 862 967 838 850 846 873 804 871 900 919 973 982 992 1017Surplus/deficit -136 -158 -152 -161 -168 -166 -146 -184 -97 -165 -163 -151 -175 -163 -154 -156
FISCAL INDICATORS 5
High-employment (BEB)surplus/deficit(-) -149 -150 -88 -98 -166 -154 -127 -147 -31 -85 -88 -82 -111 -102 -96 -100
Change in HEB, percentof potential GNP 0 0 -1.1 .2 .3 -. 2 -. 5 .4 -2.1 .9 0 -. 1 .5 -. 1 -. 1 .1
Fiscal impetus measure(FI), percent -3.5 * -3.3 * -3.3 * -4.9 * -2.3 1.2 -. 8 1.8 -4.7 1.3 -1.2 -1.3. -2.4 -. 9 -. 9 -. 9
a--actual *--calendar year
Note: Details may not add to totals due to rounding.
1. Staff projections. CBO's March deficit estimates are $309 billion in FY1991 and $294 billion in FY1992. OMB's February deficit estimatesare $318 billion in FY1991 and $281 billion in FY1992.
2. Budget receipts, outlays, and surplus/deficit include social security (OASDI) receipts, outlays and surplus, respectively. The OASDI surplusis excluded from the "on-budget- deficit and shown separately as "off-budget", as classified under current law. The Postal Service deficit isincluded in off-budget outlays beginning in ET1990.
3. CBO's March deficit estimates, excluding deposit insurance spending, are $205 billion in FY1991 and $196 billion in FY1992. OMB's Februarydeficit estimates, excluding deposit insurance spending, are $207 billion in FY1991 and $193 billion in FY1992.
4. Other means of financing are checks issued less checks paid, accrued items; and changes in other financial assets and liabilities.5. HEB is the NIPA measure in current dollars with cyclically-sensitive receipts and outlays adjusted to a 6 percent unemployment rate and 2.3%
potential output growth in the forecast period. Quarterly figures for change in HEB and FI are not at annual rates. Change in HEB, as a percentof nominal potential GNP, is reversed in sign. FI is the weighted difference of discretionary federal spending and tax changes (in 1982 dollars),scaled by real federal purchases. For change in HEB and FI, (-) indicates restraint.
May 8, 1991
DOMESTIC FINANCIAL DEVELOPMENTS
Recent Developments
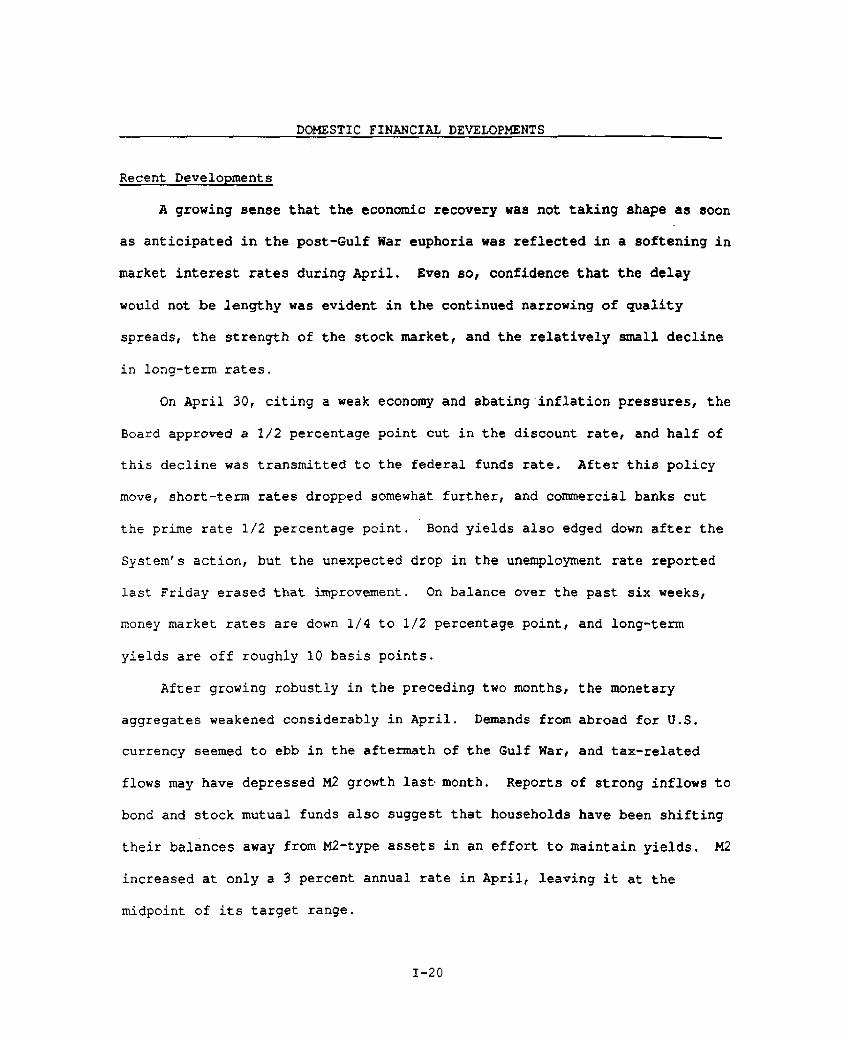
A growing sense that the economic recovery was not taking shape as soon
as anticipated in the post-Gulf War euphoria was reflected in a softening in
market interest rates during April. Even so, confidence that the delay
would not be lengthy was evident in the continued narrowing of quality
spreads, the strength of the stock market, and the relatively small decline
in long-term rates.
On April 30, citing a weak economy and abating inflation pressures, the
Board approved a 1/2 percentage point cut in the discount rate, and half of
this decline was transmitted to the federal funds rate. After this policy
move, short-term rates dropped somewhat further, and commercial banks cut
the prime rate 1/2 percentage point. Bond yields also edged down after the
System's action, but the unexpected drop in the unemployment rate reported
last Friday erased that improvement. On balance over the past six weeks,
money market rates are down 1/4 to 1/2 percentage point, and long-term
yields are off roughly 10 basis points.
After growing robustly in the preceding two months, the monetary
aggregates weakened considerably in April. Demands from abroad for U.S.
currency seemed to ebb in the aftermath of the Gulf War, and tax-related
flows may have depressed M2 growth last month. Reports of strong inflows to
bond and stock mutual funds also suggest that households have been shifting
their balances away from M2-type assets in an effort to maintain yields. M2
increased at only a 3 percent annual rate in April, leaving it at the
midpoint of its target range.
I-20
I-21
Growth of M3 dropped to a 1 percent rate last month, but the aggregate
remained in the upper half of its annual target cone. The contraction in
the funding needs of thrift institutions appears to have diminished in
April, as RTC resolution activity all but ceased; however, bank credit
expansion dropped from around a 6-1/2 percent rate in February and March to
less than zero in April, consistent with a deceleration in overall M3.
Commercial banks continued to add government securities to their balance
sheets last month, but not rapidly enough to outweigh the drop in other
securities and in loans.
Within the bank loan total, C&I loans showed the most weakness,
declining at a 9 percent rate, according to the preliminary estimate. Such
sharp declines have been rare, but they have occurred in prior recessions;
the last monthly drop of about this magnitude took place toward the end of
the 1980 contraction. Credit supply factors likely played only a secondary
role in the recent weakening of business loans. In the latest survey of
bank lending practices, a much smaller share of banks reported that they had
tightened terms and standards for approving C&I loans than in earlier
surveys taken during the past year.
While bank lending to nonfinancial businesses has been weak lately, the
growth of commercial paper outstanding turned decidedly positive in April,
and a large volume of bonds were issued. Even below-investment grade firms
were moved to sell bonds, partly in response to the buoyant equity market,
which enabled some to issue convertible bonds. In addition, lower yields
boosted offerings; the rate spread between junk bonds and Treasuries
narrowed another 150 basis points to dip slightly below its 1990 range.
Stock issuance also was quite heavy, as firms took advantage of investor
I-22
optimism that lifted most major stock price indexes to record highs in mid-
April.
Issuers of tax-exempt bonds did not similarly step up their offerings
in April; in fact, long-term debt issuance by state and local governments
declined a bit last month. Meanwhile, the federal government paid down some
debt, as the Treasury received almost $5 billion in Desert Shield/Storm
payments from foreign governments and RTC spending was constrained by delays
in legislative approval of new financing authority.
In the household sector, information is sketchy, but it suggests little
reason to think that aggregate borrowing picked up substantially in April.
Car sales were weak and likely depressed auto loans, which have been falling
rapidly of late. While anecdotal and survey reports point to a
strengthening in mortgage activity, the data in hand suggest that many of
these loans have not yet gone to closing. Real estate loans at banks grew
at just a 3 percent rate last month, and available data on their holdings of
mortgage-backed securities point to a slowing in net acquisitions of these
mortgage assets as well. One contributor to the slack in real estate
lending has been the sharp drop in the growth rate of revolving home equity
loans, from more than 20 percent in January to zero in April.
Outlook
The staff's projection for the economy and the flow of funds is based
on the assumption that the federal funds rate will stay close to its current
level of 5-3/4 percent throughout the forecast period, slightly below the 6
percent level assumed in the last Greenbook. The path of other market
interest rates also has been revised downward a bit, with short-term rates
expected to hold near current levels through 1992 and long-term rates
I-23
firming just a little as the economic recovery commences, and then drifting
down next year as growth moderates and the appreciable slowing in underlying
inflation becomes increasingly evident. Credit supply conditions should
ease somewhat over the next year and a half, but with yield spreads already
fairly narrow for high-grade borrowers, the major beneficiaries among
nonfinancial borrowers will tend to be smaller businesses and others reliant
on loans from intermediaries.
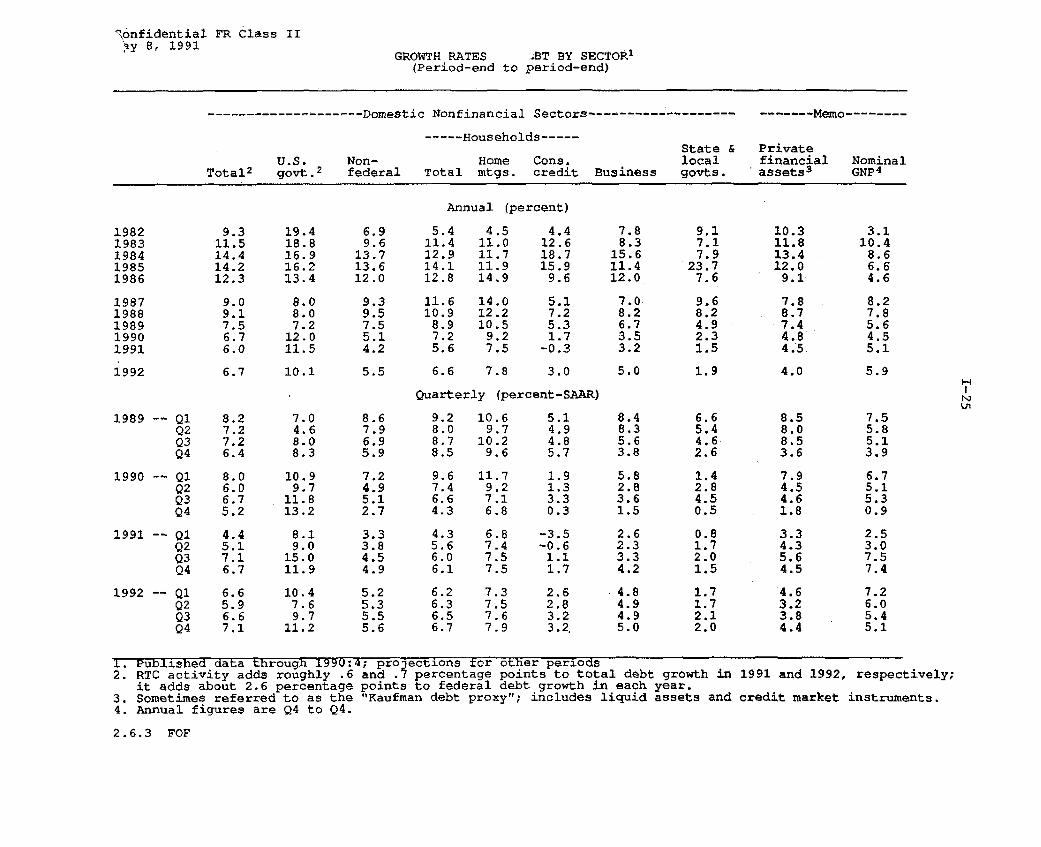
Overall, debt of the domestic nonfinancial sectors is projected to rise
somewhat faster than nominal GNP, with the overage reflecting an artificial
boost from RTC-related intermediation by the federal government. In the
current quarter, the growth rate of the debt aggregate is expected to remain
relatively low at about 5 percent, but it is projected to rise noticeably in
the second half of the year. The acceleration in debt later this year owes
primarily to a surge in federal borrowing rather than to a rebound in
private sector financing needs related to increased spending and investment.
Federal debt growth is expected to balloon to around a 14 percent rate in
the second half of this year, as RTC resolution activity resumes and foreign
contributions to the Defense Cooperation Account drop off. In 1992, U.S.
government debt growth should slacken as RTC net outlays slow and the
strengthening economy buoys tax receipts.
Outside the federal sector, borrowing is expected to increase modestly
over the forecast horizon. Nonfederal debt growth is likely to be below
that of nominal GNP in 1991 and the first half of 1992 and thereafter to
about keep pace with it. For households, the restrained borrowing pattern
reflects the projected sluggish improvement of the housing market as well as
the unusually slow recovery of spending on consumer durables expected in
I-24
this business cycle. Consumer credit is projected to decline somewhat
further in the current quarter and to pick up gradually to grow at only
about a 3 percent pace by the end of next year.
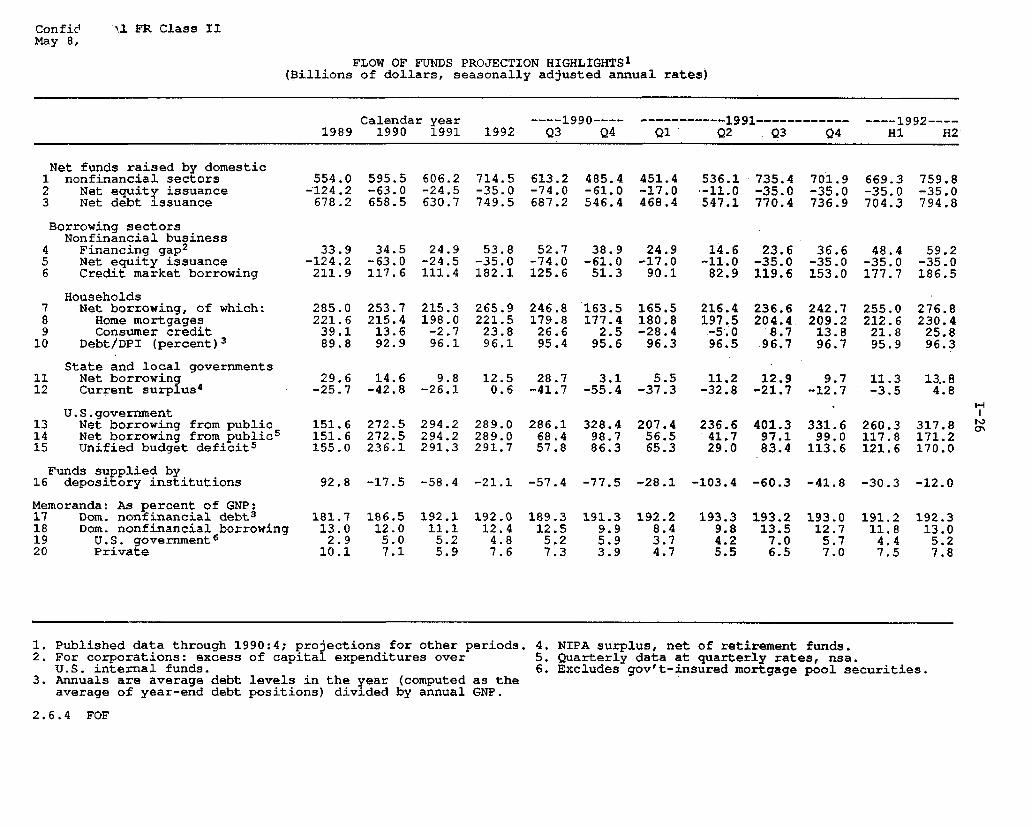
The needs of nonfinancial corporations for funds are expected to be
rather moderate in the current quarter, associated with a slackening of net
equity retirements and a narrowing of the financing gap as capital outlays
fall further. With enhanced concerns about balance sheet structure and with
lenders exhibiting substantial reluctance to fund highly leveraged
transactions, more and more firms have been deleveraging, and new mergers
and acquisitions are increasingly tailored as stock-for-stock deals.
Looking ahead to 1992, borrowing is likely to pick up some as spending on
inventories and fixed capital rises faster than internal cash flows and
lenders respond to the improving economy and reduced credit risk by
providing funds somewhat more freely. However, the willingness of
commercial banks to lend is likely to be more restrained than usual in the
recovery phase of a business cycle, as banks continue to adjust to new
capital requirements, position themselves to take advantage of possible new
legislative initiatives, and remain afflicted by an overhang of bad loans,
especially in the commercial real estate area. Insurance companies and
other intermediaries also are likely to exhibit a continuing, though
lessened, degree of restraint throughout the projection period.
The state and local sector is projected to remain a light net borrower
through 1992. This reflects our anticipation of some hesitancy to incur new
indebtedness for capital projects until budgetary pressures have eased and
of a sizable volume of debt retirements associated with earlier advance
refundings.
Confidential FR Class IIMay 8, 1991
GROWTH RATES OF DEBT BY SECTOR 1
(Period-end to period-end)
------------------- Domestic Nonfinancial Sectors------------------ ----- Memo------
----- Households-----State & Private
U.S. Non- Home Cons. local financial NominalTotal 2 govt. 2 federal Total mtgs. credit Business govts. assets3 GNP4
Annual (percent)
1982 9.3 19.4 6.9 5.4 4.5 4.4 7.8 9.1 10.3 3.11983 11.5 18.8 9.6 11.4 11.0 12.6 8.3 7.1 11.8 10.41984 14.4 16.9 13.7 12.9 11.7 18.7 15.6 7.9 13.4 8.61985 14.2 16.2 13.6 14.1 11.9 15.9 11.4 23.7 12.0 6.61986 12.3 13.4 12.0 12.8 14.9 9.6 12.0 7.6 9.1 4.6
1987 9.0 8.0 9.3 11.6 14.0 5.1 7.0 9.6 7.8 8.21988 9.1 8.0 9.5 10.9 12.2 7.2 8.2 8.2 8.7 7.81989 7.5 7.2 7.5 8.9 10.5 5.3 6.7 4.9 7.4 5.61990 6.7 12.0 5.1 7.2 9.2 1.7 3.5 2.3 4.8 4.51991 6.0 11.5 4.2 5.6 7.5 -0.3 3.2 1.5 4.5 5.1
1992 6.7 10.1 5.5 6.6 7.8 3.0 5.0 1.9 4.0 5.9
Quarterly (percent-SAAR)
1989 -- 01 8.2 7.0 8.6 9.2 10.6 5.1 8.4 6.6 8.5 7.5Q2 7.2 4.6 7.9 8.0 9.7 4.9 8.3 5.4 8.0 5.8Q3 7.2 8.0 6.9 8.7 10.2 4.8 5.6 4.6 8.5 5.1Q4 6.4 8.3 5.9 8.5 9.6 5.7 3.8 2.6 3.6 3.9
1990 -~ Q1 8.0 10.9 7.2 9.6 11.7 1.9 5.8 1.4 7.9 6.7Q2 6.0 9.7 4.9 7.4 9.2 1.3 2.8 2.8 4.5 5.1Q3 6.7 11.8 5.1 6.6 7.1 3.3 3.6 4.5 4.6 5.3Q4 5.2 13.2 2.7 4.3 6.8 0.3 1.5 0.5 1.8 0.9
1991 -- Q1 4.4 8.1 3.3 4.3 6.8 -3.5 2.6 0.8 3.3 2.5Q2 5.1 9.0 3.8 5.6 7.4 -0.6 2.3 1.7 4.3 3.0Q3 7.1 15.0 4.5 6.0 7.5 1.1 3.3 2.0 5.6 7.5Q4 6.7 11.9 4.9 6.1 7.5 1.7 4.2 1.5 4.5 7.4
1992 -- Q1 6.6 10.4 5.2 6.2 7.3 2.6 4.8 1.7 4.6 7.2Q2 5.9 7.6 5.3 6.3 7.5 2.8 4.9 1.7 3.2 6.0Q3 6.6 9.7 5.5 6.5 7.6 3.2 4.9 2.1 3.8 5.4Q4 7.1 11.2 5.6 6.7 7.9 3.2. 5.0 2.0 4.4 5.1
1. Published data through 1990:4; projectxons for other periods2. RTC activity adds roughly .6 and .7 percentage points to total debt growth in
it adds about 2.6 percentage points to federal debt growth in each year.3. Sometimes referred to as the "Kaufman debt proxy"; includes liquid assets and4. Annual figures are Q4 to Q4.
2.6.3 FOF
1991 and 1992,
credit market
respectively;
instruments.
ConfidentialMay 8, 1991
FR Class II
FLOW OF FUNDS PROJECTION HIGHLIGHTS 1
(Billions of dollars, seasonally adjusted annual rates)
Calendar year ----1990---- -----------1991------------ ----1992----1989 1990 1991 1992 Q3 Q4 01 Q2 Q3 Q4 H1 H2
Net funds raised by domestic1 nonfinancial sectors 554.0 595.5 606.2 714.5 613.2 485.4 451.4 536.1 735.4 701.9 669.3 759.82 Net equity issuance -124.2 -63.0 -24.5 -35.0 -74.0 -61.0 -17.0 -11.0 -35.0 -35.0 -35.0 -35.03 Net debt issuance 678.2 658.5 630.7 749.5 687.2 546.4 468.4 547.1 770.4 736.9 704.3 794.8
Borrowing sectorsNonfinancial business
4 Financing gap 2 33.9 34.5 24.9 53.8 52.7 38.9 24.9 14.6 23.6 36.6 48.4 59.25 Net equity issuance -124.2 -63.0 -24.5 -35.0 -74.0 -61.0 -17.0 -11.0 -35.0 -35.0 -35.0 -35.06 Credit market borrowing 211.9 117.6 111.4 182.1 125.6 51.3 90.1 82.9 119.6 153.0 177.7 186.5
Households7 Net borrowing, of which: 285.0 253.7 215.3 265.9 246.8 163.5 165.5 216.4 236.6 242.7 255.0 276.88 Home mortgages 221.6 215.4 198.0 221.5 179.8 177.4 180.8 197.5 204.4 209.2 212.6 230.49 Consumer credit 39.1 13.6 -2.7 23.8 26.6 2.5 -28.4 -5.0 8.7 13.8 21.8 25.8
10 Debt/DPI (percent)3 89.8 92.9 96.1 96.1 95.4 95.6 96.3 96.5 96.7 96.7 95.9 96.3
State and local governments11 Net borrowing 29.6 14.6 9.8 12.5 28.7 3.1 5.5 11.2 12.9 9.7 11.3 13..812 Current surplus4 -25.7 -42.8 -26.1 0.6 -41.7 -55.4 -37.3 -32.8 -21.7 -12.7 -3.5 4.8
U.S.government13 Net borrowing from public 151.6 272.5 294.2 289.0 286.1 328.4 207.4 236.6 401.3 331.6 260.3 317.814 Net borrowing from public5 151.6 272.5 294.2 289.0 68.4 98.7 56.5 41.7 97.1 99.0 117.8 171.215 Unified budget deficits 155.0 236.1 291.3 291.7 57.8 86.3 65.3 29.0 83.4 113.6 121.6 170.0
Funds supplied by16 depository institutions 92.8 -17.5 -58.4 -21.1 -57.4 -77.5 -28.1 -103.4 -60.3 -41.8 -30.3 -12.0
Memoranda: As percent of GNP:17 Dom. nonfinancial debt 3 181.7 186.5 192.1 192.0 189.3 191.3 192.2 193.3 193.2 193.0 191.2 192.318 Dom. nonfinancial borrowing 13.0 12.0 11.1 12.4 12.5 9.9 8.4 9.8 13.5 12.7 11.8 13.019 U.S. government6 2.9 5.0 5.2 4.8 5.2 5.9 3.7 4.2 7.0 5.7 4.4 5.220 Private 10.1 7.1 5.9 7.6 7.3 3.9 4.7 5.5 6.5 7.0 7.5 7.8
1. Published data through 1990:4; projections for other periods. 4. NIPA surplus, net of retirement funds.2. For corporations: excess of capital expenditures over 5. Quarterly data at quarterly rates, nsa.
U.S. internal funds. 6. Excludes gov't-insured mortgage pool securities.3. Annuals are average debt levels in the year (computed as the
average of year-end debt positions) divided by annual GNP.
2.6.4 FOF
INTERNATIONAL DEVELOPMENTS
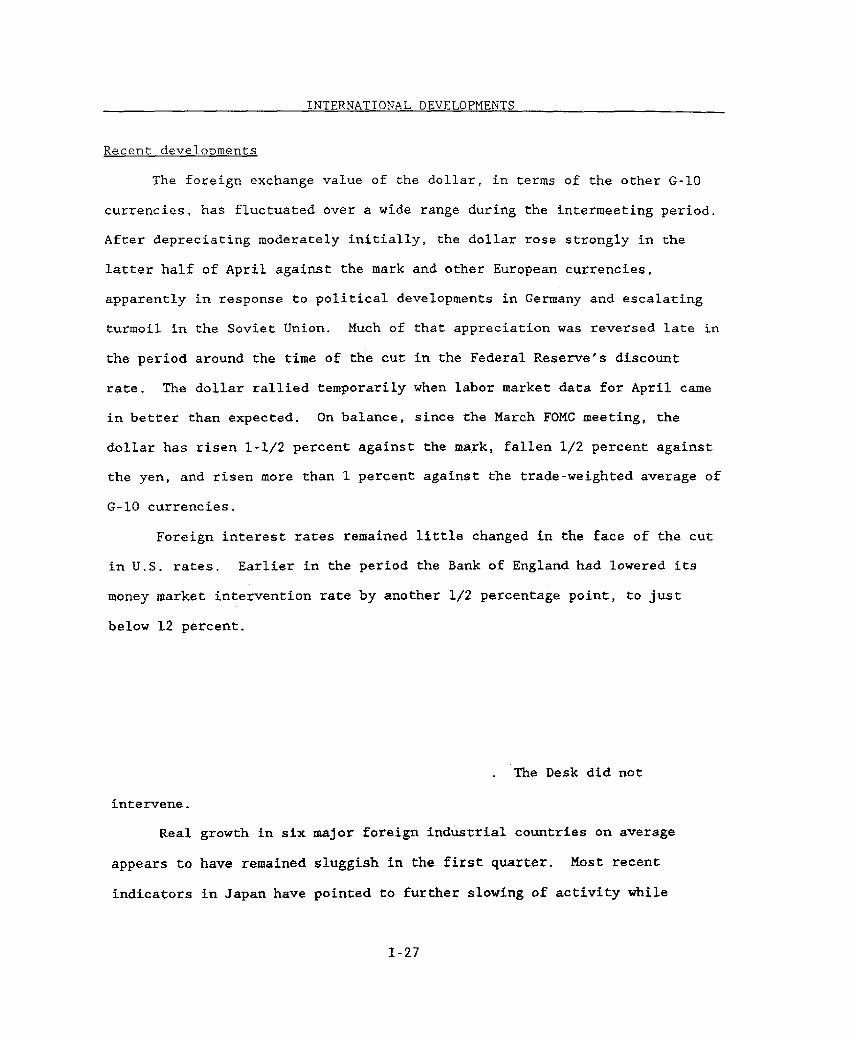
Recent developments
The foreign exchange value of the dollar, in terms of the other G-10
currencies, has fluctuated over a wide range during the intermeeting period.
After depreciating moderately initially, the dollar rose strongly in the
latter half of April against the mark and other European currencies,
apparently in response to political developments in Germany and escalating
turmoil in the Soviet Union. Much of that appreciation was reversed late in
the period around the time of the cut in the Federal Reserve's discount
rate. The dollar rallied temporarily when labor market data for April came
in better than expected. On balance, since the March FOMC meeting, the
dollar has risen 1-1/2 percent against the mark, fallen 1/2 percent against
the yen, and risen more than 1 percent against the trade-weighted average of
G-10 currencies.
Foreign interest rates remained little changed in the face of the cut
in U.S. rates. Earlier in the period the Bank of England had lowered its
money market intervention rate by another 1/2 percentage point, to just
below 12 percent.
The Desk did not
intervene.
Real growth in six major foreign industrial countries on average
appears to have remained sluggish in the first quarter. Most recent
indicators in Japan have pointed to further slowing of activity while
1-27
I-28
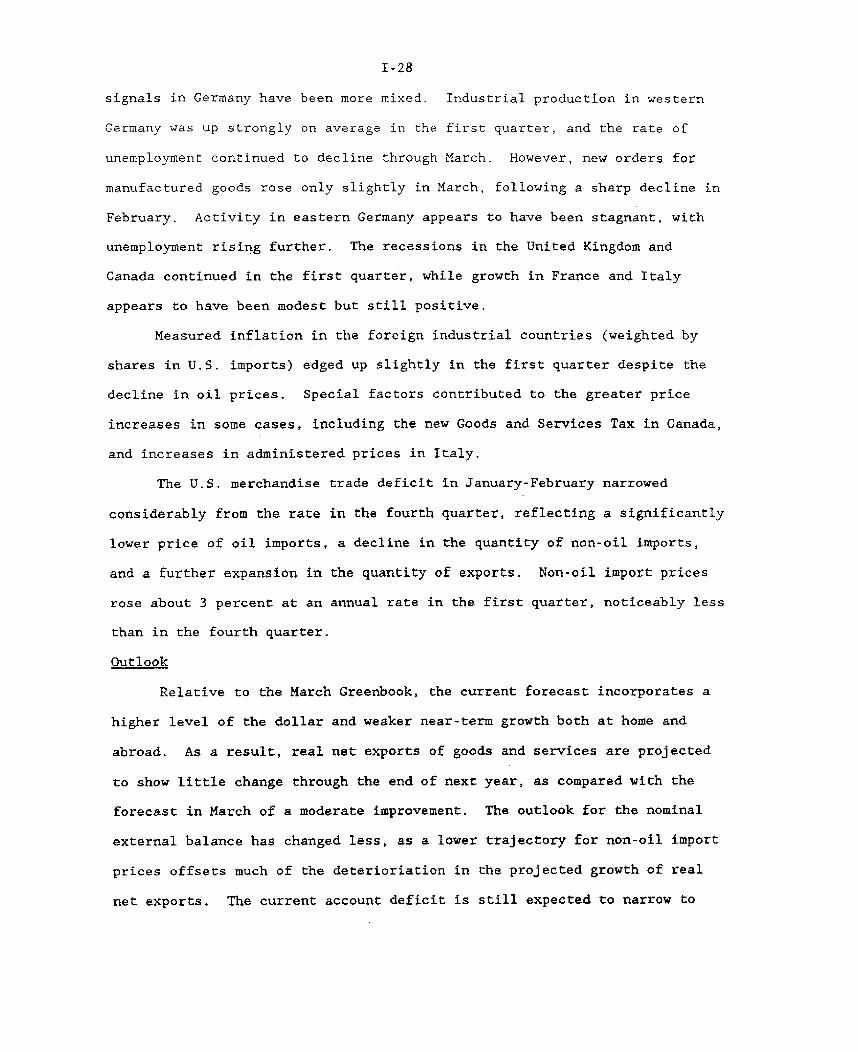
signals in Germany have been more mixed. Industrial production in western
Germany was up strongly on average in the first quarter, and the rate of
unemployment continued to decline through March. However, new orders for
manufactured goods rose only slightly in March, following a sharp decline in
February. Activity in eastern Germany appears to have been stagnant, with
unemployment rising further. The recessions in the United Kingdom and
Canada continued in the first quarter, while growth in France and Italy
appears to have been modest but still positive.
Measured inflation in the foreign industrial countries (weighted by
shares in U.S. imports) edged up slightly in the first quarter despite the
decline in oil prices. Special factors contributed to the greater price
increases in some cases, including the new Goods and Services Tax in Canada,
and increases in administered prices in Italy.
The U.S. merchandise trade deficit in January-February narrowed
considerably from the rate in the fourth quarter, reflecting a significantly
lower price of oil imports, a decline in the quantity of non-oil imports,
and a further expansion in the quantity of exports. Non-oil import prices
rose about 3 percent at an annual rate in the first quarter, noticeably less
than in the fourth quarter.
Outlook
Relative to the March Greenbook, the current forecast incorporates a
higher level of the dollar and weaker near-term growth both at home and
abroad. As a result, real net exports of goods and services are projected
to show little change through the end of next year, as compared with the
forecast in March of a moderate improvement. The outlook for the nominal
external balance has changed less, as a lower trajectory for non-oil import
prices offsets much of the deterioriation in the projected growth of real
net exports. The current account deficit is still expected to narrow to
I-29
less than $10 billion this year as a result of foreign government transfers
to the United States associated with the Gulf War, and then to widen to a
rate of more than $40 billion next year.
The Dollar. The foreign exchange value of the dollar against the
other G-10 currencies is expected to decline somewhat from its current level
over the forecast period. This path of the dollar represents an upward
revision of about 6 percent on average above that in the March Greenbook,
reflecting the sustained weakening of the mark and other European currencies
over the past few months. However, the upward revision is less in the
longer term than in the near term, because some of the recent economic and
political factors that have been depressing the mark are assumed to diminish
over time. Against the currencies of eight developing countries, the dollar
is still expected to show a small depreciation in real terms this year and
next.
Foreign Industrial Countries. The near-term outlook for growth in the
major foreign industrial countries has been revised down somewhat because
data have continued to show both weakness in current activity and the
absence of clear leading indicators of an upturn. Average growth in the G-6
countries (weighted by their shares in U.S. exports) is now projected to be
a little over 1 percent over the four quarters of 1991 -- down about 1/4
percentage point from the previous staff forecast. Growth is still expected
to improve to the range of 2-1/2 to 3 percent by the fourth quarter of
this year and next year, however, as consumption and investment revive
following the decline in oil prices and monetary easing, particularly in
those countries currently in recession. Japan is again forecast to show the
strongest growth next year (at 3-3/4 percent), while German growth is
expected to be around 3 percent, about the same as this year. The United
Kingdom and Canada are both expected to register significant positive swings
I-30
in 1992 and to contribute importantly to the overall trend toward recovery
abroad.
The outlook for average inflation in the foreign industrial countries
in 1991 and 1992 has been lowered slightly, partly in view of the weaker
forecast for foreign growth. Increases in expected inflation in Germany and
Japan in 1991 have been more than offset by projections of lower inflation
rates in France, the United Kingdom, and Canada than those predicted in
March. Average inflation over the four quarters of 1991 is now forecast to
be about 4 percent, more than 3/4 percentage point below the 1990 figure,
and to slow an additional 1/2 percentage point next year.
The outlook for interest rates in the major foreign industrial
countries is consistent with a cautious easing of monetary policy in a
context of slowing inflation and weak, but recovering, real demand. On
average, short-term interest rates are expected to move down gradually about
1/2 percentage point by the end of the forecast period. While the
Bundesbank is assumed to raise its rates slightly in the near term, German
short-term interest rates are expected to show little net change over the
rest of the forecast period. Japanese short-term interest rates are assumed
to edge down this year as aggregate demand slows, and the recessions and
monetary easing in Canada and the United Kingdom are expected to result in
further declines in short-term rates in those countries. Long-term rates
abroad, on average, are expected to decline somewhat less than short rates.
Developing Countries. Growth in key developing-country trading
partners is projected to increase slightly in 1991 to nearly 5 percent and
to rise further to about 5-1/4 percent in 1992. All countries in this group
are expected to be affected negatively by the decline in growth in
industrial countries in 1991. However, government policy is sufficiently
expansionary in several key developing countries to offset expected slower
I-31
growth in external demand, and the somewhat lower average level of oil
prices expected for this year will be a net positive factor. The average
projected growth of this group of countries has been revised up slightly
since the March Greenbook as a result of both improved investor confidence
(particularly in Taiwan) following the end of the Gulf War and an outlook
for more expansionary government policies in key countries.
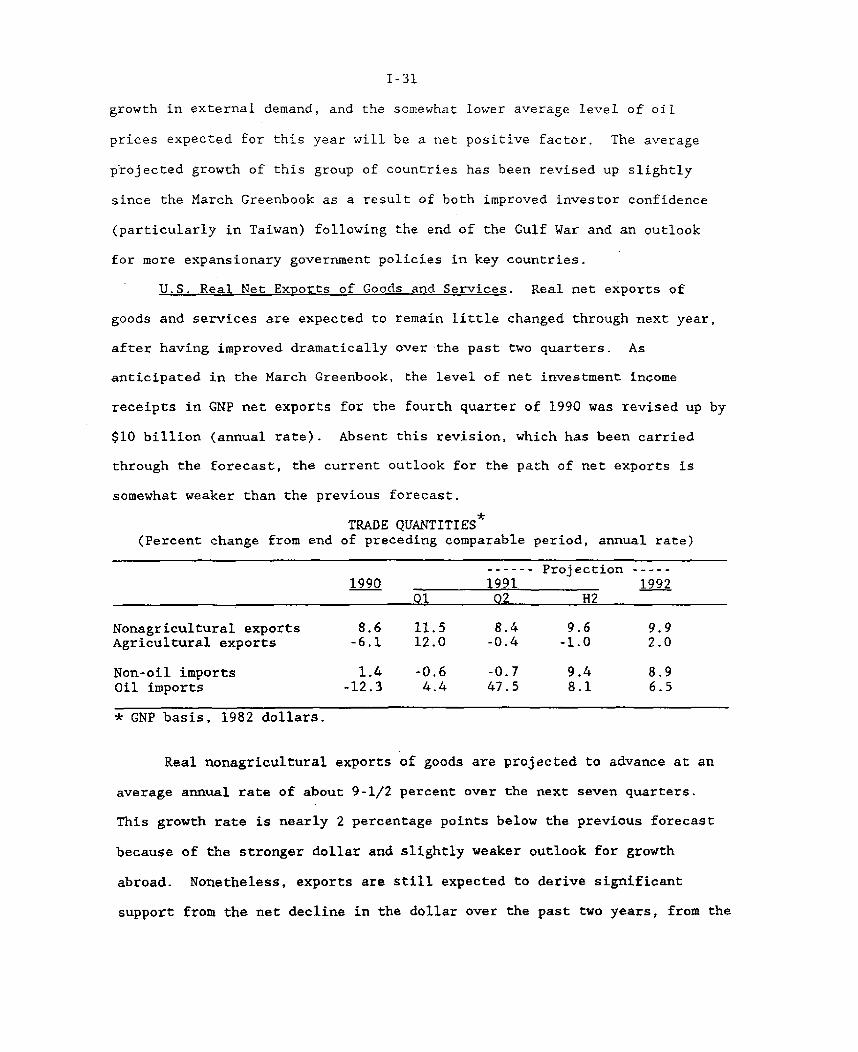
U.S. Real Net Exports of Goods and Services. Real net exports of
goods and services are expected to remain little changed through next year,
after having improved dramatically over the past two quarters. As
anticipated in the March Greenbook, the level of net investment income
receipts in GNP net exports for the fourth quarter of 1990 was revised up by
$10 billion (annual rate). Absent this revision, which has been carried
through the forecast, the current outlook for the path of net exports is
somewhat weaker than the previous forecast.
TRADE QUANTITIES(Percent change from end of preceding comparable period, annual rate)
------ Projection-----1990 1991 1992
Q1 Q2 H2
Nonagricultural exports 8.6 11.5 8.4 9.6 9.9Agricultural exports -6.1 12.0 -0.4 -1.0 2.0
Non-oil imports 1.4 -0.6 -0.7 9.4 8.9Oil imports -12.3 4.4 47.5 8.1 6.5
* GNP basis, 1982 dollars.
Real nonagricultural exports of goods are projected to advance at an
average annual rate of about 9-1/2 percent over the next seven quarters.
This growth rate is nearly 2 percentage points below the previous forecast
because of the stronger dollar and slightly weaker outlook for growth
abroad. Nonetheless, exports are still expected to derive significant
support from the net decline in the dollar over the past two years, from the
I-32
projected pick up in foreign growth, and from continued rapid growth in real
exports of computers. Agricultural exports are projected to show little
further expansion from the high rate reached in the first quarter.
The quantity of non-oil imports of goods, after having declined in the
first quarter, is projected to remain about unchanged in the second quarter
and then to expand at an average annual rate of 9 percent over the next six
quarters. Constant-dollar imports of computers are expected to expand more
rapidly, and, as in the case of nonagricultural exports, to add several
percentage points to the growth rate for total non-oil imports. Beyond the
near term, the projected growth of imports is somewhat above the previous
forecast, reflecting the effects of the higher assumed path of the dollar.
Oil imports are expected to jump in the current quarter as stocks are
rebuilt, and to expand steadily thereafter in line with growing domestic
consumption and gradually receding domestic production.
Oil Prices. Oil prices have firmed somewhat since the March forecast,
and import prices are now expected to average about $19 per barrel through
the summer. Early indications are that OPEC countries are holding to the
production levels agreed to in the accord of early March. In particular,
Saudi Arabian production appears to have been reduced significantly in
April, about in line with expectations. Prospects for significant exports
from Iraq and Kuwait this year have diminished somewhat. However, increases
in Saudi Arabian production are expected to make up for any shortfall, and
import prices are assumed to return to a flat $18 per barrel path by the end
of the year, a level consistent with a spot price of $19.50 per barrel for
West Texas intermediate crude.
Prices of Exports and Non-oil Imports. The fixed weight price index
for U.S. nonagricultural exports is projected to decline further in the
second quarter, and to rise only moderately over the next year and a half.
I-33
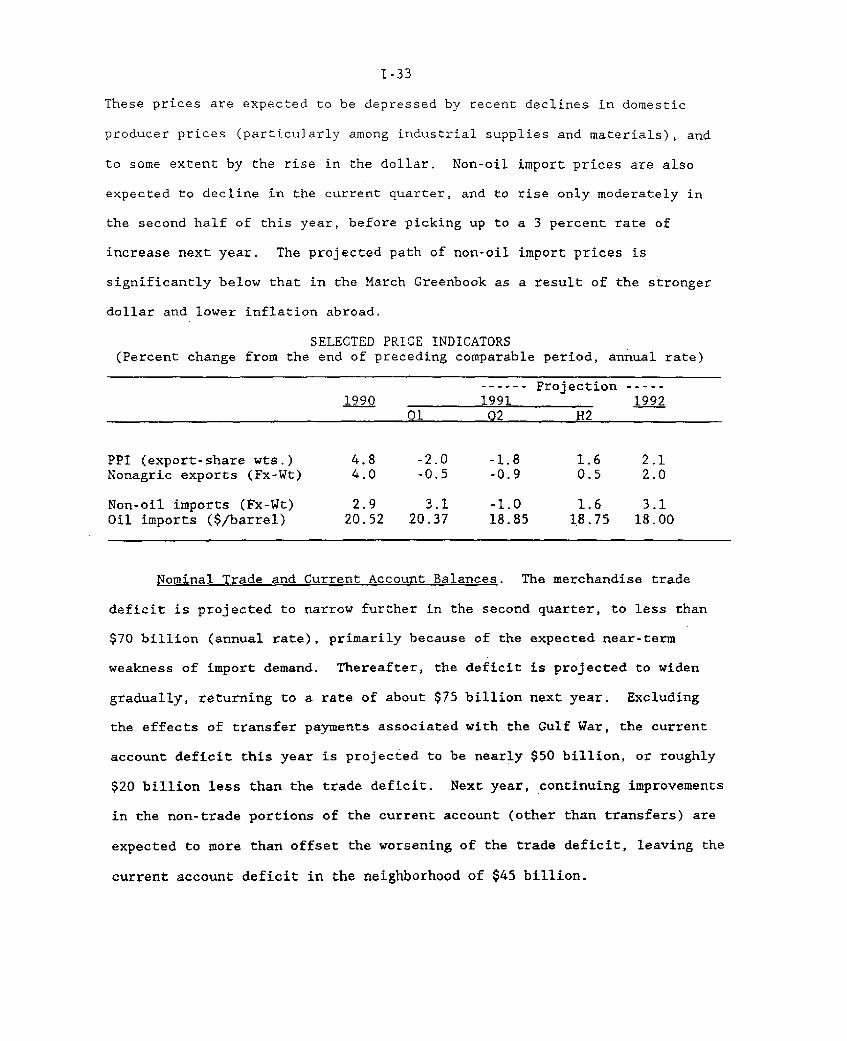
These prices are expected to be depressed by recent declines in domestic
producer prices (particularly among industrial supplies and materials), and
to some extent by the rise in the dollar. Non-oil import prices are also
expected to decline in the current quarter, and to rise only moderately in
the second half of this year, before picking up to a 3 percent rate of
increase next year. The projected path of non-oil import prices is
significantly below that in the March Greenbook as a result of the stronger
dollar and lower inflation abroad.
SELECTED PRICE INDICATORS(Percent change from the end of preceding comparable period, annual rate)
------ Projection -----1990 1991 1992
01 Q2 H2
PPI (export-share wts.) 4.8 -2.0 -1.8 1.6 2.1Nonagric exports (Fx-Wt) 4.0 -0.5 -0.9 0.5 2.0
Non-oil imports (Fx-Wt) 2.9 3.1 -1.0 1.6 3.1Oil imports ($/barrel) 20.52 20.37 18.85 18.75 18.00
Nominal Trade and Current Account Balances. The merchandise trade
deficit is projected to narrow further in the second quarter, to less than
$70 billion (annual rate), primarily because of the expected near-term
weakness of import demand. Thereafter, the deficit is projected to widen
gradually, returning to a rate of about $75 billion next year. Excluding
the effects of transfer payments associated with the Gulf War, the current
account deficit this year is projected to be nearly $50 billion, or roughly
$20 billion less than the trade deficit. Next year, continuing improvements
in the non-trade portions of the current account (other than transfers) are
expected to more than offset the worsening of the trade deficit, leaving the
current account deficit in the neighborhood of $45 billion.
I-34
Within the non-trade portions of the current account, net service
receipts are expected to continue to expand steadily in the near term; this
growth will be depressed somewhat over time by the effects of the recent
appreciation of the dollar as well as slower economic growth abroad. Net
investment income receipts are expected to make a small positive
contribution to the current account, as they did in 1990; that contribution
is expected to increase somewhat over the next few quarters as recent
declines in dollar interest rates show through to lower payments on U.S.
debt to foreigners.
With respect to transfer payments, total cash grants from foreign
governments to support Operation Desert Storm are expected to amount to $43
billion. The expected timing of these payments has been revised since the
last Greenbook. Payments received in the first quarter this year totaled
$23 billion, somewhat more than had been anticipated. An additional $10
billion is expected in the second quarter, and $5 billion more in each of
the third and fourth quarters. As a result, the current account is expected
to show a substantial surplus in the first quarter and deficits on the order
of $10 to 25 billion (annual rate) in each of the remaining quarters of this
year.
I-35
May 8, 1991
STRICTLY CONFIDENTIAL - FRCLASS II FOMC
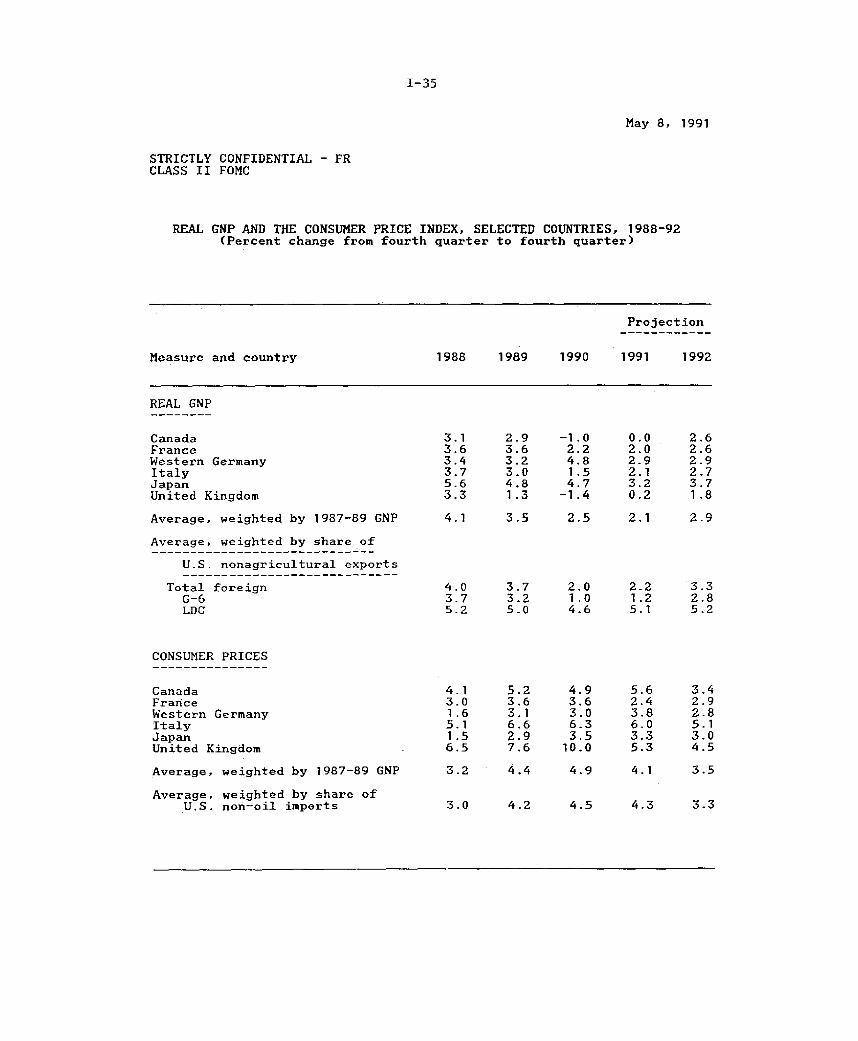
REAL GNP AND THE CONSUMER PRICE INDEX, SELECTED COUNTRIES, 1988-92(Percent change from fourth quarter to fourth quarter)
Projection
Measure and country 1988 1989 1990 1991 1992
REAL GNP
CanadaFranceWestern GermanyItalyJapanUnited Kingdom
Average, weighted by 1987-89 GNP
Average, weighted by share of
U.S. nonagricultural exports
Total foreignG-6LDC
-1.02.24.81.54.7
-1.4
2.2 3.31.2 2.85.1 5-2
CONSUMER PRICES
CanadaFranceWestern GermanyItalyJapanUnited Kingdom
Average, weighted by 1987-89 GNP
Average, weighted by share ofU.S. non-oil imports
4.13.01.65.11.56.5
3.2
4.93.63.06.33.5
10.0
4.9
4.5 4.3 3.33.0 4.2
Strictly Confidential (FR) Class II-FOMC
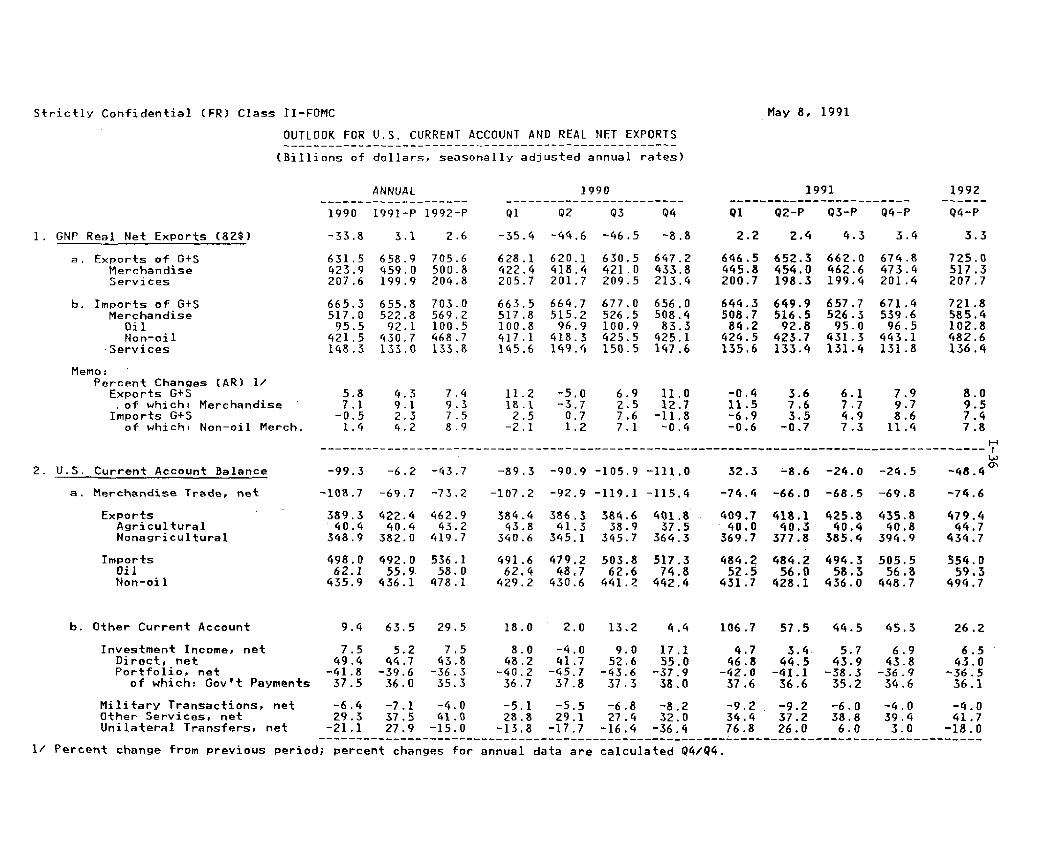
OUTLOOK FOR U.S. CURRENT ACCOUNT AND REAL NET EXPORTS
(Billions of dollars, seasonally adjusted annual rates)(Billions of dollars, seasonally adjusted annual rates)
May 8, 1991
1. GNP Real Net Exports (825)
a. Exports of G+SMerchandiseServices
b. Imports of G+SMerchandise
OilNon-oil
Services
Memo:Percent Changes (AR) 1/
Exports G+S,of whichi MerchandiseImports G+S
of whichi Non-oil Merch,
2. U.S. Current Account Balance
a. Merchandise Trade, net
ExportsAgriculturalNonagricultural
ImportsOilNon-oil
ANNUAL
1990 1991-P 1992-P
-33.8 3.1 2.6
631.5 658.9 705.6423.9 459.0 500.8207.6 199.9 204.8
665.3 655.8 703.0517.0 522.8 569.295.5 92.1 100.5
421.5 430.7 468.7148.3 133.0 133.8
1990
Ql 02 Q3 94
-35.4 -44.6 -46.5 -8.8
628.1 620.1 630.5 647.2422.4 418.4 421.0 433.8205.7 201.7 209.5 213.4
663.5 664.7 677.0 656.0517.8 515.2 526.5 508.4100.8 96.9 100.9 83.3417.1 418.3 425.5 425.1145.6 149.4 150.5 147.6
1991
Ql 02-P Q3-P Q4-P
2.2 2.4 4.3 3.4
646.5 652.3 662.0 674.8445.8 454.0 462.6 473.4200.7 198.3 199.4 201.4
644.3 649.9 657.7 671.4508.7 516.5 526.3 539.684.2 92.8 95.0 96.5424.5 423.7 431.3 443.1135,6 133.4 131.4 131.8
5.8 4.3 7.4 11.2 -5.0 6.9 11.0 -0.4 3.6 6.1 7.9 8.07.1 9.1 9.3 18.1 -3.7 2.5 12.7 11.5 7.6 7.7 9.7 9.5
-0.5 2.3 7.5 2.5 0.7 7.6 -11.8 -6.9 3.5 4.9 8.6 7.41.4 4.2 8.9 -2.1 1.2 7.1 -0.4 -0.6 -0.7 7.3 11.4 7.8
------------------------------------------------------- i-
-99.3 -6.2 -43.7 -89.3 -90.9 -105.9 -111.0 32.3 -8.6 -24.0 -24.5 -48.4
-108.7 -69.7 -73.2 -107.2 -92.9 -119.1 -115.4 -74.4 -66.0 -68.5 -69.8 -74.6
389.3 422.4 462.9 384.4 386.3 384.6 401.8 409.7 418.1 425.8 435.8 479.440.4 40.4 43.2 43.8 41.3 38.9 37.5 40.0 40.3 40.4 40.8 44.7
348.9 382.0 419.7 340.6 345.1 345.7 364.3 369.7 377.8 385.4 394.9 434.7
498.0 492.0 536.1 491.6 479.2 503.8 517.3 484.2 484.2 494.3 505.5 554.062.1 55.9 58,0 62.4 48.7 62.6 74.8 52.5 56.0 58.3 56.8 59.3435.9 436.1 478.1 429.2 430.6 441.2 442.4 431.7 428.1 436.0 448.7 494.7
b. Other Current Account 9.4 63.5 29.5 18.0 2.0 13.2 4.4 106.7 57.5 44.5 45.3 26.2
Investment Income, net 7.5 5.2 7.5 8.0 -4.0 9.0 17.1 4.7 3.4 5.7 6.9 6.5Direct, net 49.4 44.7 43.8 48.2 41.7 52.6 55.0 46.8 44.5 43.9 43.8 43.0Portfolio, net -41.8 -39.6 -36.3 -40.2 -45.7 -43.6 -37.9 -42.0 -41.1 -38.3 -36.9 -36.5
of which: Gov't Payments 37.5 36.0 35.3 36.7 37.8 37.3 38.0 37.6 36.6 35.2 34.6 36.1
Military Transactions, net -6.4 -7.1 -4.0 -5.1 -5.5 -6.8 -8.2 -9.2 -9.2 -6.0 -4.0 -4.0Other Services, net 29.3 37,5 41.0 28.8 29.1 27.4 32.0 34.4 37.2 38.8 39.4 41.7Unilateral Transfers, net -21.1 27.9 -15.0 -13.8 -17.7 -16.4 -36.4 76.8 26.0 6.0 3.0 -18.0
1/ Percent change from previous period; percent changes for annual data are calculated Q4/Q4.
1992
Q4-P
3.3
725.0517.3207.7
721.8585.4102.8482.6136.4