Embed Size (px)
Citation preview
Prefatory Note
The attached document represents the most complete and accurate version available based on original copies culled from the files of the FOMC Secretariat at the Board of Governors of the Federal Reserve System. This electronic document was created through a comprehensive digitization process which included identifying the best-preserved paper copies, scanning those copies,1 and then making the scanned versions text-searchable.2 Though a stringent quality assurance process was employed, some imperfections may remain.
Please note that this document may contain occasional gaps in the text. These gaps are the result of a redaction process that removed information obtained on a confidential basis. All redacted passages are exempt from disclosure under applicable provisions of the Freedom of Information Act.
1 In some cases, original copies needed to be photocopied before being scanned into electronic format. All scanned images were deskewed (to remove the effects of printer- and scanner-introduced tilting) and lightly cleaned (to remove dark spots caused by staple holes, hole punches, and other blemishes caused after initial printing). 2 A two-step process was used. An advanced optimal character recognition computer program (OCR) first created electronic text from the document image. Where the OCR results were inconclusive, staff checked and corrected the text as necessary. Please note that the numbers and text in charts and tables were not reliably recognized by the OCR process and were not checked or corrected by staff.
January 13, 1978Strictly Confidential (FR) Class I FOMC
MONETARY AGGREGATES ANDMONEY MARKET CONDITIONS
Prepared for the Federal Open Market Committee
By the staff Board of Governors of the Federal Reserve System
STRICTLY CONFIDENTIAL (FR) January 13, 1978CLASS I - FOMC
MONETARY AGGREGATES ANDMONEY MARKET CONDITIONS
Recent developments
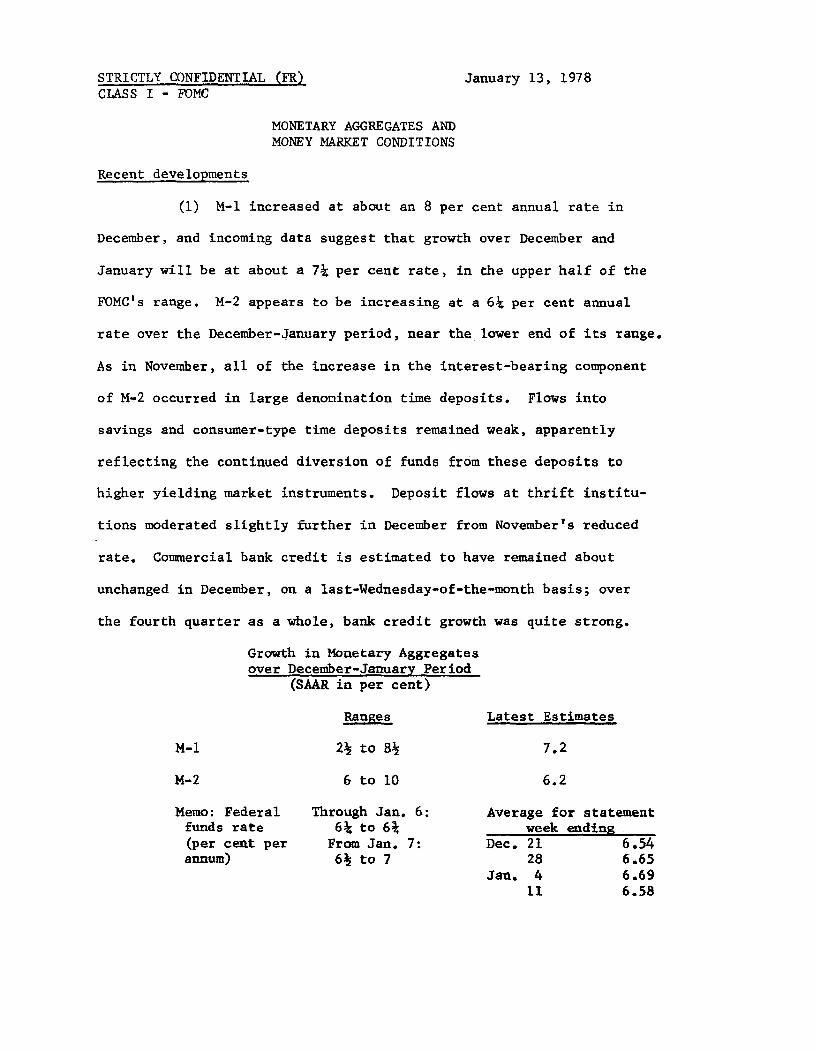
(1) M-1 increased at about an 8 per cent annual rate in
December, and incoming data suggest that growth over December and
January will be at about a 7¼ per cent rate, in the upper half of the
FOMC's range. M-2 appears to be increasing at a 6¼ per cent annual
rate over the December-January period, near the lower end of its range.
As in November, all of the increase in the interest-bearing component
of M-2 occurred in large denomination time deposits. Flows into
savings and consumer-type time deposits remained weak, apparently
reflecting the continued diversion of funds from these deposits to
higher yielding market instruments. Deposit flows at thrift institu-
tions moderated slightly further in December from November's reduced
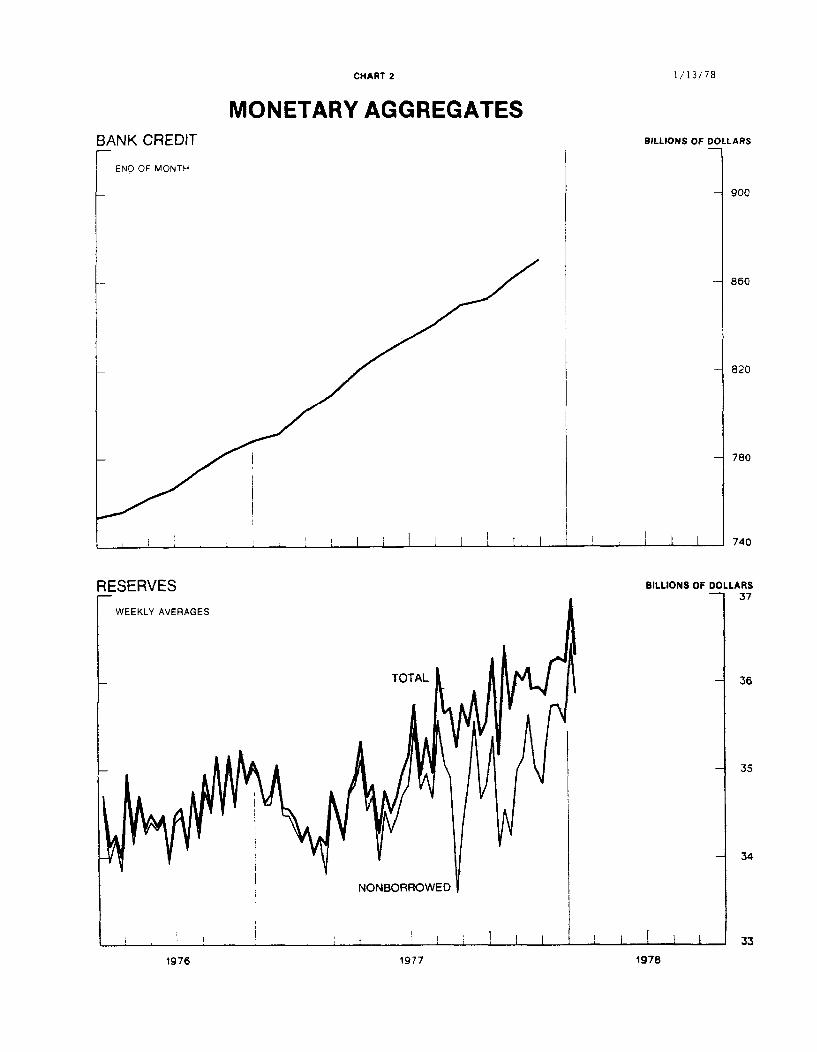
rate. Commercial bank credit is estimated to have remained about
unchanged in December, on a last-Wednesday-of-the-month basis; over
the fourth quarter as a whole, bank credit growth was quite strong.
Growth in Monetary Aggregatesover December-January Period
(SAAR in per cent)
Ranges Latest Estimates
M-1 2½ to 8½ 7.2
M-2 6 to 10 6.2
Memo: Federal Through Jan. 6: Average for statementfunds rate 6¼ to 6¾ week ending(per cent per From Jan. 7: Dec. 21 6.54annum) 6½ to 7 28 6.65
Jan. 4 6.6911 6.58
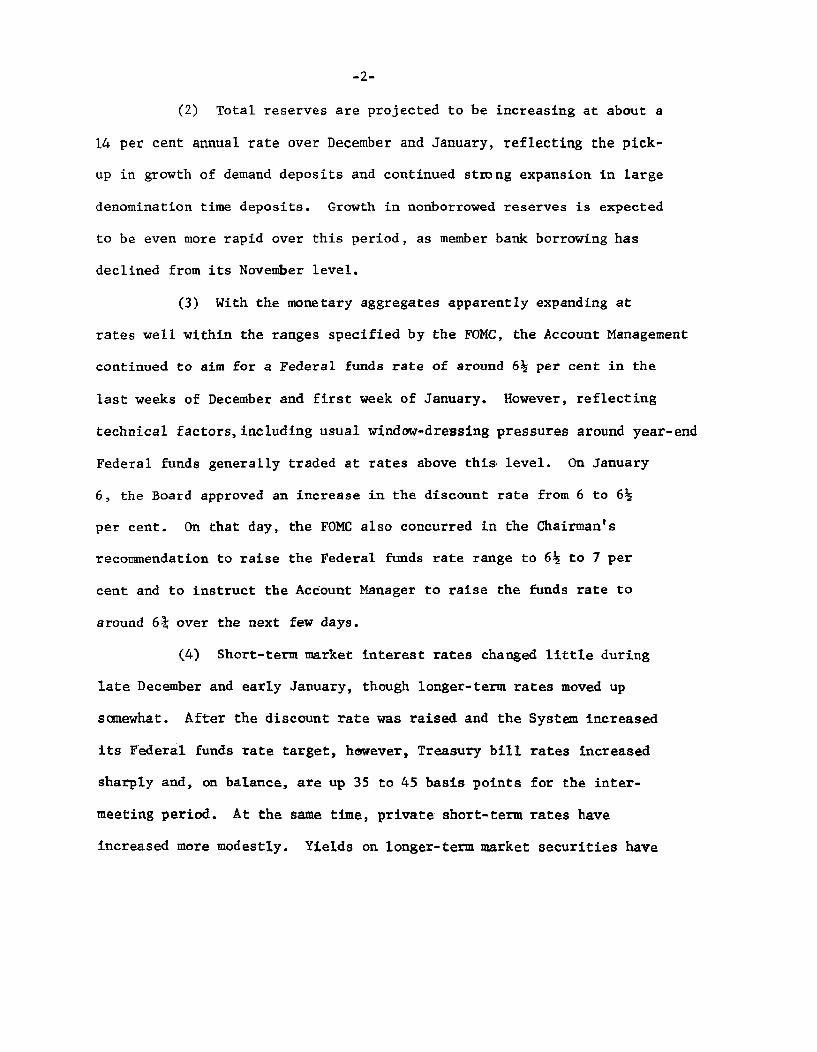
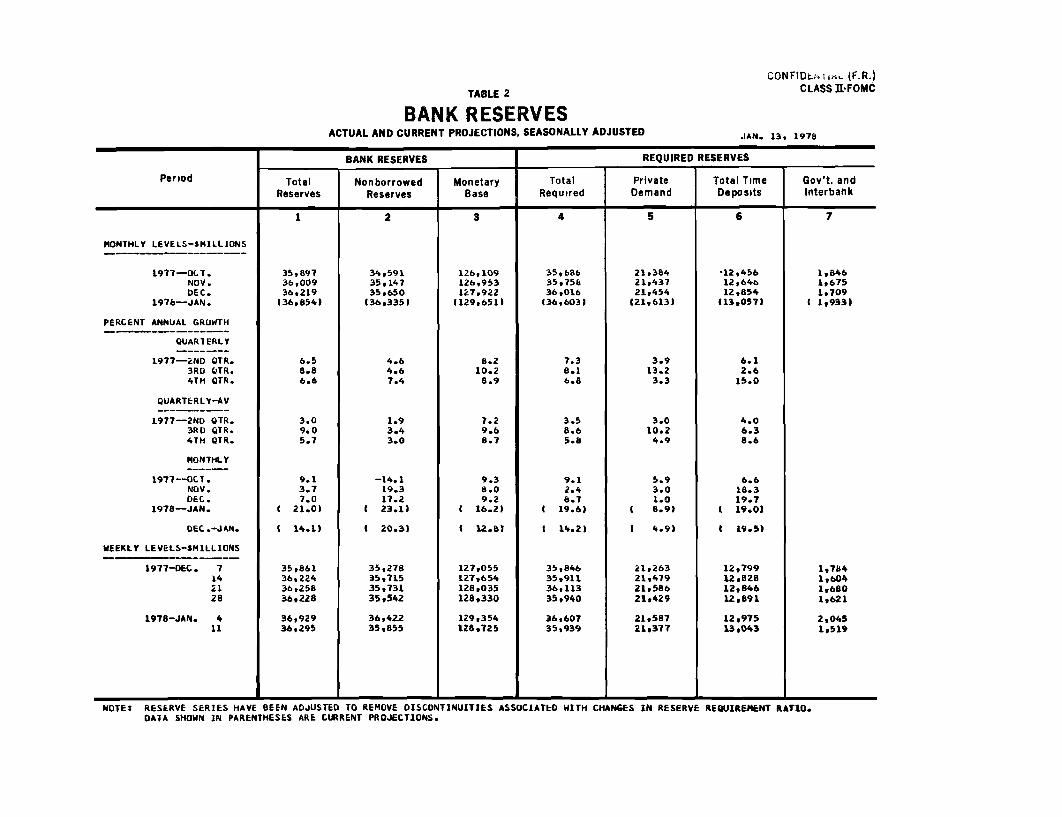
(2) Total reserves are projected to be increasing at about a
14 per cent annual rate over December and January, reflecting the pick-
up in growth of demand deposits and continued strong expansion in large
denomination time deposits. Growth in nonborrowed reserves is expected
to be even more rapid over this period, as member bank borrowing has
declined from its November level.
(3) With the monetary aggregates apparently expanding at
rates well within the ranges specified by the FOMC, the Account Management
continued to aim for a Federal funds rate of around 6½ per cent in the
last weeks of December and first week of January. However, reflecting
technical factors,including usual window-dressing pressures around year-end
Federal funds generally traded at rates above this level. On January
6, the Board approved an increase in the discount rate from 6 to 6½
per cent. On that day, the FOMC also concurred in the Chairman's
recommendation to raise the Federal funds rate range to 6½ to 7 per
cent and to instruct the Account Manager to raise the funds rate to
around 6¾ over the next few days.
(4) Short-term market interest rates changed little during
late December and early January, though longer-term rates moved up
somewhat. After the discount rate was raised and the System increased
its Federal funds rate target, however, Treasury bill rates increased
sharply and, on balance, are up 35 to 45 basis points for the inter-
meeting period. At the same time, private short-term rates have
increased more modestly. Yields on longer-term market securities have
-3-
risen to 10 to 35 basis points since the last Committee meeting, while
rates in the primary mortgage market edged higher.
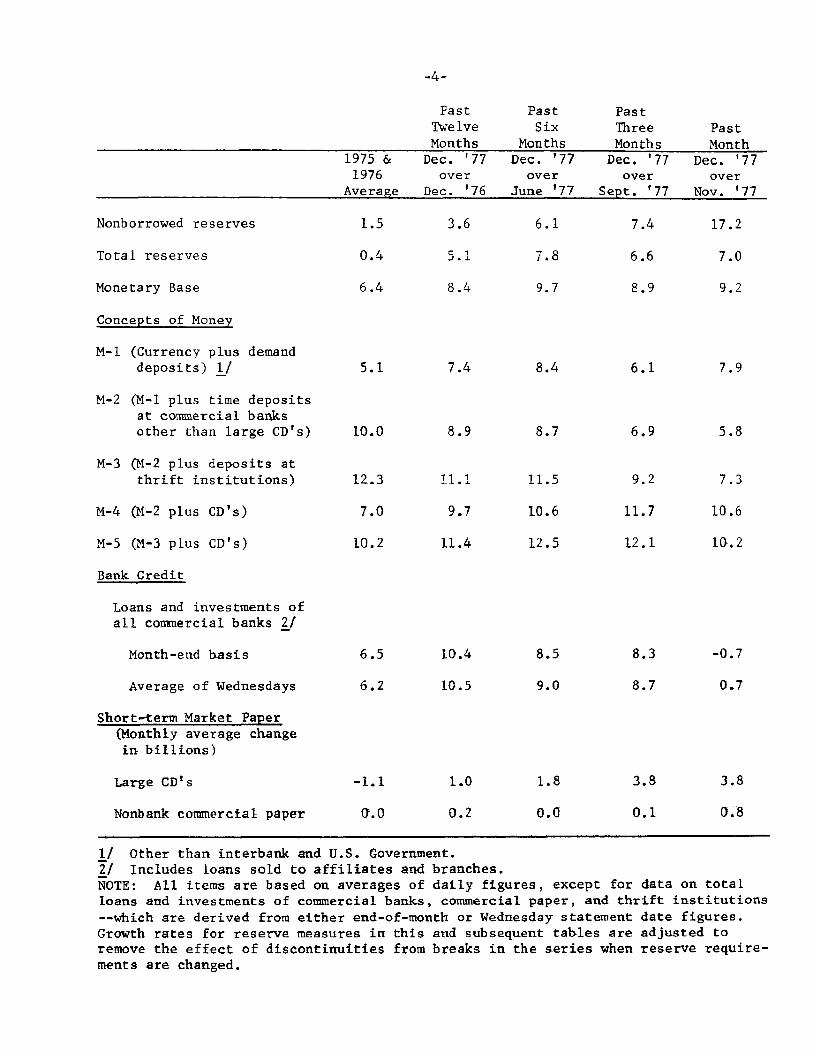
(5) The table on the following page shows (in terms of
percentage annual rates of change) related monetary and financial
flows over various time periods.
Past Past PastTwelve Six Three PastMonths Months Months Month
1975 & Dec. '77 Dec. '77 Dec. '77 Dec. '771976 over over over over
Average Dec. '76 June '77 Sept. '77 Nov. '77
Nonborrowed reserves 1.5 3.6 6.1 7.4 17.2
Total reserves 0.4 5.1 7.8 6.6 7.0
Monetary Base 6.4 8.4 9.7 8.9 9.2
Concepts of Money
M-1 (Currency plus demanddeposits) 1/ 5.1 7.4 8.4 6.1 7.9
M-2 (M-1 plus time depositsat commercial banksother than large CD's) 10.0 8.9 8.7 6.9 5.8
M-3 (M-2 plus deposits atthrift institutions) 12.3 11.1 11.5 9.2 7.3
M-4 (M-2 plus CD's) 7.0 9.7 10.6 11.7 10.6
M-5 (M-3 plus CD's) 10.2 11.4 12.5 12.1 10.2
Bank Credit
Loans and investments ofall commercial banks 2/
Month-end basis 6.5 10.4 8.5 8.3 -0.7
Average of Wednesdays 6.2 10.5 9.0 8.7 0.7
Short-term Market Paper(Monthly average changein billions)
Large CD's -1.1 1.0 1.8 3.8 3.8
Nonbank commercial paper 0.0 0.2 0.0 0.1 0.8
1/ Other than interbank and U.S. Government.2/ Includes loans sold to affiliates and branches.NOTE: All items are based on averages of daily figures, except for data on totalloans and investments of commercial banks, commercial paper, and thrift institutions
--which are derived from either end-of-month or Wednesday statement date figures.Growth rates for reserve measures in this and subsequent tables are adjusted toremove the effect of discontinuities from breaks in the series when reserve require-ments are changed.
Prospective developments
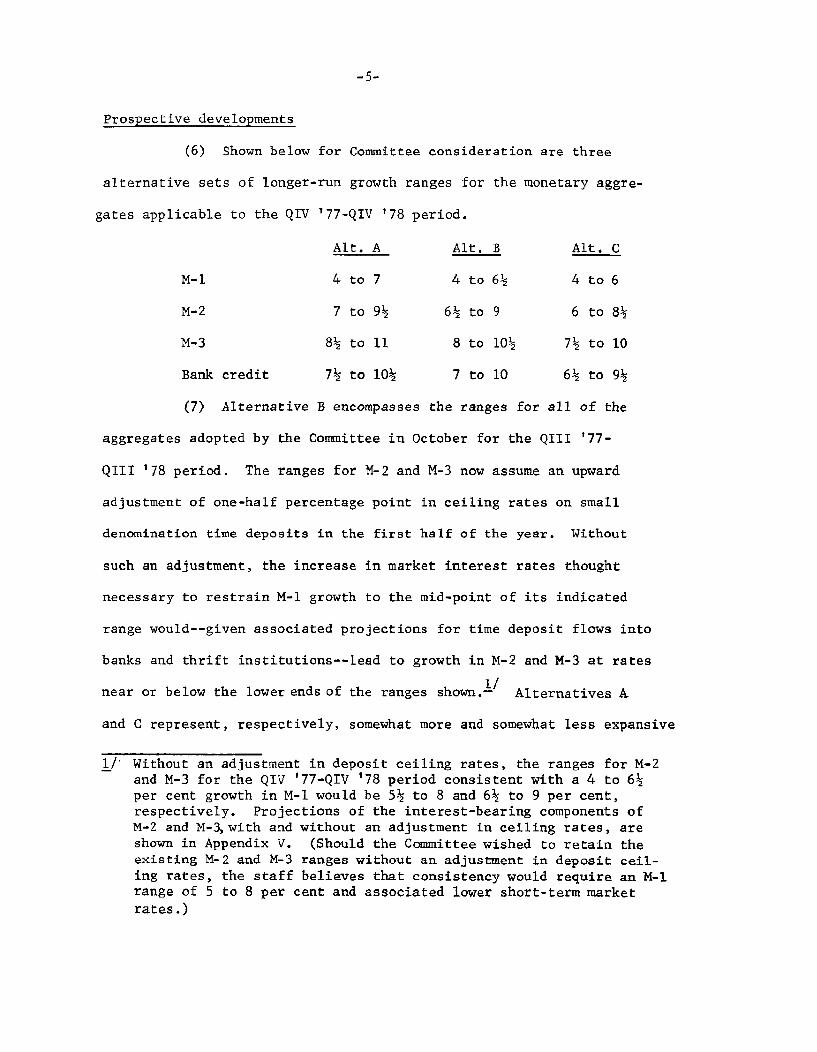
(6) Shown below for Committee consideration are three
alternative sets of longer-run growth ranges for the monetary aggre-
gates applicable to the QIV '77-QIV '78 period.
Alt. A Alt. B Alt. C
M-1 4 to 7 4 to 6 4 to 6
M-2 7 to 9 6 to 9 6 to 8
M-3 8 to 11 8 to 10 7 to 10
Bank credit 7 to 10 7 to 10 6 to 9
(7) Alternative B encompasses the ranges for all of the
aggregates adopted by the Committee in October for the QIII '77-
QIII '78 period. The ranges for M-2 and M-3 now assume an upward
adjustment of one-half percentage point in ceiling rates on small
denomination time deposits in the first half of the year. Without
such an adjustment, the increase in market interest rates thought
necessary to restrain M-1 growth to the mid-point of its indicated
range would--given associated projections for time deposit flows into
banks and thrift institutions--lead to growth in M-2 and M-3 at rates
near or below the lower ends of the ranges shown.1 / Alternatives A
and C represent, respectively, somewhat more and somewhat less expansive
1/ Without an adjustment in deposit ceiling rates, the ranges for M-2and M-3 for the QIV '77-QIV '78 period consistent with a 4 to 6per cent growth in M-1 would be 5 to 8 and 6 to 9 per cent,respectively. Projections of the interest-bearing components ofM-2 and M-3, with and without an adjustment in ceiling rates, areshown in Appendix V. (Should the Committee wished to retain theexisting M-2 and M-3 ranges without an adjustment in deposit ceil-ing rates, the staff believes that consistency would require an M-1range of 5 to 8 per cent and associated lower short-term market
rates.)
policy alternatives; both also assume the upward adjustment in ceiling
rates.
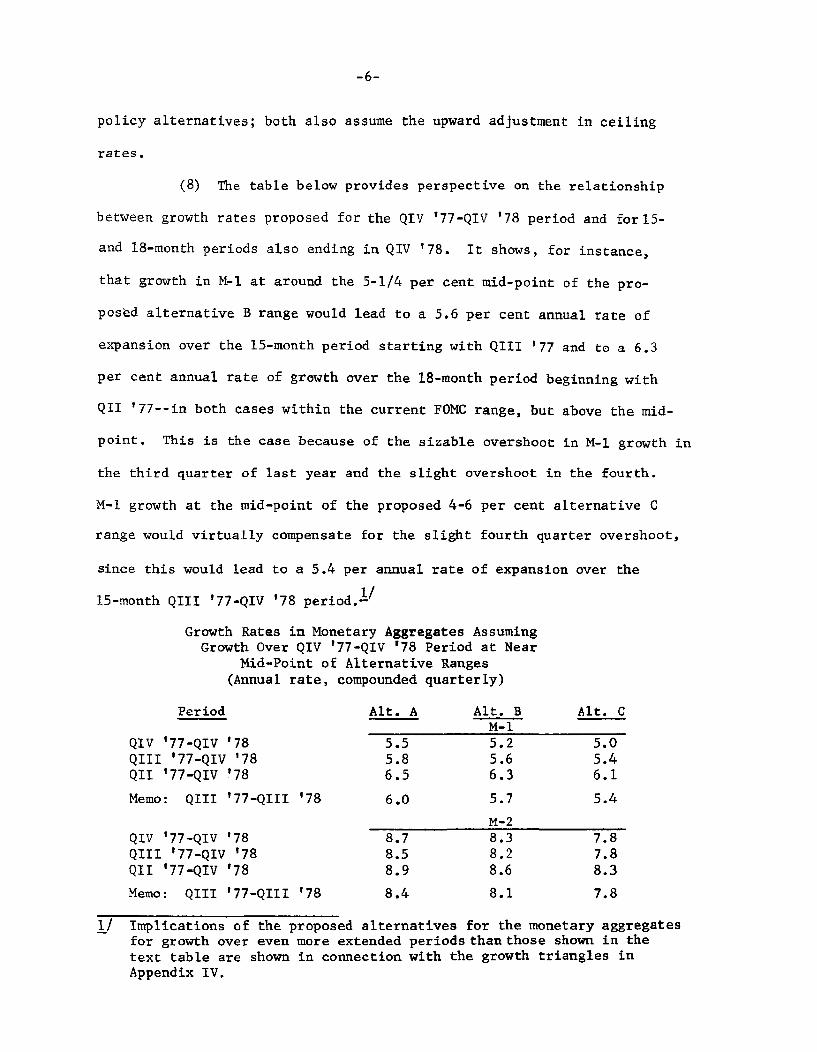
(8) The table below provides perspective on the relationship
between growth rates proposed for the QIV '77-QIV '78 period and for 5-
and 18-month periods also ending in QIV '78. It shows, for instance,
that growth in M-1 at around the 5-1/4 per cent mid-point of the pro-
posed alternative B range would lead to a 5.6 per cent annual rate of
expansion over the 15-month period starting with QIII '77 and to a 6.3
per cent annual rate of growth over the 18-month period beginning with
QII '77--in both cases within the current FOMC range, but above the mid-
point. This is the case because of the sizable overshoot in M-1 growth in
the third quarter of last year and the slight overshoot in the fourth.
M-1 growth at the mid-point of the proposed 4-6 per cent alternative C
range would virtually compensate for the slight fourth quarter overshoot,
since this would lead to a 5.4 per annual rate of expansion over the
15-month QIII '77-QIV '78 period.1/
Growth Rates in Monetary Aggregates AssumingGrowth Over QIV '77-QIV '78 Period at Near
Mid-Point of Alternative Ranges(Annual rate, compounded quarterly)
Period Alt. A Alt. B Alt. CM-1
QIV '77-QIV '78 5.5 5.2 5.0QIII '77-QIV '78 5.8 5.6 5.4QII '77-QIV '78 6.5 6.3 6.1
Memo: QIII '77-QIII '78 6.0 5.7 5.4
M-2QIV '77-QIV '78 8.7 8.3 7.8QIII '77-QIV '78 8.5 8.2 7.8QII '77-QIV '78 8.9 8.6 8.3
Memo: QIII '77-QIII '78 8.4 8.1 7.8
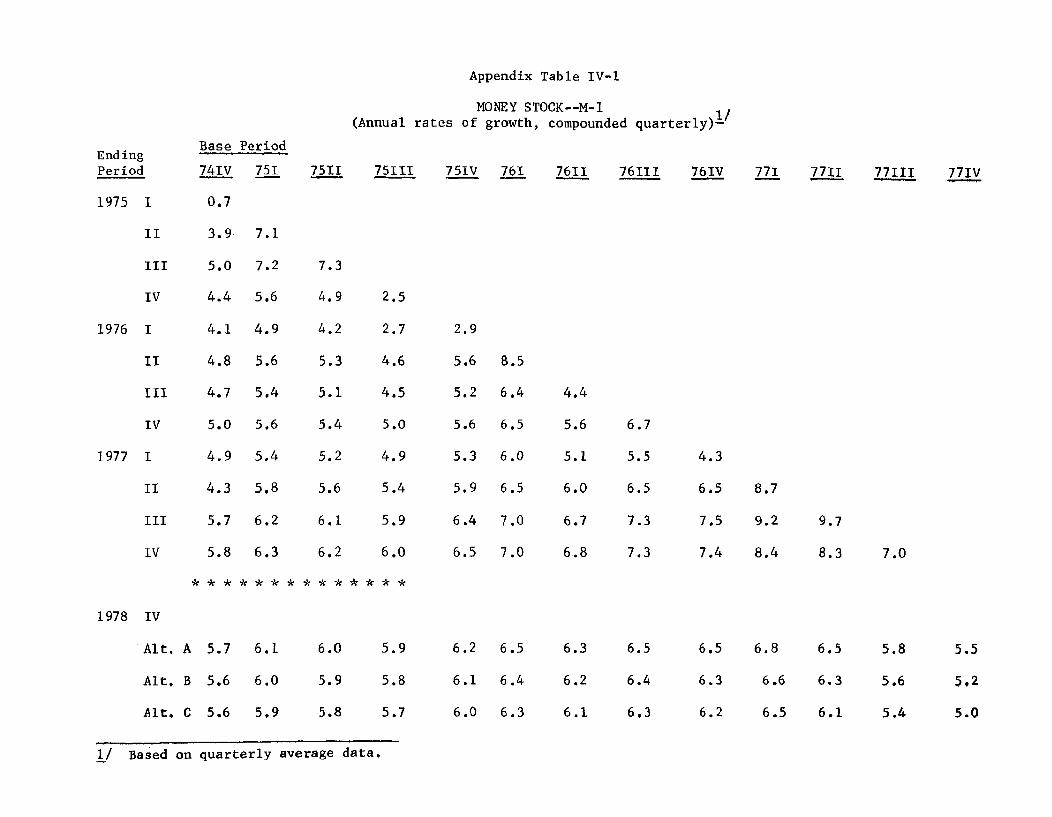
1/ Implications of the proposed alternatives for the monetary aggregatesfor growth over even more extended periods than those shown in the
text table are shown in connection with the growth triangles inAppendix IV.
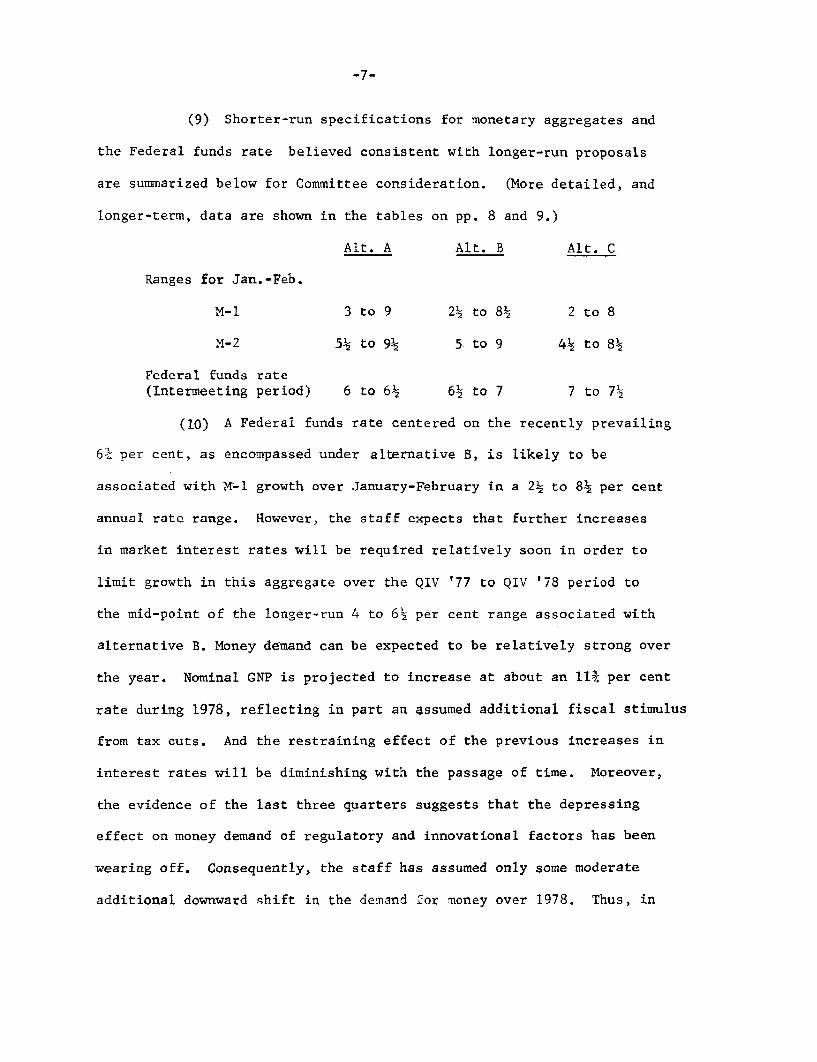
(9) Shorter-run specifications for monetary aggregates and
the Federal funds rate believed consistent with longer-run proposals
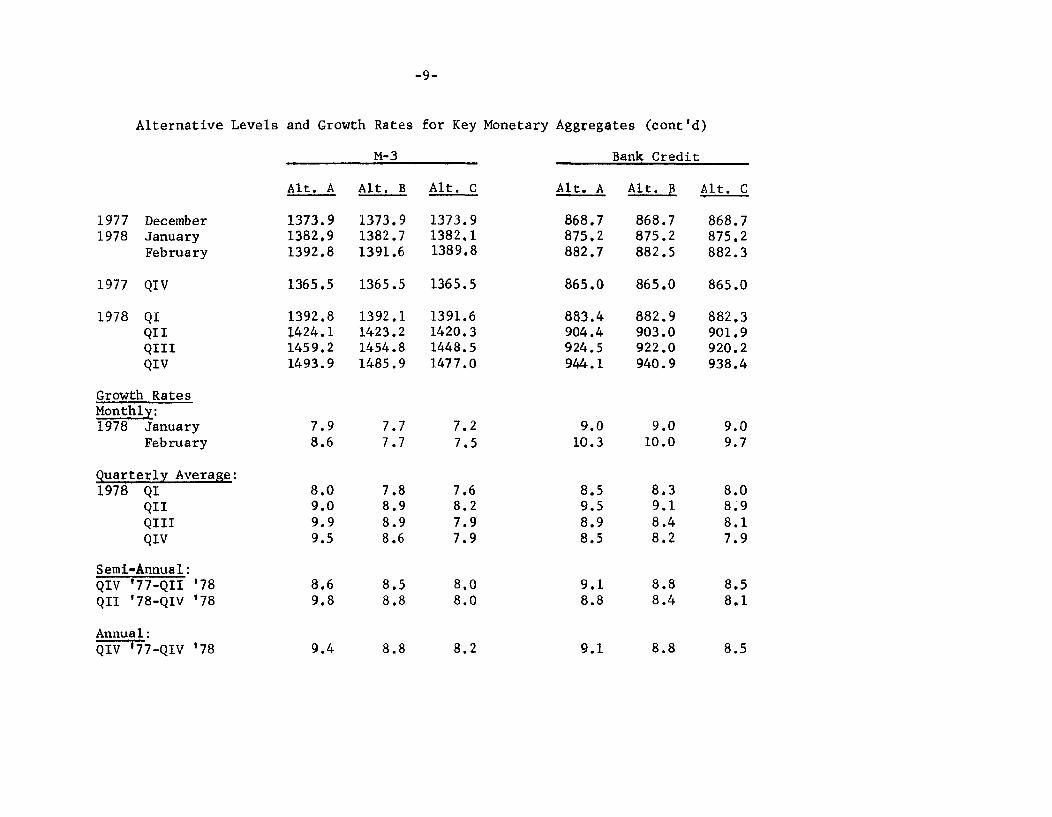
are summarized below for Committee consideration. (More detailed, and
longer-term, data are shown in the tables on pp. 8 and 9.)
Alt. A Alt. B Alt. C
Ranges for Jan.-Feb.
M-1 3 to 9 2½ to 8½ 2 to 8
M-2 5½ to 9 5 to 9 4½ to 8½
Federal funds rate(Intermeeting period) 6 to 6½ 6½ to 7 7 to 7½
(10) A Federal funds rate centered on the recently prevailing
6¾ per cent, as encompassed under alternative B, is likely to be
associated with M-1 growth over January-February in a 2½ to 8½ per cent
annual rate range. However, the staff expects that further increases
in market interest rates will be required relatively soon in order to
limit growth in this aggregate over the QIV '77 to QIV '78 period to
the mid-point of the longer-run 4 to 6½ per cent range associated with
alternative B. Money demand can be expected to be relatively strong over
the year. Nominal GNP is projected to increase at about an 11¾ per cent
rate during 1978, reflecting in part an assumed additional fiscal stimulus
from tax cuts. And the restraining effect of the previous increases in
interest rates will be diminishing with the passage of time. Moreover,
the evidence of the last three quarters suggests that the depressing
effect on money demand of regulatory and innovational factors has been
wearing off. Consequently, the staff has assumed only some moderate
additional downward shift in the demand for money over 1978. Thus, in
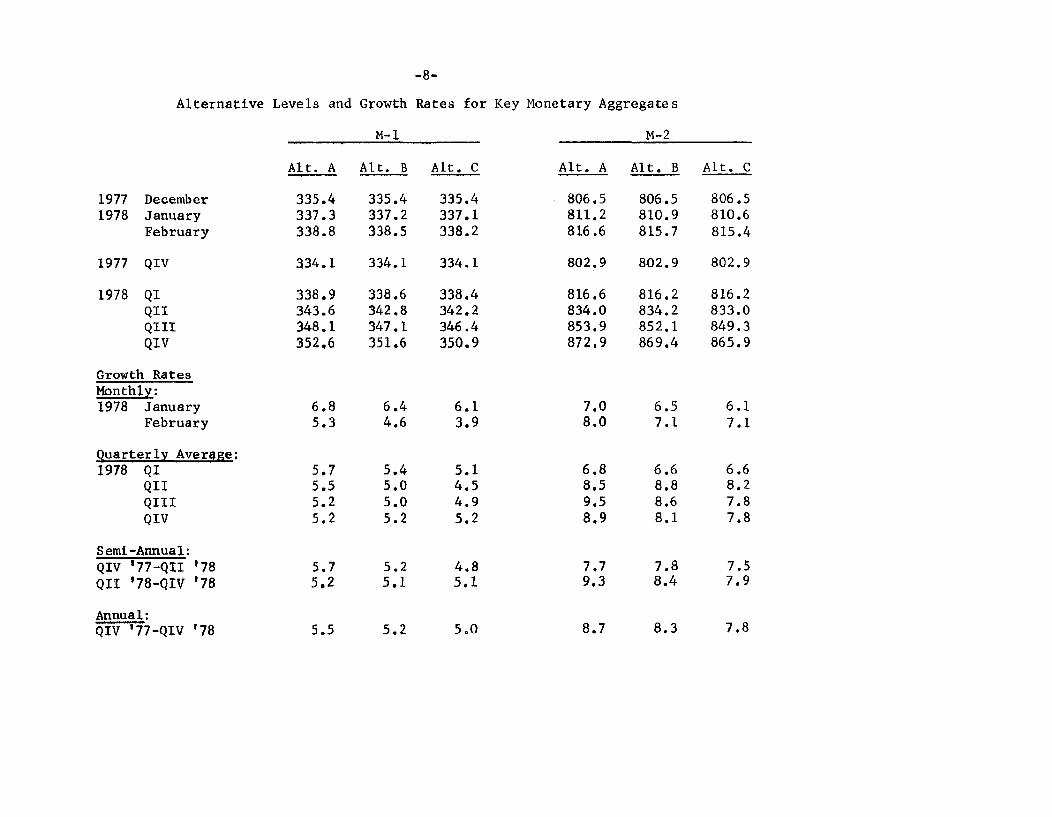
Alternative Levels and Growth Rates for Key Monetary Aggregates
M-1 M-2
Alt. A Alt. B Alt. C Alt. A Alt. B Alt. C
1977 December 335.4 335.4 335.4 806.5 806.5 806.51978 January 337.3 337.2 337.1 811.2 810.9 810.6
February 338.8 338.5 338.2 816.6 815.7 815.4
1977 QIV 334.1 334.1 334.1 802.9 802.9 802.9
1978 QI 338.9 338.6 338.4 816.6 816.2 816.2QII 343.6 342.8 342.2 834.0 834.2 833.0QIII 348,1 347.1 346.4 853.9 852.1 849.3QIV 352.6 351.6 350.9 872.9 869.4 865.9
Growth RatesMonthly:1978 January 6.8 6.4 6.1 7.0 6.5 6.1
February 5.3 4.6 3.9 8.0 7.1 7.1
Quarterly Average;1978 QI 5.7 5.4 5.1 6.8 6.6 6.6
QII 5.5 5.0 4.5 8.5 8.8 8.2QIII 5.2 5.0 4.9 9.5 8.6 7.8QIV 5.2 5.2 5.2 8.9 8.1 7.8
Semi-Annual:QIV '77-QII '78 5.7 5.2 4.8 7.7 7.8 7.5
QII '78-QIV '78 5.2 5.1 5.1 9.3 8.4 7.9
Annual:QIV '77-QIV '78 5.5 5.2 5.0 8.7 8.3 7.8
-9-
Alternative Levels and Growth Rates for Key Monetary Aggregates (cont'd)
M-3 Bank Credit
Alt. A Alt. B Alt. C Alt. A Alt. B Alt. C
1977 December 1373.9 1373.9 1373.9 868.7 868.7 868.71978 January 1382.9 1382.7 1382.1 875.2 875.2 875.2
February 1392.8 1391.6 1389.8 882.7 882.5 882.3
1977 QIV 1365.5 1365.5 1365.5 865.0 865.0 865.0
1978 QI 1392.8 1392.1 1391.6 883.4 882.9 882.3QII 1424.1 1423.2 1420.3 904.4 903.0 901.9QIII 1459.2 1454.8 1448.5 924.5 922.0 920.2QIV 1493.9 1485.9 1477.0 944.1 940.9 938.4
Growth RatesMonthly:1978 January 7.9 7.7 7.2 9.0 9.0 9.0
February 8.6 7.7 7.5 10.3 10.0 9.7
Quarterly Average:1978 QI 8.0 7.8 7.6 8.5 8.3 8.0
QII 9.0 8.9 8.2 9.5 9.1 8.9QIII 9.9 8.9 7.9 8.9 8.4 8.1QIV 9.5 8.6 7.9 8.5 8.2 7.9
Semi-Annual:QIV '77-QII '78 8.6 8.5 8.0 9.1 8.8 8.5QII '78-QIV '78 9.8 8.8 8.0 8.8 8.4 8.1
Annual:QIV '77-QIV '78 9.4 8.8 8.2 9.1 8.8 8.5
-10-
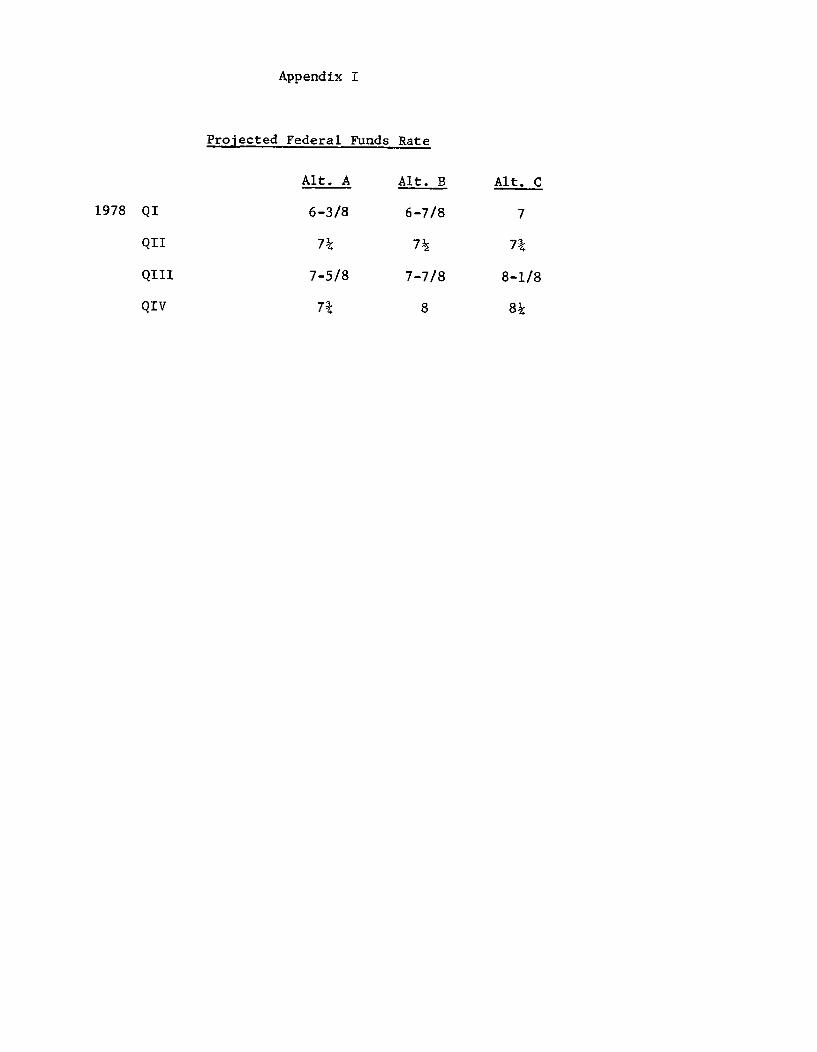
order to constrain M-1 growth, the Federal funds rate under alternative
B begins to rise next month and reaches an average of 8 per cent in the
fourth quarter, as shown in Appendix I.1/
(11) Under alternative B, growth in M-2 over the January-
February period is likely to be in a 5 to 9 per cent annual rate
range. With the recent increase in market yields, it appears likely
that savings deposits at banks, which were essentially unchanged in the
last two months of 1977, will remain weak in the early months of 1978.
Moreover, now that yields onmarket instruments are at or above effective
ceiling rates on all maturities of small denomination time deposits at
banks, growth in such deposits is likely to remain modest at best. But
relatively strong growth in large denomination time deposits included
in M-2 can be expected as banks offer these instruments aggressively
to offset slow growth of deposits subject to Regulation Q
ceilings.
(12) Thrift institutions too are faced with unfavorable
market rate comparisons, except on their 4 and 6 year maturities where
the favorable spread has narrowed to only about 5 and 25 basis points
respectively, since the last meeting. Consequently, growth in deposits
at these institutions can be expected to slow further in January-February.
With outstanding commitments at record levels, it seems likely that S&L's
will not only be forced to reduce their liquidity and to maintain a high
rate of borrowing from the FHLBanks, but also to slow their new commit-
ment activity in early 1978.
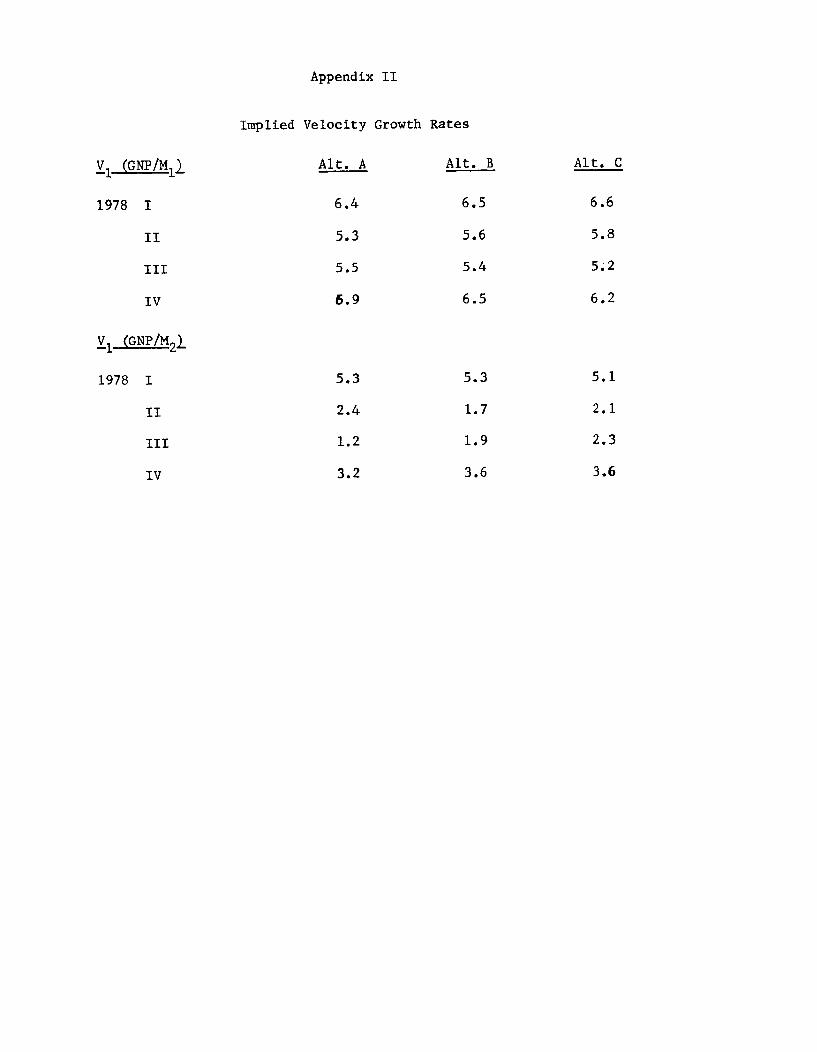
1/ The implied increases in the velocity of M-1 and M-2 over 1978 aredisplayed in Appendix II.
-11-
(13) If the Federal Funds rate remains near its present
6¾ per cent level over the intermeeting period, as envisioned under
alternative B, short-term market interest rates will probably remain
near current higher levels. And given their increases since November,
bond yields may be fully adjusted to the current level of short-term
rates. Thus, yields in the corporate and tax-exempt bond markets may
remain essentially unchanged, and could even decline somewhat in response
to continuing strong institutional investment demands and a recent
reduction in new offerings of corporate bonds. However, on January 25,
the Treasury will announce terms for refunding more than $5 billion of
publicly-held issues maturing in mid-February; the Treasury may also
take the occasion to raise $1 to $2½ billion of new money.
(14) Beyond the intermeeting period, short-term interest
rates are expected to be under renewed upward pressure as efforts are
made to limit M-1 expansion to the 5¼ per cent mid-point of the
alternative B longer-run range. As short-term rates rise, some further
induced increase in intermediate-term rates can be expected. Thus,
even with the assumed increase in deposit rate ceilings, inflows to
thrifts will probably not be sufficient to enable them to meet their
mortgage commitments without further increases in borrowings from
the FHLBanks. Under the circumstances, mortgage rates are
likely to come under upward pressure. Banks would find it necessary
to continue to offer large denomination time deposits in volume to
supplement their deposit sources, and to reduce further their port-
folio liquidity in order to meet loan demands. Moreover, with
-12-
Treasury, corporate, and municipal bond offerings remaining sizable,
long-term yields can also be expected to be under renewed upward pres-
sure. Such increases, however, will be limited by the continued high
cash flows of insurance companies and pension funds.
(15) Alternative C contemplates an increase in the Federal
funds rate over the next few weeks to the mid-point of a 7 to 7-1/2
per cent range. Under this alternative M-1 and M-2 growth over the
January-February period may be in 2 to 8 and 4½ to 8½ per cent ranges,
respectively. If the Committee followed this course, the 3-month bill
rate would likely increase to about 7 per cent between now and the next
meeting, with commensurate adjustments in other short rates. Member
bank borrowing would begin to rise, and pressures for a discount rate
increase would develop. The increase in short-term interest rates under
the alternative would tend to strengthen the dollar on international
exchange markets.
(16) Such adjustments in short-term market conditions,
following so closely on recent discount rate and open market actions,
would probably be accompanied by a reappraisal of the basic financial
outlook by market participants. It is likely that banks and thrift
institutions would adopt more restrictive lending policies, while
mortgage bankers would take down existing FNMA commitments and aggres-
sively seek new commitments. Pressures for an upward adjustment in
ceiling rates on time deposits would be likely to emerge. Long-term
interest rates would probably rise further. At the higher level of
-13-
rates, corporate and municipal bond offerings would likely be postponed
or possibly cancelled, with borrowers turning more toward banks and the
short-term sector of the open market.
(17) The tightening of the money market over the next few
weeks would be a step toward reducing longer-run growth in the aggre-
gates to rates within the somewhat lower ranges proposed for alterna-
tive C. However, further interest rate increases appear necessary as
the year progresses, given the underlying strength of money demand.
The staff would expect the funds rate under this alternative to average
7-3/4 per cent by the second quarter of 1978 and 8-1/4 per cent in the
fourth.
(18) An easing in money market conditions over the next few
weeks under alternative A, which calls for a Federal funds rate of
about 6-1/4 per cent, would come as a considerable surprise so soon
after the Board's recent discount rate action. Recent interest rate
increases would be reversed, although perhaps not entirely in long-term
markets if the rate decline was considered to be temporary. The decline
in short-term rates, however, would tend to soften the dollar in inter-
national exchange markets.
(19) Even though this alternative is consistent with a shift
to higher long-term growth ranges for the aggregates, the decline in
the funds rate would soon have to be reversed in order to keep the aggre-
gates within the longer-run ranges of alternative A. The funds rate
-14-
would probably have to begin rising late in the first quarter and
reach a high of 7-3/4 per cent by fall. The delayed rise in short-
term rates would postpone the need for a change in deposit rate
ceilings.
-15-
Directive language
(20) Given below are alternatives for the operational
paragraphs of the directive. The first formulation places main
emphasis on near-term rates of growth in monetary aggregates. The
second formulation, like the directive adopted at the last meeting,
places main emphasis on money market conditions; it shows--in strike-
through form--the specifications adopted at the last meeting (except
that the specifications for the Federal funds rate reflect the modifi-
cations agreed upon on January 6). As suggested below, the particular
language needed in the opening lines of the money market formulation
would depend on the specific conditions sought; the three alternatives
shown--calling, respectively, for somewhat easier, prevailing, and
somewhat firmer money market conditions--are intended to be associated
with the specifications discussed in the preceding section under
alternatives A, B, and C.
"Monetary Aggregates" Formulation
The Committee seeks to encourage near-term rates of growth
in M-1 and M-2 on a path believed to be reasonably consistent with
the longer-run ranges for monetary aggregates cited in the preceed-
ing paragraph. Specifically, at present, it expects the annual
growth rates over the January-February period to be within the
ranges of ____ to ____ per cent for M-1 and ____ to ____
per cent for M-2. In the judgment of the Committee such growth
rates are likely to be associated with a weekly-average Federal
-16-
funds rate of about ____ per cent. If, giving approximately
equal weight to M-1 and M-2, it appears that growth rates over
the 2-month period will deviate significantly from the midpoints
of the indicated ranges, the operational objective for the Federal
funds rate shall be modified in an orderly fashion within a range
of ____ to ____ per cent. In the conduct of day-to-day opera-
tions, account shall be taken of emerging financial market condi-
tions, including the unsettled conditions in foreign exchange
markets.
If it appears during the period before the next meeting
that the operating constraints specified above are proving to be
significantly inconsistent, the Manager is promptly to notify the
Chairman who will then decide whether the situation calls for
supplementary instructions from the Committee.
"Money Market" Formulation
At this time, the Committee seeks to maintain about the
prevailing money market conditions (OR TO ACHIEVE SOMEWHAT EASIER
OR SOMEWHAT FIRMER MONEY MARKET CONDITIONS) during the period
immediately ahead, provided that monetary aggregates appear to be
growing at approximately the rates currently expected, which are
believed to be on a path reasonably consistent with the longer-
run ranges for monetary aggregates cited in the preceding paragraph.
Specifically, the Committee seeks to maintain the weekly-average
Federal funds rate at about [DEL: 6-3/4-per cent] ____, so long as M-1
-17-
and M-2 appear to be growing over the [DEL: December-January] JANUARY-
FEBRUARY period at annual rates within ranges of [DEL: 2-l/2-to-8-1/2]
____ TO ____ per cent and [DEL: 6-to 10] ____ TO ____ per cent,
respectively. If, giving approximately equal weight to M-1 and
M-2, it appears that growth rates over the 2-month period are
approaching or moving beyond the limits of the indicated ranges,
the operational objective for the weekly-average Federal funds
rate shall be modified in an orderly fashion within a range of
[DEL: 6-l/2-to-7] ____ TO ____ per cent. In the conduct of day-
to-day operations, account shall be taken of emerging financial
market conditions, including the unsettled conditions in foreign
exchange markets.
If it appears during the period before the next meeting that
the operating constraints specified above are proving to be
significantly inconsistent, the Manager is promptly to notify
the Chairman who will then decide whether the situation calls
for supplementary instructions from the Committee.
Appendix I
Projected Federal Funds Rate
Alt. A Alt. B Alt. C
1978 QI 6-3/8 6-7/8 7
QII 7¼ 7½ 7¾
QIII 7-5/8 7-7/8 8-1/8
QIV 7¾ 8 8¼
Appendix II
Implied Velocity Growth Rates
V (GNP/M Alt. A Alt. B Alt. C
1978 I 6.4 6.5 6.6
II 5.3 5.6 5.8
III 5.5 5.4 5.2
IV 6.9 6.5 6.2
V1 (GNP/M21
1978 I 5.3 5.3 5.1
II 2.4 1.7 2.1
III 1.2 1.9 2.3
IV 3.2 3.6 3.6
Appendix III
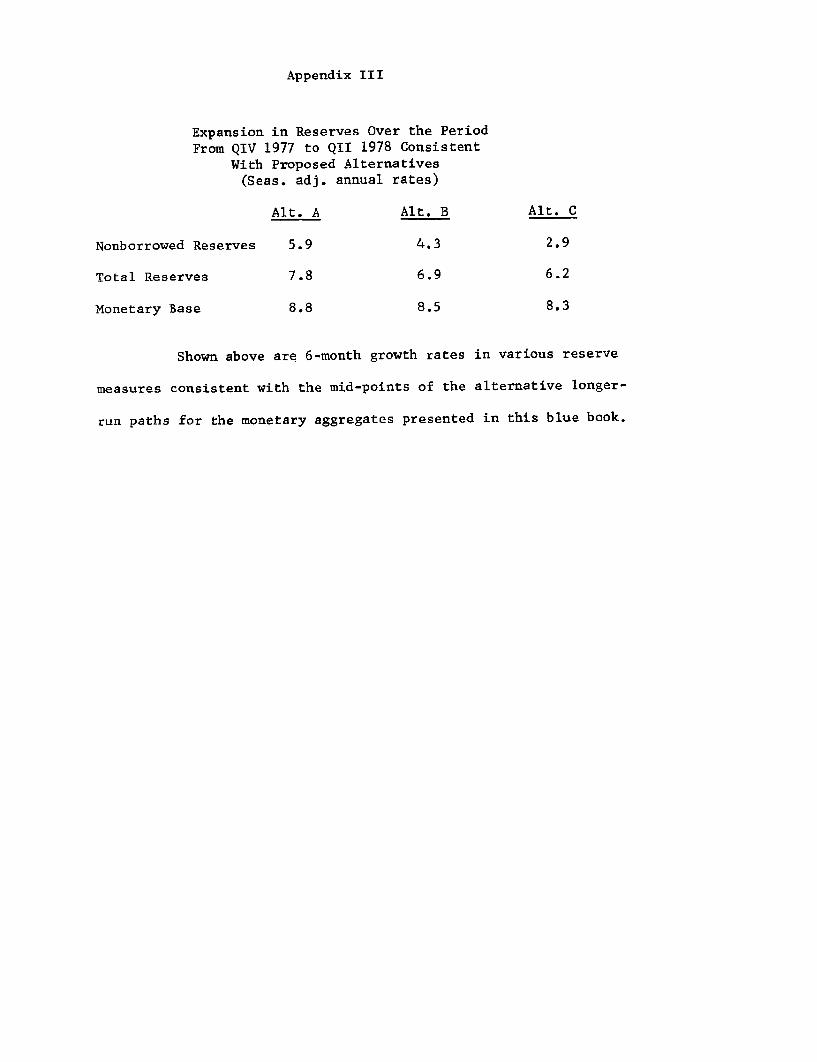
Expansion in Reserves Over the Period
From QIV 1977 to QII 1978 ConsistentWith Proposed Alternatives(Seas. adj. annual rates)
Alt. A Alt. B
Nonborrowed Reserves 5.9 4.3
Total Reserves 7.8 6.9
Monetary Base 8.8 8.5
Alt. C
2.9
6.2
8.3
Shown above are 6-month growth rates in various reserve
measures consistent with the mid-points of the alternative longer-
run paths for the monetary aggregates presented in this blue book.
Appendix Table IV-1
MONEY STOCK--M-1(Annual rates of growth, compounded quarterly)-
Base Period
741V 751 7511 7511I 751V 761 7611 76III 761V 771 7711 77 11 77IV
0.7
EndingPeriod
1975 I
II
III
IV
1976 I
II
III
IV
1977 I
II
III
IV
6.1
6.0
5.9
7.3
4.9 2.5
4.2 2.7
5.3 4.6
5.1 4.5
5.4 5.0
5.2 4.9
5.6 5.4
6.1 5.9
6.2 6.0
* ** * ** **
6.0
5.9
5.8
2.9
5.6
5.2
5.6
5.3
5.9
6.4
6.5
6.2
6.1
6.0
7.1
7.2
5.6
4.9
5.6
5.4
5.6
5.4
5.8
6.2
6.3
* * *
6.5
6.4
6.3
6.3
6.2
6.1
3.9
5.0
4.4
4.1
4.8
4.7
5.0
4.9
4.3
5.7
5.8
** *
6.5
6.4
6.3
4.3
6.5
7.5
7.4
6.5
6.3
6.2
8.7
9.2
8.4
6.8
6.6
6.5
9.7
8.3
6.5
6.3
6.1
5.8
5.6
5.4
1/ Based on quarterly average data.
4.4
5.6
5.1
6.0
6.7
6.8
6.7
5.5
6.5
7.3
7.3
1978 IV
Alt.
Alt.
Alt.
A 5.7
B 5.6
C 5.6
EndingPeriod
Base Period
74IV 751 7511
1975 I
II
III
IV
1976 I
II
III
TIV
1977 I
II
III
TV
5.8
8.1
8.9
8.3
8.7
9.1
9.1
9,6
9.7
9,7
9.8
9.6
10.4
10.4
9.2
9.4
9.7
9.7
10.2
10.2
10.1
10.2
9.9
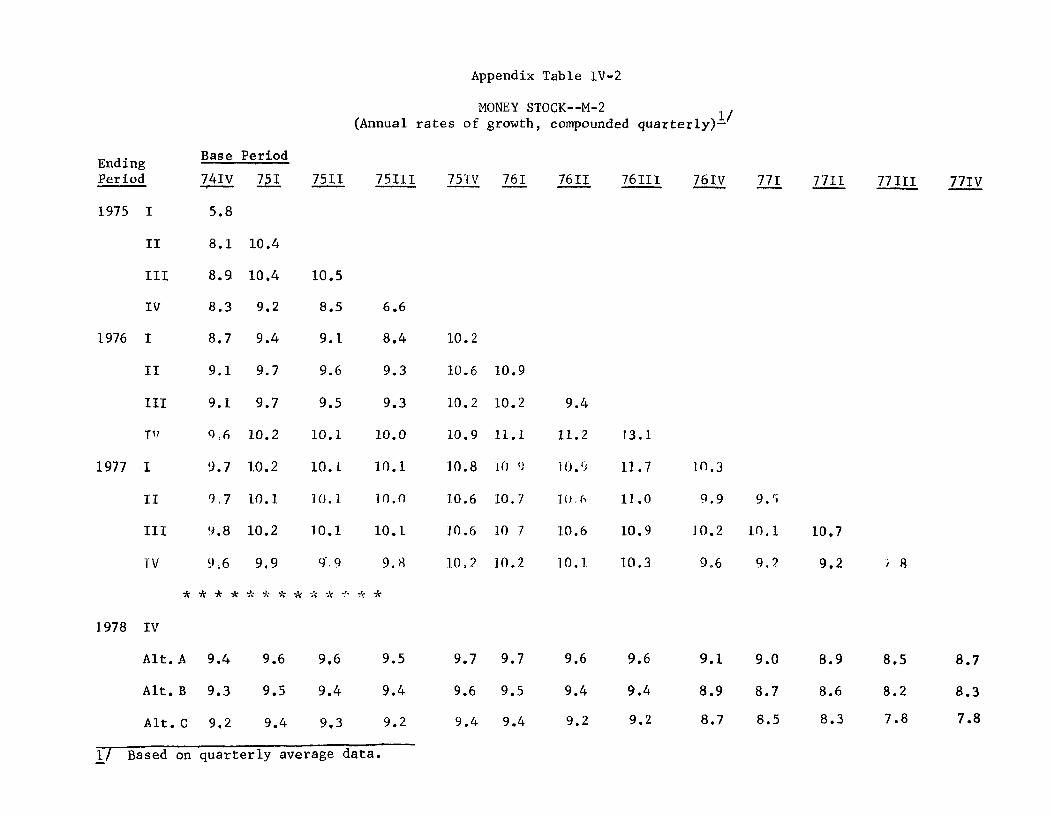
Appendix Table IV-2
MONEY STOCK--M-2(Annual rates of growth, compounded quarterly)-
7511 75IV 761 7611 76III 76IV 771 7711 7711 77IV
10.5
8.5 6.6
9.1 8.4
9.6 9.3
9.5 9.3
10.1 10.0
10.1 10.1
10.1 10.0
10.1 10.1
9 9 9.8
.A*'* *
1978 IV
Alt.A 9.4 9.6 9.6
Alt. B 9.3 9.5 9.4
Alt. C 9.2 9.4 9.3
10.2
10.6
10.2
10.9
10.8
10.6
10.6
10.2
10.9
10.2
11.1
1o0 9
10.7
10 7
10.2
9.5
9.4
9.2
9.4
11.2
10.9)
1 , (6
10.6
10.1
9.6
9.4
9.2
13.1
11.7
11.0
10.9
10.3
9.6
9.4
9.2
10.3
9.9
10.2
9.6
9.5
10.1
9, ?
9.1
8.9
8.7
10.7
9.2
8.9
8.6
8.3
8.5
8.2
7.8
1/ Based on quarterly average data.
8.7
8.3
7.8
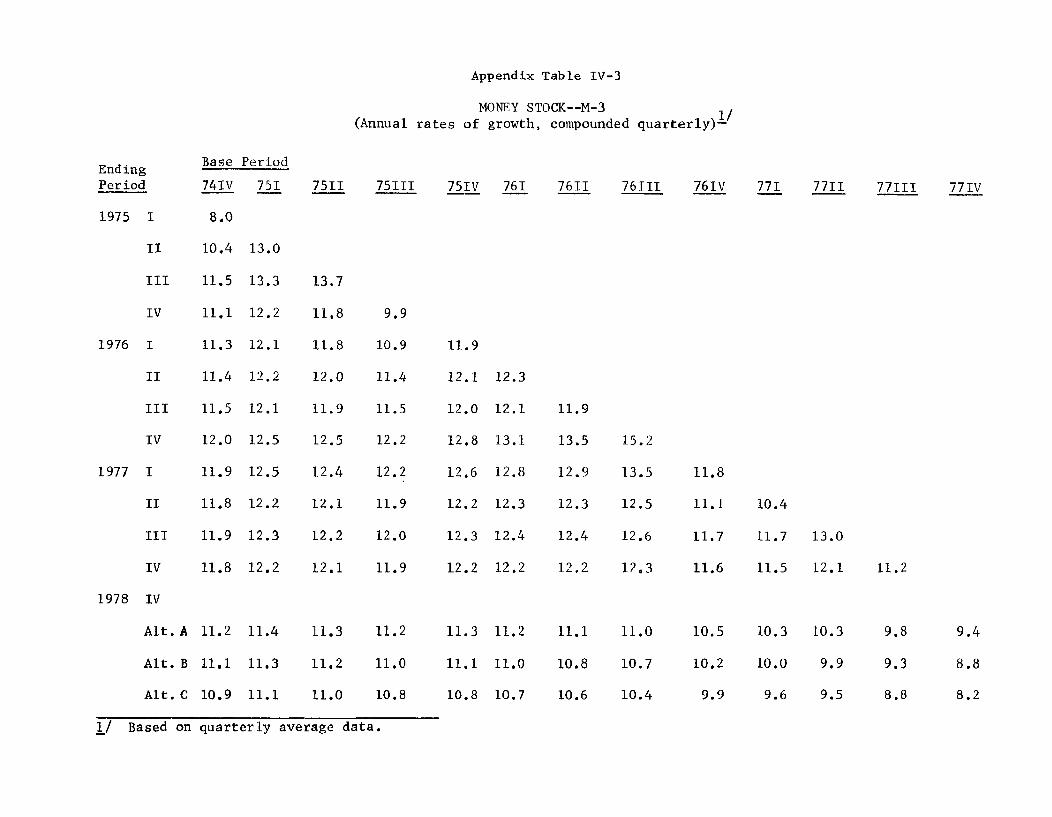
Appendix Table IV-3
MONEY STOCK--M-3
(Annual rates of growth, compounded quarterly)-
En g Base PeriodEnding
Period 74IV 751 7511 75111 751V 761 7611 76III 761V 771 7711 77111 771V
1975 I 8.0
II 10.4 13.0
III 11.5 13.3 13.7
IV 11.1 12.2 11.8 9.9
1976 I 11.3 12.1 11.8 10.9 11.9
II 11.4 12.2 12.0 11.4 12.1 12.3
III 11.5 12.1 11.9 11.5 12.0 12.1 11.9
IV 12.0 12.5 12.5 12.2 12.8 13.1 13.5 15.2
1977 I 11.9 12.5 12.4 12.2 12.6 12.8 12.9 13.5 11.8
II 11.8 12.2 12.1 11.9 12.2 12.3 12.3 12.5 11.1 10.4
III 11.9 12.3 12.2 12.0 12.3 12.4 12.4 12.6 11.7 11.7 13.0
IV 11.8 12.2 12.1 11.9 12.2 12.2 12.2 12.3 11.6 11.5 12.1 11.2
1978 IV
Alt.A 11.2 11.4 11.3 11.2 11.3 11.2 11.1 11.0 10.5 10.3 10.3 9.8 9.4
Alt. B 11.1 11.3 11.2 11.0 11.1 11.0 10.8 10.7 10.2 10.0 9.9 9.3 8.8
Alt. C 10.9 11.1 11.0 10.8 10.8 10.7 10.6 10.4 9.9 9.6 9.5 8.8 8.2
1/ Based on quarterly average data.
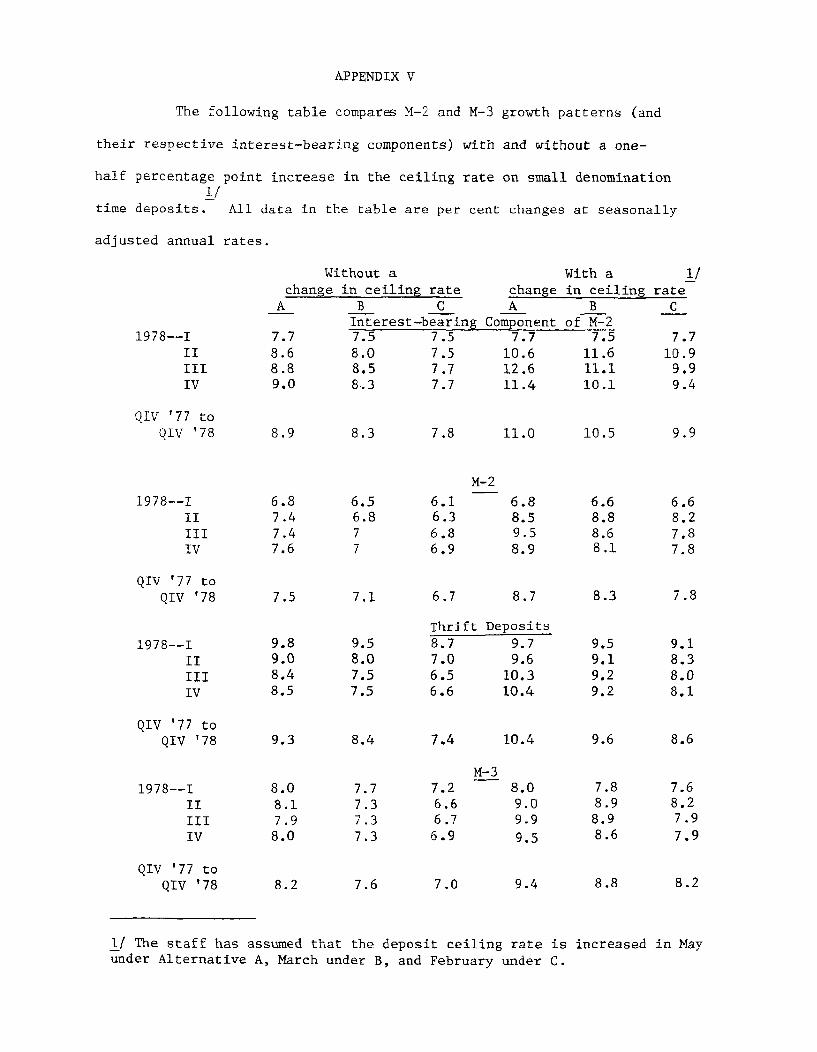
APPENDIX V
The following table compares M-2 and M-3 growth patterns (and
their respective interest-bearing components) with and without a one-
half percentage point increase in the ceiling rate on small denomination1/
time deposits. All data in the table are per cent changes at seasonally
adjusted annual rates.
1978--I
IIIIV
QIV '77 toQIV '78
Without achange in ceiling rate
A B CInterest-bearing
7.7 7.5 7.5
8.89.0
8.9
8.08.58.3
8.3
Co
7.5
With achange in ceiling rateA B
mponent of M-27.7 7.5
10.6 11.612.6 11.111.4 10.1
11.0 10.5
M-2
1978--IIIIIIIV
QIV '77 toQIV '78
1978--III
III
IV
QIV '77 toQIV '78
1978--IIIIIIIV
QIV '77 toQIV '78
6.87.47.47.6
7.5
9.89.08.48.5
9.3
8.08.17.98.0
8.2
6.56.877
7.1
9.58.07.57.5
8.4
7.77.37.37.3
6.16.36.86.9
6.88.59.58.9
6.7 8.7
Thrift Deposits8.7 9.77.0 9.66.5 10.36.6 10.4
M-37.26.66.76.9
10.4
8.09.09.9
9.5
1/ The staff has assumed that the deposit ceiling rate is increased in Mayunder Alternative A, March under B, and February under C.
1/ate
C
7.710.9
9.99.4
9.9
6.68.88.68.1
8.3
9.59.19.29.2
9.6
7.88.98.98.6
9.18.38.08.1
8.6
7.68.27.9
7.9
8.2
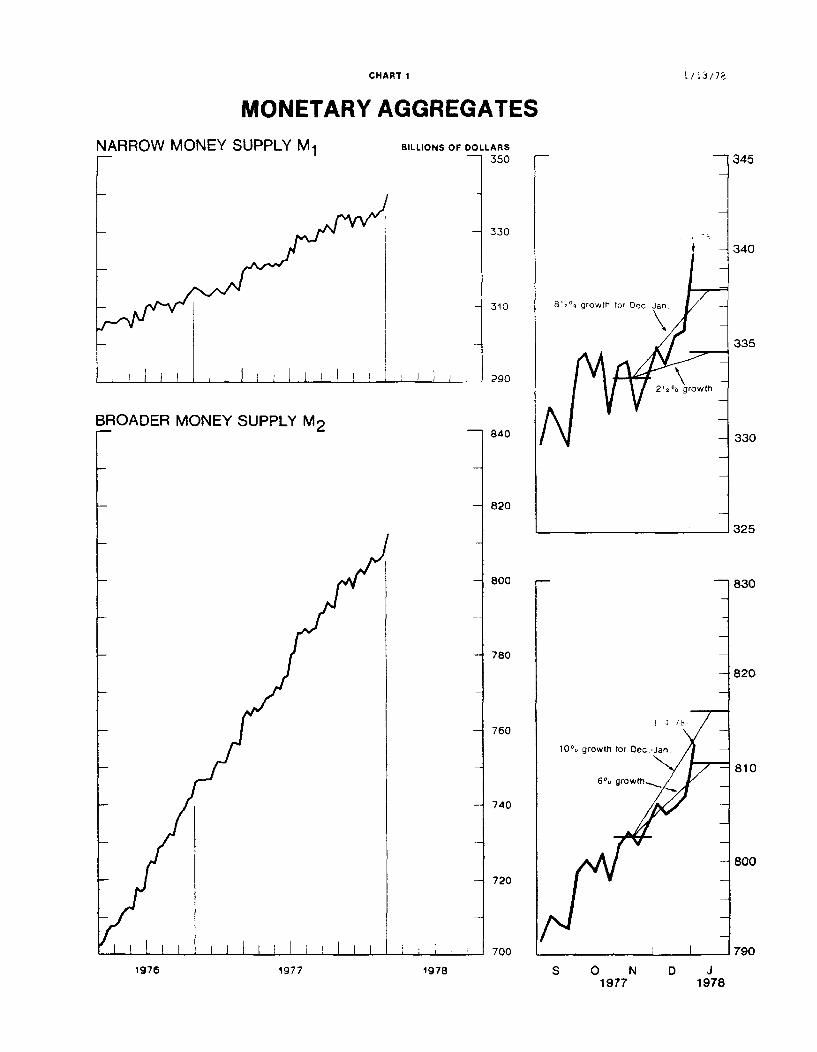
CHART 1
MONETARY AGGREGATESNARROW MONEY SUPPLY M1 BILLIONS OF DOLLARS
BROADER MONEY SUPPLY M2
350
330
310
290
840
1976 1977 1978 S 0 N D J1977 1978
1/13/7
820
810
800
790
BANK CREDIT
SEND OF MONTH
RESERVESF WEEKLY AVERAGES
1976
CHART 2 1/13/78
MONETARY AGGREGATESBILLIONS OF DOLLARS
-900
-860
-820
-780
I I I 740
BILLIONS OF DOLLARS37
TOTAL - 36
- 35
- 34
NONBORROWED
i I 33
1977 1978
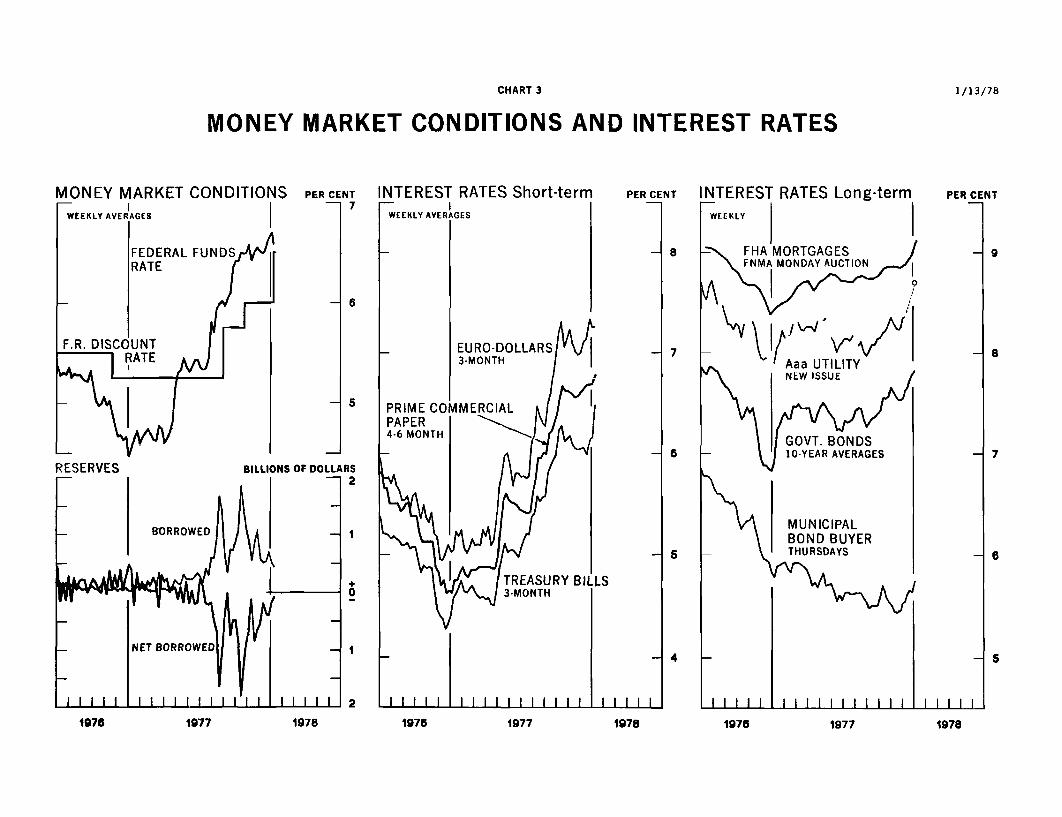
CHART 3
MONEY MARKET CONDITIONS AND INTEREST RATES
IONEY MARKET CONDITIONSWEEKLY AVEAGSWEEKLY AVERAGES
PER CENT-1 7
FEDERALRATE
RESERVES
-- 6
-1 5
BILLIONS OF DOLLARS2
0
l I 2
I
INTEREST RATES Short-term
1976 1977 1978
1/13/78
1976 1977 1978 1975 1977 1978
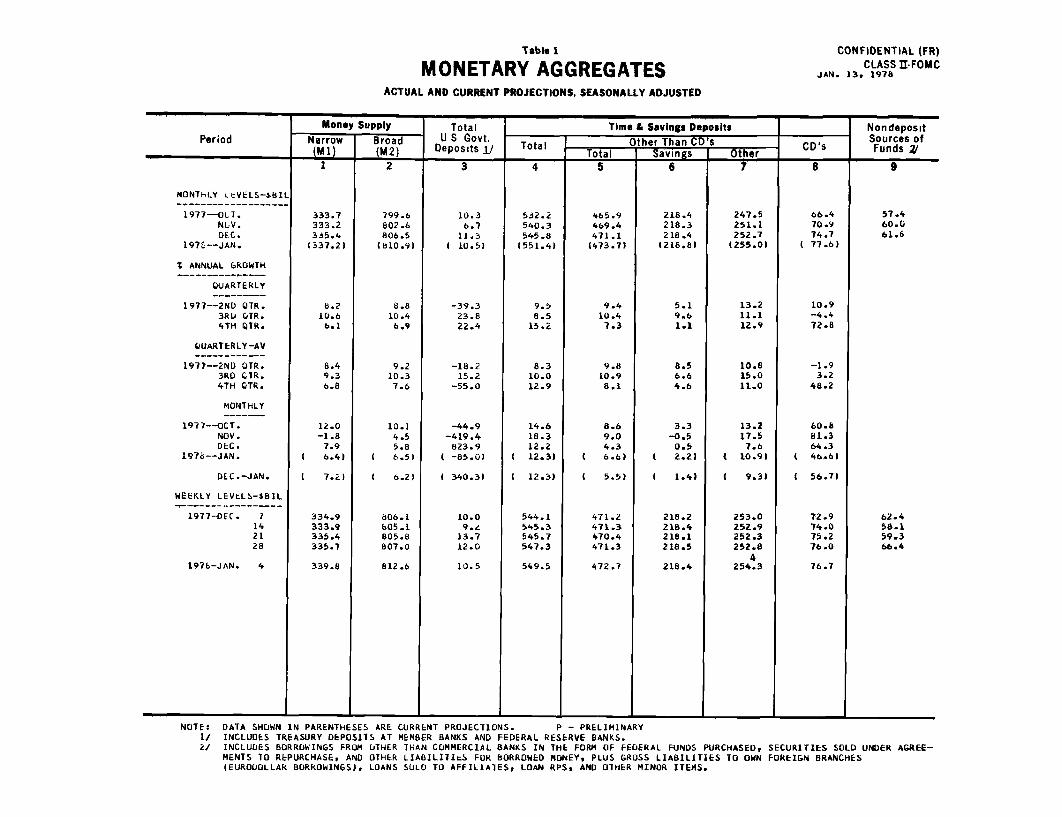
Table 1
MONETARY AGGREGATESACTUAL AND CURRENT PROJECTIONS, SEASONALLY ADJUSTED
CONFIDENTIAL (FR)CLASS II-FOMC
JAN. 13, 1978
Money Supply Total Time & Savings Deposits NondepositPeriod Narrow Broad U S Govt. Other Than CD's Sources of
(Ml) (M2) Deposits 1/ Total Total hr Tan ther CD's Funds 2
(Mij I M2 d _____I Tt I Savings I_____ Other___ I_____I
MONThLY LcVELS-sBIL
1977-OLT.NLV.DEC.
1976--JAN.
I ANNUAL GROWTH
QUARTERLY
1977--2ND QTR.3RD OTR.4TH QTR.
QUARTERLY-AV
1977--2ND OTR.3RD CTR.4TH QTR.
MONTHLY
1977--OCT.NOV.DEC.
1978--JAN.
DEC.-JAN.
WEEKLY LEVtLS-BIL
1977-DEC. 1142128
1976-JAN. 4
333.7333.2335.4
(337.2)
8.210.66.1
8.49.36.8
12.0-1.8
7.96.4)
7.2)
334.9333.9335.4335.7
339.8
799.6802.6806.5
(810.9)
8.810.4
6.9
9.210.3
7.6
10.14.55.8
1 6.5)
1 6.2)
806.1605.1805.8807.0
812.6
10.36.7
11.3I 10.5)
-39.323.822.4
-18.215.2
-55.0
-44.9-419.4
823.9-85.0)
340.31
532.2540.3545.8
1551.4)
9.58.5
15.2
8.310.012.9
14.618.312.2
1 12.3)
12.3)
544.1545.3545.7547.3
549.5
465.9469.4471.1(473.7)
9.410.4
7.3
9.810.98.1
471.2471.3470.4471.3
472.7
218.4218.3218.4
(218.8)
5.19.61.1
8.56.64.6
3.3-0.50.52.21
1.4)
218.2218.4218.1218.5
218.4
247.5251.1252.7(255.0)
13.211.112.9
10.815.011.0
13.2
17.57.6
S10.91
[ 9.3)
253.0252.9252.3252.8
4254.3
66.470.974.7
( 77.6)
10.9-4.472.8
-1.93.2
48.2
60.8
81.364.346.61
56.7)
72.974.075.276.0
76.7
57.460.061.6
NOTE: DATA SHOWN IN PARENTHESES ARE CURRENT PROJECTIONS. P - PRELIMINARY1/ INCLUDES TREASURY DEPOSITS AT MEMBER BANKS AND FEDERAL RESERVE BANKS.2/ INCLUDES BORROWINGS FROM UTHER THAN COMMERCIAL BANKS IN THE FORM OF FEDERAL FUNDS PURCHASED, SECURITIES SOLD UNDER AGREE-
MENTS TO REPURCHASE, AND OTHER LIABILITItS FOR BORROWED MONEY, PLUS GROSS LIABILITIES TO OWN FOREIGN BRANCHES(EURDOLLAR BORROWINGS), LOANS SOLD TO AFFILIATES, LOAN RPS, AND OTHER MINOR ITEMS.
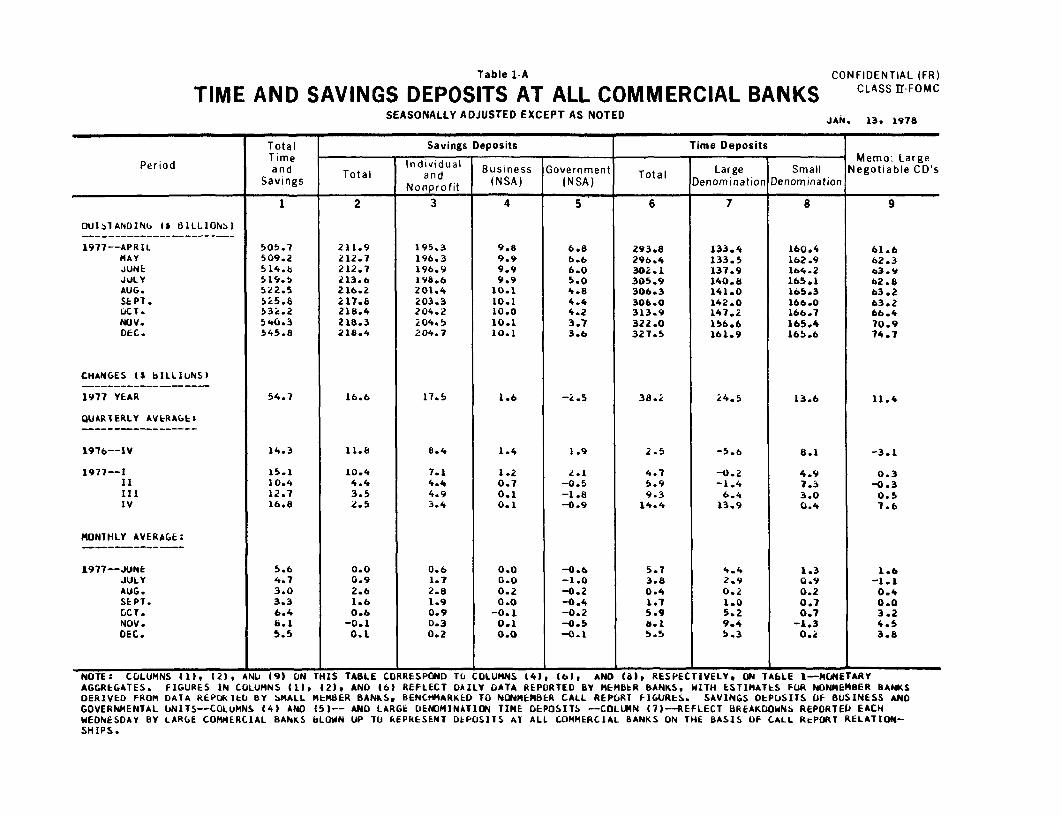
Table 1-A
TIME AND SAVINGS DEPOSITS AT ALL COMMERCIAL BANKSSEASONALLY ADJUSTED EXCEPT AS NOTED
CONFIDENTIAL (FR)CLASS II FOMC
JAN. 13, 1978
Total Savings Deposits Time DepositsTimen- Memo: Large
Period and Total Individual Business Government Total Large Small Negotiable CD'sSavings Nonprofit (NSA) (NSA) Denomination Denomination
Nonpro,,,
OUJI1ANDINGb I BILLIONS)
1977--APRILMAYJUNEJULYAUG.SEPT.OCT.NOV.DEC.
CHANGES (S bILLIuNS)
1977 YEAR
QUARTERLY AVERAGE:
1976--1V
1977--II11IIIIV
MONTHLY AVERAGE:
1977--JUNEJULYAUG.SEPT.GCT.NOV.DEC.
505.7509.2514.6519.5522.5525.8532.2540.3545.8
54.7
14.3
15.110.412.716.8
5.64.73.03.36.46.15.5
211.9212.7212.7213.6216.2217.8218.4218.3218.4
16.6
11.8
10.44.43.52.5
0.00.92.61.60.6
-0.10.1
195.3196.3196.9198.6201.4203.3204.2204.5204 7
17.5
8.4
7.14.44.93.4
0.61.72.81.90.90.30.2
9.89.99.99.9
10.110.110.010.110.1
1.6
1.4
1.20.70.10.1
0.00.00.20.0-0.10.10.0
6.86.66.05.04.84.44.23.73.6
-2.5
1.9
2.1-0.5
-1.8-0.9
-0.6-1.0-0.2-0.4-0.2-0.5-0.1
6
293.8296.4
302.1305.9306.3306.0313.9
322.0327.5
38.2
2.5
4.75.99.3
14.4
5.73.80.41.75.9a.15.5
133.4
133.5137.9140.8141.0142.0147.2156.6161.9
24.5
-5.6
-0.2-1.46.4
13.9
4.42.90.21.05.29.45.3
160.4162.9164.2165.1165.3166.0166.7165.4165.6
13.6
8.1
4.97.33.00.4
1.30.90.20.70.7
-1.30.2
61.662.363.962.863.263.266.470.974.7
11.4
-3.1
0.3-0.3
0.57.6
1.6-1.1
0.40.03.24.53.8
NOTE: COLUMNS (11, (2), ANU (9) ON THIS TABLE CORRESPOND TO COLUMNS (41, (6), AND (at, RESPECTIVELY, ON TAbLE 1-MONETARYAGGREGATES. FIGURES IN COLUMNS (1), (2), AND (6) REFLECT DAILY DATA REPORTED BY MEMBER BANKS, WITH ESTINATES FUR NONMEMBER BANKSDERIVED FROM DATA REPOKIlU BY 3MALL MEMBER BANKS, BENCHMARKED TO NONMEMBER CALL REPORT FIGURES. SAVINGS DEPOSITS OF BUSINESS ANDGOVERNMENTAL UNITS-COLUMNS (4) AND (5)-- AND LARGE DENOMINATION TIME DEPOSITS -COLUMN (7)--REFLECT BREAKDOWNS REPORTED EACHWEDNESDAY BY LARGE COMMERCIAL BANKS bLOWN UP TU REPRESENT DtPOSITS AT ALL COMMERCIAL BANKS ON THE BASIS OF CALL REPORT RELATION-SHIPS.
CONFIDENTIAL (F.R.)
TABLE 2 CLASS II FOMC
BANK RESERVESACTUAL AND CURRENT PROJECTIONS, SEASONALLY ADJUSTED JAN. 13, 1978
BANK RESERVES IREQUIRED RESERVES
Period Total Nonborrowed Monetary Total Private Total Time Gov't. andReserves Reserves Base Required Demand Deposits Interbank
MONTHLY LEVELS-$MILLIONS
1977-OC(T.NOV.DEC.
1976-JAN.
PERCENT ANNUAL GROWTH
QUARTERLY
1977-2ND OTR.3RD QTR.41H QTR.
QUARTERLY-AV
1977-2ND QTR.3RD QTR.4TH QTR.
MONTHLY
1977--OCT.NOV.DEC.
1978-JAN.
DEC.-JAN.
WEEKLY LEVELS-$MILLIONS
1977-DEC. 7142128
1978-JAN. 411
35,89736,00936,219(36,854)
6.58.86.6
3.09.05.7
9.13.77.0
( 21.0)
( 14.1)
35,86136,22436,25836,228
36,92936,295
34,59135,14735,650
(36,335)
4.64.67.4
1.93.43.0
-14.119.317.2
1 23.1)
1 20.3)
35,27835*71535,73135,542
36,42235.855
126,109126,953127,922(129,651)
8.210.28.9
7.29.68.7
9.38.09.2
16.2)
12.8)
127,055127,654128,035128,330
129,354128.725
35,68635,75636,016(36,6031
7.38.16.8
3.58.65.8
9.12.48.719.6)
14.2)
35,84635,91136,11335,940
36,60735,939
21,38421,43721,454
(21,613)
3.913.23.3
3.010.24.9
5.93.01.0
( 8.91
i 4.9)
21,26321,47921e58621,429
21,58721,377
'12,45612,64612,854(13,057)
6.12.6
15.0
4.06.38.6
6.618.319.719.01
19.5)
12,79912,82812,84612,891
12,97513,043
1,8461,67519709
( 1,933)
1,7841,6041,6801,621
2,0451,519
NOTE: RESERVE SERIES HAVE BEEN ADJUSTED TO REMOVE DISCONTINUITIES ASSOCIATED WITH CHANGES IN RESERVE REQUIREMENT RATIO.DAIA SHOWN IN PARENTHESES ARE CURRENT PROJECTIONS.
TABLE 3
NET CHANGES IN SYSTEM HOLDINGS OF SECURITIES 1
($ million, not seasonally adjusted)
STRICTLY CONFIDENTIAL (FR)CLASS II - FOMC
JANUARY 13, 1978
Treasury Bills WithinNet Change 2/ 1 year
Treasury CouponsNet Purchases 3/
1 - 5Over
5 - 10 10 Total
Federal Agencies
Net Purchases 4/Within
1 year 1 - 5 5 - 10Over
10
Net Change
OutrightHoldings
Total Total 5/
1972
1973
1974
1975
19761977
1976--Qtr.
1977--Qtr.
Qtr.
Qtr.
Qtr.
1977--July
Aug.
Sept.
-490
7,232
1,280-468863
4,361
-8861,164
2,126886
186
-1,136
636
1,385
Oct. -1,877
Nov. -736
Dec. 2,798
1977--Nov. 29162330
Dec. 714
21
28
1978--Jan. 4
11
18
25
LEVEL--Jan. 11(in billions)
789
579
797
3,284
3,025
2,833
794997
526
681
628
539
500
434
1,510
1,048758
23232517196
166
167129196
1,070642553
192165152128108
1,582
1,415
1,747
6,202
5,1874,660
1,294
1,680959
1,0211,001
116 681 96 128 1,021
99 628 166 108 1,001
-568-376
-360
585351425
1,438
-347
592
400
1,665824
469
792
1,059
864
3,082
1,613891
1,433
115
726
707
1,631
9,273
6,303
7,267
6,227
10,035
4362,738
3,6664,273
-643
---- -- -- -1,159S - - - 552
S- - - 4,881
------ -- -4,380-- -- -- -- -- -736
-- 386 177 145 707 4,474
-- -- -- -- -- -- -- -- -- -569
-- -- -- -- -- -- -- -- -- -376
-- -- -- -- -- -- -- -- -360
1,001
27.2 10.4 7.1 59.442.6
S - - - 585S - - - 327
S - - - 1,425186 177 145 707 2,145
-9-- -- -- -- -9347-- -- -- -- -347
1.3 4.1 1.6 1.0 8.0 109.9
-1,358
-46
-154
1,272
3,607
-2,892
304-4,771
4,175
-2,331
34
-2,861
-1,353
1,883
-6,530
2,996
3,568
-2,690
-4,479
-1,726
8,439-1,167
1,317
-4,553
6,709
3,099
-4,526
-7,893
-7.5
1/ Change from end-of-period to end-of-period.
2/ Outright transactions in market and with foreign accounts, and redemptions (-) in bill auctions.3/ Outright transactions in market and with foreign accounts, and short-term notes acquired in exchange for maturing bills. Excludes redemptions,
maturity shifts, rollovers of maturing coupon issues, and direct Treasury borrowing from the System.4/ Outright transactions in market and with foreign accounts only. Excludes redemptions and maturity shifts.5/ In addition to net purchases of securities, also reflects changes in System holdings of bankers' acceptances, direct Treasury borrowings from
the System, and redemptions (-) of Agency and Treasury coupon issues.6/ Includes changes in both RP's (+) and matched sale-purchase transactions (-).
Net
RP's6/
m A I
----- ~---------,
TABLE 4
SECURITY DEALER POSITIONS AND BANK POSITIONS
(millions of dollars)
STRICTLY CONFIDENTIAL (FR)
CLASS II - FOMC
JANUARY 13, 1978
U.S . Govt. SecurityDealer Positions
lr Cnunnn Tc
UnderwritingSyndicate Positions
Corporate MunicipalBonds Bonds
Excess**Reservs I
Member Bank Reserve PositionsBorrowing at FRB**
Trtall Se o a,,i
Basic Reserve Deficit**
8 New York 38 Others
1976--High
Low
1977--High
Low
1976--Dec.
1977--Jan.
Feb.
Mar.
Apr.
May
June
July
Aug.
Sept.
Oct.
Nov.
Dec.
1977--Nov. 29
16
2330
Dec. 714
2128
1978--Jan. 4
11
8,896
3,668
7,234
1,729
8,005
6,406
4,450
4,906
4,567
3.072
4,752
3,899
2,533
4,812
4,1423,617
*4,257
4,2033,6624,428
3,3262,818
3,3975,059
*4,877
*4,023
*4,416r
*5,625
3,046
175
3,017
-1,445
2,443
2,320
1,650
972
696
123
206
-309
-933
-313
-360
610*804r
-203
547
426
5751,203
1,026
447
*256*1,375
*1,247r*369
655-180
513-111
274
265198214
192213154
275200209
210251203p
24224
1,86120
53
6872
103
73206262
3231,084
626
1,305
863
570p
1,113
887534
879
1,079
0 31625p
260p
-8,161
-2,367
-9,151
-4,234
-7,168
-6,421
-5,604
-5,661
-6,586
-5,693
-5,341
-6,391
-5,581
-7,333
-6,480
-6,971-7,407p
.04 -5,01187 -7,49481 -7,34084 -7,44774 -6,165
70 -7,42456 -9,15153 -7,18553p -6,165
30p -6,717p26p -
8,00 3
p
NOTE: Government security dealer trading positions are on a commitment basis. Trading positions, which exclude Treasury securities financed byrepurchase agreements maturing in 16 days or more, are indicators of dealer holdings available for sale over the near-term. Underwriting syndicate
positions consist of issues still in syndicate, excluding trading positions. The basic reserve deficit is excess reserves less borrowing at FederalReserve less net Federal funds purchases. Weekly data are daily averages for statement weeks, except for corporate and municipal issues in syndicate
which are Friday figures.
* Strictly confidential.
** Monthly averages for excess reserves and borrowings are weighted averages of statement week figures.r Revised.
Bil:
-12,744
- 6,908
-13,975
- 8,206
-11,449
-11,504
-11,503
-10,912
-11,409
-10,175
-10,332
-11,012
-11,452
-11,120
-11,511
-11,825
-11,305p
-11,554
-13,734-12,638
-10,748
-10,259
-12,292
-11,736
-12,335
-10,246
- 8,603p
-12,976p
uesS o Is York 1 38 ....Total aIses
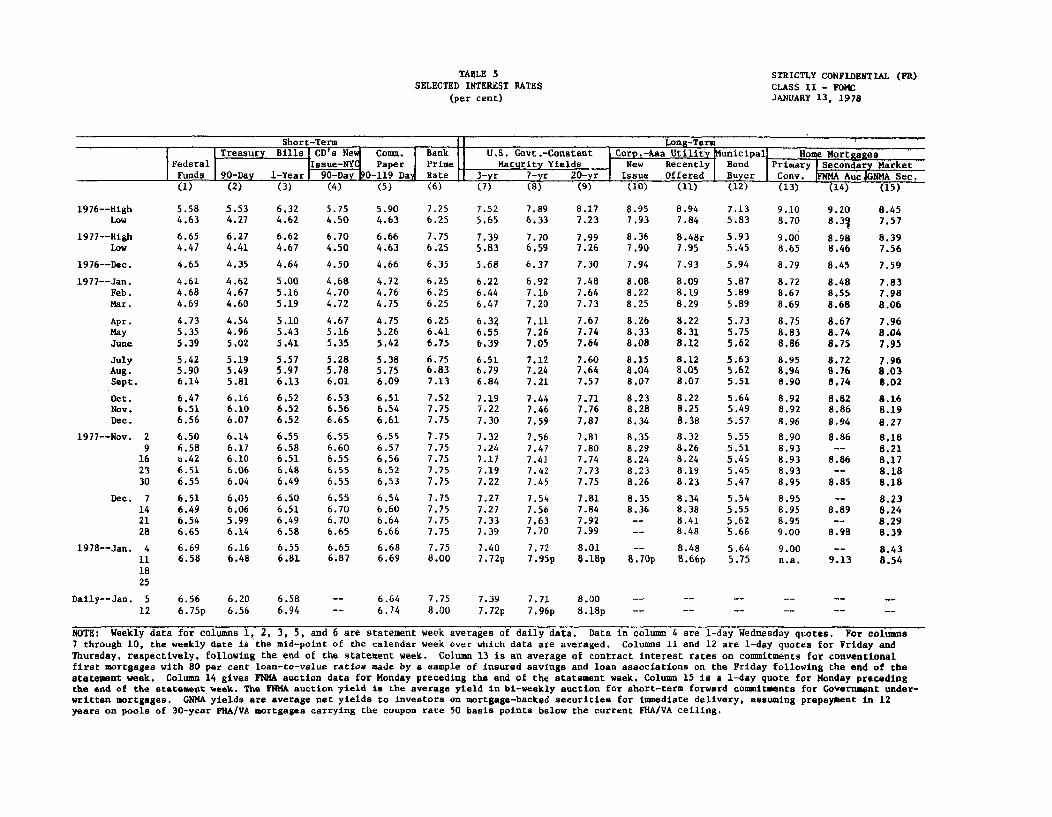
TABLE 5SELECTED INTEREST RATES
(per cent)
STRICTLY CONFIDENTIAL (FR)CLASS II - FOMCJANUARY 13, 1978
Short-Term _ I ong-Term
Treasury Bills CD's New Comm. Bank U.S. Govt.-Constant Corp.-Aaa Utility Municipal Home MortgagesFederal Issue-NYq Paper Prime [ Mattrity Yields New Recently Bond Primary ISecondary Market
Funds 90-Day 1-Year 90-Day 0-119 Da Rate 3-yr 7-yr 20-yr Issue Offered Buyer Cony. FNMA AucjGNMA Sec.(1) (2) (3) (4) (5) (6) (7) (8) (9) (10) (11) (12) (13) (14) (15)
1976--HighLow
1977--HighLow
1976--Dec.
1977--Jan.Feb.Mar.
Apr.MayJune
JulyAug.Sept.
Oct.Nov.Dec.
1977--Nov. 29
162330
Dec. 7142128
1978--Jan. 4111825
Daily--Jan. 512
5.58 5.53 6.324.63 4.27 4.62
6.65 6.27 6.624.47 4.41 4.67
4.65 4.35 4.64
4.61 4.62 5.004.68 4.67 5.164.69 4.60 5.19
4.73 4.54 5.105.35 4.96 5.435.39 5.02 5.41
5.42 5.19 5.575.90 5.49 5.976.14 5.81 6.13
6.47 6.16 6.526.51 6.10 6.526.56 6.07 6.52
6.50 6.14 6.556.58 6.17 6.58o.42 6.10 6.516.51 6.06 6.486.55 6.04 6.49
6.51 6.05 6.506.49 6.06 6.516.54 5.99 6.496.65 6.14 6.58
6.69 6.16 6.556.58 6.48 6.81
6.56 6.20 6.586 .75p 6.56 6.94
5.75 5.904.50 4.63
6.70 6.664.50 4.63
4.50 4.66
4.68 4.724.70 4.764.72 4.75
4.67 4.755.16 5.265.35 5.42
5.28 5.385.78 5.756.01 6.09
6.53 6.516.56 6.546.65 6.61
6.55 6.556.60 6.576.55 6.566.55 6.526.55 6.53
6.55 6.546.70 6.606.70 6.646.65 6.66
6.65 6.686.87 6.69
7.256.25
7.756.25
6.35
6.256.256.25
6.256.416.75
6.756.837.13
7.527.757.75
7.757.757.757.757.75
7.757.757.757.75
7.758.00
7.52 7.895.65 6.33
7.39 7.705.83 6.59
5.68 6.37
6.22 6.926.44 7.166.47 7.20
6.37 7.116.55 7.266.39 7.05
6.51 7.126.79 7.246.84 7.21
7.19 7.447.22 7.467.30 7.59
7.32 7.567.24 7.477.17 7.417.19 7.427.22 7.45
7.27 7.547.27 7.567.33 7.637.39 7.70
7.40 7.727.72p 7.95p
- 6.64 7.75 7.39 7.71- 6.74 8.00 7.72p
7.96p
8.17 8.95 8.94 7.13 9.10 9.207.23 7.93 7.84 5.83 8.70 8.31
7.99 8.36 8.48r 5.93 9.00 8.987.26 7.90 7.95 5.45 8.65 8.46
7.30 7.94 7.93 5.94 8.79 8.45
7.48 8.08 8.09 5.87 8.72 8.487.64 8.22 8.19 5.89 8.67 8.557.73 8.25 8.29 5.89 8.69 8.68
7.67 8.26 8.22 5.73 8.75 8.677.74 8.33 8.31 5.75 8.83 8.747.64 8.08 8.12 5.62 8.86 8.75
7.60 8.15 8.12 5.63 8.95 8.727.64 8.04 8.05 5.62 8.94 8.767.57 8,07 8.07 5.51 8.90 8.74
7.71 8.23 8.22 5.64 8,92 8.827.76 8.28 8.25 5.49 8.92 8.867.87 8.34 8.38 5.57 8.96 8.94
7.81 8.35 8.32 5.55 8.90 8.867.80 8.29 8.26 5.51 8.937.74 8.24 8.24 5.45 8.93 8.867.73 8.23 8.19 5.45 8.937.75 8.26 8.23 5.47 8.95 8.85
7.81 8.35 8.34 5.54 8.957.84 8.36 8.38 5.55 8.95 8.897.92 -- 8.41 5.62 8.957.99 - 8.48 .66 9.00 8.98
8.01 -- 8.48 5.64 9.008.18p 8.70p 8.6 6p 5.75 n.a. 9.13
8.00 --8.18p --
NOTE: Weekly data for columns 1, 2, 3, 5, and 6 are statement week averages of daily data. Data in column 4 are 1-day Wednesday quotes. For columns7 through 10, the weekly date is the mid-point of the calendar week over which data are averaged. Columns 11 and 12 are 1-day quotes for Friday andThursday, respectively, following the end of the statement week. Column 13 is an average of contract interest rates on commitments for conventionalfirst mortgages with 80 per cent loan-to-value ratios made by a sample of insured savings and loan associations on the Friday following the end of thestatement week. Column 14 gives FNMA auction data for Monday preceding the end of the statement week. Column 15 is a 1-day quote for Monday precedingthe end of the statement week. The FNMA auction yield is the average yield in birweekly auction for short-term forward commitments for Governamet under-written mortgages. GNMA yields are average net yields to investors on mortgage-backed securities for immediate delivery, assuming prepayment in 12years on pools of 30-year FHA/VA mortgages carrying the coupon rate 50 basis points below the current FHA/VA ceiling.
8.457.57
8.397.56
7.59
7.837.988.06
7.968.047.95
7.968.038.02
8.168.198.27
8.188.218.178.188.18
8.238.248.298.39
8.438.54
JAN. 13, 1978
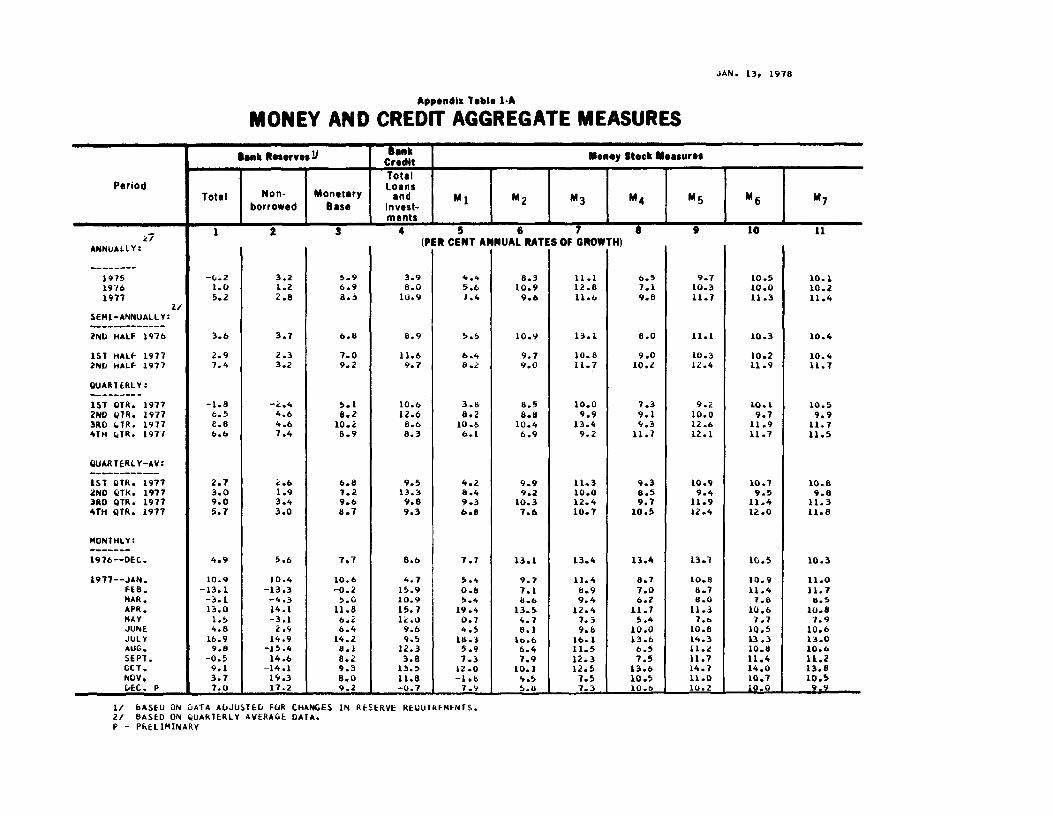
Appendix Table 1-A
MONEY AND CREDIT AGGREGATE MEASURES
Bank Reerves Y Ban Money Stock MeasuresCreditTotal
Period LoansTotal Non- Monetary and MI M2 M3 M4 M5 M6 M7borrowed Base Invest-
f± n I ments _ _. 1 2 3 4 5 6 7 9 10 11
ANNUALLY: (PER CENT ANNUAL RATES OF GROWTH)ANNUALLY
1975 -0.2 3.2 5.9 3.9 4.4 8.3 11.1 6.5 9.7 10.5 10.11976 1.0 1.2 6.9 8.0 5.6 10.9 12.8 7.1 10.3 10.0 10.21977 5.2 2.8 8.3 10.9 1.4 9.6 11.b 9.8 11.7 11.3 11.4
2/SEMI-ANNUALLY:
2ND HALF 1976 3.6 3.7 6.8 8.9 5.5 10.9 13.1 8.0 11.1 10.3 10.4
1ST HALF 1977 2.9 2.3 7.0 11.6 6.4 9.7 10.8 9.0 10.3 10.2 10.42ND HALF 1977 7.4 3.2 9.2 9.7 8.2 9.0 11.7 10.2 12.4 11.9 11.7
OUARIERLY:
1ST OTR. 1977 -1.8 -2.4 5.1 10.6 3.8 8.5 10.0 7.3 9.2 10.1 10.52ND UTR. 1977 6.5 4.6 6.2 12.6 8.2 8.8 9.9 9.1 10.0 9.7 9.93RD TR. 1977 E.8 4.6 10.2 8.6 10.6 10.4 13.4 9.3 12.6 11.9 11.74TH (TR. 1977 6.6 7.4 8.9 8.3 6.1 6.9 9.2 11.7 12.1 11.7 11.5
QUARTERLY-AV:
1ST QTR. 1977 2.7 i.6 6.8 9.5 4.2 9.9 11.3 9.3 10.9 10.7 10.82ND QTH. 1977 3.0 1.9 7.2 13.3 8.4 9.2 10.0 8.5 9.4 9.5 9.83RD QTR. 1977 9.0 3.4 9.6 9.8 9.3 10.3 12.4 9.7 11.9 11.4 11.34TH QTR. 1977 5.7 3.0 8.7 9.3 6.8 7.6 10.7 10.5 12.4 12.0 11.8
MONTHLY:
1976--DEC. 4.9 5.6 7.7 8.6 7.7 13.1 13.4 13.4 13.7 10.5 10.3
1977--JAN. 10.9 10.4 10.6 4.7 5.4 9.7 11.4 8.7 10.8 10.9 11.0FEB. -13.1 -13.3 -0.2 15.9 0.8 7.1 b.9 7.0 8.7 11.4 11.7MAR. -3.1 -4.3 5.0 10.9 5.4 8.6 9.4 6.2 8.0 7.8 8.5APR. 13.0 14.1 11.8 15.7 19.4 13.5 12.4 11.7 11.3 10.6 10.8MAY 1.5 -3.1 6.2 1 .0 0.7 4.7 7.3 5.4 7.b 7.7 7.9JUNE 4.8 2.9 6.4 9.6 4.5 8.1 9. 10.0 10.8 10.5 10.6JULY 16.9 14.9 14.2 9.5 16.3 1 .6 16.1 13.6 14.3 13.3 13.0AUG. 9.8 -15.4 8.1 12.3 5.9 6.4 11.5 6.5 11.2 10.8 10.6SEPT. -0.5 14.6 8.2 3.8 7.3 7.9 12.3 7.5 11.7 11.4 11.2OCT. 9.1 -14.1 9.3 13.5 12.0 10.1 12.5 13.6 14.7 14.0 13.8NOV. 3.7 19.3 8.0 11.8 -1.6 4.5 7.5 10.5 11.0 10.7 10.5DEC. P 7.0 17.2 9.2 -0.7 7.9 5.8 7.3 10.6 10.2 10.0 9.
1/ bASEU ON DATA ADJUSTED FOR CHANGES IN RESERVE REQUIREMENTS.2/ BASED ON QUARTERLY AVERAGE DATA.P - PRELIMINARY
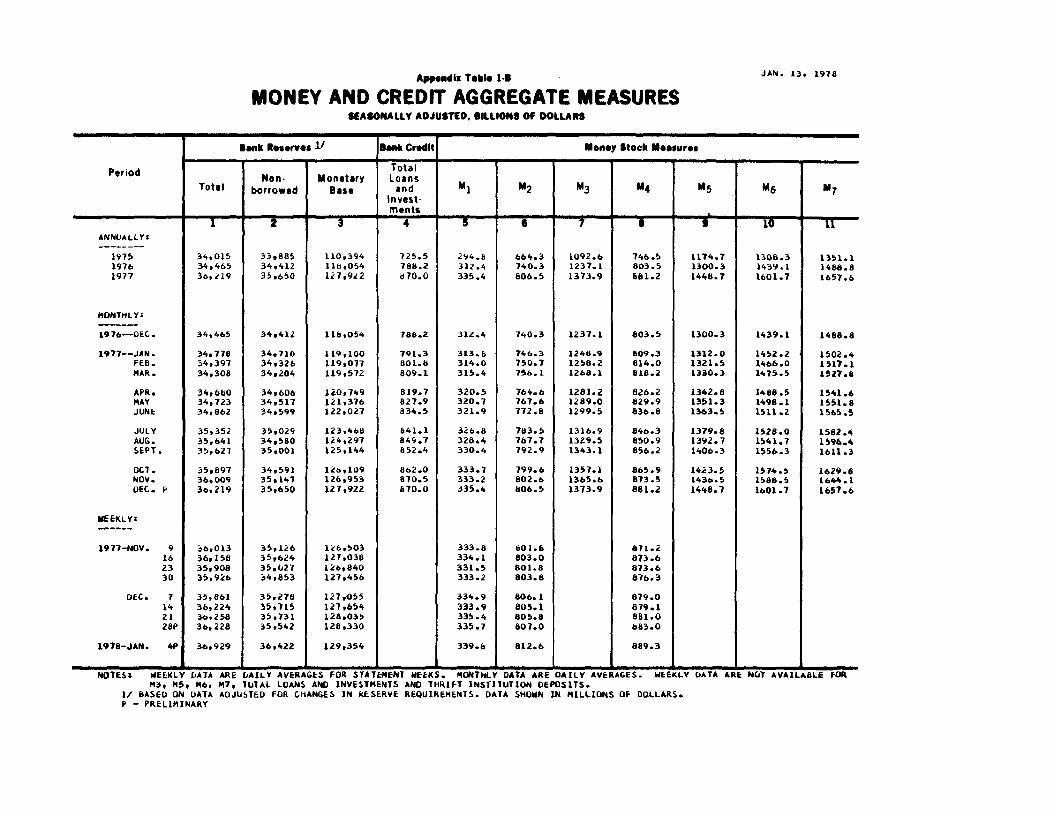
Appendix Table 1-B
MONEY AND CREDIT AGGREGATE MEASURESSEASONALLY ADJUSTED, BILLIONS OF DOLLARS
JAN. 13, 1978
Bank Reserve 1/ Bank Credit Money Stock Measures
PeTotd TotalPerd Non- Monetary Loans
Total borrowed Base and M1 M2 M3 M4 M5 M6 M7Invest-ments
1 2 3 4 5 6 7 10 1ANNUALLY:
1975 34,015 33.885 110,394 725.5 294.6 664.3 1092.6 746.5 1174.7 1308.3 1351.11976 34.465 34.412 11b,054 788.2 312.4 740.3 1237.1 803.5 1300.3 1439.1 1488.81977 36,219 35.650 127,922 870.0 335.4 806.5 1373.9 681.2 1448.7 1601.7 1657.6
MONTHLY
1976-DEC. 34,465 34,412 1168054 786.2 312.4 740.3 1237.1 803.5 1300.3 1439.1 1488.8
1977--JAN. 34*778 34.710 119,100 791.3 313.6 746.3 1248.9 609.3 1312.0 1452.2 1502.4FEB. 34,397 34,326 119,077 801.8 314.0 750.7 1258.2 814.0 1321.5 1466.0 1517.1MAR. 34,308 34,204 119,572 809.1 315.4 756.1 1268.1 818.2 1330.3 1475.5 1527.8
APR. 34,660 34,606 120,749 819.7 320.5 764.6 1281.2 826.2 1342.8 1488.5 1541.6MAY 34,723 34,517 121,376 827.9 320.7 767.6 1289.0 829.9 1351.3 1498.1 1551.8JUNE 34,862 34,599 122,027 834.5 321.9 772.8 1299.5 836.8 1363.5 1511.2 1565.5
JULY 35,352 35,029 123,468 641.1 326.8 783.5 1316.9 846.3 1379.8 1528.0 1582.4AUG. 35,641 34,580 124,297 849.7 328.4 787.7 1329.5 850.9 1392.7 1541.7 1596.4SEPT. 35,621 35,001 125,144 852.4 330.4 792.9 1343.1 856.2 1406.3 1556.3 1611.3
OCT. 35,897 34,591 126,109 862.0 333.7 799.6 1357.1 865.9 1423.5 1574.5 1629.8NOV. 36,009 35,147 126,953 870.5 333.2 802.6 1365.6 873.5 1436.5 1588.5 1644.1DEC. P 36,219 35,650 127,922 870.0 335.4 806.5 1373.9 881.2 1448.7 1601.7 1657.6
MEEKLY:
1977-NOV. 9 36,013 35,126 126,503 333.8 601.6 871.216 36,158 35,624 127,038 334.1 803.0 873.623 35,908 35,027 126,840 331.5 801.8 873.630 35,926 34,853 127.456 333.2 803.8 876.3
DEC. 7 35,861 35,278 127,055 334.9 806.1 879.014 36,224 351715 127,654 333.9 805.1 879.121 36,258 35,731 128,035 335.4 805.8 881.028P 36,228 35,542 128,330 335.7 807.0 683.0
1976-JAN. 4P 36,929 36,422 129,354 339.6 812.6 889.3
NOTESt WEEKLY DATA ARE DAILY AVERAGES FOR STATEMENT WEEKS. MONTHLY DATA ARE DAILY AVERAGES. WEEKLY DATA ARE NOT AVAILABLE FORM3, M, M6, M7, TOTAL LOANS AND INVESTMENTS AND THRIFT INSTITUTION DEPOSITS.
1/ BASED ON DATA ADJUSTED FOR CHANGES IN RESERVE REQUIREMENTS. DATA SHOWN IN MILLIONS OF DOLLARS.P - PRELIMINARY
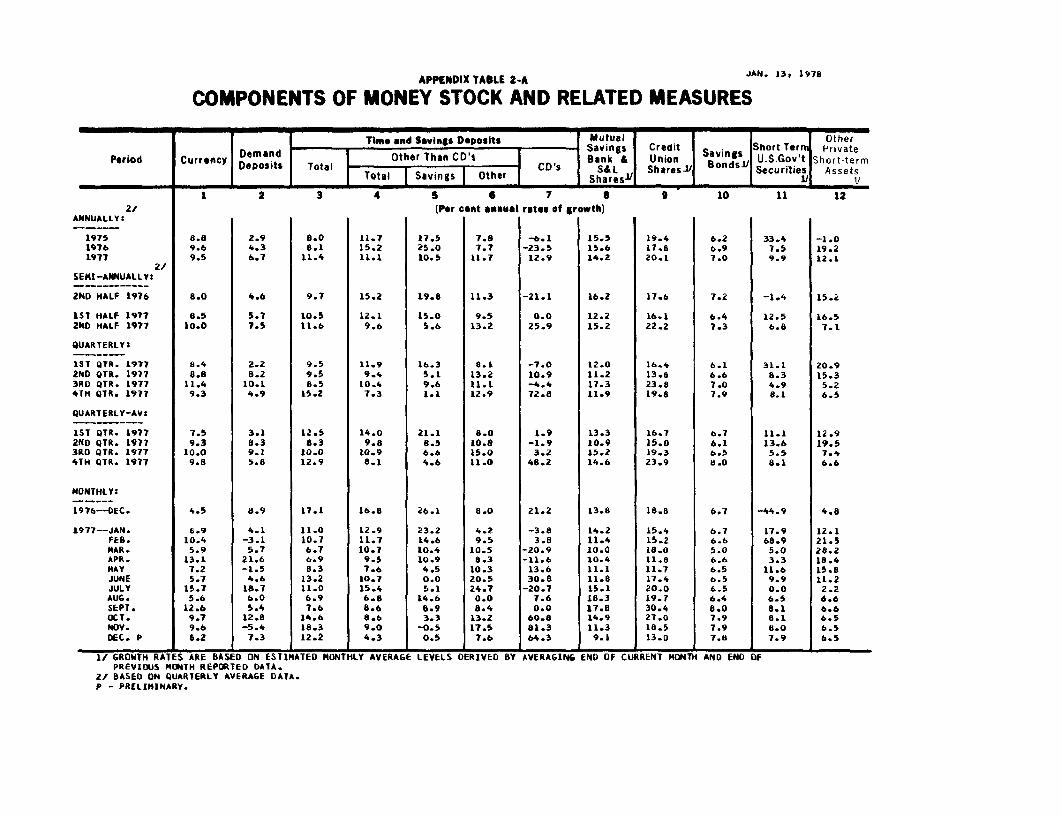
APPENDIX TABLE 2-A JAN. 13, 1978
COMPONENTS OF MONEY STOCK AND RELATED MEASURES
Time and Savings Deposits Mutual Other------ Savings Credit Short Terr Private
Period Currency Demand Other Than CD's Bank & Union Savings U.S.Gov't Short-termDeposits Total Total Savings Other CD's S&aL Shares / BondslJ Securities Assets.... Shares1 1 i
1 2 3 4 5 6 7 8 9 10 11 122/ (Per cent annual rates of growth)
ANNUALLY:
1975 8.8 2.9 8.0 11.7 17.5 7.8 -6.1 15.5 19.4 6.2 33.4 -1.01976 9.6 4.3 8.1 15.2 25.0 7.7 -23.5 15.6 17.6 6.9 7.5 19.21977 9.5 6.7 11.4 11.1 10.5 11.7 12.9 14.2 20.1 7.0 9.9 12.1
2/SEMI-ANNUALLY:
2ND HALF 1976 8.0 4.6 9.7 15.2 19.8 11.3 -21.1 16.2 17.6 7.2 -1.4 15.2
1ST HALF 1977 8.5 5.7 10.5 12.1 15.0 9.5 0.0 12.2 16.1 6.4 12.5 16.52ND HALF 1977 10.0 7.5 11.6 9.6 5.6 13.2 25.9 15.2 22.2 7.3 6.8 7.1
QUARTERLY
1ST OTR. 1977 8.4 2.2 9.5 11.9 16.3 8.1 -7.0 12.0 16.4 6.1 31.1 20.92ND QTR. 1977 8.8 8.2 9.5 9.4 5.1 13.2 10.9 11.2 13.8 6.6 8.3 15.33RD QTR. 1977 11.4 10.1 8.5 10.4 9.6 11.1 -4.4 17.3 23.8 7.0 4.9 5.24TH QTR. 1977 9.3 4.9 15.2 7.3 1.1 12.9 72.8 11.9 19.8 7.9 8.1 6.5
QUARTERLY-AVt
1ST QTR. 1977 7.5 3.1 12.5 14.0 21.1 8.0 1.9 13.3 16.7 6.7 11.1 12.92ND QTR. 1977 9.3 8.3 8.3 9.8 8.5 10.8 -1.9 10.9 15.0 6.1 13.6 19.53R0 QTR. 1977 10.0 9.1 10.0 10.9 6.6 15.0 3.2 15.2 19.3 6.5 5.5 7.44TH QTR. 1977 9.8 5.8 12.9 8.1 4.6 11.0 48.2 14.6 23.9 8.0 8.1 6.6
MONTHLY:
1976--DEC. 4.5 8.9 17.1 16.8 26.1 8.0 21.2 13.8 18.8 6.7 -44.9 4.8
1977--JAN. 6.9 4.1 11.0 12.9 23.2 4.2 -3.8 14.2 15.4 6.7 17.9 12.1FEB. 10.4 -3.1 10.7 11.7 14.6 9.5 3.8 11.4 15.2 6.6 68.9 21.5MAR. 5.9 5.7 6.7 10.7 10.4 10.5 -20.9 10.0 18.0 5.0 5.0 28.2APR. 13.1 21.6 6.9 9.5 10.9 8.3 -11.6 10.4 11.8 6.6 3.3 18.4MAY 7.2 -1.5 8.3 7.6 4.5 10.3 13.6 11.1 11.7 6.5 11.6 15.8JUNE 5.7 4.6 13.2 10.7 0.0 20.5 30.8 11.8 17.4 6.5 9.9 11.2JULY 15.7 18.7 11.0 15.4 5.1 24.7 -20.7 15.1 20.0 6.5 0.0 2.2AUG. 5.6 6.0 6.9 6.8 14.6 0.0 7.6 18.3 19.7 6.4 6.5 6.6SEPT. 12.6 5.4 7.6 8.6 6.9 8.4 0.0 17.8 30.4 8.0 8.1 6.6OCT. 9.7 12.8 14.6 8.6 3.3 13.2 60.8 14.9 27.0 7.9 8.1 6.5NOV. 9.6 -5.4 18.3 9.0 -0.5 17.5 81.3 11.3 18.5 7.9 8.0 6.5DEC. P 6.2 7.3 12.2 4.3 0.5 7.6 64.3 9.1 13.0 7.8 7.9 6.5
1/ GROWTH RATES ARE BASED ON ESTIMATED MONTHLY AVERAGE LEVELS DERIVED BY AVERAGING END OF CURRENT MONTH AND END OFPREVIOUS MONTH REPORTED DATA.
2/ BASED ON QUARTERLY AVERAGE DATA.P - PRELIMINARY.
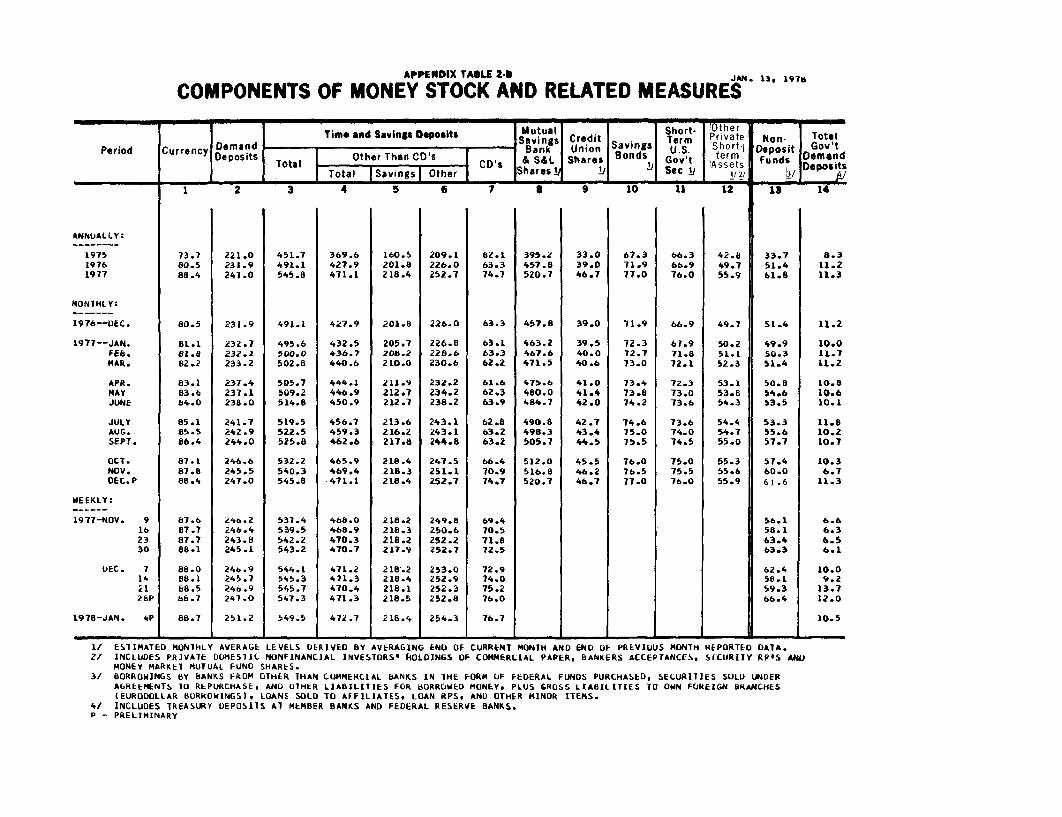
APPENDIX TABLE 2-B JAN. 13, 1978
COMPONENTS OF MONEY STOCK AND RELATED MEASURES
Time and Savings Deposits Mutual Short. Other ISavings Credit Term Private Non- Total
Period Currency Demand ank Union Savings U.S. Short Deposit Gov'tDeposits Other Thn CD's CDs & S&L Shares Bonds Gov't term Fund Demand
Total CD's i Assets DepositsT ans teSharescI 1/2/ 1 /Tota Iiv s Ote I /I -y -- I A
ANNUALLY:
197519761977
MONTHLY:
1976--DEC.
1977--JAN.FE6.MAR.
APR.MAYJUNE
JULYAUG.SEPT.
OCT.NOV.DEC.P
WEEKLY:
1977-NOV. 9162330
DEC. 7142128P
1978-JAN. 4P
1 2 3 4 5 6 7 B 9 10 11 12
221.0231.9247.0
231.9
232.7232.1233.2
237.4237.1238.0
241.7242.9244.0
246.6245.5247.0
246.2246.4243.8245.1
246.9245.7246.9247.0
251.2
451.7491.1545.8
491.1
495.6500.0502.8
505.7509.2514.8
519.5522.5525.8
532.2540.3545.8
537.4539.5542.2543.2
544.1545.3545.7547.3
549.5
369.6427.9471.1
427.9
432.5436.7440.6
444.1446.9450.9
456.7459.3462.6
465.9469.4471.1
466.0468.9470.3470.7
471.2471.3470.4471.3
472.7
160.5201.8218.4
201.8
205.7208.2210.0
211.9212.7212.7
213.6216.2217.8
218.4218.3218.4
218.2218.3218.2217.9
218.2218.4218.1218.5
218.4
209.1226.0252.7
226.0
226.8228.6230.6
232.2234.2238.2
243.1243.1244.8
247.5251.1252.7
249.8250.6252.2252.7
253.0252.9252.3252.8
254.3
82.163.374.7
63.3
63.163.362.2
61.662.363.9
62.863.263.2
66.4
70.974.7
69.470.571.872.5
72.974.075.276.0
76.7
395.2457.8520.7
457.8
463.2467.6471.5
475.6480.0484.7
490.8498.3505.7
512.0516.8520.7
33.039.046.7
39.0
39.540.040.6
41.041.442.0
42.743.444.5
45.546.246.7
67.371.977.0
71.9
72.372.773.0
73.473.874.2
74.675.075.5
76.076.577.0
66.366.976.0
66.9
67.971.872.1
72.373.073.6
73.674.074.5
75.075.576.0
73.780.588.4
80.5
81.181.882.2
83.183.664.0
85.185.586.4
87.187.888.4
87.687.787.788.1
88.088.188.5b6.7
88.7
42.849.755.9
49.7
50.251.152.3
53.153.854.3
54.454.755.0
55.355.655.9
13 14
33.751.461.8
51.4
49.950.351.4
50.854.653.5
53.355.657.7
57.460.0
61.6
56.158.163.463.3
62.458.159.366.4
8.311.211.3
11.2
10.011.711.2
10.810.610.1
11.810.210.7
10.36.7
11.3
6.66.3
6.56.1
10.09.2
13.712.0
10.5
I/ ESTIMATED MONTHLY AVERAGE LEVELS DERIVED BY AVERAGING END OF CURRENT MONTH AND END OF PREVIOUS MONTH REPORTED DATA.2/ INCLUDES PRIVATE DOMESTIC NONFINANCIAL INVESTORS' fOLDINGS OF COMMERCIAL PAPER, BANKERS ACCEPTANCES, SECURITY RP'S AND
MONEY MARKET MUTUAL FUND SHARES.3/ BORROWINGS BY BANKS FROM OTHER THAN COMMERCIAL BANKS IN THE FORM OF FEDERAL FUNDS PURCHASED, SECURITIES SOLD UNDER
AGREEMENTS TO REPURCHASE, AND OTHER LIABILITIES FOR BORROWED MONEY, PLUS GROSS LIABILITIES TO OWN FOREIGN BRANCHES(EURODOLLAR BDRROWINGS), LOANS SOLD TO AFFILIATES, LOAN RPS, AND OTHER MINOR ITEMS.
4/ INCLUDES TREASURY DEPOSITS AT MEMBER BANKS AND FEDERAL RESERVE BANKS.P - PRELIMINARY
APPENDIX TABLE 2-A JAN. 13, 1978COMPONENTS OF MONEY STOCK AND RELATED MEASURES
Corrected Copy
Time and Savings Deposits Mutual OtherSavings Credit Short Term Private
Period Currency Demand Other Than CD's Bank & Union andsls U.SGov't Short termDeposits Total CD's S&L Shares- Bo Securities Assets
Total Savings Other Shares 11/
1 2 3 4 5 6 7 8 9 10 11 12
ANNUALLY:
157519761977
SEMI-ANNUALLY:
2ND HALF 1976
1ST HALF 19772ND HALF 1977
QUARTERLY:
IST QTR. 19772ND OTR. 19773RD QTR. 19774TH QTR. 1977
QUARTERLY-AV:
1ST QTR. 19772ND QTR. 19773RD QTR. 19774TH QTR. 1977
MONTHLY:
1976--0EC.
1977--JAN.FEB.MAR.APR.MAYJUNEJULYAUG.SEPT.OCT.NOV.DEC. P
6.89.69.5
8.0
8.510.0
8.48.8
11.49.3
7.59.310.09.8
4.5
8.910.45.9
13.17.25.7
15.75.6
12.69.79.66.2
2.94.36.7
4.6
5.77.5
2.28.2
10.14.9
3.18.39.15.8
6.9
4.1-3.15.7
21.6-1.54.6
18.76.05.4
12.8-5.47.3
8.08.1
11.4
9.7
10.511.6
9.59.58.5
15.2
12.58.3
10.012.9
17.1
11.010.76.76.98.3
13.211.06.97.6
14.618.312.2
11.715.211.1
15.2
12.19.6
11.99.4
10.47.3
14.09.8
10.98.1
16.8
12.911.710.79.57.6
10.715.46.88.68.69.04.3
17.525.010.5
19.8
15.05.6
16.35.19.61.1
21.18.56.64.6
26.1
23.214.610.410.94.50.05.1
14.68.93.3
-0.50.5
(Per cent annual rates of
7.87.7
11.7
11.3
9.513.2
8.113.211.112.9
8.010.815.011.0
8.0
4.29.5
10.58.3
10.320.524.7
0.08.4
13.217.57.6
-6.1-23.512.9
-21.1
0.025.9
-7.0
10.9-4.472.8
1.9-1.93.2
48.2
21.2
-3.83.8
-20.9-11.613.630.8
-20.77.60.060.881.364.3
growth)
15.515.614.2
16.2
12.215.2
12.011.217.311.9
13.310.915.214.6
13.8
14.211.410.010.411.111.815.118.317.814.9
11.39.1
19.417.620.1
17.6
16.122.2
16.413.823.819.8
16.715.019.323.9
18.8
15.415.218.011.811.717.420.019.730.427.018.513.0
33.47.59.9
-1.4
12.56.
31.16.34.98.1
11.113.6
5.58.1
-44.9
17.966.9
5.03.3
11.69.90.06.58.18.18.07.9
I I i I - a a & a a1/ GROWTH RATES ARE BASED ON ESTIMATED MONTHLY AVERAGE
PREVIOUS MONTH REPORTED DATA.2/ BASED ON QUARTERLY AVERAGE DATA.B - DI TMTMAODV
LEVELS DERIVED BY AVERAGING END OF CURRENT MONTH AND ENL OF
-1.019.i
1e.1
15.2
16.57.1
20.915.36.26.5
12.919.5
7.46.6
4.8
12.121.528.218.415.811.22.26.66.66.56.56.5