Embed Size (px)
Citation preview
Prefatory Note
The attached document represents the most complete and accurate version available based on original copies culled from the files of the FOMC Secretariat at the Board of Governors of the Federal Reserve System. This electronic document was created through a comprehensive digitization process which included identifying the best-preserved paper copies, scanning those copies,1 and then making the scanned versions text-searchable.2 Though a stringent quality assurance process was employed, some imperfections may remain.
Please note that this document may contain occasional gaps in the text. These gaps are the result of a redaction process that removed information obtained on a confidential basis. All redacted passages are exempt from disclosure under applicable provisions of the Freedom of Information Act.
1 In some cases, original copies needed to be photocopied before being scanned into electronic format. All scanned images were deskewed (to remove the effects of printer- and scanner-introduced tilting) and lightly cleaned (to remove dark spots caused by staple holes, hole punches, and other blemishes caused after initial printing). 2 A two-step process was used. An advanced optimal character recognition computer program (OCR) first created electronic text from the document image. Where the OCR results were inconclusive, staff checked and corrected the text as necessary. Please note that the numbers and text in charts and tables were not reliably recognized by the OCR process and were not checked or corrected by staff.
Strictly Confidential (FR)
MONETARY POLICY ALTERNATIVES
Prepared for the Federal Open Market Committee
Board of Governors of the Federal Reserve System
Class I FOMC
By the staff

Strictly Confidential (FR)Class I - FOMC January 29, 1993
MONETARY POLICY ALTERNATIVES
Recent Developments
(1) The degree of reserve pressure was left unchanged over
the intermeeting period, with the intended level of the federal funds
rate remaining at 3 percent and the allowance for adjustment and sea-
sonal borrowing at $50 million. In the last week of 1992, the federal
funds rate was somewhat volatile, reflecting shifting market antici-
pations of year-end pressures and sizable swings in market factors
affecting reserves. However, the Desk ensured that reserves were abun-
dant in the maintenance period spanning year-end, and the funds rate
did not show any unusual tightness on December 31 itself. For the
intermeeting period as a whole, the federal funds rate averaged 2.99
percent.
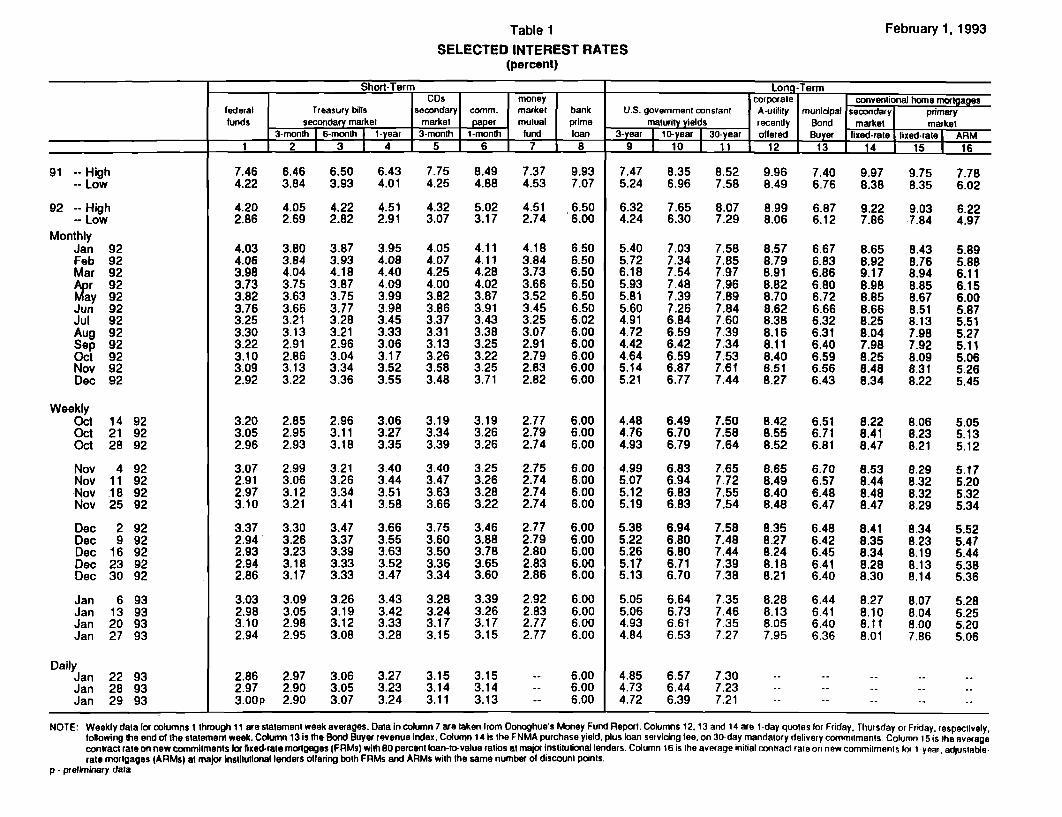
(2) Most short-term interest rates fell 20 to 25 basis points
over the intermeeting period, although somewhat larger drops were re-
corded at the one-month maturity. The declines partly reflected the
passing of the year-end statement date, and a return toward more normal
relationships with the federal funds rate. With labor market indi-
cators suggesting somewhat less strength than market participants had
expected, money supply data weakening, and discussions of near-term
fiscal stimulus centering on quite moderate numbers, market partici-
pants appear to be scaling back the odds on significant Federal Reserve
tightening over the next year or so. Consequently, intermediate-term
1. Adjustment and seasonal borrowing averaged $235 million overthe maintenance periods ending January 6 and January 20, well aboveallowance. The overage reflected a substantial need for funds by onenonbank bank over the long New Year's weekend and a surge in borrowingat the end of the January 20 maintenance period, as extremely heavytax receipts pushed the Treasury's balance far above projections.Borrowing has been closer to expected levels recently, averaging $77million to date in the current maintenance period.
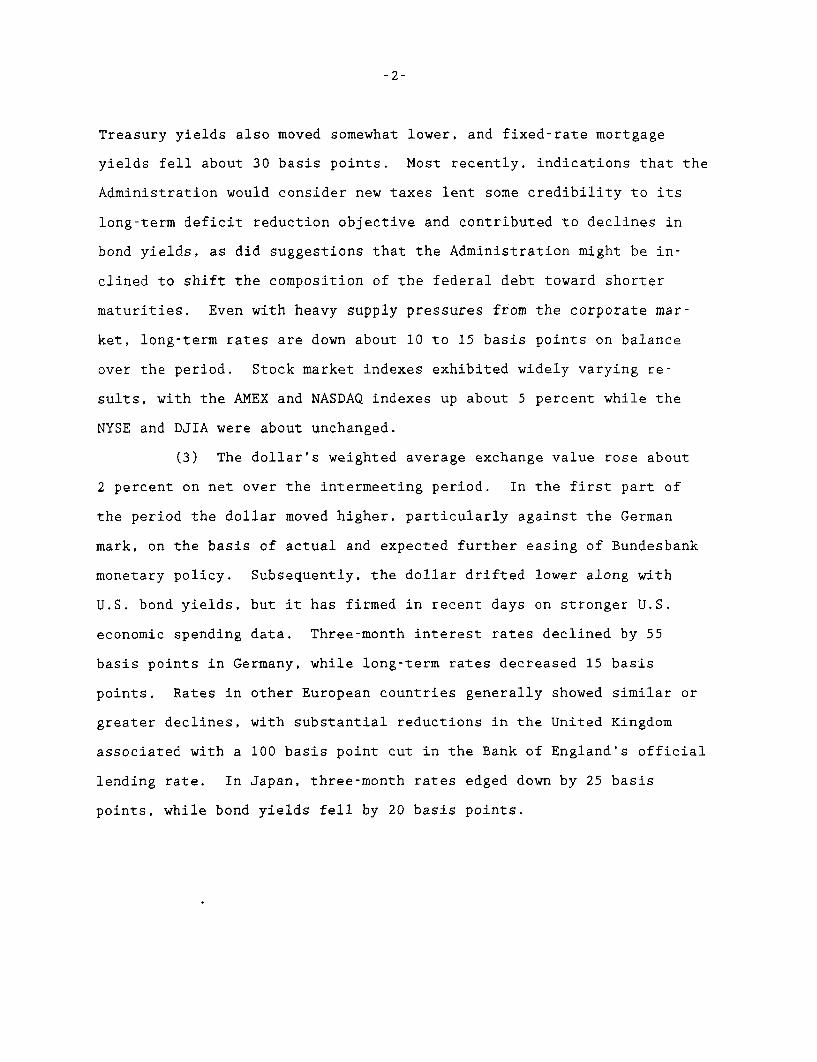
Treasury yields also moved somewhat lower, and fixed-rate mortgage
yields fell about 30 basis points. Most recently, indications that the
Administration would consider new taxes lent some credibility to its
long-term deficit reduction objective and contributed to declines in
bond yields, as did suggestions that the Administration might be in-
clined to shift the composition of the federal debt toward shorter
maturities. Even with heavy supply pressures from the corporate mar-
ket, long-term rates are down about 10 to 15 basis points on balance
over the period. Stock market indexes exhibited widely varying re-
sults, with the AMEX and NASDAQ indexes up about 5 percent while the
NYSE and DJIA were about unchanged.
(3) The dollar's weighted average exchange value rose about
2 percent on net over the intermeeting period. In the first part of
the period the dollar moved higher, particularly against the German
mark, on the basis of actual and expected further easing of Bundesbank
monetary policy. Subsequently, the dollar drifted lower along with
U.S. bond yields, but it has firmed in recent days on stronger U.S.
economic spending data. Three-month interest rates declined by 55
basis points in Germany, while long-term rates decreased 15 basis
points. Rates in other European countries generally showed similar or
greater declines, with substantial reductions in the United Kingdom
associated with a 100 basis point cut in the Bank of England's official
lending rate. In Japan, three-month rates edged down by 25 basis
points, while bond yields fell by 20 basis points.
(4) After showing some strength in the late summer and autumn
of last year, the broader monetary aggregates contracted over December
and January--a considerably weaker showing than had been projected in
the December bluebook.2 M2 declined at about a 2 percent annual
rate over December and January, and M3 at about a 4-1/2 percent rate.
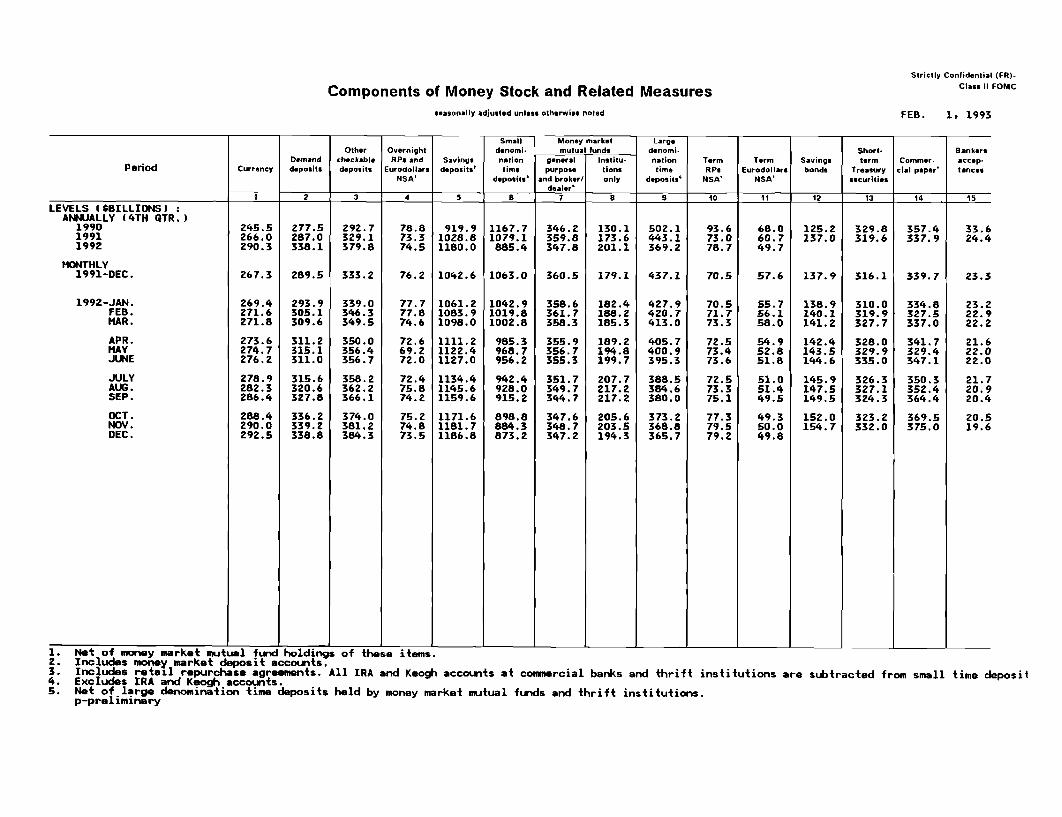
(5) The unexpected weakness in the broader aggregates in the
last two months entirely reflected sizable and larger-than-projected
declines in their nontransaction components. Growth of M1 also slowed,
to an average 8 percent rate, but a deceleration had been expected,
based partly on special factors. Demand deposit growth plunged on
lower mortgage refinancing activity, and other checkable deposits
slowed in December because unwinding of its sweep account
program had been completed. Currency growth, however, strengthened,
apparently as a result of large shipments of currency abroad.
Within the nontransaction component of M2, the runoff of small time
deposits slackened a bit, but expansion of savings and MMDAs slowed
abruptly and money market mutual fund assets declined more rapidly.
Anecdotal information suggests that flows into bond and stock mutual
funds fell off somewhat in December, but remained fairly robust. The
extent of the weakness in the liquid nontransaction components is
surprising. While some of this weakness may have been due to earlier
widening in opportunity costs, as yields on these components failed to
match increases in market rates this fall, the timing of the declines
2. The monetary data presented in this bluebook incorporate theresults of the annual benchmark and seasonal review--discussed inAppendix A--and should be treated as strictly confidential until theirrelease to the public, tentatively planned for February 4. TheDecember bluebook projections, of course, were done on the old basis,but weakness in money is apparent on the revised basis as well.
3. Reflecting the brisk growth in Ml deposits, total reserves roseat a 5 percent pace over the November-January period, and the monetarybase expanded at a 9-1/4 percent rate.
suggests that unusually large tax payments and holiday purchases also
may have played a role. At the M3 level, the drop-off in large time
deposits accelerated around year-end, likely reflecting efforts by
banks and thrifts to improve balance-sheet ratios and reduce deposit-
insurance premiums. Reliance on managed liabilities in M3 was held
down by weakness in bank credit in December and January and greater use
of funds raised in bond and equity markets. Declines in M3 also were a
result of a steep drop in institution-only money fund shares owing to
interest rate incentives around year-end.
(6) The growth of nonfederal debt appears to have remained
subdued, below the pace of spending, suggesting that households and
business remain cautious in their attitudes toward debt. In the busi-
ness sector, bond issuance has picked up in December and January, but
shorter-term business borrowing has dropped off on balance, perhaps
owing partly to reduced needs to finance retail inventories. Consumer
credit likely rose a little in December, reflecting a modest pickup in
revolving credit. Although mortgage refinancing activity has declined
on balance over the past two months, its pace remained brisk. With
mortgage borrowing likely supported by equity extraction in the course
of refinancing as well by strong existing home sales, mortgage debt
likely has continued to expand at a healthy clip. Federal borrowing
remained heavy in December, boosting overall debt growth to a 6-1/2
percent pace.
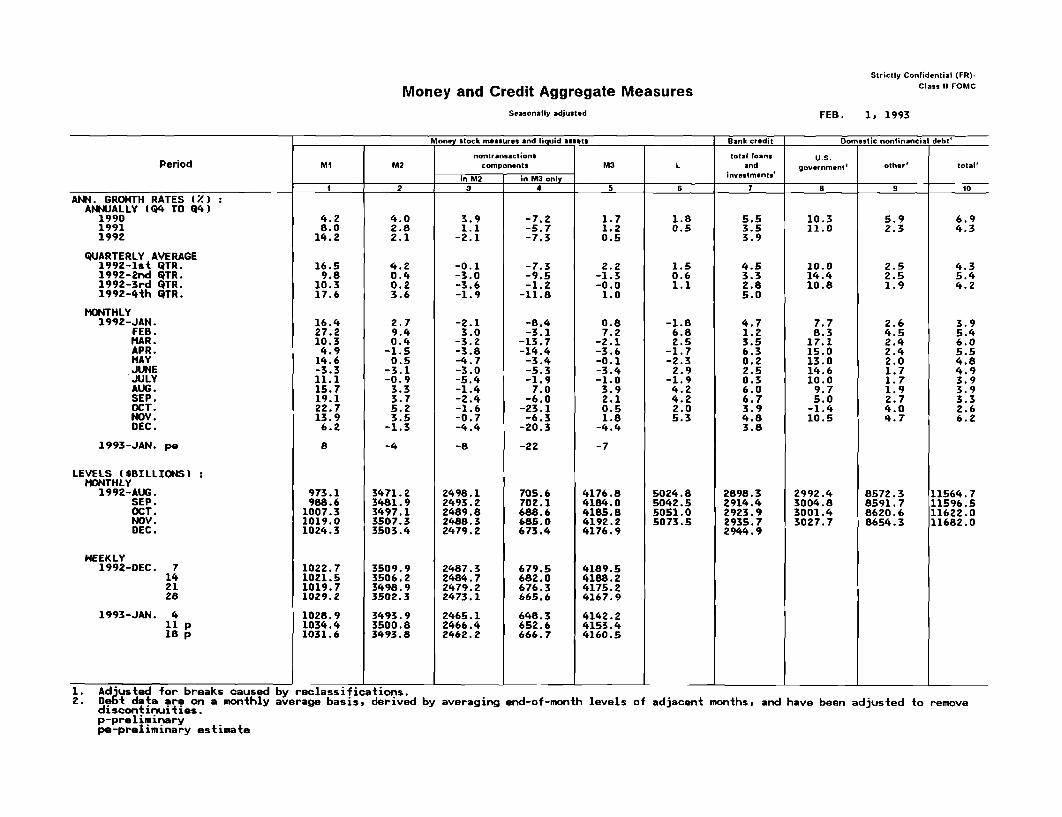
(7) The table below shows final results for growth of the
money and debt aggregates for 1992, incorporating new benchmarks and
seasonal factors. For 1992 as a whole, the aggregates expanded at very
sluggish rates. M2 and M3 rose 1.9 and 0.5 percent, respectively,
leaving both aggregates about 1/2 percentage point below the lower
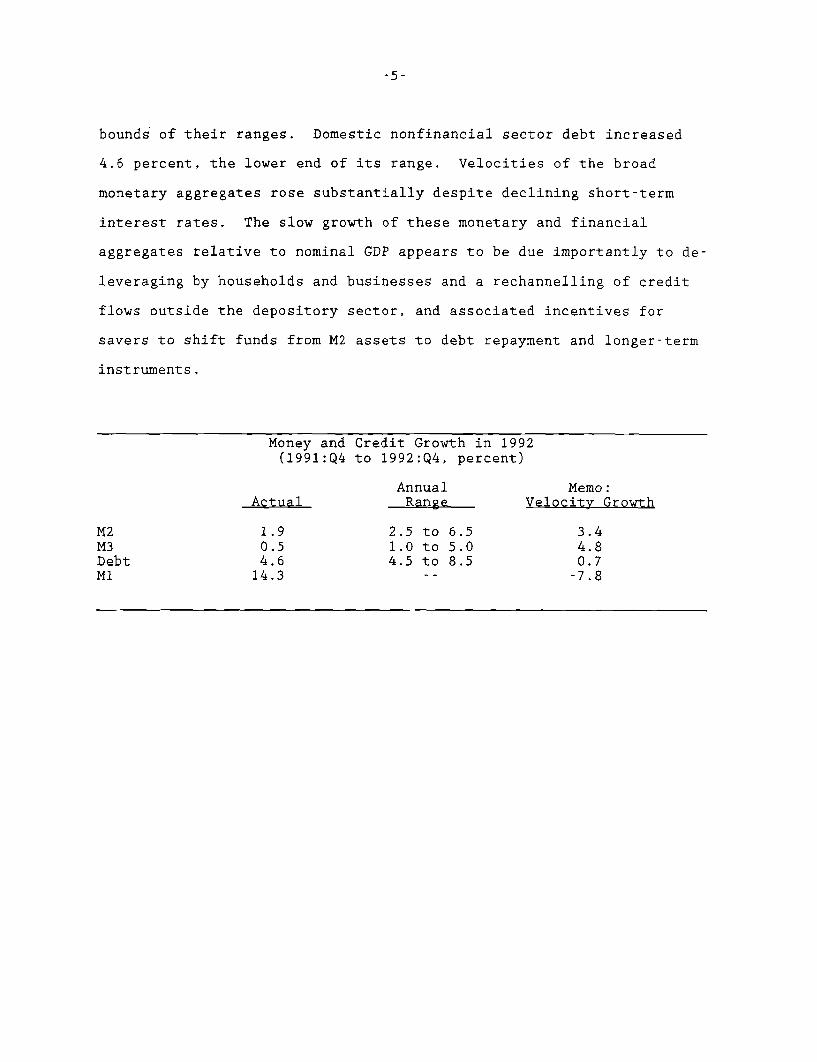
bounds of their ranges. Domestic nonfinancial sector debt increased
4.6 percent, the lower end of its range. Velocities of the broad
monetary aggregates rose substantially despite declining short-term
interest rates. The slow growth of these monetary and financial
aggregates relative to nominal GDP appears to be due importantly to de-
leveraging by households and businesses and a rechannelling of credit
flows outside the depository sector, and associated incentives for
savers to shift funds from M2 assets to debt repayment and longer-term
instruments.
Money and Credit Growth in 1992(1991:Q4 to 1992:Q4, percent)
Annual Memo:Actual Range Velocity Growth
M2 1.9 2.5 to 6.5 3.4M3 0.5 1.0 to 5.0 4.8Debt 4.6 4.5 to 8.5 0.7M1 14.3 -- -7.8
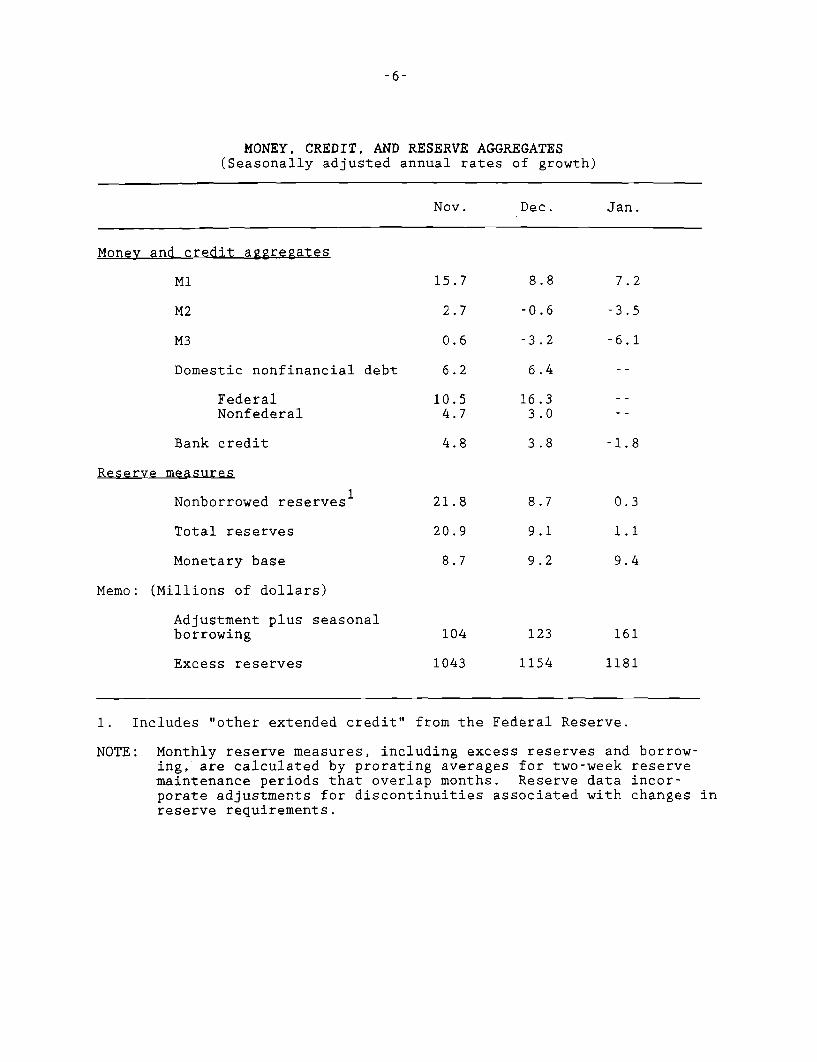
MONEY, CREDIT, AND RESERVE AGGREGATES(Seasonally adjusted annual rates of growth)
Nov. Dec. Jan.
Money and credit aggregates
M1 15.7 8.8 7.2
M2 2.7 -0.6 -3.5
M3 0.6 -3.2 -6.1
Domestic nonfinancial debt 6.2 6.4
Federal 10.5 16.3Nonfederal 4.7 3.0
Bank credit 4.8 3.8 -1.8
Reserve measures
Nonborrowed reserves 21.8 8.7 0.3
Total reserves 20.9 9.1 1.1
Monetary base 8.7 9.2 9.4
Memo: (Millions of dollars)
Adjustment plus seasonalborrowing 104 123 161
Excess reserves 1043 1154 1181
1. Includes "other extended credit" from the Federal Reserve.
NOTE: Monthly reserve measures, including excess reserves and borrow-ing, are calculated by prorating averages for two-week reservemaintenance periods that overlap months. Reserve data incor-porate adjustments for discontinuities associated with changes inreserve requirements.
Alternative Long-run Strategies
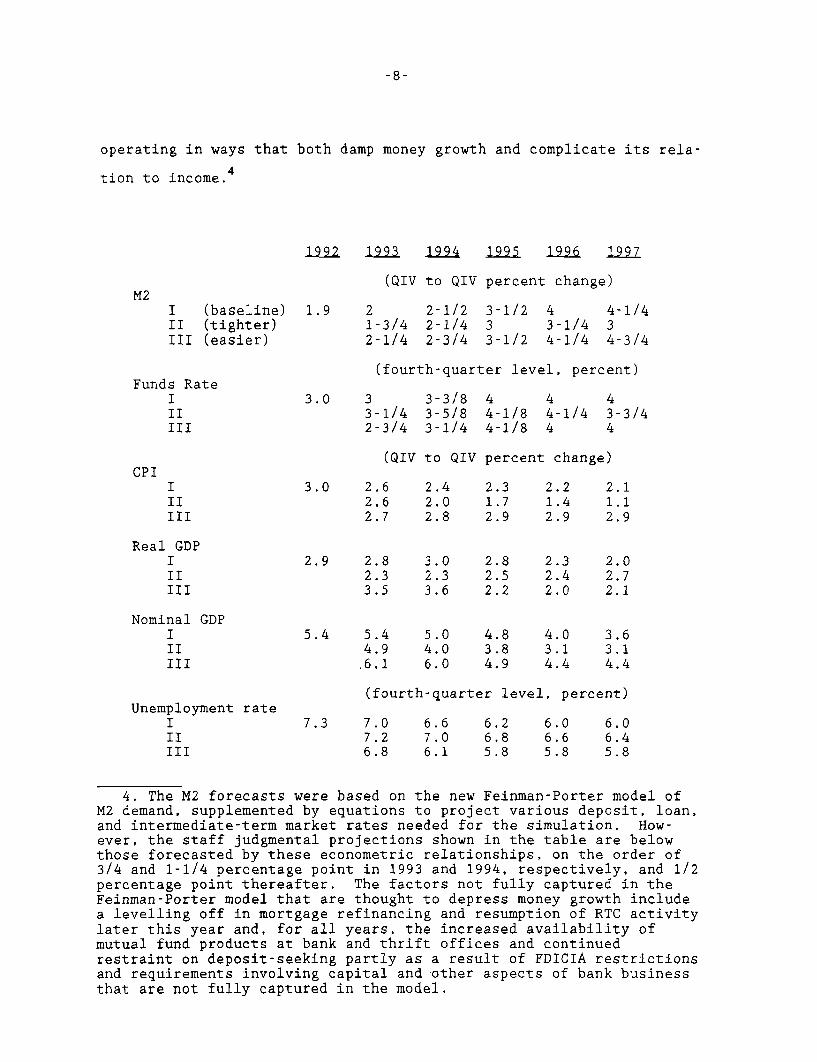
(8) To place the consideration of the annual ranges for money
and credit for 1993 in a longer perspective, the table on the following
page presents three alternative five-year monetary policy strategies,
together with the consequences for output, prices, and resource utili-
zation. The baseline strategy, labelled I in the table, judgmentally
extends the greenbook forecast for 1993 and 1994 through 1997. It
retains the assumption of no short-run fiscal stimulus, and posits
gradual progress through the entire period in reducing the structural
deficit as a ratio to GDP; these assumptions also are retained in the
simulations shown for the two alternative monetary policy strategies.
The simulations incorporate the staff's assessment that potential GDP
will grow at a 2-1/4 percent rate, benefiting from a small boost to
productivity relative to recent years. The natural rate of unemploy-
ment is seen currently as 6 percent, elevated by the labor market mis-
matches resulting from sizable industry restructuring--especially in
the defense sector--but edges back down to 5-3/4 percent later in the
simulation as the pace of restructuring wanes. M2 growth paths for the
baseline and the two alternative strategies reflect our expectation
that special forces will continue to depress M2 relative to spending,
albeit with diminishing intensity. Influences captured in the expanded
view of the determinants of opportunity costs--returns on capital mar-
ket instruments, loan rates, and a wider array of deposit rates, as
well as short-term market rates--along with other forces will be
operating in ways that both damp money growth and complicate its rela-
tion to income.
(QIV to QIV percent change)
I (baseline)II (tighter)III (easier)
Funds RateIIIIII
1.9 21-3/42-1/4
2-1/22-1/42-3/4
3-1/2 4 4-1/43 3-1/4 33-1/2 4-1/4 4-3/4
(fourth-quarter level, percent)
3.0 33-1/42-3/4
3-3/83-5/83-1/4
4 4 44-1/8 4-1/4 3-3/44-1/8 4 4
(QIV to QIV percent change)
3.0 2.6 2.4 2.3 2.2 2.12.6 2.0 1.7 1.4 1.12.7 2.8 2.9 2.9 2.9
2.9 2.8 3.0 2.8 2.3 2.02.3 2.3 2.5 2.4 2.73.5 3.6 2.2 2.0 2.1
Nominal GDPIIIIII
5.4 5.44.9,6.1
5.0 4.84.0 3.86.0 4.9
4.0 3.63.1 3.14.4 4.4
Unemployment rateIIIIII
(fourth-quarter level, percent)
7.3 7.07.26.8
6.6 6.2 6.0 6.07.0 6.8 6.6 6.46.1 5.8 5.8 5.8
4. The M2 forecasts were based on the new Feinman-Porter model ofM2 demand, supplemented by equations to project various deposit, loan,and intermediate-term market rates needed for the simulation. How-ever, the staff judgmental projections shown in the table are belowthose forecasted by these econometric relationships, on the order of3/4 and 1-1/4 percentage point in 1993 and 1994, respectively, and 1/2percentage point thereafter. The factors not fully captured in theFeinman-Porter model that are thought to depress money growth includea levelling off in mortgage refinancing and resumption of RTC activitylater this year and, for all years, the increased availability ofmutual fund products at bank and thrift offices and continuedrestraint on deposit-seeking partly as a result of FDICIA restrictionsand requirements involving capital and other aspects of bank businessthat are not fully captured in the model.
CPIIIIIII
Real GDPIIIIII
1992 1993 1994 1995 1996 1997
(9) The policy alternatives encompass somewhat tighter
(Strategy II) and somewhat easier (Strategy III) monetary policies,
which produce discernable differences in output and inflation over the
5-year simulation period. The difference in policy--measured by inter-
est rates or money supplies--are narrower than in similar exercises in
past bluebooks. In part this reflects the current configuration of a
relatively low inflation rate and a moderate gap between the unemploy-
ment rate and the natural rate of unemployment. In these circumstances
major differences in policy would result in deflation or a significant
acceleration of inflation. In addition, we have assumed a faster
response of long-term interest rates to changes in the federal funds
rate than is usually embodied in the quarterly econometric model, which
produces a greater response of spending for a given change in the
federal funds rate. The money growth differences are especially nar-
row, as a result of the low responsiveness of M2 demand to change in
short-term interest rates in the Feinman-Porter model.
(10) The baseline strategy provides a gradual deceleration of
inflation as measured by the consumer price index to around 2 percent
by 1997. Nominal short-term rates rise somewhat by 1995 under this
alternative, and remain flat thereafter. Declining inflation at the
same time implies more appreciable increases in real short-term rates.
As credit becomes more freely available and other unusual forces damp-
ing spending wane, the rise in short-term real rates is necessary to
restrain output to its potential. With the disinflation becoming em-
bedded in expectations, long-term nominal rates remain on a downward
trajectory, dropping below 6 percent by 1995. The resulting sizable
flattening of the yield curve, together with the improvement in bank
and household balance-sheet positions as the recovery proceeds, tends
-10-
to boost M2 demand, implying the need for a pickup in money growth in
later years even as expansion in nominal spending continues to slow
gradually.
(11) Strategy II embodies a somewhat tighter monetary policy
to produce reasonable price stability by the end of the simulation
period. To do this, policy tightens more promptly than under alterna-
tive I, keeping the federal funds rate above and money growth below the
baseline case for most of the period. Real rates are substantially
higher than in the baseline, given the faster decline in inflation,
maintaining considerable slack in resource utilization. The unemploy-
ment rate declines very little until late in the simulation. More
rapid declines would be possible if this policy reinforced the credi-
bility of the System's price stability objective, producing more rapid
decline in inflation expectations.
(12) Under the easier Strategy III, the economy would return
to full employment more quickly, but progress in disinflation would
end. Under this policy, money growth exceeds the baseline path by
about 1/4 point on average over the simulation period. Short-term
interest rates decline in the near term and remain below the baseline
path for a time. As a consequence, output is boosted to a 3-1/2 per-
cent rate of expansion in both 1993 and 1994. However, to keep infla-
tion from accelerating, policy must reverse before too long, with
short-term rates rising in the first part of next year and moving above
the baseline path in 1995.
-11-
Long-Run Ranges for 1993
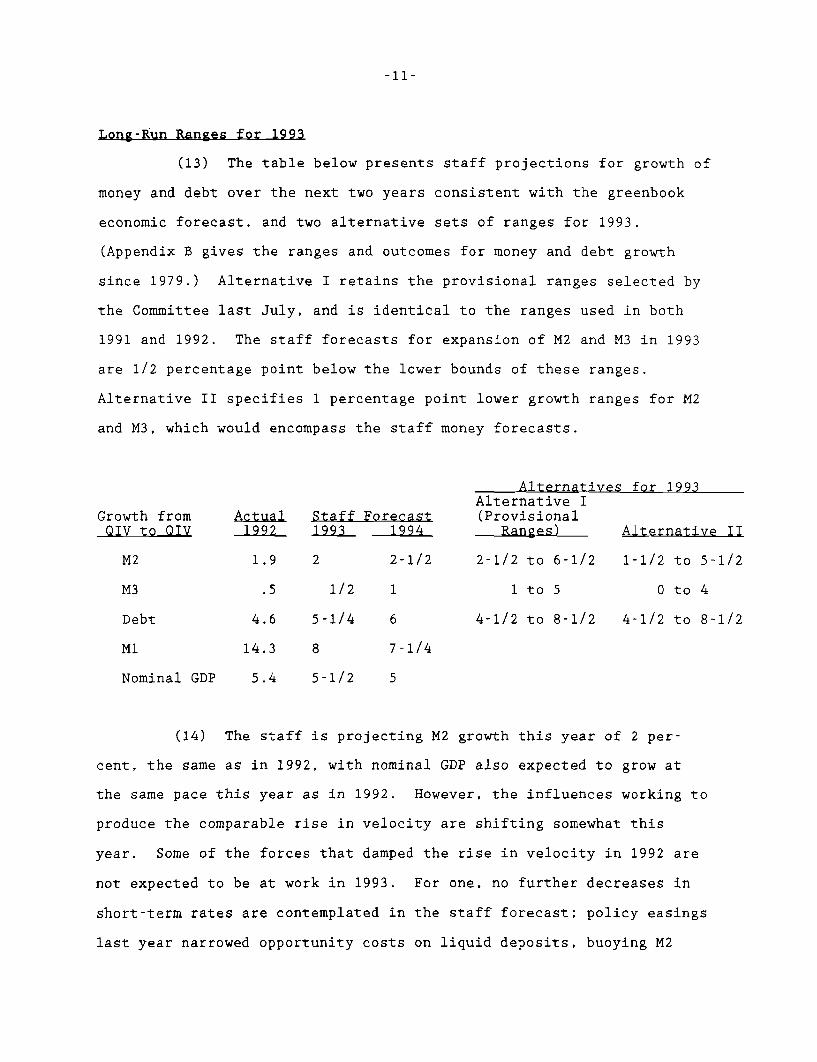
(13) The table below presents staff projections for growth of
money and debt over the next two years consistent with the greenbook
economic forecast, and two alternative sets of ranges for 1993.
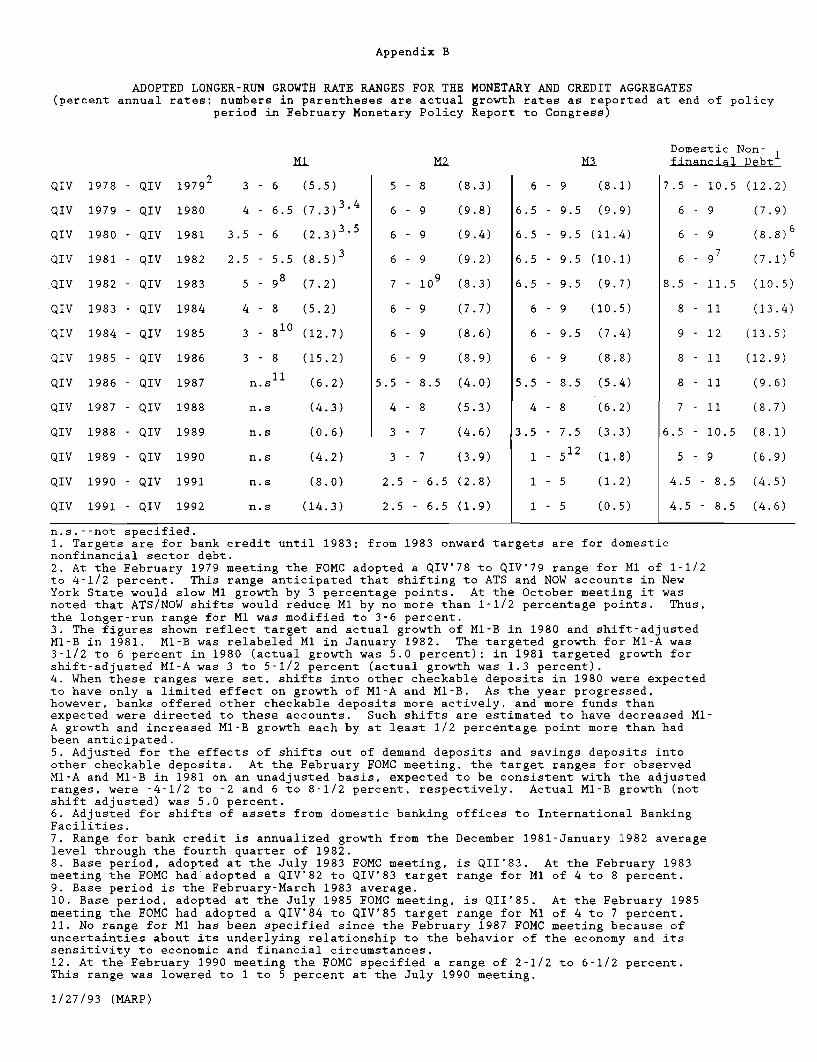
(Appendix B gives the ranges and outcomes for money and debt growth
since 1979.) Alternative I retains the provisional ranges selected by
the Committee last July, and is identical to the ranges used in both
1991 and 1992. The staff forecasts for expansion of M2 and M3 in 1993
are 1/2 percentage point below the lower bounds of these ranges.
Alternative II specifies 1 percentage point lower growth ranges for M2
and M3, which would encompass the staff money forecasts.
Alternatives for 1993Alternative I
Growth from Actual Staff Forecast (ProvisionalQIV to QIV 1992 1993 1994 Ranges) Alternative II
M2 1.9 2 2-1/2 2-1/2 to 6-1/2 1-1/2 to 5-1/2
M3 .5 1/2 1 1 to 5 0 to 4
Debt 4.6 5-1/4 6 4-1/2 to 8-1/2 4-1/2 to 8-1/2
M1 14.3 8 7-1/4
Nominal GDP 5.4 5-1/2 5
(14) The staff is projecting M2 growth this year of 2 per-
cent, the same as in 1992, with nominal GDP also expected to grow at
the same pace this year as in 1992. However, the influences working to
produce the comparable rise in velocity are shifting somewhat this
year. Some of the forces that damped the rise in velocity in 1992 are
not expected to be at work in 1993. For one, no further decreases in
short-term rates are contemplated in the staff forecast; policy easings
last year narrowed opportunity costs on liquid deposits, buoying M2
growth. In addition, mortgage refinancings are expected to level out,
meaning that last year's boost to M2 growth from this source will
disappear. Finally, RTC resolution activity is assumed to reemerge
after midyear, damping the funding needs of the depository sector.
However, the tendency for these factors to raise velocity in 1993
relative to 1992 will be offset by some diminution in the effects of
some other influences that were boosting velocity in 1992. Among these
will be an abatement of credit restraint by lenders and balance sheet
restructuring by borrowers. Nonetheless, bank lending to businesses
and households, while picking up, is projected to remain damped by
historical standards. Moreover, the pickup in loans will be funded by
reduced bank security acquisitions. As a consequence, banks are not
expected to become significantly more aggressive in pursuing deposits;
retail deposit rates should decline further, partly in response to the
recent fall in short- and intermediate-term Treasury rates. Even so,
the continued downtrend in longer-term interest rates in the staff
forecast should be sufficient to narrow the spread of bond rates over
retail deposit rates, ultimately reducing the relative attractiveness
of capital market instruments, including bond mutual funds. Neverthe-
less, such spreads would stay unusually wide, capital gains on bond
funds would elevate their advertised yields as rates decline, and the
process of stock adjustment to lower desired levels of retail deposits,
particularly small time deposits, probably still has a way to go.
Further reductions in consumer loan rates should cut back on household
incentives to deleverage out of nontransaction M2 balances, though
here, too, spreads would stay wide.
-12-
-13-
(15) With neither further policy easing nor larger mortgage
refinancings, the growth of the M1 component of M2 is expected to de-
cline from 14-1/4 percent last year to 8 percent this year.5 About
offsetting this slowing, the partial unwinding of the influences that
have been depressing the non-M1 component of M2 relative to spending is
expected to mute its contraction over 1993 to 1/2 percent versus 2-1/2
percent last year.
(16) M3 growth this year at 1/2 percent also is projected to
hold at last year's rate. Bank credit is not expected to pick up, as
banks meet greater loan demands by curtailing security acquisitions.
Thrift credit is projected to change little over 1993, after an
appreciable decline last year, despite the anticipated resumption of
RTC resolution activity in the second half. As a consequence, we see
a slower runoff of large time deposits in 1993 compared to 1992. How-
ever, the effects of this on M3 are about counterbalanced by much
smaller inflows to institution-only money funds, which had been boosted
in 1992 by temporary rate advantages brought on by drops in short-term
market interest rates.
(17) Debt of domestic nonfinancial sectors is projected to
pick up to a 5-1/4 percent rate over 1993. On the assumption of no
fiscal stimulus package, federal debt growth is expected to slow to
a 9-1/2 percent rate after last year's 10-3/4 percent pace. Most of
the strengthening in growth of the nonfederal component--from 2-1/2
percent last year to 3-3/4 percent over 1993--is seen as occurring
in the business sector. Business spending on fixed investment and
inventories this year is expected to move above the flow of internally
5. We expect continued sizable flows of currency abroad, especiallyto Eastern Europe and the former Soviet Union, to buoy the growth ofthe monetary base to 9 percent.
-14-
generated funds, and equity issuance is projected to drop back as busi-
nesses feel more comfortable with their financial structures. Last
year's runoff of business loans at banks should reverse, owing partly
to an easing of lending terms prompted by improved bank capital posi-
tions and perceptions of reduced credit risk as the expansion con-
tinues. In the household sector, lowered debt service burdens, further
decreases in consumer credit costs, and improved employment prospects
are anticipated to induce a resumption in consumer credit expansion
after no change on balance last year. The growth of mortgage debt
should hold at around last year's pace as housing construction again
strengthens this year, supported by further declines in fixed-rate
mortgage interest rates.
(18) Alternative II could be preferred if the Committee
viewed further substantial increases in velocities as a likely outcome
in 1993. The continued slow growth in the broader monetary aggregates
since mid-1992 in the face of still lower short-term interest rates and
a speedup of nominal GDP might be seen reinforcing the case for addi-
tional unusual velocity increases this year. Thus, growth of M2 and M3
in the lower portions of the reduced ranges of alternative II could be
viewed as fully compatible with economic outcomes along the lines of
the greenbook projection. And considerable scope would exist for money
growth higher up in the ranges if a more vigorous economic expansion
should emerge or be desired, or if velocity behavior returns more to
normal; even in those cases, growth near the reduced upper ends of the
alternative II ranges seems unlikely. Alternative II also might be
seen as being more consistent than alternative I with the Committee's
intention to move toward price stability over time. If the staff
view of velocity is correct, M2 growth within the alternative I range
-15-
would be consistent with a significant acceleration in nominal income,
forestalling further progress in reducing inflation in 1994. M2 growth
in line with the staff forecast, or even a little higher, would be
sending a much stronger signal to ease reserve conditions under alter-
native I. Moreover, the decrease in the M2 range would renew the
process of reducing those ranges to levels more consistent with rea-
sonable price stability. Alternative II does not include a reduction
in the debt range, despite the staff forecast that debt will grow in
the lower half of the proposed range. If the Committee viewed the
reduction in money ranges as essentially "technical," leaving the debt
range unchanged might reinforce that perception. On the other hand, a
reduction in the debt range would underline the favorable trend toward
reduced leverage.
(19) Alternative I could be selected if the greenbook projec-
tions were viewed as representing an unacceptably weak economic expan-
sion, with an unemployment rate still around 7 percent in the fourth
quarter of this year. Such an objective would be fostered by the
higher money growth and lower interest rates of this alternative.
Alternative I might signal the Federal Reserve's intent to accommodate
the effects on spending of a near-term fiscal stimulus package through
higher money growth. Keeping the range unchanged might also be seen
as better conveying the uncertainty about velocity behavior. The
alternative I ranges would be more consistent with M2 and M3 growth
needed to support the staff GDP projection if velocity were behaving in
line with historical relation to short-term interest rates. The Com-
mittee could choose to retain the current range but announce its
willingness to accept a shortfall if velocity were again to increase
unusually.
-16-
Short-Run Policy Alternatives
(20) Three short-run policy alternatives are presented for
consideration by the Committee. Under alternative B, the allowance for
adjustment and seasonal borrowing would be retained at $50 million, in
association with trading in federal funds continuing to be centered
around 3 percent.6 Under alternative A, the federal funds rate
would drop to 2-1/2 percent; this could be achieved either through a
reduction in the borrowing allowance to $25 million or by a half per-
centage point cut in the discount rate with unchanged borrowing.
Federal funds would trade around 3-1/2 percent under alternative C in
combination with a $25 million boost to the borrowing allowance.
(21) The markets appear to have built in an unchanged policy
in the period just ahead and thus interest rates would be expected to
remain near current levels under alternative B. Longer-term rates
might come under a little downward pressure if, consistent with the
staff greenbook forecast, news on prices continues to be good, and
economic indicators point to a little less momentum in the economic
expansion than in the second half of last year. Intermediate- and
long-term rates are likely to be especially volatile as markets digest
reports and rumors of fiscal initiatives or shifts in debt management
policy by the new Administration, and as they assess how any initia-
tives might influence monetary policy. The upcoming mid-quarter
refunding announcement, scheduled for February 3, will be watched
closely by market participants for clues of the Administration's debt
management plans, and the general shape of the Administration's fiscal
policy plans are likely to be covered in the President's address to the
6. An upward technical adjustment of $25 million to the borrowingallowance might prove necessary in March should demands for seasonalcredit prove to be stronger than now anticipated.
-17-
Congress on February 17. The dollar would fluctuate around current
levels under alternative B, moving up on any news of unexpected eco-
nomic weakness or policy easing abroad, or down should the news about
the U.S. economy prove to be softer than expected.
(22) Short-term interest rates--including the prime rate--
would decline by the half-point drop in the federal funds rate under
alternative A. Availability constraints on business credit at banks
might ease more noticeably should bankers come to see lower rates
as improving the outlook for business profitability and lessening
strains in this sector. If incoming information suggested that the
economic expansion had lost some of its steam--such as a weak employ-
ment report--or if the easing were seen as being associated with the
likelihood of more fiscal policy restraint, this alternative might be
viewed as needing to be reversed before long. In these circumstances,
declines in intermediate- and long-term rates would be limited. The
dollar would move lower on foreign exchange markets.
(23) Although market participants seem to believe that some
tightening of monetary policy over the next year will be forthcoming,
they do not see this happening soon and thus would be surprised by the
election of alternative C. Short-term rates would rise by about 1/2
percentage point. Long-term rates, too, would rise, although the boost
to nominal rates would be held in check by the associated better out-
look for disinflation. The dollar would climb higher on foreign
exchange markets.
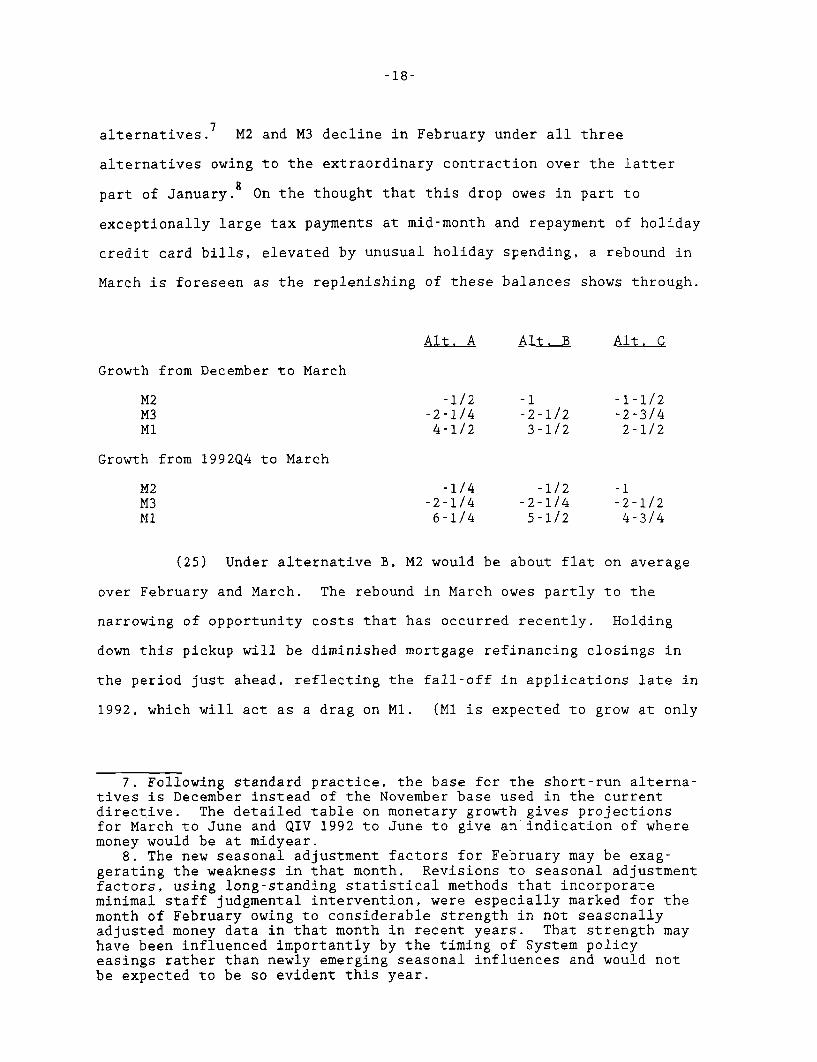
(24) The table below presents monetary growth rates over
the December-to-March period thought to be consistent with these
-18-
alternatives.7 M2 and M3 decline in February under all three
alternatives owing to the extraordinary contraction over the latter
part of January. On the thought that this drop owes in part to
exceptionally large tax payments at mid-month and repayment of holiday
credit card bills, elevated by unusual holiday spending, a rebound in
March is foreseen as the replenishing of these balances shows through.
Alt. A Alt. B Alt. C
Growth from December to March
M2 -1/2 -1 -1-1/2M3 -2-1/4 -2-1/2 -2-3/4M1 4-1/2 3-1/2 2-1/2
Growth from 1992Q4 to March
M2 -1/4 -1/2 -1M3 -2-1/4 -2-1/4 -2-1/2M1 6-1/4 5-1/2 4-3/4
(25) Under alternative B, M2 would be about flat on average
over February and March. The rebound in March owes partly to the
narrowing of opportunity costs that has occurred recently. Holding
down this pickup will be diminished mortgage refinancing closings in
the period just ahead, reflecting the fall-off in applications late in
1992, which will act as a drag on M1. (M1 is expected to grow at only
7. Following standard practice, the base for the short-run alterna-tives is December instead of the November base used in the currentdirective. The detailed table on monetary growth gives projectionsfor March to June and QIV 1992 to June to give an indication of wheremoney would be at midyear.
8. The new seasonal adjustment factors for February may be exag-gerating the weakness in that month. Revisions to seasonal adjustmentfactors, using long-standing statistical methods that incorporateminimal staff judgmental intervention, were especially marked for themonth of February owing to considerable strength in not seasonallyadjusted money data in that month in recent years. That strength mayhave been influenced importantly by the timing of System policyeasings rather than newly emerging seasonal influences and would notbe expected to be so evident this year.
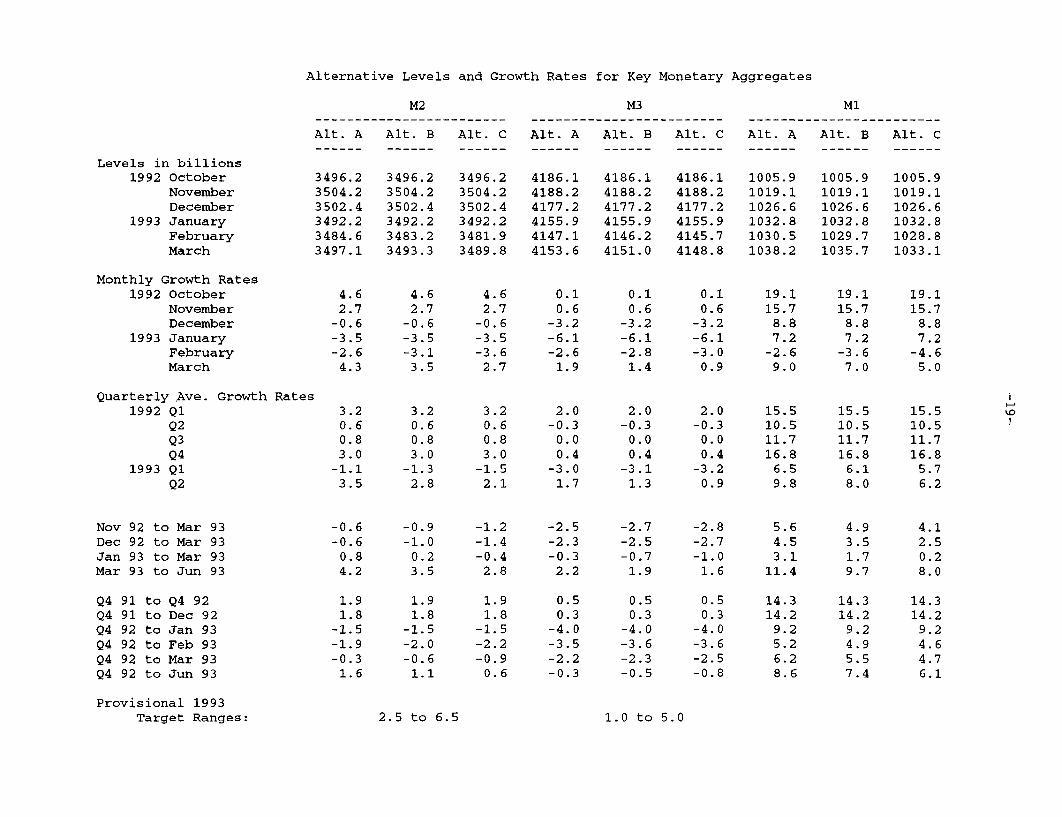
Alternative Levels and Growth Rates for Key Monetary Aggregates
M2 M3 M1
Alt. A Alt. B Alt. C Alt. A Alt. B Alt. C Alt. A Alt. B Alt. C
Levels in billions1992 October 3496.2 3496.2 3496.2 4186.1 4186.1 4186.1 1005.9 1005.9 1005.9
November 3504.2 3504.2 3504.2 4188.2 4188.2 4188.2 1019.1 1019.1 1019.1December 3502.4 3502.4 3502.4 4177.2 4177.2 4177.2 1026.6 1026.6 1026.6
1993 January 3492.2 3492.2 3492.2 4155.9 4155.9 4155.9 1032.8 1032.8 1032.8February 3484.6 3483.2 3481.9 4147.1 4146.2 4145.7 1030.5 1029.7 1028.8March 3497.1 3493.3 3489.8 4153.6 4151.0 4148.8 1038.2 1035.7 1033.1
Monthly Growth Rates1992 October 4.6 4.6 4.6 0.1 0.1 0.1 19.1 19.1 19.1
November 2.7 2.7 2.7 0.6 0.6 0.6 15.7 15.7 15.7December -0.6 -0.6 -0.6 -3.2 -3.2 -3.2 8.8 8.8 8.8
1993 January -3.5 -3.5 -3.5 -6.1 -6.1 -6.1 7.2 7.2 7.2February -2.6 -3.1 -3.6 -2.6 -2.8 -3.0 -2.6 -3.6 -4.6March 4.3 3.5 2.7 1.9 1.4 0.9 9.0 7.0 5.0
Quarterly Ave. Growth Rates1992 Q1 3.2 3.2 3.2 2.0 2.0 2.0 15.5 15.5 15.5
Q2 0.6 0.6 0.6 -0.3 -0.3 -0.3 10.5 10.5 10.5Q3 0.8 0.8 0.8 0.0 0.0 0.0 11.7 11.7 11.7Q4 3.0 3.0 3.0 0.4 0.4 0.4 16.8 16.8 16.8
1993 Q1 -1.1 -1.3 -1.5 -3.0 -3.1 -3.2 6.5 6.1 5.7Q2 3.5 2.8 2.1 1.7 1.3 0.9 9.8 8.0 6.2
Nov 92 to Mar 93 -0.6 -0.9 -1.2 -2.5 -2.7 -2.8 5.6 4.9 4.1Dec 92 to Mar 93 -0.6 -1.0 -1.4 -2.3 -2.5 -2.7 4.5 3.5 2.5Jan 93 to Mar 93 0.8 0.2 -0.4 -0.3 -0.7 -1.0 3.1 1.7 0.2Mar 93 to Jun 93 4.2 3.5 2.8 2.2 1.9 1.6 11.4 9.7 8.0
Q4 91 to Q4 92 1.9 1.9 1.9 0.5 0.5 0.5 14.3 14.3 14.3Q4 91 to Dec 92 1.8 1.8 1.8 0.3 0.3 0.3 14.2 14.2 14.2Q4 92 to Jan 93 -1.5 -1.5 -1.5 -4.0 -4.0 -4.0 9.2 9.2 9.2Q4 92 to Feb 93 -1.9 -2.0 -2.2 -3.5 -3.6 -3.6 5.2 4.9 4.6Q4 92 to Mar 93 -0.3 -0.6 -0.9 -2.2 -2.3 -2.5 6.2 5.5 4.7Q4 92 to Jun 93 1.6 1.1 0.6 -0.3 -0.5 -0.8 8.6 7.4 6.1
Provisional 1993Target Ranges: 2.5 to 6.5 1.0 to 5.0
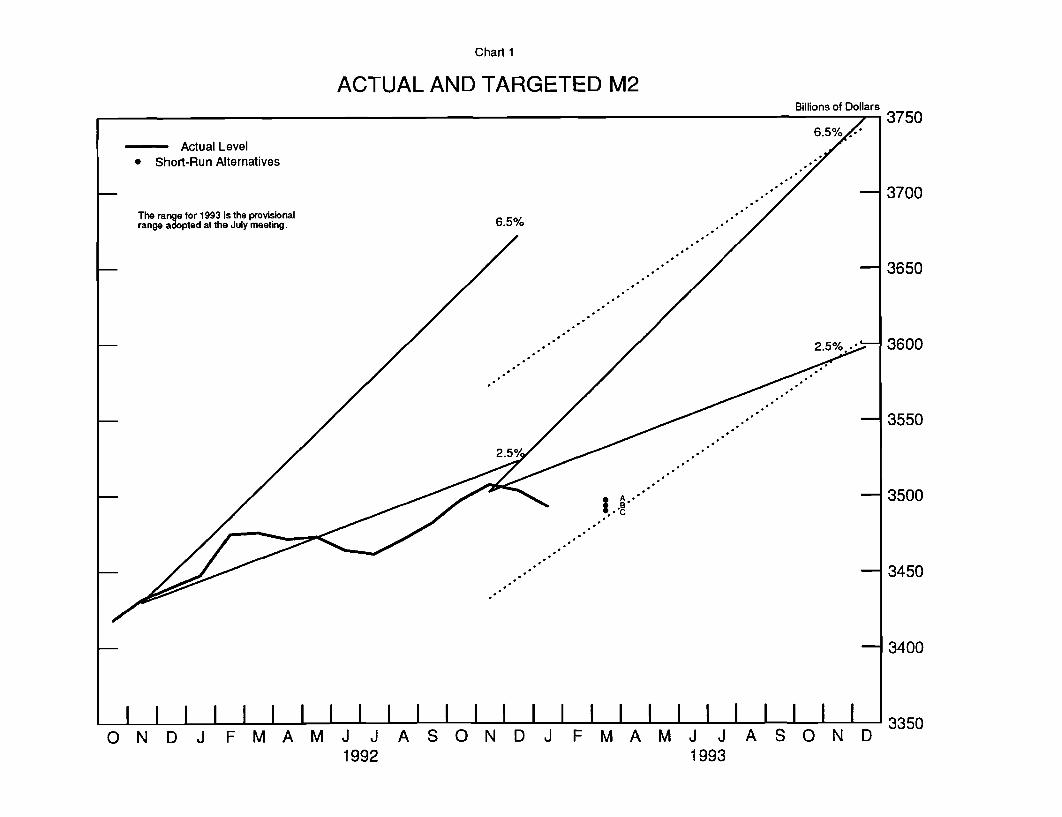
Chart 1
-- Actual Level* Short-Run Alternatives
The range for 1993 is the provisionalrange adopted at the July meeting.
ACTUAL AND TARGETED M2Billions of Dollars
37506.5%
3700
6.5%
3650
2.5% .- 3600
3550
2.51
iA * - 3500
3450
-3400
-- 3350ONDJ F M A M J J A S O N D J F M A M J J A S O N D
1992 1993
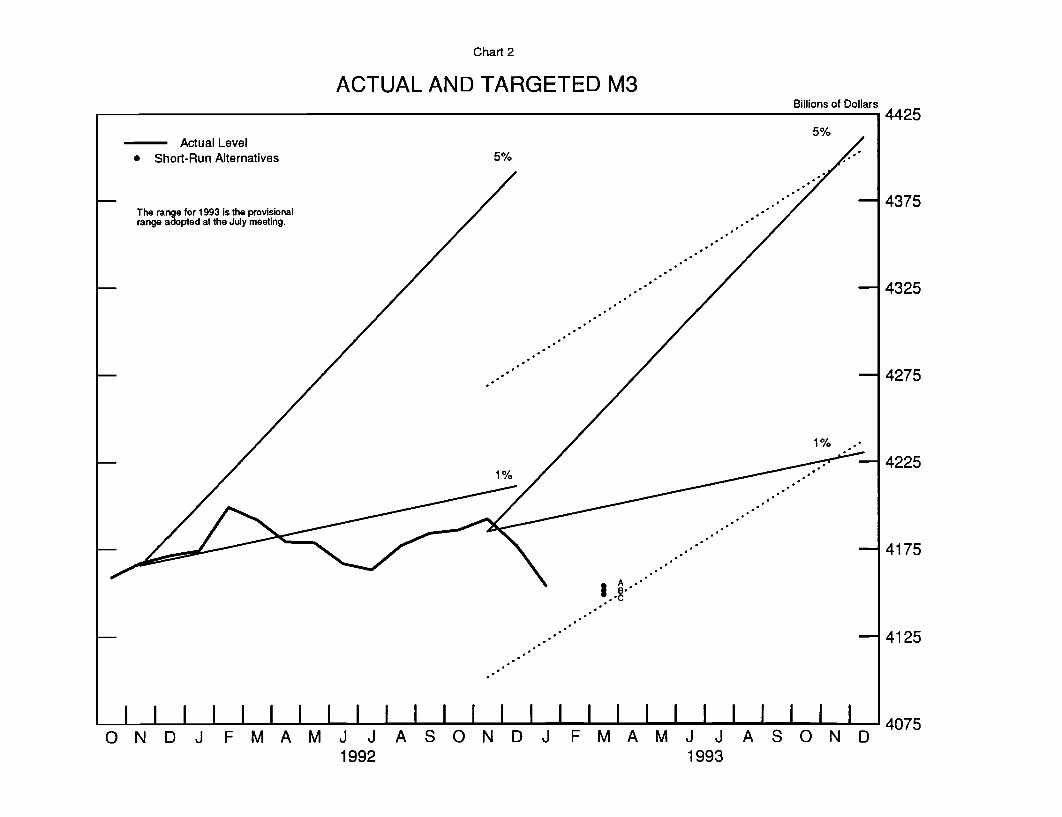
Chart 2
ACTUAL AND TARGETED M3Billions of Dollars
1 4425
- Actual Level* Short-Run Alternatives
The range for 1993 is the provisionalrange adopted at the July meeting.
-- 4325
-1 4275
1%4 .S-C- 4225
-- 4175
I I I I I I I I I I I I I I I I I I I I I I I I 4075ONDJ F M A M J J A S O N D J F M A M J J A S O N D
1992 1993
-1 4375
IA .I..r.
-- 4125
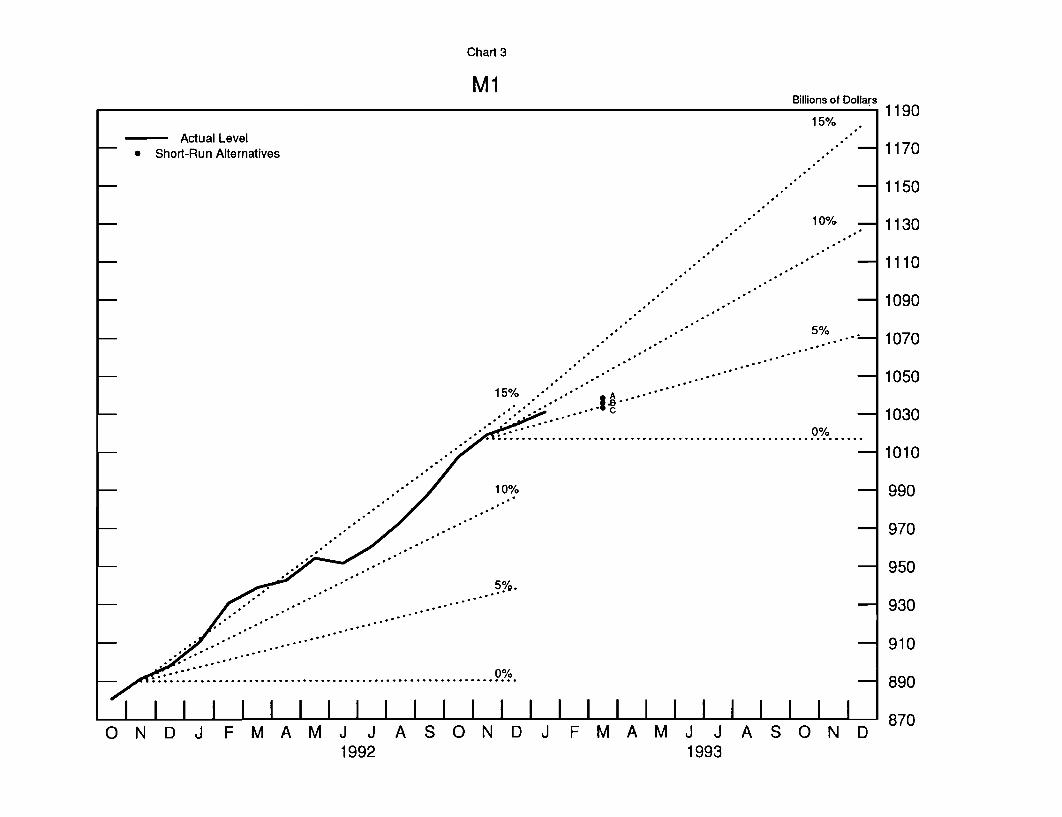
Chart 3
M1Billions of Dollars 1190
15%- Actual Level
* Short-Run Alternatives -1170
1150
- ... 10% - 1130
- .. ' 1110
- .* .. - 1090
5%... " .5%--- 1070
10 %- 990970.. 105015% .** " A ...**
- .'.. .... c - 1030. .t :.................................................... ...
- .1010
ONDOFMAMJJASONDJFMAMJJASOND- 1 . 10% - 990- .. o"" - 930
- .. .......- **1'" - 910
S .:: ................................................. 8 90O N D J F M A M J J A S O N D J F M A M J J A S O N D 8 7 0
1992 1993
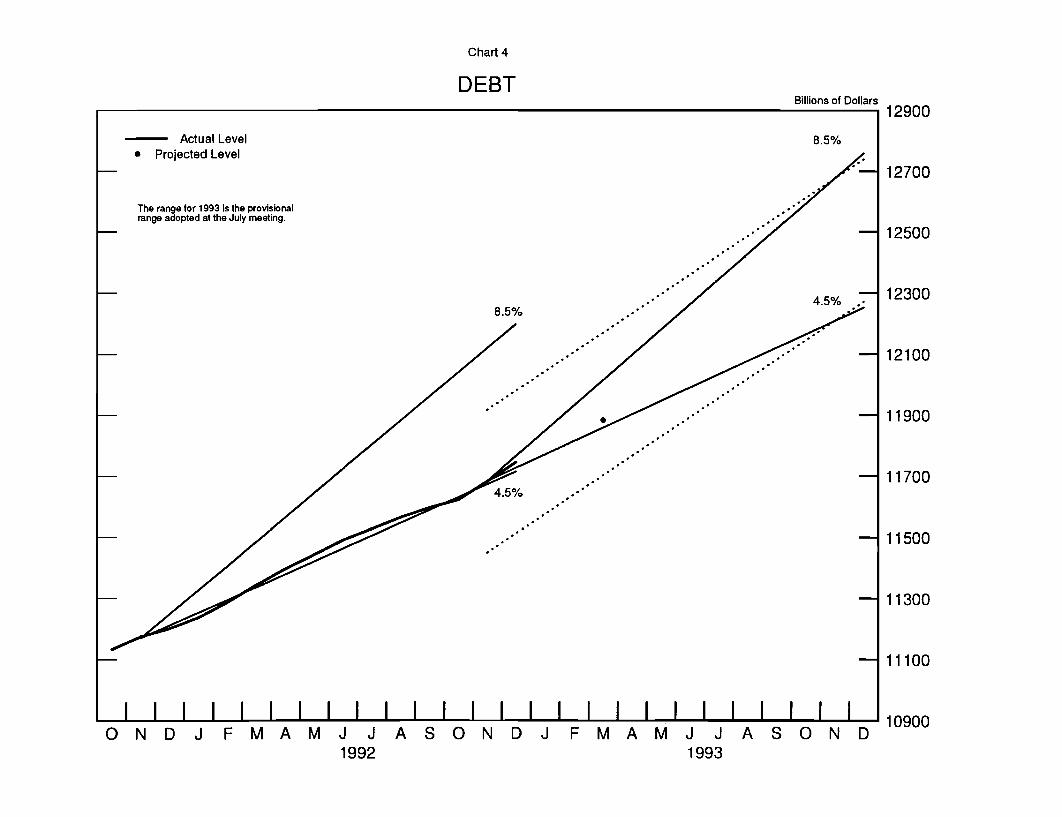
Chart 4
DEBTBillions of Dollars
12900
- Actual Level 8.5%* Projected Level .
- 12700
-12500
The range for 1993 is the provisionalrange adopted at the July meeting.
-1123008.5%
4.5%
-12100
-11900
-11700
-11500
-11300
-11100
I I I I I I I I I I II I I I I I JI I I I I I II 10900ONDJ FMAMJ JASONDJ FMAMJ JASOND
1992 1993
-20-
a 1-3/4 percent rate over February and March.) Still, M2 would remain
below its fourth-quarter 1992 level and, on a quarterly average basis,
would decline at a 1-1/4 percent pace in the first quarter, implying a
sharp 7-1/2 percent rate of increase in its velocity.
(26) Although M3 would resume growing in March under alterna-
tive B, this aggregate would contract on balance over February and
March. A rebound in institution-only money market mutual funds as
year-end effects disappear and rate relationships are more favorable
acts to hold down the M3 run-off in February. Banks' needs for funds
are seen as remaining quite modest as businesses continue to concen-
trate their financing in the capital markets and as household spending
and borrowing moderate. Overall private credit demands are expected to
remain around the sluggish pace of recent months. Federal borrowing
which has been held down in January and February by unexpected tax
inflows, will strengthen substantially in March, boosting growth in
domestic nonfinancial debt to a 5-1/2 percent rate over February and
March and expansion from the fourth quarter of 1992 through March to
5 percent.
(27) Under alternative A, growth in M2 would pick up to a
1 percent annual rate over February and March, returning this aggregate
to its fourth-quarter 1992 level in March. In response to more attrac-
tive opportunity costs and the boost to income, M2 would be on a tra-
jectory to reach the lower bound of its long-run alternative II range
for 1993 by June, but would remain noticeably below its alternative I
range. Bigger inflows to savings and MMDAs, as well as to M1 balances,
would account for the faster growth in M2 in the months ahead. A
buildup of institution-only money funds, as holders responded to more
attractive rate relationships, would buoy M3 over February and March
-21-
under alternative A, and hold down the net declines in this aggregate
over these two months. Nonetheless, the level of M3 in March would
remain well below that of the fourth quarter of 1992, and the firmer
path of this aggregate in subsequent months still would not be
sufficient to return it to its fourth-quarter level until July.
(28) Under alternative C, M2 would decline over February and
March as larger opportunity costs act as an additional drag on this
aggregate. The rebound in its M1 component in March would about offset
a decline in February and it, too, would be about unchanged over these
two months. M3 would drop at a 1/4 percent annual rate over February
and March, as less attractive returns on M3-money funds lead to out-
flows from such funds. The weaker trajectory of this aggregate in
later months implies that even by midyear it would remain well below
its fourth-quarter 1992 level.
-22-
Directive Language
(29) Presented below for Committee consideration is draft
language relating to the Humphrey-Hawkins ranges for 1993 and to the
operating paragraph for the intermeeting period.
1993 Ranges
The Federal Open Market Committee seeks monetary and
financial conditions that will foster price stability and
promote sustainable growth in output. In furtherance of
these objectives, the Committee at THIS [DEL: its] meeting [DEL: on
June 30 July 1 reaffirmed the ranges it had] established [DEL: in
February] RANGES for growth of M2 and M3 of [DEL: 2-1/2 to 6-1/-2]
____ TO ____ percent and [DEL: 1 to 5] ____ TO __ percent respec-
tively, measured from the fourth quarter of 1992 [DEL: 1991] to the
fourth quarter of 1993 [DEL: 1992]. The Committee anticipated that
developments contributing to unusual velocity increases
could persist DURING [DEL: in the second half of] the year. The
monitoring range for growth of total domestic nonfinancial
debt [DEL: also] was SET [DEL: maintained] at [DEL: 4-1/2 to 8-1/2] ____ TO ____
percent for the year. [DEL: For 1993, the Committee on a
tentative basis set the same ranges as in 199-2 for growth of
the monetary aggregates and debt measured from the fourth
quarter of 199-2 to the fourth quarter of 1993.] The behavior
of the monetary aggregates will continue to be evaluated in
the light of progress toward price level stability, move-
ments in their velocities, and developments in the economy
and financial markets.
-23-
OPERATIONAL PARAGRAPH
In the implementation of policy for the immediate
future, the Committee seeks to DECREASE SOMEWHAT/maintain/
INCREASE SOMEWHAT the existing degree of pressure on reserve
positions. In the context of the Committee's long-run
objectives for price stability and sustainable economic
growth, and giving careful consideration to economic,
financial, and monetary developments, slightly (SOMEWHAT)
greater reserve restraint (WOULD/MIGHT) or slightly (SOME-
WHAT) lesser reserve restraint would (MIGHT) be acceptable
in the intermeeting period. The contemplated reserve condi-
tions are expected to be consistent with GROWTH OF (DECLINES
IN) M2 AND M3 AT ANNUAL RATES [DEL: growing at a rate] of around
[DEL: 1-1/2 percent] ____ AND ____ PERCENT RESPECTIVELY OVER [DEL: M3 about
unchanged in] the period from DECEMBER [DEL: November] through
March.

APPENDIX A
MONEY STOCK REVISIONS
Measures of the money stock have been revised to incorporatethe results of the annual benchmark and seasonal factor review. Theattached tables compare growth rates of the old and revised series.These data should be regarded as confidential until their release tothe public, tentatively planned for February 4.
Benchmark Revisions
Data for the monetary aggregates have been benchmarked usingcall reports through September 1992 and other sources. The benchmarkrevisions lowered the annual growth rate of M2 by .2 percentage pointover 1992. Other growth rates of M1, M2, and M3 were revised by nomore than .1 percentage point for any year.
The benchmark incorporates a change in the type of data usedto measure large time deposits held by domestic banks. We had reliedon reports from issuing banks as to bank holders of their CDs; we nowuse reports by banks of CDs they hold, which we have learned to bemore accurate. (This item is one of several that are subtracted fromgross large time deposits to measure the quantity of such time depos-its held by the nonbank public.) As a result of the change, thisnetting item revised upward by as much as $12 billion over the pastseven years, thereby reducing the level of M3 by the same amount, butcausing little revision to the annual growth rates of M3. The bench-mark also incorporates corrections for the previous misreporting bybanks of some brokered time deposits. Initially, these deposits hadbeen misclassified as large time deposits, rather than as small timedeposits. In last year's benchmark, this misclassification was cor-rected for data reported by several large banks in 1990 and 1991. Inthis year's benchmark, after a more thorough examination of the prob-lem, the misclassification was corrected for a large number of addi-tional banks, for data reported over the past nine years. The reclas-sification of these deposits, which amounted to as much as $6 billionin 1988, boosted the level of M2 but left M3 unaffected.
The benchmark also folded in historical data for severalmoney market mutual funds that began reporting for the first timeduring 1992, raising the level of M3 by almost $9 billion in late1992. Numerous other, smaller revisions were also made to theaggregates.
Seasonal Factor Revisions
Seasonal factors for the monetary aggregates have beenrevised using the X-11 ARIMA procedure applied to data throughpreliminary estimates for January 1993. The seasonal adjustmentprocedure used this year is identical to that used last year.
The revisions to seasonal factors redistributed some growthin each of the aggregates from the first and fourth quarters to thesecond and third quarters of 1992.
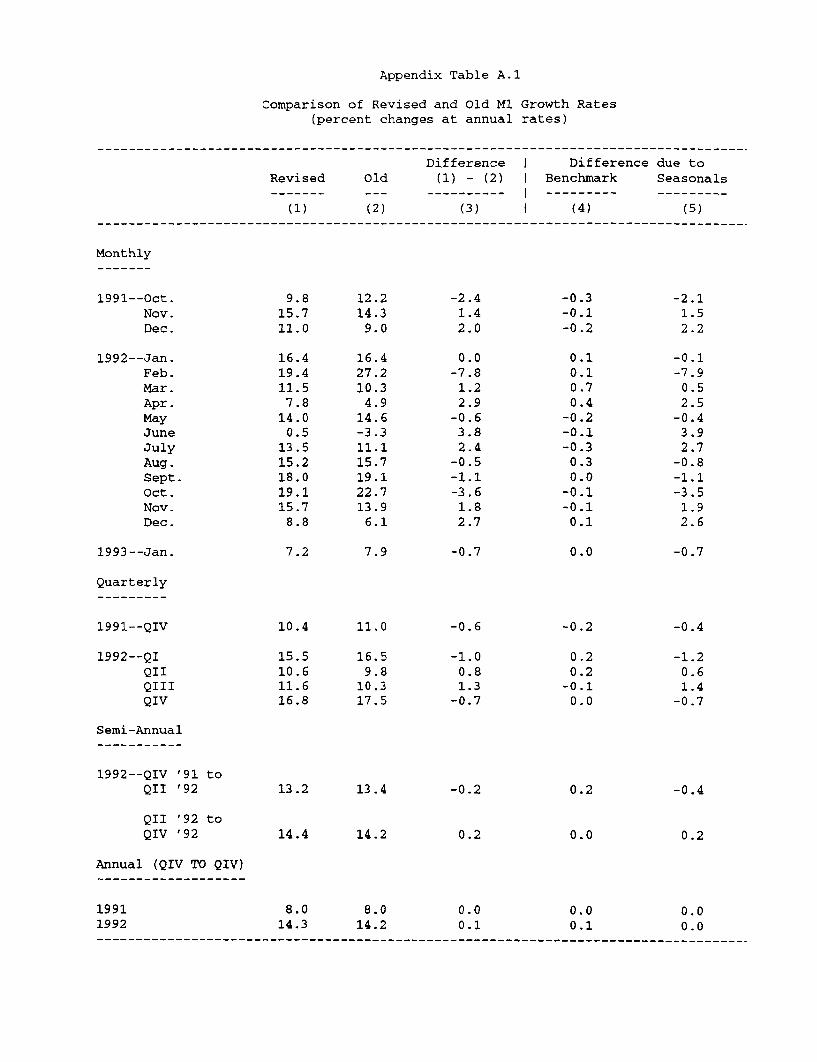
Appendix Table A.1
Comparison of Revised and Old M1 Growth Rates(percent changes at annual rates)
Difference I Difference due toRevised Old (1) - (2) I Benchmark Seasonals
(1) (2) (3) I (4) (5)
Monthly
1991--Oct. 9.8 12.2 -2.4 -0.3 -2.1Nov. 15.7 14.3 1.4 -0.1 1.5Dec. 11.0 9.0 2.0 -0.2 2.2
1992--Jan. 16.4 16.4 0.0 0.1 -0.1Feb. 19.4 27.2 -7.8 0.1 -7.9Mar. 11.5 10.3 1.2 0.7 0.5Apr. 7.8 4.9 2.9 0.4 2.5May 14.0 14.6 -0.6 -0.2 -0.4June 0.5 -3.3 3.8 -0.1 3.9July 13.5 11.1 2.4 -0.3 2.7Aug. 15.2 15.7 -0.5 0.3 -0.8Sept. 18.0 19.1 -1.1 0.0 -1.1Oct. 19.1 22.7 -3.6 -0.1 -3.5Nov. 15.7 13.9 1.8 -0.1 1.9Dec. 8.8 6.1 2.7 0.1 2.6
1993--Jan. 7.2 7.9 -0.7 0.0 -0.7
Quarterly
1991--QIV 10.4 11.0 -0.6 -0.2 -0.4
1992--QI 15.5 16.5 -1.0 0.2 -1.2QII 10.6 9.8 0.8 0.2 0.6QIII 11.6 10.3 1.3 -0.1 1.4QIV 16.8 17.5 -0.7 0.0 -0.7
Semi-Annual
1992--QIV '91 toQII '92 13.2 13.4 -0.2 0.2 -0.4
QII '92 toQIV '92 14.4 14.2 0.2 0.0 0.2
Annual (QIV TO QIV)
1991 8.0 8.0 0.0 0.0 0.01992 14.3 14.2 0.1 0.1 0.0
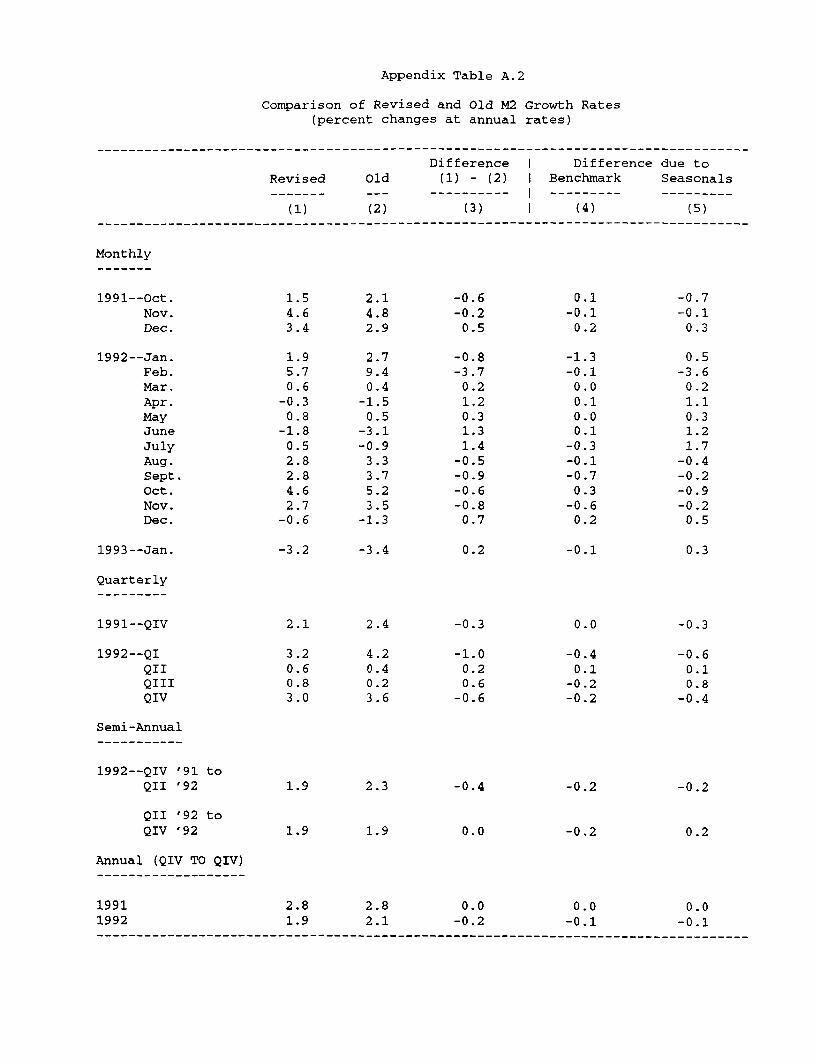
Appendix Table A.2
Comparison of Revised and Old M2 Growth Rates(percent changes at annual rates)
Difference I Difference due toRevised Old (1) - (2) I Benchmark Seasonals------- --- ---------- --------- ---------
(1) (2) (3) I (4) (5)
Monthly
1991--Oct. 1.5 2.1 -0.6 0.1 -0.7Nov. 4.6 4.8 -0.2 -0.1 -0.1Dec. 3.4 2.9 0.5 0.2 0.3
1992--Jan. 1.9 2.7 -0.8 -1.3 0.5Feb. 5.7 9.4 -3.7 -0.1 -3.6Mar. 0.6 0.4 0.2 0.0 0.2Apr. -0.3 -1.5 1.2 0.1 1.1May 0.8 0.5 0.3 0.0 0.3June -1.8 -3.1 1.3 0.1 1.2July 0.5 -0.9 1.4 -0.3 1.7Aug. 2.8 3.3 -0.5 -0.1 -0.4Sept. 2.8 3.7 -0.9 -0.7 -0.2Oct. 4.6 5.2 -0.6 0.3 -0.9Nov. 2.7 3.5 -0.8 -0.6 -0.2Dec. -0.6 -1.3 0.7 0.2 0.5
1993--Jan. -3.2 -3.4 0.2 -0.1 0.3
Quarterly
1991--QIV 2.1 2.4 -0.3 0.0 -0.3
1992--QI 3.2 4.2 -1.0 -0.4 -0.6QII 0.6 0.4 0.2 0.1 0.1QIII 0.8 0.2 0.6 -0.2 0.8QIV 3.0 3.6 -0.6 -0.2 -0.4
Semi-Annual
1992--QIV '91 toQII '92 1.9 2.3 -0.4 -0.2 -0.2
QII '92 toQIV '92 1.9 1.9 0.0 -0.2 0.2
Annual (QIV TO QIV)
1991 2.8 2.8 0.0 0.0 0.01992 1.9 2.1 -0.2 -0.1 -0.1
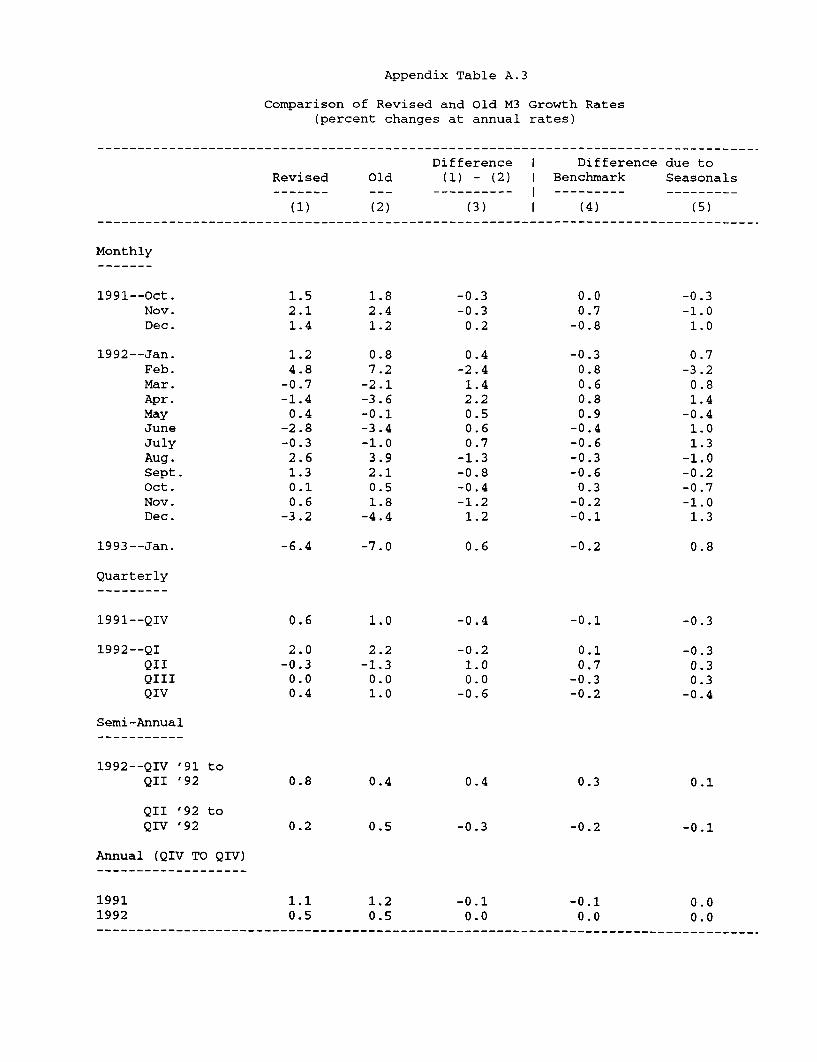
Appendix Table A.3
Comparison of Revised and Old M3 Growth Rates(percent changes at annual rates)
Difference I Difference due toRevised Old (1) - (2) I Benchmark Seasonals
(1) (2) (3) I (4) (5)
Monthly
1991--Oct. 1.5 1.8 -0.3 0.0 -0.3Nov. 2.1 2.4 -0.3 0.7 -1.0Dec. 1.4 1.2 0.2 -0.8 1.0
1992--Jan. 1.2 0.8 0.4 -0.3 0.7Feb. 4.8 7.2 -2.4 0.8 -3.2Mar. -0.7 -2.1 1.4 0.6 0.8Apr. -1.4 -3.6 2.2 0.8 1.4May 0.4 -0.1 0.5 0.9 -0.4June -2.8 -3.4 0.6 -0.4 1.0July -0.3 -1.0 0.7 -0.6 1.3Aug. 2.6 3.9 -1.3 -0.3 -1.0Sept. 1.3 2.1 -0.8 -0.6 -0.2Oct. 0.1 0.5 -0.4 0.3 -0.7Nov. 0.6 1.8 -1.2 -0.2 -1.0Dec. -3.2 -4.4 1.2 -0.1 1.3
1993--Jan. -6.4 -7.0 0.6 -0.2 0.8
Quarterly
1991--QIV 0.6 1.0 -0.4 -0.1 -0.3
1992--QI 2.0 2.2 -0.2 0.1 -0.3QII -0.3 -1.3 1.0 0.7 0.3QIII 0.0 0.0 0.0 -0.3 0.3QIV 0.4 1.0 -0.6 -0.2 -0.4
Semi-Annual
1992--QIV '91 toQII '92 0.8 0.4 0.4 0.3 0.1
QII '92 toQIV '92 0.2 0.5 -0.3 -0.2 -0.1
Annual (QIV TO QIV)
1991 1.1 1.2 -0.1 -0.1 0.01992 0.5 0.5 0.0 0.0 0.0-------------------------------------------------------------------------------
Appendix B
ADOPTED LONGER-RUN GROWTH RATE RANGES FOR THE MONETARY AND CREDIT AGGREGATES(percent annual rates; numbers in parentheses are actual growth rates as reported at end of policy
period in February Monetary Policy Report to Congress)
Domestic Non-M1 M2 M3 financial Debt
1978 - QIV
1979 - QIV
1980 - QIV
1981 - QIV
1982 - QIV
1983 - QIV
1984 - QIV
1985 - QIV
1986 - QIV
1987 - QIV
1988 - QIV
1989 - QIV
1990 - QIV
1991 - QIV
19792
1980
1981
1982
1983
1984
1985
1986
1987
1988
1989
1990
1991
1992
3 - 6 (5.5)
4 - 6.5 (7.3) 3 ,4
3.5 - 6 (2.3) 3 , 5
2.5 - 5.5 (8.5) 3
5 - 98 (7.2)
4 - 8 (5.2)
3 - 810 (12.7)
3 - 8 (15.2)1 1
n.s 1
n. s
n. s
n. s
(6.2)
(4.3)
(0.6)
(4.2)
n.s (8.0)
n.s (14.3)
5 - 8 (8.3)
6 - 9 (9.8)
6 - 9 (9.4)
6 - 9 (9.2)
7 - 10 9 (8.3)
6 - 9 (7.7)
6 - 9 (8.6)
6 - 9 (8.9)
.5 - 8.5 (4.0)
4 - 8 (5.3)
3 - 7 (4.6)
3 - 7 (3.9)
2.5 - 6.5 (2.8)
2.5 - 6.5 (1.9)
6 - 9 (8.1)
6.5 - 9.5 (9.9)
6.5 - 9.5 (11.4)
6.5 - 9.5 (10.1)
6.5 - 9.5 (9.7)
6 - 9 (10.5)
6 - 9.5 (7.4)
6 - 9 (8.8)
5.5 - 8.5 (5.4)
4 - 8 (6.2)
3.5 - 7.5 (3.3)
1 512 (1.8)
1 - 5 (1.2)
1 - 5 (0.5)
7 .
4
4
.5 - 10.5 (12.2)
6 - 9 (7.9)
6 - 9 (8.8) 6
6 - 97 (7.1) 6
5 - 11.5 (10.5)
8 - 11 (13.4)
9 - 12 (13.5)
8 - 11 (12.9)
8 - 11 (9.6)
7 - 11 (8.7)
5 - 10.5 (8.1)
5 - 9 (6.9)
.5 - 8.5 (4.5)
.5 - 8.5 (4.6)
n.s.--not specified.1. Targets are for bank credit until 1983: from 1983 onward targets are for domesticnonfinancial sector debt.2. At the February 1979 meeting the FOMC adopted a QIV'78 to QIV'79 range for M1 of 1-1/2to 4-1/2 percent. This range anticipated that shifting to ATS and NOW accounts in NewYork State would slow M1 growth by 3 percentage points. At the October meeting it wasnoted that ATS/NOW shifts would reduce M1 by no more than 1-1/2 percentage points. Thus,the longer-run range for M1 was modified to 3-6 percent.3. The figures shown reflect target and actual growth of MI-B in 1980 and shift-adjustedM1-B in 1981. MI-B was relabeled M1 in January 1982. The targeted growth for Ml-A was3-1/2 to 6 percent in 1980 (actual growth was 5.0 percent); in 1981 targeted growth forshift-adjusted MI-A was 3 to 5-1/2 percent (actual growth was 1.3 percent).4. When these ranges were set, shifts into other checkable deposits in 1980 were expectedto have only a limited effect on growth of MI-A and Ml-B. As the year progressed.however, banks offered other checkable deposits more actively, and more funds thanexpected were directed to these accounts. Such shifts are estimated to have decreased MI-A growth and increased Ml-B growth each by at least 1/2 percentage point more than hadbeen anticipated.5. Adjusted for the effects of shifts out of demand deposits and savings deposits intoother checkable deposits. At the February FOMC meeting, the target ranges for observedM1-A and Ml-B in 1981 on an unadjusted basis, expected to be consistent with the adjustedranges, were -4-1/2 to -2 and 6 to 8-1/2 percent, respectively. Actual MI-B growth (notshift adjusted) was 5.0 percent.6. Adjusted for shifts of assets from domestic banking offices to International BankingFacilities.7. Range for bank credit is annualized growth from the December 1981-January 1982 averagelevel through the fourth quarter of 1982.8. Base period, adopted at the July 1983 FOMC meeting, is QII'83. At the February 1983meeting the FOMC had adopted a QIV'82 to QIV'83 target range for Ml of 4 to 8 percent.9. Base period is the February-March 1983 average.10. Base period, adopted at the July 1985 FOMC meeting, is QII'85. At the February 1985meeting the FOMC had adopted a QIV'84 to QIV'85 target range for Ml of 4 to 7 percent.11. No range for MI has been specified since the February 1987 FOMC meeting because ofuncertainties about its underlying relationship to the behavior of the economy and itssensitivity to economic and financial circumstances.12. At the February 1990 meeting the FOMC specified a range of 2-1/2 to 6-1/2 percent.This range was lowered to 1 to 5 percent at the July 1990 meeting.
1/27/93 (MARP)
SELECTED INTEREST RATES(percent)
Short-Term Long-TermCDs money corporate conventional home mortgages
federal Treasury bills secondary comm. market bank U.S. government conslant A-utility municipal secondary primaryfunds secondary market market paper mutual prime - maturity yields recently Bond market I market
3-month I 6-month I 1-year 3-month 1-month fund loan 3-year I 10 -yeyar ollered Buyer lixed-rale Aixed-rate ARM1 2 3 4 5 6 7 8 9 1 0 11 12 13 14 15 I 16
91 -- High-- Low
92 -- High- Low
MonthlyJan 92Feb 92Mar 92Apr 92May 92Jun 92Jul 92Aug 92Sep 92Oct 92Nov 92Dec 92
WeeklyOct 14 92Oct 21 92Oct 28 92
Nov 4 92Nov 11 92Nov 18 92Nov 25 92
Dec 2 92Dec 9 92Dec 16 92Dec 23 92Dec 30 92
Jan 6 93Jan 13 93Jan 20 93Jan 27 93
DailyJan 22 93Jan 28 93Jan 29 93
7.46 6.46 6.50 6.43 7.75 8.49 7.37 9.934.22 3.84 3.93 4.01 4.25 4.88 4.53 7.07
4.20 4.05 4.22 4.51 4.32 5.02 4.51 6.502.86 2.69 2.82 2.91 3.07 3.17 2.74 6.00
4.03 3.80 3.87 3.95 4.05 4.11 4.18 6.504.06 3.84 3.93 4.08 4.07 4.11 3.84 6.503.98 4.04 4.18 4.40 4.25 4.28 3.73 6.503.73 3.75 3.87 4.09 4.00 4.02 3.66 6.503.82 3.63 3.75 3.99 3.82 3.87 3.52 6.503.76 3.66 3.77 3.98 3.86 3.91 3.45 6.503.25 3.21 3.28 3.45 3.37 3.43 3.25 6.023.30 3.13 3.21 3.33 3.31 3.38 3.07 6.003.22 2.91 2.96 3.06 3.13 3.25 2.91 6.003.10 2.86 3.04 3.17 3.26 3.22 2.79 6.003.09 3.13 3.34 3.52 3.58 3.25 2.83 6.002.92 3.22 3.36 3.55 3.48 3.71 2.82 6.00
3.20 2.85 2.96 3.06 3.19 3.19 2.77 6.003.05 2.95 3.11 3.27 3.34 3.26 2.79 6.002.96 2.93 3.18 3.35 3.39 3.26 2.74 6.00
3.07 2.99 3.21 3.40 3.40 3.25 2.75 6.002.91 3.06 3.26 3.44 3.47 3.26 2.74 6.002.97 3.12 3.34 3.51 3.63 3.28 2.74 6.003.10 3.21 3.41 3.58 3.66 3.22 2.74 6.00
3.37 3.30 3.47 3.66 3.75 3.46 2.77 6.002.94 3.26 3.37 3.55 3.60 3.88 2.79 6.002.93 3.23 3.39 3.63 3.50 3.78 2.80 6.002.94 3.18 3.33 3.52 3.36 3.65 2.83 6.002.86 3.17 3.33 3.47 3.34 3.60 2.86 6.00
3.03 3.09 3.26 3.43 3.28 3.39 2.92 6.002.98 3.05 3.19 3.42 3.24 3.26 2.83 6.003.10 2.98 3.12 3.33 3.17 3.17 2.77 6.002.94 2.95 3.08 3.28 3.15 3.15 2.77 6.00
2.86 2.97 3.06 3.27 3.15 3.152.97 2.90 3.05 3.23 3.14 3.143.00p 2.90 3.07 3.24 3.11 3.13
6.006.006.00
7.47 8.35 8.52 9.96 7.405.24 6.96 7.58 8.49 6.76
6.32 7.65 8.07 8.99 6.874.24 6.30 7.29 8.06 6.12
5.40 7.03 7.58 8.57 6.675.72 7.34 7.85 8.79 6.836.18 7.54 7.97 8.91 6.865.93 7.48 7.96 8.82 6.805.81 7.39 7.89 8.70 6.725.60 7.26 7.84 8.62 6.664.91 6.84 7.60 8.38 6.324.72 6.59 7.39 8.16 6.314.42 6.42 7.34 8.11 6.404.64 6.59 7.53 8.40 6.595.14 6.87 7.61 8.51 6.565.21 6.77 7.44 8.27 6.43
4.48 6.49 7.50 8.42 6.514.76 6.70 7.58 8.55 6.714.93 6.79 7.64 8.52 6.81
4.99 6.83 7.65 8.65 6.705.07 6.94 7.72 8.49 6.575.12 6.83 7.55 8.40 6.485.19 6.83 7.54 8.48 6.47
5.38 6.94 7.58 8.35 6.485.22 6.80 7.48 8.27 6.425.26 6.80 7.44 8.24 6.455.17 6.71 7.39 8.18 6.415.13 6.70 7.38 8.21 6.40
5.05 6.64 7.35 8.28 6.445.06 6.73 7.46 8.13 6.414.93 6.61 7.35 8.05 6.404.84 6.53 7.27 7.95 6.36
4.85 6.57 7.304.73 6.44 7.234.72 6.39 7.21
9.978.38
9.227.86
8.658.929.178.988.858.668.258.047.988.258.488.34
8.228.418.47
8.538.448.488.47
8.418.358.348.288.30
8.278.108.118.01
9.75 7.788.35 6.02
9.03 6.227.84 4.97
8.43 5.898.76 5.888.94 6.118.85 6.158.67 6.008.51 5.878.13 5.517.98 5.277.92 5.118.09 5.068.31 5.268.22 5.45
8.06 5.058.23 5.138.21 5.12
8.29 5.178.32 5.208.32 5.328.29 5.34
8.34 5.528.23 5.478.19 5.448.13 5.388.14 5.36
8.07 5.288.04 5.258.00 5.207.86 5.06
NOTE: Weekly data lor columns 1 through 11 are statement week averages. Data in column 7 are taken Irom Donoghue's Money Fund Report. Columns 12, 13 and 14 are -day quotes lor Friday. Thursday or Friday, respectively,following the end of the statement week. Column 13 is the Bond Buyer revenue index. Column 14 is the FNMA purchase yield, plus loan servicing lee, on 30-day mandatory delivery commitments. Column 15is the averagecontract rate on new commitments for fixed-rate mortgages (FRMs) with 80 percent loan-to-value ratios at major institutional lenders. Column 16 is the average initial contract rate on new commitments tor 1 year. adjustablerate mortgages (ARMs) at major institutional lenders olfering both FRMs and ARMs with the same number of discount points.
p - preliminary data
February 1, 1993Table 1
Strictly Confidential (FR)-
Money and Credit Aggregate Measures Class II FOMC
Seasonally adjusted FEB. 1, 1993
Money stock measures and liquid assets Bank credit Domestic nonfinancial debt'
nontransactions total loans U.S.Period MI M2 components M3 L and government' other' total'
in M2 in M3 only investments'
1 2 3 4 5 6 7 8 9 10
ANN. GROWTH RATES (%) :ANNUALLY (Q4 TO Q4)
199019911992
QUARTERLY AVERAGE1992-1st QTR.1992-2nd QTR.1992-3rd QTR.1992-4th QTR.
MONTHLY1992-JAN.
FEB.MAR.APR.MAYJUNEJULYAUG.SEP.OCT.NOV.DEC.
1993-JAN. pe
LEVELS ($BILLIONS) :MONTHLY
1992-AUG.SEP.OCT.NOV.DEC.
WEEKLY1992-DEC.
1993-JAN. 411 p18 p
1. Adjusted for breaks caused2. Debt data are on a monthly
discontinuities.p-preliminarype-preliminary estimate
4.28.014.2
16.59.8
10.317.6
16.427.210.34.914.6-3.311.115.719.122.713.96.2
8
973.1988.61007.31019.01024.3
1022.71021.51019.71029.2
1028.91034.41031.6
4.02.82.1
4.20.40.23.6
2.79.40.4
-1.50.5
-3.1-0.9
3.33.75.23.5-1.3
-4
3471.23481.93497.13507.33503.4
3509.93506.23498.93502.3
3493.93500.83493.8
by reclassifications.average basis, derived
3.91.1
-2.1
-0.1-3.0-3.6-1.9
-2.13.0
-3.2-3.8-4.7-3.0-5.4-1.4-2.4-1.6-0.7-4.4
-8
2498.12493.22489.82488.32479.2
2487.32484.72479.22473.1
2465.12466.42462.2
-7.2-5.7-7.3
-7.3-9.5-1.2
-11.8
-8.4-3.1
-13.7-14.4
-3.4-5.3-1.97.0-6.0
-23.1-6.3
-20.3
-22
705.6702.1688.6685.0673.4
679.5682.0676.3665.6
648.3652.6666.7
1.71.20.5
2.2-1.3-0.01.0
0.87.2
-2.1-3.6-0.1-3.4-1.0
3.92.10.51.8-4.4
-7
4176.84184.04185.84192.24176.9
4189.54188.24175.24167.9
4142.24153.44160.5
1.80.5
1.50.61.1
-1.86.82.5
-1.7-2.32.9
-1.94.24.22.05.3
5024.85042.55051.05073.5
5.53.53.9
4.53.32.85.0
4.71.23.56.30.22.50.36.06.73.94.83.8
2898.32914.42923.92935.72944.9
10.311.0
10.014.410.8
7.78.3
17.115.013.014.610.09.75.0-1.410.5
2992.43004.83001.43027.7
5.92.3
2.52.51.9
2.64.52.42.42.01.71.71.92.74.04.7
8572.38591.78620.68654.3
6.94.3
4.35.44.2
3.95.46.05.54.84.93.93.93.32.66.2
11564.711596.511622.011682.0
by averaging end-of-month levels of adjacent months, and have been adjusted to remove
Strictly Confidential (FR)-
Components of Money Stock and Related Measures Class II FOMC
seasonally adjusted unless otherwise noted FEB. 1, 1993
Small Money market LargeOther Overnight denomi- mutual funds denomi- Short- Bankers
Demand checkable RPs and Savings nation general Institu- nation Term Term Savings term Commer- accep-Period Currency deposits deposits Eurodollars deposits' time purpose tions time RPs Eurodollars bonds Treasury cial paper' tances
NSA' deposits' and broker/ only deposits' NSA' NSA' securitiesdealer'
1 2 3 4 5 8 7 8 9 10 11 12 13 14 15
LEVELS ($BILLIONS) :ANNUALLY (4TH QTR.)
199019911992
MONTHLY1991-DEC.
1992-JAN.FEB.MAR.
APR.MAYJUNE
JULYAUG.SEP.
OCT.NOV.DEC.
245.5266.0290.3
267.3
269.4271.6271.8
273.6274.7276.2
278.9282.3286.4
288.4290.0292.5
277.5287.0338.1
289.5
293.9305.1309.6
311.2315.1311.0
315.6320.6327.8
336.2339.2338.8
292.7329.1379.8
333.2
339.0346.3349.5
350.0356.4356.7
358.2362.2366.1
374.0381.2384.3
78.8 919.9 1167.773.3 1028.8 1079.174.5 1180.0 885.4
76.2 1042.6 1063.0
77.777.874.6
72.669.272.0
72.475.874.2
75.274.873.5
1061.21083.91098.0
1111.21122.41127.0
1134.41145.61159.6
1171.61181.71186.8
1042.91019.81002.8
985.3968.7956.2
942.4928.0915.2
898.8884.3873.2
346.2359.8347.8
360.5
358.6361.7358.3
355.9356.7355.3
351.7349.7344.7
347.6348.7347.2
130.1173.6201.1
179.1
182.4188.2185.3
189.2194.8199.7
207.7217.2217.2
205.6203.5194.3
502.1443.1369.2
437.1
427.9420.7413.0
405.7400.9395.3
388.5384.6380.0
373.2368.8365.7
93.673.078.7
70.5
70.571.773.3
72.573.473.6
72.573.375.1
77.379.579.2
68.060.749.7
57.6
55.756.158.0
54.952.851.8
51.051.449.5
49.350.049.8
125.2137.0
137.9
138.9140.1141.2
142.4143.5144.6
145.9147.5149.5
152.0154.7
329.8319.6
316.1
310.0319.9327.7
328.0329.9335.0
326.3327.1324.3
323.2332.0
357.4337.9
339.7
334.8327.5337.0
341.7329.4347.1
350.3352.4364.4
369.5375.0
33.624.4
23.3
23.222.922.2
21.622.022.0
21.720.920.4
20.519.6
I _ _ _ _ 1. __ I _ I _ I |_ |1. Net of money market mutual fund holdings of these items.2. Includes money market deposit accounts.3. Includes retail repurchase agreements. All IRA and Keogh accounts at commercial banks and thrift institutions are subtracted from small time deposil4. Excludes IRA and Keogh accounts.5. Net of large denomination time deposits held by money market mutual funds and thrift institutions.
p-preliminary
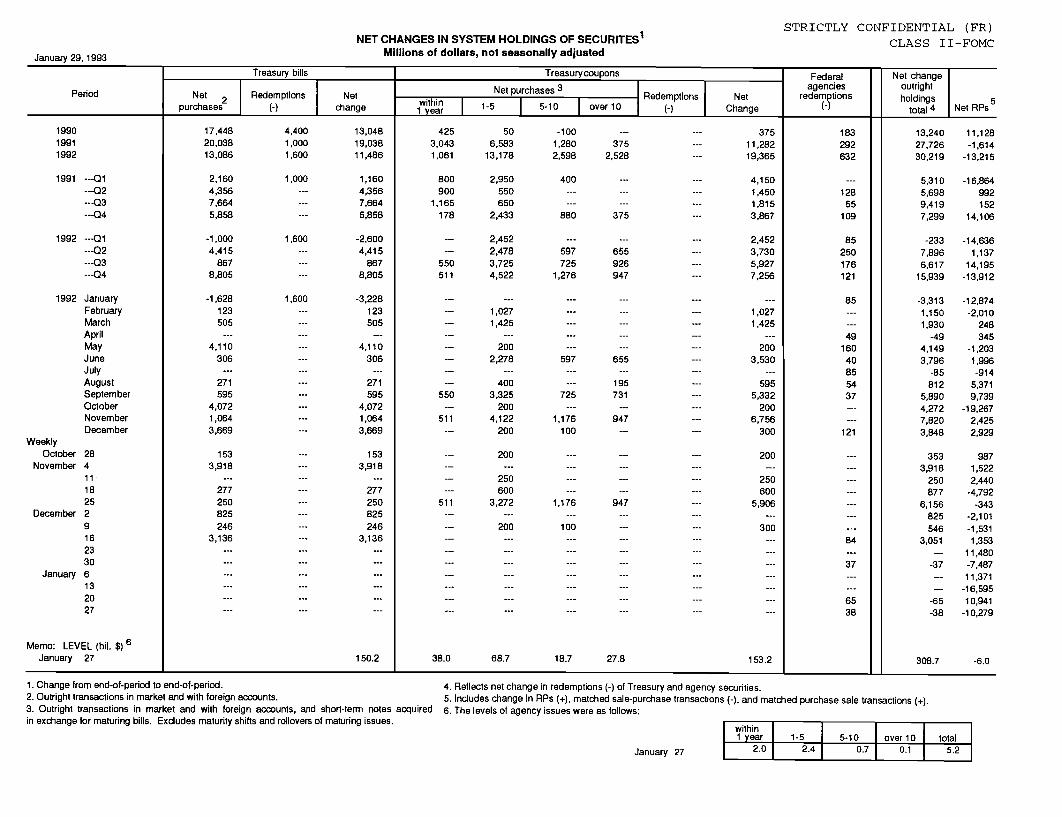
January 29, 1993
NET CHANGES IN SYSTEM HOLDINGS OF SECURITES 1
Millions of dollars, not seasonally adjusted
STRICTLY CONFIDENTIAL (FR)CLASS II-FOMC
Treasury bills Treasurycoupons Federal Net changeSedemtios Net purchases 3 agencies outright
Period Net 2 Redemptions Net with-i Net purchses Redemptions Net reem s holdingspurchases (-) change 1ye 1-5 5-10 over 10 (-) Change total4 Net RPs
1992 ---Q1---Q2---Q3--- 04
1992 JanuaryFebruaryMarchAprilMayJuneJulyAugustSeptemberOctoberNovemberDecember
WeeklyOctober 28
November 4111825
December 29162330
January 6132027
Memo: LEVEL (bil. $) 6January 27
17,44820,03813,086
2,1604,3567,6645,858
-1,0004,415
8678,805
-1,628123505
4,110306
271595
4,0721,0643,669
1533,918
277250825246
3,136
4,4001,0001,600
1,000
1,600
1,600
---.
---
13,04819,03811,486
1,1604,3567,6645,858
-2,6004,415
8678,805
-3,228123505
4,110306
271595
4,0721,0643,669
1533,918
277250825246
3,136
150.2
4253,0431.061
506,583
13.178
800 2,950900 550
1,165 650178 2,433
-- 2,452-- 2,478
550 3,725511 4,522
1,0271,425
2002,278
4003,325
2004,122
200
200
250600
3,272
200
68.7
-1001,2802,598
400
880
3752,528
375
597 655725 926
1,276 947
37511,28219,365
4,1501,4501,8153,867
2,4523,7305,9277,256
1,0271,425
2003,530
5955,332
2006,756
300
200
250600
5,906
300
153.218.7 27.8
13,24027,72630,219
5,3105,6989,4197,299
-2337,8966,617
15,939
-3,3131,1501,930
-494,1493,796
-85812
5,8904,2727,8203,848
3533,918
250877
6,156825546
3,051
-37
-65-38
11,128-1,614
-13,215
-16,864992152
14,106
-14,6361,137
14,195-13,912
-12,874-2,010
248345
-1,2031,996-914
5,3719,739
-19,2672,4252,929
9871,5222,440
-4,792-343
-2,101-1,5311,353
11,480-7,48711,371
-16,59510,941
-10,279
308.7 -6.0__________ .L.L ______________
1. Change from end-of-period to end-of-period. 4. Reflects net change in redemptions (-) of Tre,2. Outright transactions in market and with foreign accounts. 5. Includes change in RPs (+), matched sale-pu3. Outright transactions in market and with foreign accounts, and short-term notes acquired 6. The levels of agency issues were as follows:in exchange for maturing bills. Excludes maturity shifts and rollovers of maturing issues.
asury and agency securities.rchase transactions (-), and matched purchase sale transactions (+).
January 27
within1 year 1-5 5-10 over 10 total
2.0 2.4 0.7 0.1 5.2