Embed Size (px)
Citation preview

HAL Id: hal-00568865https://hal-mines-paristech.archives-ouvertes.fr/hal-00568865
Submitted on 23 Feb 2011
HAL is a multi-disciplinary open accessarchive for the deposit and dissemination of sci-entific research documents, whether they are pub-lished or not. The documents may come fromteaching and research institutions in France orabroad, or from public or private research centers.
L’archive ouverte pluridisciplinaire HAL, estdestinée au dépôt et à la diffusion de documentsscientifiques de niveau recherche, publiés ou non,émanant des établissements d’enseignement et derecherche français ou étrangers, des laboratoirespublics ou privés.
Flexibility and reliability in long-term planning exercicesdedicated to the electricity sector
Nadia Maïzi, Mathilde Drouineau, Edi Assoumou
To cite this version:Nadia Maïzi, Mathilde Drouineau, Edi Assoumou. Flexibility and reliability in long-term planningexercices dedicated to the electricity sector. XXIe World Energy Congress, Sep 2010, Montreal,Canada. 20 p. �hal-00568865�

Flexibility and reliability in long-term planning
exercises dedicated to the electricity sector
Nadia Maızi∗ Mathilde Drouineau∗ Edi Assoumou∗
Vincent Mazauric‡
XXI World Energy Congress
Montreal, September 12 to 16, 2010
Abstract
Long-term planning models are useful to build plausible options for future energy
systems and must consequently address the technological feasibility and associated
cost of these options. This paper focuses on the electricity sector and on problems
of flexibility and reliability in power systems in order to improve results provided by
long-term planning exercises: flexibility needs are integrated as an additional crite-
rion for new investment decisions and, reliability requirements are assessed through
the level of electrical losses they induced and a related cost. These approaches are
implemented in a long-term planning model and demonstrated through a study of
the Reunion Island.
Keywords: – Long-term energy planning. Flexibility. Reliability of supply –
Introduction
Electricity is a very convenient way to deliver huge amounts of power in areas where
demand is concentrated. Due to the predicted population densification, electricity
consumption is set to significantly increase over the next decades. Besides, the Interna-
tional Energy Agency estimates that during the next thirty years US$10 trillion will be
spent on generation, transmission and distribution of electricity [1], in order to replace
existing capacities in developed countries, to accompany the development of energy
markets in developing countries or to substitute energy vectors that are less clean or
growing scarce.
In this context, two critical features challenge forthcoming changes in power systems:
• the emergence of different paradigms for serving electricity than those for which
the system was designed [2]. For instance, high shares of renewable energy
∗N. Maızi, M. Drouineau and E. Assoumou are with MINES ParisTech, Centre for Applied Mathe-matics. Corresponding author: M. Drouineau, [email protected]
‡V. Mazauric is with Schneider Electric, Strategy & Innovation.
1

sources may become a critical aspect of future energy systems, both for cen-
tralized scheme, with the Desertec concept [3], and for distributed architecture,
with the smartgrid concepts [4].
• the will to improve the energy efficiency of electrical power transmission, given
that the current system clearly lacks efficiency. For instance, since 1950 in the
US, electrical losses have been twice as high as electricity consumption as pointed
out in [5] and illustrated in figure 1 for the industrial sector (same trends for the
commercial and residential sectors).
Figure 1: Industrial Total Energy Consumption, Major Sources [5]: electricity use (and relatedlosses) expanded dramatically.
Moreover, the world net generation of electricity increasingly relies on fossil fuels as
shown in figure 2, which implies a higher impact on the environment due to the level
of greenhouse gas emitted by the electrical sector.
Figure 2: Electricity generation in TWh by fuel since 1971 [6]. Other includes geothermal,solar, wind, combustible renewables and waste, and heat.
These issues stress the need for assessing future electrical power systems and the
MARKAL (MARKet ALlocation) type of technology-rich models provide a partial
solution to this problem [7, 8, 9]. Actually, models for energy planning – like the
MARKAL family of models – have proven useful to determine plausible evolutions of
2

the energy sector in the mid- to long-term when facing strong environmental pressures,
such as carbon mitigation or fossil energy depletion. Indeed, this kind of models offers
substitution possibilities throughout the whole energy chain and subsequently enables
to address different issues such as pointing out the main drivers of the energy system
at a given regional scale, anticipating changes in and impacts of energy prices, or
estimating pollutant emissions.
However, the feasibility of the results provided by energy planning models – namely
their sustainability and robustness – depends on the description of spatiality and time
constraints of power systems:
• Spatiality constraints are related to the geographical distribution of power plants,
the structure and availability of the transmission network, and the location of the
consumers.
• Time constraints are related to the electric current and the management of the
network in order to minimize the variations in tension and frequency at any
time, while keeping the system within safety limits. After recovering a stationary
behavior, the total electric power supplied by the stations must be equal to the
network demand. In order to ensure this power balance in real time, electricity
production modes will be chosen for their dynamic nature and for their location
in the network.
These spatiality and time constraints come from the needs for flexibility and reliabi-
lity when operating power systems. In this paper, we choose to improve the description
of flexibility and reliability requirements in long-term energy planning models in order
to provide more plausible results for the electricity sector. We quantitatively address
these issues in section 1.2 and 2.2, respectively for the flexibility and reliability needs.
We start with a preliminary presentation of the current MARKAL modeling ap-
proach for the electricity sector. The paper is then divided into three contributions:
1. We present an augmented MARKAL model that introduces flexibility as an addi-
tional criterion for electricity generation investments: the choice of power stations
relying on a cost minimization is then tempered by specific technical constraints
(section 1).
2. We describe reliability requirements on power systems and we present a metho-
dology that provides the cost of reliability of supply in future power systems.
This analysis is based on a thermodynamic approach, which enables a synthetic
description of power transmission (section 2).
3. Finally, we study the case of the Reunion Island for which we conduct a long-
term analysis of the electricity sector, and for which we aim at implementing
the approaches presented in sections 1 and 2. The Reunion Island is interesting
because it relies on a small and isolated power system, which exarcerbates the
needs for flexibility and reliability; and because they aimed to have in 2030 an
energy consumption based to 100% on renewable energy sources [10] (section 3).
3
The last section gives some concluding remarks.
Preliminary presentation of the MARKAL models
To start with, we present the main features of the MARKAL long-term planning models
and underline some strengths and weaknesses concerning the representation of the
electricity sector.
Long-term global prospective models permit the assessment of multi-sectoral energy
policies and are therefore persuasive. Among these models, the MARKAL family of
models are technological models developed since the mid-eighties [7] under the auspices
of the International Energy Agency [8]. MARKAL, in its basic version, is a technically
optimum model. It relies on an explicit formulation of the input/output relationships
for each technology and minimizes - over the chosen time horizon and for a given final
outcome - the actualized global cost. The optimization is subject to constraints such
as energy management features, caps for CO2eq emissions, limitations on fuel shares in
electricity generation, etc. The decision variables depend on the choice of the activity
level of technologies, and of capacity investments. The equilibria of energy flows are
generally expressed over the year and evaluated on total energy rather than on hourly
power demand. A synthetic description of the input/output relationships is given in
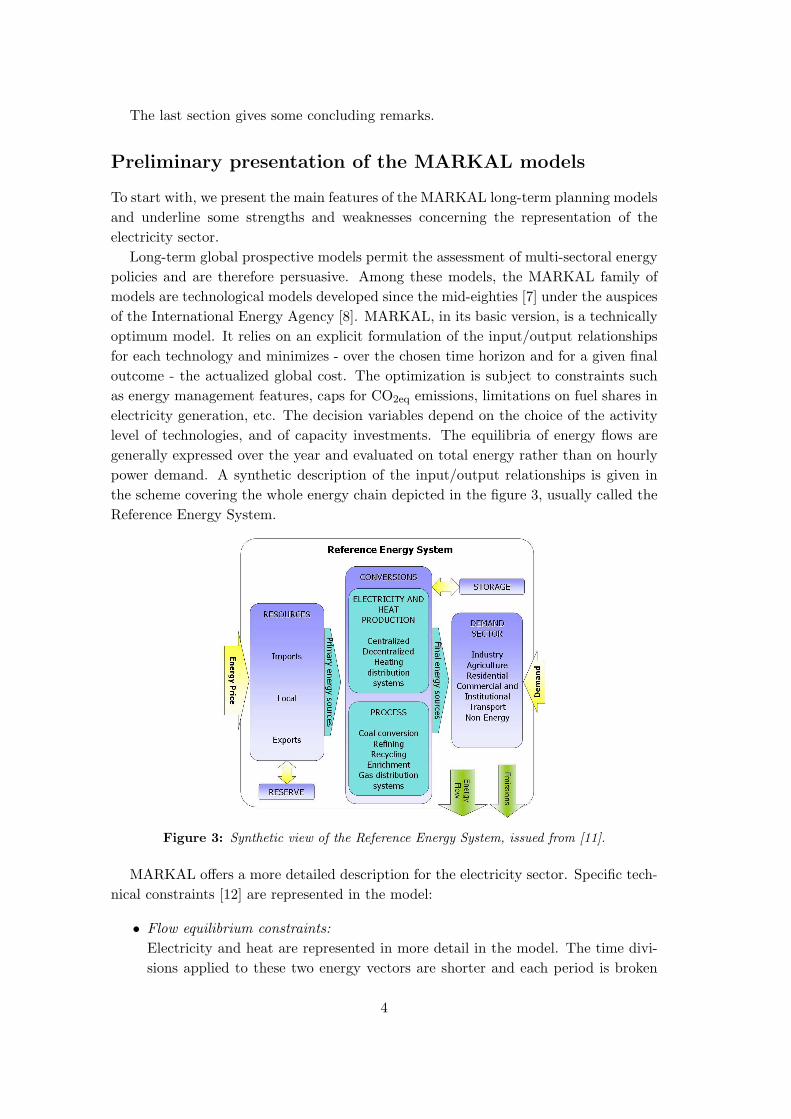
the scheme covering the whole energy chain depicted in the figure 3, usually called the
Reference Energy System.
Figure 3: Synthetic view of the Reference Energy System, issued from [11].
MARKAL offers a more detailed description for the electricity sector. Specific tech-
nical constraints [12] are represented in the model:
• Flow equilibrium constraints:
Electricity and heat are represented in more detail in the model. The time divi-
sions applied to these two energy vectors are shorter and each period is broken
4

down into six sub-periods showing the combinations between, on the one hand,
three seasons (summer, winter, intermediate), and on the other hand, day and
night. The flux equilibrium equations are then published separately for each of
these sub-periods.
• Peak reserve capacity constraints:
A peak reserve constraint guarantees the setting-up of a supplementary capa-
city reserve to cope with high demand periods. A peak equation stipulates that
the total production capacity must be oversized by a certain percentage1 to sa-
tisfy the demand (for exports, processes and demand technologies) and to insure
against several contingencies. It forces to increase the production capacity by the
chosen level of reserve. The user specifies two parameters: a global electricity or
heat reserve factor, and the contribution2 of each electricity or heat production
technology to the reserve factor.
1 Flexibility desciption in MARKAL
1.1 Description of the need for flexibility
The need for flexibility is related to the structure of the load curve: installations that
run for a relatively long time throughout the year must be installed and actually used.
Therefore, to satisfy the electricity demand, all functioning electricity systems require,
a priori, the installation and effective use of power stations devoted to the baseload
supply, as well as others devoted to peakload supply (few hours per year). There is a
strong link between installation decisions motivated by power dimensioning, and the
effective use of these installations for energy supply. Thus, the need for flexibility in time
management of electricity systems corresponds to a challenging technical constraint,
making it necessary to use more expensive technologies that can rapidly adapt their
production level in order to meet the consumption level.
These flexibility constraints are on the whole largely ignored in MARKAL models,
whereas in reality requirements for flexibility call for long-term investments. Indeed,
least expensive ways of production are favored, as the MARKAL approach relies on the
minimization of economic criteria [13] – which aims at choosing the electricity system
that is cost-efficient. Ignoring flexibility presents several drawbacks for the MARKAL
results in the electricity sector. They are listed below:
1. It leads to an over-estimation of the importance of power stations that have low
production costs but may also have low reactivity on the load curve: this impacts
the capacity needs, the type of technologies chosen, and their level of use.
2. The system’s running costs can be miscalculated since, even with identical tech-
nologies, the constraints of operating at partial load increase the costs of meeting
1For instance, in Metropolitan France, the value of the peaking factor can be set to 1.6.2 The coefficient (from 0 to 1) specifies the fraction of the technology’s capacity that is allowed to
contribute to the peak load and makes it possible to differentiate between the contributions of differentpower plants. Nuclear power plant has a peak coefficient of 1, whereas wind farm has a peak coefficientof 0.2 or 0.3.
5

with demand (slower amortization, the need to use a greater number of power
stations).
3. The consequences of the increased share of intermittent renewable sources in the
power generation mix are not fully handled. In France, the theoretical potential is
estimated at 66 TWh for 30 GW of onshore wind power and 97 TWh for 30 GW of
offshore wind power [14]. As development of these power plants increases, there
will be a greater need for more flexibility. The feasibility of scenarios figuring
a low share of thermal production and a large share of wind or solar power is
questionable. On top of that, intermittent sources call for thermal production
capacities. As these plants are the only direct sources of greenhouse gas emissions
in the electricity sector, they counterbalance the expected potential for reducing
emissions attributed to renewable energy sources. This should be revised in order
to better assess greenhouse gas emissions.
For these reasons, flexibility has to be integrated as a constraint within the model’s
framework.
1.2 An augmented flexible MARKAL model
This approach quantifies the average production needs for several specific operating
modes, such as semi-base load or peak, and then introduces flexibility as one of the
model’s selection criteria. It was applied to the French electricity sector in [11], which
is dominated by nuclear power. Technological choices are differentiated for each mode,
and the flexibility criterion, defined globally, does not depend on short time divisions for
the model’s equations. Its quantitative assessment, relies on a time analysis that is both
shorter and easier to put into place outside the model. The pre-existent mechanisms
specific to the electricity sector are conserved.
Results for the standard and for the augmented MARKAL model – taking flexibility
into account – are only given for fossil plants regarding that these power plants are
sensitive to dynamical features (figures 4 and 5). The figures compare fossil capacities
effectively used for electricity generation.
With the standard MARKAL model, gas, fuel or oil power plants are installed to
satisfy the peak equation, but the figure 4 shows that they are not used for electri-
city production. Actually, power stations are used over long periods of time leading
preferentially to baseload profiles of power plants running with cheaper fuels.
With the augmented approach, the figure 5 shows on the contrary that oil power
plants appear in the electricity generation. Indeed, even if they are more expensive, they
are essential plants to meet the peak demand. It confirms that the optimization process
with the augmented MARKAL model provides results more plausible concerning the
electricity sector. With this model, we also observe that a greater amount of energy is
produced from fossil fuels (200 PJ in 2030 compared to 150 PJ), which corresponds to
a best representation of the need for flexible technologies.
When flexibility is not properly handled, the results issued from MARKAL reflect
a minimal (under-constrained) condition to satisfy global electricity demand. Thus it
6

Figure 4: Fossil plant production 2000-2030: a standard MARKAL approach.
Figure 5: Fossil plant production 2000-2030: an augmented MARKAL approach.
fails to address properly the questions related to environmental issues, and namely the
level of carbon emissions - except for regions where fossil fuels dominate the baseload
mix. In France, the level of greenhouse gas emissions depends on the precision of the
thermal production assessment [11].
Regarding these results, flexibility appears to be a key parameter for reaching a
better representation of the electricity generation system and consequently achieving
sustainable power systems. It has also appeared that providing power systems with
enough installed capacities – both satisfying the electric demand and following the load
curve – is difficult when ignoring the need for flexibility. Flexibility is a step towards
planning long-term generation shares where installed capacities are well-anticipated.
7

2 The need for reliability of supply
At the side of the need for flexibility also stands the question of the reliability of
electricity supply. Reliability of supply relies on the ability of the electric system
to withstand sudden disturbances [15] and is ensured by technical properties of the
production means.
Currently, power systems clearly lack of efficiency because this sector is severely
disadvantaged by the efficiency of the Carnot cycle of the thermal units, which are about
one order of magnitude greater than electrical losses at the transmission, distribution
and consumption levels (figure 6).
Figure 6: Energy supply-chain in Mtoe in 2007 (e!Sankey diagram). The electricity sector isseverely disadvantaged by the efficiency of the Carnot cycle of the thermal units, and by theelectrical losses at the transmission, distribution and consumption levels [6].
In this context, renewable and distributed energy sources seem to be attractive
alternatives for cleaner and unlimited power generation. Furthermore, a wide integra-
tion of renewable energy sources is expected to improve the overall efficiency of power
systems. Renewable energy sources decrease electrical losses at the production level,
whereas distributed energy sources decrease electrical losses at the transmission and
distribution levels. However, such a gain in efficiency may be counterbalanced by a
decrease in the reliability of electricity supply. The reliability of electricity supply is
defined as the capacity of a power system to handle safely sudden disturbances, such as
production or load fluctuations. To maintain an appropriate reliability of supply, power
systems must provide amounts of energy dedicated to the reliability of supply, which
induces additional investments and extra-losses. Consequently, the need for reliability
of supply may decrease the expected gain in efficiency with renewable and distributed
energy sources. In this section, we introduce the reliability of electricity supply within
an optimal discussion and aim at assessing the cost of reliability of supply.
8
2.1 Description of reliability requirements
Firstly, in order to provide relevant comparisons between future electrical systems, we
must define accurately the three main kind of losses on power systems:
Losses induced by the Carnot cycles The electricity industry is severely disad-
vantaged by the efficiency of the Carnot cycle of the thermal units, which are
about one order of magnitude greater than electrical losses at the transmission,
distribution and consumption levels (figure 6).
Conveyance losses occur during power transmission through the network. They
mainly depend on whether or not the transmission grid is congested, on the volt-
age level, or on the network architecture. They can be assessed from the duration
of peak, semi-base or base loads. When production capacities are centralized,
transmission takes place through longer distances, and conveyance losses may in-
crease, despite high voltage lines. In fact, for a given geographical distribution of
loads and generators, the more the meshing of the grid increases, the more the
Joule losses decrease, the voltage profile improves and the system is more stable.
Reliability-induced losses are linked to the needed level of reliability. The level of
losses corresponds to the stocks of electromagnetic coupling energy and of kinetic
and spinning energy required to handle load fluctuations. A part of the electricity
production must be dedicated to maintain the appropriate stocks of electromag-
netic, kinetic and spinning energy. Consequently, the electricity industry must be
(over-)sized to produce enough electricity for the consumers and also for providing
the stocks. The part of the electricity dedicated to the stocks induces investments
in dedicated capacities and additional electrical losses.
With a wide integration of renewable energy sources on power systems, the losses
induced by the Carnot cycles are expected to decrease, as energy production will rely
on fewer thermal units. With a wide development of distributed energy sources, the
conveyance losses are expected to have similar benefits, as the average distance be-
tween production and consumption decrease. Conversely, reliability-induced losses are
expected to increase, as renewable and distributed energy sources do not maintain suf-
ficient stocks of electromagnetic coupling energy and of kinetic and spinning reserves.
Secondly, we describe more precisely reliability of electricity supply. According to the
UCTE handbook [15], the reliability of an electric system is addressed by considering
both the adequacy of the system, i.e. the ability to supply the aggregate electrical
demand and energy requirements of the customers at all times, and the security of the
system, i.e. the ability to withstand sudden disturbances such as unanticipated loss of
system elements.
To ensure these two elements, power systems rely on the dynamic management
of frequency and voltage [16]. Frequency and voltage are crucial quantities in power
systems, whose great deviations can lead to brownouts or power outages when the
system recovers from production or load fluctuations or when it experiences transient
9

states (e.g. lightnings). Basically, maintaining appropriate variations of frequency
depends on the levels of kinetic and spinning reserves on the system, and maintaining
appropriate variations of voltage depends on the electromagnetic energy on the system.
Levels of kinetic and spinning reserves are ensured by the mechanical inertia of
the rotating generators on the system and can be adjusted by investing in weighing
generation machines or flywheel. The electromagnetic coupling energy is the energy in-
volved in the electromechanical and electromagnetic power conversions. It is absolutely
necessary to enable power transmission and it is stocked in electromagnetic materials,
namely rotating power machines and transformers. The level of electromagnetic cou-
pling energy can be adjusted by investing preferentially in rotating power machines and
transformers.
Furthermore, with high shares of renewable energy sources on power system, levels of
electromagnetic energy and of kinetic and spinning reserves decrease, whereas intermit-
tent energy sources induce abundant production fluctuations, with higher magnitude.
High shares of renewable energy sources in electricity mix may decrease the reliability
of electricity supply.
2.2 Assessing the cost of reliability
In the following, we intend to compare the level of network losses for power systems
with different production shares of renewable energy sources – in particular intermittent
ones. To do so, we apply variational principles deduced from thermodynamics to achieve
a global description of power systems and of their subsequent level of losses [17, 18].
The system on which we apply the variational principles is the electromagnetic field,
conveying electricity from the generation units to the consumers:
1. In the thermodynamic framework, the deviation between the mechanical power
flowing through the network and the variation with time of the Helmoltz free-
energy F gives an evaluation of the Joule losses PJoule, at the transmission, dis-
tribution and consumption levels. PJoule gives an evaluation of the irreversibility
experienced by the system. According to the thermodynamics, Joule losses are
always positive and the lower they are, the more reversible is the evolution of
the system. The latter statement can be expressed with an optimal condition,
which means that the system always tends to minimize the Joule losses during its
evolution. Ideally, a centralized power system can be described from the Helmoltz
free-energy, and this reversibility condition provides the very minimum amount
of Joule losses during the power transaction and matches the conveyance losses.
Added to the losses induced by the Carnot cycles, it gives the total amount of
primary energy lowered in a centralized system.
2. Conversely, in order to explicitly take reliability into account, the description
should also include the inertial behavior of the electromagnetic coupling. Hence,
the actual level of Joule losses should be assessed from another reversibility con-
dition obtained with the Gibbs free-energy G = F − ΦIexc, where ΦIexc is the
electromagnetic coupling and Iexc the excitation provided to the generator. As a
10
physical result, the latter description provides the level of both conveyance and
reliability losses. Compared to the case (1), the argument of the optimum is
drastically changed. This leads to new stability requirements for dynamic man-
agement.
Added to the losses induced by the residual Carnot cycles, it gives the total
amount of primary energy lowered in a distributed system.
This analysis provides the level of Joule losses PJoule for operating electric power
systems in a reliable way. It will enable to compare the overall amounts of losses for
a centralized power system and for a distributed one, when the electrical demand and
the level of reliability of supply are the same. The cost of electricity production in
centralized systems is severely disadvantaged by the efficiency of the Carnot cycle of
the thermal units, whereas in distributed system it is more penalized by the cost of
reliability of electricity supply.
3 The case of the Reunion Island
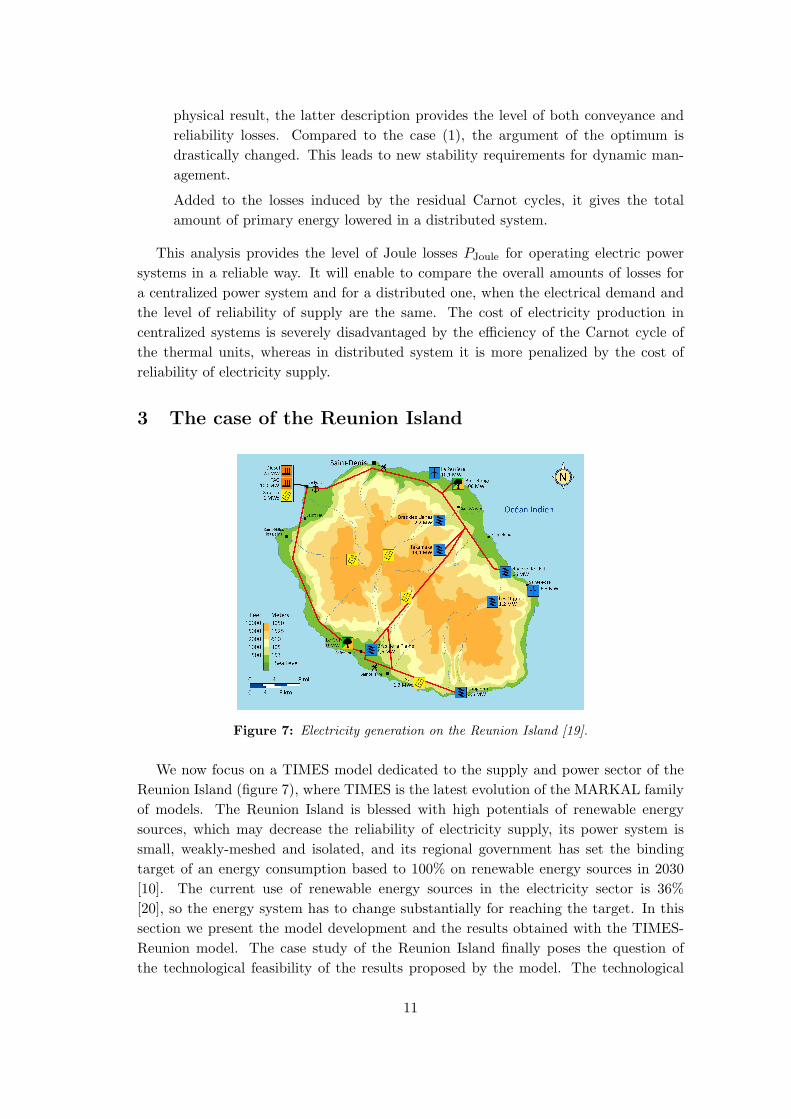
Figure 7: Electricity generation on the Reunion Island [19].
We now focus on a TIMES model dedicated to the supply and power sector of the
Reunion Island (figure 7), where TIMES is the latest evolution of the MARKAL family
of models. The Reunion Island is blessed with high potentials of renewable energy
sources, which may decrease the reliability of electricity supply, its power system is
small, weakly-meshed and isolated, and its regional government has set the binding
target of an energy consumption based to 100% on renewable energy sources in 2030
[10]. The current use of renewable energy sources in the electricity sector is 36%
[20], so the energy system has to change substantially for reaching the target. In this
section we present the model development and the results obtained with the TIMES-
Reunion model. The case study of the Reunion Island finally poses the question of
the technological feasibility of the results proposed by the model. The technological
11

Real terms (2008 prices) Unit 2000 2008 2015 2020 2025 2030
OECD steam coal imports $2008/ton 41.22 120.59 91.05 104.16 107.12 109.4IEA crude oil imports $2008/barrel 34.3 97.19 86.67 100.00 107.50 115.00Heavy fuel oil e2008/ton - 196 174 201 216 231Distillate fuel oil e2008/hl - 47 42 48 51 55
Table 1: Fossil-fuel price assumptions [21].
feasibility may be studied in the light of the flexibility and reliability requirements
presented previously.
3.1 Model development
3.1.1 Resources supplies
The resources in the Reunion Island are domestic sugarcane bagasse and importations of
coal, and fuel oils (heavy and distillate). The fossil energy import prices are based on the
projections of the World Energy Outlook [21]. We assume that fuel oil prices follow the
projections of crude oil prices. Fossil-fuel price assumptions are listed in table 1. The
Reunion Island also produces around 10% of its annual electricity consumption with the
combustion of the sugarcane bagasse. The cost of the bagasse sugarcane is set to zero as
the bagasse is a co-product of the sugar factories and that these factories are on the same
production areas than the thermal power plants using sugarcane bagasse. Electricity
production from bagasse takes place in the power plants of Le Gol (111.5 MW) and
Bois-Rouge (100 MW), which also work with coal, thus producing electricity apart from
the season of sugar production.
3.1.2 Electricity demand
In 2008, the general features of the electricity sector were the followings [20, 22]:
Electricity consumption rose up to 2546 GWh, divided into 50% coal, 14% other
fossil fuels, 25% hydroelectricity, 10% sugarcane bagasse and 1% others; the electricity
peak demand was 408 MW; and the total installed capacities were slightly less than
650 MW.
Since 1995, the growth rate of electricity demand has decreased from 6.7% to 2.8%,
and it is expected to continue decreasing and reach a value between 1 and 2% in
2025 [20]. A projection for electricity consumption growth until 2025 was provided by
Electricite de France (EDF) [20] (see table 2).
3.1.3 Existing and coming power plants
Data for existing capacity, capacity factors, and efficiency are derived from reports on
existing power plants by EDF and the Regional Agency for Energy in the Reunion Island
(ARER) [20, 22]. Following discussion with experts, some of the technico-economical
data have been revised to correspond more accurately to the electricity mix, in parti-
cular with the current spread of renewable energy sources.
12

Unit 2008 2010 2015 2020 2025 2030
Electricity consumption GWh 2 546 2 710 3 110 3 500 3 805 4100Growth rate % 3.4 3.2 2.6 2.4 1.5 1.5Power MW 408 445 520 595 670 720
Table 2: Electricity consumption growth in the Reunion Island from the medium scenario ofEDF [20]. This scenario is extended from 2025 to 2030 with a growth rate of 1.5%.
Energy sources Current levels Potentials
Biomass 260 GWh 400 GWhHydropower 121 MW (553 GWh) 177 MW until 2012,
then 268 MWWind 16,8 MW 50 MWSolar PV 10 MW 160 MWOcean Thermal – 10 MW in 2020,Energy Conversion 100 MW in 2030Wave Energy – 30 MW (by 2014)Geothermy – 30 MW
Storage Capacities – 1 MW in 2009,then 10 MW
Table 3: Renewable energy potentials in the Reunion Island.
Costs and performance characteristics of new power plants are derived from the
database of the European RES20203 project.
3.1.4 Renewable potentials
According to experts and to the literature, the available renewable sources for the
Reunion Island and their technical and economic resource potential are those presented
in the table 3.
3.1.5 Scenarios specification
Various scenarios are investigated wherein the electricity system is required to simul-
taneously meet a given level of electricity demand (table 2) and reach the 2030 target
with an electricity consumption based to 100% on renewable energy sources. Height
scenarios are built around three main assuptions concerning levels of fossil fuels im-
ports, electricity demand, and sugarcane bagasse potential. They are summarized in
the table 4:
• An upper limit for the fossil fuels imports is set in 2008 and linearly decreased
to 0 in 2030. The objective is to study the evolution of the electricity production
3RES2020 is a European project which aims at monitoring and assessing the implementation of thedirectives on Renewable Energy Sources and the policy recommendations for 2020 in the EU-27. Withthis project, a number of future options for policies and measures are defined and studied with the useof TIMES.
13

without fossil fuels. We propose an alternative scenario with a softened constraint,
where the limit is only set on coal imports. These scenarios are compared with a
business-as-usual with no limits on importations.
• We consider scenarios with lower electricity consumption to study how lowering
the demand helps reaching the 100% target.
• For all these scenarios, we set the potential for the renewable energy sources
at the maximum rates described previously, except for sugarcane bagasse. We
finally consider the option with a higher available potential, where the sugarcane
industry is only dedicated to energy production.
Limit on imports Sugarcane BagasseDemand No limit Limit on coal Limit on all fuels Higher potential
Standard MedDEM MedDEM NoCOA MedDEM NoFOS MedDEM NoFOS UpBAGLow LowDEM LowDEM NoCOA LowDEM NoFOS LowDEM NoFOS UpBAG
Table 4: Scenarios specification. The scenarios are built around three main assuptions con-cerning electricity demand, fossil fuel imports and sugarcane bagasse potential.
The scenario MedDEM corresponds to the business-as-usual scenario.
3.2 Results
3.2.1 Electricity shares of 2008
In table 5, we compare the 2008 electricity production given by the model with actual
data [20] and the similarity of the results is encouraging. In particular, the proportion
between production based on fossil fuels and production based on renewable sources
are the same.
The main difference concerns the production based on fossil fuels. With the model,
coal participates to a higher share of electricity production. This is explained by the
fact that in this TIMES-Reunion model, load curves and peak demands are not fully
described. Thus, the modeled electricity system requires in a lesser extent power plants
dedicated to peak loads such as fuel oil turbines.
3.2.2 Towards an electricity consumption based to 100% on renewable en-
ergy sources
We then present the evolution of the electricity mix when the limitation of coal or all
fossil fuel imports is set on the standard level of electricity demand. In the business
as usual scenario (figure 8(a)), the actual shares of production roughly follow the in-
crease in the demand. However, there is no development of renewable energy sources
despite their potentials. This is explained by the cost of power plants relying on these
sources, compared to those relying on coal. The model may be improved with a precise
description of the incentives’ system favoring renewable energy sources or with another
14

Energy sources Model (%) EDF (%)
Coal 56.90 50.55Fuel Oils (Distillate and Heavy) 9.06 13.30
Sugarcane bagasse 10.21 10.31Hydroelectricity 21.71 24.86Wind energy 1.19 0.53Solar energy 0.41 0.42Municipal waste 0.52 0.03
Production 2 547 GWh 2 546 GWh
Table 5: The 2008 electricity shares given by the TIMES-Reunion model compared to theactual values of EDF [20].
constraint on the greenhouse gas emissions in the Reunion Island. Furthermore, in this
scenario, power plants based on fuel oils are still hardly used, which corroborates the
need to describe the time characteristics of the electricity demand.
The two other scenarios (figures 8(b) and 8(c)) show that there is a large room for
the development of renewable energy sources when a constraint is set on coal and all
fossil fuels import. In both scenarios, new renewable energy sources appear such as
geothermy, ocean thermal energy, or wave energy. Hydroelectricity increases sharply.
Nevertheless, with the constraint on both coal and petroleum products, the figure 8(c)
shows that around 500 GWh of electricity demand can not be met in 2030.
3.2.3 Lower growth of electricity demand
The decrease in the electricity demand may be due to two main features: a slower
growth rate of the demand, and a deep improvements of energy efficiency of end-use
devices. If electricity consumption goes in this direction, it will consequently ease the
Reunion Island to reach its ambitious target of 100% of renewable energy sources by
2030. The new electricity consumption growth is taken from a lower scenario also
provided by EDF [20]. The results with a lower electricity demand are depicted in the
figure 9, which presents the changes induced on the electricity mix.
3.2.4 Higher potential for sugarcane bagasse production
Finally, we consider a radical change of the sugarcane industry, where sugarcane pro-
duction is only dedicated to electricity production, as suggested in [10]. In this case,
the available potential of sugarcane bagasse is increased as the whole sugarcane is used
for energy purposes. Interestingly, it seems that the whole available potentials for
renewable energy sources can meet the lower electricity demand (figure 10).
15

(a) Business as Usual.
(b) Without importation of coal in 2030.
(c) Without importation of fossil fuels in 2030.
Figure 8: Shares of the electricity production for the electricity demand proposed in the table2. The importations of coal and petroleum products are constrained over the time horizon: fromtheir levels in 2008 to 0 in 2030.
16

Figure 9: Shares of the electricity production with a lower electricity demand.
Figure 10: Shares of the electricity production with a higher sugarcane bagasse potenatial anda lower electricity demand.
17

Concluding remarks
In this paper, we have studied spatiality and time constraints for power generation
system with the flexibility and reliability requirements. This work allows the following
understandings:
• On the one hand, flexible features of electricity are handled using an augmented
version of the MARKAL model. Regarding its results, flexibility appears to be
a key parameter for reaching a better representation of the electricity generation
system and consequently achieving sustainable systems. Taking flexibility into
account has made it possible to provide electric systems with enough installed
capacities, both satisfying the electric demand and following the load curve. It
is a step towards long-term planning models where electrical installed capacities
are well-anticipated.
• On the other hand, for reliability requirements, we have proposed a method that
provides the cost of reliability of supply. This method is based on a thermo-
dynamic approach applied to power systems. It emphasizes the need to take
reliability requirements into account for the design of future power systems. As
a result, the total cost of future energy systems may increase.
• Finally, we propose to implement the approaches dealing with the flexibility and
reliability needs of power systems in a TIMES model dedicated to the Reunion
Island. This case study is a good illustration of the previous results: its small
island grid without interconnection and the proposed shares for renewable energy
sources raise the two challenging issues – flexibility and reliability requirements
– for future power systems.
Acknowledgment
This research was supported by the Chair Modeling for sustainable development, driven
by MINES ParisTech, Ecole des Ponts ParisTech, AgroParisTech, and ParisTech; and
supported by ADEME, EDF, RENAULT, SCHNEIDER ELECTRIC and TOTAL.
18

References
[1] “World energy investment outlook 2003,” Organisation for Economic CO-
operation and Developement. International Energy Agency, Paris, Tech. Rep.
World Energy Outlook 11, 2003. [Online]. Available: www.iea.org/Textbase/
nppdf/free/2003/weio.pdf
[2] M. D. Ilic, “From hierarchical to open access electric power systems,” Proceedings
of the IEEE, vol. 95, no. 5, pp. 1060–1084, May 2007.
[3] DESERTEC. website: http://www.desertec.org/downloads/summary en.pdf.
[4] O. Siddiqui, “The green grid: Energy savings and carbon emissions reductions
enabled by a smart grid.” Electrical Power Research Institute, Palo Alto, CA,
Tech. Rep. 1016905, June 2008.
[5] “Annual Energy Review 2007,” DOE/EIA. http://www. eia. doe. gov/emeu/aer,
Whashington DC, USA, Tech. Rep. 0384, June 2008.
[6] Key world energy statistics from the IEA. International Energy Agency (Organ-
isation for Economic Cooperation and Development), 2007.
[7] L. Fishbone and H. Abilock, “MARKAL, a linear-programming model for energy
systems analysis: technical description of the BNL version,” International Journal
of Energy Research, vol. 5, no. 4, pp. 353–375, 1981.
[8] ETSAP. (Energy Technology Systems Analysis Programme) website:
http://www.etsap.org.
[9] E. Assoumou, M. Bordier, G. Guerassimoff, C. Grange, and N. Maızi, “La famille
MARKAL de modeles de planification energetique: un complement aux exercices
de modelisation dans le contexte francais,” Revue de l’energie, no. 558, 2004.
[10] ARER, “PETREL - Ile de la Reunion Plan Economique de Transition et de Re-
lance via des Energies 100% Locales a l’ıle de la Reunion,” Agence Regionale de
l’Energie Reunion, Tech. Rep., 2009.
[11] N. Maızi, E. Assoumou, M. Bordier, G. Guerassimoff, and V. Mazauric, “Key
features of the electricity production sector through long-term planning : the french
case,” in Power Systems Conference and Exposition, 2006. PSCE ’06. 2006 IEEE
PES, Atlanta, GA, Oct./Nov. 2006, pp. 1796–1801.
[12] “System for the analysis of global energy market, model documentation, volume 1.”
Energy Information Administration, US Department of Energy, Tech. Rep., 2003.
[Online]. Available: tonto.eia.doe.gov/FTPROOT/modeldoc/m072(2003)1.pdf
[13] C. Berger, R. Dubois, A. Haurie, E. Lessard, R. Loulou, and J. Waaub, “Canadian
markal: An advanced linear programming system for energy and environmental
modelling,” INFOR, vol. 20, pp. 114–125, 1992.
19

[14] “Programmation pluriannuelle des investissements de production electrique,” Min-
istere de l’economie et des finances, Tech. Rep., 2002.
[15] Operation Handbook - Glossary. European Network of Transmission Systems
Operators for Electricity, 2004.
[16] A. R. Bergen and V. Vittal, Power System Analysis, 2nd ed. Prentice-Hall Series,
2000.
[17] V. Mazauric, “From thermostatistics to Maxwell’s equations: a variational ap-
proach of electromagnetism,” IEEE Transactions on Magnetics, vol. 40, pp. 945–
948, 2004.
[18] V. Mazauric and N. Maızi, “A global approach of electromagnetism dedicated to
further long-term planning,” Proceedings in Applied Mathematics and Mechanics,
vol. 7, no. 1, pp. 2 130 003–2 130 004, 2007.
[19] G. Guerassimoff, N. Maızi et al., Iles et Energie: un paysage de contrastes. Les
Presses-MINES Paristech, 2008.
[20] EDF, “Bilan Previsionnel Pluriannuel : investissements en production (La
Reunion),” EDF - SEI, Tech. Rep., 2009.
[21] World Energy Outlook 2009. International Energy Agency (Organisation for Eco-
nomic Cooperation and Development), 2009.
[22] “Bilan energetique 2009 de l’ıle de la Reunion,” Observatoire Energie Reunion,
Agence Regionale de l’Energie Reunion, Tech. Rep., 2010.
20