Embed Size (px)
Citation preview
Fixed Income Investor Presentation
August 1, 2017
2
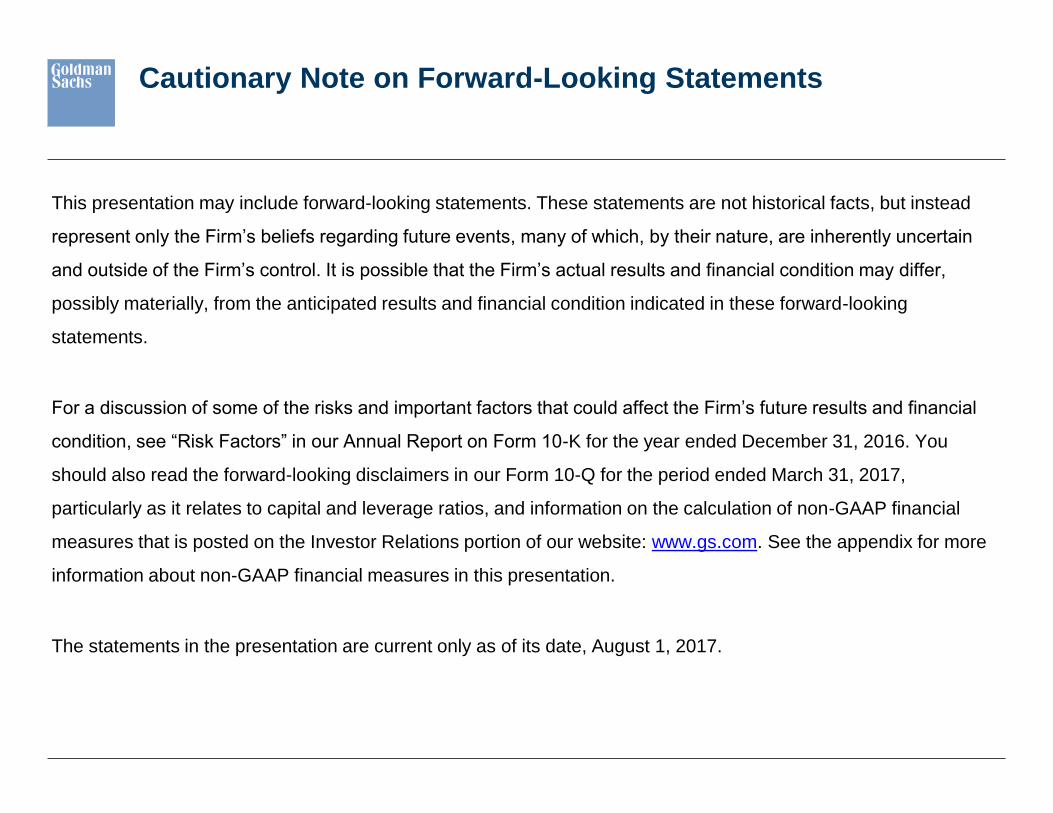
Cautionary Note on Forward-Looking Statements
This presentation may include forward-looking statements. These statements are not historical facts, but instead
represent only the Firm’s beliefs regarding future events, many of which, by their nature, are inherently uncertain
and outside of the Firm’s control. It is possible that the Firm’s actual results and financial condition may differ,
possibly materially, from the anticipated results and financial condition indicated in these forward-looking
statements.
For a discussion of some of the risks and important factors that could affect the Firm’s future results and financial
condition, see “Risk Factors” in our Annual Report on Form 10-K for the year ended December 31, 2016. You
should also read the forward-looking disclaimers in our Form 10-Q for the period ended March 31, 2017,
particularly as it relates to capital and leverage ratios, and information on the calculation of non-GAAP financial
measures that is posted on the Investor Relations portion of our website: www.gs.com. See the appendix for more
information about non-GAAP financial measures in this presentation.
The statements in the presentation are current only as of its date, August 1, 2017.
3
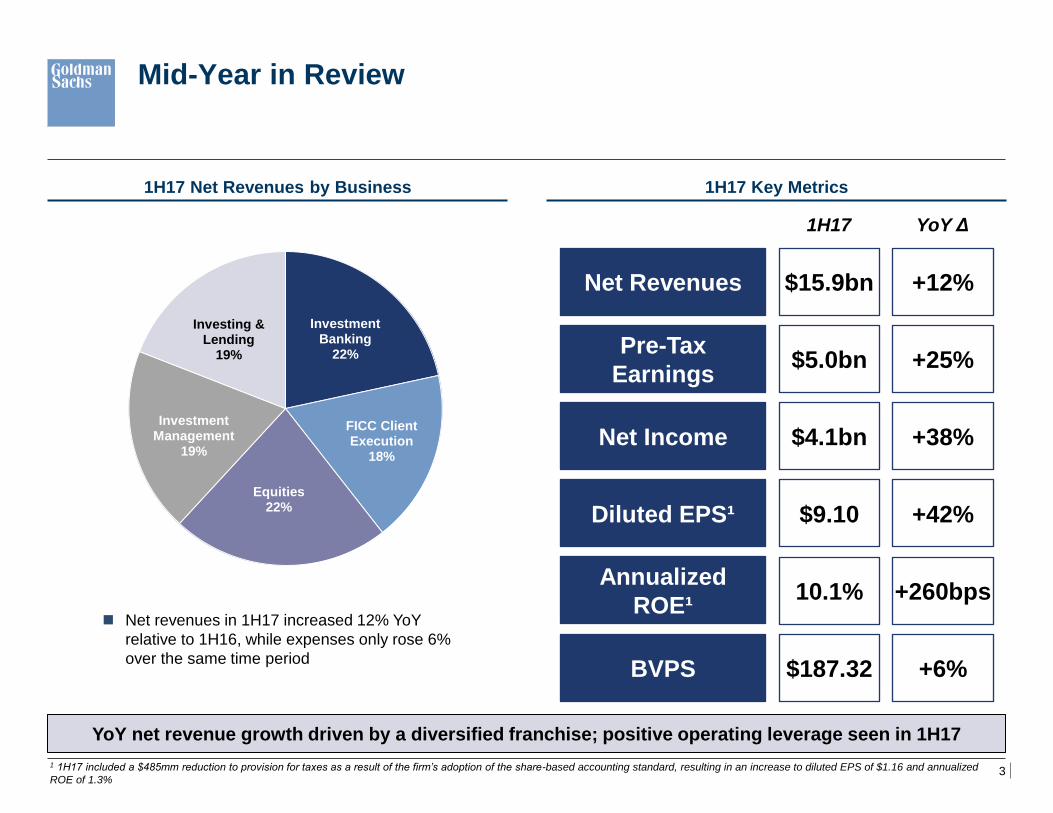
Mid-Year in Review
1H17 Key Metrics 1H17 Net Revenues by Business
YoY net revenue growth driven by a diversified franchise; positive operating leverage seen in 1H17
1 1H17 included a $485mm reduction to provision for taxes as a result of the firm’s adoption of the share-based accounting standard, resulting in an increase to diluted EPS of $1.16 and annualized
ROE of 1.3%
Net revenues in 1H17 increased 12% YoY
relative to 1H16, while expenses only rose 6%
over the same time period
$15.9bn Net Revenues
$5.0bn Pre-Tax
Earnings
$9.10 Diluted EPS¹
10.1% Annualized
ROE¹
$187.32 BVPS
Investment Banking
22%
FICC Client Execution
18%
Equities 22%
Investment Management
19%
Investing & Lending
19%
+12%
+25%
+42%
+260bps
+6%
YoY Δ 1H17
$4.1bn Net Income +38%
4
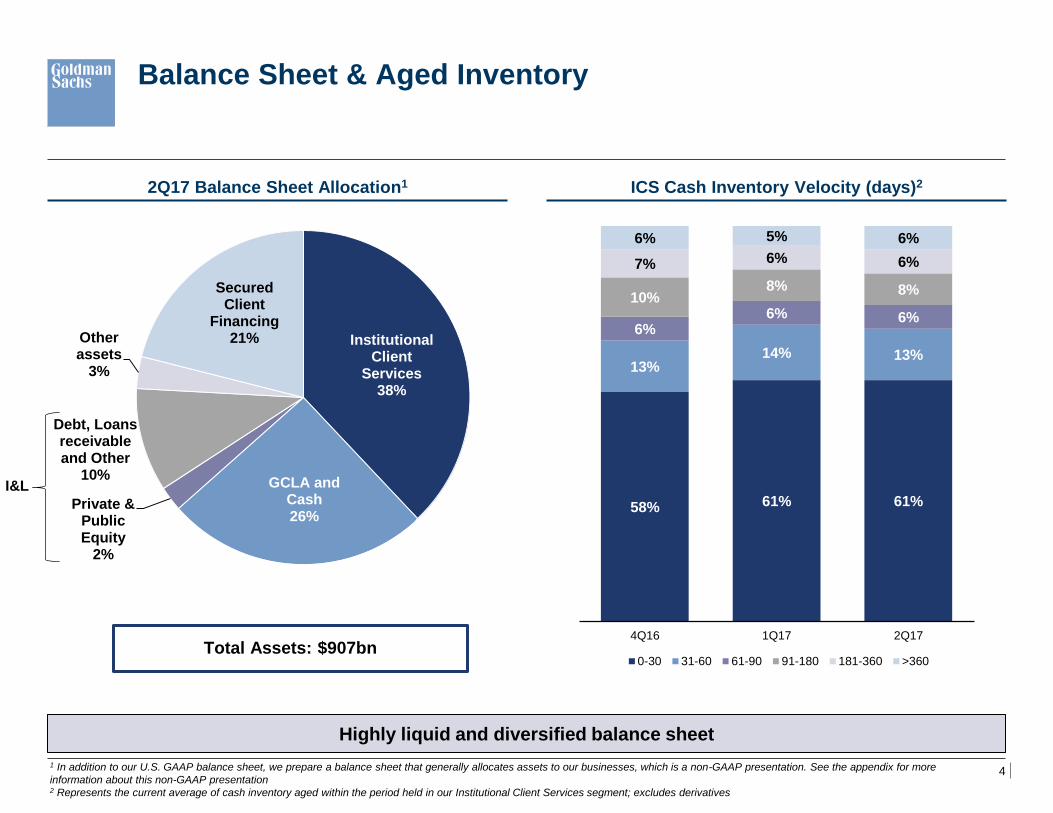
Balance Sheet & Aged Inventory
ICS Cash Inventory Velocity (days)2 2Q17 Balance Sheet Allocation1
Highly liquid and diversified balance sheet
1 In addition to our U.S. GAAP balance sheet, we prepare a balance sheet that generally allocates assets to our businesses, which is a non-GAAP presentation. See the appendix for more
information about this non-GAAP presentation 2 Represents the current average of cash inventory aged within the period held in our Institutional Client Services segment; excludes derivatives
Institutional Client
Services 38%
GCLA and Cash 26%
Private & Public Equity
2%
Debt, Loans receivable and Other
10%
Other assets
3%
Secured Client
Financing 21%
I&L
Total Assets: $907bn
58% 61% 61%
13% 14% 13%
6% 6% 6%
10% 8% 8%
7% 6% 6%
6% 5% 6%
4Q16 1Q17 2Q17
0-30 31-60 61-90 91-180 181-360 >360
5
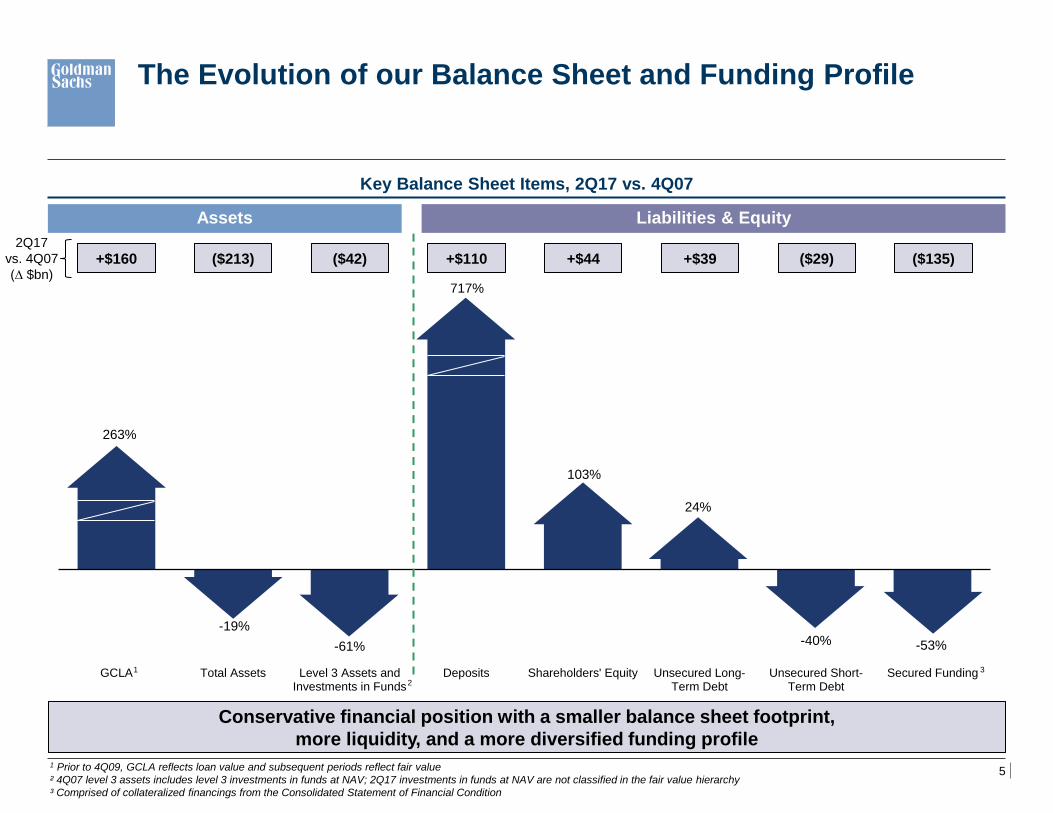
-19%
-61%
103%
24%
-40% -53%
GCLA Total Assets Level 3 Assets andInvestments in Funds
Deposits Shareholders' Equity Unsecured Long-Term Debt
Unsecured Short-Term Debt
Secured Funding
The Evolution of our Balance Sheet and Funding Profile
Conservative financial position with a smaller balance sheet footprint,
more liquidity, and a more diversified funding profile
Assets Liabilities & Equity
1 Prior to 4Q09, GCLA reflects loan value and subsequent periods reflect fair value
² 4Q07 level 3 assets includes level 3 investments in funds at NAV; 2Q17 investments in funds at NAV are not classified in the fair value hierarchy
³ Comprised of collateralized financings from the Consolidated Statement of Financial Condition
2
1 3
263%
717%
Key Balance Sheet Items, 2Q17 vs. 4Q07
($135) +$160 +$44 ($213) +$39 ($42) ($29) +$110 2Q17
vs. 4Q07
(∆ $bn)
6
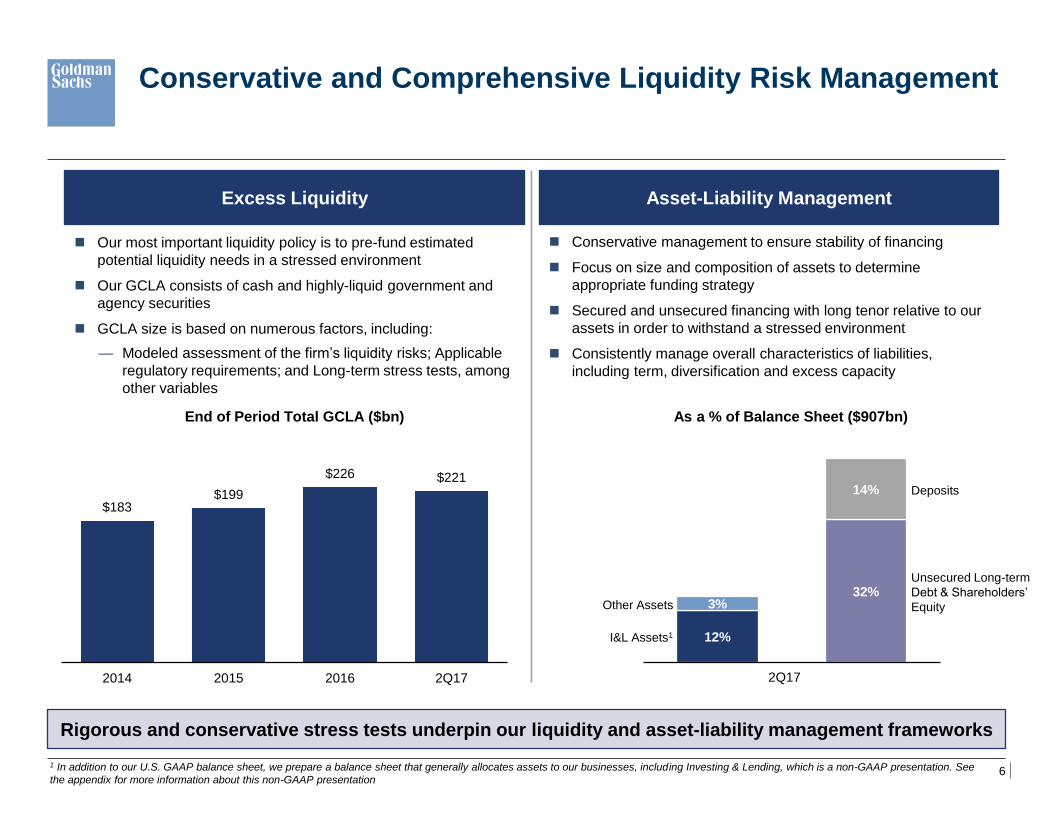
12%
3% 32%
14%
Conservative and Comprehensive Liquidity Risk Management
Excess Liquidity Asset-Liability Management
Our most important liquidity policy is to pre-fund estimated
potential liquidity needs in a stressed environment
Our GCLA consists of cash and highly-liquid government and
agency securities
GCLA size is based on numerous factors, including:
— Modeled assessment of the firm’s liquidity risks; Applicable
regulatory requirements; and Long-term stress tests, among
other variables
Conservative management to ensure stability of financing
Focus on size and composition of assets to determine
appropriate funding strategy
Secured and unsecured financing with long tenor relative to our
assets in order to withstand a stressed environment
Consistently manage overall characteristics of liabilities,
including term, diversification and excess capacity
Rigorous and conservative stress tests underpin our liquidity and asset-liability management frameworks
2Q17
Unsecured Long-term
Debt & Shareholders’
Equity
Deposits
I&L Assets1
End of Period Total GCLA ($bn) As a % of Balance Sheet ($907bn)
$183 $199
$226 $221
2014 2015 2016 2Q17
Other Assets
1 In addition to our U.S. GAAP balance sheet, we prepare a balance sheet that generally allocates assets to our businesses, including Investing & Lending, which is a non-GAAP presentation. See
the appendix for more information about this non-GAAP presentation
7
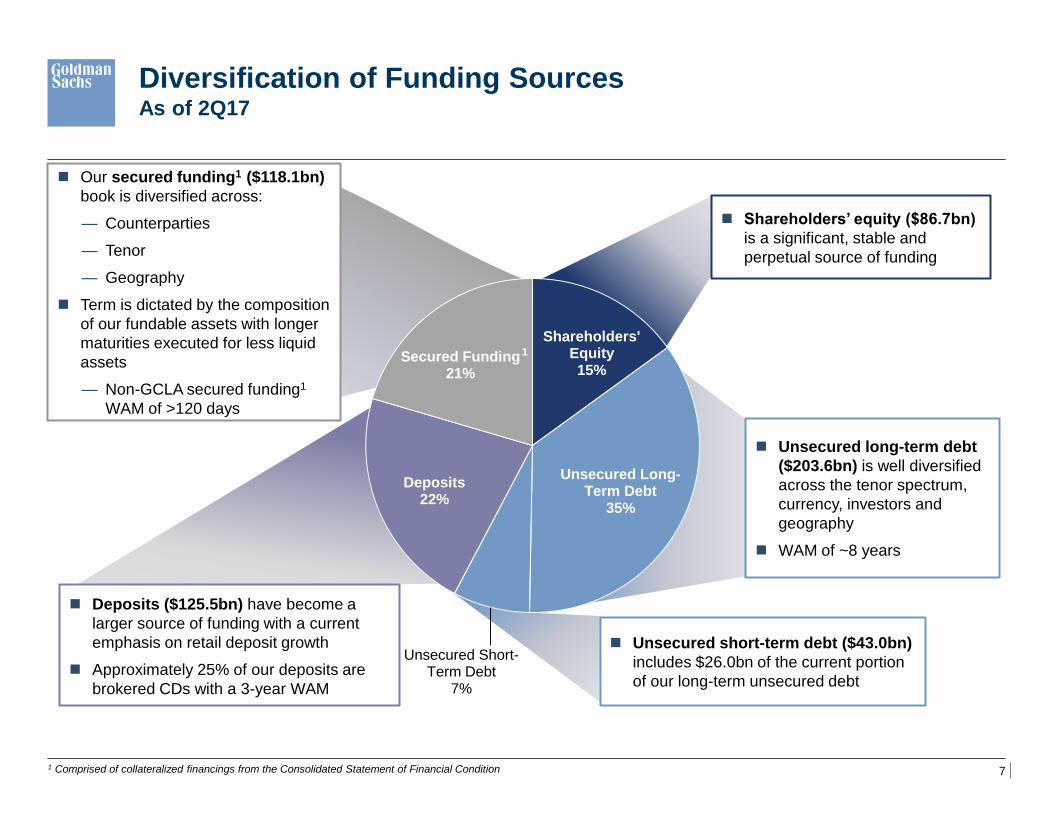
Shareholders’ equity ($86.7bn)
is a significant, stable and
perpetual source of funding
Unsecured long-term debt
($203.6bn) is well diversified
across the tenor spectrum,
currency, investors and
geography
WAM of ~8 years
Diversification of Funding Sources As of 2Q17
Deposits ($125.5bn) have become a
larger source of funding with a current
emphasis on retail deposit growth
Approximately 25% of our deposits are
brokered CDs with a 3-year WAM
Our secured funding1 ($118.1bn)
book is diversified across:
— Counterparties
— Tenor
— Geography
Term is dictated by the composition
of our fundable assets with longer
maturities executed for less liquid
assets
— Non-GCLA secured funding1
WAM of >120 days
Unsecured short-term debt ($43.0bn)
includes $26.0bn of the current portion
of our long-term unsecured debt
Shareholders' Equity 15%
Unsecured Long-Term Debt
35%
Unsecured Short-Term Debt
7%
Deposits 22%
Secured Funding 21%
1
1 Comprised of collateralized financings from the Consolidated Statement of Financial Condition
8
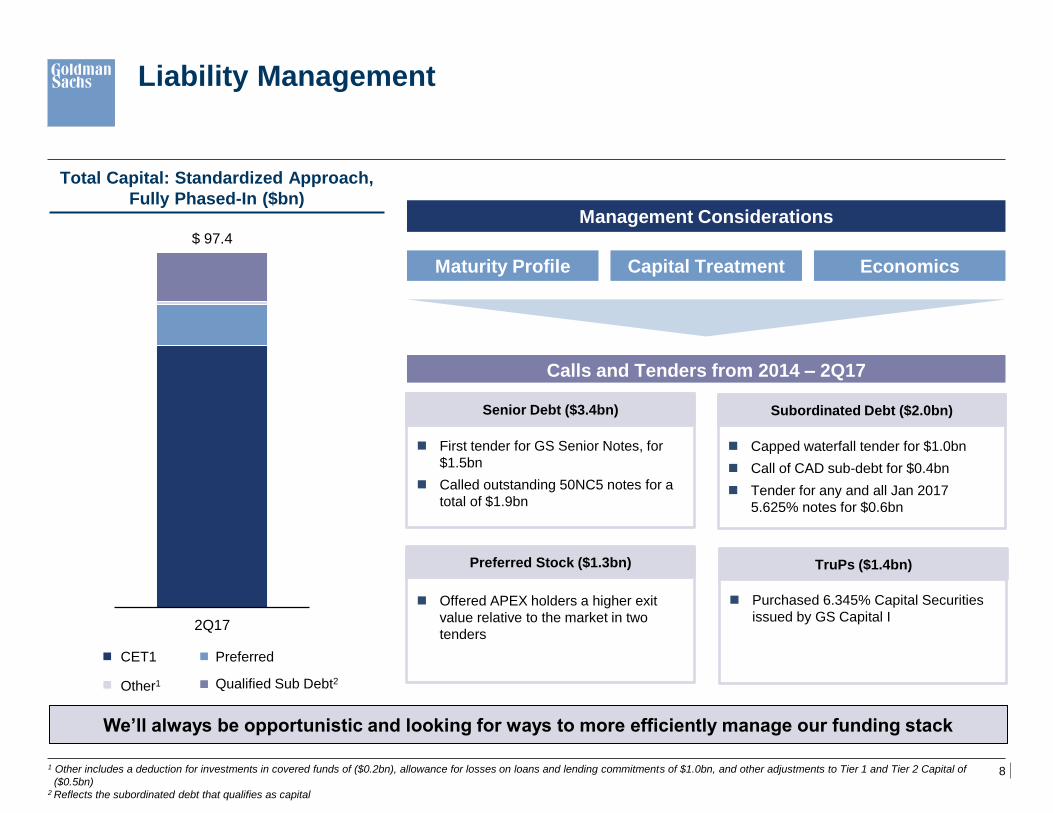
$ 97.4
2Q17
Liability Management
We’ll always be opportunistic and looking for ways to more efficiently manage our funding stack
Total Capital: Standardized Approach,
Fully Phased-In ($bn)
First tender for GS Senior Notes, for
$1.5bn
Called outstanding 50NC5 notes for a
total of $1.9bn
Purchased 6.345% Capital Securities
issued by GS Capital I
Capped waterfall tender for $1.0bn
Call of CAD sub-debt for $0.4bn
Tender for any and all Jan 2017
5.625% notes for $0.6bn
1 Other includes a deduction for investments in covered funds of ($0.2bn), allowance for losses on loans and lending commitments of $1.0bn, and other adjustments to Tier 1 and Tier 2 Capital of
($0.5bn) 2 Reflects the subordinated debt that qualifies as capital
Management Considerations
Calls and Tenders from 2014 – 2Q17
Maturity Profile Economics Capital Treatment
CET1
Other1
Preferred
Qualified Sub Debt2
TruPs ($1.4bn) Preferred Stock ($1.3bn)
Subordinated Debt ($2.0bn) Senior Debt ($3.4bn)
Offered APEX holders a higher exit
value relative to the market in two
tenders
9
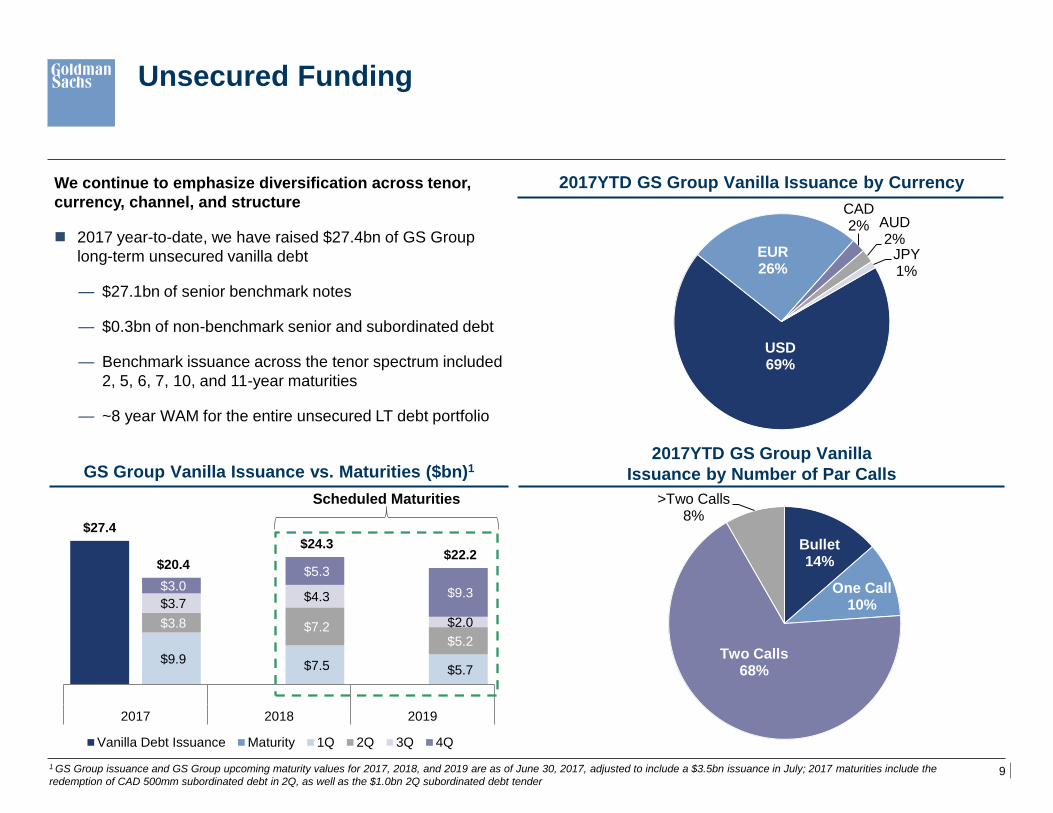
$27.4
$9.9 $7.5 $5.7
$3.8 $7.2 $5.2
$3.7 $4.3
$2.0
$3.0 $5.3
$9.3
$20.4
$24.3 $22.2
2017 2018 2019
Vanilla Debt Issuance Maturity 1Q 2Q 3Q 4Q
GS Group Vanilla Issuance vs. Maturities ($bn)1
Scheduled Maturities
USD 69%
EUR 26%
CAD 2% AUD
2% JPY 1%
1 GS Group issuance and GS Group upcoming maturity values for 2017, 2018, and 2019 are as of June 30, 2017, adjusted to include a $3.5bn issuance in July; 2017 maturities include the
redemption of CAD 500mm subordinated debt in 2Q, as well as the $1.0bn 2Q subordinated debt tender
We continue to emphasize diversification across tenor,
currency, channel, and structure
2017 year-to-date, we have raised $27.4bn of GS Group
long-term unsecured vanilla debt
— $27.1bn of senior benchmark notes
— $0.3bn of non-benchmark senior and subordinated debt
— Benchmark issuance across the tenor spectrum included
2, 5, 6, 7, 10, and 11-year maturities
— ~8 year WAM for the entire unsecured LT debt portfolio
Unsecured Funding
2017YTD GS Group Vanilla Issuance by Currency
2017YTD GS Group Vanilla
Issuance by Number of Par Calls
Bullet 14%
One Call 10%
Two Calls 68%
>Two Calls 8%
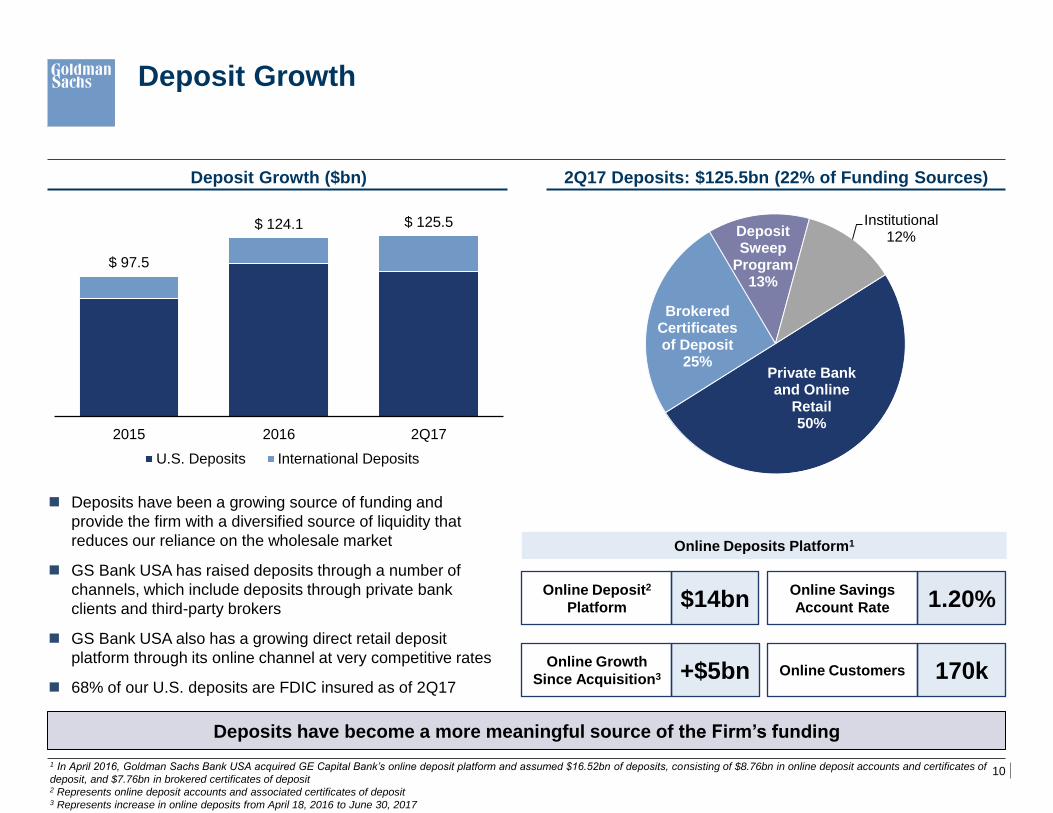
10
Private Bank and Online
Retail 50%
Brokered Certificates of Deposit
25%
Deposit Sweep
Program 13%
Institutional 12%
$ 97.5
$ 124.1 $ 125.5
2015 2016 2Q17
U.S. Deposits International Deposits
2Q17 Deposits: $125.5bn (22% of Funding Sources) Deposit Growth ($bn)
Deposit Growth
Deposits have become a more meaningful source of the Firm’s funding
Deposits have been a growing source of funding and
provide the firm with a diversified source of liquidity that
reduces our reliance on the wholesale market
GS Bank USA has raised deposits through a number of
channels, which include deposits through private bank
clients and third-party brokers
GS Bank USA also has a growing direct retail deposit
platform through its online channel at very competitive rates
68% of our U.S. deposits are FDIC insured as of 2Q17
$14bn 1.20% Online Savings
Account Rate
+$5bn Online Growth
Since Acquisition3 170k Online Customers
Online Deposit2
Platform
Online Deposits Platform1
1 In April 2016, Goldman Sachs Bank USA acquired GE Capital Bank’s online deposit platform and assumed $16.52bn of deposits, consisting of $8.76bn in online deposit accounts and certificates of
deposit, and $7.76bn in brokered certificates of deposit 2 Represents online deposit accounts and associated certificates of deposit 3 Represents increase in online deposits from April 18, 2016 to June 30, 2017
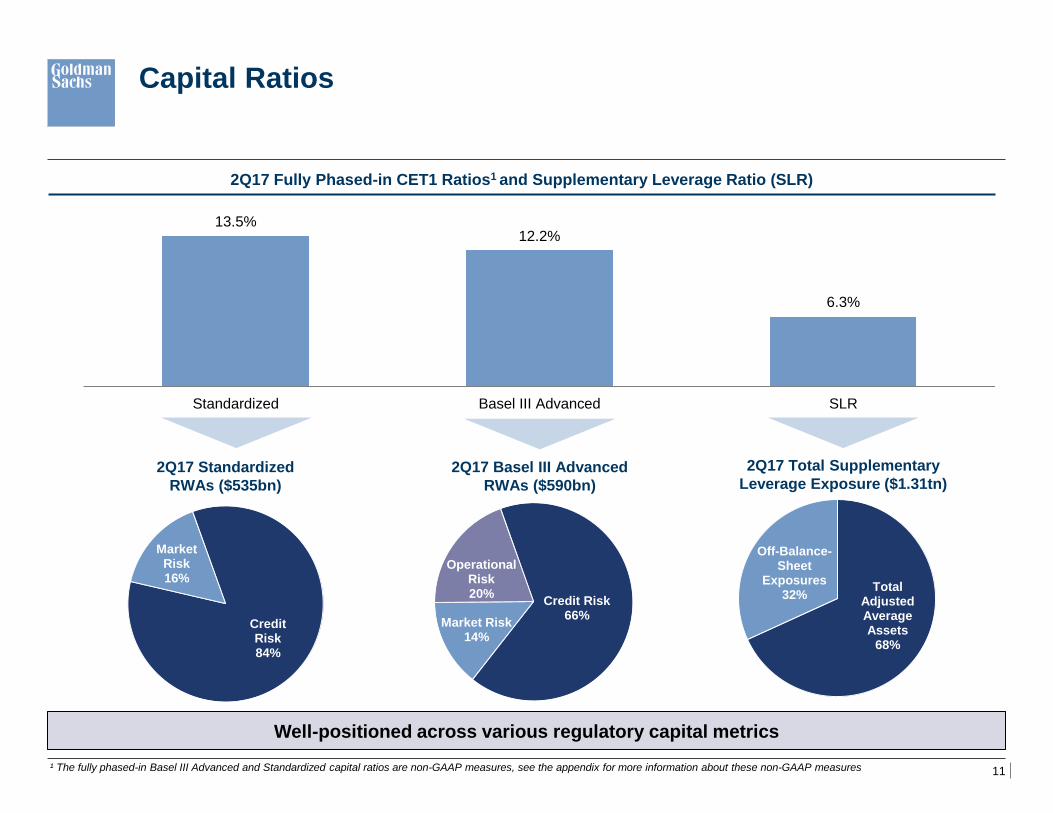
11
Credit Risk 66%
Market Risk 14%
Operational Risk 20%
¹ The fully phased-in Basel III Advanced and Standardized capital ratios are non-GAAP measures, see the appendix for more information about these non-GAAP measures
2Q17 Fully Phased-in CET1 Ratios1 and Supplementary Leverage Ratio (SLR)
Credit Risk 84%
Market Risk 16%
2Q17 Standardized
RWAs ($535bn)
13.5% 12.2%
6.3%
Standardized Basel III Advanced SLR
Capital Ratios
2Q17 Basel III Advanced
RWAs ($590bn)
Total Adjusted Average Assets
68%
Off-Balance-Sheet
Exposures 32%
2Q17 Total Supplementary
Leverage Exposure ($1.31tn)
Well-positioned across various regulatory capital metrics
12
Appendix
13
Appendix Non-GAAP Measures
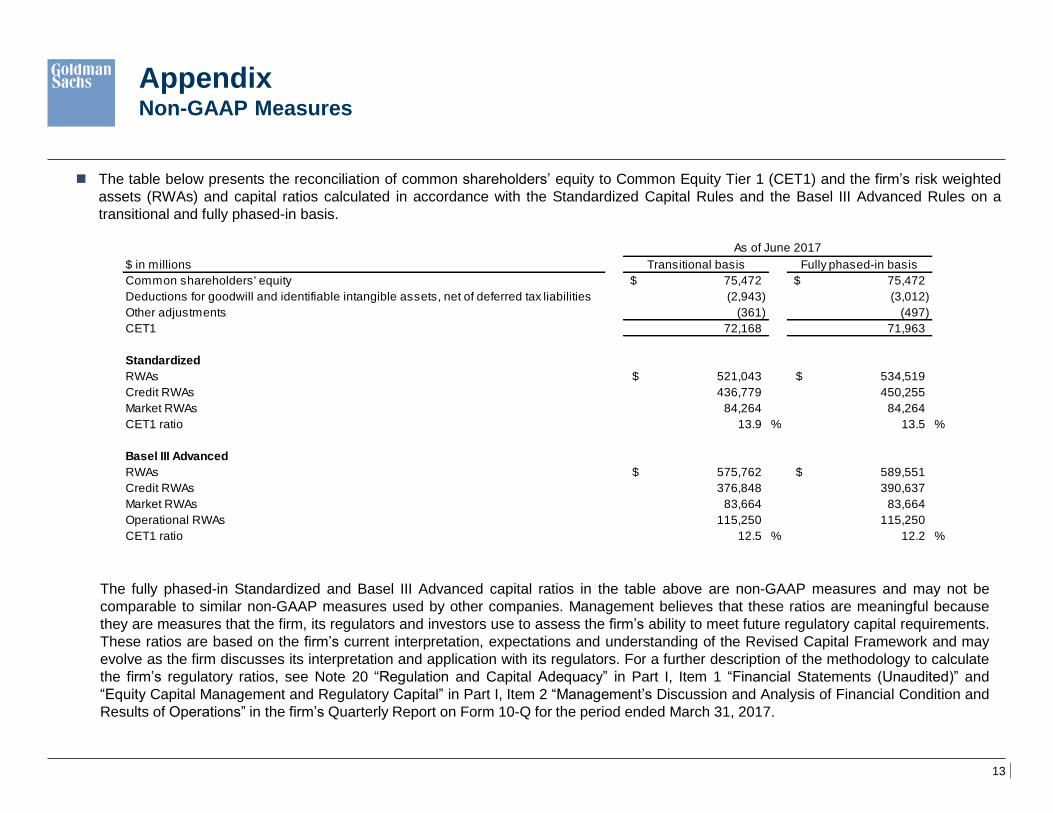
The fully phased-in Standardized and Basel III Advanced capital ratios in the table above are non-GAAP measures and may not be
comparable to similar non-GAAP measures used by other companies. Management believes that these ratios are meaningful because
they are measures that the firm, its regulators and investors use to assess the firm’s ability to meet future regulatory capital requirements.
These ratios are based on the firm’s current interpretation, expectations and understanding of the Revised Capital Framework and may
evolve as the firm discusses its interpretation and application with its regulators. For a further description of the methodology to calculate
the firm’s regulatory ratios, see Note 20 “Regulation and Capital Adequacy” in Part I, Item 1 “Financial Statements (Unaudited)” and
“Equity Capital Management and Regulatory Capital” in Part I, Item 2 “Management’s Discussion and Analysis of Financial Condition and
Results of Operations” in the firm’s Quarterly Report on Form 10-Q for the period ended March 31, 2017.
The table below presents the reconciliation of common shareholders’ equity to Common Equity Tier 1 (CET1) and the firm’s risk weighted
assets (RWAs) and capital ratios calculated in accordance with the Standardized Capital Rules and the Basel III Advanced Rules on a
transitional and fully phased-in basis.
$ in millions Transitional basis Fully phased-in basis
Common shareholders' equity 75,472$ 75,472$
Deductions for goodwill and identifiable intangible assets, net of deferred tax liabilities (2,943) (3,012)
Other adjustments (361) (497)
CET1 72,168 71,963
Standardized
RWAs 521,043$ 534,519$
Credit RWAs 436,779 450,255
Market RWAs 84,264 84,264
CET1 ratio 13.9 % 13.5 %
Basel III Advanced
RWAs 575,762$ 589,551$
Credit RWAs 376,848 390,637
Market RWAs 83,664 83,664
Operational RWAs 115,250 115,250
CET1 ratio 12.5 % 12.2 %
As of June 2017
14
Appendix Non-GAAP Measures, continued
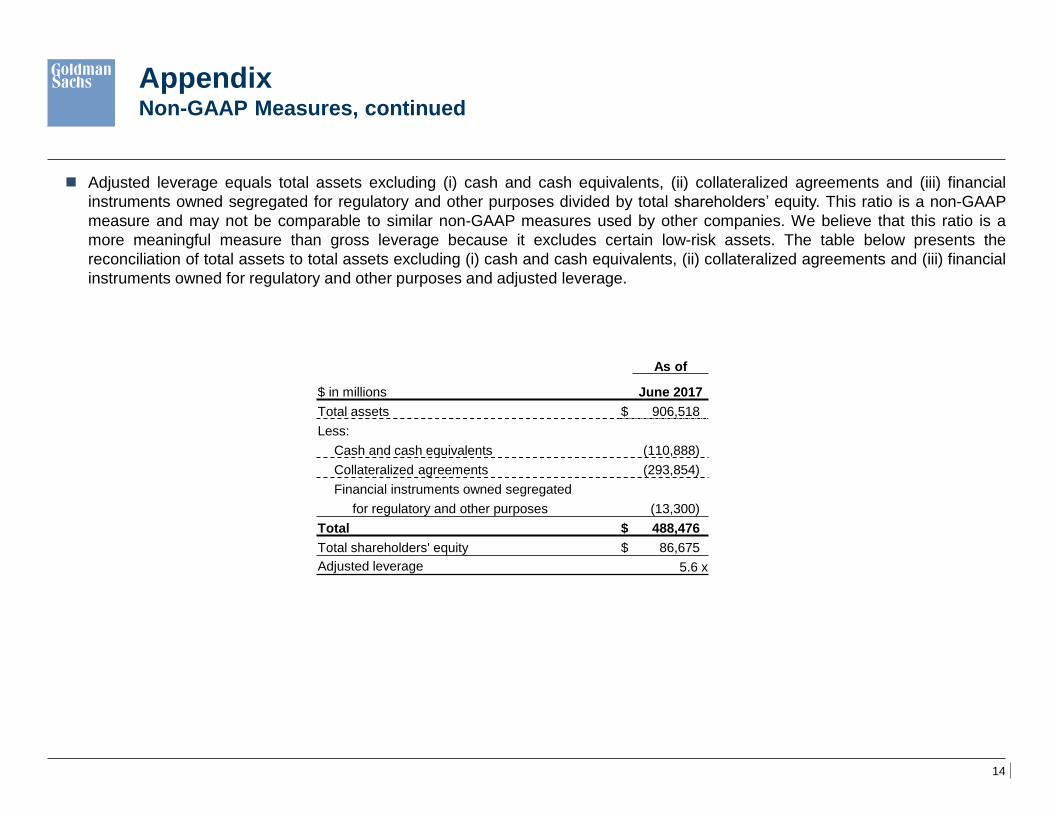
Adjusted leverage equals total assets excluding (i) cash and cash equivalents, (ii) collateralized agreements and (iii) financial
instruments owned segregated for regulatory and other purposes divided by total shareholders’ equity. This ratio is a non-GAAP
measure and may not be comparable to similar non-GAAP measures used by other companies. We believe that this ratio is a
more meaningful measure than gross leverage because it excludes certain low-risk assets. The table below presents the
reconciliation of total assets to total assets excluding (i) cash and cash equivalents, (ii) collateralized agreements and (iii) financial
instruments owned for regulatory and other purposes and adjusted leverage.
As of
$ in millions June 2017
Total assets $ 906,518
Less:
Cash and cash equivalents (110,888)
Collateralized agreements (293,854)
Financial instruments owned segregated
for regulatory and other purposes (13,300)
Total $ 488,476
Total shareholders' equity $ 86,675
Adjusted leverage 5.6 x
15
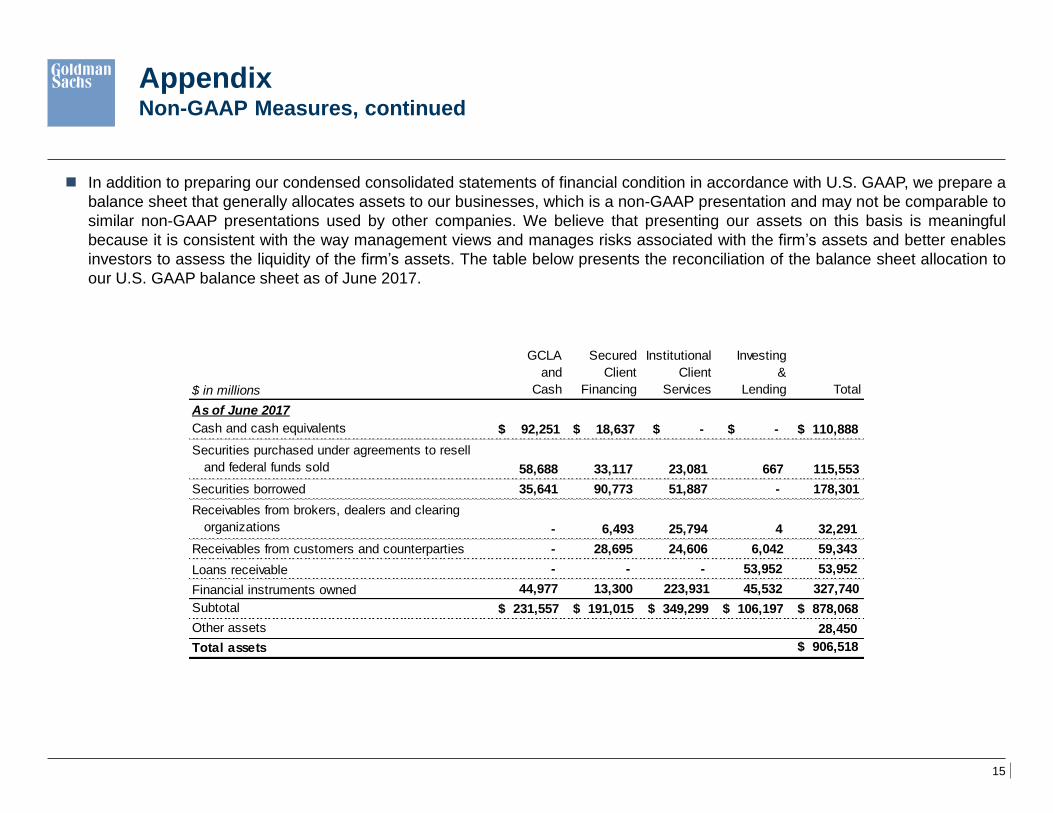
In addition to preparing our condensed consolidated statements of financial condition in accordance with U.S. GAAP, we prepare a
balance sheet that generally allocates assets to our businesses, which is a non-GAAP presentation and may not be comparable to
similar non-GAAP presentations used by other companies. We believe that presenting our assets on this basis is meaningful
because it is consistent with the way management views and manages risks associated with the firm’s assets and better enables
investors to assess the liquidity of the firm’s assets. The table below presents the reconciliation of the balance sheet allocation to
our U.S. GAAP balance sheet as of June 2017.
Appendix Non-GAAP Measures, continued
$ in millions
GCLA
and
Cash
Secured
Client
Financing
Institutional
Client
Services
Investing
&
Lending Total
As of June 2017
$ 92,251 $ 18,637 $ - $ - $ 110,888
58,688 33,117 23,081 667 115,553
Securities borrowed 35,641 90,773 51,887 - 178,301
- 6,493 25,794 4 32,291
- 28,695 24,606 6,042 59,343
- - - 53,952 53,952
44,977 13,300 223,931 45,532 327,740
$ 231,557 $ 191,015 $ 349,299 $ 106,197 $ 878,068
Other assets 28,450
Total assets $ 906,518
Subtotal
Cash and cash equivalents
Securities purchased under agreements to resell
and federal funds sold
Receivables from brokers, dealers and clearing
organizations
Receivables from customers and counterparties
Loans receivable
Financial instruments owned

Fixed Income Investor Presentation
August 1, 2017


![Top of Mind - goldmansachs.com · Product innovation has… [in my view] been particularly pronounced in the past 20 years. And if that’s the case, productivity statistics systematically](https://img.pdfslide.us/doc/110x75/5b77f6c17f8b9a8f698e0842/top-of-mind-product-innovation-has-in-my-view-been-particularly-pronounced.jpg)