Embed Size (px)
Citation preview

0
Cover page
Go10111an

1
2014 Environmental Finance Innovation Summit
Introduction
The underlying thesis for investing in solutions that benefit the environment is increasingly compelling, given the macro trends of a rapidly growing population and increased urbanization, the social pressures to more effectively manage the environmental spillovers that come with growth, and the security imperatives of protecting against extreme weather. At the same time, capital flow into environmentally beneficial opportunities is often constrained by uncertainties around public policy, budgetary challenges, and the natural fits and starts of nascent technologies. In response to the opportunities and challenges, a number of innovative financing mechanisms and capital markets solutions are being deployed to scale-up investments in clean technology, energy efficiency, water and green infrastructure solutions. To raise awareness about these developments and to facilitate dialogue, Goldman Sachs hosted the Environmental Finance Innovation Summit on February 13, 2014. The Summit coincided with the powerful nor’easter Pax, which underscored the importance of the topic at hand. With a group of nearly 200 participants, the Summit provided a forum to discuss emerging innovative financing vehicles, identify obstacles and solutions to scaling up these financing mechanisms, offer policy input, and foster partnerships to drive further progress. The following paper summarizes key takeaways from the summit.
Agenda
Green Infrastructure – Leveraging Natural Capital
Jamie Rubin – New York Governor’s Office of Storm Recovery, Director
Mark Tercek – The Nature Conservancy, President & CEO
Andrea Phillips – Goldman Sachs, Vice President, Urban Investment Group
Water – Innovative Public-Private Partnerships
Matthew Diserio – Water Asset Management, Co-Founder & President Peter Luchetti – Table Rock Capital, Managing Partner Laura Tlaiye – The World Bank Treasury, Senior Sustainability Advisor
Tim Romer – Goldman Sachs, Head of West Region Public Sector & Infrastructure Banking
“State” of the Green Market – Power of the Green Bank
Dan Esty – Hillhouse Professor, Yale University, and former Commissioner of the Connecticut Dept. of Energy and Environmental Protection Alfred Griffin – New York Green Bank, President Jonathan Maxwell – Sustainable Development Capital, Founding Partner & CEO
Radford Small – Goldman Sachs, COO, Clean Technology and Renewables
Securitization – Creating a Secondary Market
Winston Chang – S&P, Managing Director, Structured Credit Group West Owens – SolarCity, Director of Structured Finance Jeffrey Weiss – Distributed Sun, Co-Chairman & Managing Director
Steven Moffitt – Goldman Sachs, Managing Director, Consumer Structured Finance
Energy Efficiency – Creating Scale
Cisco DeVries – Renewable Funding, President & CEO Susan Leeds – New York City Energy Efficiency Corporation, CEO Clay Nesler – Johnson Controls, VP of Global Energy & Sustainability
Ian Parker – Goldman Sachs, Managing Director, Public Sector & Infrastructure Banking
Green Bonds – Tapping Into Fixed Income Markets
Evelyn Hartwick – IFC Treasury, Head of Socially Responsible Bond Programs Brian Kinney – State Street Global Advisors, Global Head of Fixed Income Beta Solutions Paul-Edouard Clos – Asian Development Bank, Senior Advisor to the VP George Richardson – The World Bank, Head of Capital Markets
Kyung-Ah Park – Goldman Sachs, Head of Environmental Markets Group
Yield Vehicles – Facilitating Capital Efficiency
Jeffrey Eckel – Hannon Armstrong, President and CEO Michael Lyon – Pattern Energy, CFO
Chuck Park – Goldman Sachs, Head of Natural Resources Equity Capital Markets
*moderators are italicized
Disclosures: This document has been prepared by the Goldman Sachs Environmental Markets Group and is not a product of Global Investment Research. The opinions summarized are not those of Goldman Sachs, are not endorsed by Goldman Sachs, and are shared in good faith based on public statements made by conference participants. This document should not be used as a basis for trading in the securities or loans of the companies named herein or for any other investment decision. This document does not constitute an offer to sell the securities or loans of the companies named herein or a solicitation of proxies or votes and should not be construed as consisting of investment advice. We are not soliciting any action based on this material. It does not constitute a recommendation or take into account the particular investment objectives, financial conditions, or needs of individual clients.

2
Green Infrastructure – Leveraging Natural Capital Benefits: In contrast to traditional “grey” infrastructure, green infrastructure harnesses nature’s ability to provide ecosystem services such as cleaning air and water, providing food, regulating the climate and offering protection from floods and extreme weather. In addition to environmental benefits, green infrastructure solutions provide resiliency and improved economic value. For example, according to The Nature Conservancy (TNC), building a man-made sea wall to protect against extreme weather and rising sea levels in New Orleans would cost approximately $1 million per mile. A green infrastructure solution, which harnesses oyster reefs, costs about the same. Both investments perform equally in protection, but the sea wall depreciates over time while the reef produces oysters, benefits the local economy, cleans the water, nourishes the beach with old shells, and provides a habitat for fish and birds. Role of private capital: Protecting nature is capital-intensive work, and the scale of environmental problems is too large to be solved through philanthropic capital alone. As such, many organizations are looking at innovative models for funding large-scale green infrastructure solutions in partnership with the private sector. TNC, for example, has launched water funds across Latin America to pay for watershed protection and reforestation. Water users contribute to the funds in exchange for fresh, clean water. The funds, in turn, pay for forest conservation efforts along rivers, streams and lakes to help ensure a safe supply of drinking water. TNC’s Quito Water Fund preserves the watersheds that supply the city’s two million residents with 80 percent of their freshwater. From TNC’s initial $20,000 investment in 2000, monthly contributions from Quito’s water and electric companies now produce nearly $1 million annually in disbursements for conservation projects for the city’s watersheds. TNC is now applying this model to other water fund projects. The New York Governor’s Office of Storm Recovery was launched six months after Hurricane Sandy to administer ~$4 billion of federal recovery dollars that were allocated to New York State and a similar sized allocation for New York City. Among the funding priorities is a broad effort across the state to develop infrastructure that will rebuild what was lost while strengthening resiliency against future storms – often relying upon green infrastructure solutions. Specifically, the Community Reconstruction Program brings together some 102 communities throughout New York to incorporate community needs into the State’s redevelopment strategies. Many of the priorities that have been identified by this first-of-its-kind community-led effort have incorporated green infrastructure ideas. These green infrastructure projects will require some $1.5 billion of capital, which exceeds the $600 million allocated by the Office toward them – underscoring the potential opportunity for private sector finance. In addition to the capital it brings, a key benefit of private sector investment is its demand for heightened precision about evidence of nature’s services and cash flow streams. While green solutions are gaining public support, overcoming the perception that these solutions are at odds with economic progress is a challenge. The importance of non-partisan governmental leadership in this arena, as well as the impact of stronger analytics and science, will drive increased levels of investor capital.
Mark Tercek, President and Chief Executive Officer of The Nature Conservancy, discusses the business case for investing in nature. Watch the video.

3
Municipal Tax Exempt Financing vs. Private Capital
The question of whether private capital can compete cost effectively against tax-exempt municipal financing is often a question on P3 transactions. According to Table Rock Capital, empirical data shows 15 - 30 percent lifecycle cost savings from the P3 model over traditional public procurement due to operational efficiencies, economies of scale, and other cost savings achieved from private operation. In comparison, a 1 - 1 ½ percent interest rate cost efficiency of tax-exempt financing may provide somewhere in the ball park of a 2 - 4 percent advantage in the total costs, so the overall lifecycle savings of P3s in most cases more than outweigh this.
Water – Innovative Public-Private Partnerships (P3s) P3s in the US: In the US, government owned systems comprise 84 percent of the country’s ~53,000 water systems and 98 percent of its ~16,000 wastewater systems
1. The American Society of Civil
Engineers assigned US water infrastructure a D+ grade (Poor: At Risk) citing more than $1 trillion in drinking water, wastewater and stormwater infrastructure capital improvements needed over the coming decades
2. With growing public sector financial
constraints and aging water systems, municipalities have become more receptive to partnerships with the private sector.
For example, in December 2012, the city of Rialto, California, teamed up with private equity firm Table Rock Capital, Union Labor Life Insurance Co. and Veolia Water in a 30-year water and wastewater concession. At the time of the transaction, Rialto was in financial stress. According to Table Rock, as a result of the city’s fiscal challenges and the lack of investment in the water system over the previous 25 years, the team had to ensure rehabilitation of the infrastructure, responsibly operate and maintain the system for the concession period, and help stabilize Rialto’s general fund. Principally, Table Rock had to secure the assets and restore sufficient confidence to investors that the city would survive its hardship. Rialto passed a utility tax that facilitated equity investment and a $146 million debt raise. The proceeds enabled Rialto to secure $35 million in upfront funds for economic development, retire outstanding debt, and fund the water system repairs. Through this partnership, Rialto retains ownership of the water systems. Veolia Water is responsible for upgrading, operating and maintaining Rialto’s water mains and sewers, in addition to making other system-wide improvements. Another example of an innovative P3 is in Prescott Valley, Arizona, where the town tapped into effluent water as a resource to meet its growth-related water needs. In a first-of-its-kind proposal in the nation, the town made the case to the state that highly treated effluent could be used to meet water demand and recharge the aquifers within town limits. The town issued effluent credits, which were purchased by Water Asset Management (WAM) through an auction process. The transaction enabled the use of effluent as a new resource to meet water demand and provided the town with additional capital that could be redeployed to other water investment opportunities.
1 US EPA
2 American Society of Civil Engineers Report Card (2013)
In February 2013, Goldman Sachs, GE and WRI hosted a summit entitled “Water: Emerging Risks & Opportunities” to discuss the intersection of capital, policy and technology in addressing critical US water challenges. Read the white paper and watch videos from the summit.

4
P3s in developing markets: Globally, water investment needs become even more acute, with ~800 million people lacking access to clean water and more than 2.5 billion without adequate sanitation
3. The World Bank is currently the largest external
source of financing for water projects. According to the World Bank, in developing countries where the public sector has very limited capacity, it is challenging to bring in private sector participation, so the institution works with governments to build technical capacity. However, in countries where capacity already exists and where contracts, regulations and assets are in place, many issues (e.g., water rationing, bursting pipes and infiltration) causing poor water quality still remain – highlighting an important opportunity for the private sector to bring additional efficiencies that can
benefit the population. In many countries, the private sector must consider the need to provide access to parts of the population that cannot afford to pay for water immediately, creating additional financial challenges. In these instances, public capital can partner with private capital. An example is “output-based aid”, a results-driven financial mechanism that ties the disbursement of public funding (in the form of subsidies) to the achievement of clearly specified results that directly support improved access to basic services, including water. For instance, in Manila, 80 percent of the water connection cost is given as a grant to households, which then pay the remaining 20 percent in installments. This approach relieves the private operator from the challenges of providing good quality water and expansive access. In P3s, it is critical to identify and define risks, to determine which partners are best positioned to address them, and to balance the need for public sector fiscal responsibility.
“State” of the Green Market – Power of the Green Bank Role of the Green Bank: Connecticut’s green bank, the Clean Energy Finance and Investment Authority (CEFIA), was established in 2011 as the nation’s first green bank. In achieving the core goals of enabling cheaper, cleaner and more reliable energy for the state, there were real limits on government or rate-payer money. The goal of CEFIA is to leverage these limited resources to five times or ten times as much private capital. CEFIA’s key focus has been driving clean energy innovation and technology development through scaled up deployment of projects, rather than direct investment in technology development. For example, CEFIA has launched a successful commercial Property Assessed Clean Energy (PACE) program, which is de-risked because repayment of the upfront cost is done through the local property tax bill, with nearly zero risk of default. The lower default risk means the cost of capital decreases, which in turn helps more projects become financeable, enabling a virtuous cycle. CEFIA also established a successful microgrid pilot program, which forms a critical part of the state’s resiliency strategy. Microgrids are 24/7 power sources that are integrated with the main grid 99.7 percent of the time but are “island-able” in a crisis, such as an extreme weather event. Connecticut began by rolling the program out to critical public safety facilities (hospitals, water treatment plants and prisons) and will soon integrate microgrids into commercially critical facilities (gas stations, groceries and pharmacies) so they can remain open in an emergency.
3 Billions Daily Affected By Water Crisis, www.water.org
Water Rights – Another Form of P3
According to WAM, despite recent challenges with severe drought and water scarcity in California, Arizona, Nevada, Colorado and New Mexico, there is ample water in these states. Eighty percent of the water happens to be consumed by agriculture, an industry that generates less than 2 percent of GDP of the region. The water is being consumed as it has been historically, which is different than the current economic structure in these states. Given the water challenges, WAM sees an increasing opportunity to trade water to higher beneficial consumptive uses. Essentially, the public markets can help establish a price on the water resource locally, which in turn can help facilitate greater value-add, efficiency and innovation in the way in which water is consumed.

5
New York State recently launched the NY Green Bank (NYGB) with an initial capitalization of $219 million. NYGB is leveraging the lessons learned from CEFIA, but rather than designing a program upfront, it is asking market participants to approach the Bank to collaborate on projects where there is a demonstrated market need. This shift is important given the demand component of the equation. Examples of how NYGB could partner include credit enhancements, loan guarantees and warehouse facilities. In addition, NYGB will focus on facilitating capital for smaller-scale projects, which are typically disjointed and where standardization is key. NYGB engagement on these projects may involve warehousing and packaging loans for resale into the secondary market, creating an opportunity for pension funds and other institutional investors. Another opportunity may entail community initiatives that reduce soft costs by building critical mass and momentum for distributed generation and energy efficiency. Fostering Private Partnerships: Sustainable Development Capital LLP (SDCL), a UK-based specialist advisory and investment firm, has focused on investing in energy efficiency in markets where energy is not heavily subsidized. But as SDCL has focused on expanding at a faster scale, the role of green banks has started to play a more meaningful role in certain markets. SDCL has partnered with the UK Green Investment Bank (GIB), a £3.8 billion government-sponsored scheme launched in 2012, to facilitate energy efficiency. Through a competitive bid process, the UK GIB provided £50 million to seed the first half of SDCL’s £100 million UK Energy Efficiency Investments Fund. Working in partnership with Energy Service Companies (ESCOs) across the UK, the fund seeks to finance up to 100 percent of the capital cost of energy efficiency projects. The concept of these P3s has expanded to other markets. For example, in Singapore, SDCL won the contract to be the fund manager for Singapore’s Energy Efficiency Investment Funds. More recently, Ireland committed €25 million to an energy efficiency fund, which SDCL has matched with €35 million to launch a €70 million fund. Assessing Risk vs. Return: The green bank models enable a transition away from the 20
th century,
subsidy-dependent approach to clean energy and towards a 21st century approach that relies on sustainable
finance. According to NYGB, the way it thinks about the cost of capital and return on its capital is by considering the premium on the debt, which is usually a combination of a credit premium and a liquidity premium. NYGB wants to ensure it recoups the credit premium while being more flexible on the liquidity premium, given its mission to facilitate capital towards segments of the clean energy market where there is less access and liquidity. By virtue of its ability to create liquidity, establish a roadmap, promote standardization and create scale, the private sector can step in. In Europe, a regulatory test called the Market Economy Investor Principle requires the public sector to achieve a reasonable return on investment to avoid state-aid implications. This principle is applied across SDCL funds and mandates that 50 to 51 percent of every dollar invested come from private capital. In addition to providing leverage, this approach adds discipline to de-risk investments. According to SDCL, a UK report examining ten years of P3s demonstrated that 80 percent of public sector procured deals were completed late or over budget, while 80 percent of P3s were either early or on budget.
Securitization – Creating a Secondary Market Distributed generation solar: Securitization is a well-established tool that has helped scale-up consumer financing in areas such as auto loans, credit cards and mortgages. It provides more expansive access to capital by aggregating pools of loans and structuring them into different bond tranches. This structure allows the targeting of investor risk-return requirements, thereby diversifying the investor base and access points in the capital market while providing greater liquidity. With greater penetration of solar panels, there has been an increasing focus by developers on tapping into capital market tools such as securitization, which is more efficient than traditional tax equity markets. In November 2013, securitization was applied for the first time to distributed solar by SolarCity, which issued $54.4 million in solar asset-backed notes linked to its residential and commercial customers’

6
Potential Benefits from Securitization4
Developers
Lower cost of capital compared to traditional debt/equity
Broader investor mix
Market price discovery for illiquid assets
Cost competitive financing compared to tax equity structures
Cost of capital tied to asset performance vs. developer’s credit rating
Allows for recycling of capital
Investors
Diversification of underlying assets (geography and income)
Flexibility: Fixed and variable interest rates; greater maturities
Lower credit risk: public securities offer more efficient risk pricing
Public
Lower cost of capital for developers translates to lower electricity prices
rooftop solar contracts. The notes were rated BBB+ with approximately 40% over-collateralization and carry a 4.8% interest rate and scheduled maturity of December 2026. Credit rating considerations: According to S&P, evaluating risk is often about the track record of the asset class. For new asset classes, the track record doesn’t have enough longevity to cover the 20-year duration of the asset, which introduces a time element. Rooftop solar as a new asset class falls into this category, with payment history spanning only the last six to seven years. However, evaluating a solar lease in the context of a typical energy utility payment unlocks a century of data to analyze. A solar lease requires the same payment as the existing utility payment, with the added benefit of offering customers a cheaper energy bill. When S&P analyzed the history, the majority of consumers and commercial entities paid given this benefit. S&P also addressed questions such as the potential risk of the value proposition shifting in the future if utility rates flatten out or there is a continued decline in PPAs, as well as the potential risk from the injection of new panel manufacturers. On default risk, because solar companies are unlikely to take the solar panel and sell and recover it, S&P looked at vacancy reassignment (i.e., how long the solar asset will sit in a home until a new homeowner reassumes the contract). Commercial and industrial market (C&I): According to Distributed Sun, to scale-up capital the market needs to become simpler and more straightforward. One of the simplifying elements that allowed the residential market to grow was the ability to leverage consumer FICO scores, which provide a standardized way of assessing the customer’s credit. In the C&I market, there is no FICO score equivalent, and profiles of off-takers vary significantly. While the vast majority of US C&I solar installed to date is on rooftops of creditworthy entities, the real opportunity exists with less creditworthy entities that may be unrated. Additionally, investment decisions at the commercial entity level are more complicated in part due to real estate issues, credit, tax, regulatory and policy considerations. While residential customer demand is primarily based upon obtaining an essential service at a lower cost, the C&I market is focused on locking-in energy costs over the longer term (10-25 years) given the current lack of financial mechanisms to hedge power prices that far in the future. To help address the complexities, Distributed Sun and DuPont Photovoltaic Solutions are co-leading an industry group called truSolar, an initiative focused on developing a public standard to evaluate and measure risk in solar securitization transactions. The standard will act akin to a FICO score by providing an industry-established scoring mechanism to screen and rate C&I distributed solar projects. Standardization is critical as it will lower soft transaction costs, help the industry better manage risk, and enable more diversified and liquid securities.
Energy Efficiency – Creating Scale State of the market: A 2012 study by the Rockefeller Foundation reported a potential nationwide energy efficiency market of nearly $280 billion over the next ten years that would translate to more than $1 trillion in energy savings, three million jobs, and 600 million fewer metric tons of carbon emissions per year. Despite the potential economic, environmental and social benefits, less than ten percent of the “low-hanging fruit” in energy efficiency projects has been tapped.
4 PwC – Solar Securitization: A promising financing opportunity for solar developers
7
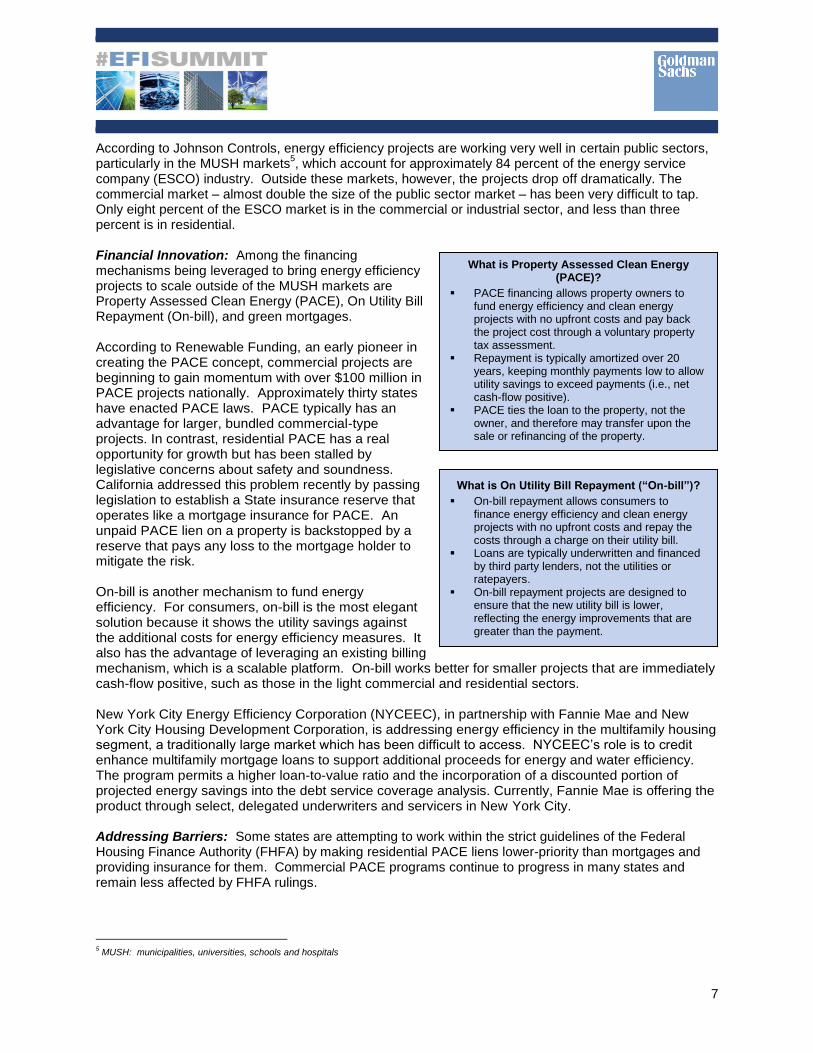
What is On Utility Bill Repayment (“On-bill”)?
On-bill repayment allows consumers to finance energy efficiency and clean energy projects with no upfront costs and repay the costs through a charge on their utility bill.
Loans are typically underwritten and financed by third party lenders, not the utilities or ratepayers.
On-bill repayment projects are designed to ensure that the new utility bill is lower, reflecting the energy improvements that are greater than the payment.
According to Johnson Controls, energy efficiency projects are working very well in certain public sectors, particularly in the MUSH markets
5, which account for approximately 84 percent of the energy service
company (ESCO) industry. Outside these markets, however, the projects drop off dramatically. The commercial market – almost double the size of the public sector market – has been very difficult to tap. Only eight percent of the ESCO market is in the commercial or industrial sector, and less than three percent is in residential. Financial Innovation: Among the financing mechanisms being leveraged to bring energy efficiency projects to scale outside of the MUSH markets are Property Assessed Clean Energy (PACE), On Utility Bill Repayment (On-bill), and green mortgages. According to Renewable Funding, an early pioneer in creating the PACE concept, commercial projects are beginning to gain momentum with over $100 million in PACE projects nationally. Approximately thirty states have enacted PACE laws. PACE typically has an advantage for larger, bundled commercial-type projects. In contrast, residential PACE has a real opportunity for growth but has been stalled by legislative concerns about safety and soundness. California addressed this problem recently by passing legislation to establish a State insurance reserve that operates like a mortgage insurance for PACE. An unpaid PACE lien on a property is backstopped by a reserve that pays any loss to the mortgage holder to mitigate the risk. On-bill is another mechanism to fund energy efficiency. For consumers, on-bill is the most elegant solution because it shows the utility savings against the additional costs for energy efficiency measures. It also has the advantage of leveraging an existing billing mechanism, which is a scalable platform. On-bill works better for smaller projects that are immediately cash-flow positive, such as those in the light commercial and residential sectors. New York City Energy Efficiency Corporation (NYCEEC), in partnership with Fannie Mae and New York City Housing Development Corporation, is addressing energy efficiency in the multifamily housing segment, a traditionally large market which has been difficult to access. NYCEEC’s role is to credit enhance multifamily mortgage loans to support additional proceeds for energy and water efficiency. The program permits a higher loan-to-value ratio and the incorporation of a discounted portion of projected energy savings into the debt service coverage analysis. Currently, Fannie Mae is offering the product through select, delegated underwriters and servicers in New York City. Addressing Barriers: Some states are attempting to work within the strict guidelines of the Federal Housing Finance Authority (FHFA) by making residential PACE liens lower-priority than mortgages and providing insurance for them. Commercial PACE programs continue to progress in many states and remain less affected by FHFA rulings.
5 MUSH: municipalities, universities, schools and hospitals
What is Property Assessed Clean Energy (PACE)?
PACE financing allows property owners to fund energy efficiency and clean energy projects with no upfront costs and pay back the project cost through a voluntary property tax assessment.
Repayment is typically amortized over 20 years, keeping monthly payments low to allow utility savings to exceed payments (i.e., net cash-flow positive).
PACE ties the loan to the property, not the owner, and therefore may transfer upon the sale or refinancing of the property.

8
A principal issue with On-bill repayment is that many people do not pay their utility bills on time. Renewable Funding observed that in California alone, an average of 22 percent of residential rate-payers are delinquent, and two percent of customers have their power turned off. Another challenge is that On-bill has not been standardized or aggregated, and the security mechanisms and regulatory systems differ from state to state. Finally, public utility commissions regulate utilities and utility billing, and adding an On-bill mechanism can be complex from a regulatory perspective. Johnson Controls believes that the industry is increasingly focusing on “larger-scale efficiency” projects, underscoring the market importance of standardization and aggregation. Certain states, such as Delaware and Connecticut, have embraced standardization efforts as a means for stimulating demand. The role of standardization will be critical to pave the way for aggregation and eventually create a secondary market to enable securitization.
Green Bonds – Tapping Into Fixed Income Markets
Market momentum: Green bonds, fixed income instruments whose proceeds are dedicated to environmental initiatives, have seen significant momentum with approximately $14 billion of issuance in 2013, more than double the prior year. First issued in 2008 by the World Bank, until recently, green bonds have largely been the domain of the supranational issuers, offering investors the ability to buy AAA bonds, take zero project risk, and benefit from the ring fencing of the funds for green purposes, as well as the transparency and due diligence provided by the issuer. In 2010, Asian Development Bank issued a “water bond”, which was then followed by a “clean energy bond”. In 2013, the market saw an expansion in both issuers and issuance size. IFC came out with the first $1 billion issuance in February 2013, followed by its second $1 billion green bond in November. IFC’s sizing decision was guided by the large pipeline of environmentally-beneficial projects – approximately $2.5 billion in 2013 – as well as the desire to grow the green market from a relatively small dedicated SRI investment community to the broader universe of fixed income investors. 2013 also saw the market evolving to include both non-AAA investment grade corporate investors and municipal entities. Key benefits: According to the World Bank, green bonds have attracted an expanded pool of investors who otherwise would not have come into their traditional bond issuance. For example, Swedish pension funds, which have been more focused on corporate issuance but could not get the dedicated green exposure, participated in the first green bond investment. Since then, they have participated in all the World Bank green bonds in multiple currencies, as well as conventional World Bank bonds. Other
Green Bond Principles
The Green Bond Principles, supported by a group of thirteen banks, seek to provide a voluntary set of guidelines for green bonds, with an emphasis on transparency, disclosure and integrity. Read more.
Energy Efficient Mortgages
M-PIRE
Multifamily Property Improvements to Reduce Energy
Uses Fannie Mae’s typical desk lending process for multifamily properties
Property Needs Assessment is amended to include ASHRAE Level 2 Energy Audit
Cost of conservation measures added to loan principal
Increases loan to value ratio, relaxes minimum debt service
PERL
Program for Energy Retrofit Loans
In cooperation with NYC Housing and Economic Development Corporation
Property Needs Assessment is amended to include ASHRAE Level 2 Energy Audit
Loans originally capped at $2 million; greater sizes reviewed on case-by-case basis
Projected savings must be at least 15 percent to capture lower interest rate on loan dedicated to PERL

9
Examples of Recent Green Bonds
$550 million issuance of floating rate green bonds in January 2014
Proceeds will support lending for eligible projects that promote the transition to low-carbon and climate-resilient growth in recipient countries
First syndicated green floating rate note from The World Bank and wider supranational and sovereign issuer-base
€750 million green bond issuance in February 2014
Proceeds will be used to finance the construction and development of new and existing eligible assets certified by BREEAM – a leading global design and assessment method for sustainable buildings
First green bond issued by a corporation in 2014
investors are also participating in the World Bank’s larger transactions, including State Street Global Advisors (SSgA). IFC underscored the franchise value that is generated for investors by being associated with this asset class, which in turn can facilitate more asset flow due to increasing interest in social responsible investing. The mix of investors in green bonds includes asset managers, insurance companies and public sector participants such as central banks. Overall, there is broader benefit in facilitating deep pools of institutional investor capital towards green projects. Investor perspective: SSgA first launched its green bond strategy in 2011. Its approach was to create an investment strategy that would resonate with investors who have an institutional mindset and large-scale portfolios, and to assess how green bonds would fit within an asset allocation framework. SSgA invests in green bonds in a way that mimics the duration and curve characteristics of the US Treasury curve. Its approach creates a vehicle that allows investors who own US Treasuries or supranationals to invest in green bonds as a substitute for other elements of their existing portfolio rather than trying to fit green bonds into an alternative sleeve. This flexibility is also important given that there are often two different audiences among US institutional investors: investors focused on environmental, social and governance (ESG) issues, and those who are less focused on green concerns but want to ensure that their bond portfolio meets investment objectives and high fiduciary standards. Supranational issuers have provided the building blocks by pioneering the space with transparency, high quality issuance, large size, and issuing across the credit curve. SSgA has invested $100 million across its broader portfolio, which has been feasible given the larger issuance sizes that provide greater liquidity. Though the portfolio to date has been exclusively a supranational portfolio in light of the strategy described above, SSgA sees an opportunity in the near future to expand green bond investments to corporate credits, particularly as investors look to pick up incremental yield and move down the credit curve relative to the supranational credits. In addition, for clients that have separately managed accounts with clear asset guidelines on risk, there could be opportunities to invest in less liquid, loan-oriented exposures.
Source: Bloomberg New Energy Finance
Green Bond Issuance, 2007 – 2013 ($bn)

10
MLPs, though not yet extended to renewables, can provide an indicative data point for the market potential for clean energy yield vehicles – taking just 5 years for MLP market cap to double by 2009 to $100bn and then from there to reach $550bn today. Source: Dealogic; reflective of merger, reverse merger, bankruptcy and IPO activity since 2000
~$50bn of
Equity Value
by 2005
~$100bn of
Equity Value
by 2009
~$550bn of
Equity Value
To Date
0
20
40
60
80
100
120
$0
$100
$200
$300
$400
$500
$600
2000 2001 2002 2003 2004 2005 2006 2007 2008 2009 2010 2011 2012 2013 2014
Ma
rket
Ca
p (
$b
n)
# of Companies
54
116
100
86
7467 67
64
453733
2823
35
117
# o
f Co
mp
an
ies
Yield Vehicles – Facilitating Capital Efficiency Overview: A “yield vehicle” or “yield co” is a company that has a long-term, contracted set of cash flows that enables stable predictable yield, as well as excess cash flows that can be reinvested to provide growth. Several clean energy yield cos have been successfully listed in the US market in the absence of Master Limited Partnerships (MLPs), which have yet to be extended to renewable energy. Recent yield vehicles have entailed a parent entity transferring contracted operating power generation assets into a new publicly traded C-Corp. Combined with the contracted cash flow is the visible development pipeline that can be “dropped-down” from the parent to the public entity. The combination of de-risked cash flows and visible growth have generally enabled both a higher multiple than the publicly traded parent and more efficient cost of capital. Pattern Energy Yield Co: Pattern Energy, an independent power producer, went public in September 2013 as a yield co with a portfolio of operating wind projects. Founded almost five years ago and principally backed by Riverstone Holdings, the IPO provided Pattern with the opportunity to establish a permanent equity structure and have access to an ongoing source of capital to fund its high growth pipeline. According to Pattern, investors have been very discriminating in investing in yield cos, showing a strong preference for those that have both high levels of expected growth and visibility into where that growth will come from. Similar to NRG Yield, Pattern’s growth will come from the purchase of renewable assets that are developed in the parent entity and sold to the listed yield co. Governance mechanisms such as independent Boards of Directors, financial advisors and legal counsel ensure fair pricing between the two entities. Unlike other companies who have listed yield cos, for Pattern, the separation of the development arm and the listed company is temporary to accommodate the risk profile and burn rate of the development projects. Pattern anticipates that when it reaches approximately double its current $1 billion capitalization (which could be in the next two to three years), it would seek to reintegrate the two entities.
NRG Yield
Went public in July 2013 with $495 million IPO NRG Yield comprises assets across 9 states and 2.5
GW portfolio of contracted renewable and conventional generation and thermal infra assets
Since the IPO, NRG Yield has been growing through drop-downs of assets from NRG Energy, the parent company, and the recent acquisition of Energy Systems Co., a Nebraska-based district energy company
MLP Market (2000-present)

11
Hannon Armstrong REIT: Hannon Armstrong, which provides debt and equity for companies implementing energy efficiency and clean energy solutions, went public in April 2013 as a real estate investment trust (REIT). Hannon offers investors high credit-quality cash-flows that sustain a yield, largely by originating positions in the senior debt of projects. Hannon’s goal is to serve clients (typically Fortune 500 companies) with well-priced capital and to continue to reduce the cost of capital it provides. The REIT construct provides a tax-efficient pass-through entity and access to the public market, which in turn allows for more efficient capital access. Because of the build-up of strong REIT assets of almost $2 billion in energy efficiency financings, there has been no meaningful constraint in the REIT structure, despite Hannon not owning any physical real estate. At the time of the IPO, Hannon targeted a 7 percent yield, but with investors more recently asking about dividend growth, it has established a near-term growth target of 13-15 percent. In December 2013, Hannon also issued a $100 million Sustainable Yield Bond, which has a 2.79 percent fixed coupon over six years and aggregates hundreds of individual transactions underlying the bond. Hannon tracks the greenhouse gas emissions for each of these transactions, translating them into 0.61 metric tons of greenhouse gas reduction per $1,000 bond.