Embed Size (px)
Citation preview
FIRST QUARTER UPDATE—
2021
1Q21 TRADING UPDATE / PILLAR 3 SUPPORT PACK
18 FEBRUARY 2021
This document should be read in conjunction with ANZ Basel III Pillar 3 Disclosure as at December 2020 (APS 330: Public disclosure)
Approved for distribution by ANZ’s Continuous Disclosure Committee
Australia and New Zealand Banking Group Limited 9/833 Collins Street Docklands Victoria 3008 Australia ABN 11 005 357 522
OVERVIEW
1
FINANCIAL INFORMATION AS AT 31 DECEMBER 20201
(ALL COMPARISONS TO 2H20 QUARTERLY AVERAGE UNLESS OTHERWISE STATED)
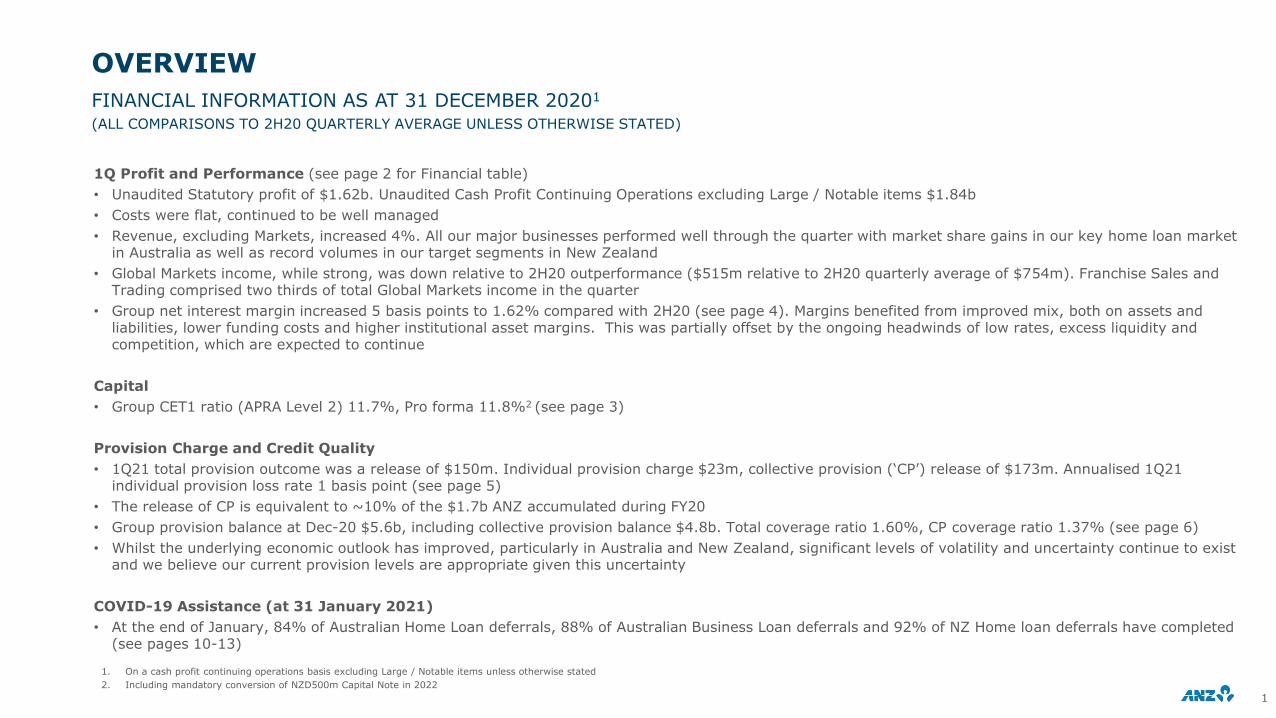
1Q Profit and Performance (see page 2 for Financial table)
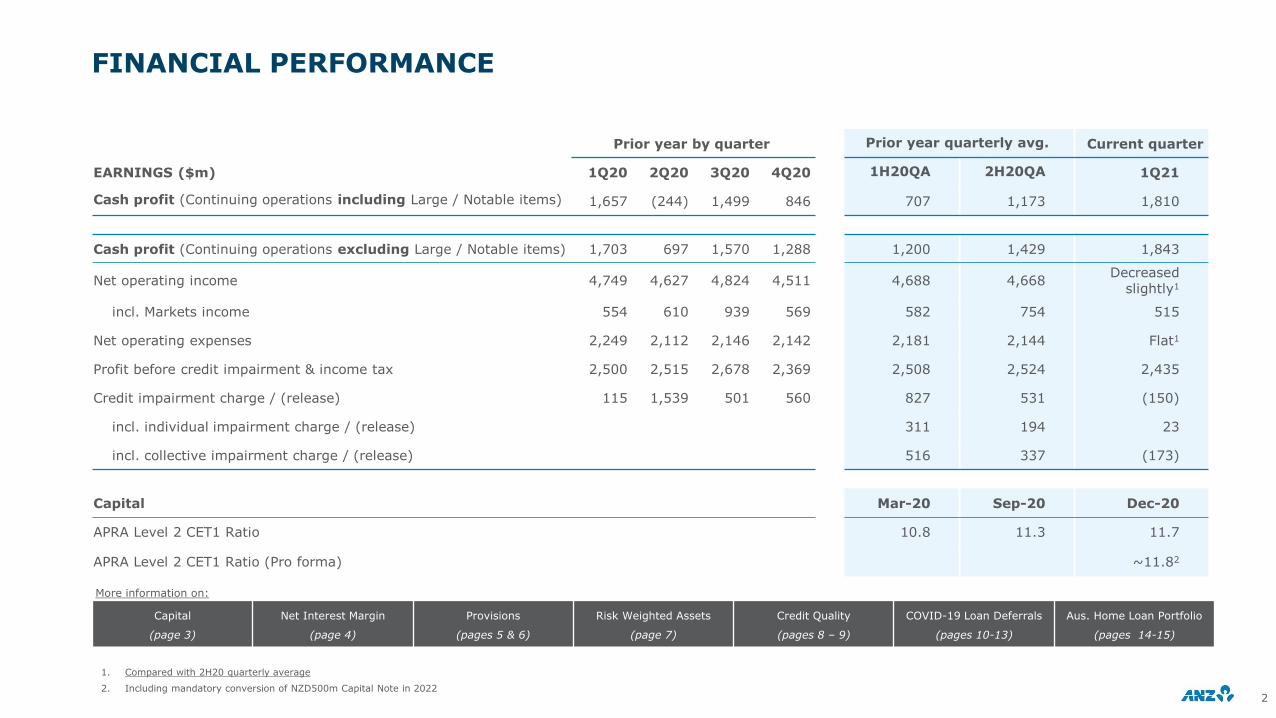
• Unaudited Statutory profit of $1.62b. Unaudited Cash Profit Continuing Operations excluding Large / Notable items $1.84b
• Costs were flat, continued to be well managed
• Revenue, excluding Markets, increased 4%. All our major businesses performed well through the quarter with market share gains in our key home loan market in Australia as well as record volumes in our target segments in New Zealand
• Global Markets income, while strong, was down relative to 2H20 outperformance ($515m relative to 2H20 quarterly average of $754m). Franchise Sales and Trading comprised two thirds of total Global Markets income in the quarter
• Group net interest margin increased 5 basis points to 1.62% compared with 2H20 (see page 4). Margins benefited from improved mix, both on assets and liabilities, lower funding costs and higher institutional asset margins. This was partially offset by the ongoing headwinds of low rates, excess liquidity and competition, which are expected to continue
Capital
• Group CET1 ratio (APRA Level 2) 11.7%, Pro forma 11.8%2 (see page 3)
Provision Charge and Credit Quality
• 1Q21 total provision outcome was a release of $150m. Individual provision charge $23m, collective provision (‘CP’) release of $173m. Annualised 1Q21 individual provision loss rate 1 basis point (see page 5)
• The release of CP is equivalent to ~10% of the $1.7b ANZ accumulated during FY20
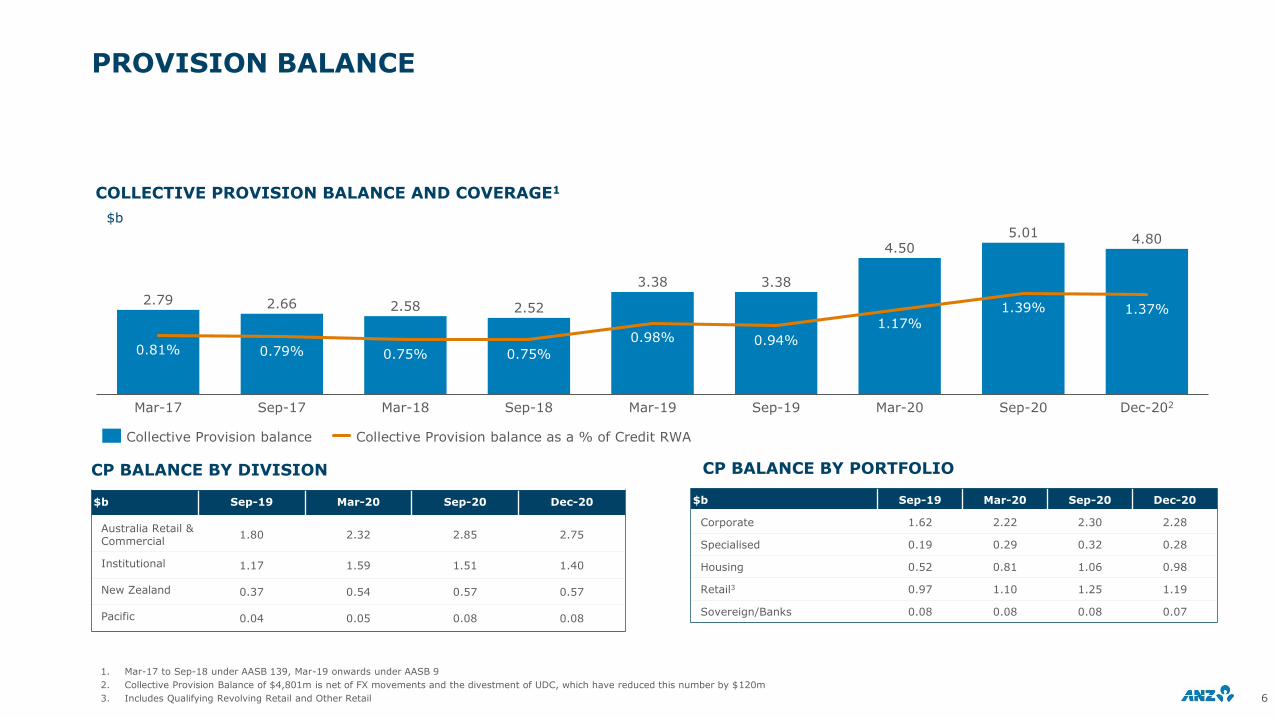
• Group provision balance at Dec-20 $5.6b, including collective provision balance $4.8b. Total coverage ratio 1.60%, CP coverage ratio 1.37% (see page 6)
• Whilst the underlying economic outlook has improved, particularly in Australia and New Zealand, significant levels of volatility and uncertainty continue to exist and we believe our current provision levels are appropriate given this uncertainty
COVID-19 Assistance (at 31 January 2021)
• At the end of January, 84% of Australian Home Loan deferrals, 88% of Australian Business Loan deferrals and 92% of NZ Home loan deferrals have completed (see pages 10-13)
1. On a cash profit continuing operations basis excluding Large / Notable items unless otherwise stated
2. Including mandatory conversion of NZD500m Capital Note in 2022
FINANCIAL PERFORMANCE
2
More information on:
Prior year by quarter Prior year quarterly avg. Current quarter
EARNINGS ($m) 1Q20 2Q20 3Q20 4Q20 1H20QA 2H20QA 1Q21
Cash profit (Continuing operations including Large / Notable items) 1,657 (244) 1,499 846 707 1,173 1,810
Cash profit (Continuing operations excluding Large / Notable items) 1,703 697 1,570 1,288 1,200 1,429 1,843
Net operating income 4,749 4,627 4,824 4,511 4,688 4,668Decreased
slightly1
incl. Markets income 554 610 939 569 582 754 515
Net operating expenses 2,249 2,112 2,146 2,142 2,181 2,144 Flat1
Profit before credit impairment & income tax 2,500 2,515 2,678 2,369 2,508 2,524 2,435
Credit impairment charge / (release) 115 1,539 501 560 827 531 (150)
incl. individual impairment charge / (release) 311 194 23
incl. collective impairment charge / (release) 516 337 (173)
Capital Mar-20 Sep-20 Dec-20
APRA Level 2 CET1 Ratio 10.8 11.3 11.7
APRA Level 2 CET1 Ratio (Pro forma) ~11.82
Capital
(page 3)
Net Interest Margin
(page 4)
Provisions
(pages 5 & 6)
Risk Weighted Assets
(page 7)
Credit Quality
(pages 8 – 9)
COVID-19 Loan Deferrals
(pages 10-13)
Aus. Home Loan Portfolio
(pages 14-15)
1. Compared with 2H20 quarterly average
2. Including mandatory conversion of NZD500m Capital Note in 2022
CAPITAL
3
APRA LEVEL 2 COMMON EQUITY TIER 1 RATIO (CET1)
1. Other impacts include capital deductions (which mainly comprises the movement in retained earnings in deconsolidated entities, capitalised expenses and EL/EP deduction), net imposts/efficiencies, movements in non-cash earnings, net foreign currency translation and other
2. Capital Conservation Buffer
0.41 0.02 0.02
0.08
0.04
2020 Final Dividend
(net of DRP)
CIC(net of tax)
Dec-20Underlying RWA Business
Growth(ex FX)
Sep-20 PBP(net of tax)
Net DTA (on CIC)
Risk Migration
Other1
11.3
-0.20
-0.0211.7
Credit impact%
CET1 min. $19b
Buffers~$15b
CCB2
$15b
Dec-20
~$49b CET1 capital
Pro forma CET1 of ~11.8% after
conversion of NZ$500m
capital note
+35bps
Mainly Australia division
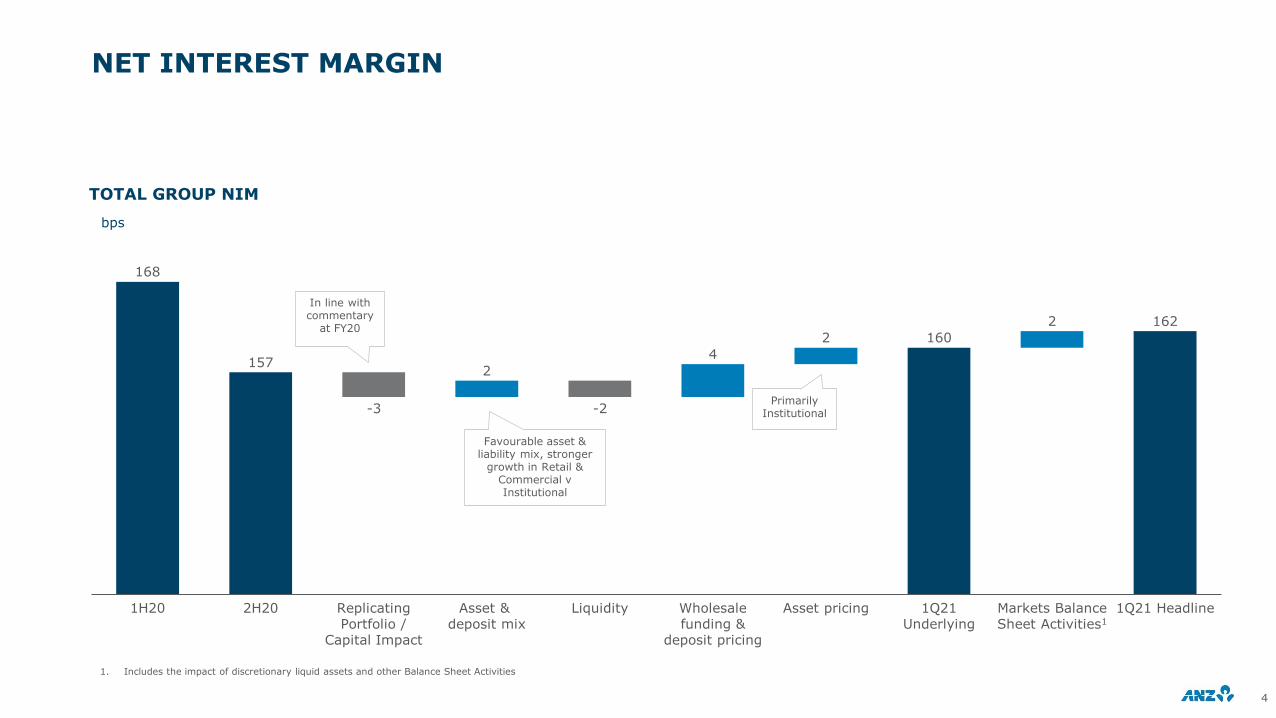
168
157
160
162
2
4
2
2
1Q21Underlying
1Q21 Headline1H20 2H20 Liquidity Markets Balance Sheet Activities1
Asset pricingWholesale funding &
deposit pricing
Replicating Portfolio /
Capital Impact
Asset & deposit mix
-3 -2
NET INTEREST MARGIN
4
TOTAL GROUP NIM
bps
In line with commentary
at FY20
Favourable asset & liability mix, stronger
growth in Retail & Commercial v Institutional
Primarily Institutional
1. Includes the impact of discretionary liquid assets and other Balance Sheet Activities
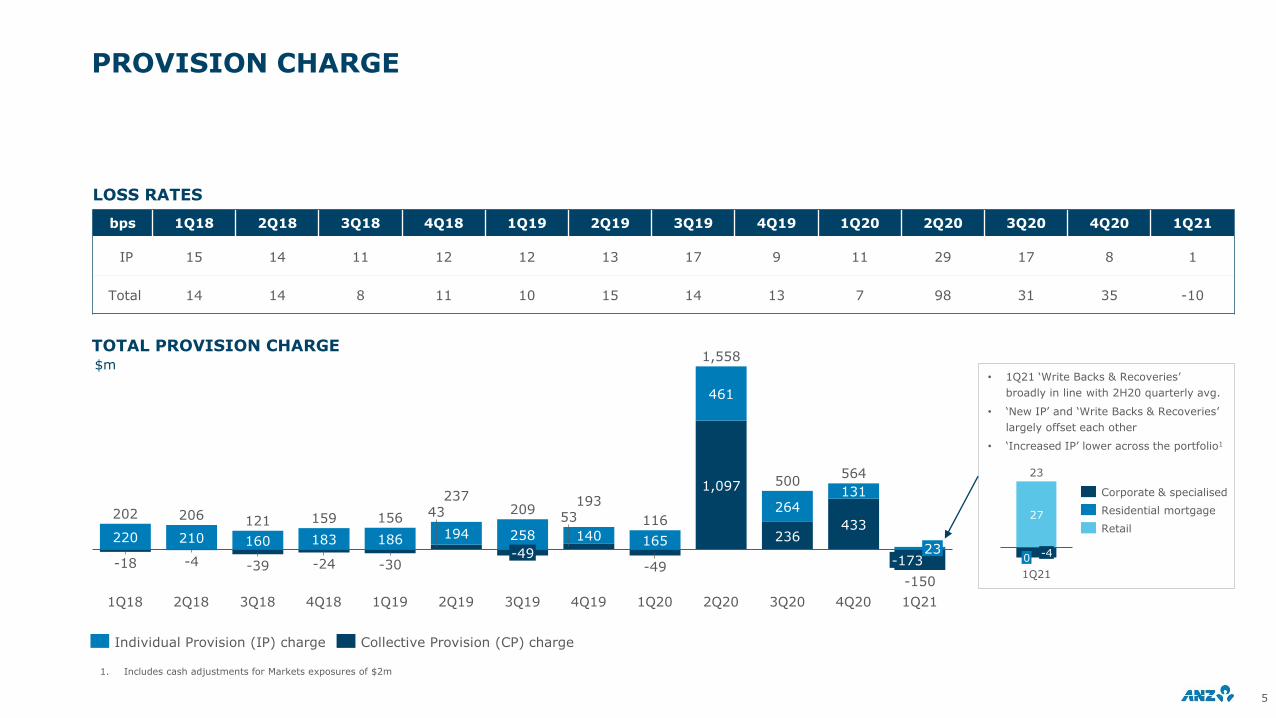
PROVISION CHARGE
$m
5
220 210 160 183 186
43
258
53
165
1,097
236433
-18 -4 -39 -24 -30
194 140
-49
461
264131
2Q18
206 121
1Q18 3Q18
500
1Q19
-173
2Q19
-49
4Q18 3Q19 4Q19 3Q201Q20 2Q20 4Q20
23
1Q21
202 159 156 116209
193
1,558
564
-150
237
Individual Provision (IP) charge Collective Provision (CP) charge
bps 1Q18 2Q18 3Q18 4Q18 1Q19 2Q19 3Q19 4Q19 1Q20 2Q20 3Q20 4Q20 1Q21
IP 15 14 11 12 12 13 17 9 11 29 17 8 1
Total 14 14 8 11 10 15 14 13 7 98 31 35 -10
LOSS RATES
TOTAL PROVISION CHARGE
• 1Q21 ‘Write Backs & Recoveries’
broadly in line with 2H20 quarterly avg.
• ‘New IP’ and ‘Write Backs & Recoveries’
largely offset each other
• ‘Increased IP’ lower across the portfolio1
27
23
-40
1Q21
Corporate & specialised
Residential mortgage
Retail
1. Includes cash adjustments for Markets exposures of $2m
PROVISION BALANCE
6
1. Mar-17 to Sep-18 under AASB 139, Mar-19 onwards under AASB 9
2. Collective Provision Balance of $4,801m is net of FX movements and the divestment of UDC, which have reduced this number by $120m
3. Includes Qualifying Revolving Retail and Other Retail
COLLECTIVE PROVISION BALANCE AND COVERAGE1
$b
$b Sep-19 Mar-20 Sep-20 Dec-20
Australia Retail & Commercial
1.80 2.32 2.85 2.75
Institutional 1.17 1.59 1.51 1.40
New Zealand 0.37 0.54 0.57 0.57
Pacific 0.04 0.05 0.08 0.08
CP BALANCE BY DIVISION CP BALANCE BY PORTFOLIO
$b Sep-19 Mar-20 Sep-20 Dec-20
Corporate 1.62 2.22 2.30 2.28
Specialised 0.19 0.29 0.32 0.28
Housing 0.52 0.81 1.06 0.98
Retail3 0.97 1.10 1.25 1.19
Sovereign/Banks 0.08 0.08 0.08 0.07
Sep-19Sep-18
0.94%0.81%
Sep-17
1.17%
Mar-17 Sep-20
0.79% 0.75%0.75%
Mar-18
1.37%
Mar-20
0.98%
Mar-19
1.39%
Dec-202
3.38
2.79 2.66 2.58 2.52
3.38
4.505.01 4.80
Collective Provision balance as a % of Credit RWACollective Provision balance
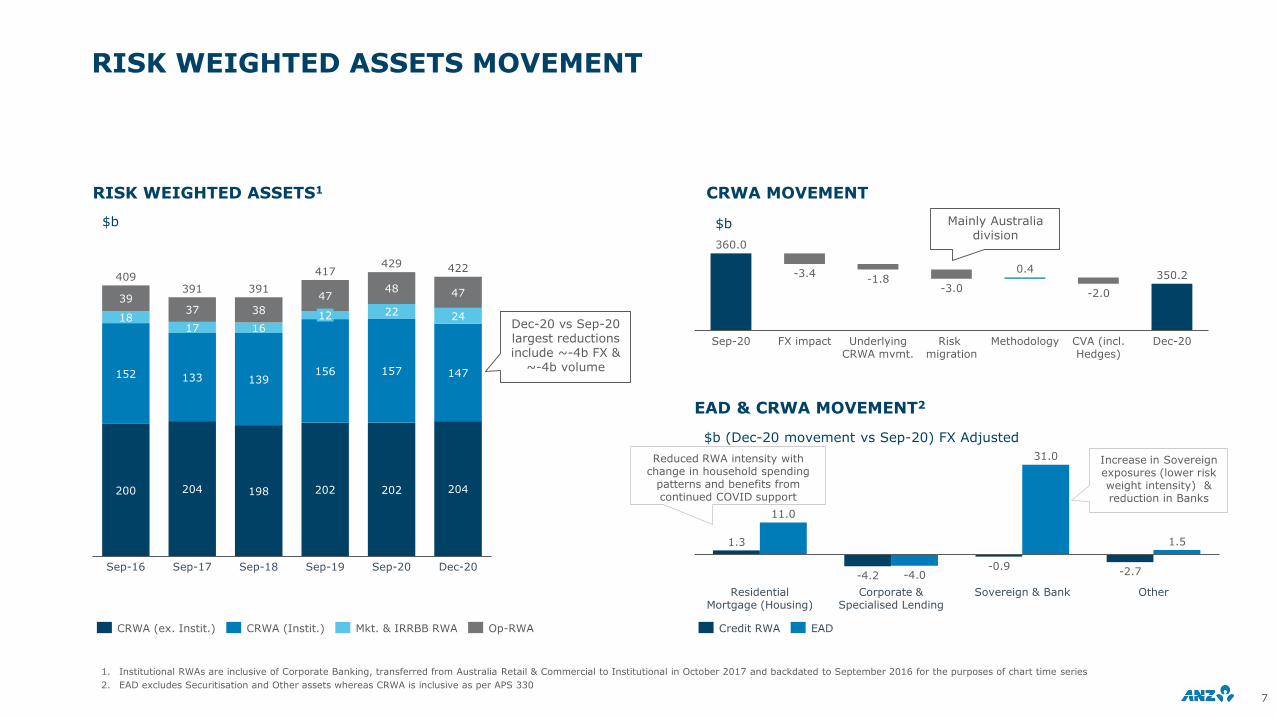
RISK WEIGHTED ASSETS MOVEMENT
RISK WEIGHTED ASSETS1
$b
7
360.0
350.20.4
Underlying CRWA mvmt.
Sep-20 MethodologyFX impact Risk migration
CVA (incl. Hedges)
Dec-20
-3.4-1.8
-3.0 -2.0
CRWA MOVEMENT
200 204 198 202 202 204
152 133 139156 157 147
1817 16
22 24
3937 38
4748 47
Sep-16
391
12
Sep-17 Sep-18 Sep-20Sep-19 Dec-20
409391
422417429
CRWA (ex. Instit.) CRWA (Instit.) Mkt. & IRRBB RWA Op-RWA
1. Institutional RWAs are inclusive of Corporate Banking, transferred from Australia Retail & Commercial to Institutional in October 2017 and backdated to September 2016 for the purposes of chart time series
2. EAD excludes Securitisation and Other assets whereas CRWA is inclusive as per APS 330
$b
EAD & CRWA MOVEMENT2
1.3
-4.2-0.9
-2.7
11.0
-4.0
31.0
1.5
Corporate & Specialised Lending
Residential Mortgage (Housing)
Sovereign & Bank Other
Credit RWA EAD
$b (Dec-20 movement vs Sep-20) FX Adjusted
Increase in Sovereign exposures (lower risk weight intensity) & reduction in Banks
Reduced RWA intensity with change in household spending
patterns and benefits from continued COVID support
Mainly Australia division
Dec-20 vs Sep-20 largest reductions include ~-4b FX &
~-4b volume
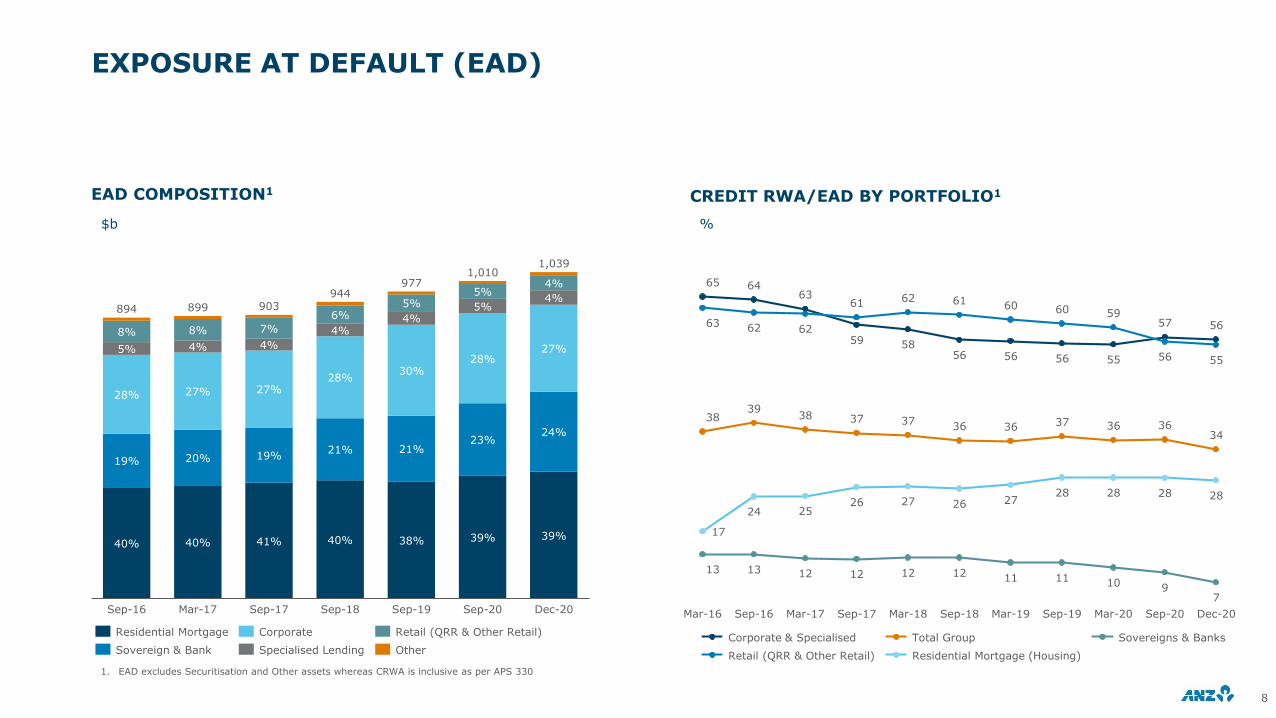
EXPOSURE AT DEFAULT (EAD)
EAD COMPOSITION1 CREDIT RWA/EAD BY PORTFOLIO1
$b %
1. EAD excludes Securitisation and Other assets whereas CRWA is inclusive as per APS 330
8
8%
5%
23%
4%
40%
5%
40%
8%
19%
28%
Sep-16
20%
5%
27%
4%
39%
21%
Mar-17
41%
944
19%
27%
1,039
4%
7%
Sep-17
40%
28%
894
4%
6%
Sep-18
899
21%
38%
30%
39%
4%
1,010
5%903
Sep-19
28%
Sep-20
24%
27%
4%
Dec-20
977
Residential Mortgage Corporate
Sovereign & Bank Specialised Lending Other
Retail (QRR & Other Retail)
65 6463
59 5856 56 56 55
57 5663 62 62
61 62 61 60 60 59
56 55
3839
38 37 3736 36 37 36 36
34
17
24 2526 27 26 27
28 28 28 28
13 13 12 12 12 12 11 11 10 97
Sep-18Sep-16 Mar-17 Mar-18Mar-16 Sep-17 Mar-19 Sep-19 Mar-20 Sep-20 Dec-20
Corporate & Specialised Total Group
Retail (QRR & Other Retail) Residential Mortgage (Housing)
Sovereigns & Banks
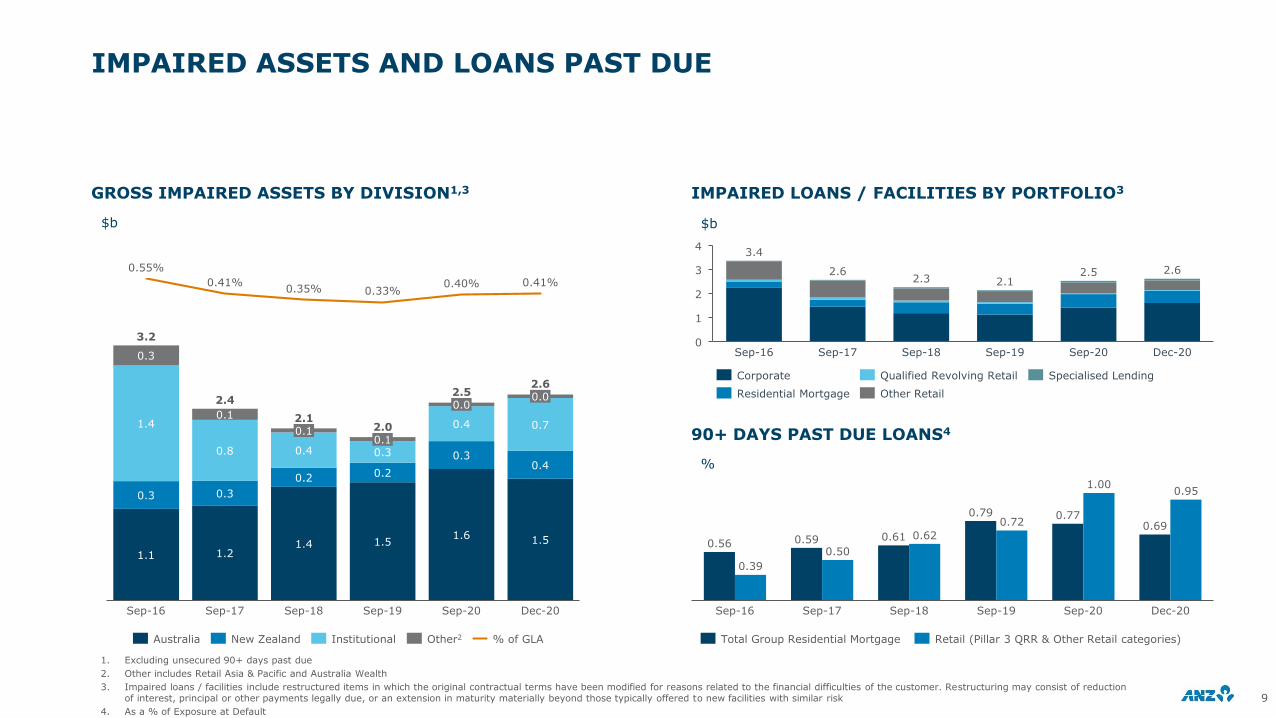
IMPAIRED ASSETS AND LOANS PAST DUE
GROSS IMPAIRED ASSETS BY DIVISION1,3 IMPAIRED LOANS / FACILITIES BY PORTFOLIO3
$b $b
90+ DAYS PAST DUE LOANS4
%
9
1. Excluding unsecured 90+ days past due
2. Other includes Retail Asia & Pacific and Australia Wealth
3. Impaired loans / facilities include restructured items in which the original contractual terms have been modified for reasons related to the financial difficulties of the customer. Restructuring may consist of reduction of interest, principal or other payments legally due, or an extension in maturity materially beyond those typically offered to new facilities with similar risk
4. As a % of Exposure at Default
0.56 0.59 0.61
0.79 0.770.69
0.39
0.50
0.62
0.72
1.000.95
Dec-20Sep-19 Sep-20Sep-18Sep-16 Sep-17
Total Group Residential Mortgage Retail (Pillar 3 QRR & Other Retail categories)
0.55%
0.41%0.35% 0.33%
0.40% 0.41%
0.4
1.1
1.4
0.4
0.3
0.3
0.8
1.2
Dec-20Sep-16
0.3
0.1
Sep-17
1.51.4
0.1
0.2
0.1
Sep-18
1.5
2.1
0.2
0.3
Sep-19
1.6
0.3
0.4
3.2
0.0
Sep-20
0.7
0.02.4
2.0
2.52.6
Australia Other2New Zealand Institutional % of GLA
1
0
2
3
4
Sep-20Sep-18Sep-17Sep-16 Sep-19 Dec-20
3.4
2.62.3 2.1
2.5 2.6
Specialised LendingCorporate
Residential Mortgage
Qualified Revolving Retail
Other Retail
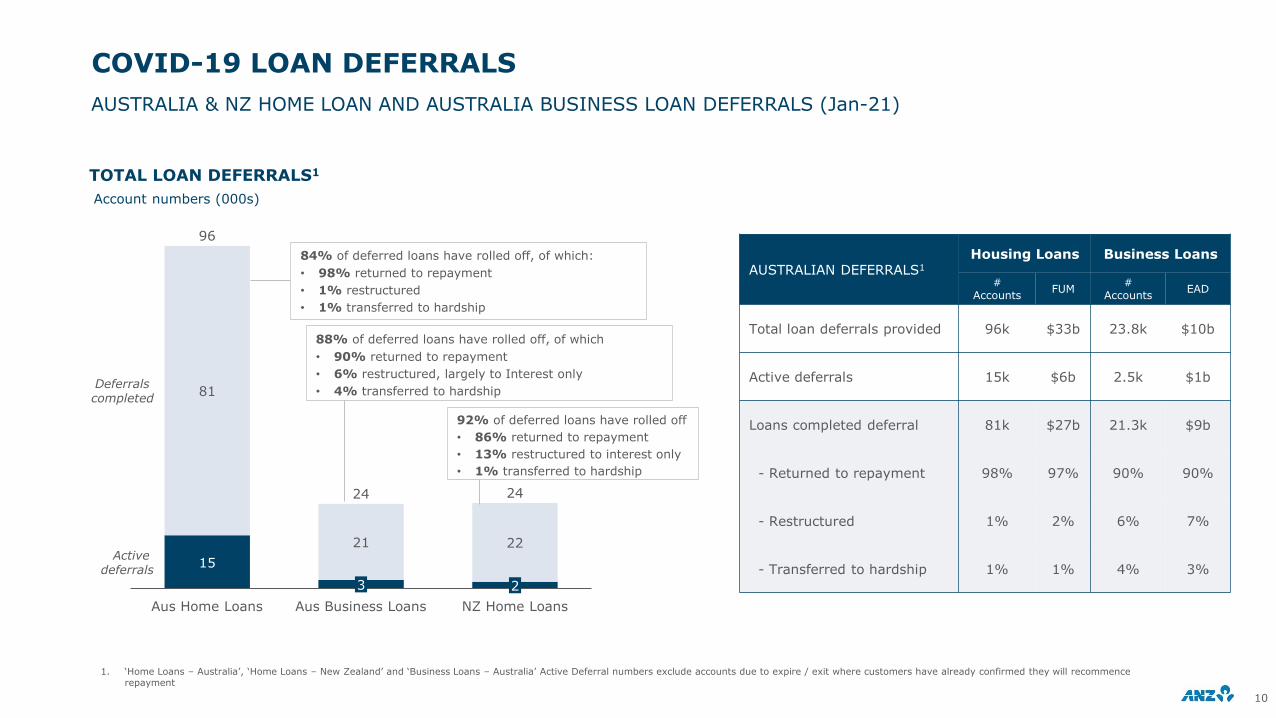
COVID-19 LOAN DEFERRALS
AUSTRALIA & NZ HOME LOAN AND AUSTRALIA BUSINESS LOAN DEFERRALS (Jan-21)
10
1. ‘Home Loans – Australia’, ‘Home Loans – New Zealand’ and ‘Business Loans – Australia’ Active Deferral numbers exclude accounts due to expire / exit where customers have already confirmed they will recommence repayment
AUSTRALIAN DEFERRALS1
Housing Loans Business Loans
# Accounts
FUM#
AccountsEAD
Total loan deferrals provided 96k $33b 23.8k $10b
Active deferrals 15k $6b 2.5k $1b
Loans completed deferral 81k $27b 21.3k $9b
- Returned to repayment 98% 97% 90% 90%
- Restructured 1% 2% 6% 7%
- Transferred to hardship 1% 1% 4% 3%
TOTAL LOAN DEFERRALS1
15
81
21 22
Aus Business LoansAus Home Loans
Deferrals completed
NZ Home Loans
3
96
Active deferrals
24 24
2
Account numbers (000s)
84% of deferred loans have rolled off, of which:
• 98% returned to repayment
• 1% restructured
• 1% transferred to hardship
88% of deferred loans have rolled off, of which
• 90% returned to repayment
• 6% restructured, largely to Interest only
• 4% transferred to hardship
92% of deferred loans have rolled off
• 86% returned to repayment
• 13% restructured to interest only
• 1% transferred to hardship
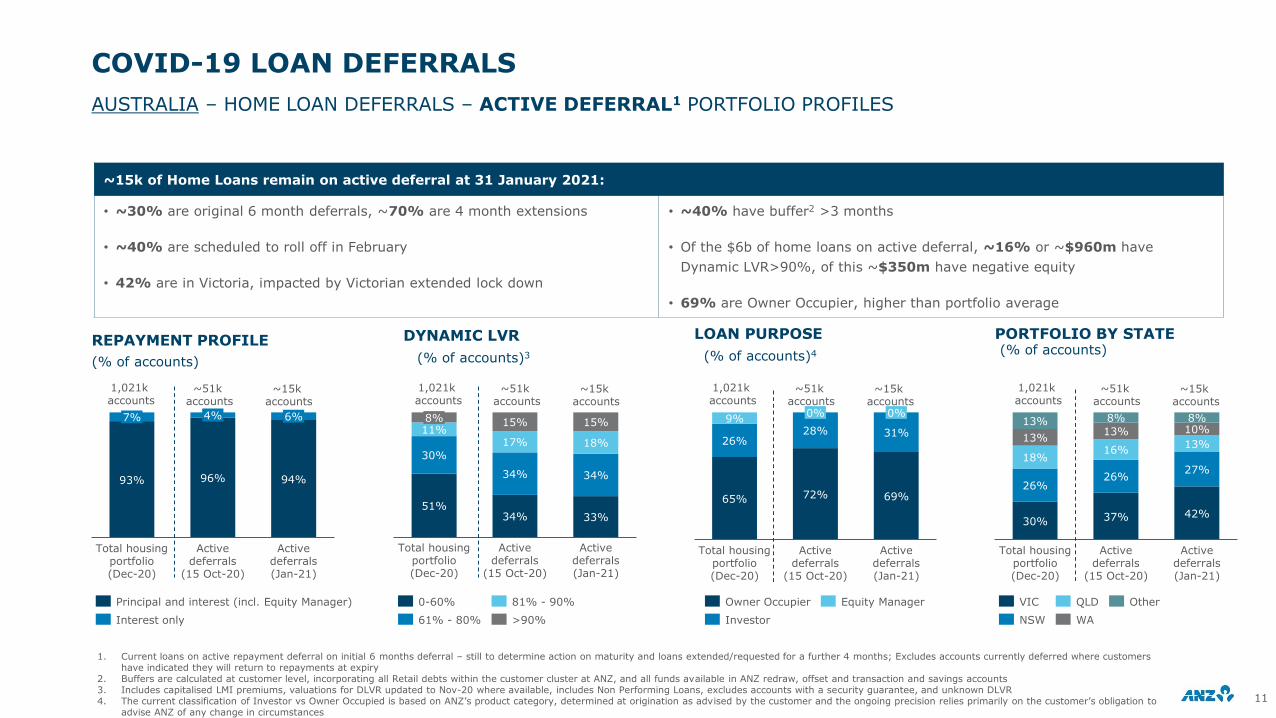
COVID-19 LOAN DEFERRALS
11
AUSTRALIA – HOME LOAN DEFERRALS – ACTIVE DEFERRAL1 PORTFOLIO PROFILES
REPAYMENT PROFILE LOAN PURPOSE
(% of accounts) (% of accounts)4
DYNAMIC LVR
33%51%
30%
11%17%
15%
34%
8%
Total housing portfolio (Dec-20)
34%
15%
Active deferrals
(15 Oct-20)
34%
18%
Active deferrals(Jan-21)
0-60%
61% - 80%
81% - 90%
>90%
Active deferrals
(15 Oct-20)
Total housing portfolio (Dec-20)
93% 96%
7% 4%
94%
6%
Active deferrals(Jan-21)
Interest only
Principal and interest (incl. Equity Manager)
1,021k accounts
~15k accounts
30%
26%
37%
18%
13%
13%
26%
Total housing portfolio (Dec-20)
16%
13%
8%
Active deferrals
(15 Oct-20)
42%
8%
27%
13%
10%
Active deferrals(Jan-21)
WA
VIC
NSW
QLD Other
Total housing portfolio (Dec-20)
26%
9%
65%
28%
72%
0%
Active deferrals
(15 Oct-20)
69%
31%
0%
Active deferrals (Jan-21)
Owner Occupier
Investor
Equity Manager
PORTFOLIO BY STATE(% of accounts)
(% of accounts)3
~51k accounts
1. Current loans on active repayment deferral on initial 6 months deferral – still to determine action on maturity and loans extended/requested for a further 4 months; Excludes accounts currently deferred where customers have indicated they will return to repayments at expiry
2. Buffers are calculated at customer level, incorporating all Retail debts within the customer cluster at ANZ, and all funds available in ANZ redraw, offset and transaction and savings accounts3. Includes capitalised LMI premiums, valuations for DLVR updated to Nov-20 where available, includes Non Performing Loans, excludes accounts with a security guarantee, and unknown DLVR4. The current classification of Investor vs Owner Occupied is based on ANZ’s product category, determined at origination as advised by the customer and the ongoing precision relies primarily on the customer’s obligation to
advise ANZ of any change in circumstances
~15k of Home Loans remain on active deferral at 31 January 2021:
• ~30% are original 6 month deferrals, ~70% are 4 month extensions
• ~40% are scheduled to roll off in February
• 42% are in Victoria, impacted by Victorian extended lock down
• ~40% have buffer2 >3 months
• Of the $6b of home loans on active deferral, ~16% or ~$960m have
Dynamic LVR>90%, of this ~$350m have negative equity
• 69% are Owner Occupier, higher than portfolio average
1,021k accounts
~15k accounts
~51k accounts
1,021k accounts
~15k accounts
~51k accounts
1,021k accounts
~15k accounts
~51k accounts
COVID-19 LOAN DEFERRALS
12
AUSTRALIA – COMMERCIAL BUSINESS LOAN DEFERRALS – ACTIVE DEFERRAL PORTFOLIO PROFILES
BY SECURITY PROFILE (% OF EAD) BY INDUSTRY (% OF EAD)
74% 73% 73%
15% 20% 21%
7%6%
Active Deferrals(Jan-21)
5% 0%
Total Commercial portfolio (Dec-20)
Active deferrals (15 Oct-20)
0%6%
24% 18%10%
19%
10%
13%15%
9%
10%11%
21% 29%
9%
27% 26% 28%
Active Deferrals(Jan-21)
5%6%
5%
Total Commercial portfolio (Dec-20)
Active deferrals (15-Oct-20)
2%
3%
Comm. Property & Construction Accom. Cafes & Restaurants
Agri., Forestry & Fishing
Retail Trade
Other Property & Bus. Services
Health & Community Services
Other Industries1
28%40%
60%
26%
29%
20%
15%
13%
9%
11%
12%8%
12%
Total Commercial portfolio (Dec-20)
6%
Active Deferrals(Jan-21)
4%1%
Active Deferrals (15-Oct-20)
5%2%
VIC/TAS
WANSW/ACT
QLD SA/NT
Other
$68b $1b
Partially Secured
Fully Secured
Others
Unsecured
$68b $68b$1b $1b
BY STATE (% OF EAD)
$4b $4b $4b
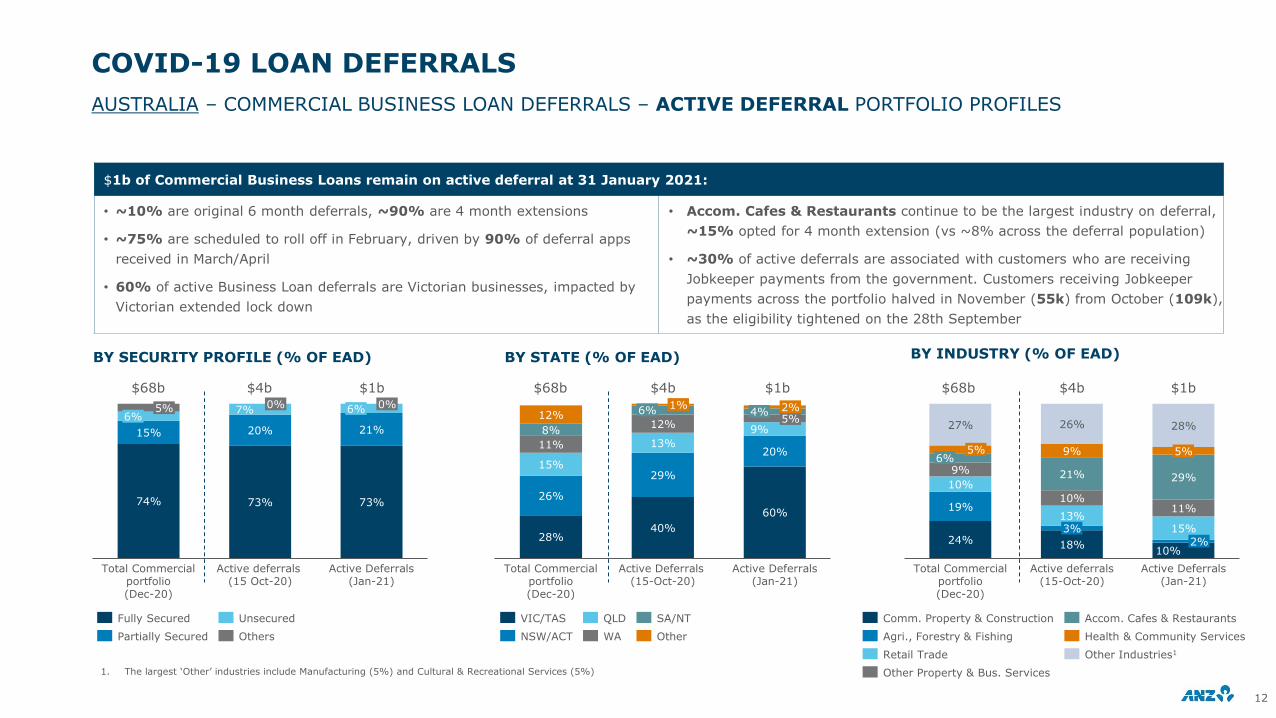
$1b of Commercial Business Loans remain on active deferral at 31 January 2021:
• ~10% are original 6 month deferrals, ~90% are 4 month extensions
• ~75% are scheduled to roll off in February, driven by 90% of deferral apps
received in March/April
• 60% of active Business Loan deferrals are Victorian businesses, impacted by
Victorian extended lock down
• Accom. Cafes & Restaurants continue to be the largest industry on deferral,
~15% opted for 4 month extension (vs ~8% across the deferral population)
• ~30% of active deferrals are associated with customers who are receiving
Jobkeeper payments from the government. Customers receiving Jobkeeper
payments across the portfolio halved in November (55k) from October (109k),
as the eligibility tightened on the 28th September
1. The largest ‘Other’ industries include Manufacturing (5%) and Cultural & Recreational Services (5%)
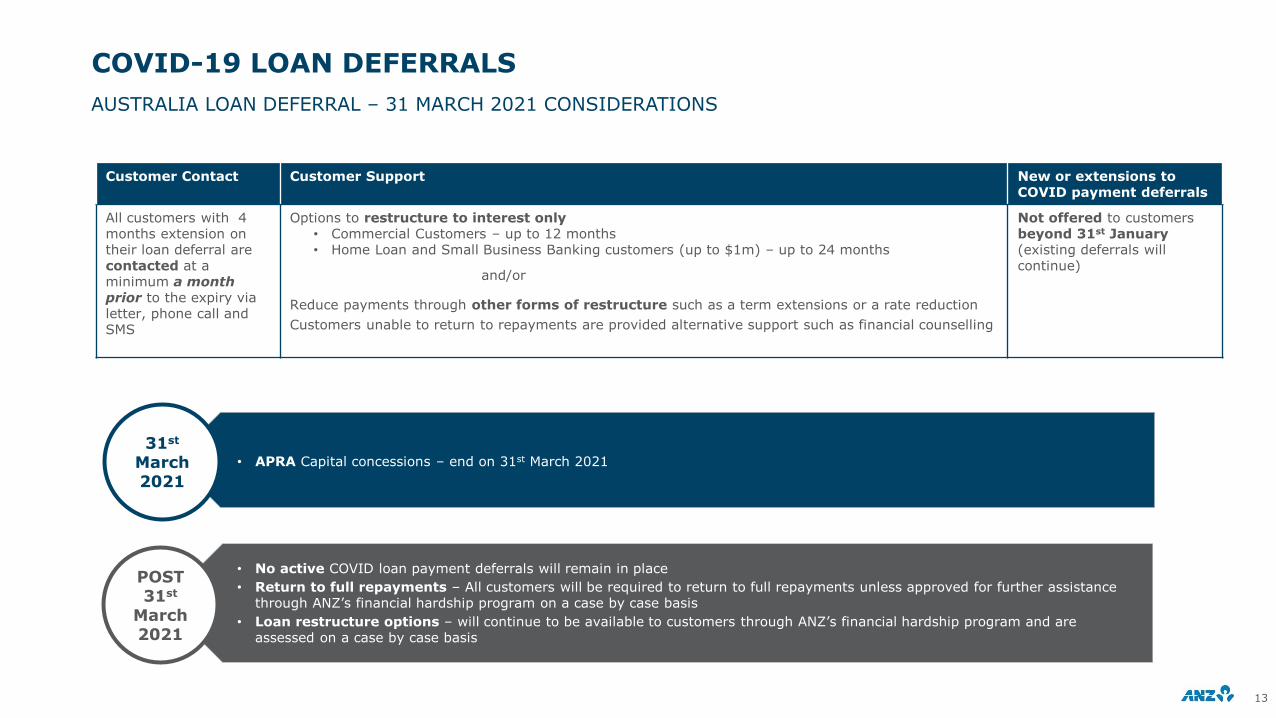
Customer Contact Customer Support New or extensions to COVID payment deferrals
All customers with 4 months extension on their loan deferral are contacted at a minimum a month prior to the expiry via letter, phone call and SMS
Options to restructure to interest only• Commercial Customers – up to 12 months• Home Loan and Small Business Banking customers (up to $1m) – up to 24 months
and/or
Reduce payments through other forms of restructure such as a term extensions or a rate reduction
Customers unable to return to repayments are provided alternative support such as financial counselling
Not offered to customers beyond 31st January(existing deferrals will continue)
COVID-19 LOAN DEFERRALS
AUSTRALIA LOAN DEFERRAL – 31 MARCH 2021 CONSIDERATIONS
13
31st
March 2021
• APRA Capital concessions – end on 31st March 2021
POST31st
March 2021
• No active COVID loan payment deferrals will remain in place
• Return to full repayments – All customers will be required to return to full repayments unless approved for further assistance through ANZ’s financial hardship program on a case by case basis
• Loan restructure options – will continue to be available to customers through ANZ’s financial hardship program and are assessed on a case by case basis
AUSTRALIA HOME LOAN PORTFOLIO
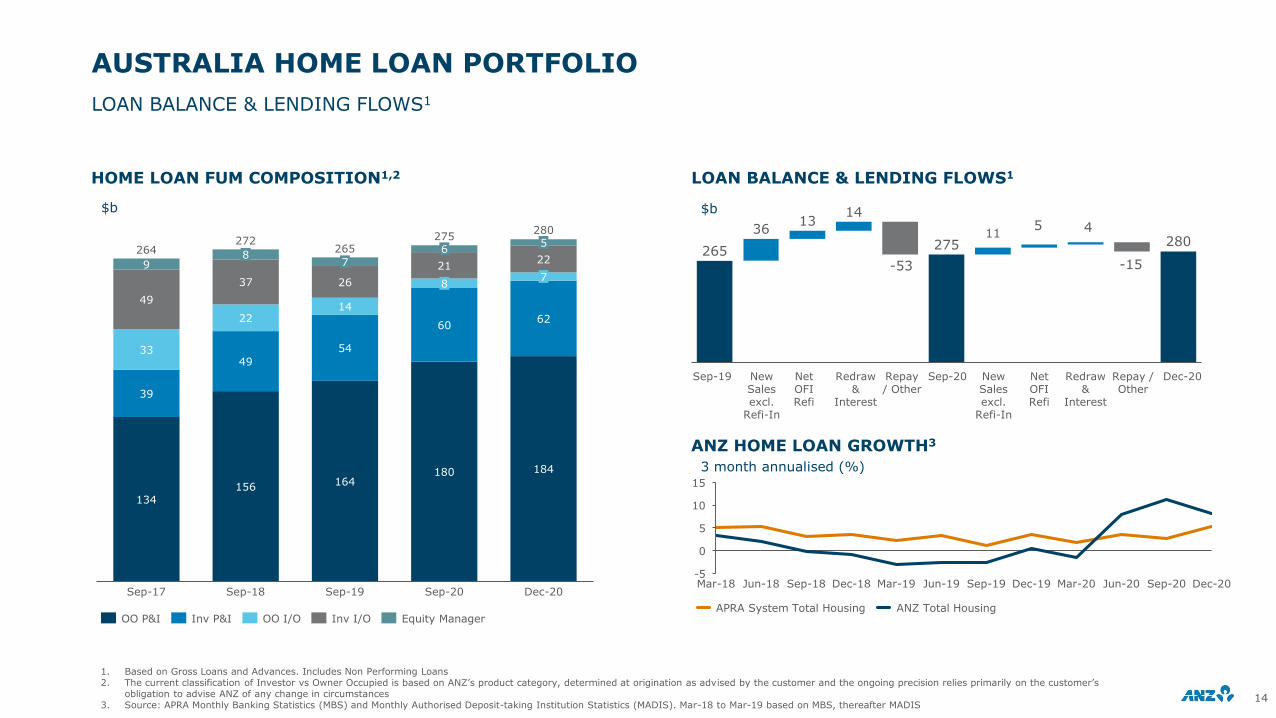
HOME LOAN FUM COMPOSITION1,2 LOAN BALANCE & LENDING FLOWS1
$b $b
ANZ HOME LOAN GROWTH3
3 month annualised (%)
LOAN BALANCE & LENDING FLOWS1
14
1. Based on Gross Loans and Advances. Includes Non Performing Loans2. The current classification of Investor vs Owner Occupied is based on ANZ’s product category, determined at origination as advised by the customer and the ongoing precision relies primarily on the customer’s
obligation to advise ANZ of any change in circumstances3. Source: APRA Monthly Banking Statistics (MBS) and Monthly Authorised Deposit-taking Institution Statistics (MADIS). Mar-18 to Mar-19 based on MBS, thereafter MADIS
0
10
15
-5
5
Sep-18Mar-18 Sep-20Jun-20Jun-18 Dec-18 Mar-19 Jun-19 Sep-19 Dec-19 Mar-20 Dec-20
ANZ Total HousingAPRA System Total Housing
134156 164
180 184
39
49
54
6062
33
2214
49
37 26
21229
Sep-19Sep-18Sep-17
87
8
280
6
Sep-20
7
5
Dec-20
264272
265275
Equity ManagerInv I/OOO P&I Inv P&I OO I/O
265 275 28036
1314
115 4
-15
New Sales excl.
Refi-In
Net OFI Refi
Sep-19 Repay / Other
Redraw &
Interest
Sep-20
-53
New Sales excl.
Refi-In
Net OFI Refi
Redraw &
Interest
Repay / Other
Dec-20
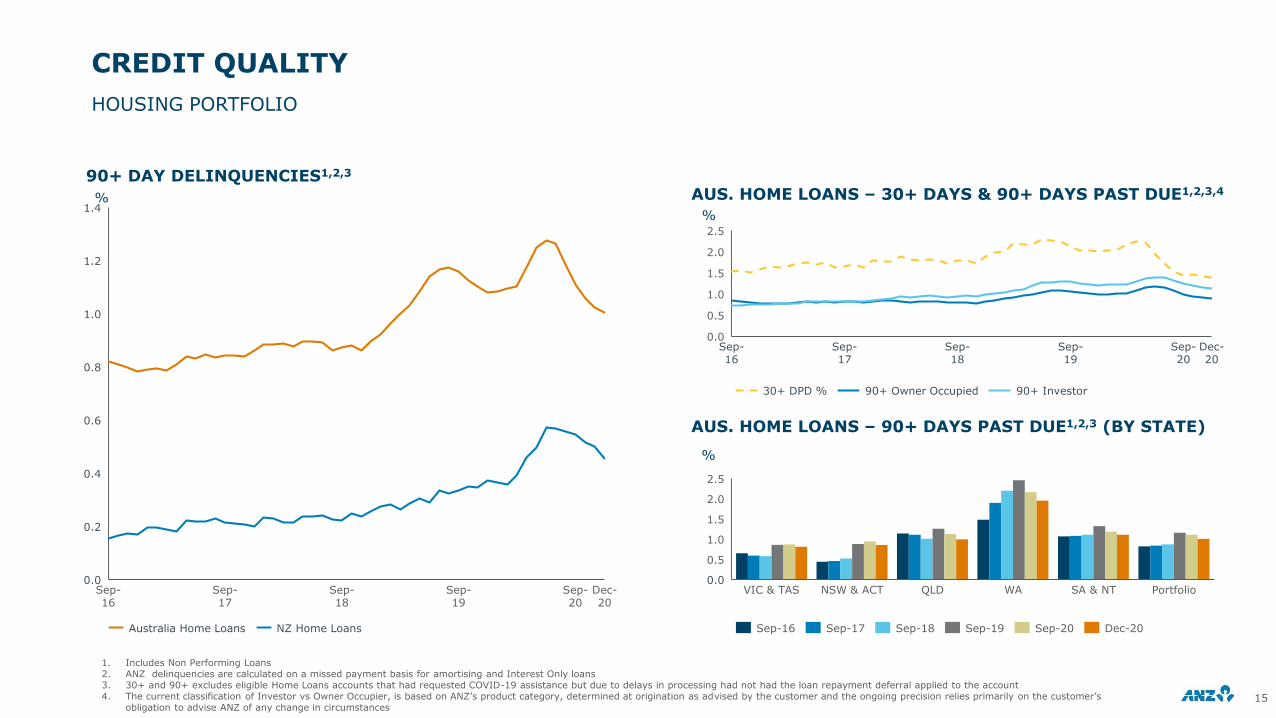
CREDIT QUALITY
AUS. HOME LOANS – 30+ DAYS & 90+ DAYS PAST DUE1,2,3,4
AUS. HOME LOANS – 90+ DAYS PAST DUE1,2,3 (BY STATE)
%
15
HOUSING PORTFOLIO
90+ DAY DELINQUENCIES1,2,3
%2.5
0.0
0.5
1.0
2.0
1.5
Sep-19
Sep-16
Sep-17
Sep-18
Sep-20
Dec-20
30+ DPD % 90+ Owner Occupied 90+ Investor
0.0
0.5
1.5
1.0
2.0
2.5
NSW & ACT PortfolioVIC & TAS QLD WA SA & NT
Sep-16 Sep-18Sep-17 Sep-20Sep-19 Dec-20
%
1. Includes Non Performing Loans 2. ANZ delinquencies are calculated on a missed payment basis for amortising and Interest Only loans 3. 30+ and 90+ excludes eligible Home Loans accounts that had requested COVID-19 assistance but due to delays in processing had not had the loan repayment deferral applied to the account4. The current classification of Investor vs Owner Occupier, is based on ANZ’s product category, determined at origination as advised by the customer and the ongoing precision relies primarily on the customer’s
obligation to advise ANZ of any change in circumstances
0.4
1.2
0.0
0.2
1.4
0.8
0.6
1.0
Sep-19
Sep-17
Sep-16
Sep-18
Sep-20
Dec-20
NZ Home LoansAustralia Home Loans
16
FURTHER INFORMATION
Equity Investors
Jill CampbellGroup General Manager Investor Relations+61 3 8654 7749+61 412 047 [email protected]
Cameron DavisExecutive Manager Investor Relations+61 3 8654 7716+61 421 613 [email protected]
Harsh VardhanSenior Manager Investor Relations+61 3 8655 0878+61 466 848 [email protected]
Retail Investors Debt Investors
Michelle WeerakoonManager Shareholder Services & Events+61 3 8654 7682+61 411 143 [email protected]
Scott GiffordHead of Debt Investor Relations +61 3 8655 5683+61 434 076 [email protected]
Our Shareholder information anz.com/shareholder/centre/DISCLAIMER & IMPORTANT NOTICE: The material in this presentation is general background information about the Bank’s activities current at the date of the presentation. It is information given in summary form and does not purport to be complete. It is not intended to be relied upon as advice to investors or potential investors and does not take into account the investment objectives, financial situation or needs of any particular investor. These should be considered, with or without professional advice when deciding if an investment is appropriate.
This presentation may contain forward-looking statements including statements regarding our intent, belief or current expectations with respect to ANZ’s business and operations, market conditions, results of operations and financial condition, capital adequacy, specific provisions and risk management practices. When used in this presentation, the words “estimate”, “project”, “intend”, “anticipate”, “believe”, “expect”, “should” and similar expressions, as they relate to ANZ and its management, are intended to identify forward-looking statements. Readers are cautioned not to place undue reliance on these forward-looking statements, which speak only as of the date hereof. Such statements constitute “forward-looking statements” for the purposes of the United States Private Securities Litigation Reform Act of 1995. ANZ does not undertake any obligation to publicly release the result of any revisions to these forward-looking statements to reflect events or circumstances after the date hereof to reflect the occurrence of unanticipated events.
COVID-19 update Corporate Overview & Sustainability AASB 9
https://www.anz.com/shareholder/centre/investor-toolkit/
https://www.anz.com/shareholder/centre/reporting/sustainability/
https://www.anz.com/shareholder/centre/investor-toolkit/
Latest commentary on
response to COVID-19 pandemic
Progress against our
Environment, Social &
Governance (ESG) targets
AASB 9 overview and
stages