Embed Size (px)
Citation preview
© 2019 Halliburton. All rights reserved.
First Quarter 2019 Update
Investor Relations Contacts
Abu Zeya, Sr. Director
Marina Matselinskaya, Director
281-871-2688 or [email protected]
NYSE Stock Symbol: HAL
Common Dividend: $0.18 in the first quarter 2019
Shares Outstanding: 874 million as of 04/19/2019
2© 2019 Halliburton. All rights reserved.
Safe Harbor
The statements in this presentation that are not historical statements, including statements regarding future financial performance, are forward-looking statements within the meaning of the federal securities laws. These statements are subject to numerous risks and uncertainties, many of which are beyond the company's control, which could cause actual results to differ materially from the results expressed or implied by the statements. These risks and uncertainties include, but are not limited to: the continuation or suspension of our stock repurchase program, the amount, the timing and the trading prices of Halliburton common stock, and the availability and alternative uses of cash; changes in the demand for or price of oil and/or natural gas; potential catastrophic events related to our operations, and related indemnification and insurance matters; protection of intellectual property rights and against cyber-attacks; compliance with environmental laws; changes in government regulations and regulatory requirements, particularly those related to offshore oil and natural gas exploration, radioactive sources, explosives, chemicals, hydraulic fracturing services, and climate-related initiatives; the impact of federal tax reform, compliance with laws related to income taxes and assumptions regarding the generation of future taxable income; risks of international operations, including risks relating to unsettled political conditions, war, the effects of terrorism, foreign exchange rates and controls, international trade and regulatory controls and sanctions, and doing business with national oil companies; weather-related issues, including the effects of hurricanes and tropical storms; changes in capital spending by customers; delays or failures by customers to make payments owed to us; execution of long-term, fixed-price contracts; structural changes in the oil and natural gas industry; maintaining a highly skilled workforce; availability and cost of raw materials; agreement with respect to and completion of potential acquisitions and integration and success of acquired businesses and operations of joint ventures. Halliburton's Form 10-K for the year ended December 31, 2018, Form 10-Q for the quarter ended March 31, 2019, recent Current Reports on Form 8-K, and other Securities and Exchange Commission filings discuss some of the important risk factors identified that may affect Halliburton's business, results of operations, and financial condition. Halliburton undertakes no obligation to revise or update publicly any forward-looking statements for any reason.
© 2019 Halliburton. All rights reserved.
Agenda
Company Overview
Returns-focused Strategy Unconventionals Mature Fields Deep Water
Financial Review
3
4© 2019 Halliburton. All rights reserved.
TCTC
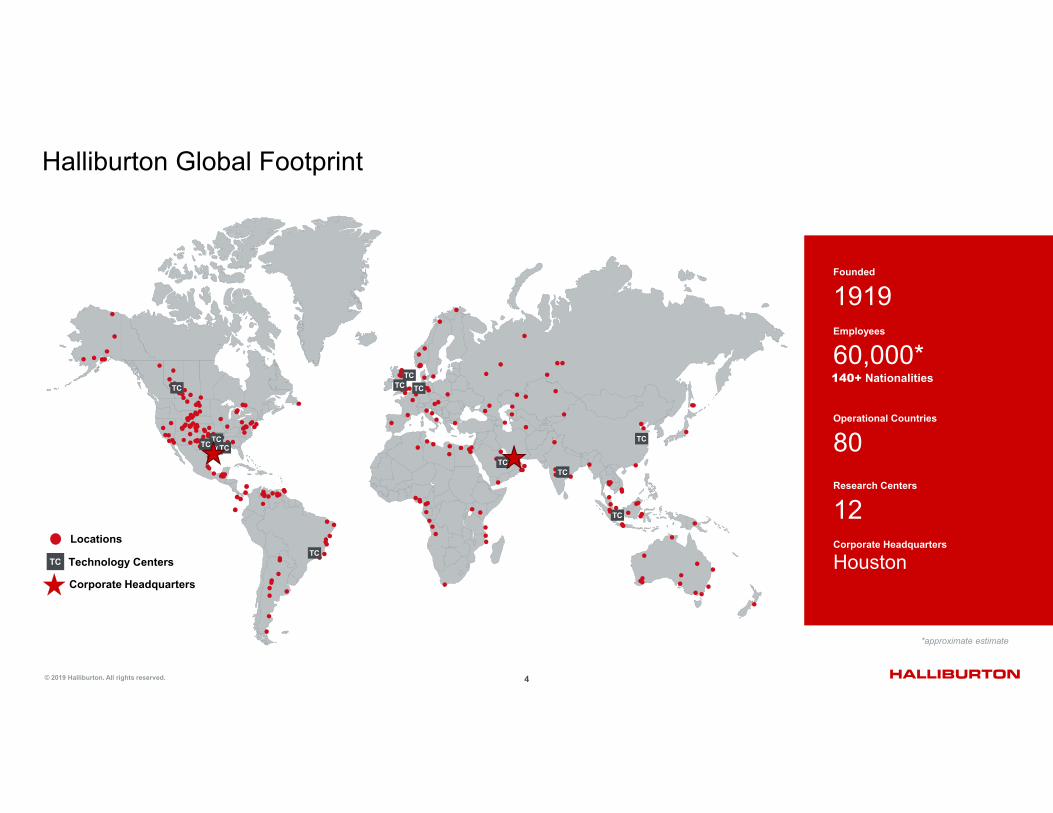
Halliburton Global Footprint
Founded
1919
60,000*
Operational Countries
80Research Centers
12Corporate Headquarters
Houston
Employees
140+ Nationalities
*approximate estimate
TCTC
TCTC
TC TC
TCTC
TC
TC
TC
TC
TC
Locations
Technology Centers
Corporate Headquarters
5© 2019 Halliburton. All rights reserved.
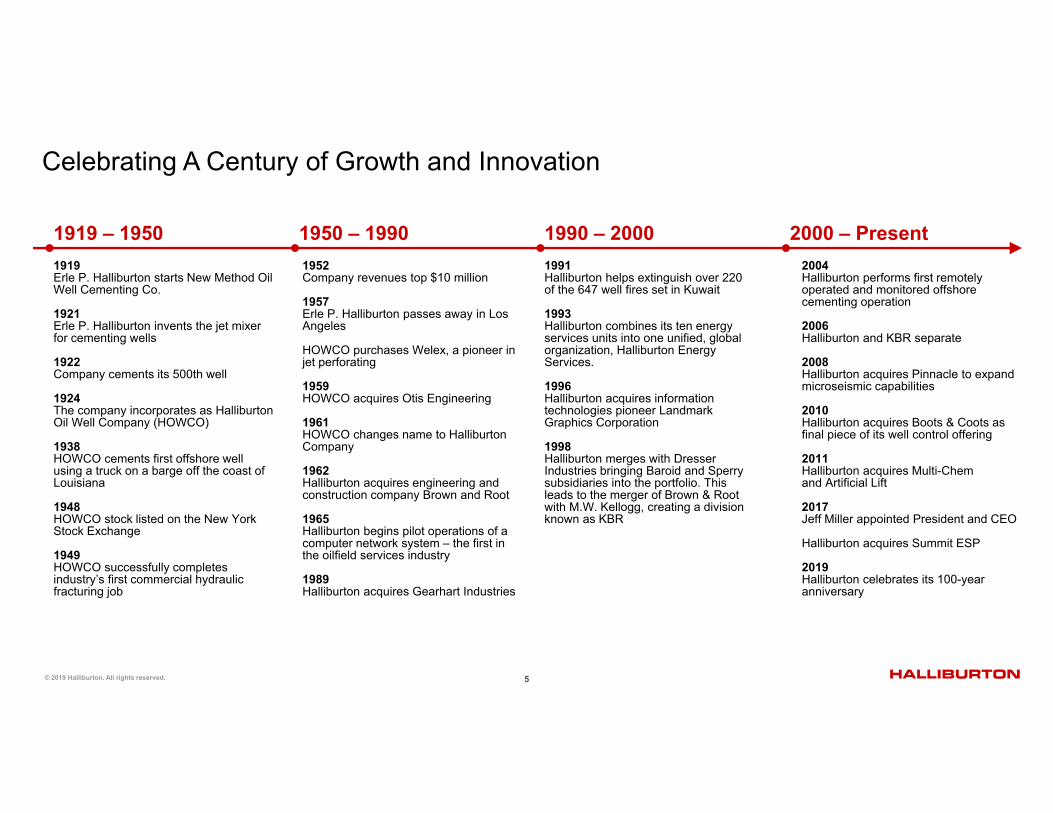
1991Halliburton helps extinguish over 220 of the 647 well fires set in Kuwait
1993Halliburton combines its ten energy services units into one unified, global organization, Halliburton Energy Services.
1996Halliburton acquires information technologies pioneer Landmark Graphics Corporation
1998Halliburton merges with Dresser Industries bringing Baroid and Sperry subsidiaries into the portfolio. This leads to the merger of Brown & Root with M.W. Kellogg, creating a division known as KBR
1990 – 20001952Company revenues top $10 million
1957 Erle P. Halliburton passes away in Los Angeles
HOWCO purchases Welex, a pioneer in jet perforating
1959 HOWCO acquires Otis Engineering
1961 HOWCO changes name to Halliburton Company
1962Halliburton acquires engineering and construction company Brown and Root
1965Halliburton begins pilot operations of a computer network system – the first in the oilfield services industry
1989Halliburton acquires Gearhart Industries
1950 – 19901919Erle P. Halliburton starts New Method Oil Well Cementing Co.
1921Erle P. Halliburton invents the jet mixer for cementing wells
1922Company cements its 500th well
1924The company incorporates as Halliburton Oil Well Company (HOWCO)
1938HOWCO cements first offshore well using a truck on a barge off the coast of Louisiana
1948HOWCO stock listed on the New York Stock Exchange
1949HOWCO successfully completes industry’s first commercial hydraulic fracturing job
1919 – 19502004 Halliburton performs first remotely operated and monitored offshore cementing operation
2006Halliburton and KBR separate
2008Halliburton acquires Pinnacle to expand microseismic capabilities
2010Halliburton acquires Boots & Coots as final piece of its well control offering
2011Halliburton acquires Multi-Chemand Artificial Lift
2017Jeff Miller appointed President and CEO
Halliburton acquires Summit ESP
2019Halliburton celebrates its 100-year anniversary
2000 – Present
Celebrating A Century of Growth and Innovation
6© 2019 Halliburton. All rights reserved.
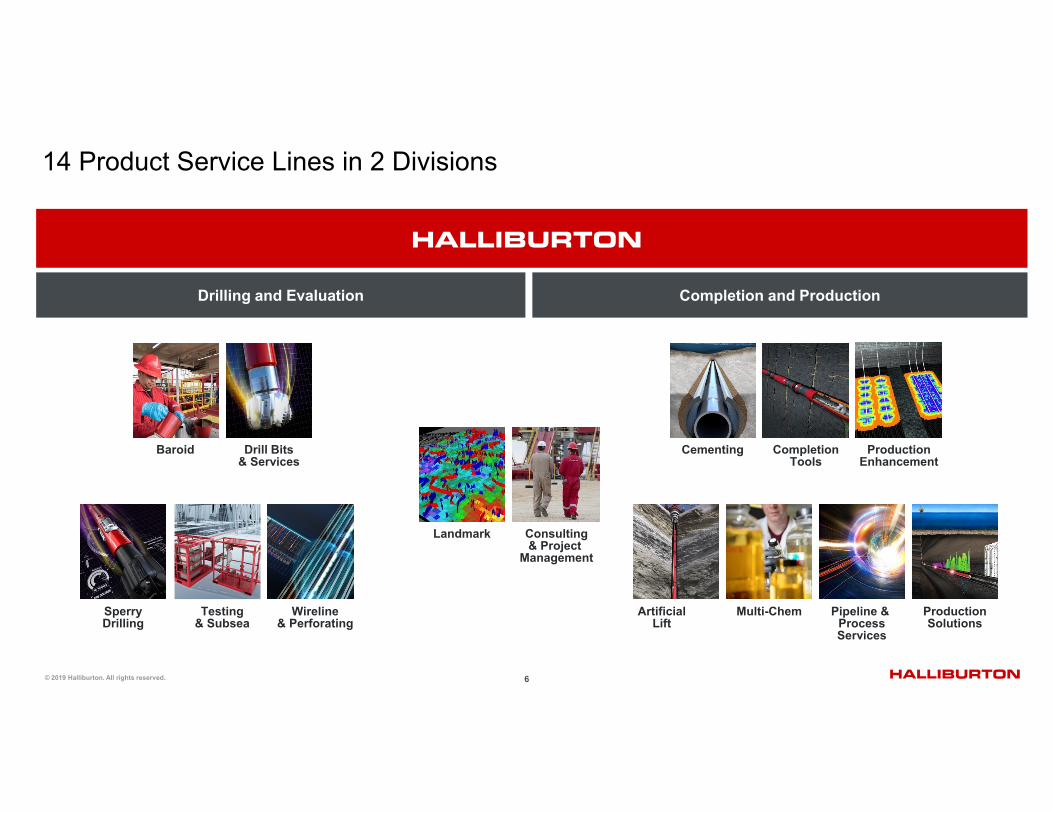
14 Product Service Lines in 2 Divisions
Drill Bits& Services
Baroid
Consulting& Project
Management
Landmark
Testing& Subsea
Wireline& Perforating
SperryDrilling
Cementing CompletionTools
ProductionEnhancement
ArtificialLift
Pipeline & ProcessServices
Multi-Chem ProductionSolutions
Drilling and Evaluation Completion and Production
7© 2019 Halliburton. All rights reserved.
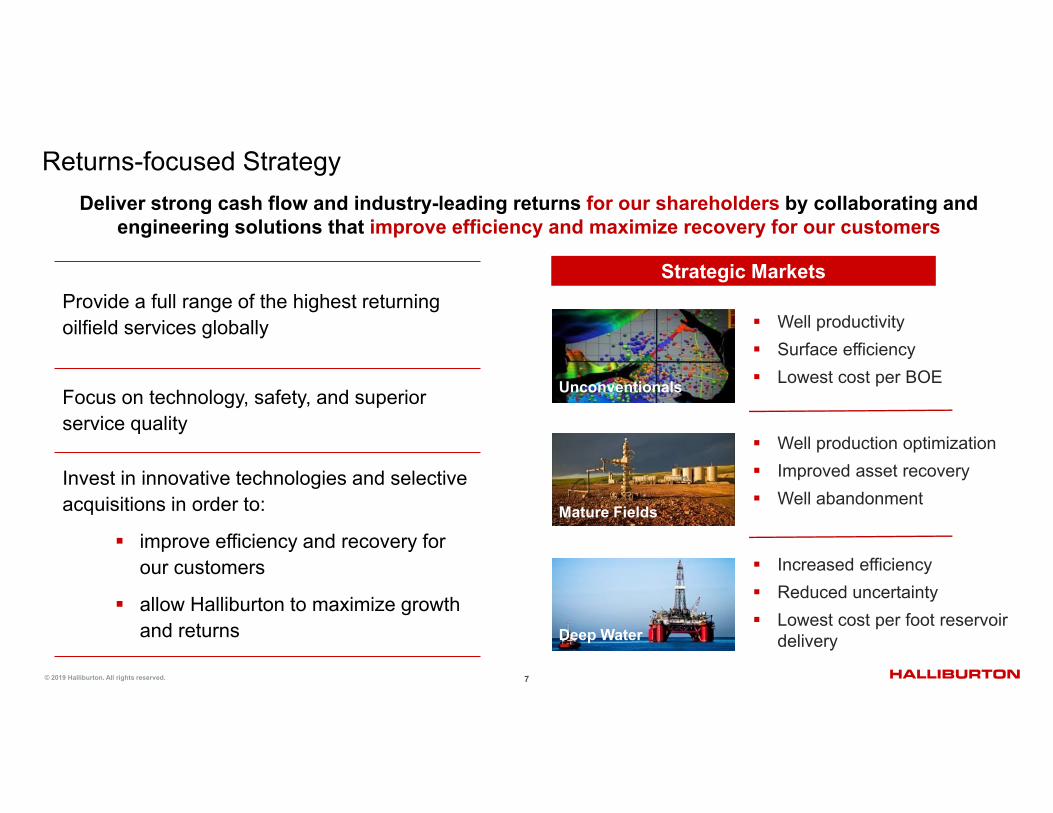
Returns-focused Strategy
Well productivity Surface efficiency Lowest cost per BOE
Well production optimization Improved asset recovery Well abandonment
Increased efficiency Reduced uncertainty Lowest cost per foot reservoir
delivery
Deliver strong cash flow and industry-leading returns for our shareholders by collaborating and engineering solutions that improve efficiency and maximize recovery for our customers
Strategic Markets
Unconventionals
Mature Fields
Deep Water
Provide a full range of the highest returning oilfield services globally
Focus on technology, safety, and superior service quality
Invest in innovative technologies and selective acquisitions in order to:
improve efficiency and recovery for our customers
allow Halliburton to maximize growth and returns
8© 2019 Halliburton. All rights reserved.
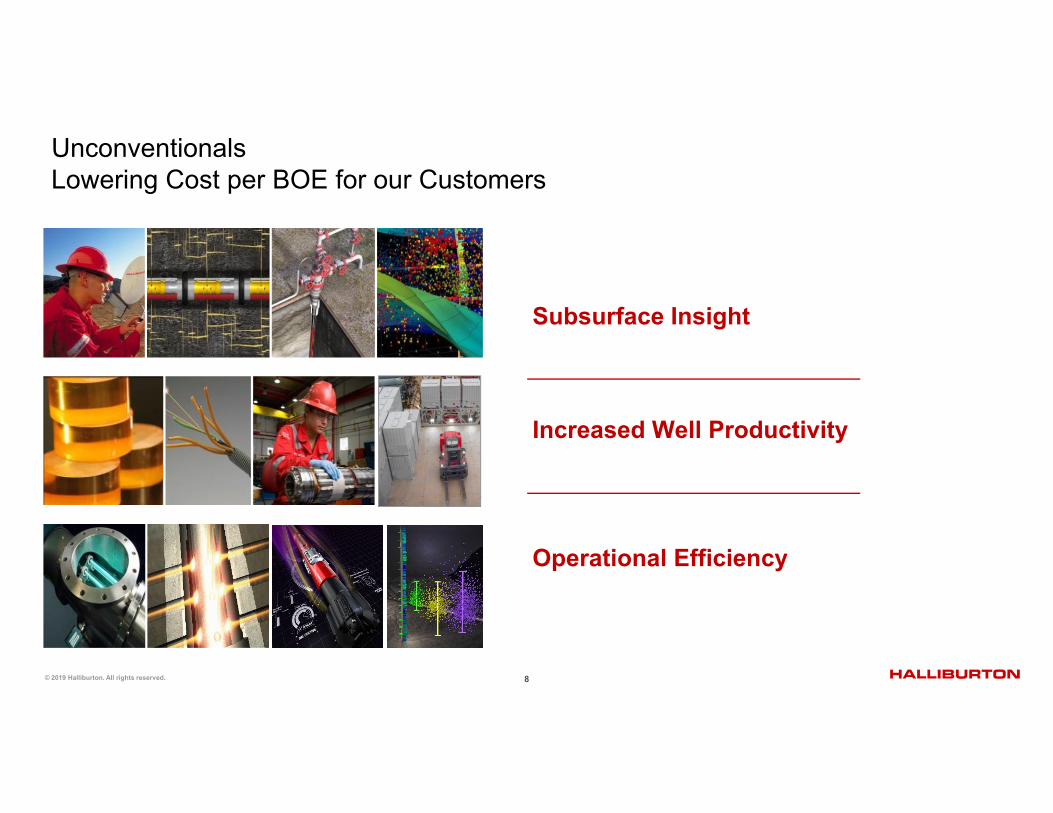
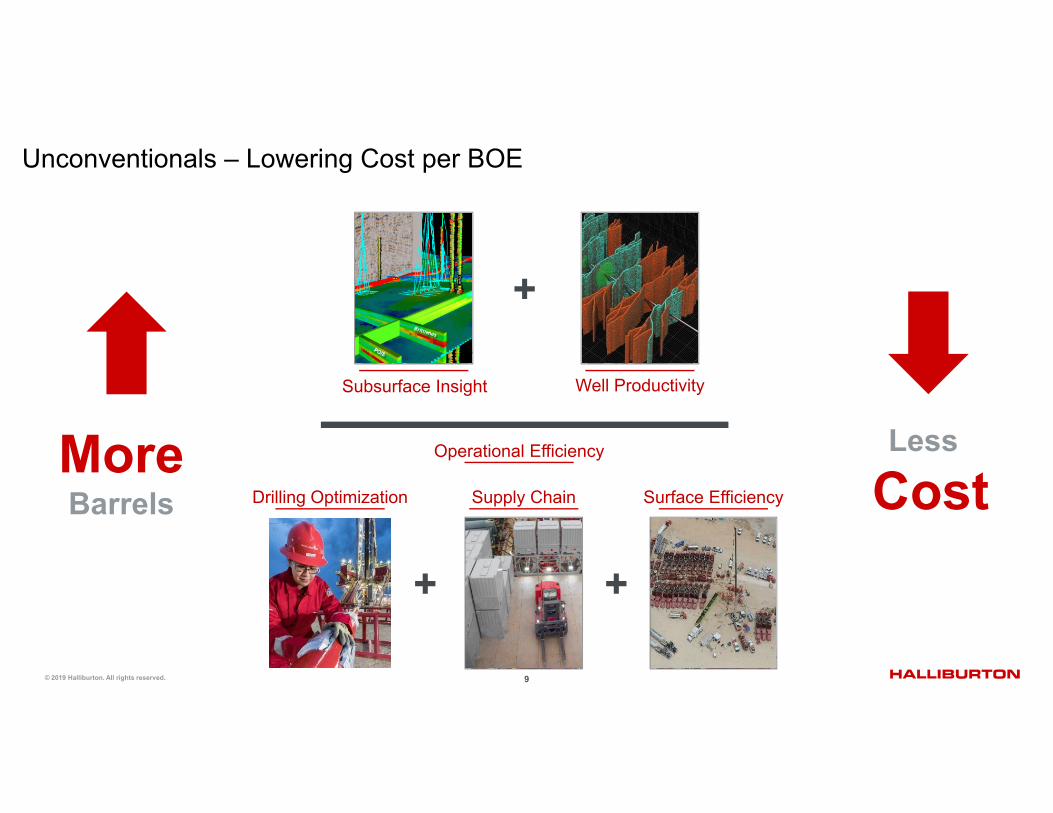
UnconventionalsLowering Cost per BOE for our Customers
Subsurface Insight
Increased Well Productivity
Operational Efficiency
9© 2019 Halliburton. All rights reserved.
+ +
+
Drilling Optimization Supply Chain Surface Efficiency
Subsurface Insight Well Productivity
MoreBarrels
Less
Cost
Unconventionals – Lowering Cost per BOE
Operational Efficiency
10© 2019 Halliburton. All rights reserved.
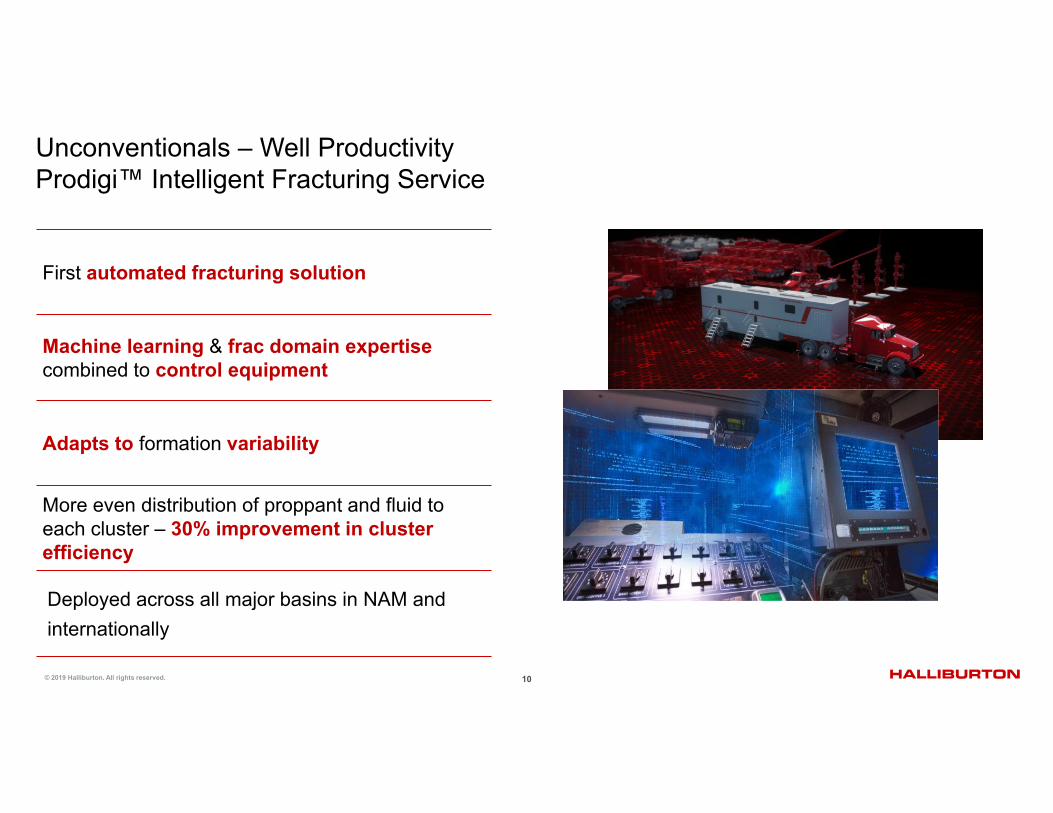
Unconventionals – Well Productivity Prodigi™ Intelligent Fracturing Service
First automated fracturing solution
Machine learning & frac domain expertise combined to control equipment
Adapts to formation variability
More even distribution of proppant and fluid to each cluster – 30% improvement in cluster efficiency
Deployed across all major basins in NAM and internationally
11© 2019 Halliburton. All rights reserved.
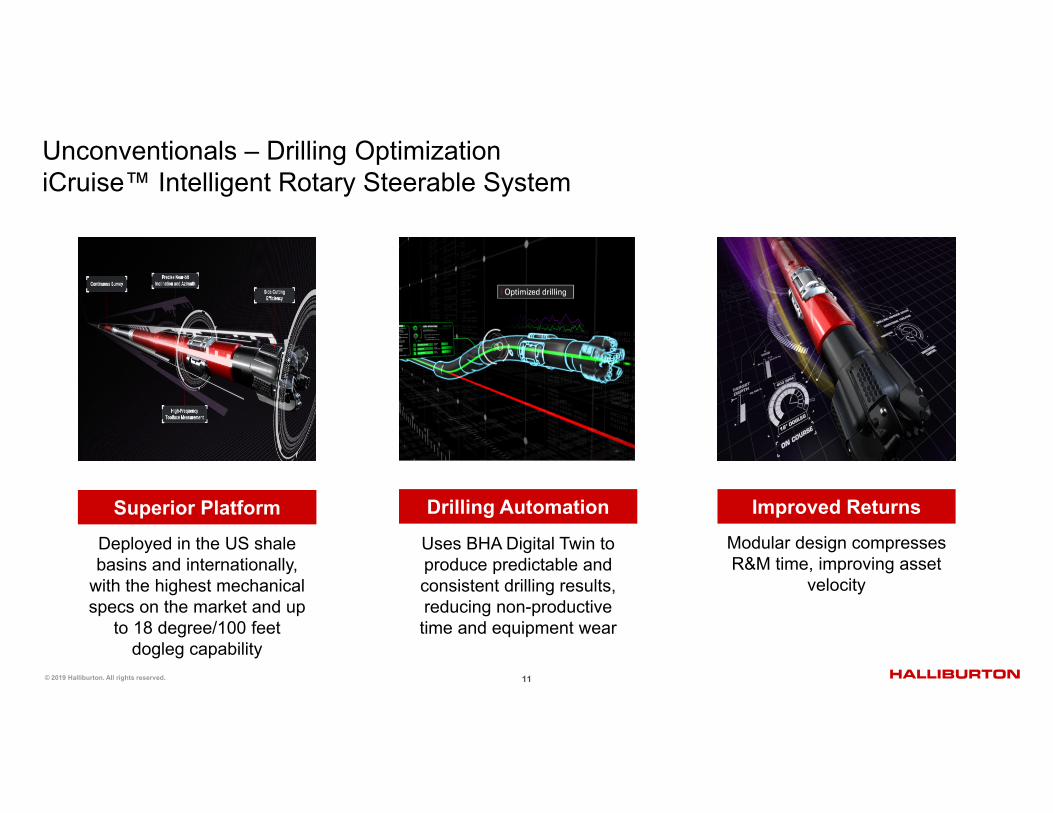
Modular design compresses R&M time, improving asset
velocity
Deployed in the US shale basins and internationally,
with the highest mechanical specs on the market and up
to 18 degree/100 feet dogleg capability
Maximize your Asset Value Unconventionals – Drilling OptimizationiCruise™ Intelligent Rotary Steerable System
Uses BHA Digital Twin to produce predictable and consistent drilling results, reducing non-productive time and equipment wear
Drilling AutomationSuperior Platform Improved Returns
12© 2019 Halliburton. All rights reserved.
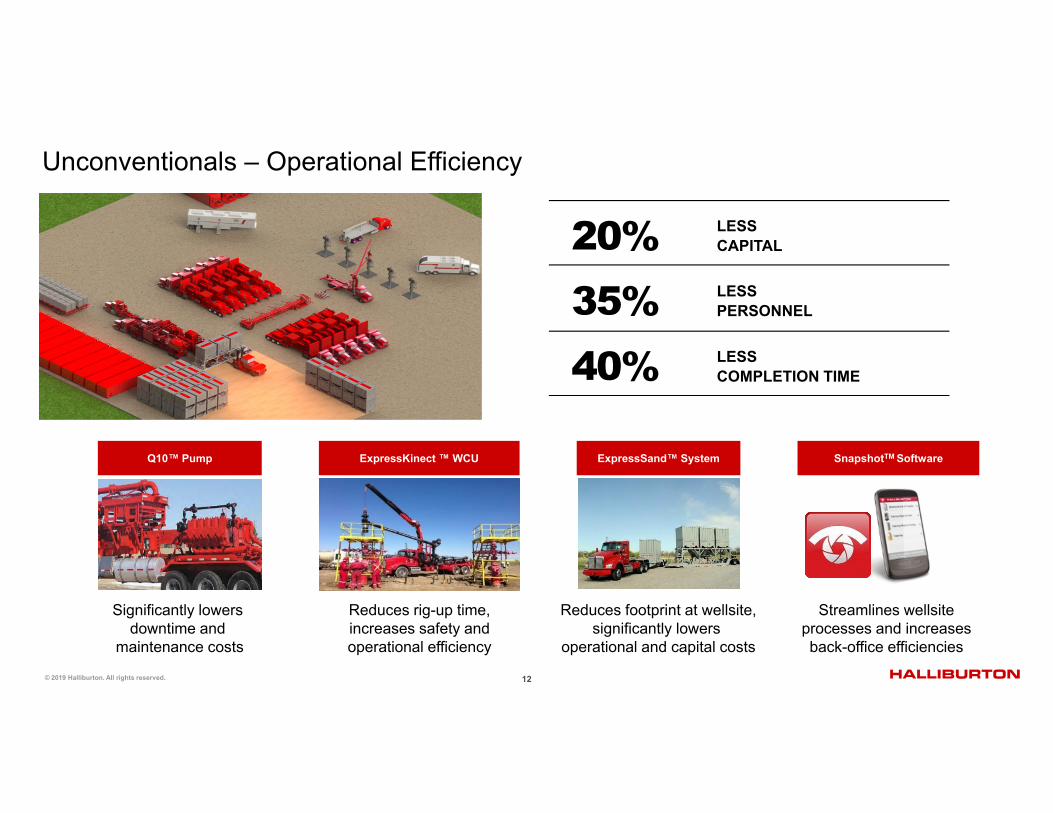
Unconventionals – Operational Efficiency
35% LESSPERSONNEL
40% LESSCOMPLETION TIME
20% LESSCAPITAL
ExpressKinect ™ WCU
Reduces rig-up time, increases safety and operational efficiency
Q10™ Pump
Significantly lowers downtime and
maintenance costs
SnapshotTM Software
Streamlines wellsite processes and increases back-office efficiencies
ExpressSand™ System
Reduces footprint at wellsite,significantly lowers
operational and capital costs
13© 2019 Halliburton. All rights reserved.
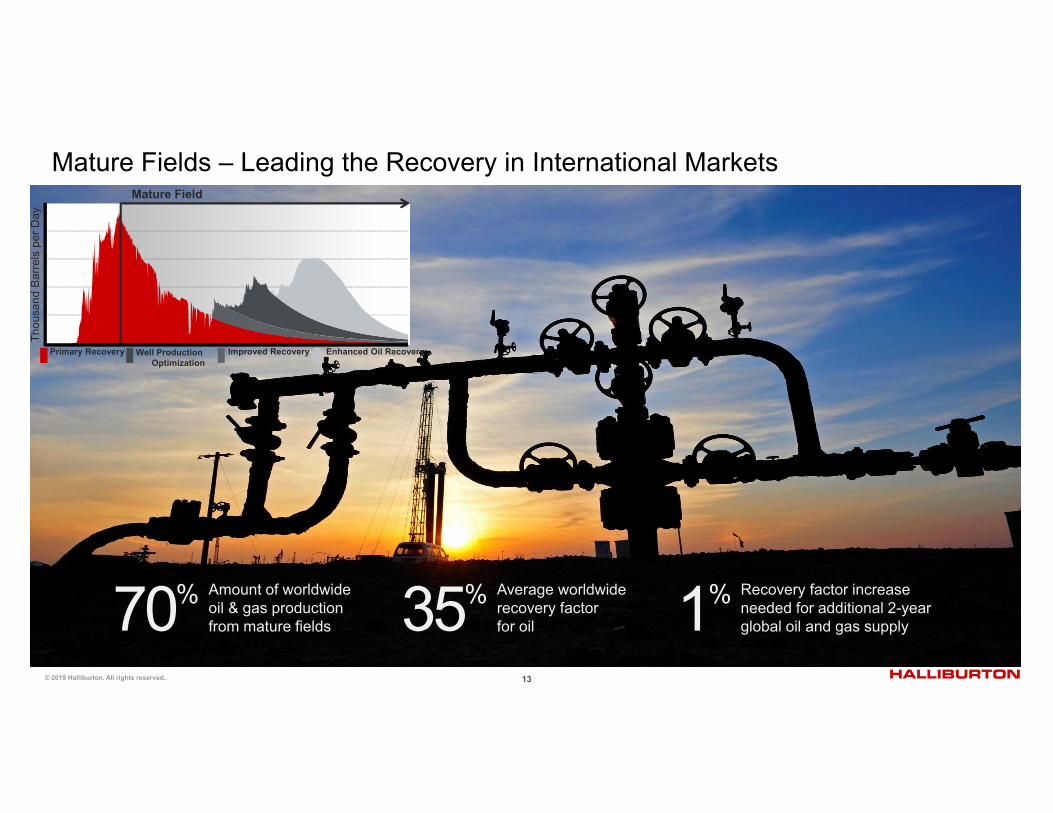
70% Amount of worldwideoil & gas productionfrom mature fields 1% Recovery factor increase
needed for additional 2-year global oil and gas supply35% Average worldwide
recovery factor for oil
Mature Fields – Leading the Recovery in International Markets
Primary Recovery Well Production Optimization
Improved Recovery Enhanced Oil Recovery
Thou
sand
Bar
rels
per
Day
Mature Field
14© 2019 Halliburton. All rights reserved.
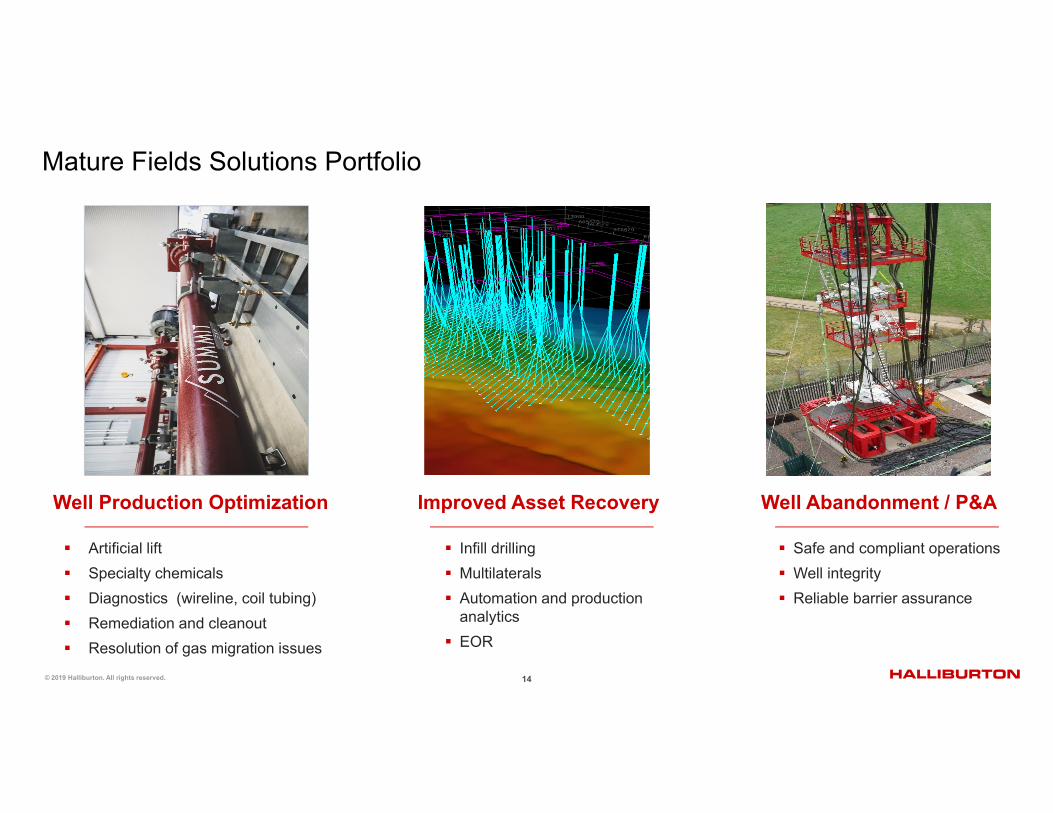
Well Production Optimization Improved Asset Recovery Well Abandonment / P&A
Mature Fields Solutions Portfolio
Artificial lift Specialty chemicals Diagnostics (wireline, coil tubing) Remediation and cleanout Resolution of gas migration issues
Infill drilling Multilaterals Automation and production
analytics EOR
Safe and compliant operations Well integrity Reliable barrier assurance
15© 2019 Halliburton. All rights reserved.
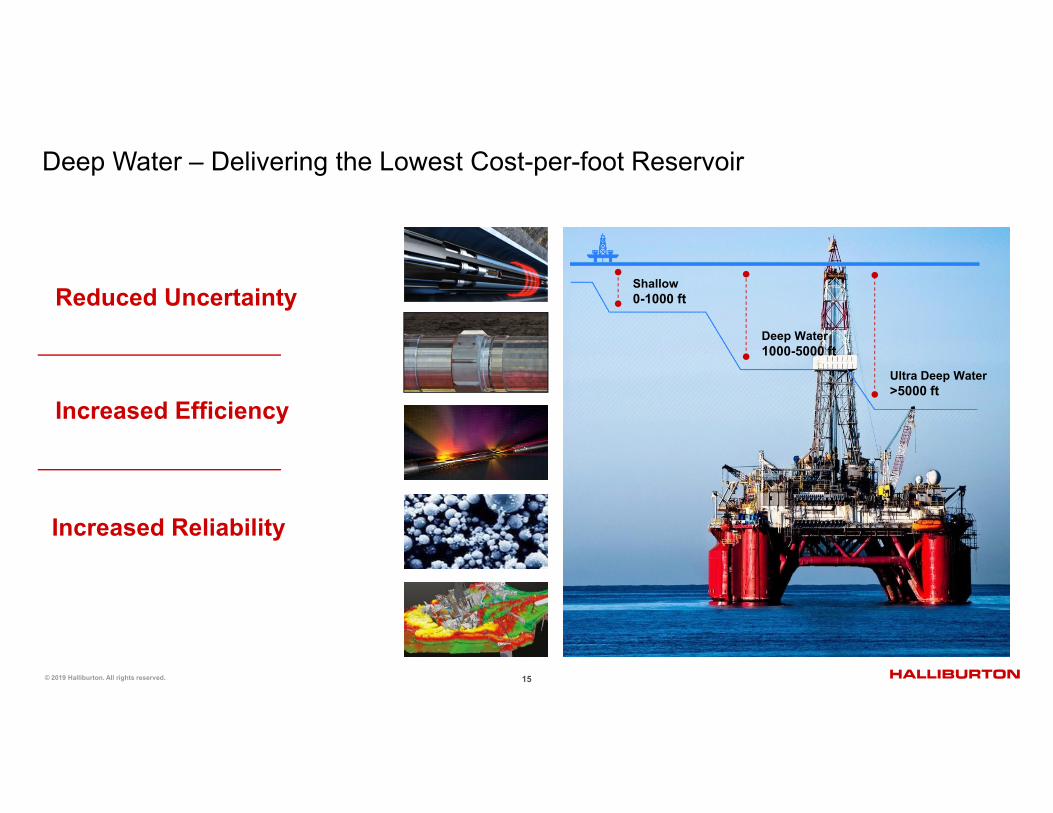
Deep Water – Delivering the Lowest Cost-per-foot Reservoir
Reduced Uncertainty
Increased Reliability
Increased Efficiency
Shallow0-1000 ft
Deep Water1000-5000 ft
Ultra Deep Water>5000 ft
16© 2019 Halliburton. All rights reserved.
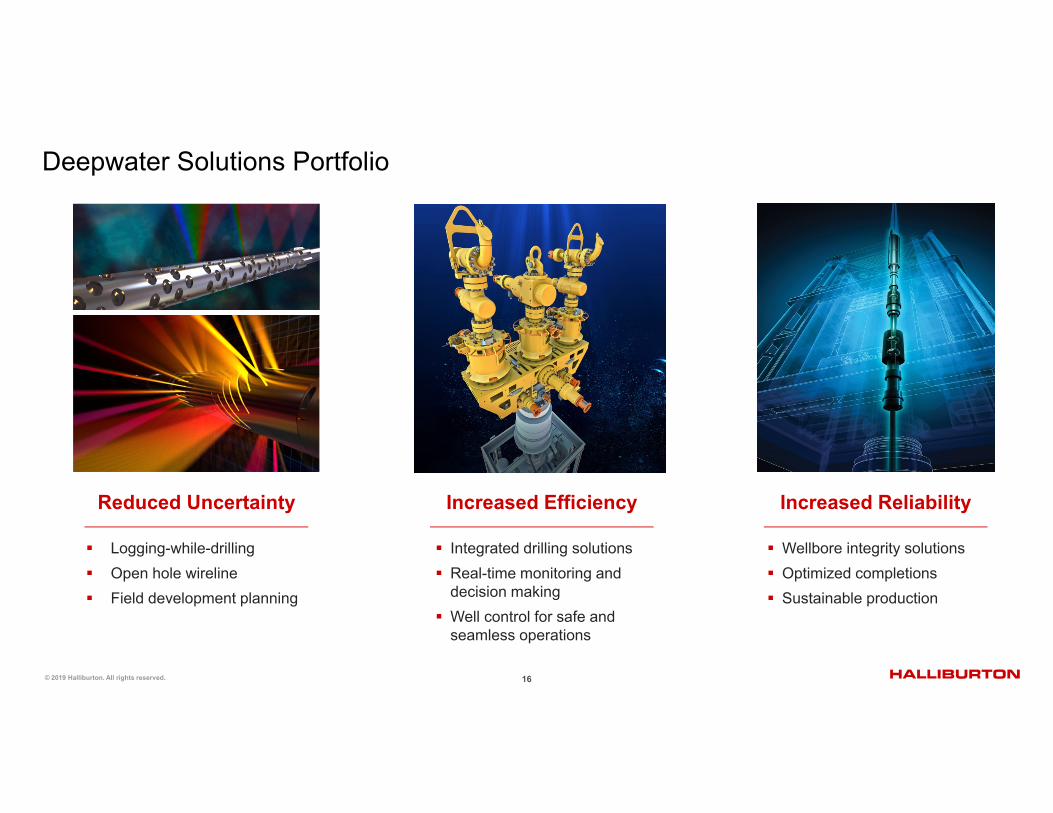
Reduced Uncertainty Increased Efficiency Increased Reliability
Deepwater Solutions Portfolio
Logging-while-drilling Open hole wireline Field development planning
Integrated drilling solutions Real-time monitoring and
decision making Well control for safe and
seamless operations
Wellbore integrity solutions Optimized completions Sustainable production
17© 2019 Halliburton. All rights reserved.
57%
10%
13%
20%
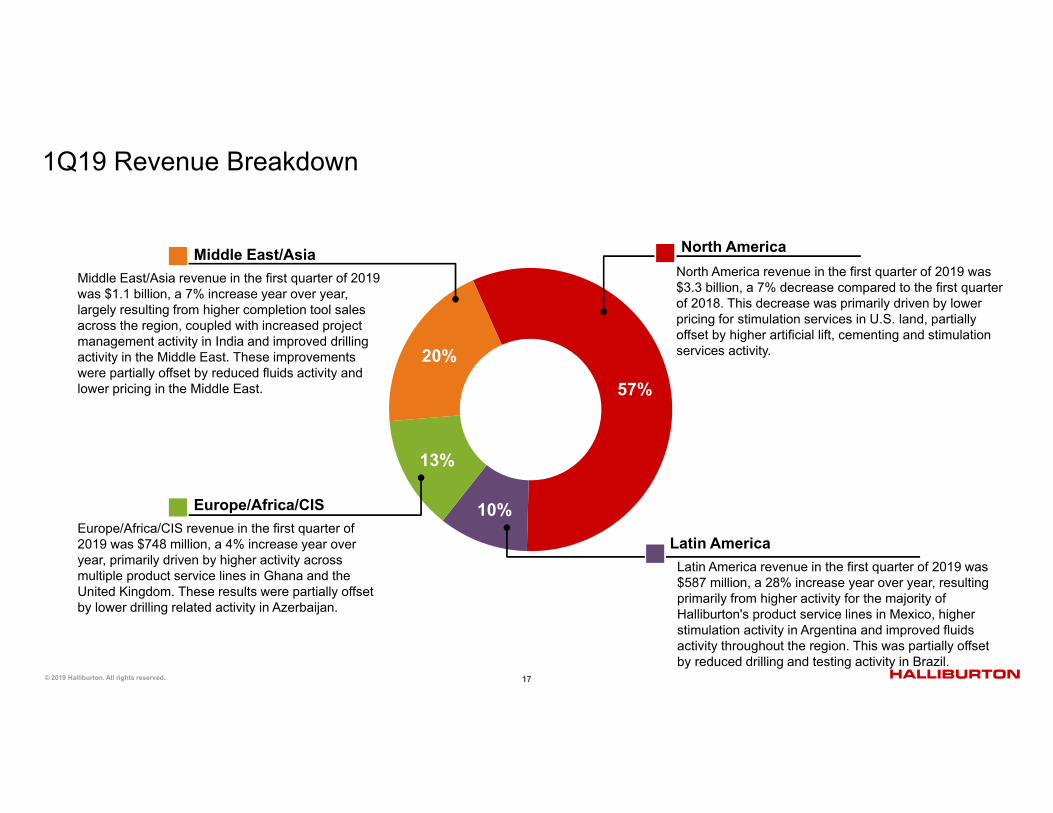
1Q19 Revenue Breakdown
Middle East/AsiaMiddle East/Asia revenue in the first quarter of 2019 was $1.1 billion, a 7% increase year over year, largely resulting from higher completion tool sales across the region, coupled with increased project management activity in India and improved drilling activity in the Middle East. These improvements were partially offset by reduced fluids activity and lower pricing in the Middle East.
Europe/Africa/CISEurope/Africa/CIS revenue in the first quarter of 2019 was $748 million, a 4% increase year over year, primarily driven by higher activity across multiple product service lines in Ghana and the United Kingdom. These results were partially offset by lower drilling related activity in Azerbaijan.
North AmericaNorth America revenue in the first quarter of 2019 was $3.3 billion, a 7% decrease compared to the first quarter of 2018. This decrease was primarily driven by lower pricing for stimulation services in U.S. land, partially offset by higher artificial lift, cementing and stimulation services activity.
Latin AmericaLatin America revenue in the first quarter of 2019 was $587 million, a 28% increase year over year, resulting primarily from higher activity for the majority of Halliburton's product service lines in Mexico, higher stimulation activity in Argentina and improved fluids activity throughout the region. This was partially offset by reduced drilling and testing activity in Brazil.
18© 2019 Halliburton. All rights reserved.
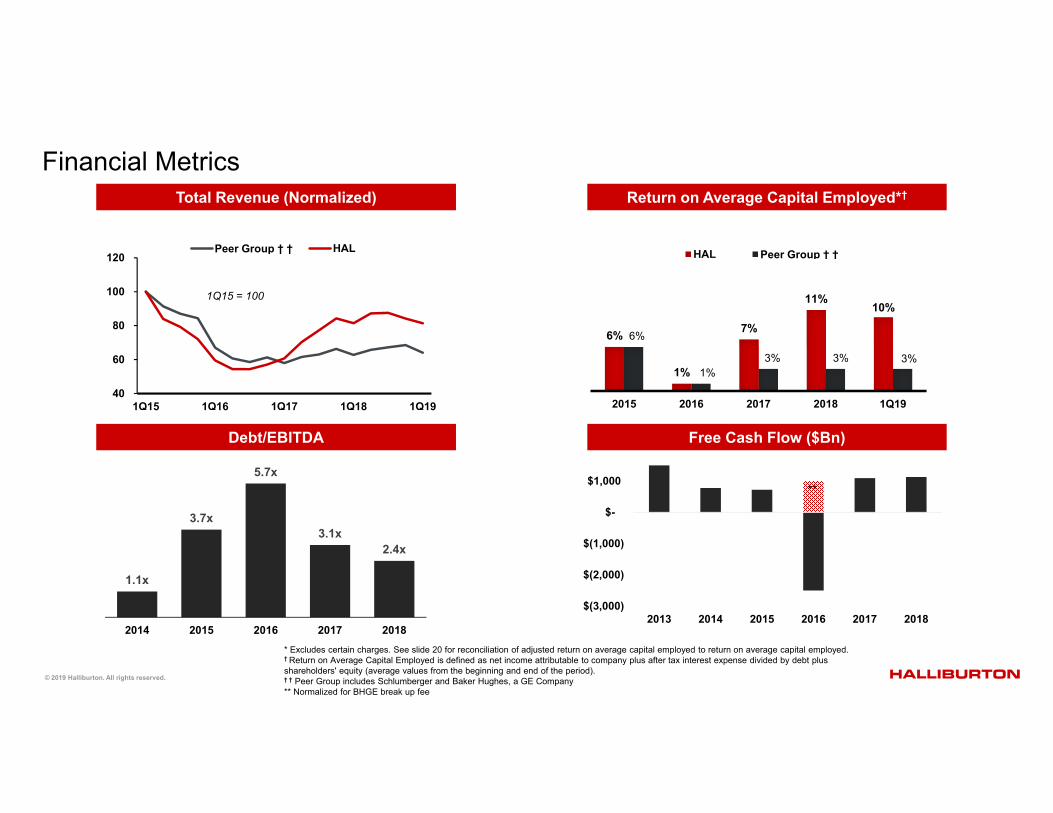
* Excludes certain charges. See slide 20 for reconciliation of adjusted return on average capital employed to return on average capital employed.† Return on Average Capital Employed is defined as net income attributable to company plus after tax interest expense divided by debt plus shareholders' equity (average values from the beginning and end of the period).† † Peer Group includes Schlumberger and Baker Hughes, a GE Company** Normalized for BHGE break up fee
Financial MetricsTotal Revenue (Normalized) Return on Average Capital Employed*†
1Q15 = 100
40
60
80
100
120
1Q15 1Q16 1Q17 1Q18 1Q19
Peer Group † † HAL
6%
1%
7%
11%10%
6%
1%3% 3% 3%
2015 2016 2017 2018 1Q19
HAL Peer Group † †
Debt/EBITDA Free Cash Flow ($Bn)
1.1x
3.7x
5.7x
3.1x2.4x
2014 2015 2016 2017 20182013 2014 2015 2016 2017 2018
$(3,000)
$(2,000)
$(1,000)
$-
$1,000**
19© 2019 Halliburton. All rights reserved.
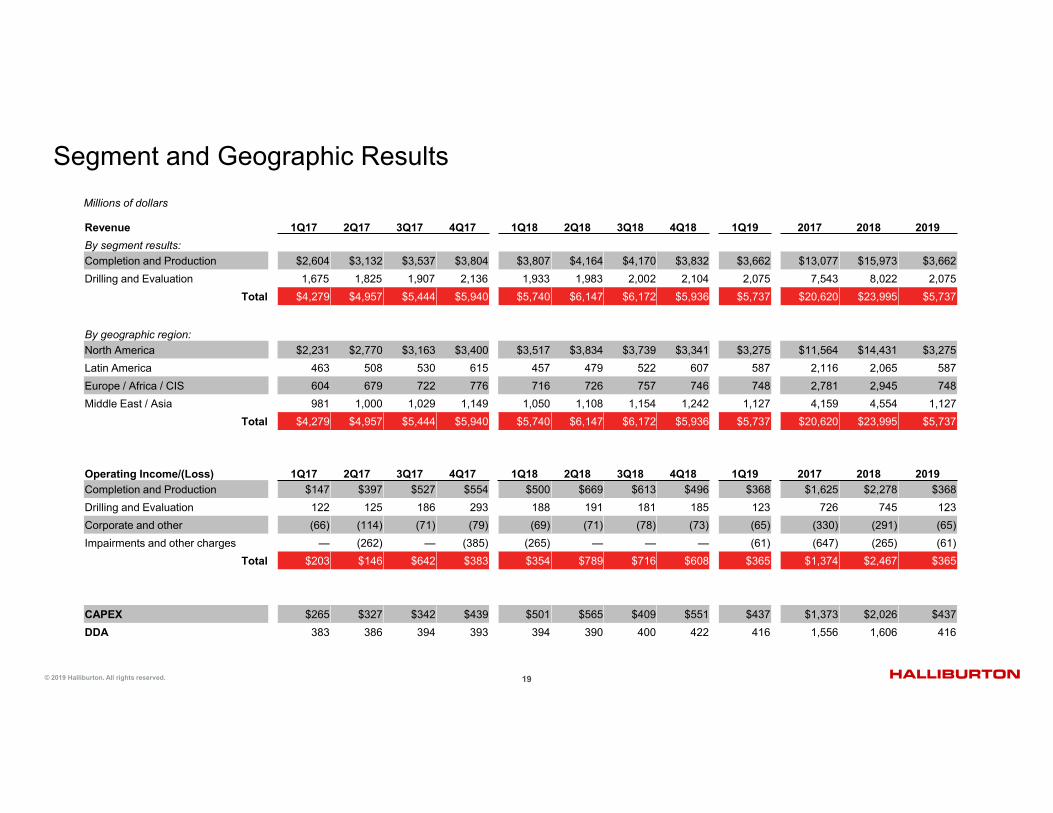
Segment and Geographic Results
Revenue 1Q17 2Q17 3Q17 4Q17 1Q18 2Q18 3Q18 4Q18 1Q19 2017 2018 2019By segment results:Completion and Production $2,604 $3,132 $3,537 $3,804 $3,807 $4,164 $4,170 $3,832 $3,662 $13,077 $15,973 $3,662 Drilling and Evaluation 1,675 1,825 1,907 2,136 1,933 1,983 2,002 2,104 2,075 7,543 8,022 2,075
Total $4,279 $4,957 $5,444 $5,940 $5,740 $6,147 $6,172 $5,936 $5,737 $20,620 $23,995 $5,737
By geographic region:North America $2,231 $2,770 $3,163 $3,400 $3,517 $3,834 $3,739 $3,341 $3,275 $11,564 $14,431 $3,275 Latin America 463 508 530 615 457 479 522 607 587 2,116 2,065 587 Europe / Africa / CIS 604 679 722 776 716 726 757 746 748 2,781 2,945 748 Middle East / Asia 981 1,000 1,029 1,149 1,050 1,108 1,154 1,242 1,127 4,159 4,554 1,127
Total $4,279 $4,957 $5,444 $5,940 $5,740 $6,147 $6,172 $5,936 $5,737 $20,620 $23,995 $5,737
Operating Income/(Loss) 1Q17 2Q17 3Q17 4Q17 1Q18 2Q18 3Q18 4Q18 1Q19 2017 2018 2019Completion and Production $147 $397 $527 $554 $500 $669 $613 $496 $368 $1,625 $2,278 $368 Drilling and Evaluation 122 125 186 293 188 191 181 185 123 726 745 123 Corporate and other (66) (114) (71) (79) (69) (71) (78) (73) (65) (330) (291) (65)Impairments and other charges — (262) — (385) (265) — — — (61) (647) (265) (61)
Total $203 $146 $642 $383 $354 $789 $716 $608 $365 $1,374 $2,467 $365
CAPEX $265 $327 $342 $439 $501 $565 $409 $551 $437 $1,373 $2,026 $437 DDA 383 386 394 393 394 390 400 422 416 1,556 1,606 416
Millions of dollars
20© 2019 Halliburton. All rights reserved.
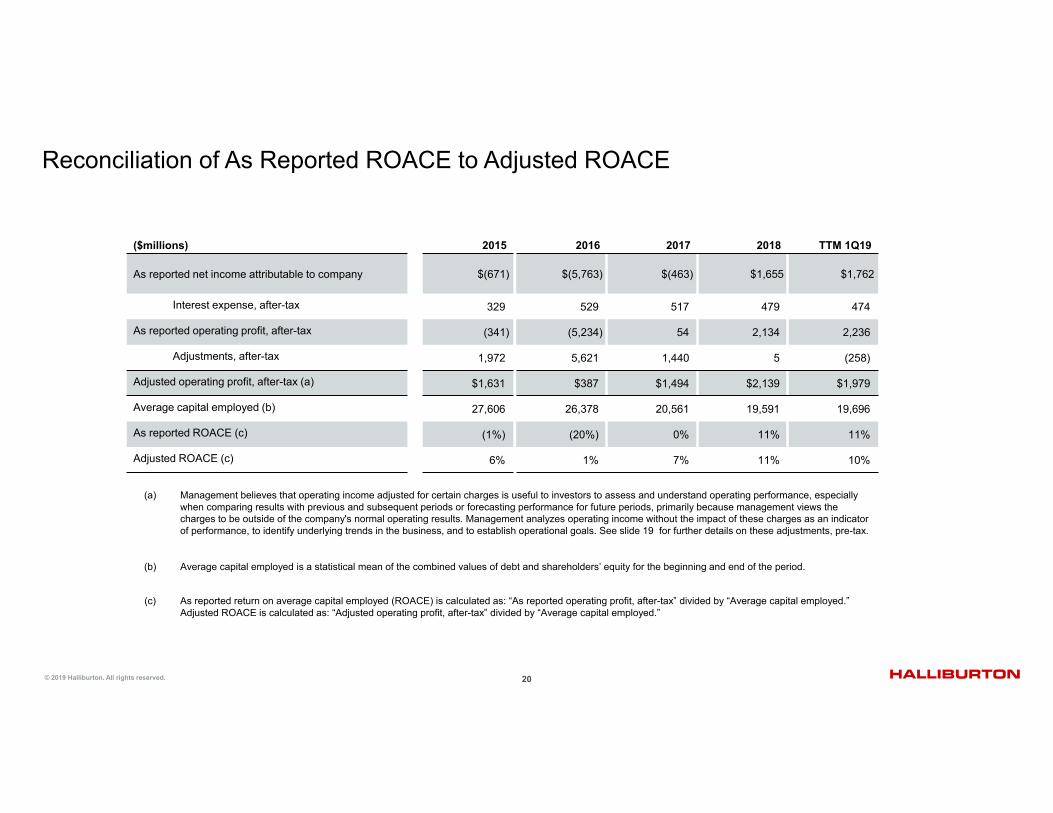
($millions) 2015 2016 2017 2018 TTM 1Q19
As reported net income attributable to company $(671) $(5,763) $(463) $1,655 $1,762
Interest expense, after-tax 329 529 517 479 474
As reported operating profit, after-tax (341) (5,234) 54 2,134 2,236
Adjustments, after-tax 1,972 5,621 1,440 5 (258)
Adjusted operating profit, after-tax (a) $1,631 $387 $1,494 $2,139 $1,979
Average capital employed (b) 27,606 26,378 20,561 19,591 19,696
As reported ROACE (c) (1%) (20%) 0% 11% 11%
Adjusted ROACE (c) 6% 1% 7% 11% 10%
(a) Management believes that operating income adjusted for certain charges is useful to investors to assess and understand operating performance, especially when comparing results with previous and subsequent periods or forecasting performance for future periods, primarily because management views the charges to be outside of the company's normal operating results. Management analyzes operating income without the impact of these charges as an indicator of performance, to identify underlying trends in the business, and to establish operational goals. See slide 19 for further details on these adjustments, pre-tax.
(b) Average capital employed is a statistical mean of the combined values of debt and shareholders’ equity for the beginning and end of the period.
(c) As reported return on average capital employed (ROACE) is calculated as: “As reported operating profit, after-tax” divided by “Average capital employed.” Adjusted ROACE is calculated as: “Adjusted operating profit, after-tax” divided by “Average capital employed.”
Reconciliation of As Reported ROACE to Adjusted ROACE
21© 2019 Halliburton. All rights reserved.
Why Invest in Halliburton?
Globally diversified oilfield services company with 14 different product service lines
Leading position in North America and a strong international franchise
Collaborating and engineering differentiated solutions to maximize asset value for our customers
Delivering strong cash flow and industry-leading returns