Embed Size (px)
Citation preview

First Quarter 2021 ResultsMay 4, 2021
2
Safe Harbor Disclosure
The statements contained herein that are not historical facts are forward-looking statements including, but not limited to statements about: (1) projections of revenues, expenses, income or loss, earnings or loss per share, cash flow, orother financial items; (2) statements of our plans and objectives, including those related to releases of products or services and restructuring activities; (3) statements of future financial or operating performance, including the impact oftax items thereon; and (4) statements of assumptions underlying such statements. Activision Blizzard, Inc. generally uses words such as “outlook,” “forecast,” “will,” “could,” “should,” “would,” “to be,” “plan,” “aims,” “believes,” “may,”“might,” “expects,” “intends,” “seeks,” “anticipates,” “estimate,” “future,” “positioned,” “potential,” “project,” “remain,” “scheduled,” “set to,” “subject to,” “upcoming,” and other similar words and expressions to help identify forward-looking statements. Forward-looking statements are subject to business and economic risks, reflect management’s current expectations, estimates, and projections about our business, and are inherently uncertain and difficult to predict.
We caution that a number of important factors, many of which are beyond our control, could cause our actual future results and other future circumstances to differ materially from those expressed in any forward-looking statements.Such factors include, but are not limited to: the ongoing global impact of a novel strain of coronavirus which emerged in December 2019 (“COVID-19”) (including, without limitation, the potential for significant short- and long-term globalunemployment and economic weakness and a resulting impact on global discretionary spending; potential strain on the retailers and distributors who sell our physical product to customers; effects on our ability to release our content ina timely manner; the impact of large-scale intervention by the Federal Reserve and other central banks around the world, including the impact on interest rates; and volatility in foreign exchange rates); our ability to consistently deliverpopular, high-quality titles in a timely manner, which has been made more difficult as a result of the COVID-19 pandemic; concentration of revenue among a small number of franchises; our ability to satisfy the expectations of consumerswith respect to our brands, games, services, and/or business practices; our ability to attract, retain and motivate skilled personnel; rapid changes in technology and industry standards; competition, including from other forms ofentertainment; increasing importance of revenues derived from digital distribution channels; risks associated with the retail sales business model; the continued growth in the scope and complexity of our business, including the diversionof management time and attention to issues relating to the operations of our newly acquired or started businesses and the potential impact of our expansion into new businesses on our existing businesses; substantial influence of third-party platform providers over our products and costs; risks associated with transitions to next-generation consoles; success and availability of video game consoles manufactured by third parties; risks associated with the free-to-playbusiness model, including dependence on a relatively small number of consumers for a significant portion of revenues and profits from any given game; our ability to realize the expected financial and operational benefits of, andeffectively implement and manage, our previously-announced restructuring actions; our ability to quickly adjust our cost structure in response to sudden changes in demand; risks and costs associated with legal proceedings; intellectualproperty claims; changes in tax rates or exposure to additional tax liabilities, as well as the outcome of current or future tax disputes; our ability to sell products at assumed pricing levels; reliance on external developers for developmentof some of our software products; the amount of our debt and the limitations imposed by the covenants in the agreements governing our debt; the seasonality in the sale of our products; counterparty risks relating to customers,licensees, licensors, and manufacturers, which have been magnified as a result of the COVID-19 pandemic; risks associated with our use of open source software; piracy and unauthorized copying of our products; insolvency or businessfailure of any of our partners, which has been magnified as a result of the COVID-19 pandemic; risks and uncertainties of conducting business outside the United States; increasing regulation of our business, products, and distribution inkey territories; compliance with continually evolving laws and regulations concerning data privacy; reliance on servers and networks to operate our games and our proprietary online gaming service; potential data breaches and othercybersecurity risks; and the other factors identified in “Risk Factors” included in Part I, Item 1A of our Annual Report on Form 10-K for the year ended December 31, 2020.
The forward-looking statements contained herein are based on information available to Activision Blizzard, Inc. as of the date of this filing and we assume no obligation to update any such forward-looking statements. Although theseforward-looking statements are believed to be true when made, they may ultimately prove to be incorrect. These statements are not guarantees of our future performance and are subject to risks, uncertainties, and other factors, someof which are beyond our control and may cause actual results to differ materially from current expectations.
Please review our SEC filings on Form 10-K and Form 10-Q
3
As a supplement to our financial measures presented in accordance with U.S. Generally Accepted Accounting Principles (“GAAP”), Activision Blizzard presents certain non-GAAP measures of financial performance.These non-GAAP financial measures are not intended to be considered in isolation from, as a substitute for, or as more important than, the financial information prepared and presented in accordance with GAAP. Inaddition, these non-GAAP measures have limitations in that they do not reflect all of the items associated with the company’s results of operations as determined in accordance with GAAP.
Activision Blizzard provides net income (loss), earnings (loss) per share and operating margin data and guidance both including (in accordance with GAAP) and excluding (non-GAAP) certain items. When relevant, thecompany also provides constant FX information to provide a framework for assessing how our underlying businesses performed excluding the effect of foreign currency rate fluctuations. In addition, Activision Blizzardprovides EBITDA (defined as GAAP net income (loss) before interest (income) expense, income taxes, depreciation and amortization) and adjusted EBITDA (defined as non-GAAP operating margin (see non-GAAPfinancial measure below) before depreciation). The non-GAAP financial measures exclude the following items, as applicable in any given reporting period and our outlook:
expenses related to share-based compensation; the amortization of intangibles from purchase price accounting; fees and other expenses related to acquisitions, including related debt financings, and refinancing of long-term debt, including penalties and the write off of unamortized discount and deferred financing costs; restructuring and related charges; other non-cash charges from reclassification of certain cumulative translation adjustments into earnings as required by GAAP; the income tax adjustments associated with any of the above items (tax impact on non-GAAP pre-tax income is calculated under the same accounting principles applied to the GAAP pre-tax income under ASC
740, which employs an annual effective tax rate method to the results); and significant discrete tax-related items, including amounts related to changes in tax laws, amounts related to the potential or final resolution of tax positions, and other unusual or unique tax-related items and
activities.
In the future, Activision Blizzard may also consider whether other items should also be excluded in calculating the non-GAAP financial measures used by the company. Management believes that the presentation ofthese non-GAAP financial measures provides investors with additional useful information to measure Activision Blizzard’s financial and operating performance. In particular, the measures facilitate comparison ofoperating performance between periods and help investors to better understand the operating results of Activision Blizzard by excluding certain items that may not be indicative of the company’s core business,operating results or future outlook. Additionally, we consider quantitative and qualitative factors in assessing whether to adjust for the impact of items that may be significant or that could affect an understanding ofour ongoing financial and business performance or trends. Internally, management uses these non-GAAP financial measures, along with others, in assessing the company’s operating results, and measuringcompliance with the requirements of the company’s debt financing agreements, as well as in planning and forecasting.
Activision Blizzard’s non-GAAP financial measures are not based on a comprehensive set of accounting rules or principles, and the terms non-GAAP net income, non-GAAP earnings per share, non-GAAP operatingmargin, and non-GAAP or adjusted EBITDA do not have a standardized meaning. Therefore, other companies may use the same or similarly named measures, but exclude different items, which may not provideinvestors a comparable view of Activision Blizzard’s performance in relation to other companies.
Management compensates for the limitations resulting from the exclusion of these items by considering the impact of the items separately and by considering Activision Blizzard’s GAAP, as well as non-GAAP, resultsand outlook, and by presenting the most comparable GAAP measures directly ahead of non-GAAP measures, and by providing a reconciliation that indicates and describes the adjustments made.
Use of Non-GAAP Measures
41 Prior outlook provided February 4, 2021.
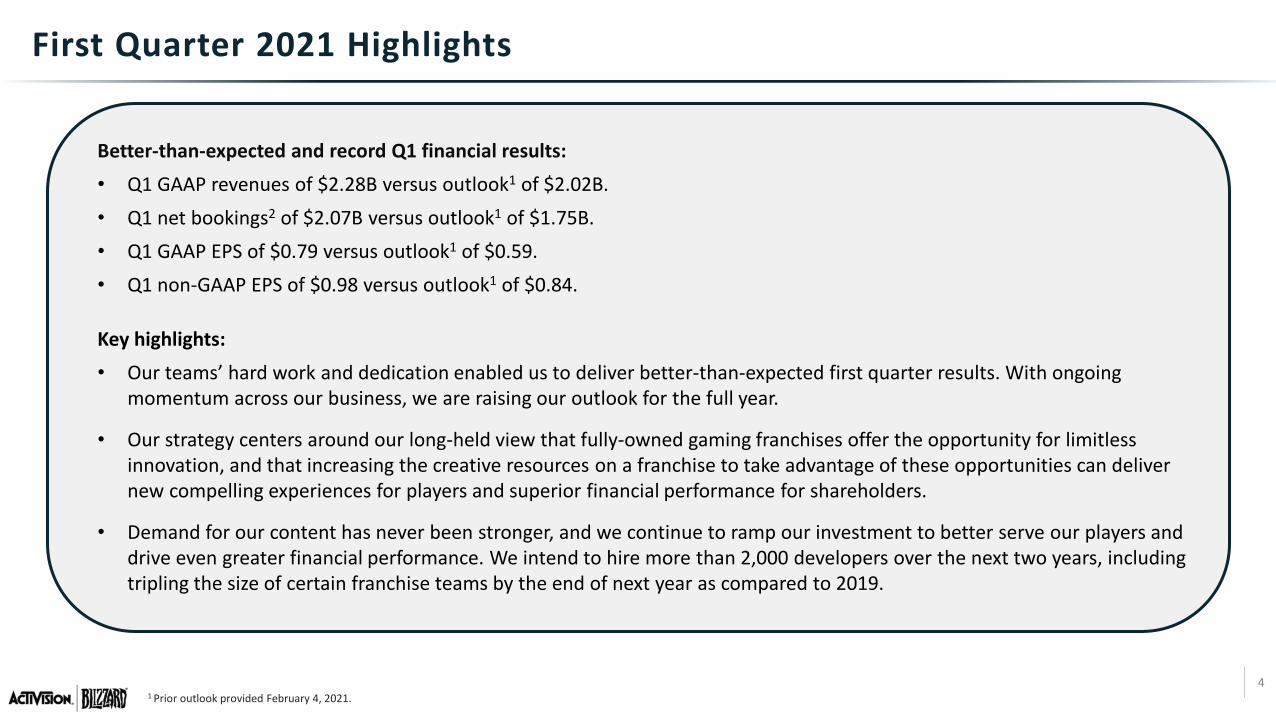
First Quarter 2021 Highlights
Better-than-expected and record Q1 financial results:• Q1 GAAP revenues of $2.28B versus outlook1 of $2.02B.• Q1 net bookings2 of $2.07B versus outlook1 of $1.75B.• Q1 GAAP EPS of $0.79 versus outlook1 of $0.59.• Q1 non-GAAP EPS of $0.98 versus outlook1 of $0.84.
Key highlights:• Our teams’ hard work and dedication enabled us to deliver better-than-expected first quarter results. With ongoing
momentum across our business, we are raising our outlook for the full year.
• Our strategy centers around our long-held view that fully-owned gaming franchises offer the opportunity for limitless innovation, and that increasing the creative resources on a franchise to take advantage of these opportunities can deliver new compelling experiences for players and superior financial performance for shareholders.
• Demand for our content has never been stronger, and we continue to ramp our investment to better serve our players and drive even greater financial performance. We intend to hire more than 2,000 developers over the next two years, including tripling the size of certain franchise teams by the end of next year as compared to 2019.
5
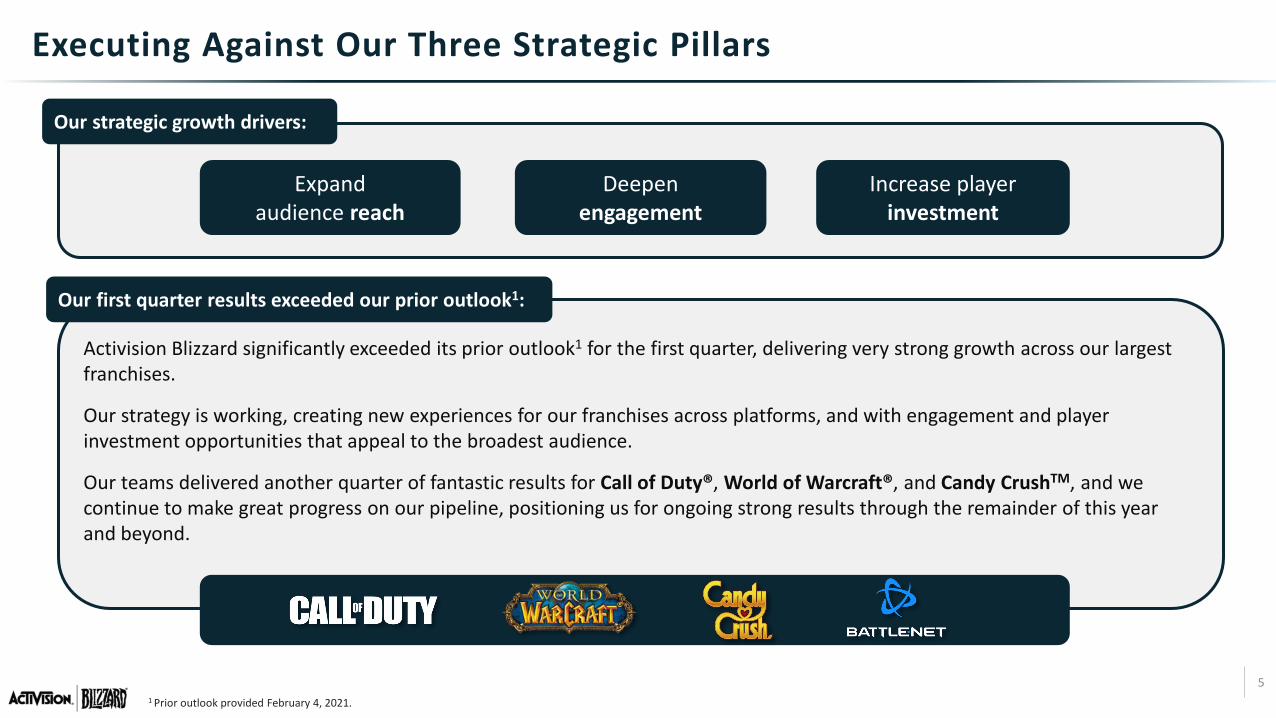
Activision Blizzard significantly exceeded its prior outlook1 for the first quarter, delivering very strong growth across our largest franchises.
Our strategy is working, creating new experiences for our franchises across platforms, and with engagement and player investment opportunities that appeal to the broadest audience.
Our teams delivered another quarter of fantastic results for Call of Duty®, World of Warcraft®, and Candy CrushTM, and we continue to make great progress on our pipeline, positioning us for ongoing strong results through the remainder of this yearand beyond.
Expand audience reach
Deepen engagement
Increase player investment
Our strategic growth drivers:
Our first quarter results exceeded our prior outlook1:
1 Prior outlook provided February 4, 2021.
Executing Against Our Three Strategic Pillars
6
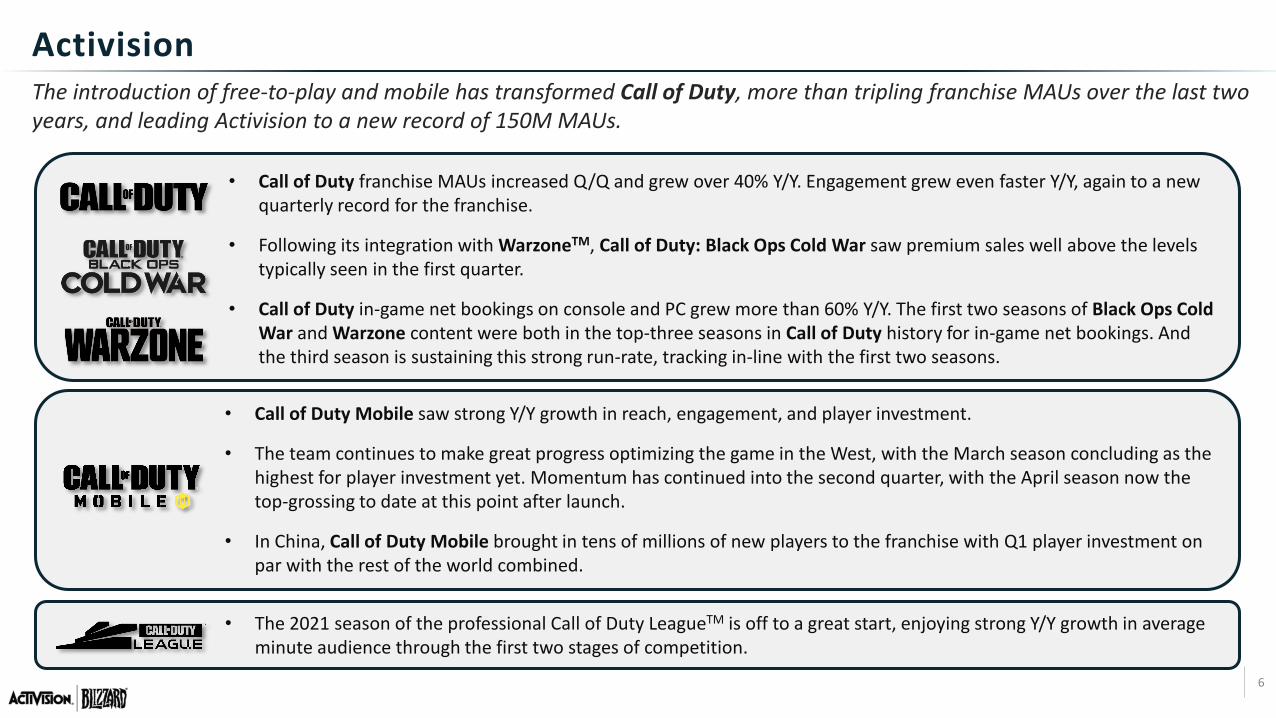
The introduction of free-to-play and mobile has transformed Call of Duty, more than tripling franchise MAUs over the last two years, and leading Activision to a new record of 150M MAUs.
• Call of Duty franchise MAUs increased Q/Q and grew over 40% Y/Y. Engagement grew even faster Y/Y, again to a new quarterly record for the franchise.
• Following its integration with WarzoneTM, Call of Duty: Black Ops Cold War saw premium sales well above the levels typically seen in the first quarter.
• Call of Duty in-game net bookings on console and PC grew more than 60% Y/Y. The first two seasons of Black Ops Cold War and Warzone content were both in the top-three seasons in Call of Duty history for in-game net bookings. And the third season is sustaining this strong run-rate, tracking in-line with the first two seasons.
• The 2021 season of the professional Call of Duty LeagueTM is off to a great start, enjoying strong Y/Y growth in average minute audience through the first two stages of competition.
• Call of Duty Mobile saw strong Y/Y growth in reach, engagement, and player investment.
• The team continues to make great progress optimizing the game in the West, with the March season concluding as the highest for player investment yet. Momentum has continued into the second quarter, with the April season now the top-grossing to date at this point after launch.
• In China, Call of Duty Mobile brought in tens of millions of new players to the franchise with Q1 player investment on par with the rest of the world combined.
Activision
7
Blizzard
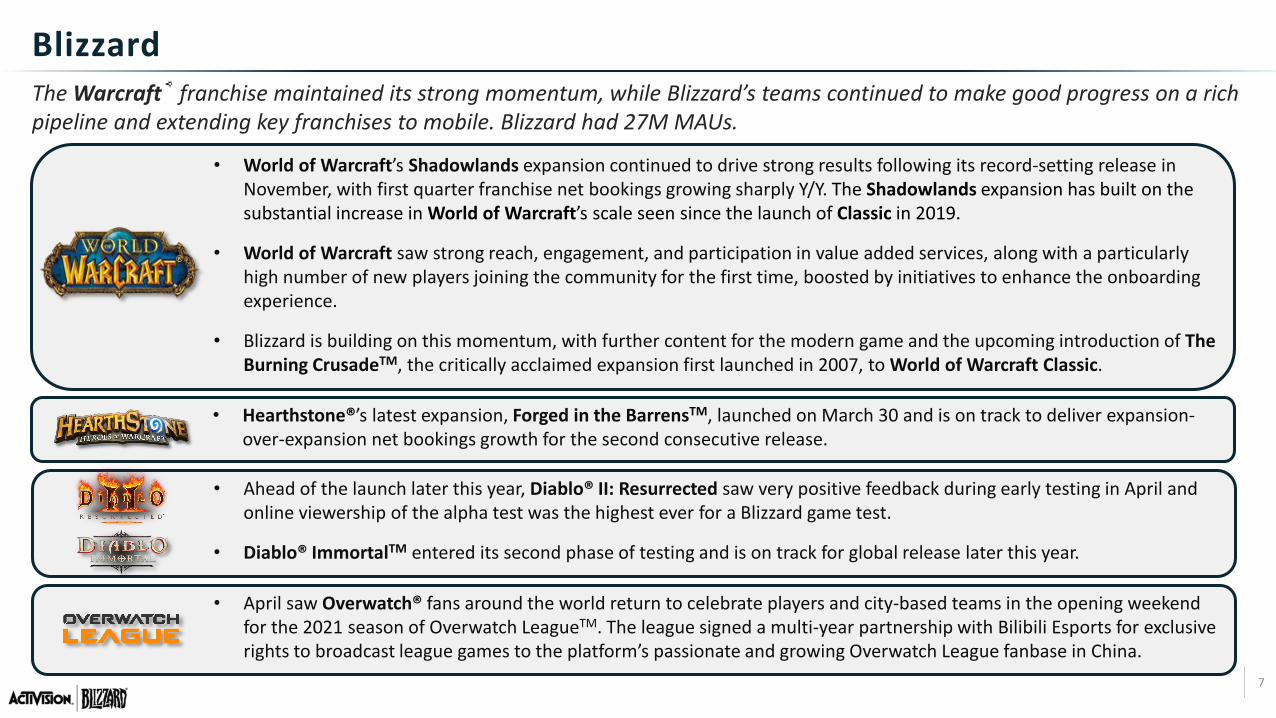
• World of Warcraft’s Shadowlands expansion continued to drive strong results following its record-setting release in November, with first quarter franchise net bookings growing sharply Y/Y. The Shadowlands expansion has built on the substantial increase in World of Warcraft’s scale seen since the launch of Classic in 2019.
• World of Warcraft saw strong reach, engagement, and participation in value added services, along with a particularly high number of new players joining the community for the first time, boosted by initiatives to enhance the onboarding experience.
• Blizzard is building on this momentum, with further content for the modern game and the upcoming introduction of The Burning CrusadeTM, the critically acclaimed expansion first launched in 2007, to World of Warcraft Classic.
• April saw Overwatch® fans around the world return to celebrate players and city-based teams in the opening weekend for the 2021 season of Overwatch LeagueTM. The league signed a multi-year partnership with Bilibili Esports for exclusive rights to broadcast league games to the platform’s passionate and growing Overwatch League fanbase in China.
• Ahead of the launch later this year, Diablo® II: Resurrected saw very positive feedback during early testing in April and online viewership of the alpha test was the highest ever for a Blizzard game test.
• Diablo® ImmortalTM entered its second phase of testing and is on track for global release later this year.
The Warcraft® franchise maintained its strong momentum, while Blizzard’s teams continued to make good progress on a rich pipeline and extending key franchises to mobile. Blizzard had 27M MAUs.
• Hearthstone®’s latest expansion, Forged in the BarrensTM, launched on March 30 and is on track to deliver expansion-over-expansion net bookings growth for the second consecutive release.
8
KingThe first quarter saw King continue to benefit from successful growth initiatives across the business. King had 258M MAUs, exhibiting better seasonality than typically seen following the fourth quarter, led by Candy Crush.
• King’s initiatives to broaden the payer base, deliver more frequent content and introduce compelling features into Candy Crush and other portfolio titles drove in-game net bookings growth in the high-teens percentage Y/Y, accelerating further relative to Q4.
• In-game net bookings have remained strong into the second quarter, continuing to grow well Y/Y in April.
• King delivered 70% Y/Y growth in advertising, with significant increase across both direct brand advertisers and partner networks.
1 Based on App Annie Intelligence.
• Candy Crush grew in-game net bookings very strongly Y/Y and was once again the top grossing franchise in the U.S. app stores1.
• In-game net bookings for Farm HeroesTM, King’s second-largest franchise, also grew sharply Y/Y.
• Crash Bandicoot: On The Run!TM launched on March 25 and has seen over 30M downloads to-date.
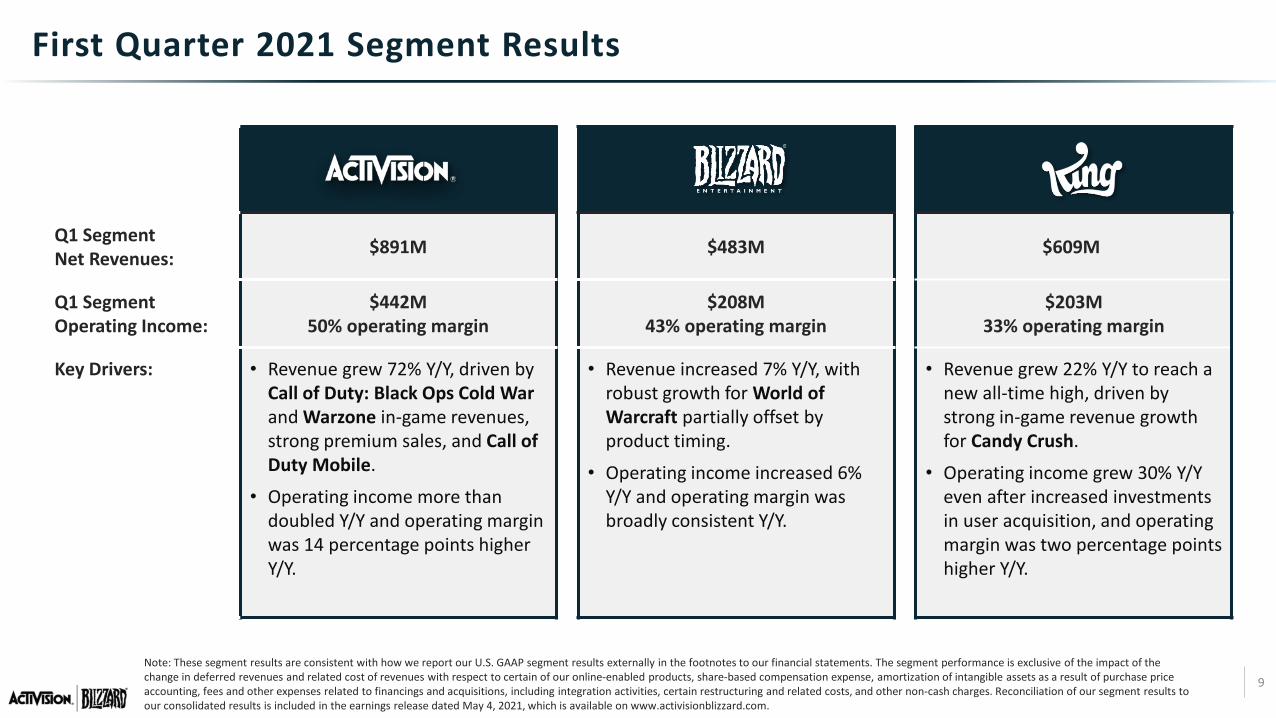
9Note: These segment results are consistent with how we report our U.S. GAAP segment results externally in the footnotes to our financial statements. The segment performance is exclusive of the impact of the change in deferred revenues and related cost of revenues with respect to certain of our online-enabled products, share-based compensation expense, amortization of intangible assets as a result of purchase price accounting, fees and other expenses related to financings and acquisitions, including integration activities, certain restructuring and related costs, and other non-cash charges. Reconciliation of our segment results to our consolidated results is included in the earnings release dated May 4, 2021, which is available on www.activisionblizzard.com.
Q1 Segment Net Revenues: $891M $483M $609M
Q1 Segment Operating Income:
$442M 50% operating margin
$208M 43% operating margin
$203M 33% operating margin
Key Drivers: • Revenue grew 72% Y/Y, driven by Call of Duty: Black Ops Cold Warand Warzone in-game revenues, strong premium sales, and Call of Duty Mobile.
• Operating income more than doubled Y/Y and operating margin was 14 percentage points higher Y/Y.
• Revenue increased 7% Y/Y, with robust growth for World of Warcraft partially offset by product timing.
• Operating income increased 6% Y/Y and operating margin was broadly consistent Y/Y.
• Revenue grew 22% Y/Y to reach a new all-time high, driven by strong in-game revenue growth for Candy Crush.
• Operating income grew 30% Y/Y even after increased investments in user acquisition, and operating margin was two percentage points higher Y/Y.
First Quarter 2021 Segment Results
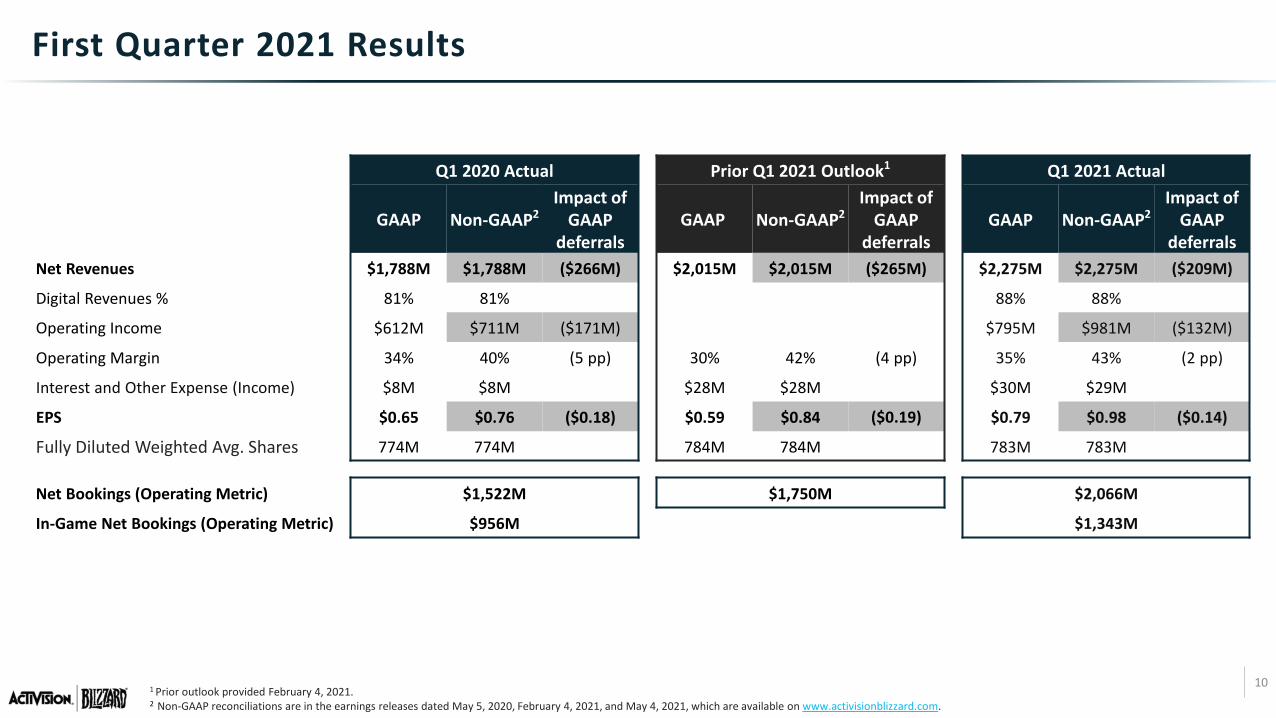
101 Prior outlook provided February 4, 2021. 2 Non-GAAP reconciliations are in the earnings releases dated May 5, 2020, February 4, 2021, and May 4, 2021, which are available on www.activisionblizzard.com.
Q1 2020 Actual Prior Q1 2021 Outlook1 Q1 2021 Actual
GAAP Non-GAAP2Impact of
GAAP deferrals
GAAP Non-GAAP2Impact of
GAAP deferrals
GAAP Non-GAAP2Impact of
GAAP deferrals
Net Revenues $1,788M $1,788M ($266M) $2,015M $2,015M ($265M) $2,275M $2,275M ($209M)
Digital Revenues % 81% 81% 88% 88%
Operating Income $612M $711M ($171M) $795M $981M ($132M)
Operating Margin 34% 40% (5 pp) 30% 42% (4 pp) 35% 43% (2 pp)
Interest and Other Expense (Income) $8M $8M $28M $28M $30M $29M
EPS $0.65 $0.76 ($0.18) $0.59 $0.84 ($0.19) $0.79 $0.98 ($0.14)
Fully Diluted Weighted Avg. Shares 774M 774M 784M 784M 783M 783M
Net Bookings (Operating Metric) $1,522M $1,750M $2,066M
In-Game Net Bookings (Operating Metric) $956M $1,343M
First Quarter 2021 Results
11
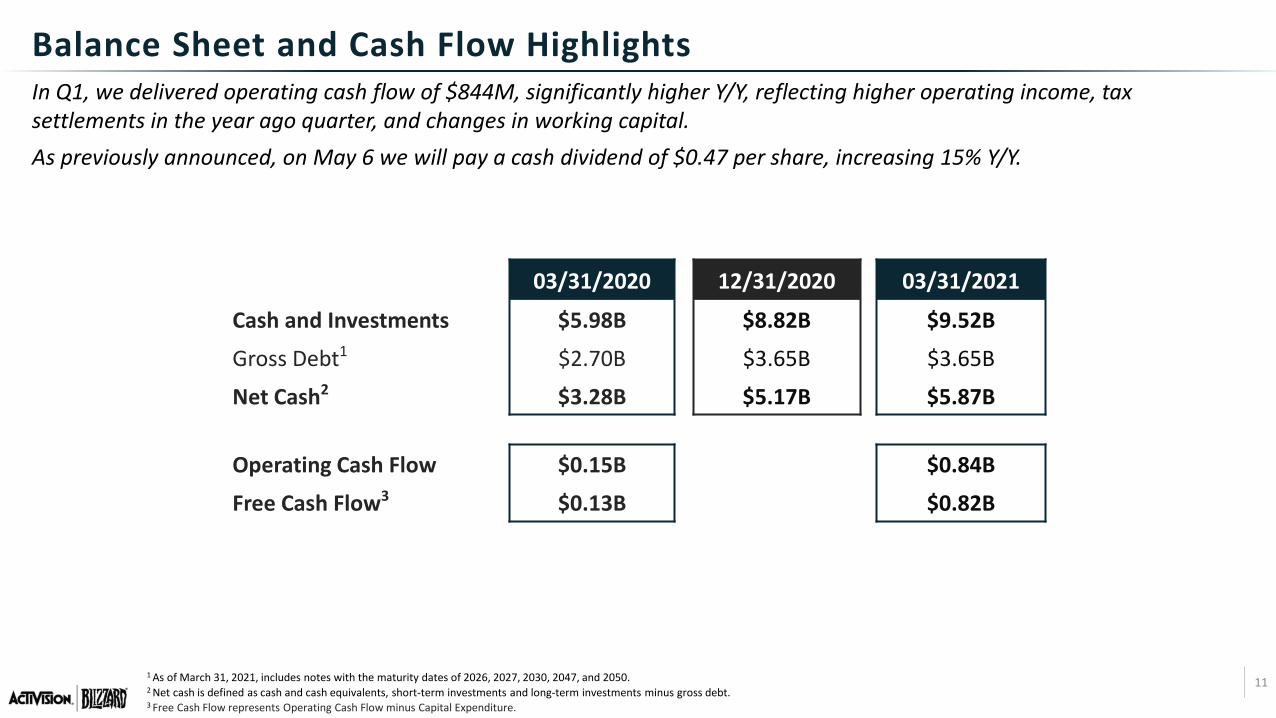
In Q1, we delivered operating cash flow of $844M, significantly higher Y/Y, reflecting higher operating income, tax settlements in the year ago quarter, and changes in working capital.As previously announced, on May 6 we will pay a cash dividend of $0.47 per share, increasing 15% Y/Y.
1 As of March 31, 2021, includes notes with the maturity dates of 2026, 2027, 2030, 2047, and 2050.2 Net cash is defined as cash and cash equivalents, short-term investments and long-term investments minus gross debt.3 Free Cash Flow represents Operating Cash Flow minus Capital Expenditure.
03/31/2020 12/31/2020 03/31/2021
Cash and Investments $5.98B $8.82B $9.52B
Gross Debt1 $2.70B $3.65B $3.65B
Net Cash2 $3.28B $5.17B $5.87B
Operating Cash Flow $0.15B $0.84B
Free Cash Flow3 $0.13B $0.82B
Balance Sheet and Cash Flow Highlights
12
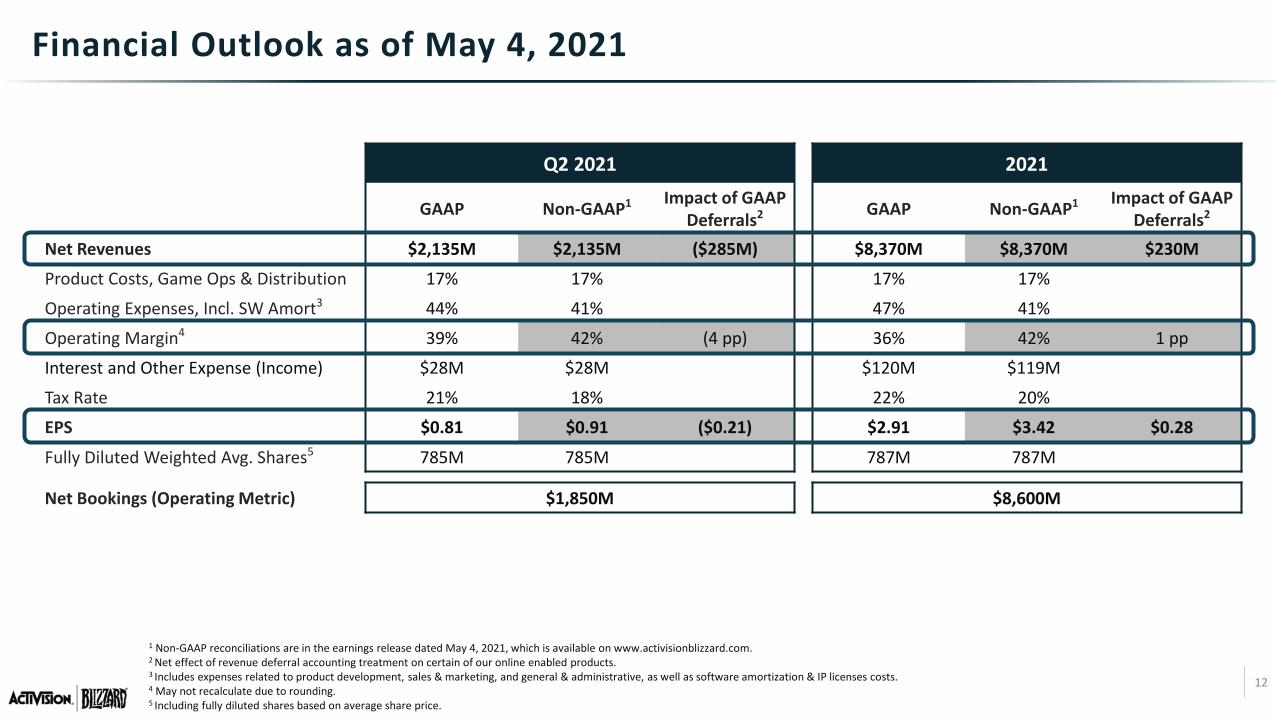
Financial Outlook as of May 4, 2021
1 Non-GAAP reconciliations are in the earnings release dated May 4, 2021, which is available on www.activisionblizzard.com. 2 Net effect of revenue deferral accounting treatment on certain of our online enabled products. 3 Includes expenses related to product development, sales & marketing, and general & administrative, as well as software amortization & IP licenses costs. 4 May not recalculate due to rounding.5 Including fully diluted shares based on average share price.
Q2 2021 2021
GAAP Non-GAAP1 Impact of GAAP Deferrals2 GAAP Non-GAAP1 Impact of GAAP
Deferrals2
Net Revenues $2,135M $2,135M ($285M) $8,370M $8,370M $230M
Product Costs, Game Ops & Distribution 17% 17% 17% 17%
Operating Expenses, Incl. SW Amort3 44% 41% 47% 41%
Operating Margin4 39% 42% (4 pp) 36% 42% 1 pp
Interest and Other Expense (Income) $28M $28M $120M $119M
Tax Rate 21% 18% 22% 20%
EPS $0.81 $0.91 ($0.21) $2.91 $3.42 $0.28
Fully Diluted Weighted Avg. Shares5 785M 785M 787M 787M
Net Bookings (Operating Metric) $1,850M $8,600M
13
Glossary of Operating Metrics
• Monthly Active Users (“MAUs”) We monitor MAUs as a key measure of the overall size of our user base. MAUs are the number of individuals who accessed a particular game in a given month. We calculate average MAUs in a period by adding the total number of MAUs in each of the months in a given period and dividing that total by the number of months in the period. An individual who accesses two of our games would be counted as two users. In addition, due to technical limitations, for Activision and King, an individual who accesses the same game on two platforms or devices in the relevant period would be counted as two users. For Blizzard, an individual who accesses the same game on two platforms or devices in the relevant period would generally be counted as a single user. In certain instances, we rely on third parties to publish our games. In these instances, MAU data is based on information provided to us by those third parties, or, if final data is not available, reasonable estimates of MAUs for these third-party published games.
• Net bookings is an operating metric that is defined as the net amount of products and services sold digitally or sold-in physically in the period, and includes license fees, merchandise, and publisher incentives, among others, and is equal to net revenues excluding the impact from deferrals.
• In-game net bookings primarily includes the net amount of downloadable content and microtransactions sold during the period, and is equal to in-game net revenues excluding the impact from deferrals.
Q&A SessionMay 4, 2021
![Presentazione standard di PowerPoint08.07.2019]Corpor… · Activision Blizzard products V-Valley Iberian S.L.U. IT & CE Distributor (Spain) Vinzeo Technologies S.A.U. Celly Pacific](https://img.pdfslide.us/doc/110x75/5f04ba2e7e708231d40f6782/presentazione-standard-di-powerpoint-08072019corpor-activision-blizzard-products.jpg)