Embed Size (px)
Citation preview
ACTIVISION BLIZZARD, INC.
FORM 8-K(Current report filing)
Filed 08/03/17 for the Period Ending 08/03/17
Address 3100 OCEAN PARK BLVD
SANTA MONICA, CA 90405Telephone 3102552000
CIK 0000718877Symbol ATVI
SIC Code 7372 - Prepackaged SoftwareIndustry Internet Services
Sector TechnologyFiscal Year 12/31
http://www.edgar-online.com© Copyright 2017, EDGAR Online, Inc. All Rights Reserved.
Distribution and use of this document restricted under EDGAR Online, Inc. Terms of Use.

UNITED STATES
SECURITIES AND EXCHANGE COMMISSIONWASHINGTON, DC 20549
FORM 8-K
CURRENT REPORTPURSUANT TO SECTION 13 OR 15(d) OF THE
SECURITIES EXCHANGE ACT OF 1934
Dateofreport(Dateofearliesteventreported):August3,2017
ACTIVISIONBLIZZARD,INC.(ExactNameofRegistrantasSpecifiedinCharter)
Delaware
001-15839
95-4803544(StateorOtherJurisdictionof
Incorporation)
(CommissionFileNumber)
(IRSEmployerIdentificationNo.)
3100OceanParkBoulevard,
SantaMonica,CA
90405(AddressofPrincipalExecutive
Offices)
(ZipCode)
Registrant’stelephonenumber,includingareacode:(310)255-2000
(FormerNameorFormerAddress,ifChangedSinceLastReport)
ChecktheappropriateboxbelowiftheForm8-Kfilingisintendedtosimultaneouslysatisfythefilingobligationoftheregistrantunderanyofthefollowingprovisions(see GeneralInstructionA.2.below):¨WrittencommunicationspursuanttoRule425undertheSecuritiesAct(17CFR230.425)
¨SolicitingmaterialpursuanttoRule14a-12undertheExchangeAct(17CFR240.14a-12)
¨Pre-commencementcommunicationspursuanttoRule14d-2(b)undertheExchangeAct(17CFR240.14d-2(b))
¨Pre-commencementcommunicationspursuanttoRule13e-4(c)undertheExchangeAct(17CFR240.13e-4(c))IndicatebycheckmarkwhethertheregistrantisanemerginggrowthcompanyasdefinedinRule405oftheSecuritiesActof1933(§230.405ofthischapter)orRule12b-2oftheSecuritiesExchangeActof1934(§240.12b-2ofthischapter).EmerginggrowthcompanyoIfanemerginggrowthcompany,indicatebycheckmarkiftheregistranthaselectednottousetheextendedtransitionperiodforcomplyingwithanyneworrevisedfinancialaccountingstandardsprovidedpursuanttoSection13(a)oftheExchangeAct.o
Certain Information Not Filed . The information in Item 2.02 of this Form 8-K and Exhibit 99.1 attached to this Form 8-K shall not bedeemed “filed” for purposes of Section 18 of the Securities Exchange Act of 1934, nor shall such Item 2.02 or such Exhibit 99.1 or any of theinformation contained therein be deemed incorporated by reference in any filing under the Securities Exchange Act of 1934 or the SecuritiesAct of 1933, except as shall be expressly set forth by specific reference in such filing.Item 2.02. Results of Operations and Financial Condition.OnAugust3,2017,ActivisionBlizzard,Inc.(the“Company”)issuedapressreleaseannouncingresultsfortheCompanyforthefiscalquarterendedJune30,2017.AcopyofthepressreleaseisattachedheretoasExhibit99.1.Aspreviouslyannounced,theCompanyishostingaconferencecallandwebcastinconjunctionwiththatrelease.Item 9.01. Financial Statements and Exhibits.(d)Exhibits
99.1PressReleasedatedAugust3,2017(furnishednotfiled)
2

SIGNATURE
PursuanttotherequirementsoftheSecuritiesExchangeActof1934,theregistranthasdulycausedthisreporttobesignedonits
behalfbytheundersignedhereuntodulyauthorized.Date:August3,2017 ACTIVISIONBLIZZARD,INC.
By: /s/SpencerNeumann
SpencerNeumann
ChiefFinancialOfficer
3

EXHIBIT INDEX
ExhibitNo.
Description 99.1
PressReleasedatedAugust3,2017(furnishednotfiled)
4
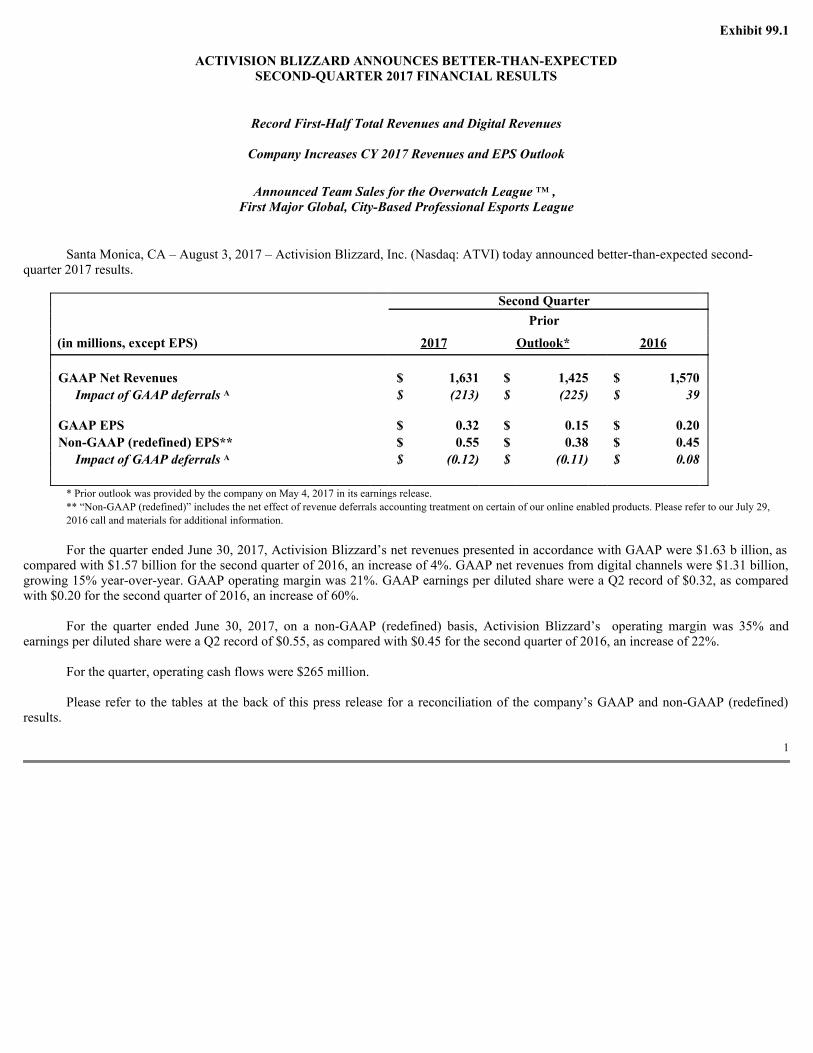
Exhibit 99.1
ACTIVISION BLIZZARD ANNOUNCES BETTER-THAN-EXPECTEDSECOND-QUARTER 2017 FINANCIAL RESULTS
Record First-Half Total Revenues and Digital Revenues
Company Increases CY 2017 Revenues and EPS Outlook
Announced Team Sales for the Overwatch League ™, First Major Global, City-Based Professional Esports League
SantaMonica,CA–August3,2017–ActivisionBlizzard,Inc.(Nasdaq:ATVI)todayannouncedbetter-than-expectedsecond-quarter2017results.
Second Quarter
Prior
(in millions, except EPS)
2017
Outlook*
2016
GAAP Net Revenues
$ 1,631
$ 1,425
$ 1,570
Impact of GAAP deferrals
$ (213)
$ (225)
$ 39
GAAP EPS
$ 0.32
$ 0.15
$ 0.20
Non-GAAP (redefined) EPS**
$ 0.55
$ 0.38
$ 0.45
Impact of GAAP deferrals
$ (0.12)
$ (0.11)
$ 0.08
*PrioroutlookwasprovidedbythecompanyonMay4,2017initsearningsrelease.**“Non-GAAP(redefined)”includestheneteffectofrevenuedeferralsaccountingtreatmentoncertainofouronlineenabledproducts.PleaserefertoourJuly29,2016callandmaterialsforadditionalinformation.
ForthequarterendedJune30,2017,ActivisionBlizzard’snetrevenuespresentedinaccordancewithGAAPwere$1.63billion,as
comparedwith$1.57billionforthesecondquarterof2016,anincreaseof4%.GAAPnetrevenuesfromdigitalchannelswere$1.31billion,growing15%year-over-year.GAAPoperatingmarginwas21%.GAAPearningsperdilutedsharewereaQ2recordof$0.32,ascomparedwith$0.20forthesecondquarterof2016,anincreaseof60%.
For the quarter ended June 30, 2017, on a non-GAAP (redefined) basis, Activision Blizzard’s operating margin was 35% andearningsperdilutedsharewereaQ2recordof$0.55,ascomparedwith$0.45forthesecondquarterof2016,anincreaseof22%.
Forthequarter,operatingcashflowswere$265million.
Pleaserefer to thetables at thebackof this press releasefor a reconciliationof thecompany’sGAAPandnon-GAAP(redefined)results.
1
A
A
Activision Blizzard Announces Q2 2017 Financial Results
BobbyKotick, Chief Executive Officer of ActivisionBlizzard, said,“This was another strongquarter for Activision Blizzard. Weexceededouroutlookanddeliveredrecordrevenuesforthefirsthalfof2017.”
Kotickadded,“Celebratingplayersandaudiencesisthefoundationforoursuccess.Thisquarterweannouncedthefirstteamownersin the Overwatch League™, the first major global, city-based professional esports league. With hundreds of hours of broadcast contentaheadofus,aswellassignificantsponsorshipandmediaopportunities,theOverwatchLeaguewillprovidenewwaysforustohighlightandsupportthepassionofesportsfansandtheskillofsomeoftheworld’stopOverwatch players.”Selected Business Highlights:·Regularcontentandfeatureupdatesacrosstheportfolioenableddeeperplayerengagementandthereforeplayerinvestment.Audience Reach·ActivisionBlizzardhad407millionMonthlyActiveUsers(MAUs) inthequarter.·Blizzardhadthebiggestquarterlyonlineplayercommunityinitshistorywitharecord46millionMAUs ,up38%year-over-year.The
Overwatch communitycontinuedtogrowmorethanayearafterlaunch,settinganotherall-timeMAU recordwiththereleaseoftwoseasonaleventsinthequarter.Hearthstone MAUs grewyear-over-yearandquarter-over-quartertoanall-timerecord,drivenbyitsexpansion,Journey to Un’Goro ™ .
·Activisionhad47millionMAUs inthesecondquarter,downslightlyyear-over-year.ThelaunchofZombies Chronicles ledtoaMAU
increasequarter-over-quarterinCall of Duty : Black Ops III .ActivisionalsoreleasedCrash Bandicoot ™ N. Sane Trilogy forPS4,acollectionofremasteredCrash Bandicoot ™ classictitles.Despiteonlytwodaysofsalesonasingleplatform,itwasthenumberoneconsoletitlegloballyinJunebasedonunits.
·ActivisionanditspartnersatBungieexpecttoreleaseDestiny 2 onSeptember6,2017forconsolesandonOctober24,2017forPC.The
Destiny 2 consoleBetahadmoretotalplayersthanthe2014Destiny Beta,andDestiny 2 pre-ordersarenowabovethefirstDestiny .ActivisionexpectstoreleaseCall of Duty: WWII onNovember3,2017.Momentumonpre-ordersandhands-onfeedbackhavebeenstrong.
·Kinghad314millionMAUs forthequarter,downyear-over-year,butwithbettergrossbookings perpayinguser.Kinghadtwoof
thetop-10highest-grossingtitlesintheU.S.mobileappstoresforthefifteenthquarterinarow.
2
®
B
B
B
® B
B
B ®
1
B C
2
Activision Blizzard Announces Q2 2017 Financial ResultsDeep Engagement·BlizzardhadQ2-recordtimespent.InApril,BlizzardlaunchedUprising ,anOverwatch seasonaleventthatincludedaplayer-versus-
environmentmodethatdrewrecordplaytime.Overwatch ’sAnniversary eventinMayandJunealsodrovestrongengagementwithrecordparticipationincustomizationitems.TimespentinWorld of Warcraft grewyear-over-yearinthesecondquarter,andtheLegion ™ expansioncontinuedtoperformaheadofthepriorexpansion.
·King’sliveoperationsandnewcontentcontinuetodrivestrongengagementwithsteadytimespentat35minutesperdayandplayers
engagingmorefrequently.·BlizzardannouncedthefirstseventeamsalesfortheOverwatch League ,thefirstmajorglobalprofessionalesportsleaguewithcity-
basedteams,andtheleagueissettobeginitsinauguralcompetitiveseasonlaterthisyear.·Blizzardannouncedalive-streamingmediarightspartnershipforesportsandin-gamecontentacrossanumberoffranchises,but
excludingOverwatch League content.·Activision’sCall of Duty World League willculminateinitsChampionshipsheldinOrlandoinAugust.Player Investment·ActivisionBlizzarddeliverednearly$1billionofin-gamerevenuesinthequarterwithrecordperformanceinthefirsthalfof2017.·King’sgrossbookings perpayingusergrewforthe8 quarterinarowtoanewrecord.Strongengagementandplayerinvestmentled
toanincreaseinmobilegrossbookings year-over-yearandquarter-over-quarter.·Call of Duty: Black Ops III ’sZombies Chronicles, Activision’sfirstlargecontentdropinyeartwoafteragamelaunch,notonlydrove
purchasesofthatspecificpieceofcontent,butalsoledtohigherengagementandtoadd-onrevenuesforthatgame.·Blizzard’sOverwatch ,Hearthstone ,World of Warcraft ,andDiablo III ,whichdebutednewcontentduringthequarter,drove
strongin-gameparticipation.
3
®
C th
C
®
Activision Blizzard Announces Q2 2017 Financial ResultsCompany Outlook:
(in millions, except EPS)
GAAP Outlook
Non-GAAP Outlook (redefined)
Impact of GAAP deferrals
CY 2017
Net Revenues
$ 6,400
6,400
175
EPS
$ 1.05
1.94
0.06
Fully Diluted Shares*
767
767
Q3 2017
Net Revenues
$ 1,385
1,385
315
EPS
$ 0.09
0.34
0.11
Fully Diluted Shares*
766
766
*Fullydilutedweightedaveragesharesincludeparticipatingsecuritiesanddilutiveoptionsonaweightedaveragebasis.AsreferencedonourJuly29,2016call,ifyouwouldliketocalculateNon-GAAPmetricsaspreviouslydefined,youwouldaddtheimpactofGAAPdeferralstotheNon-GAAP(redefined)metrics.CurrencyAssumptionsfor2017Outlook:
·$1.12USD/Euroforcurrentoutlook(vs.averageof$1.11for2016and$1.11for2015);and·$1.30USD/BritishPoundSterlingforcurrentoutlook(vs.averageof$1.36for2016and$1.53for2015).·Note:OurfinancialguidanceincludestheforecastedimpactoftheFXcashflowhedgingprogram.
Cash Dividend:
Thecompanypaidacashdividendof$0.30percommonshare,up15%year-over-year,inMay2017toshareholdersofrecordatthecloseofbusinessonMarch30,2017,totaling$226million.Conference Call:
Todayat4:30p.m.EDT,ActivisionBlizzard’smanagementwillhostaconferencecallandWebcasttodiscussthecompany’sresultsforthequarterendedJune30,2017andmanagement’soutlookfortheremainderofthecalendaryear.Thecompanywelcomesallmembersofthefinancialandmediacommunitiesandotherinterestedpartiestovisitthe“InvestorRelations”areaofwww.activisionblizzard.comtolistentotheconferencecallvialiveWebcastortolistentothecalllivebydialinginto888-364-3108intheU.S.withpasscode1183538.About Activision Blizzard:ActivisionBlizzard,Inc.,amemberoftheS&P500,istheworld’smostsuccessfulstandaloneinteractiveentertainmentcompany.WedelighthundredsofmillionsofmonthlyactiveusersaroundtheworldthroughfranchisesincludingActivision’sCallofDuty ,DestinyandSkylanders ,Blizzard’sWorldofWarcraft ,Overwatch ,Hearthstone ,Diablo ,StarCraft ,andHeroesoftheStorm ,andKing’sCandyCrush™,PetRescue™,BubbleWitch™andFarmHeroes™.ThecompanyisoneoftheFortune“100BestCompaniesToWorkFor ”.HeadquarteredinSantaMonica,California,ActivisionBlizzardhasoperationsthroughouttheworld,anditsgamesareplayedin196countries.MoreinformationaboutActivisionBlizzardanditsproductsandservicescanbefoundonthecompany’swebsite,www.activisionblizzard.com.PerNPD,GfK,GSD,andinternalestimatesU.S.rankingforAppleAppStoreandGooglePlayStorecombined,perAppAnnieIntelligenceforsecondquarter2017.
4
A
® ® ®
® ® ® ® ®
®
1
2
Activision Blizzard Announces Q2 2017 Financial ResultsNeteffectofaccountingtreatmentfromrevenuedeferralsoncertainofouronlineenabledproducts.Someofourgames’onlinefunctionalityrepresentsanessentialcomponent
ofgameplayand,asaresult,amore-than-inconsequentialseparatedeliverable.Asaresult,werecognizerevenuesattributedtothesegametitlesovertheirestimatedserviceperiods,whichisgenerallylessthanayear.Therelatedcostofrevenuesisdeferredandrecognizedasanexpenseastherelatedrevenuesarerecognized.Impactfromchangesindeferralsreferstotheneteffectfromrevenuedeferralsaccountingtreatmentforthepurposesofrevenues,alongwith,forthepurposesofEPS,therelatedcostofrevenuesdeferralstreatmentandtherelatedtaximpacts.Internally,managementexcludestheimpactofthischangeindeferredrevenuesandrelatedcostofrevenueswhenevaluatingthecompany’soperatingperformance,whenplanning,forecastingandanalyzingfutureperiods,andwhenassessingtheperformanceofitsmanagementteam.Managementbelievesthisisappropriatebecausedoingsoenablesananalysisofperformancebasedonthetimingofactualtransactionswithourcustomers.Inaddition,managementbelievesexcludingthechangeindeferredrevenuesandtherelatedcostofrevenuesprovidesamuchmoretimelyindicationoftrendsinouroperatingresults.MonthlyActiveUser(“MAU”)Definition: Wemonitor MAUsasa keymeasureof theoverall size of our user base. MAUsarethe number of individuals whoplayeda
particulargameinagivenmonth.WecalculateaverageMAUsinaperiodbyaddingthetotalnumberofMAUsineachofthemonthsinagivenperiodanddividingthattotalbythenumberofmonthsintheperiod.Anindividualwhoplaystwoofourgameswouldbecountedastwousers.Inaddition,duetotechnicallimitations,forActivisionandKing,anindividualwhoplaysthesamegameontwoplatformsordevicesintherelevantperiodwouldbecountedastwousers.ForBlizzard,anindividualwhoplaysthesamegameontwoplatformsordevicesintherelevantperiodwouldgenerallybecountedasasingleuser.Grossbookingsisanoperatingmetricthatrepresentsthetotalcashspentbyplayersintheperiodforthepurchaseofvirtualitems.Kingusesgrossbookingstoevaluateits
resultsofoperations,generatefutureoperatingplansandassessperformance.Grossbookingsisthetotalpricepaidbyplayers,whichincludesindirecttaxes(salestaxorvalueaddedtaxetc.),platformprovidersfees,andKing’sshareofrevenues.Non-GAAP (as previously defined) and Non-GAAP (redefined) Financial Measures: InaccordancewiththeupdatedComplianceandDisclosureInterpretationsissuedbytheSECstaffonMay17,2016,beginningwiththereportingofoursecond-quarter2016results,wehavereportedourfinancialresultsandprovidedouroutlookusingGAAPandnon-GAAP(redefined).WehavehistoricallyprovidedNon-GAAP(aspreviouslydefined)financialmeasures.Theonlydifferencebetweenthetwomeasuresistheinclusion(Non-GAAP(redefined))orexclusion(Non-GAAP(aspreviouslydefined))oftheimpactfromrevenuedeferralsaccountingtreatmentoncertainofouronlineenabledproducts.PleaseseematerialsfromJuly29,2016callforfurtherdetails.Non-GAAP Financial Measures: Asasupplement toourfinancial measurespresentedinaccordancewithGenerallyAcceptedAccountingPrinciples (“GAAP”), ActivisionBlizzardpresentscertainnon-GAAPmeasuresoffinancialperformance.Thesenon-GAAPfinancialmeasuresarenotintendedtobeconsideredinisolationfrom,asasubstitutefor,orasmoreimportantthan,thefinancialinformationpreparedandpresentedinaccordancewithGAAP.Inaddition,thesenon-GAAPmeasureshavelimitationsinthattheydonotreflectalloftheitemsassociatedwiththecompany’sresultsofoperationsasdeterminedinaccordancewithGAAP.ActivisionBlizzardprovidesnetincome(loss),earnings(loss)pershareandoperatingmargindataandguidancebothincluding(inaccordancewithGAAP)andexcluding(non-GAAP) certain items. When relevant, the company also provides constant FX information to provide a framework for assessing how our underlying businesses performedexcluding the effect of foreign currency rate fluctuations. In addition, Activision Blizzard provides EBITDA (defined as GAAP net income (loss) before interest (income)expense, income taxes, depreciation and amortization) and adjusted EBITDA (defined as non-GAAP operating margin (see non-GAAP financial measure below) beforedepreciation).Thenon-GAAPfinancialmeasuresexcludethefollowingitems,asapplicableinanygivenreportingperiodandouroutlook:
·expensesrelatedtostock-basedcompensation;·theamortizationofintangiblesfrompurchasepriceaccounting;
5
A
B
C
Activision Blizzard Announces Q2 2017 Financial Results
· feesandotherexpensesrelatedtotheKingacquisition,inclusiveofrelateddebtfinancings,andrefinancingoflong-termdebt,includingpenaltiesandthewriteoffofunamortizeddiscountanddeferredfinancingcosts;
·restructuringcharges;·othernon-cashchargesfromreclassificationofcertaincumulativetranslationadjustmentsintoearningsasrequiredbyGAAP;and· theincometaxadjustmentsassociatedwithanyoftheaboveitems(taximpactonnon-GAAPpre-taxincomeiscalculatedunderthesameaccounting
principlesappliedtotheGAAPpre-taxincomeunderASC740,whichemploysanannualeffectivetaxratemethodtotheresults).In the future, Activision Blizzard may also consider whether other items should also be excluded in calculating the non-GAAP financial measures used by the company.Management believes that the presentation of these non-GAAP financial measures provides investors with additional useful information to measure Activision Blizzard’sfinancial and operating performance. In particular, the measures facilitate comparison of operating performance between periods and help investors to better understand theoperatingresults of ActivisionBlizzardbyexcludingcertainitemsthat maynot beindicativeofthecompany’scorebusiness, operatingresults, or futureoutlook. Internally,managementusesthesenon-GAAPfinancialmeasures,alongwithothers,inassessingthecompany’soperatingresults,andmeasuringcompliancewiththerequirementsofthecompany’sdebtfinancingagreements,aswellasinplanningandforecasting.ActivisionBlizzard’snon-GAAPfinancialmeasuresarenotbasedonacomprehensivesetofaccountingrulesorprinciples,andthetermsnon-GAAPnetincome,non-GAAPearningspershare,non-GAAPoperatingmargin,andnon-GAAPoradjustedEBITDAdonothaveastandardizedmeaning.Therefore, othercompaniesmayusethesameorsimilarlynamedmeasures,butexcludedifferentitems,whichmaynotprovideinvestorsacomparableviewofActivisionBlizzard’sperformanceinrelationtoothercompanies.Management compensates for the limitations resulting from the exclusion of these items by considering the impact of the items separately and by considering ActivisionBlizzard’sGAAP,aswellasnon-GAAP,resultsandoutlook,andbypresentingthemostcomparableGAAPmeasuresdirectlyaheadofnon-GAAPmeasures,andbyprovidingareconciliationthatindicatesanddescribestheadjustmentsmade.Cautionary Note Regarding Forward-looking Statements: Thestatements contained herein that are not historical facts are forward-looking statements, including, but notlimitedto,statementsabout:(1)projectionsofrevenues,expenses,incomeorloss,earningsorlosspershare,cashfloworotherfinancialitems;(2)statementsofourplansandobjectives,includingthoserelatedtoreleasesofproductsandservices;(3)statementsoffuturefinancialoroperatingperformance;and(4)statementsofassumptionsunderlyingsuchstatements. The company generally uses words such as “outlook,” “forecast,” “will,” “could,” “should,” “would,” “to be,” “plan,” “plans,” “believes,” “may,” “might,”“expects,”“intends,”“intendsas,”“anticipates,”“estimate,”“future,”“positioned,”“potential,”“project,”“remain,”“scheduled,”“setto,”“subjectto,”“upcoming”andothersimilar expressions to help identify forward-looking statements. Forward-looking statements are subject to business and economic risk, reflect management’s currentexpectations,estimatesandprojectionsaboutourbusiness,andareinherentlyuncertainanddifficulttopredict.ThecompanycautionsthatanumberofimportantfactorscouldcauseActivisionBlizzard’sactualfutureresultsandotherfuturecircumstancestodiffermateriallyfromthoseexpressedin anyforward-looking statements. Suchfactors include, but are not limited to: sales levels of Activision Blizzard’s titles, products and services; concentration ofrevenueamongasmallnumberoftitles;ActivisionBlizzard’sabilitytopredictconsumerpreferences,includinginterestinspecificgenres,andpreferencesamongplatforms;thediversionofmanagementtimeandattentiontoissuesrelatingtotheoperationsofouracquiredornewlystartedbusinesses;theamountofourdebtandthelimitationsimposedbythecovenantsintheagreementsgoverningourdebt;theadoptionrateandavailabilityofnewhardware(includingperipherals)andrelatedsoftware;counterpartyrisksrelatingtocustomers,licensees,licensorsandmanufacturers;maintenanceofrelationshipswithkeypersonnel,customers,financingproviders,licensees,licensors,manufacturers,vendors,andthird-partydevelopers,includingtheabilitytoattract,retainanddevelopkeypersonnelanddevelopersthatcancreatehigh-qualitytitles,productsandservices;risksrelatingto the expansion into newbusinesses, including the potential impact on our existing businesses; changing business models within the video gameindustry, including digitaldeliveryofcontentandtheincreasedprevalenceoffree-to-playgames;productdelaysordefects;competition,includingfromotherformsofentertainment;
6
Activision Blizzard Announces Q2 2017 Financial Resultsrapidchangesintechnologyandindustrystandards;possibledeclinesinsoftwarepricing;productreturnsandpriceprotection;theidentificationofsuitablefutureacquisitionopportunitiesandpotentialchallengesassociatedwithgeographicexpansion;theseasonalandcyclicalnatureoftheinteractiveentertainmentmarket;theoutcomeofcurrentorfuture tax disputes; the impact of litigation risks and associated costs; protection of proprietary rights; shifts in consumer spending trends; capital market risks; applicableregulations;domesticandinternationaleconomic,financialandpoliticalconditionsandpolicies;taxratesandforeignexchangerates;theimpactofthecurrentmacroeconomicenvironment;andtheotherfactorsidentifiedin“RiskFactors”includedinPartI,Item1AofourAnnualReportonForm10-KfortheyearendedDecember31,2016.Theforward-lookingstatementsinthispressreleasearebasedoninformationavailabletothecompanyatthistimeandweassumenoobligationtoupdateanysuchforward-looking statements. Although these forward-looking statements are believed to be true when made, they may ultimately prove to be incorrect. These statements are notguarantees of our future performance and are subject to risks, uncertainties and other factors, some of which are beyond our control and may cause actual results to differmateriallyfromcurrentexpectations.
###
(TablestoFollow)For Information Contact:Amrita Ahuja
Mary OsakoSVP, Investor Relations
SVP, Global Communications(310) 255-2075
(424) [email protected]
7
1
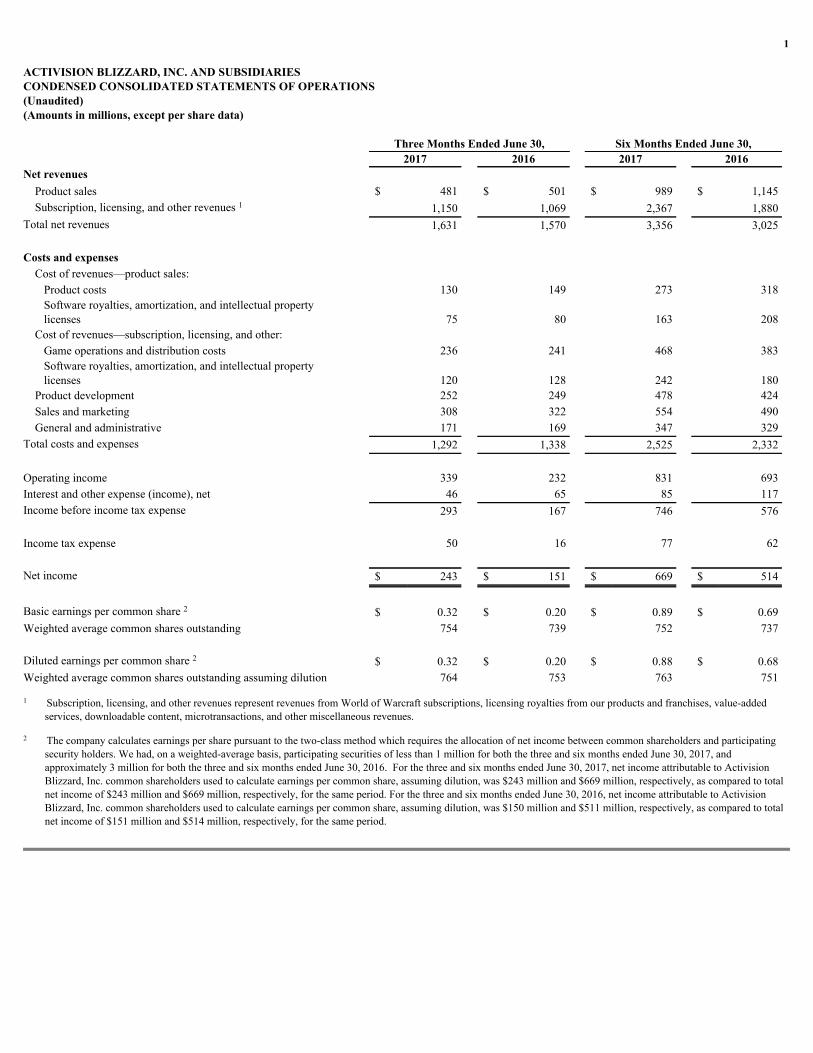
ACTIVISION BLIZZARD, INC. AND SUBSIDIARIESCONDENSED CONSOLIDATED STATEMENTS OF OPERATIONS(Unaudited)(Amounts in millions, except per share data)
Three Months Ended June 30,
Six Months Ended June 30,
2017
2016
2017
2016
Net revenues
Productsales $ 481 $ 501 $ 989 $ 1,145
Subscription,licensing,andotherrevenues 1,150 1,069 2,367 1,880
Totalnetrevenues 1,631 1,570 3,356 3,025
Costs and expenses
Costofrevenues—productsales:
Productcosts 130 149 273 318
Softwareroyalties,amortization,andintellectualpropertylicenses
75
80
163
208
Costofrevenues—subscription,licensing,andother:
Gameoperationsanddistributioncosts 236 241 468 383
Softwareroyalties,amortization,andintellectualpropertylicenses
120
128
242
180
Productdevelopment 252 249 478 424
Salesandmarketing 308 322 554 490
Generalandadministrative 171 169 347 329
Totalcostsandexpenses 1,292 1,338 2,525 2,332
Operatingincome 339 232 831 693
Interestandotherexpense(income),net 46 65 85 117
Incomebeforeincometaxexpense 293 167 746 576
Incometaxexpense 50 16 77 62
Netincome $ 243 $ 151 $ 669 $ 514
Basicearningspercommonshare $ 0.32 $ 0.20 $ 0.89 $ 0.69
Weightedaveragecommonsharesoutstanding 754 739 752 737
Dilutedearningspercommonshare $ 0.32 $ 0.20 $ 0.88 $ 0.68
Weightedaveragecommonsharesoutstandingassumingdilution 764 753 763 751
Subscription,licensing,andotherrevenuesrepresentrevenuesfromWorldofWarcraftsubscriptions,licensingroyaltiesfromourproductsandfranchises,value-added
services,downloadablecontent,microtransactions,andothermiscellaneousrevenues.
Thecompanycalculatesearningspersharepursuanttothetwo-classmethodwhichrequirestheallocationofnetincomebetweencommonshareholdersandparticipatingsecurityholders.Wehad,onaweighted-averagebasis,participatingsecuritiesoflessthan1millionforboththethreeandsixmonthsendedJune30,2017,andapproximately3millionforboththethreeandsixmonthsendedJune30,2016.ForthethreeandsixmonthsendedJune30,2017,netincomeattributabletoActivisionBlizzard,Inc.commonshareholdersusedtocalculateearningspercommonshare,assumingdilution,was$243millionand$669million,respectively,ascomparedtototalnetincomeof$243millionand$669million,respectively,forthesameperiod.ForthethreeandsixmonthsendedJune30,2016,netincomeattributabletoActivisionBlizzard,Inc.commonshareholdersusedtocalculateearningspercommonshare,assumingdilution,was$150millionand$511million,respectively,ascomparedtototalnetincomeof$151millionand$514million,respectively,forthesameperiod.
1
2
2
1
2
2
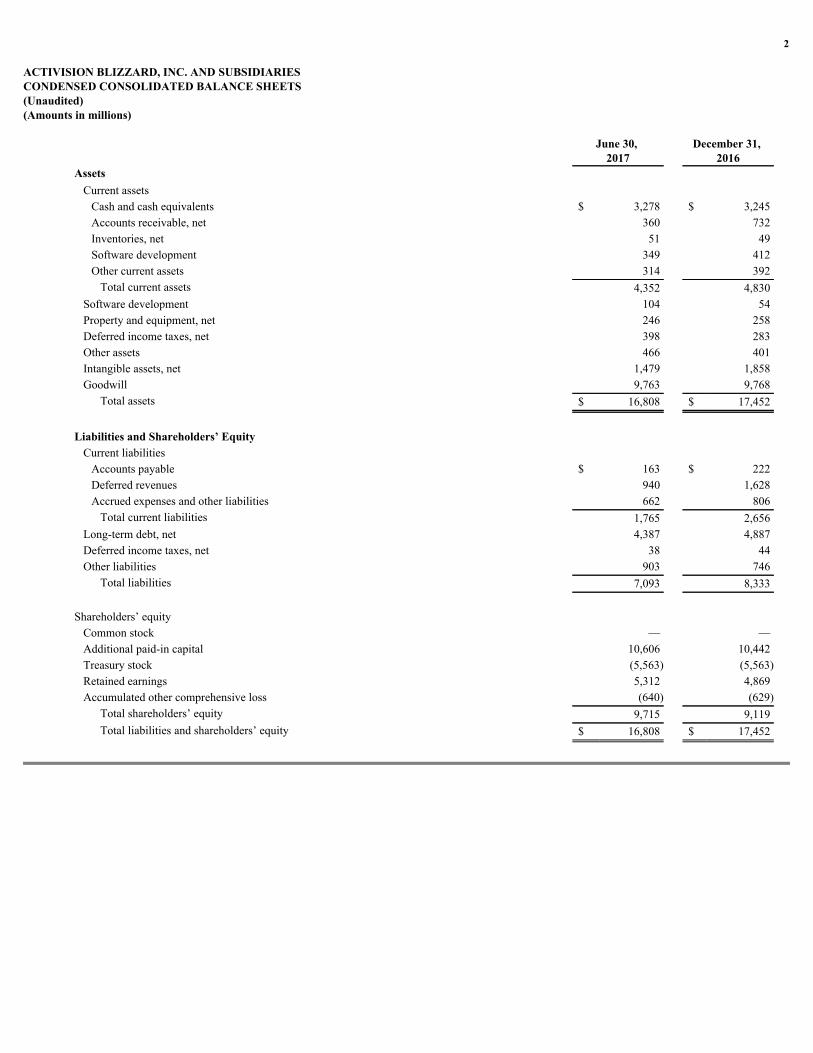
ACTIVISION BLIZZARD, INC. AND SUBSIDIARIESCONDENSED CONSOLIDATED BALANCE SHEETS(Unaudited)(Amounts in millions)
June 30, 2017
December 31, 2016
Assets
Currentassets
Cashandcashequivalents $ 3,278 $ 3,245
Accountsreceivable,net 360 732
Inventories,net 51 49
Softwaredevelopment 349 412
Othercurrentassets 314 392
Totalcurrentassets 4,352 4,830
Softwaredevelopment 104 54
Propertyandequipment,net 246 258
Deferredincometaxes,net 398 283
Otherassets 466 401
Intangibleassets,net 1,479 1,858
Goodwill 9,763 9,768
Totalassets $ 16,808 $ 17,452
Liabilities and Shareholders’ Equity
Currentliabilities
Accountspayable $ 163 $ 222
Deferredrevenues 940 1,628
Accruedexpensesandotherliabilities 662 806
Totalcurrentliabilities 1,765 2,656
Long-termdebt,net 4,387 4,887
Deferredincometaxes,net 38 44
Otherliabilities 903 746
Totalliabilities 7,093 8,333
Shareholders’equity
Commonstock — —
Additionalpaid-incapital 10,606 10,442
Treasurystock (5,563) (5,563)
Retainedearnings 5,312 4,869
Accumulatedothercomprehensiveloss (640) (629)
Totalshareholders’equity 9,715 9,119
Totalliabilitiesandshareholders’equity $ 16,808 $ 17,452
3
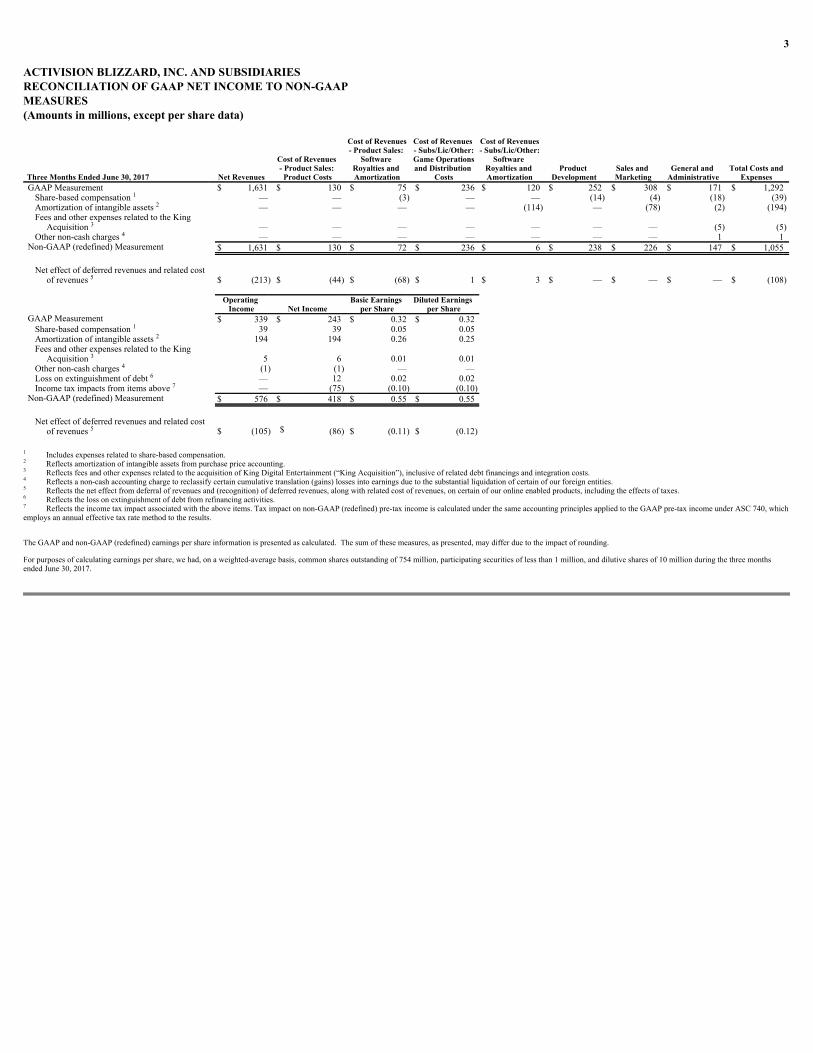
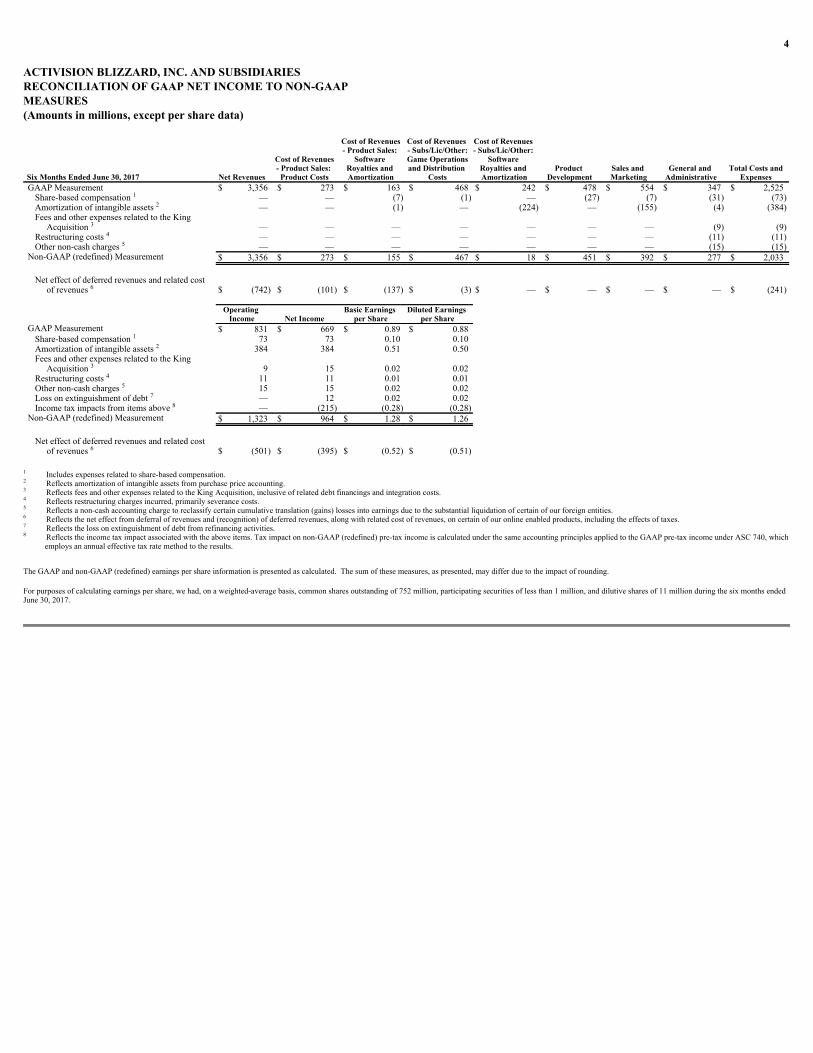
ACTIVISION BLIZZARD, INC. AND SUBSIDIARIES RECONCILIATION OF GAAP NET INCOME TO NON-GAAPMEASURES (Amounts in millions, except per share data)
Three Months Ended June 30, 2017
Net Revenues
Cost of Revenues - Product Sales: Product Costs
Cost of Revenues- Product Sales:
Software Royalties and Amortization
Cost of Revenues - Subs/Lic/Other:Game Operationsand Distribution
Costs
Cost of Revenues- Subs/Lic/Other:
Software Royalties and Amortization
Product Development
Sales and Marketing
General and Administrative
Total Costs andExpenses
GAAPMeasurement
$ 1,631
$ 130
$ 75
$ 236
$ 120
$ 252
$ 308
$ 171
$ 1,292
Share-basedcompensation
—
—
(3) —
—
(14) (4) (18) (39)Amortizationofintangibleassets
—
—
—
—
(114) —
(78) (2) (194)FeesandotherexpensesrelatedtotheKing
Acquisition
—
—
—
—
—
—
—
(5) (5)Othernon-cashcharges
—
—
—
—
—
—
—
1
1
Non-GAAP(redefined)Measurement
$ 1,631
$ 130
$ 72
$ 236
$ 6
$ 238
$ 226
$ 147
$ 1,055
Neteffectofdeferredrevenuesandrelatedcost
ofrevenues
$ (213) $ (44) $ (68) $ 1
$ 3
$ —
$ —
$ —
$ (108)
Operating Income
Net Income
Basic Earnings per Share
Diluted Earnings per Share
GAAPMeasurement
$ 339
$ 243
$ 0.32
$ 0.32
Share-basedcompensation
39
39
0.05
0.05
Amortizationofintangibleassets
194
194
0.26
0.25
FeesandotherexpensesrelatedtotheKingAcquisition
5
6
0.01
0.01
Othernon-cashcharges
(1) (1) —
—
Lossonextinguishmentofdebt
—
12
0.02
0.02
Incometaximpactsfromitemsabove
—
(75) (0.10) (0.10)
Non-GAAP(redefined)Measurement
$ 576
$ 418
$ 0.55
$ 0.55
Neteffectofdeferredrevenuesandrelatedcost
ofrevenues
$ (105) $ (86) $ (0.11) $ (0.12)
Includesexpensesrelatedtoshare-basedcompensation.Reflectsamortizationofintangibleassetsfrompurchasepriceaccounting.ReflectsfeesandotherexpensesrelatedtotheacquisitionofKingDigitalEntertainment(“KingAcquisition”),inclusiveofrelateddebtfinancingsandintegrationcosts.Reflectsanon-cashaccountingchargetoreclassifycertaincumulativetranslation(gains)lossesintoearningsduetothesubstantialliquidationofcertainofourforeignentities.Reflectstheneteffectfromdeferralofrevenuesand(recognition)ofdeferredrevenues,alongwithrelatedcostofrevenues,oncertainofouronlineenabledproducts,includingtheeffectsoftaxes.Reflectsthelossonextinguishmentofdebtfromrefinancingactivities.Reflectstheincometaximpactassociatedwiththeaboveitems.Taximpactonnon-GAAP(redefined)pre-taxincomeiscalculatedunderthesameaccountingprinciplesappliedtotheGAAPpre-taxincomeunderASC740,whichemploysanannualeffectivetaxratemethodtotheresults.
TheGAAPandnon-GAAP(redefined)earningspershareinformationispresentedascalculated.Thesumofthesemeasures,aspresented,maydifferduetotheimpactofrounding.Forpurposesofcalculatingearningspershare,wehad,onaweighted-averagebasis,commonsharesoutstandingof754million,participatingsecuritiesoflessthan1million,anddilutivesharesof10millionduringthethreemonthsendedJune30,2017.
12
34
5
12
34
67
5
1
2
3
4
5
6
7
4
ACTIVISION BLIZZARD, INC. AND SUBSIDIARIES RECONCILIATION OF GAAP NET INCOME TO NON-GAAPMEASURES (Amounts in millions, except per share data)
Six Months Ended June 30, 2017
Net Revenues
Cost of Revenues- Product Sales: Product Costs
Cost of Revenues- Product Sales:
Software Royalties and Amortization
Cost of Revenues - Subs/Lic/Other:Game Operationsand Distribution
Costs
Cost of Revenues - Subs/Lic/Other:
Software Royalties and Amortization
Product Development
Sales and Marketing
General and Administrative
Total Costs andExpenses
GAAPMeasurement
$ 3,356
$ 273
$ 163
$ 468
$ 242
$ 478
$ 554
$ 347
$ 2,525
Share-basedcompensation
—
—
(7) (1) —
(27) (7) (31) (73)Amortizationofintangibleassets
—
—
(1) —
(224) —
(155) (4) (384)FeesandotherexpensesrelatedtotheKing
Acquisition
—
—
—
—
—
—
—
(9) (9)Restructuringcosts
—
—
—
—
—
—
—
(11) (11)Othernon-cashcharges
—
—
—
—
—
—
—
(15) (15)Non-GAAP(redefined)Measurement
$ 3,356
$ 273
$ 155
$ 467
$ 18
$ 451
$ 392
$ 277
$ 2,033
Neteffectofdeferredrevenuesandrelatedcost
ofrevenues
$ (742) $ (101) $ (137) $ (3) $ —
$ —
$ —
$ —
$ (241)
Operating Income
Net Income
Basic Earnings per Share
Diluted Earnings per Share
GAAPMeasurement
$ 831
$ 669
$ 0.89
$ 0.88
Share-basedcompensation
73
73
0.10
0.10
Amortizationofintangibleassets
384
384
0.51
0.50
FeesandotherexpensesrelatedtotheKingAcquisition
9
15
0.02
0.02
Restructuringcosts
11
11
0.01
0.01
Othernon-cashcharges
15
15
0.02
0.02
Lossonextinguishmentofdebt
—
12
0.02
0.02
Incometaximpactsfromitemsabove
—
(215) (0.28) (0.28)
Non-GAAP(redefined)Measurement
$ 1,323
$ 964
$ 1.28
$ 1.26
Neteffectofdeferredrevenuesandrelatedcost
ofrevenues
$ (501) $ (395) $ (0.52) $ (0.51)
Includesexpensesrelatedtoshare-basedcompensation.Reflectsamortizationofintangibleassetsfrompurchasepriceaccounting.ReflectsfeesandotherexpensesrelatedtotheKingAcquisition,inclusiveofrelateddebtfinancingsandintegrationcosts.
Reflectsrestructuringchargesincurred,primarilyseverancecosts.Reflectsanon-cashaccountingchargetoreclassifycertaincumulativetranslation(gains)lossesintoearningsduetothesubstantialliquidationofcertainofourforeignentities.
Reflectstheneteffectfromdeferralofrevenuesand(recognition)ofdeferredrevenues,alongwithrelatedcostofrevenues,oncertainofouronlineenabledproducts,includingtheeffectsoftaxes.Reflectsthelossonextinguishmentofdebtfromrefinancingactivities.
Reflectstheincometaximpactassociatedwiththeaboveitems.Taximpactonnon-GAAP(redefined)pre-taxincomeiscalculatedunderthesameaccountingprinciplesappliedtotheGAAPpre-taxincomeunderASC740,whichemploysanannualeffectivetaxratemethodtotheresults.
TheGAAPandnon-GAAP(redefined)earningspershareinformationispresentedascalculated.Thesumofthesemeasures,aspresented,maydifferduetotheimpactofrounding.Forpurposesofcalculatingearningspershare,wehad,onaweighted-averagebasis,commonsharesoutstandingof752million,participatingsecuritiesoflessthan1million,anddilutivesharesof11millionduringthesixmonthsendedJune30,2017.
12
34
5
6
12
34
57
8
6
1
2
3
456
78
5
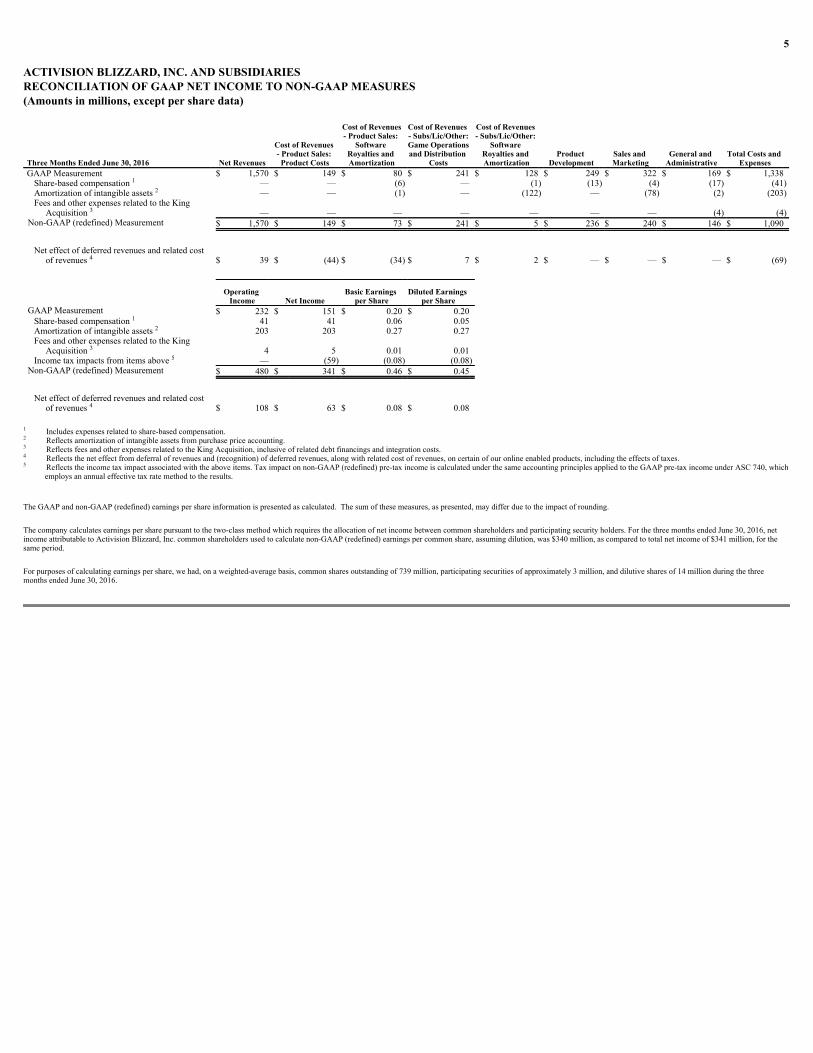
ACTIVISION BLIZZARD, INC. AND SUBSIDIARIESRECONCILIATION OF GAAP NET INCOME TO NON-GAAP MEASURES(Amounts in millions, except per share data)
Three Months Ended June 30, 2016
Net Revenues
Cost of Revenues - Product Sales: Product Costs
Cost of Revenues- Product Sales:
Software Royalties and Amortization
Cost of Revenues - Subs/Lic/Other:Game Operationsand Distribution
Costs
Cost of Revenues - Subs/Lic/Other:
Software Royalties and Amortization
Product Development
Sales and Marketing
General and Administrative
Total Costs and Expenses
GAAPMeasurement
$ 1,570
$ 149
$ 80
$ 241
$ 128
$ 249
$ 322
$ 169
$ 1,338
Share-basedcompensation
—
—
(6) —
(1) (13) (4) (17) (41)Amortizationofintangibleassets
—
—
(1) —
(122) —
(78) (2) (203)FeesandotherexpensesrelatedtotheKing
Acquisition
—
—
—
—
—
—
—
(4) (4)Non-GAAP(redefined)Measurement
$ 1,570
$ 149
$ 73
$ 241
$ 5
$ 236
$ 240
$ 146
$ 1,090
Neteffectofdeferredrevenuesandrelatedcost
ofrevenues
$ 39
$ (44) $ (34) $ 7
$ 2
$ —
$ —
$ —
$ (69)
Operating Income
Net Income
Basic Earnings per Share
Diluted Earnings per Share
GAAPMeasurement
$ 232
$ 151
$ 0.20
$ 0.20
Share-basedcompensation
41
41
0.06
0.05
Amortizationofintangibleassets
203
203
0.27
0.27
FeesandotherexpensesrelatedtotheKingAcquisition
4
5
0.01
0.01
Incometaximpactsfromitemsabove
—
(59) (0.08) (0.08)
Non-GAAP(redefined)Measurement
$ 480
$ 341
$ 0.46
$ 0.45
Neteffectofdeferredrevenuesandrelatedcost
ofrevenues
$ 108
$ 63
$ 0.08
$ 0.08
Includesexpensesrelatedtoshare-basedcompensation.Reflectsamortizationofintangibleassetsfrompurchasepriceaccounting.ReflectsfeesandotherexpensesrelatedtotheKingAcquisition,inclusiveofrelateddebtfinancingsandintegrationcosts.Reflectstheneteffectfromdeferralofrevenuesand(recognition)ofdeferredrevenues,alongwithrelatedcostofrevenues,oncertainofouronlineenabledproducts,includingtheeffectsoftaxes.Reflectstheincometaximpactassociatedwiththeaboveitems.Taximpactonnon-GAAP(redefined)pre-taxincomeiscalculatedunderthesameaccountingprinciplesappliedtotheGAAPpre-taxincomeunderASC740,which
employsanannualeffectivetaxratemethodtotheresults.TheGAAPandnon-GAAP(redefined)earningspershareinformationispresentedascalculated.Thesumofthesemeasures,aspresented,maydifferduetotheimpactofrounding.Thecompanycalculatesearningspersharepursuanttothetwo-classmethodwhichrequirestheallocationofnetincomebetweencommonshareholdersandparticipatingsecurityholders.ForthethreemonthsendedJune30,2016,netincomeattributabletoActivisionBlizzard,Inc.commonshareholdersusedtocalculatenon-GAAP(redefined)earningspercommonshare,assumingdilution,was$340million,ascomparedtototalnetincomeof$341million,forthesameperiod.Forpurposesofcalculatingearningspershare,wehad,onaweighted-averagebasis,commonsharesoutstandingof739million,participatingsecuritiesofapproximately3million,anddilutivesharesof14millionduringthethreemonthsendedJune30,2016.
12
3
4
12
35
4
1
2
3
4
5

6
ACTIVISION BLIZZARD, INC. AND SUBSIDIARIESRECONCILIATION OF GAAP NET INCOME TO NON-GAAP MEASURES(Amounts in millions, except per share data)
Six Months Ended June 30, 2016
Net Revenues
Cost of Revenues- Product Sales: Product Costs
Cost of Revenues- Product Sales:
Software Royalties and Amortization
Cost of Revenues - Subs/Lic/Other:Game Operationsand Distribution
Costs
Cost of Revenues - Subs/Lic/Other:
Software Royalties and Amortization
Product Development
Sales and Marketing
General and Administrative
Total Costs and Expenses
GAAPMeasurement
$ 3,025
$ 318
$ 208
$ 383
$ 180
$ 424
$ 490
$ 329
$ 2,332
Share-basedcompensation
—
—
(14) —
(1) (23) (7) (40) (85)Amortizationofintangibleassets
—
—
(2) (1) (168) —
(111) (3) (285)FeesandotherexpensesrelatedtotheKing
Acquisition
—
—
—
—
—
—
—
(38) (38)Non-GAAP(redefined)Measurement
$ 3,025
$ 318
$ 192
$ 382
$ 11
$ 401
$ 372
$ 248
$ 1,924
Neteffectofdeferredrevenuesandrelatedcost
ofrevenues
$ (508) $ (127) $ (122) $ 3
$ (1) $ —
$ —
$ —
$ (247)
Operating Income
Net Income
Basic Earnings per Share
Diluted Earnings per Share
GAAPMeasurement
$ 693
$ 514
$ 0.69
$ 0.68
Share-basedcompensation
85
85
0.12
0.11
Amortizationofintangibleassets
285
285
0.38
0.38
FeesandotherexpensesrelatedtotheKingAcquisition
38
41
0.06
0.05
Incometaximpactsfromitemsabove
—
(143) (0.19) (0.19)
Non-GAAP(redefined)Measurement
$ 1,101
$ 782
$ 1.06
$ 1.04
Neteffectofdeferredrevenuesandrelatedcost
ofrevenues
$ (261) $ (205) $ (0.28) $ (0.28)
Includesexpensesrelatedtoshare-basedcompensation.Reflectsamortizationofintangibleassetsfrompurchasepriceaccounting.ReflectsfeesandotherexpensesrelatedtotheKingAcquisition,inclusiveofrelateddebtfinancingsandintegrationcosts.Reflectstheneteffectfromdeferralofrevenuesand(recognition)ofdeferredrevenues,alongwithrelatedcostofrevenues,oncertainofouronlineenabledproducts,includingtheeffectsoftaxes.Reflectstheincometaximpactassociatedwiththeaboveitems.Taximpactonnon-GAAP(redefined)pre-taxincomeiscalculatedunderthesameaccountingprinciplesappliedtotheGAAPpre-taxincomeunderASC740,which
employsanannualeffectivetaxratemethodtotheresults.TheGAAPandnon-GAAP(redefined)earningspershareinformationispresentedascalculated.Thesumofthesemeasures,aspresented,maydifferduetotheimpactofrounding.Thecompanycalculatesearningspersharepursuanttothetwo-classmethodwhichrequirestheallocationofnetincomebetweencommonshareholdersandparticipatingsecurityholders.ForthesixmonthsendedJune30,2016,netincomeattributabletoActivisionBlizzard,Inc.commonshareholdersusedtocalculatenon-GAAP(redefined)earningspercommonshare,assumingdilution,was$778million,ascomparedtototalnetincomeof$782million,forthesameperiod.Forpurposesofcalculatingearningspershare,wehad,onaweighted-averagebasis,commonsharesoutstandingof737million,participatingsecuritiesofapproximately3million,anddilutivesharesof14millionduringthesixmonthsendedJune30,2016.
12
3
4
12
35
4
1
2
3
4
5
7
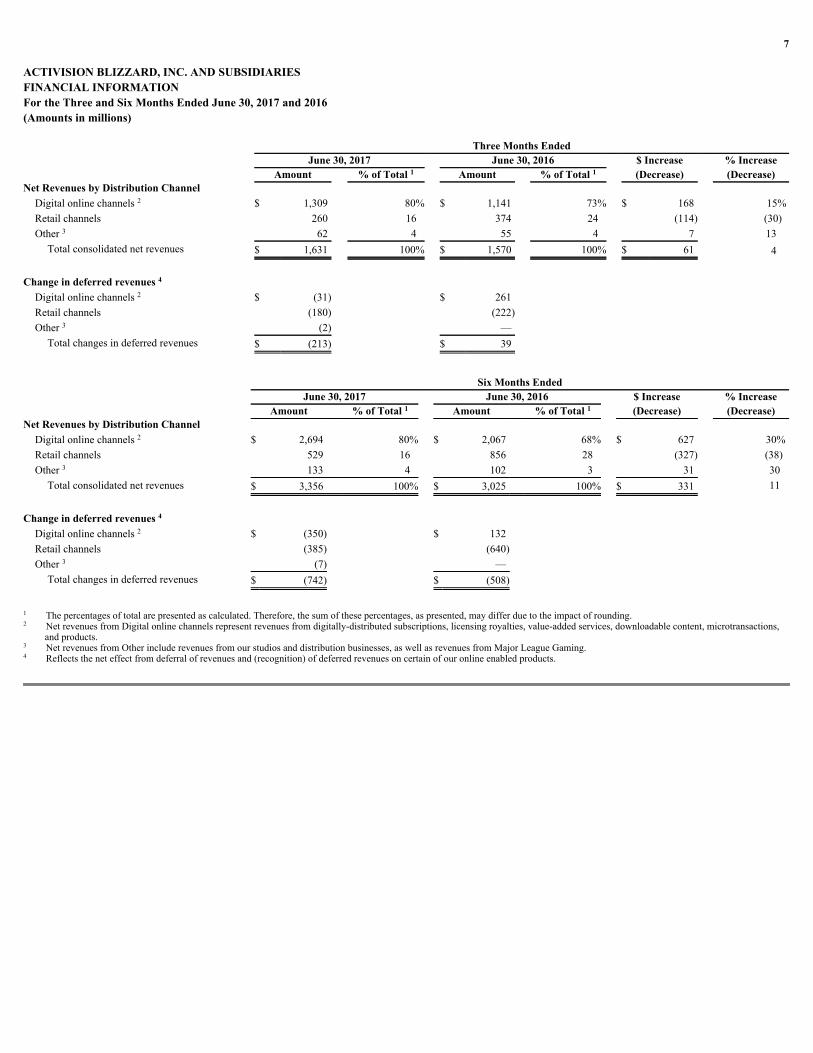
ACTIVISION BLIZZARD, INC. AND SUBSIDIARIES
FINANCIAL INFORMATION
For the Three and Six Months Ended June 30, 2017 and 2016
(Amounts in millions)
Three Months Ended
June 30, 2017
June 30, 2016
$ Increase
% Increase
Amount
% of Total
Amount
% of Total
(Decrease)
(Decrease)Net Revenues by Distribution Channel
Digitalonlinechannels
$ 1,309
80%
$ 1,141
73%
$ 168
15%Retailchannels
260
16
374
24
(114)
(30)Other
62
4
55
4
7
13Totalconsolidatednetrevenues
$ 1,631
100%
$ 1,570
100%
$ 61
4 Change in deferred revenues
Digitalonlinechannels
$ (31)
$ 261
Retailchannels
(180)
(222)
Other
(2)
—
Totalchangesindeferredrevenues
$ (213)
$ 39
Six Months Ended
June 30, 2017
June 30, 2016
$ Increase
% Increase
Amount
% of Total
Amount
% of Total
(Decrease)
(Decrease)Net Revenues by Distribution Channel
Digitalonlinechannels
$ 2,694
80%
$ 2,067
68%
$ 627
30%Retailchannels
529
16
856
28
(327)
(38)Other
133
4
102
3
31
30Totalconsolidatednetrevenues
$ 3,356
100%
$ 3,025
100%
$ 331
11
Change in deferred revenues
Digitalonlinechannels
$ (350)
$ 132
Retailchannels
(385)
(640)
Other
(7)
—
Totalchangesindeferredrevenues
$ (742)
$ (508)
Thepercentagesoftotalarepresentedascalculated.Therefore,thesumofthesepercentages,aspresented,maydifferduetotheimpactofrounding.NetrevenuesfromDigitalonlinechannelsrepresentrevenuesfromdigitally-distributedsubscriptions,licensingroyalties,value-addedservices,downloadablecontent,microtransactions,
andproducts.NetrevenuesfromOtherincluderevenuesfromourstudiosanddistributionbusinesses,aswellasrevenuesfromMajorLeagueGaming.Reflectstheneteffectfromdeferralofrevenuesand(recognition)ofdeferredrevenuesoncertainofouronlineenabledproducts.
1 1
2
3
4
2
3
1 1
2
3
4
2
3
1
2
3
4
8
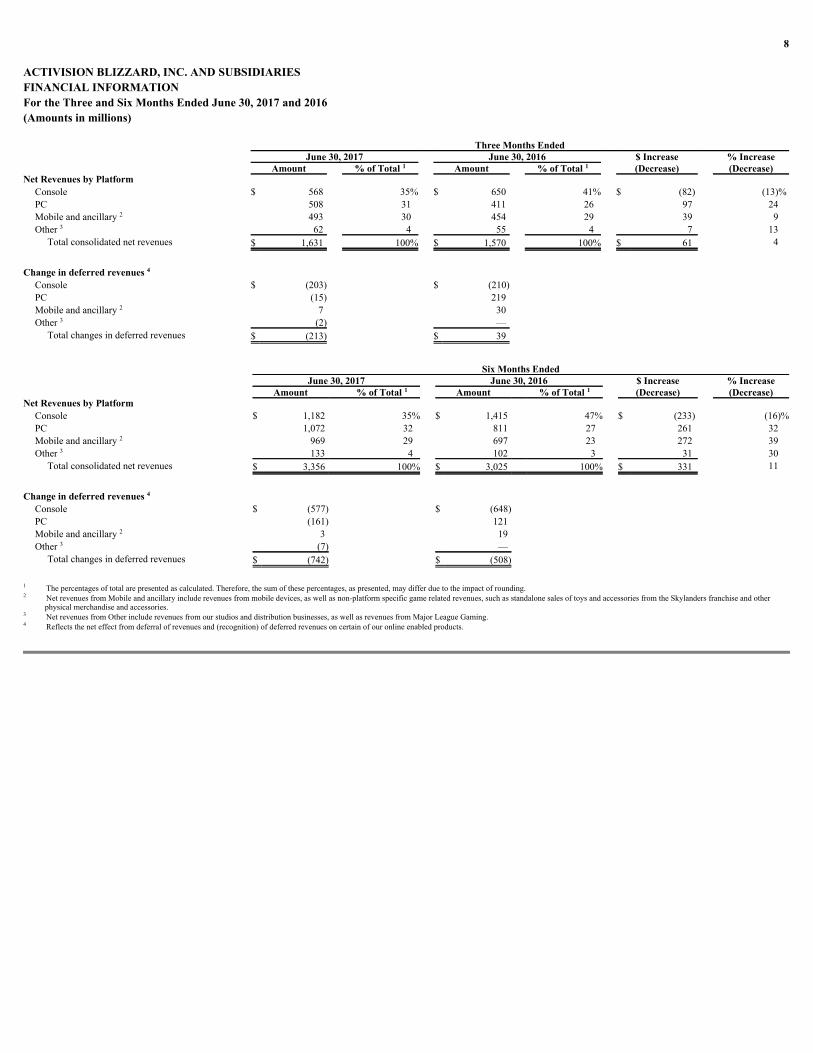
ACTIVISION BLIZZARD, INC. AND SUBSIDIARIES
FINANCIAL INFORMATION
For the Three and Six Months Ended June 30, 2017 and 2016
(Amounts in millions)
Three Months Ended
June 30, 2017
June 30, 2016
$ Increase
% Increase
Amount
% of Total
Amount
% of Total
(Decrease)
(Decrease)Net Revenues by Platform
Console
$ 568
35%
$ 650
41%
$ (82)
(13)%PC
508
31
411
26
97
24Mobileandancillary
493
30
454
29
39
9Other
62
4
55
4
7
13Totalconsolidatednetrevenues
$ 1,631
100%
$ 1,570
100%
$ 61
4 Change in deferred revenues
Console
$ (203)
$ (210)
PC
(15)
219
Mobileandancillary
7
30
Other
(2)
—
Totalchangesindeferredrevenues
$ (213)
$ 39
Six Months Ended
June 30, 2017
June 30, 2016
$ Increase
% Increase
Amount
% of Total
Amount
% of Total
(Decrease)
(Decrease)Net Revenues by Platform
Console
$ 1,182
35%
$ 1,415
47%
$ (233)
(16)%PC
1,072
32
811
27
261
32Mobileandancillary
969
29
697
23
272
39Other
133
4
102
3
31
30Totalconsolidatednetrevenues
$ 3,356
100%
$ 3,025
100%
$ 331
11 Change in deferred revenues
Console
$ (577)
$ (648)
PC
(161)
121
Mobileandancillary
3
19
Other
(7)
—
Totalchangesindeferredrevenues
$ (742)
$ (508)
Thepercentagesoftotalarepresentedascalculated.Therefore,thesumofthesepercentages,aspresented,maydifferduetotheimpactofrounding.NetrevenuesfromMobileandancillaryincluderevenuesfrommobiledevices,aswellasnon-platformspecificgamerelatedrevenues,suchasstandalonesalesoftoysandaccessoriesfromtheSkylandersfranchiseandother
physicalmerchandiseandaccessories.NetrevenuesfromOtherincluderevenuesfromourstudiosanddistributionbusinesses,aswellasrevenuesfromMajorLeagueGaming.Reflectstheneteffectfromdeferralofrevenuesand(recognition)ofdeferredrevenuesoncertainofouronlineenabledproducts.
1 1
2
3
4
2
3
1 1
2
3
4
2
3
1
2
3
4
9
ACTIVISION BLIZZARD, INC. AND SUBSIDIARIESFINANCIAL INFORMATIONFor the Three and Six Months Ended June 30, 2017 and 2016(Amounts in millions)
Three Months Ended
June 30, 2017
June 30, 2016
$ Increase
% Increase
Amount
% of Total
Amount
% of Total
(Decrease)
(Decrease)Net Revenues by Geographic Region
Americas
$ 858
53%
$ 860
55%
$ (2)
—%EMEA
538
33
507
32
31
6AsiaPacific
235
14
203
13
32
16Totalconsolidatednetrevenues
$ 1,631
100%
$ 1,570
100%
$ 61
4 Change in deferred revenues
Americas
$ (129)
$ (24)
EMEA
(72)
(17)
AsiaPacific
(12)
80
Totalchangesindeferredrevenues
$ (213)
$ 39
Six Months Ended
June 30, 2017
June 30, 2016
$ Increase
% Increase
Amount
% of Total
Amount
% of Total
(Decrease)
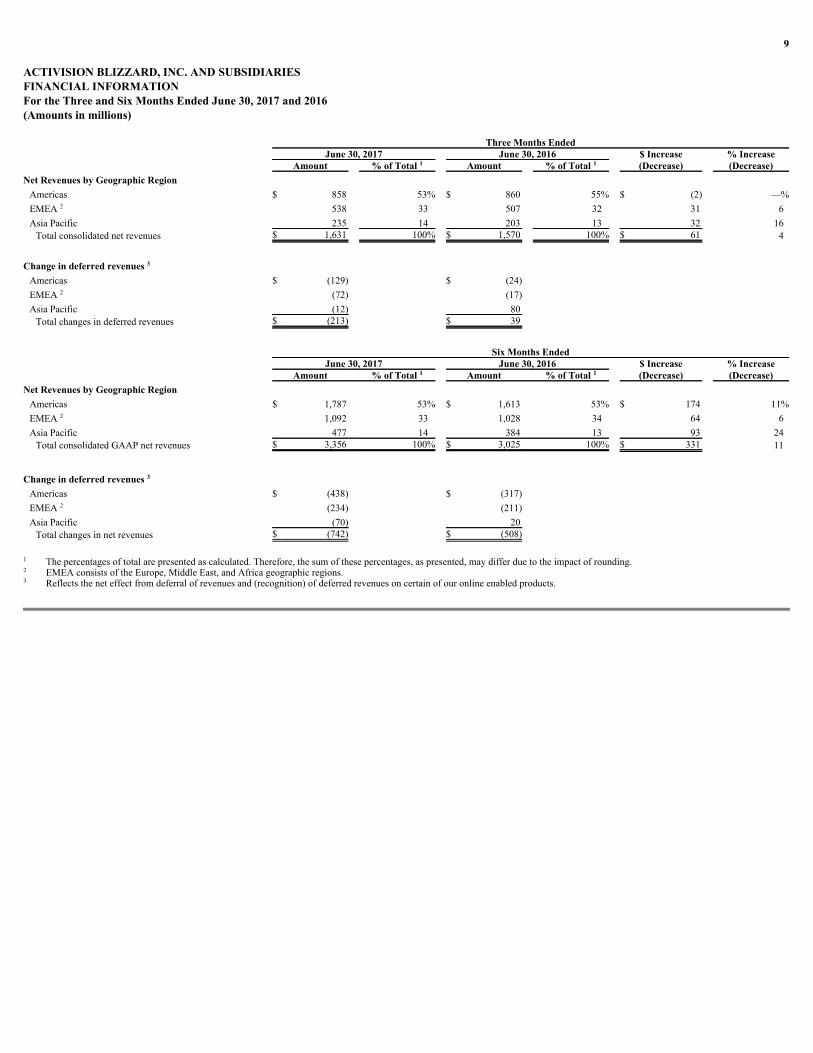
(Decrease)Net Revenues by Geographic Region
Americas
$ 1,787
53%
$ 1,613
53%
$ 174
11%EMEA
1,092
33
1,028
34
64
6AsiaPacific
477
14
384
13
93
24TotalconsolidatedGAAPnetrevenues
$ 3,356
100%
$ 3,025
100%
$ 331
11
Change in deferred revenues
Americas
$ (438)
$ (317)
EMEA
(234)
(211)
AsiaPacific
(70)
20
Totalchangesinnetrevenues
$ (742)
$ (508)
Thepercentagesoftotalarepresentedascalculated.Therefore,thesumofthesepercentages,aspresented,maydifferduetotheimpactofrounding.
EMEAconsistsoftheEurope,MiddleEast,andAfricageographicregions.Reflectstheneteffectfromdeferralofrevenuesand(recognition)ofdeferredrevenuesoncertainofouronlineenabledproducts.
1 1
2
3
2
1 1
2
3
2
1
2
3
10
ACTIVISION BLIZZARD, INC. AND SUBSIDIARIESFINANCIAL INFORMATIONFor the Three Months Ended June 30, 2017 and 2016(Amounts in millions)
Three Months Ended
June 30, 2017
June 30, 2016
$ Increase
% Increase
Amount
% of Total
Amount
% of Total
(Decrease)
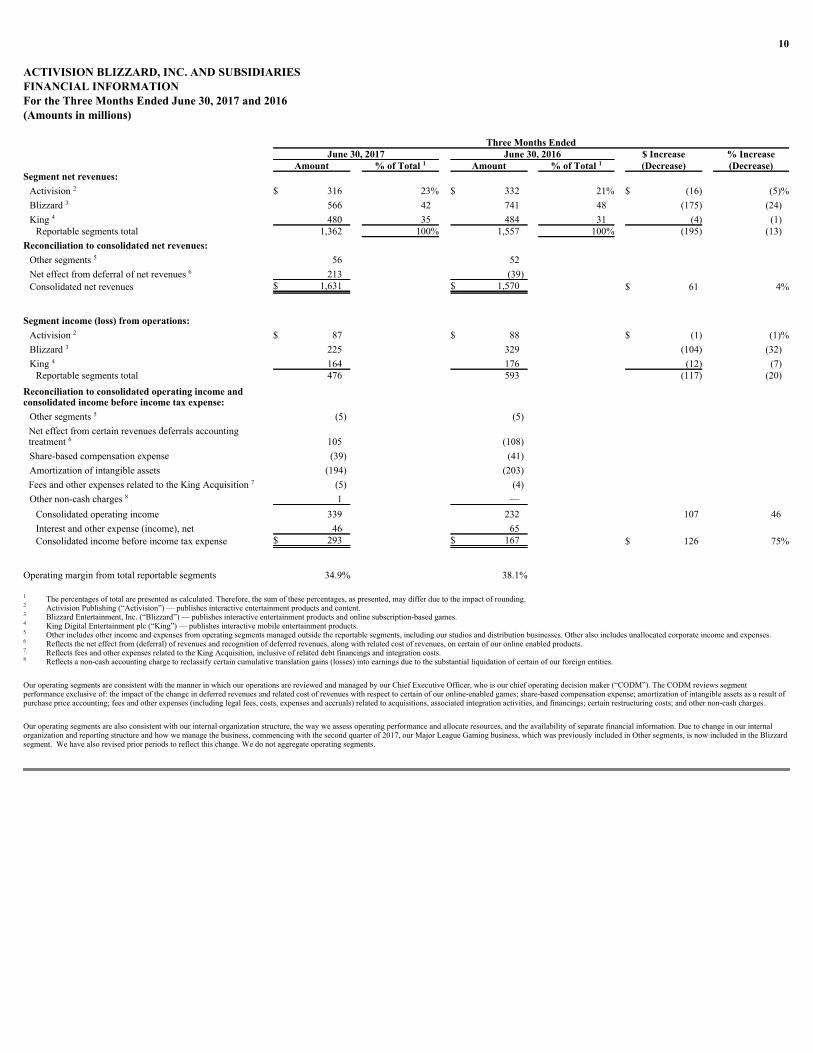
(Decrease)Segment net revenues:
Activision
$ 316
23%
$ 332
21%
$ (16)
(5)%Blizzard
566
42
741
48
(175)
(24)King
480
35
484
31
(4)
(1)Reportablesegmentstotal
1,362
100%
1,557
100%
(195)
(13)Reconciliation to consolidated net revenues:
Othersegments
56
52
Neteffectfromdeferralofnetrevenues
213
(39)
Consolidatednetrevenues
$ 1,631
$ 1,570
$ 61
4%
Segment income (loss) from operations:
Activision
$ 87
$ 88
$ (1)
(1)%Blizzard
225
329
(104)
(32)King
164
176
(12)
(7)Reportablesegmentstotal
476
593
(117)
(20)Reconciliation to consolidated operating income andconsolidated income before income tax expense:
Othersegments
(5)
(5)
Neteffectfromcertainrevenuesdeferralsaccountingtreatment
105
(108)
Share-basedcompensationexpense
(39)
(41)
Amortizationofintangibleassets
(194)
(203)
FeesandotherexpensesrelatedtotheKingAcquisition
(5)
(4)
Othernon-cashcharges
1
—
Consolidatedoperatingincome
339
232
107
46Interestandotherexpense(income),net
46
65
Consolidatedincomebeforeincometaxexpense
$ 293
$ 167
$ 126
75%
Operatingmarginfromtotalreportablesegments
34.9%
38.1%
Thepercentagesoftotalarepresentedascalculated.Therefore,thesumofthesepercentages,aspresented,maydifferduetotheimpactofrounding.ActivisionPublishing(“Activision”)—publishesinteractiveentertainmentproductsandcontent.BlizzardEntertainment,Inc.(“Blizzard”)—publishesinteractiveentertainmentproductsandonlinesubscription-basedgames.KingDigitalEntertainmentplc(“King”)—publishesinteractivemobileentertainmentproducts.Otherincludesotherincomeandexpensesfromoperatingsegmentsmanagedoutsidethereportablesegments,includingourstudiosanddistributionbusinesses.Otheralsoincludesunallocatedcorporateincomeandexpenses.Reflectstheneteffectfrom(deferral)ofrevenuesandrecognitionofdeferredrevenues,alongwithrelatedcostofrevenues,oncertainofouronlineenabledproducts.ReflectsfeesandotherexpensesrelatedtotheKingAcquisition,inclusiveofrelateddebtfinancingsandintegrationcosts.
Reflectsanon-cashaccountingchargetoreclassifycertaincumulativetranslationgains(losses)intoearningsduetothesubstantialliquidationofcertainofourforeignentities.OuroperatingsegmentsareconsistentwiththemannerinwhichouroperationsarereviewedandmanagedbyourChiefExecutiveOfficer,whoisourchiefoperatingdecisionmaker(“CODM”).TheCODMreviewssegmentperformanceexclusiveof:theimpactofthechangeindeferredrevenuesandrelatedcostofrevenueswithrespecttocertainofouronline-enabledgames;share-basedcompensationexpense;amortizationofintangibleassetsasaresultofpurchasepriceaccounting;feesandotherexpenses(includinglegalfees,costs,expensesandaccruals)relatedtoacquisitions,associatedintegrationactivities,andfinancings;certainrestructuringcosts;andothernon-cashcharges.Ouroperatingsegmentsarealsoconsistentwithourinternalorganizationstructure,thewayweassessoperatingperformanceandallocateresources,andtheavailabilityofseparatefinancialinformation.Duetochangeinourinternalorganizationandreportingstructureandhowwemanagethebusiness,commencingwiththesecondquarterof2017,ourMajorLeagueGamingbusiness,whichwaspreviouslyincludedinOthersegments,isnowincludedintheBlizzardsegment.Wehavealsorevisedpriorperiodstoreflectthischange.Wedonotaggregateoperatingsegments.
1 1
2
3
4
5
6
2
3
4
5
6
7
8
1
2
3
4
5
6
7
8
11
ACTIVISION BLIZZARD, INC. AND SUBSIDIARIESFINANCIAL INFORMATIONFor the Six Months Ended June 30, 2017 and 2016(Amounts in millions)
Six Months Ended
June 30, 2017 June 30, 2016 $ Increase
(Decrease)
% Increase (Decrease)
Amount % of Total Amount % of Total
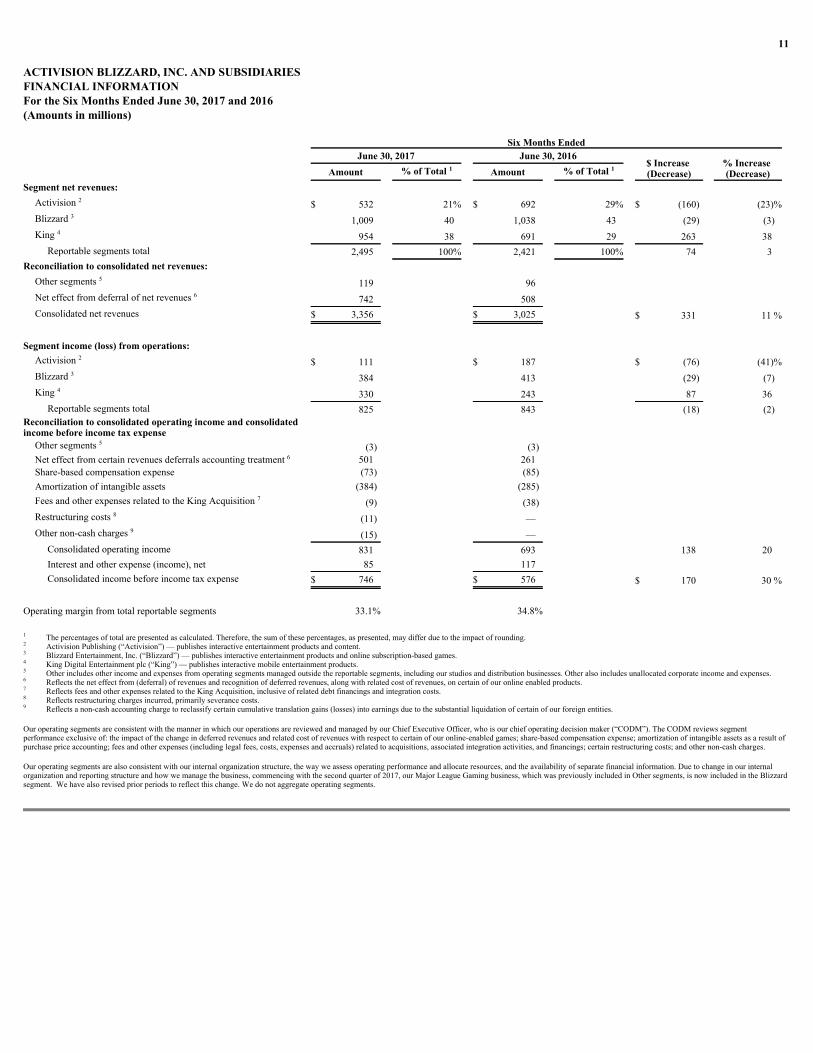
Segment net revenues:
Activision $ 532 21% $ 692 29% $ (160) (23)%
Blizzard 1,009 40 1,038 43 (29) (3)
King 954 38 691 29 263 38
Reportablesegmentstotal 2,495 100% 2,421 100% 74 3
Reconciliation to consolidated net revenues:
Othersegments 119 96
Neteffectfromdeferralofnetrevenues 742 508
Consolidatednetrevenues $ 3,356 $ 3,025 $ 331 11%
Segment income (loss) from operations:
Activision $ 111 $ 187 $ (76) (41)%
Blizzard 384 413 (29) (7)
King 330 243 87 36
Reportablesegmentstotal 825 843 (18) (2)
Reconciliation to consolidated operating income and consolidatedincome before income tax expense
Othersegments (3) (3)
Neteffectfromcertainrevenuesdeferralsaccountingtreatment
501
261
Share-basedcompensationexpense (73) (85)
Amortizationofintangibleassets (384) (285)
FeesandotherexpensesrelatedtotheKingAcquisition (9) (38)
Restructuringcosts (11) —
Othernon-cashcharges (15) —
Consolidatedoperatingincome 831 693 138 20
Interestandotherexpense(income),net 85 117
Consolidatedincomebeforeincometaxexpense $ 746 $ 576 $ 170 30%
Operatingmarginfromtotalreportablesegments 33.1% 34.8%
Thepercentagesoftotalarepresentedascalculated.Therefore,thesumofthesepercentages,aspresented,maydifferduetotheimpactofrounding.ActivisionPublishing(“Activision”)—publishesinteractiveentertainmentproductsandcontent.BlizzardEntertainment,Inc.(“Blizzard”)—publishesinteractiveentertainmentproductsandonlinesubscription-basedgames.KingDigitalEntertainmentplc(“King”)—publishesinteractivemobileentertainmentproducts.Otherincludesotherincomeandexpensesfromoperatingsegmentsmanagedoutsidethereportablesegments,includingourstudiosanddistributionbusinesses.Otheralsoincludesunallocatedcorporateincomeandexpenses.Reflectstheneteffectfrom(deferral)ofrevenuesandrecognitionofdeferredrevenues,alongwithrelatedcostofrevenues,oncertainofouronlineenabledproducts.ReflectsfeesandotherexpensesrelatedtotheKingAcquisition,inclusiveofrelateddebtfinancingsandintegrationcosts.Reflectsrestructuringchargesincurred,primarilyseverancecosts.
Reflectsanon-cashaccountingchargetoreclassifycertaincumulativetranslationgains(losses)intoearningsduetothesubstantialliquidationofcertainofourforeignentities.OuroperatingsegmentsareconsistentwiththemannerinwhichouroperationsarereviewedandmanagedbyourChiefExecutiveOfficer,whoisourchiefoperatingdecisionmaker(“CODM”).TheCODMreviewssegmentperformanceexclusiveof:theimpactofthechangeindeferredrevenuesandrelatedcostofrevenueswithrespecttocertainofouronline-enabledgames;share-basedcompensationexpense;amortizationofintangibleassetsasaresultofpurchasepriceaccounting;feesandotherexpenses(includinglegalfees,costs,expensesandaccruals)relatedtoacquisitions,associatedintegrationactivities,andfinancings;certainrestructuringcosts;andothernon-cashcharges.Ouroperatingsegmentsarealsoconsistentwithourinternalorganizationstructure,thewayweassessoperatingperformanceandallocateresources,andtheavailabilityofseparatefinancialinformation.Duetochangeinourinternalorganizationandreportingstructureandhowwemanagethebusiness,commencingwiththesecondquarterof2017,ourMajorLeagueGamingbusiness,whichwaspreviouslyincludedinOthersegments,isnowincludedintheBlizzardsegment.Wehavealsorevisedpriorperiodstoreflectthischange.Wedonotaggregateoperatingsegments.
1 1
2
3
4
5
6
2
3
4
5
6
7
8
9
1
2
3
4
5
6
7
8
9
12
ACTIVISION BLIZZARD, INC. AND SUBSIDIARIESEBITDA and Adjusted EBITDAFor the Trailing Twelve Months Ended June 30, 2017(Amounts in millions)
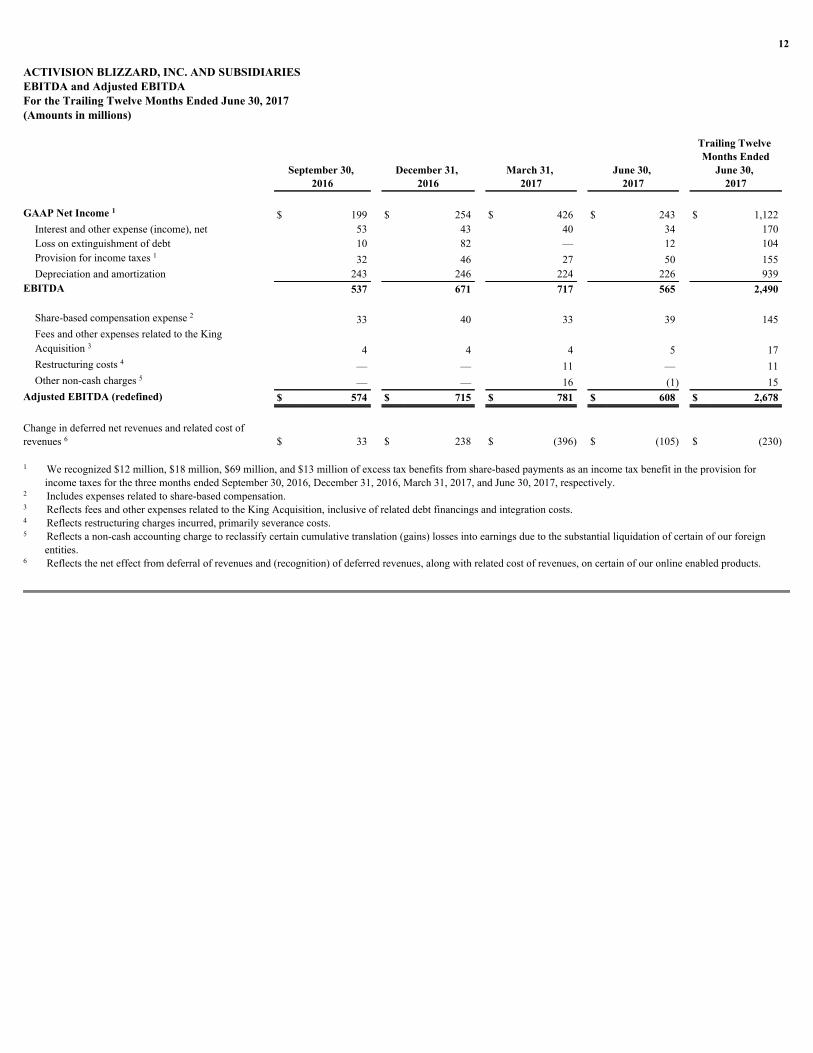
Trailing Twelve Months Ended
September 30, 2016
December 31, 2016
March 31, 2017
June 30, 2017
June 30, 2017
GAAP Net Income $ 199 $ 254 $ 426 $ 243 $ 1,122
Interestandotherexpense(income),net 53 43 40 34 170
Lossonextinguishmentofdebt 10 82 — 12 104
Provisionforincometaxes 32 46 27 50 155
Depreciationandamortization 243 246 224 226 939
EBITDA 537 671 717 565 2,490
Share-basedcompensationexpense 33 40 33 39 145
FeesandotherexpensesrelatedtotheKingAcquisition 4 4 4 5 17
Restructuringcosts — — 11 — 11
Othernon-cashcharges — — 16 (1) 15
Adjusted EBITDA (redefined) $ 574 $ 715 $ 781 $ 608 $ 2,678
Changeindeferrednetrevenuesandrelatedcostofrevenues
$ 33
$ 238
$ (396)
$ (105)
$ (230)
Werecognized$12million,$18million,$69million,and$13millionofexcesstaxbenefitsfromshare-basedpaymentsasanincometaxbenefitintheprovisionforincometaxesforthethreemonthsendedSeptember30,2016,December31,2016,March31,2017,andJune30,2017,respectively.
Includesexpensesrelatedtoshare-basedcompensation.ReflectsfeesandotherexpensesrelatedtotheKingAcquisition,inclusiveofrelateddebtfinancingsandintegrationcosts.
Reflectsrestructuringchargesincurred,primarilyseverancecosts.Reflectsanon-cashaccountingchargetoreclassifycertaincumulativetranslation(gains)lossesintoearningsduetothesubstantialliquidationofcertainofourforeignentities.
Reflectstheneteffectfromdeferralofrevenuesand(recognition)ofdeferredrevenues,alongwithrelatedcostofrevenues,oncertainofouronlineenabledproducts.
1
1
2
3
4
5
6
1
2
3
4
5
6
13
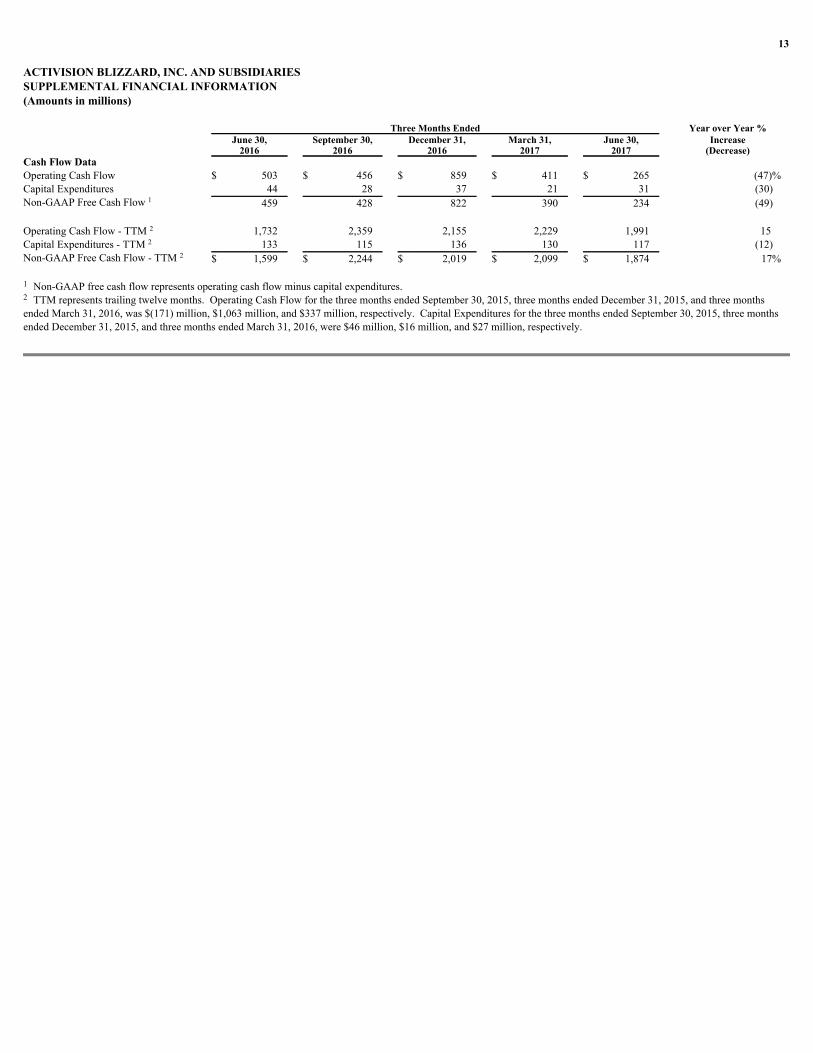
ACTIVISION BLIZZARD, INC. AND SUBSIDIARIESSUPPLEMENTAL FINANCIAL INFORMATION(Amounts in millions)
Three Months Ended
Year over Year %
June 30,
September 30,
December 31,
March 31,
June 30,
Increase
2016
2016
2016
2017
2017
(Decrease)
Cash Flow Data
OperatingCashFlow
$ 503
$ 456
$ 859
$ 411
$ 265
(47)%
CapitalExpenditures
44
28
37
21
31
(30)
Non-GAAPFreeCashFlow
459
428
822
390
234
(49)
OperatingCashFlow-TTM
1,732
2,359
2,155
2,229
1,991
15
CapitalExpenditures-TTM
133
115
136
130
117
(12)
Non-GAAPFreeCashFlow-TTM
$ 1,599
$ 2,244
$ 2,019
$ 2,099
$ 1,874
17%
Non-GAAPfreecashflowrepresentsoperatingcashflowminuscapitalexpenditures.TTMrepresentstrailingtwelvemonths.OperatingCashFlowforthethreemonthsendedSeptember30,2015,threemonthsendedDecember31,2015,andthreemonthsendedMarch31,2016,was$(171)million,$1,063million,and$337million,respectively.CapitalExpendituresforthethreemonthsendedSeptember30,2015,threemonthsendedDecember31,2015,andthreemonthsendedMarch31,2016,were$46million,$16million,and$27million,respectively.
1
2
2
2
1
2
14
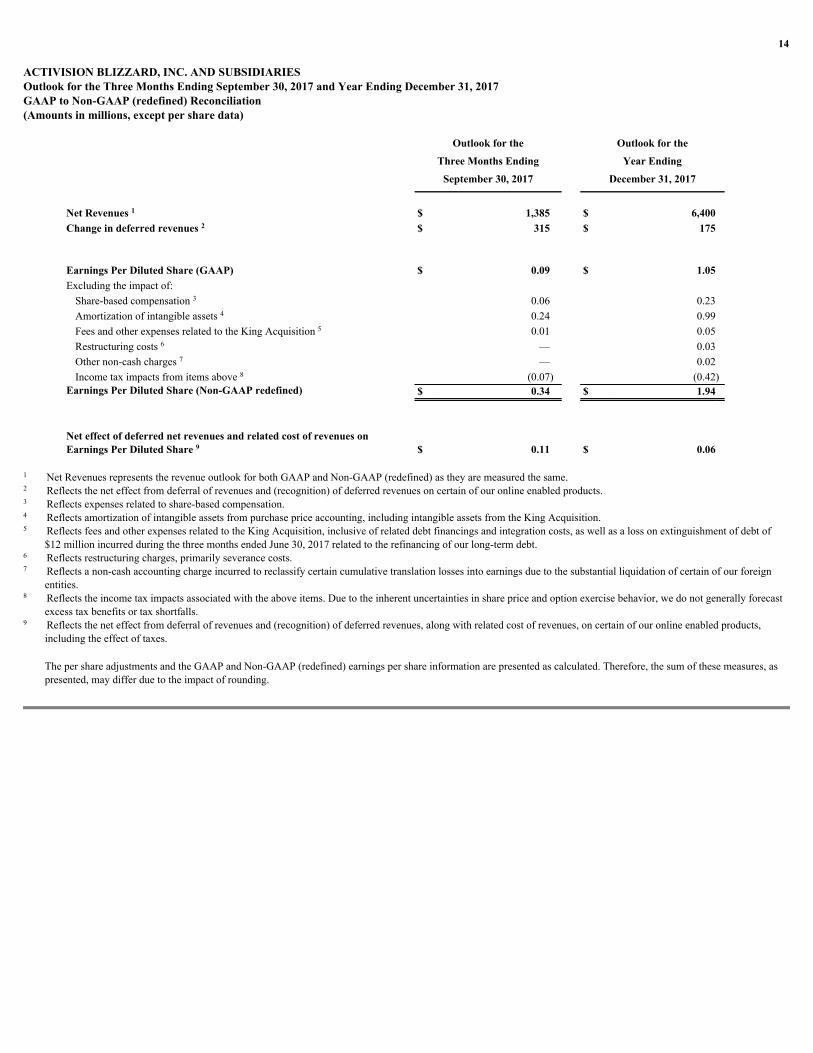
ACTIVISION BLIZZARD, INC. AND SUBSIDIARIESOutlook for the Three Months Ending September 30, 2017 and Year Ending December 31, 2017GAAP to Non-GAAP (redefined) Reconciliation(Amounts in millions, except per share data)
Outlook for the
Outlook for the
Three Months Ending
Year Ending
September 30, 2017
December 31, 2017
Net Revenues
$ 1,385
$ 6,400
Change in deferred revenues
$ 315
$ 175
Earnings Per Diluted Share (GAAP)
$ 0.09
$ 1.05
Excludingtheimpactof:
Share-basedcompensation
0.06
0.23
Amortizationofintangibleassets
0.24
0.99
FeesandotherexpensesrelatedtotheKingAcquisition
0.01
0.05
Restructuringcosts
—
0.03
Othernon-cashcharges
—
0.02
Incometaximpactsfromitemsabove
(0.07)
(0.42)Earnings Per Diluted Share (Non-GAAP redefined)
$ 0.34
$ 1.94
Net effect of deferred net revenues and related cost of revenues onEarnings Per Diluted Share
$ 0.11
$ 0.06
NetRevenuesrepresentstherevenueoutlookforbothGAAPandNon-GAAP(redefined)astheyaremeasuredthesame.Reflectstheneteffectfromdeferralofrevenuesand(recognition)ofdeferredrevenuesoncertainofouronlineenabledproducts.Reflectsexpensesrelatedtoshare-basedcompensation.Reflectsamortizationofintangibleassetsfrompurchasepriceaccounting,includingintangibleassetsfromtheKingAcquisition.ReflectsfeesandotherexpensesrelatedtotheKingAcquisition,inclusiveofrelateddebtfinancingsandintegrationcosts,aswellasalossonextinguishmentofdebtof
$12millionincurredduringthethreemonthsendedJune30,2017relatedtotherefinancingofourlong-termdebt.Reflectsrestructuringcharges,primarilyseverancecosts.Reflectsanon-cashaccountingchargeincurredtoreclassifycertaincumulativetranslationlossesintoearningsduetothesubstantialliquidationofcertainofourforeign
entities.Reflectstheincometaximpactsassociatedwiththeaboveitems.Duetotheinherentuncertaintiesinsharepriceandoptionexercisebehavior,wedonotgenerallyforecast
excesstaxbenefitsortaxshortfalls.Reflectstheneteffectfromdeferralofrevenuesand(recognition)ofdeferredrevenues,alongwithrelatedcostofrevenues,oncertainofouronlineenabledproducts,
includingtheeffectoftaxes.
ThepershareadjustmentsandtheGAAPandNon-GAAP(redefined)earningspershareinformationarepresentedascalculated.Therefore,thesumofthesemeasures,aspresented,maydifferduetotheimpactofrounding.
1
2
3
4
5
6
7
8
9
1
2
3
4
5
6
7
8
9


![Presentazione standard di PowerPoint08.07.2019]Corpor… · Activision Blizzard products V-Valley Iberian S.L.U. IT & CE Distributor (Spain) Vinzeo Technologies S.A.U. Celly Pacific](https://img.pdfslide.us/doc/110x75/5f04ba2e7e708231d40f6782/presentazione-standard-di-powerpoint-08072019corpor-activision-blizzard-products.jpg)