Embed Size (px)
Citation preview

© 2020 Chevron. All rights reserved.
First quarter 2020 earnings conference call
and webcastMike Wirth
Chairman and Chief Executive Officer
Pierre Breber
Vice President and Chief Financial Officer
Wayne Borduin
General Manager, Investor Relations
May 1, 2020

2© 2020 Chevron
Cautionary statement
This presentation contains forward-looking statements relating to Chevron's operations that are based on management's current expectations, estimates and projections about the petroleum, chemicals and
other energy-related industries. Words or phrases such as “anticipates,” “expects,” “intends,” “plans,” “targets,” “forecasts,” “projects,” “believes,” “seeks,” “schedules,” “estimates,” “positions,” “pursues,” “may,”
“could,” “should,” “will,” “budgets,” “outlook,” “trends,” “guidance,” “focus,” “on schedule,” “on track,” “is slated,” “goals,” “objectives,” “strategies,” “opportunities,” “poised” “potential” and similar expressions are
intended to identify such forward-looking statements. These statements are not guarantees of future performance and are subject to certain risks, uncertainties and other factors, many of which are beyond the
company's control and are difficult to predict. Therefore, actual outcomes and results may differ materially from what is expressed or forecasted in such forward-looking statements. The reader should not place
undue reliance on these forward-looking statements, which speak only as of the date of this news release. Unless legally required, Chevron undertakes no obligation to update publicly any forward-looking
statements, whether as a result of new information, future events or otherwise.
Among the important factors that could cause actual results to differ materially from those in the forward-looking statements are: changing crude oil and natural gas prices and demand for our products; crude oil
production quotas or other actions that might be imposed by the Organization of Petroleum Exporting Countries and other producing countries; public health crises, such as pandemics (including coronavirus
(COVID-19)) and epidemics, and any related government policies and actions; changing economic, regulatory and political environments in the various countries in which the company operates; general
domestic and international economic and political conditions; changing refining, marketing and chemicals margins; the company's ability to realize anticipated cost savings, expenditure reductions and
efficiencies associated with enterprise transformation initiatives; actions of competitors or regulators; timing of exploration expenses; timing of crude oil liftings; the competitiveness of alternate-energy sources or
product substitutes; technological developments; the results of operations and financial condition of the company's suppliers, vendors, partners and equity affiliates, particularly during extended periods of low
prices for crude oil and natural gas during the COVID-19 pandemic; the inability or failure of the company's joint-venture partners to fund their share of operations and development activities; the potential failure
to achieve expected net production from existing and future crude oil and natural gas development projects; potential delays in the development, construction or start-up of planned projects; the potential
disruption or interruption of the company's operations due to war, accidents, political events, civil unrest, severe weather, cyber threats, terrorist acts, or other natural or human causes beyond the company's
control; the potential liability for remedial actions or assessments under existing or future environmental regulations and litigation; significant operational, investment or product changes required by existing or
future environmental statutes and regulations, including international agreements and national or regional legislation and regulatory measures to limit or reduce greenhouse gas emissions; the potential liability
resulting from pending or future litigation; the company's future acquisitions or dispositions of assets or shares or the delay or failure of such transactions to close based on required closing conditions; the
potential for gains and losses from asset dispositions or impairments; government-mandated sales, divestitures, recapitalizations, industry-specific taxes, tariffs, sanctions, changes in fiscal terms or restrictions
on scope of company operations; foreign currency movements compared with the U.S. dollar; material reductions in corporate liquidity and access to debt markets; the receipt of required Board authorizations to
pay future dividends; the effects of changed accounting rules under generally accepted accounting principles promulgated by rule-setting bodies; the company's ability to identify and mitigate the risks and
hazards inherent in operating in the global energy industry; and the factors set forth under the heading “Risk Factors” on pages 18 through 21 of the company's 2019 Annual Report on Form 10-K and in
subsequent filings with the U.S. Securities and Exchange Commission. Other unpredictable or unknown factors not discussed in this news release could also have material adverse effects on forward-looking
statements.
As used in this presentation, the term “Chevron” and such terms as “the company,” “the corporation,” “our,” “we,” “us” and “its” may refer to Chevron Corporation, one or more of its consolidated subsidiaries, or
to all of them taken as a whole. All of these terms are used for convenience only and are not intended as a precise description of any of the separate companies, each of which manages its own affairs.
This presentation is meant to be read in conjunction with the First Quarter 2020 Transcript posted on chevron.com under the headings “Investors,” “Events & Presentations.”
CAUTIONARY STATEMENTS RELEVANT TO FORWARD-LOOKING INFORMATION
FOR THE PURPOSE OF “SAFE HARBOR” PROVISIONS OF THE PRIVATE SECURITIES LITIGATION REFORM ACT OF 1995

3© 2020 Chevron
Actions in response to current conditions
Maintain safe and reliable operations
Reduce short-cycle capital
Drive operating costs savings
Guard balance sheet
Preserve long-term value

4© 2020 Chevron
Maintain safe and reliable operationsStatus update May 1, 2020
People
<50 confirmed employee cases
Testing capability ramping up
$12MM+ to support humanitarian efforts
Downstream
Demand decrease: jet ~75%, mogas ~50%,
diesel ~25%, petchem ~0%
Refinery crude utilization ~60% in April
Turnarounds re-optimized
Upstream
100% April LNG contract
cargoes delivered
Rigs down ~60% to 20 in 2Q
~200-300 MBOED curtailed in May
Supply Chain
No major disruptions to operations
Monitoring supplier financial health
Collaborative engagement with suppliers

5© 2020 Chevron
TCO FGP-WPMPStatus update May 1, 2020
Overall progress 77%, construction 56%
Final 7 modules expected to depart Korea in 2Q
Demobilization of non-critical path project personnel
2020 capital reduced by ~$1B (CVX Share)
Expect some degree of impact to cost and schedule
due to COVID-19

6© 2020 Chevron
Reduce short-cycle capital
Capital & exploratory expenditures$ billions
$16
$20
2H run rate up to 40% below budget
Deferring short-cycle investments
Prioritizing capital that preserves
long-term value
$14
2020
budget
March 24th
guidance
May 1st
guidance
UnconventionalsUpstream
Base
Upstream Projects
& Exploration
Downstream, Chemicals
& Other

7© 2020 Chevron
Drive operating cost savings
$1B savings in 2020
Lower activity levels and turnarounds
Lower fuel and currency effects
Response to market conditions SAM20 guidance
Additional $1B run-rate reduction by YE2020
Organizational design complete 2Q
Staffing decisions 3Q

8© 2020 Chevron
Guard balance sheet resilient at $30 Brent
Net debt ratio and debt capacityStress test at $30 Brent (2020 - 2021)1
$ billions
Sources ofcash
Dividends CapitalProgram
Buybacks
Cash
capex
CFFO
Asset sales
& other
Debt
TCO
financing
0%
10%
20%
30%
40%
-30 -15 0 15 30
Net
debt
ratio
2
Incremental debt to 25% net debt ratio ($B)
2 Net debt ratio as of year end 2019. All figures are based on published
financial reports for each company. Refer to Chevron’s 2019 Form 10-K for
reconciliation of Chevron’s net debt ratio.
Suspend
share repurchase program
Minimize
pull on the balance sheet
Flex down
short-cycle capital
Protect
the dividend
1 Excludes working capital. Assumes $30/bbl Brent for 2020 and 2021, and
Downstream & Chemicals margins remain weak in 2020 and recover in 2021.
Competitors: BP, RDS, TOT, XOM

9© 2020 Chevron
Preserve long-term value
Capabilities
Preserve ability to ramp-up short-cycle investments
Continue explorationin proven basins
Opportunities
Pace pre-FID projectsacross the portfolio
Defershort-cycle investments
Assets
Maintain spend on asset integrity and reliability
Complete projectsalready under construction
Sustainability
Maintain commitmentto ESG priorities
Continue approachto energy transition
10© 2020 Chevron
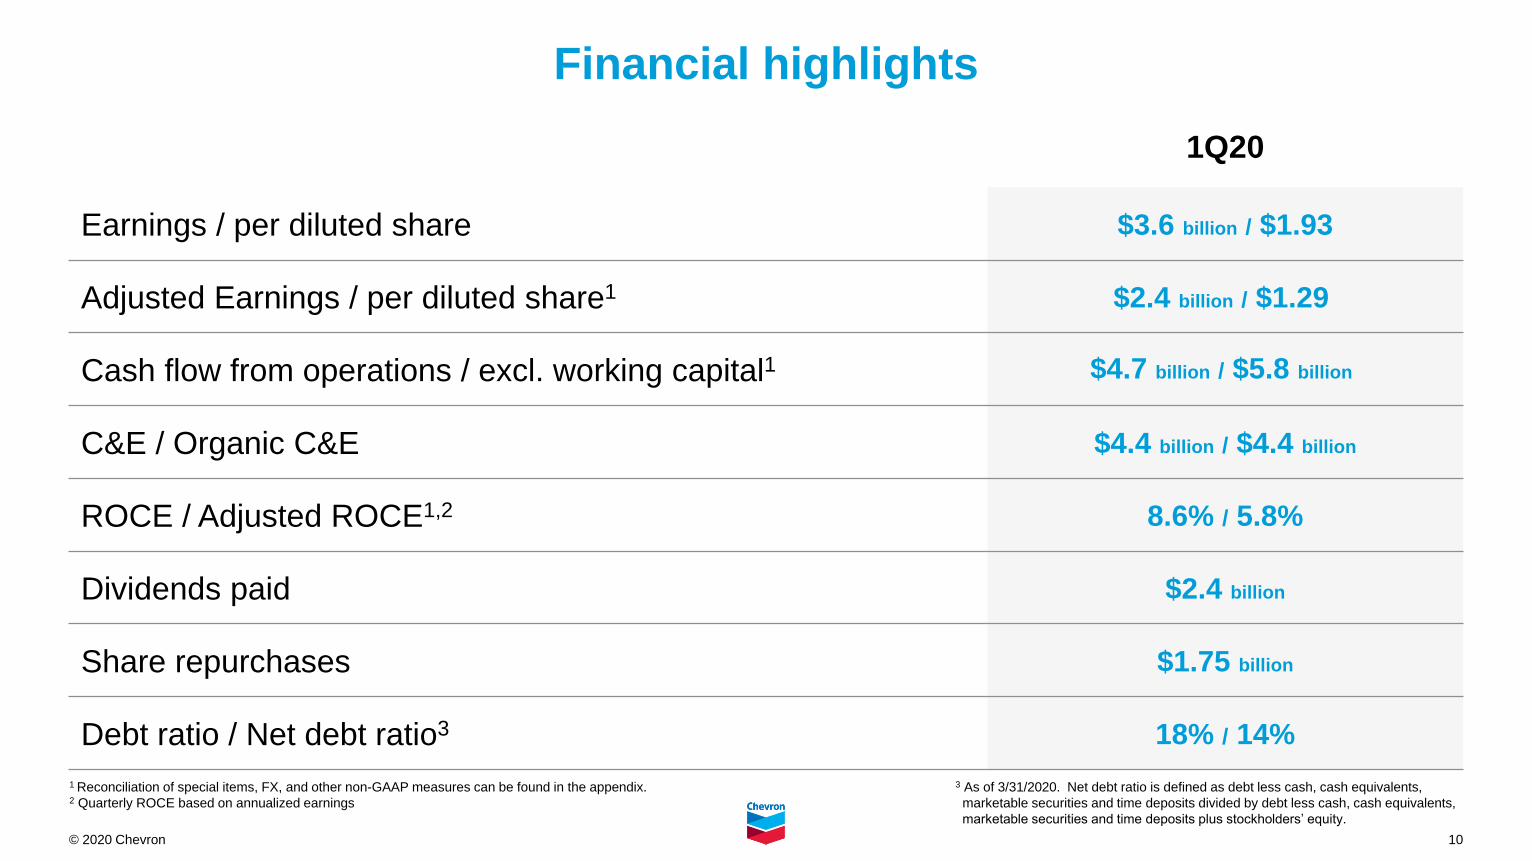
Financial highlights
1 Reconciliation of special items, FX, and other non-GAAP measures can be found in the appendix.2 Quarterly ROCE based on annualized earnings
1Q20
Earnings / per diluted share $3.6 billion / $1.93
Adjusted Earnings / per diluted share1 $2.4 billion / $1.29
Cash flow from operations / excl. working capital1 $4.7 billion / $5.8 billion
C&E / Organic C&E $4.4 billion / $4.4 billion
ROCE / Adjusted ROCE1,2 8.6% / 5.8%
Dividends paid $2.4 billion
Share repurchases $1.75 billion
Debt ratio / Net debt ratio3 18% / 14%
3 As of 3/31/2020. Net debt ratio is defined as debt less cash, cash equivalents,
marketable securities and time deposits divided by debt less cash, cash equivalents,
marketable securities and time deposits plus stockholders’ equity.
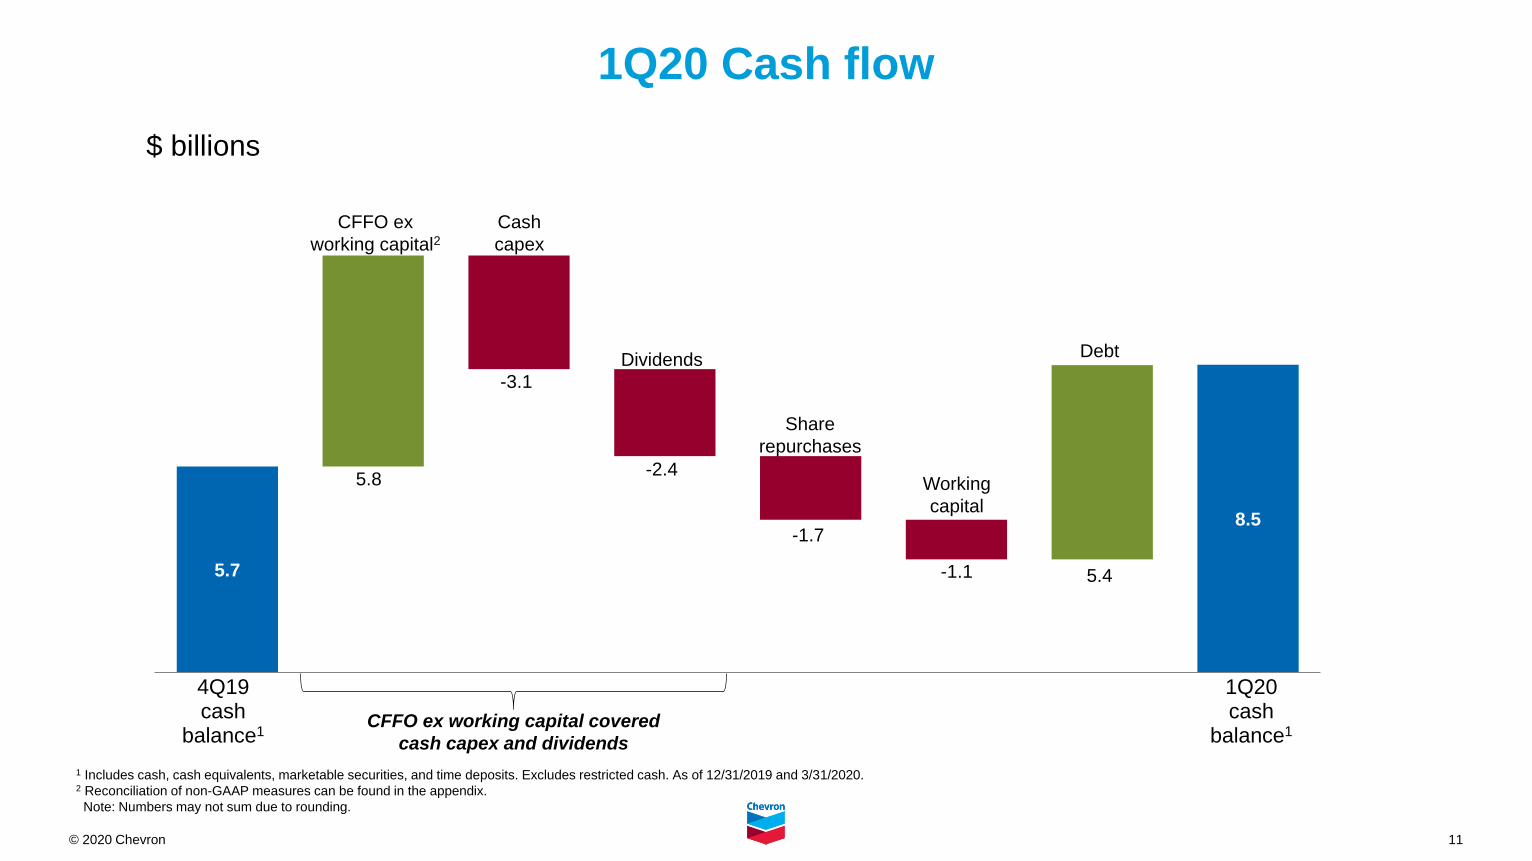
11© 2020 Chevron
1Q20 Cash flow
5.7
8.5
4Q19cash
balance1
1Q20cash
balance1
CFFO ex
working capital2Cash
capex
DebtDividends
Share
repurchases
$ billions
5.8
-3.1
5.4
-2.4
-1.7
1 Includes cash, cash equivalents, marketable securities, and time deposits. Excludes restricted cash. As of 12/31/2019 and 3/31/2020.2 Reconciliation of non-GAAP measures can be found in the appendix.
Note: Numbers may not sum due to rounding.
-1.1
Working
capital
CFFO ex working capital covered
cash capex and dividends

12© 2020 Chevron
Chevron earnings1Q20 vs. 1Q19
* Reconciliation of special items and FX can be found in the appendix.
2,649
3,599
Special
items*
FX*
Liftings
Upstream
651
470-1,755
316
Realizations
Other
Other
$ millions
680
1Q19earnings
1Q20earnings
435
Margin
670
Opex
-200
Timing
effects
Downstream Other
Other
-83DD&A
-24-210

13© 2020 Chevron
Chevron earnings1Q20 vs. 4Q19
-6,610
3,599
Special
items*
FX*
Liftings770
270-1,440300
140
RealizationsOther
Opex
$ millions
9,830
4Q19earnings
1Q20earnings
Timing
effects
-95
Opex
175
Volume
360
Upstream Downstream Other
-101
Other
* Reconciliation of special items and FX can be found in the appendix.

14© 2020 Chevron
3,038
3,235
MBOED
1Q19 1Q20
Entitlement
effects
Other
+ Permian growth
+ Entitlement effects
- U.K., Denmark and Frade asset sales
Worldwide net oil & gas production 1Q20 vs. 1Q19
Shale &
tight
Asset
sales*
$63/bbl
Brent
$50/bbl
Brent
Base
* Includes impact of 2019 and 2020 asset sales on 2020 production.
Note: Numbers may not sum due to rounding.
MCPs
Turnarounds/
downtime
2721
-41
-95 5
51
229

15© 2020 Chevron
Asset sales program nearing completion
aa
* Excludes returns of investment as presented in Statement of Cash Flows.
5
10
2020
Appalachia natural gas
Colombia natural gas
Azerbaijan
Philippines upstream
2018 - 2019
~$1.75BApril YTD
Asset sale proceeds*$ billions (before-tax)

16© 2020 Chevron
Strong liquidity position
Reaffirmed AAcredit rating
Modestdebt maturity horizon
Ample accessto debt markets
* Cash includes cash, cash equivalents, marketable securities, and time deposits; excludes restricted cash.
Commercial paper is based on estimated readily available incremental capacity.
Long-term debt maturities$ billions
2
Sources of liquidity*
$ billions
$9
$12
$10
Cash Commercial Paper Revolver
-
1
2
3
4
2Q20 3Q20 4Q20 1Q21 2Q21 3Q21 4Q21
$30+

17© 2020 Chevron
Net production roughly flat with 2019
(excl. asset sales, curtailments, & entitlement price effect)
TCO co-lending: ~$2.5B
Permian production exit rate 125 MBOED below
(excl. curtailments): SAM guidance
Looking ahead
Distributions less affiliate income: <$(1)B
B/T asset sales proceeds: ~$2B
Sensitivities ($30/bbl Brent):
$450 – $500MM A/T cash flow per $1 change in Brent
$400MM A/T earnings per $1 change in Brent
~20 MBOED change per $10 change in Brent due to
entitlement price effect
2Q2020 outlook Full-year 2020 outlook
Upstream
Downstream
Corporate
Turnarounds: ~(70) MBOED
April curtailment: ~(80) MBOED
May curtailment: ~(200) – (300) MBOED
June curtailment: ~(200) – (400) MBOED
Refinery turnarounds: $(200) – (300)MM A/T earnings

18© 2020 Chevron
questions
answers
19© 2020 Chevron
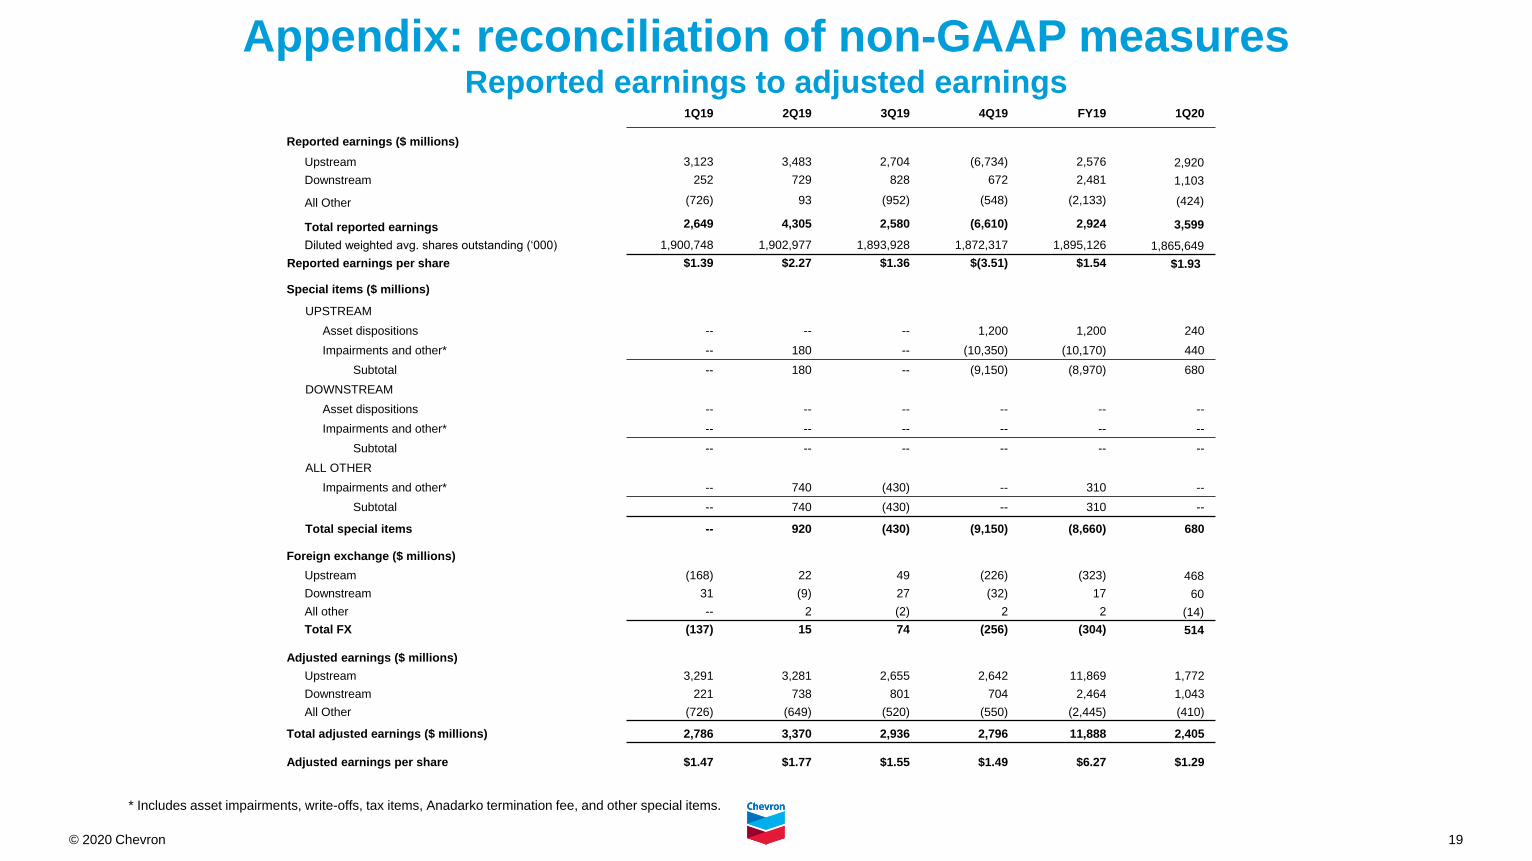
Appendix: reconciliation of non-GAAP measures Reported earnings to adjusted earnings
1Q19 2Q19 3Q19 4Q19 FY19 1Q20
Reported earnings ($ millions)
Upstream 3,123 3,483 2,704 (6,734) 2,576 2,920
Downstream 252 729 828 672 2,481 1,103
All Other (726) 93 (952) (548) (2,133) (424)
Total reported earnings 2,649 4,305 2,580 (6,610) 2,924 3,599
Diluted weighted avg. shares outstanding (‘000) 1,900,748 1,902,977 1,893,928 1,872,317 1,895,126 1,865,649
Reported earnings per share $1.39 $2.27 $1.36 $(3.51) $1.54 $1.93
Special items ($ millions)
UPSTREAM
Asset dispositions -- -- -- 1,200 1,200 240
Impairments and other* -- 180 -- (10,350) (10,170) 440
Subtotal -- 180 -- (9,150) (8,970) 680
DOWNSTREAM
Asset dispositions -- -- -- -- -- --
Impairments and other* -- -- -- -- -- --
Subtotal -- -- -- -- -- --
ALL OTHER
Impairments and other* -- 740 (430) -- 310 --
Subtotal -- 740 (430) -- 310 --
Total special items -- 920 (430) (9,150) (8,660) 680
Foreign exchange ($ millions)
Upstream (168) 22 49 (226) (323) 468
Downstream 31 (9) 27 (32) 17 60
All other -- 2 (2) 2 2 (14)
Total FX (137) 15 74 (256) (304) 514
Adjusted earnings ($ millions)
Upstream 3,291 3,281 2,655 2,642 11,869 1,772
Downstream 221 738 801 704 2,464 1,043
All Other (726) (649) (520) (550) (2,445) (410)
Total adjusted earnings ($ millions) 2,786 3,370 2,936 2,796 11,888 2,405
Adjusted earnings per share $1.47 $1.77 $1.55 $1.49 $6.27 $1.29
* Includes asset impairments, write-offs, tax items, Anadarko termination fee, and other special items.

20© 2020 Chevron
Appendix: reconciliation of non-GAAP measures Cash flow from operations excluding working capital
$ millions1Q20
Net Cash Provided by Operating Activities 4,722
Net Decrease (Increase) in Operating Working Capital (1,096)
Cash Flow from Operations Excluding Working Capital 5,818
Note: Numbers may not sum due to rounding.

21© 2020 Chevron
Appendix: reconciliation of non-GAAP measures ROCE
Adjusted ROCE
$ millions
1Q20
Adjusted earnings 2,405
Non-controlling interest (18)
Interest expense (A/T) 154
Adjusted ROCE earnings1 2,541
Annualized adjusted ROCE earnings110,164
Average capital employed2 174,723
Adjusted ROCE1,2 5.8%
1 ROCE earnings and adjusted ROCE earnings are annualized to calculate ROCE and adjusted ROCE for the quarter.2 Capital employed is the sum of Chevron Corporation stockholders’ equity, total debt and noncontrolling interests. Average capital employed is computed by averaging the capital employed at the beginning and the end of the quarter.
Note: Numbers may not sum due to rounding.
$ millions
1Q20
Total reported earnings 3,599
Non-controlling interest (18)
Interest expense (A/T) 154
ROCE earnings1 3,735
Annualized ROCE earnings1 14,940
Average capital employed2 174,723
ROCE1,2 8.6%

22© 2020 Chevron
3,078
3,235
MBOED
4Q19 1Q20
Entitlement
effects
+ Absence of turnarounds
+ Permian growth
- U.K. asset sales
Worldwide net oil & gas production 1Q20 vs. 4Q19
Shale &
tight
Asset
sales*
$63/bbl
Brent
$50/bbl
Brent
Turnarounds/
downtime
Base
* Includes impact of 2019 and 2020 asset sales on 2020 production.
Note: Numbers may not sum due to rounding.
Other
82
72
16
12
-30 5

23© 2020 Chevron
-7,465
241
• Primarily absence of impairments
associated with Appalachia and Big
Foot in 4Q19
• Lower crude realizations
• Higher Permian production
4Q19 earnings
1Q20 earnings
$ millions
8,170
Absence of
special items Realizations Opex/
other
80-560
Appendix U.S. upstream earnings: 1Q20 vs. 4Q19
Liftings
16

24© 2020 Chevron
731
2,679
• Absence of 4Q19
impairments, gain on
Malampaya asset sale, and
favorable tax items
• ~$13/bbl decrease in Brent
• Higher liftings mainly in Australia
and Nigeria
• Lower opex due to
lower turnarounds
• Favorable timing effects4Q19
earnings 1Q20
earnings
$ millions
Special
items
1,660
694
FX RealizationsTax/
other
-880
Liftings
190
Appendix International upstream earnings: 1Q20 vs. 4Q19
Opex
240
-161
Timing
effects
205

25© 2020 Chevron
AppendixU.S. downstream earnings: 1Q20 vs. 4Q19
4Q19earnings
1Q20 earnings
• Favorable timing effects
• Lower opex due to lower maintenance
activities
• Lower utilization and product demand
• Lower refining margins
$ millions
488450
Timing
effects
80
-100
-60
VolumeOpex
60 Margin
-18
Other

26© 2020 Chevron
AppendixInternational downstream earnings: 1Q20 vs. 4Q19
184
653 653
$ millions
Timing
effects
93
95
Tax/
other
FX
280
-114
Margin
1Q20 earnings
4Q19earnings
• Favorable timing effects
• Lower opex due to lower
turnarounds
• Higher marketing margins
115
Opex