Embed Size (px)
Citation preview
Chevron Corporation, Company Intelligence Report © GlobalData. This report is a licensed product and is not to be copied, reproduced, shared or resold in any form.
REFERENCE CODE GDGE0674V | PUBLICATION DATE SEPTEMBER 2014
CHEVRON CORPORATION, COMPANY INTELLIGENCE REPORT
Chevron Corporation, Company Intelligence Report 2 © GlobalData. This report is a licensed product and is not to be copied, reproduced, shared or resold in any form.
CHEVRON CORPORATION, COMPANY INTELLIGENCE REPORT
Executive Summary
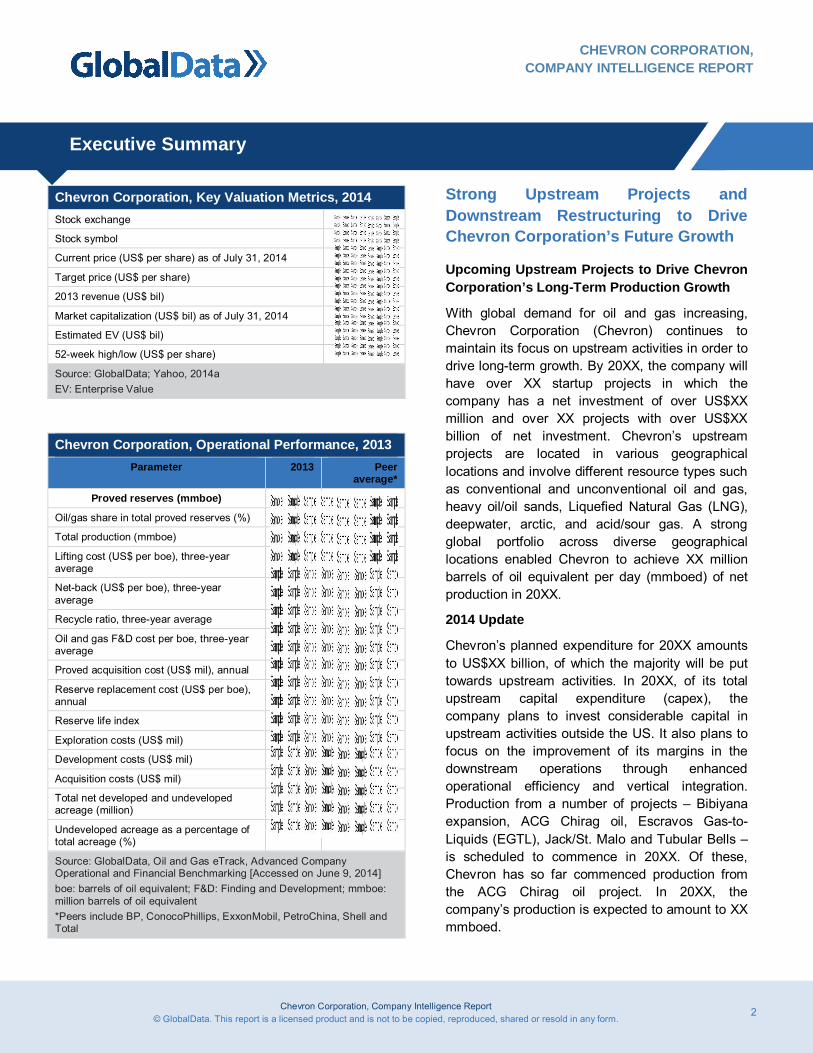
Chevron Corporation, Key Valuation Metrics, 2014 Stock exchange NYSE
Stock symbol CVX
Current price (US$ per share) as of July 31, 2014 128.15
Target price (US$ per share) 134.40
2013 revenue (US$ bil) 220.16
Market capitalization (US$ bil) as of July 31, 2014 245.42
Estimated EV (US$ bil) 264.35
52-week high/low (US$ per share) 133.7 /106.7
Source: GlobalData; Yahoo, 2014a EV: Enterprise Value
Chevron Corporation, Operational Performance, 2013 Parameter 2013 Peer
average*
Proved reserves (mmboe) 11,202.7 16,570.6
Oil/gas share in total proved reserves (%) 56.64 53.1
Total production (mmboe) 947.7 1,100.2
Lifting cost (US$ per boe), three-year average
16.5 20.1
Net-back (US$ per boe), three-year average
59.6 47.4
Recycle ratio, three-year average 2.2 2.2
Oil and gas F&D cost per boe, three-year average
25.11 24.2
Proved acquisition cost (US$ mil), annual 162 806
Reserve replacement cost (US$ per boe), annual
41.38 20.42
Reserve life index 11.8 14.5
Exploration costs (US$ mil) 3,186 4,954
Development costs (US$ mil) 27,447.0 23,126.3
Acquisition costs (US$ mil) 2,872.0 3,173.7
Total net developed and undeveloped acreage (million)
70.87 91.60
Undeveloped acreage as a percentage of total acreage (%)
89 79
Source: GlobalData, Oil and Gas eTrack, Advanced Company Operational and Financial Benchmarking [Accessed on June 9, 2014] boe: barrels of oil equivalent; F&D: Finding and Development; mmboe: million barrels of oil equivalent *Peers include BP, ConocoPhillips, ExxonMobil, PetroChina, Shell and Total
Strong Upstream Projects and Downstream Restructuring to Drive Chevron Corporation’s Future Growth
Upcoming Upstream Projects to Drive Chevron Corporation’s Long-Term Production Growth
With global demand for oil and gas increasing, Chevron Corporation (Chevron) continues to maintain its focus on upstream activities in order to drive long-term growth. By 20XX, the company will have over XX startup projects in which the company has a net investment of over US$XX million and over XX projects with over US$XX billion of net investment. Chevron’s upstream projects are located in various geographical locations and involve different resource types such as conventional and unconventional oil and gas, heavy oil/oil sands, Liquefied Natural Gas (LNG), deepwater, arctic, and acid/sour gas. A strong global portfolio across diverse geographical locations enabled Chevron to achieve XX million barrels of oil equivalent per day (mmboed) of net production in 20XX.
2014 Update
Chevron’s planned expenditure for 20XX amounts to US$XX billion, of which the majority will be put towards upstream activities. In 20XX, of its total upstream capital expenditure (capex), the company plans to invest considerable capital in upstream activities outside the US. It also plans to focus on the improvement of its margins in the downstream operations through enhanced operational efficiency and vertical integration. Production from a number of projects – Bibiyana expansion, ACG Chirag oil, Escravos Gas-to-Liquids (EGTL), Jack/St. Malo and Tubular Bells – is scheduled to commence in 20XX. Of these, Chevron has so far commenced production from the ACG Chirag oil project. In 20XX, the company’s production is expected to amount to XX mmboed.
Chevron Corporation, Company Intelligence Report 3 © GlobalData. This report is a licensed product and is not to be copied, reproduced, shared or resold in any form.
CHEVRON CORPORATION, COMPANY INTELLIGENCE REPORT
Executive Summary
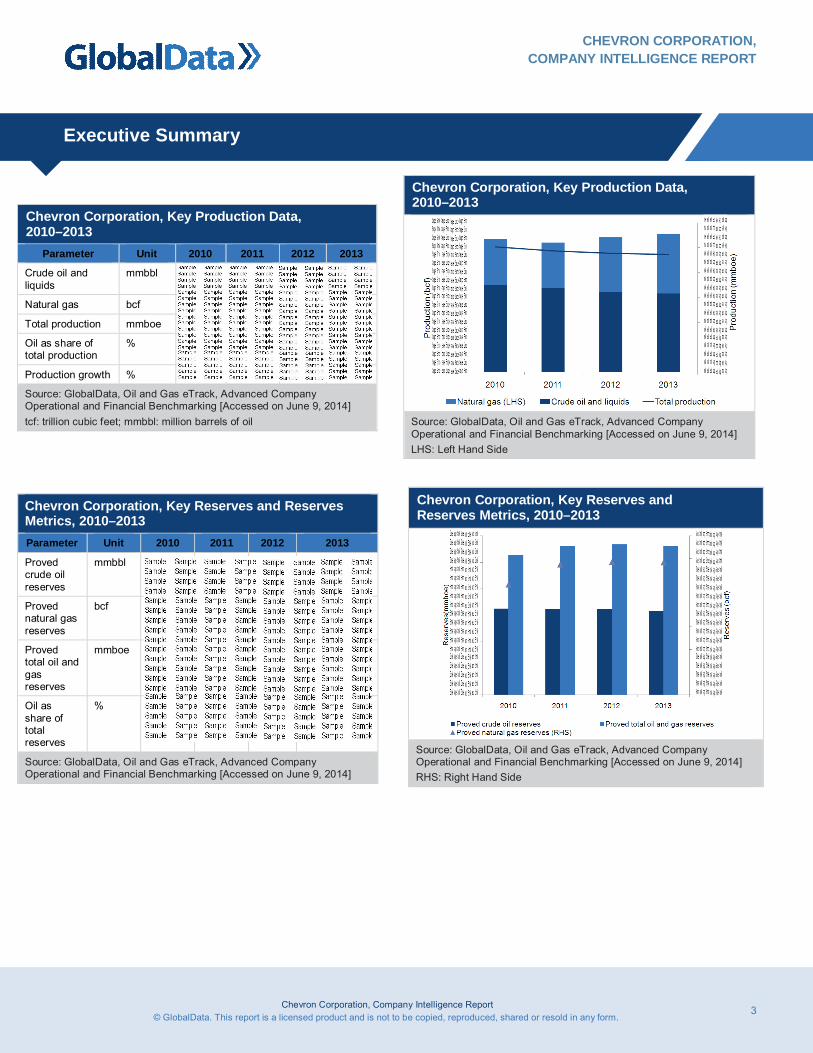
Chevron Corporation, Key Production Data, 2010–2013
Parameter Unit 2010 2011 2012 2013
Crude oil and liquids
mmbbl 702 676 646 632
Natural gas bcf 1,839 1,805 1,857 1,895
Total production mmboe 1,008 975 955 948
Oil as share of total production
% 70 69 68 67
Production growth % - (3) (2) (1)
Source: GlobalData, Oil and Gas eTrack, Advanced Company Operational and Financial Benchmarking [Accessed on June 9, 2014] tcf: trillion cubic feet; mmbbl: million barrels of oil
Chevron Corporation, Key Reserves and Reserves Metrics, 2010–2013 Parameter Unit 2010 2011 2012 2013
Proved crude oil reserves
mmbbl 6,503 6,455 6,481 6,345
Proved natural gas reserves
bcf 24,251 28,683 29,195 29,146
Proved total oil and gas reserves
mmboe 10,545 11,236 11,347 11,203
Oil as share of total reserves
% 62 57 57 57
Source: GlobalData, Oil and Gas eTrack, Advanced Company Operational and Financial Benchmarking [Accessed on June 9, 2014]
Chevron Corporation, Key Production Data, 2010–2013
Source: GlobalData, Oil and Gas eTrack, Advanced Company Operational and Financial Benchmarking [Accessed on June 9, 2014] LHS: Left Hand Side
Chevron Corporation, Key Reserves and Reserves Metrics, 2010–2013
Source: GlobalData, Oil and Gas eTrack, Advanced Company Operational and Financial Benchmarking [Accessed on June 9, 2014] RHS: Right Hand Side
Chevron Corporation, Company Intelligence Report 4 © GlobalData. This report is a licensed product and is not to be copied, reproduced, shared or resold in any form.
CHEVRON CORPORATION, COMPANY INTELLIGENCE REPORT
Executive Summary
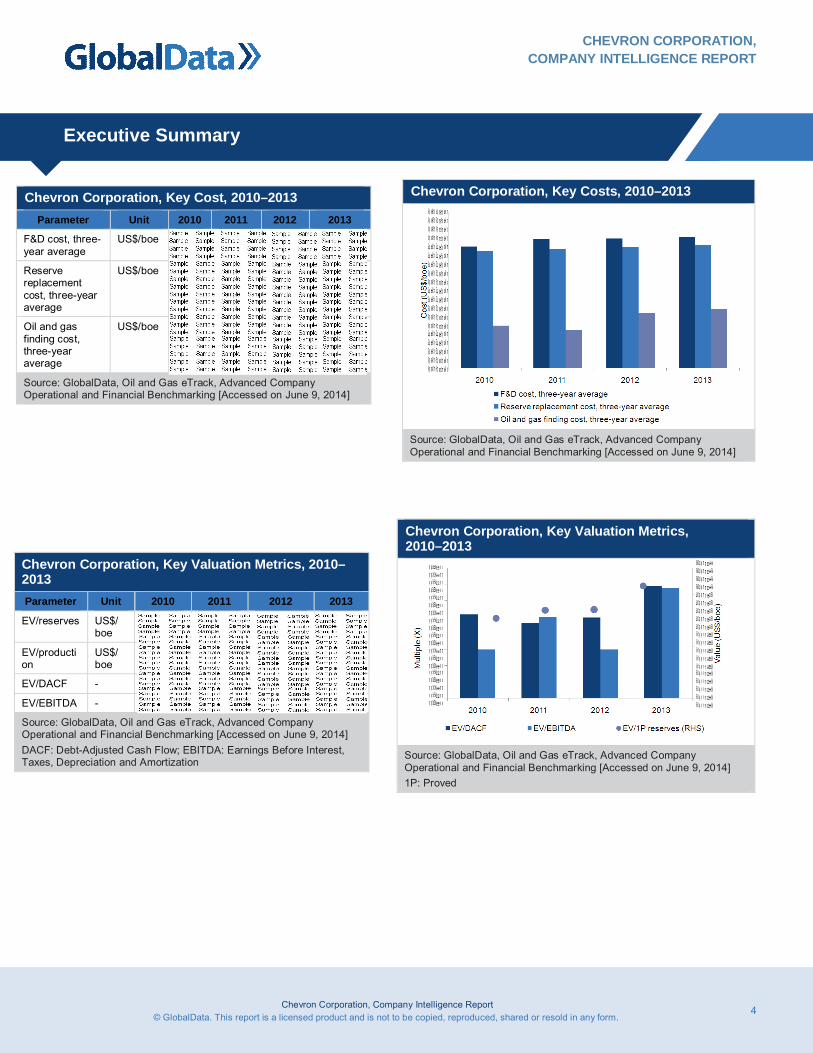
Chevron Corporation, Key Cost, 2010–2013
Parameter Unit 2010 2011 2012 2013
F&D cost, three-year average
US$/boe 23.3 24.7 24.8 25.1
Reserve replacement cost, three-year average
US$/boe
22.5 22.8 23.2 23.6
Oil and gas finding cost, three-year average
US$/boe
8.1 7.3 10.6 11.4
Source: GlobalData, Oil and Gas eTrack, Advanced Company Operational and Financial Benchmarking [Accessed on June 9, 2014]
Chevron Corporation, Key Costs, 2010–2013
Source: GlobalData, Oil and Gas eTrack, Advanced Company Operational and Financial Benchmarking [Accessed on June 9, 2014]
Chevron Corporation, Key Valuation Metrics, 2010–2013 Parameter Unit 2010 2011 2012 2013
EV/reserves US$/ boe
15.4 16.9 17.0 21.5
EV/production
US$/ boe
58,729.8 71,082.5 74,056.1 92,865.3
EV/DACF - 5.2 4.6 5.0 6.9
EV/EBITDA - 3.0 5.0 3.0 6.8
Source: GlobalData, Oil and Gas eTrack, Advanced Company Operational and Financial Benchmarking [Accessed on June 9, 2014] DACF: Debt-Adjusted Cash Flow; EBITDA: Earnings Before Interest, Taxes, Depreciation and Amortization
Chevron Corporation, Key Valuation Metrics, 2010–2013
Source: GlobalData, Oil and Gas eTrack, Advanced Company Operational and Financial Benchmarking [Accessed on June 9, 2014] 1P: Proved
Chevron Corporation, Company Intelligence Report 5 © GlobalData. This report is a licensed product and is not to be copied, reproduced, shared or resold in any form.
CHEVRON CORPORATION, COMPANY INTELLIGENCE REPORT
Executive Summary
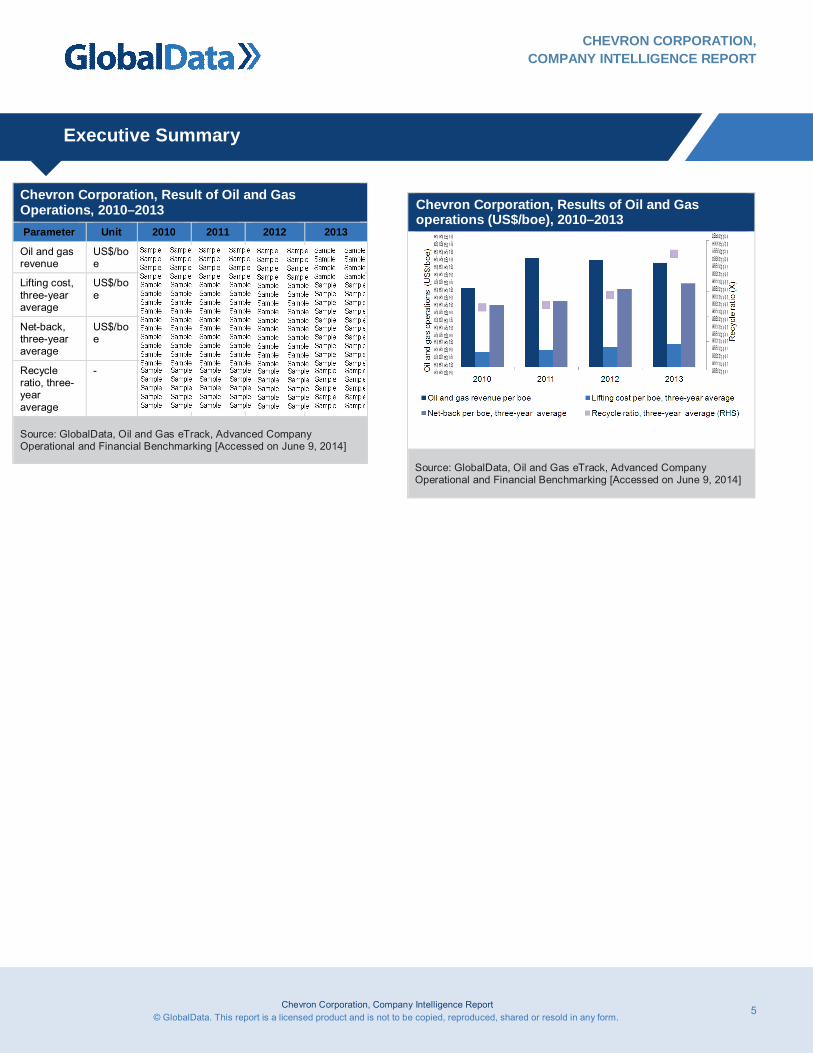
Chevron Corporation, Result of Oil and Gas Operations, 2010–2013 Parameter Unit 2010 2011 2012 2013
Oil and gas revenue
US$/boe
56.3 77.7 76.2 74.3
Lifting cost, three-year average
US$/boe
10.8 12.1 14.4 16.5
Net-back, three-year average
US$/boe
43.9 47.0 55.5 59.6
Recycle ratio, three-year average
- 1.2 1.2 1.4 2.2
Source: GlobalData, Oil and Gas eTrack, Advanced Company Operational and Financial Benchmarking [Accessed on June 9, 2014]
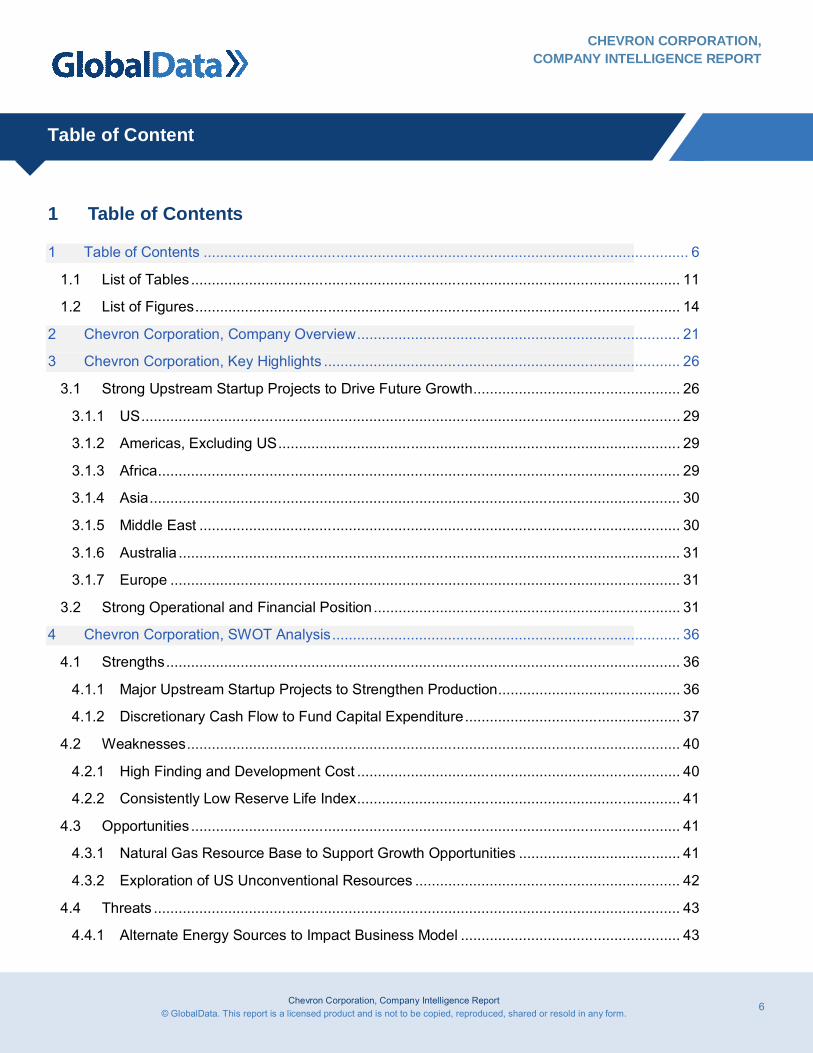
Chevron Corporation, Results of Oil and Gas operations (US$/boe), 2010–2013
Source: GlobalData, Oil and Gas eTrack, Advanced Company Operational and Financial Benchmarking [Accessed on June 9, 2014]
Chevron Corporation, Company Intelligence Report 6 © GlobalData. This report is a licensed product and is not to be copied, reproduced, shared or resold in any form.
CHEVRON CORPORATION, COMPANY INTELLIGENCE REPORT
Table of Content
1 Table of Contents
1 Table of Contents ..................................................................................................................... 6
1.1 List of Tables ...................................................................................................................... 11
1.2 List of Figures ..................................................................................................................... 14
2 Chevron Corporation, Company Overview .............................................................................. 21
3 Chevron Corporation, Key Highlights ...................................................................................... 26
3.1 Strong Upstream Startup Projects to Drive Future Growth .................................................. 26
3.1.1 US .................................................................................................................................. 29
3.1.2 Americas, Excluding US ................................................................................................. 29
3.1.3 Africa .............................................................................................................................. 29
3.1.4 Asia ................................................................................................................................ 30
3.1.5 Middle East .................................................................................................................... 30
3.1.6 Australia ......................................................................................................................... 31
3.1.7 Europe ........................................................................................................................... 31
3.2 Strong Operational and Financial Position .......................................................................... 31
4 Chevron Corporation, SWOT Analysis .................................................................................... 36
4.1 Strengths ............................................................................................................................ 36
4.1.1 Major Upstream Startup Projects to Strengthen Production ............................................ 36
4.1.2 Discretionary Cash Flow to Fund Capital Expenditure .................................................... 37
4.2 Weaknesses ....................................................................................................................... 40
4.2.1 High Finding and Development Cost .............................................................................. 40
4.2.2 Consistently Low Reserve Life Index .............................................................................. 41
4.3 Opportunities ...................................................................................................................... 41
4.3.1 Natural Gas Resource Base to Support Growth Opportunities ....................................... 41
4.3.2 Exploration of US Unconventional Resources ................................................................ 42
4.4 Threats ............................................................................................................................... 43
4.4.1 Alternate Energy Sources to Impact Business Model ..................................................... 43
Chevron Corporation, Company Intelligence Report 7 © GlobalData. This report is a licensed product and is not to be copied, reproduced, shared or resold in any form.
CHEVRON CORPORATION, COMPANY INTELLIGENCE REPORT
Table of Content
4.4.2 Operations in Politically Imbalanced Countries May Impact Operations ......................... 43
5 Chevron Corporation, Goals and Strategies ............................................................................ 44
5.1 Focus on Future Projects to Improve Production and Strengthen Legacy Positions ........... 44
5.2 Continued Focus on Downstream and Chemicals Business ............................................... 45
6 Chevron Corporation, Production Overview ............................................................................ 48
6.1 Production Profile ............................................................................................................... 48
6.2 Assets Portfolio................................................................................................................... 53
6.2.1 US .................................................................................................................................. 53
6.2.2 Americas, Excluding US ................................................................................................. 54
6.2.3 Africa .............................................................................................................................. 56
6.2.4 Asia and Middle East ...................................................................................................... 57
6.2.5 Australia ......................................................................................................................... 59
6.2.6 Europe ........................................................................................................................... 60
7 Chevron Corporation, Capital Expenditure .............................................................................. 62
7.1 Costs Incurred .................................................................................................................... 64
8 Chevron Corporation, Acreage ............................................................................................... 66
9 Chevron Corporation, Exploration and Development Overview ............................................... 71
9.1 US ...................................................................................................................................... 78
9.1.1 California ........................................................................................................................ 78
9.1.2 Gulf of Mexico ................................................................................................................ 80
9.1.3 Midcontinent ................................................................................................................... 82
9.2 Americas, Excluding US ..................................................................................................... 85
9.2.1 Canada .......................................................................................................................... 85
9.2.2 Greenland ...................................................................................................................... 87
9.2.3 Argentina ........................................................................................................................ 88
9.2.4 Brazil .............................................................................................................................. 89
9.2.5 Colombia ........................................................................................................................ 90
Chevron Corporation, Company Intelligence Report 8 © GlobalData. This report is a licensed product and is not to be copied, reproduced, shared or resold in any form.
CHEVRON CORPORATION, COMPANY INTELLIGENCE REPORT
Table of Content
9.2.6 Suriname ........................................................................................................................ 90
9.2.7 Trinidad and Tobago ...................................................................................................... 90
9.2.8 Venezuela ...................................................................................................................... 91
9.3 Africa .................................................................................................................................. 92
9.3.1 Angola ............................................................................................................................ 92
9.3.2 Nigeria............................................................................................................................ 95
9.3.3 Republic of the Congo and Democratic Republic of the Congo ...................................... 98
9.3.4 Chad/Cameroon ............................................................................................................. 98
9.3.5 Rest of Africa.................................................................................................................. 99
9.4 Asia .................................................................................................................................. 100
9.4.1 Azerbaijan .................................................................................................................... 100
9.4.2 Kazakhstan .................................................................................................................. 101
9.4.3 Bangladesh .................................................................................................................. 102
9.4.4 Cambodia and Myanmar .............................................................................................. 103
9.4.5 Thailand ....................................................................................................................... 104
9.4.6 Vietnam ........................................................................................................................ 105
9.4.7 China ........................................................................................................................... 106
9.4.8 Philippines .................................................................................................................... 107
9.4.9 Indonesia ..................................................................................................................... 108
9.5 Middle East Region .......................................................................................................... 109
9.5.1 Kurdistan Region of Iraq ............................................................................................... 109
9.5.2 Partitioned Zone ........................................................................................................... 111
9.6 Australia ........................................................................................................................... 111
9.7 Europe .............................................................................................................................. 115
9.7.1 Denmark ...................................................................................................................... 116
9.7.2 Netherlands .................................................................................................................. 117
9.7.3 Norway ......................................................................................................................... 117
Chevron Corporation, Company Intelligence Report 9 © GlobalData. This report is a licensed product and is not to be copied, reproduced, shared or resold in any form.
CHEVRON CORPORATION, COMPANY INTELLIGENCE REPORT
Table of Content
9.7.4 Lithuania ...................................................................................................................... 117
9.7.5 Poland .......................................................................................................................... 117
9.7.6 Romania ....................................................................................................................... 118
9.7.7 Ukraine......................................................................................................................... 119
9.7.8 UK ................................................................................................................................ 119
10 Chevron Corporation, Forecast Production and Financial Statements .................................. 120
10.1 Income Statement, 2011–2018 ......................................................................................... 121
10.2 Balance Sheet (2011–2018) ............................................................................................. 123
10.3 Cash Flow Statement, 2011–2018 .................................................................................... 125
11 Chevron Corporation, Valuation ............................................................................................ 127
11.1 Net Asset Value ................................................................................................................ 127
12 Chevron Corporation, Peer Comparison ............................................................................... 128
12.1 Share Price Performance ................................................................................................. 128
12.2 Operational and Financial Performance ............................................................................ 129
12.3 Key Financial and Operational Ratio................................................................................. 134
13 Chevron Corporation, Production and Reserves Trends ....................................................... 137
13.1 Total Oil and Gas, Reserves and Production .................................................................... 137
13.1.1 Total Crude Oil and Natural Gas Production and Reserves Trend, 2009-2013 ............. 137
13.1.2 Total Crude Oil & Natural Gas Production and Reserves By Country/Region, 2009-2013 .................................................................................................................... 139
13.1.3 Total Crude Oil and Natural Gas Reserve Changes, 2009-2013 .................................. 142
13.2 Crude Oil/Liquids Production and Reserve ....................................................................... 144
13.2.1 Crude Oil/Liquids Production and Reserve Trend, 2009-2013 ...................................... 144
13.2.2 Crude Oil Production and Reserves By Country/Region, 2009-2013 ............................ 145
13.2.3 Crude Oil/Liquids Reserve Changes, 2009-2013 .......................................................... 148
13.3 Natural Gas Production and Reserve ............................................................................... 149
13.3.1 Natural Gas Production and Reserve Trend, 2009-2013 .............................................. 149
13.3.2 Natural Gas Production and Reserves, By Country/Region, 2009-2013 ....................... 150
Chevron Corporation, Company Intelligence Report 10 © GlobalData. This report is a licensed product and is not to be copied, reproduced, shared or resold in any form.
CHEVRON CORPORATION, COMPANY INTELLIGENCE REPORT
Table of Content
13.3.3 Natural Gas Reserve Changes, 2009-2013 .................................................................. 153
13.4 Total Crude Oil and Natural Gas Reserves Life Index....................................................... 154
13.4.1 Total Crude Oil and Natural Gas Reserves Life Index, 2009-2013 ............................... 154
13.4.2 Total Crude Oil and Natural Gas Reserves Life Index, By Country/Region, 2009-2013 .................................................................................................................... 155
14 Chevron Corporation, E&P Costs Trends .............................................................................. 159
14.1 Allocation of the Upstream Capital Expenditure ................................................................ 159
14.1.1 Upstream Capital Expenditure, 2009-2013 ................................................................... 159
14.1.2 Acquisition Costs By Country/Region, 2009-2013 ........................................................ 161
14.1.3 Exploration and Development Costs, By Country/Region, 2009-2013 .......................... 164
14.2 Oil and Gas Cost Per boe, US$/boe ................................................................................. 167
14.2.1 Oil and Gas Cost Per boe, US$/boe, 2009-2013 .......................................................... 167
14.2.2 Oil and Gas Cost Per boe, US$/boe, By Country/Region, 2009-2013 .......................... 169
15 Chevron Corporation, Reserve Replacement Ratio ............................................................... 173
15.1 Oil and Gas Production Replacement Ratio ...................................................................... 173
15.1.1 Oil and Gas Production Replacement Ratio, 2009-2013 .............................................. 173
15.1.2 Oil and Gas Production Replacement Ratio, By Country/Region, 2009-2013 ............... 175
16 Chevron Corporation, Results of Oil & Gas Operations Trend .............................................. 183
16.1 Oil and Gas Revenue and Expenses ................................................................................ 183
16.1.1 Oil and Gas Revenue and Expenses, 2009-2013 ......................................................... 183
16.1.2 Oil and Gas Revenue and Expenses, By Country/Region, 2009-2013 ......................... 185
16.2 Oil and Gas Revenue and Expenses, Per boe .................................................................. 195
16.2.1 Oil and Gas Revenue and Expenses, By boe, 2009-2013 ............................................ 195
16.2.2 Oil and Gas Revenue and Expenses Per boe, By Country/Region, 2009-2013 ............ 196
16.3 Oil and Gas Performance Metrics ..................................................................................... 205
17 Chevron Corporation, Land Holdings and Well Data ............................................................. 206
17.1 Developed and Undeveloped Acreage ............................................................................. 206
17.1.1 Gross and Net Developed and Undeveloped Acreage, 2009-2013 ............................... 206
Chevron Corporation, Company Intelligence Report 11 © GlobalData. This report is a licensed product and is not to be copied, reproduced, shared or resold in any form.
CHEVRON CORPORATION, COMPANY INTELLIGENCE REPORT
Table of Content
17.1.2 Gross and Net Developed and Undeveloped Acreage, By Country/Region, 2009-2013 .................................................................................................................... 208
17.2 Well Statistics ................................................................................................................... 214
17.2.1 Producible Oil and Gas Well, 2009-2013 ...................................................................... 214
17.2.2 Producible Oil and Gas Well, By Country/Region, 2009-2013 ...................................... 215
17.2.3 Exploration and Development Wells Drilled, 2009-2013 ............................................... 224
17.2.4 Exploration and Development Wells Drilled, By Country/Region, 2009-2013................ 226
18 Appendix ............................................................................................................................... 229
18.1 Abbreviations .................................................................................................................... 229
18.2 Sources ............................................................................................................................ 232
18.3 Research Methodology ..................................................................................................... 233
18.3.1 Coverage ..................................................................................................................... 233
18.3.2 Secondary Research .................................................................................................... 233
18.3.3 Primary Research ........................................................................................................ 234
18.4 Disclaimer......................................................................................................................... 234
1.1 List of Tables Table 1: Chevron Corporation, Startup Projects, 2014 ..................................................................27
Table 2: Chevron Corporation, Total Oil and Gas Production Forecast, 2011–2018 ......................42
Table 3: Chevron Corporation, Total Liquids Production by Region/Country (mbd), 2011–2013 ....50
Table 4: Chevron Corporation, Total Natural Gas Production by Region/Country (mmcfd), 2011–2013 ..........................................................................................................................51
Table 5: Chevron Corporation, Total Natural Gas Production by Region/Country (mmcfd), 2011–2013 ..........................................................................................................................52
Table 6: Chevron Corporation, Total Oil and Gas Production Forecast, 2011–2018 ......................53
Table 7: Chevron Corporation, Capital Expenditure (US$ mil), 2011–2013 ...................................63
Table 8: Chevron Corporation, Costs Incurred (US$ bil), 2011–2013 ............................................65
Chevron Corporation, Company Intelligence Report 12 © GlobalData. This report is a licensed product and is not to be copied, reproduced, shared or resold in any form.
CHEVRON CORPORATION, COMPANY INTELLIGENCE REPORT
Table of Content
Table 9: Chevron Corporation, Net Developed and Undeveloped Acreage (Million), 2011–2013 ...68
Table 10: Chevron Corporation, Net Developed and Undeveloped Acreage (Million), 2011–2013 .69
Table 11: Chevron Corporation, Gross Undeveloped Acres Expiring (Million), 2013 ......................70
Table 12: Chevron Corporation, Startup Projects, 2014 ................................................................72
Table 13: Chevron Corporation, Development Well Activity, 2013 .................................................74
Table 14: Chevron Corporation, Exploratory Well Activity, 2013....................................................75
Table 15: Chevron Corporation, Exploratory and Development Well Activity by Region, 2011–2013 ..........................................................................................................................75
Table 16: Chevron Corporation, Wells Activity Profile, 2011–2013 ................................................76
Table 17: Chevron Corporation, Net Productive Wells, 2011–2013 ...............................................77
Table 18: Chevron Corporation, Forecast Production, 2011–2018 ..............................................120
Table 19: Chevron Corporation, Price Forecasts, 2014–2018 .....................................................120
Table 20: Chevron Corporation, Income Statement (US$ bil), 2011–2018 ..................................121
Table 21: Chevron Corporation, Balance Sheet (US$ bil), 2011–2018 ........................................123
Table 22: Chevron Corporation, Cash Flow Statement (US$ bil), 2011–2018 .............................125
Table 23: Chevron Corporation, Net Asset Value, 2013 ..............................................................127
Table 24: Chevron Corporation and Peers, Operational and Financial Performance, 2013 ..........129
Table 25: Chevron Corporation and Peers, Financial Ratios, 2013 .............................................134
Table 26: Chevron Corporation, Total Crude Oil and Natural Gas, Production and Reserves, mmboe, 2009-2013 .................................................................................................137
Table 27: Chevron Corporation, Total Crude Oil & Natural Gas Production and Reserves, By Country/Region, mmboe, 2009-2013 .......................................................................140
Table 28: Chevron Corporation, Total Crude Oil and Natural Gas Reserve Changes, mmboe, 2009-2013 ...............................................................................................................142
Table 29: Chevron Corporation, Crude Oil Production and Reserves Metrics, mmbbl, 2009-2013144
Chevron Corporation, Company Intelligence Report 13 © GlobalData. This report is a licensed product and is not to be copied, reproduced, shared or resold in any form.
CHEVRON CORPORATION, COMPANY INTELLIGENCE REPORT
Table of Content
Table 30: Chevron Corporation, Crude Oil Production and Reserves, By Country/Region, mmbbl, 2009-2013 ...................................................................................................146
Table 31: Chevron Corporation, Crude Oil Reserve Changes, mmbbl, 2009-2013 .....................148
Table 32: Chevron Corporation, Natural Gas Production and Reserves Metrics, bcf, 2009-2013 .149
Table 33: Chevron Corporation, Natural Gas Production and Reserves, By Country/Region, bcf, 2009-2013 ...............................................................................................................151
Table 34: Chevron Corporation, Natural Gas Reserve Changes, bcf, 2009-2013 ........................153
Table 35: Chevron Corporation, Oil and Gas Reserves Life Index, Years, 2009-2013 .................154
Table 36: Chevron Corporation, Oil and Gas Reserves Life Index, By Country/Region, Years, 2009-2013 ...............................................................................................................157
Table 37: Chevron Corporation, Upstream Capital Expenditure, US$ mil, 2009-2013..................159
Table 38: Chevron Corporation, Proved and Unproved Acquisition Costs, By Country/Region, US$ mil, 2009-2013 .................................................................................................162
Table 39: Chevron Corporation, Exploration and Development Costs, By Country/Region, US$ mil, 2009-2013.........................................................................................................165
Table 40: Chevron Corporation, Reserves Replacement, Finding and Development Costs, Finding Cost and Proved Acquisition Costs Per boe, US$/boe, 2009-2013 ..............167
Table 41: Chevron Corporation, Reserves Replacement, Finding and Development Costs, Finding Cost and Proved Acquisition Costs Per boe, US$/boe, By Country/Region, 2009-2013 ...............................................................................................................171
Table 42: Chevron Corporation, Oil and Gas Production Replacement Ratio, %, 2009-2013 ......173
Table 43: Chevron Corporation, 3-Year Wt.Avg. Oil and Gas Production Replacement Ratio, By Country/Region, %, 2009-2013 ................................................................................180
Table 44: Chevron Corporation, Revenue and Expenses, US$ mil, 2009-2013 ...........................183
Table 45: Chevron Corporation, Revenue and Expenses, By Country/Region, US$ mil, 2009-2013 ........................................................................................................................192
Table 46: Chevron Corporation, Oil and Gas Revenue and Expenses, US$/boe, 2009-2013 ......195
Table 47: Chevron Corporation, Oil and Gas Revenue and Expenses, US$/boe, By Country/Region, 2009-2013 .....................................................................................202
Chevron Corporation, Company Intelligence Report 14 © GlobalData. This report is a licensed product and is not to be copied, reproduced, shared or resold in any form.
CHEVRON CORPORATION, COMPANY INTELLIGENCE REPORT
Table of Content
Table 48: Chevron Corporation, Oil and Gas Performance Metrics, 2009-2013 ...........................205
Table 49: Chevron Corporation, Land Holdings (Developed and Undeveloped Acreage), Acres, 2009-2013 ...............................................................................................................206
Table 50: Chevron Corporation, Land Holdings (Developed and Undeveloped Acreage), By Country/Region, Acres, 2009-2013 ..........................................................................211
Table 51: Chevron Corporation, Producible Oil and Gas Wells, 2009-2013 .................................214
Table 52: Chevron Corporation, Producible Oil and Gas Wells, By Country/Region, 2009-2013 ..221
Table 53: Chevron Corporation, Exploratory and Developed Wells, 2009-2013 ...........................224
Table 54: Chevron Corporation, Exploratory and Developed Wells, By Country/Region, 2009-2013 ........................................................................................................................226
1.2 List of Figures Figure 1: Chevron Corporation, Operational Map, 2014 ................................................................22
Figure 2: Chevron Corporation, Financial and Operational Overview, 2010–2013 .........................24
Figure 3: Chevron Corporation, Share Performance, August 2013–July 2014 ...............................25
Figure 4: Chevron Corporation, Worldwide Startup Projects, 2014–2020 ......................................26
Figure 5: Chevron Corporation, US Startup Projects, 2014 ...........................................................27
Figure 6: Chevron Corporation, Financial and Operational Performance, 2013 .............................32
Figure 7: Chevron Corporation vs. Peers, Dividend, Five-Year Average (US$/Share), 2009–2013 ..........................................................................................................................33
Figure 8: Chevron Corporation vs. Peers, Return on Equity and Return on Capital Employed, Five-Year Average (%), 2009–2013 ...........................................................................34
Figure 9: Chevron Corporation vs. Peers, Total Shareholder Return, 2013 ...................................35
Figure 10: Chevron Corporation, Major Startup Projects, 2013 .....................................................37
Figure 11: Chevron Corporation, Cash Flow from Operations vs. Capex, 2013 .............................38
Figure 12: Chevron Corporation and Peers, Debt Ratio, Three-Year Average (%), 2013 ...............39
Chevron Corporation, Company Intelligence Report 15 © GlobalData. This report is a licensed product and is not to be copied, reproduced, shared or resold in any form.
CHEVRON CORPORATION, COMPANY INTELLIGENCE REPORT
Table of Content
Figure 13: Chevron Corporation and Peers, Finding and Development Cost, 2013 .......................40
Figure 14: Chevron Corporation and Peers, Oil and Gas Reserve Life Index, 2013.......................41
Figure 15: Chevron Corporation, Chemicals Growth Target, 2013–2017 .......................................46
Figure 16: Chevron Corporation, Upcoming Petrochemicals and Refinery Plants Operational Map, 2013 .................................................................................................................47
Figure 17: Chevron Corporation, Production Mix (%), 2011–2018 .................................................49
Figure 18: Chevron Corporation, Capital Expenditure (US$ bil), 2011–2013 .................................63
Figure 19: Chevron Corporation, Capital Expenditure by Category (%), 2014–2016 ......................64
Figure 20: Chevron Corporation, Costs Incurred (US$ bil), 2011–2013 .........................................65
Figure 21: Chevron Corporation and Peers, Total Net Acreage (Million), 2013 ..............................66
Figure 22: Chevron Corporation and Peers, Net Developed and Undeveloped Acreage (%), 2013 ..........................................................................................................................67
Figure 23: Chevron Corporation, Net Developed and Undeveloped Acreage (Million), 2011–2013 ..........................................................................................................................69
Figure 24: Chevron Corporation and Peers, Net Developed and Undeveloped Acreage (Million), 2010–2013 ................................................................................................................70
Figure 25: Chevron Corporation, Exploration Operations, 2014 ....................................................72
Figure 26: Chevron Corporation, Net Development and Exploratory Wells Drilled and Completed, 2011–2013 .............................................................................................77
Figure 27: Chevron Corporation, California, Operational Map, 2013 .............................................79
Figure 28: Chevron Corporation, Gulf of Mexico, Operational Map, 2013 ......................................80
Figure 29: Chevron Corporation, Permian Basin, Operational Map, 2013 .....................................83
Figure 30: Chevron Corporation, Utica Shale, Marcellus Shale and Antrim Shale, Operational Map, 2013 .................................................................................................................85
Figure 31: Chevron Corporation, Canada, Operational Map, 2013 ................................................86
Figure 32: Chevron, Greenland, Operational Map, 2013 ...............................................................88
Figure 33: Chevron, Argentina and Brazil, Operational Map, 2013 ................................................89
Chevron Corporation, Company Intelligence Report 16 © GlobalData. This report is a licensed product and is not to be copied, reproduced, shared or resold in any form.
CHEVRON CORPORATION, COMPANY INTELLIGENCE REPORT
Table of Content
Figure 34: Chevron, Colombia, Suriname, Trinidad and Tobago and Venezuela, Operational Map, 2013 .................................................................................................................92
Figure 35: Chevron, Angola, Operational Map, 2013 ....................................................................93
Figure 36: Chevron, Nigeria, Operational Map, 2013 ....................................................................96
Figure 37: Chevron, Liberia, Operational Map, 2013 .....................................................................99
Figure 38: Chevron, Morocco, Operational Map, 2013 ................................................................100
Figure 39: Chevron, Kazakhstan, Operational Map, 2013 ...........................................................101
Figure 40: Chevron, Bangladesh, Operational Map, 2013 ...........................................................103
Figure 41: Chevron, Myanmar, Cambodia and Thailand, Operational Map, 2013 ........................105
Figure 42: Chevron, China, Operational Map, 2013 ....................................................................107
Figure 43: Chevron, Indonesia, Operational Map, 2013 ..............................................................109
Figure 44: Chevron, Kurdistan Region of Iraq and Saudi–Kuwaiti Partitioned Zone, Operational Map, 2013 ...............................................................................................................110
Figure 45: Chevron, Australia, Operational Map, 2013 ................................................................112
Figure 46: Chevron, PEL 218 and ATP 855, Australia, Operational Map, 2013 ...........................114
Figure 47: Chevron, Great Australian Bight, Operational Map, 2013 ...........................................115
Figure 48: Chevron, North Sea and Norwegian Sea, Operational Map, 2013 ..............................116
Figure 49: Chevron, Lithuania, Poland, Romania and Ukraine, Operational Map, 2013 ...............118
Figure 50: Chevron Corporation and Peers, Relative Share Price Performance Index (%), August 2013–July 2014 ...........................................................................................128
Figure 51: Chevron Corporation and Peers, Financial Parameters, 2013 ....................................130
Figure 52: Chevron Corporation and Peers, Reserve Life Index (Years), 2013............................131
Figure 53: Chevron Corporation and Peers, Finding and Development Cost and Reserve Replacement Comparison, 2013 ..............................................................................132
Figure 54: Chevron Corporation and Peers, Total Oil and Gas Proved Reserves and Production (mmboe), 2013 ........................................................................................................133
Chevron Corporation, Company Intelligence Report 17 © GlobalData. This report is a licensed product and is not to be copied, reproduced, shared or resold in any form.
CHEVRON CORPORATION, COMPANY INTELLIGENCE REPORT
Table of Content
Figure 55: Chevron Corporation, Valuation Ratios, 2013 ............................................................136
Figure 56: Chevron Corporation, Total Crude Oil and Natural Gas, Production and Reserves, mmboe, 2009-2013 .................................................................................................137
Figure 57: Chevron Corporation, Total Oil & Gas Reserves, End of Period, By Country/Region, mmboe, 2009-2013 .................................................................................................139
Figure 58: Chevron Corporation, Total Oil & Gas Production, By Country/Region, mmboe, 2009-2013 ........................................................................................................................140
Figure 59: Chevron Corporation, Total Crude Oil and Natural Gas Reserve Changes, mmboe, 2013 ........................................................................................................................142
Figure 60: Chevron Corporation, Crude Oil Production and Reserves Metrics, mmbbl, 2009-2013 ........................................................................................................................144
Figure 61: Chevron Corporation, Oil Reserves, End of Period, By Country/Region, mmbbl, 2009-2013 ...............................................................................................................145
Figure 62: Chevron Corporation, Oil Production, By Country/Region, mmbbl, 2009-2013............146
Figure 63: Chevron Corporation, Crude Oil Reserve Changes, mmbbl, 2013 .............................148
Figure 64: Chevron Corporation, Natural Gas Production and Reserves Metrics, bcf, 2009-2013149
Figure 65: Chevron Corporation, Gas Reserves, End of Period, By Country/Region, bcf, 2009-2013 ........................................................................................................................150
Figure 66: Chevron Corporation, Gas Production, By Country/Region, bcf, 2009-2013 ...............151
Figure 67: Chevron Corporation, Natural Gas Reserve Changes, bcf, 2013 ................................153
Figure 68: Chevron Corporation, Oil and Gas Reserves Life Index, Years, 2009-2013 ................154
Figure 69: Chevron Corporation, Gas Reserve Life Index, By Country/Region, Ratio, 2009-2013155
Figure 70: Chevron Corporation, Oil & Gas Reserve Life Index, By Country/Region, Ratio, 2009-2013 ........................................................................................................................156
Figure 71: Chevron Corporation, Oil Reserve Life Index, By Country/Region, Ratio, 2009-2013 .157
Figure 72: Chevron Corporation, Upstream Capital Expenditure, US$ mil, 2009-2013 ................159
Figure 73: Chevron Corporation, Proved Acquisition Costs, By Country/Region, US$ mil, 2009-2013 ........................................................................................................................161
Chevron Corporation, Company Intelligence Report 18 © GlobalData. This report is a licensed product and is not to be copied, reproduced, shared or resold in any form.
CHEVRON CORPORATION, COMPANY INTELLIGENCE REPORT
Table of Content
Figure 74: Chevron Corporation, Unproved Acquisition Costs, By Country/Region, US$ mil, 2009-2013 ...............................................................................................................162
Figure 75: Chevron Corporation, Development Costs, By Country/Region, US$ mil, 2009-2013 .164
Figure 76: Chevron Corporation, Exploration Costs, By Country/Region, US$ mil, 2009-2013 ....165
Figure 77: Chevron Corporation, 3-Year Wt.Avg., Reserves Replacement, Finding and Development Costs, Finding Cost and Proved Acquisition Costs Per boe, US$/boe, 2009-2013 ...............................................................................................................167
Figure 78: Chevron Corporation, Oil & Gas Finding & Development Cost/boe, 3-Year Average, By Country/Region, US$/boe, 2009-2013 ................................................................169
Figure 79: Chevron Corporation, Oil & Gas Finding Cost per boe, 3-Year Average, By Country/Region, US$/boe, 2009-2013 .....................................................................170
Figure 80: Chevron Corporation, Reserve Replacement Cost per boe, 3-Year Average, By Country/Region, US$/boe, 2009-2013 .....................................................................171
Figure 81: Chevron Corporation, 3-Year Wt.Avg., Oil and Gas Production Replacement Ratio, %, 2009-2013 ..........................................................................................................173
Figure 82: Chevron Corporation, 3-Year Wt. Avg. Gas F&D Production Replacement, By Country/Region, %, 2009-2013 ................................................................................175
Figure 83: Chevron Corporation, 3-Year Wt. Avg. Gas RRC Production Replacement, By Country/Region, %, 2009-2013 ................................................................................176
Figure 84: Chevron Corporation, 3-Year Wt. Avg. Oil & Gas F&D Production Replacement, By Country/Region, %, 2009-2013 ................................................................................177
Figure 85: Chevron Corporation, 3-Year Wt. Avg. Oil & Gas RRC Production Replacement, By Country/Region, %, 2009-2013 ................................................................................178
Figure 86: Chevron Corporation, 3-Year Wt. Avg. Oil F&D Production Replacement, By Country/Region, %, 2009-2013 ................................................................................179
Figure 87: Chevron Corporation, 3-Year Wt. Avg. Oil RRC Production Replacement, By Country/Region, %, 2009-2013 ................................................................................180
Figure 88: Chevron Corporation, Revenue and Expenses, US$ mil, 2009-2013 ..........................183
Figure 89: Chevron Corporation, Depreciation, Depletion and Amortization From Upstream Oil & Gas Operations, By Country/Region, US$ mil, 2009-2013........................................185
Chevron Corporation, Company Intelligence Report 19 © GlobalData. This report is a licensed product and is not to be copied, reproduced, shared or resold in any form.
CHEVRON CORPORATION, COMPANY INTELLIGENCE REPORT
Table of Content
Figure 90: Chevron Corporation, Exploration Expenses, By Country/Region, US$ mil, 2009-2013 ........................................................................................................................186
Figure 91: Chevron Corporation, Income Tax Provision (Benefit) From Upstream Oil & Gas Operations, By Country/Region, US$ mil, 2009-2013 ...............................................187
Figure 92: Chevron Corporation, Net Income/ Loss From Upstream Oil & Gas Operations, By Country/Region, US$ mil, 2009-2013 .......................................................................188
Figure 93: Chevron Corporation, Oil & Gas Revenue, By Country/Region, US$ mil, 2009-2013 ..189
Figure 94: Chevron Corporation, Profit (loss) Before Taxation From Upstream Oil & Gas Operations, By Country/Region, US$ mil, 2009-2013 ...............................................190
Figure 95: Chevron Corporation, Production Costs, By Country/Region, US$ mil, 2009-2013 .....191
Figure 96: Chevron Corporation, Total Expenses From Upstream Oil & Gas Operations, By Country/Region, US$ mil, 2009-2013 .......................................................................192
Figure 97: Chevron Corporation, Oil and Gas Revenue and Expenses, US$/boe, 2009-2013 .....195
Figure 98: Chevron Corporation, Exploration Expenses per boe, By Country/Region, US$/boe, 2009-2013 ...............................................................................................................196
Figure 99: Chevron Corporation, Income Tax/(Benefit) per boe, By Country/Region, US$/boe, 2009-2013 ...............................................................................................................197
Figure 100: Chevron Corporation, Lifting Cost per boe, By Country/Region, US$/boe, 2009-2013 ........................................................................................................................198
Figure 101: Chevron Corporation, Annual Net Income per boe, By Country/Region, US$/boe, 2009-2013 ...............................................................................................................199
Figure 102: Chevron Corporation, Oil & Gas Revenue per boe, By Country/Region, US$/boe, 2009-2013 ...............................................................................................................200
Figure 103: Chevron Corporation, Total DD&A per boe, By Country/Region, US$/boe, 2009-2013 ........................................................................................................................201
Figure 104: Chevron Corporation, Total Revenue per boe, By Country/Region, US$/boe, 2009-2013 ........................................................................................................................202
Figure 105: Chevron Corporation, Oil and Gas Performance Metrics, 2009-2013 .......................205
Figure 106: Chevron Corporation, Land Holdings (Developed and Undeveloped Acreage), Acres, 2009-2013 ....................................................................................................206
Chevron Corporation, Company Intelligence Report 20 © GlobalData. This report is a licensed product and is not to be copied, reproduced, shared or resold in any form.
CHEVRON CORPORATION, COMPANY INTELLIGENCE REPORT
Table of Content
Figure 107: Chevron Corporation, Total Gross Undeveloped Acreage, By Country/Region, Acres, 2009-2013 ....................................................................................................208
Figure 108: Chevron Corporation, Total Net Undeveloped Acreage, By Country/Region, Acres, 2009-2013 ...............................................................................................................209
Figure 109: Chevron Corporation, Total Gross Developed Acreage, By Country/Region, Acres, 2009-2013 ...............................................................................................................210
Figure 110: Chevron Corporation, Total Net Developed Acreage, By Country/Region, Acres, 2009-2013 ...............................................................................................................211
Figure 111: Chevron Corporation, Producible Oil and Gas Wells, 2009-2013 ..............................214
Figure 112: Chevron Corporation, Gross Productive Gas Wells, By Country/Region, Number, 2009-2013 ...............................................................................................................215
Figure 113: Chevron Corporation, Gross Productive Oil & Gas Wells, By Country/Region, Number, 2009-2013 .................................................................................................216
Figure 114: Chevron Corporation, Gross Productive Oil Wells, By Country/Region, Number, 2009-2013 ...............................................................................................................217
Figure 115: Chevron Corporation, Net/Gross Oil & Gas Ratio, By Country/Region, %, 2009-2013 ........................................................................................................................218
Figure 116: Chevron Corporation, Net Productive Gas Wells, By Country/Region, Number, 2009-2013 ...............................................................................................................219
Figure 117: Chevron Corporation, Net Productive Oil & Gas Wells, By Country/Region, Number, 2009-2013 ...............................................................................................................220
Figure 118: Chevron Corporation, Net Productive Oil Wells, By Country/Region, Number, 2009-2013 ........................................................................................................................221
Figure 119: Chevron Corporation, Exploratory and Developed Wells, 2009-2013 .......................224
Chevron Corporation, Company Intelligence Report 21 © GlobalData. This report is a licensed product and is not to be copied, reproduced, shared or resold in any form.
CHEVRON CORPORATION, COMPANY INTELLIGENCE REPORT
Chevron Corporation, Company Overview
2 Chevron Corporation, Company Overview
Chevron Corporation (Chevron) is an integrated energy company headquartered in San Ramon, California, US. The company is primarily engaged in Exploration and Production (E&P) activities upstream, while its downstream activity consists primarily of manufacturing, products, chemicals and transportation. It also has interest in other business segments, including midstream, power generation, mining, petrochemicals manufacturing and technology.
Chevron produces oil and natural gas from assets across the globe. In 20XX, the company’s net production averaged XX million barrels of oil equivalent per day (mmboed). Some of its major producing areas are Angola, Australia, Bangladesh, Canada, Indonesia, Kazakhstan, Nigeria, the Partitioned Zone (PZ) between Kuwait and Saudi Arabia, Thailand, the US and Venezuela. Of the company’s total production in 20XX, XX% was derived from its US assets and the remaining amount was produced from more than XX different countries.
Chevron’s conventional asset exploration activities are focused upon the deepwater Gulf of Mexico (GoM) in the US, offshore areas of
Chevron Corporation, Company Intelligence Report 22 © GlobalData. This report is a licensed product and is not to be copied, reproduced, shared or resold in any form.
CHEVRON CORPORATION, COMPANY INTELLIGENCE REPORT
Chevron Corporation, Company Overview
Figure 1: Chevron Corporation, Operational Map, 2014
Source: Chevron, 2013d
Chevron Corporation, Company Intelligence Report 26 © GlobalData. This report is a licensed product and is not to be copied, reproduced, shared or resold in any form.
CHEVRON CORPORATION, COMPANY INTELLIGENCE REPORT
Chevron Corporation, Key Highlights
3 Chevron Corporation, Key Highlights
3.1 Strong Upstream Startup Projects to Drive Future Growth Chevron’s revenue and profitability are primarily driven by its upstream activities. The company’s producing assets are located in a number of countries across the globe and it is continuously striving to increase its overall production volumes. Although its production volumes declined between 20XX and 20XX the company has built up a strong base of projects expected to commence production over the next few years. By 20XX, Chevron will have over
Figure 4: Chevron Corporation, Worldwide Startup Projects, 2014–2020
Source: Chevron, 2014
Chevron Corporation, Company Intelligence Report 36 © GlobalData. This report is a licensed product and is not to be copied, reproduced, shared or resold in any form.
CHEVRON CORPORATION, COMPANY INTELLIGENCE REPORT
Chevron Corporation, SWOT Analysis
4 Chevron Corporation, SWOT Analysis
4.1 Strengths
4.1.1 Major Upstream Startup Projects to Strengthen Production
In 20XX, Chevron’s production averaged XX mmboed, a decline compared with 20XX. However, the company has strong upcoming projects in the pipeline, which are expected to have commenced production by the end of the decade. These upcoming projects consist of a diversified portfolio of conventional and unconventional assets, both onshore and offshore, across various geographic locations. Chevron has invested more than US$XX million in around XX projects in the pipeline, while XX major projects have received more than
Chevron Corporation, Company Intelligence Report 40 © GlobalData. This report is a licensed product and is not to be copied, reproduced, shared or resold in any form.
CHEVRON CORPORATION, COMPANY INTELLIGENCE REPORT
Chevron Corporation, SWOT Analysis
4.2 Weaknesses
4.2.1 High Finding and Development Cost
Chevron’s five-year average Finding and Development (F&D) cost has been consistently high compared with those of its peers, and the company ranks low in this area. In 20XX, while the peer group five-year average F&D cost amounted to US$XX/boe, Chevron’s five-year average F&D cost stood at US$XX/boe, and its annual F&D reached as high as US$XX per boe, while the peer group average amounted to
Figure 13: Chevron Corporation and Peers, Finding and Development Cost, 2013
Source: GlobalData, Oil and Gas eTrack, Advanced Company Operational and Financial Benchmarking [Accessed on June 9, 2014]
Chevron Corporation, Company Intelligence Report 44 © GlobalData. This report is a licensed product and is not to be copied, reproduced, shared or resold in any form
CHEVRON CORPORATION, COMPANY INTELLIGENCE REPORT
Chevron Corporation, Goals and Strategies
5 Chevron Corporation, Goals and Strategies
5.1 Focus on Future Projects to Improve Production and Strengthen Legacy Positions
Chevron plans to have improved its production from the current XX mboed level to XX mboed by 20XX. In order to achieve these target production volumes, the company has invested in major projects across the globe in both conventional and unconventional assets, of which the majority are expected to have commenced production by 20XX. By 20XX, Chevron’s investment amounted to more than US$XX million in the case of XX projects, and to more than US$XX billion in the case of a further XX. In addition, the company has several other expansion and enhanced recovery projects in development, which are expected to have commenced production by 20XX.
Chevron is currently more inclined towards liquids-rich assets due to prevailing low natural gas prices. However, the company does have natural gas-rich assets in its portfolio, such as its conventional natural gas assets in Australia, Bangladesh, Colombia, the Gulf of Thailand, Indonesia, Kazakhstan, Trinidad and Tobago, the US and Venezuela, and shale natural gas assets in areas of the US such as
Chevron Corporation, Company Intelligence Report 120 © GlobalData. This report is a licensed product and is not to be copied, reproduced, shared or resold in any form
CHEVRON CORPORATION, COMPANY INTELLIGENCE REPORT
Chevron Corporation, Forecast Production and Financial Statements
10 Chevron Corporation, Forecast Production and Financial
Statements
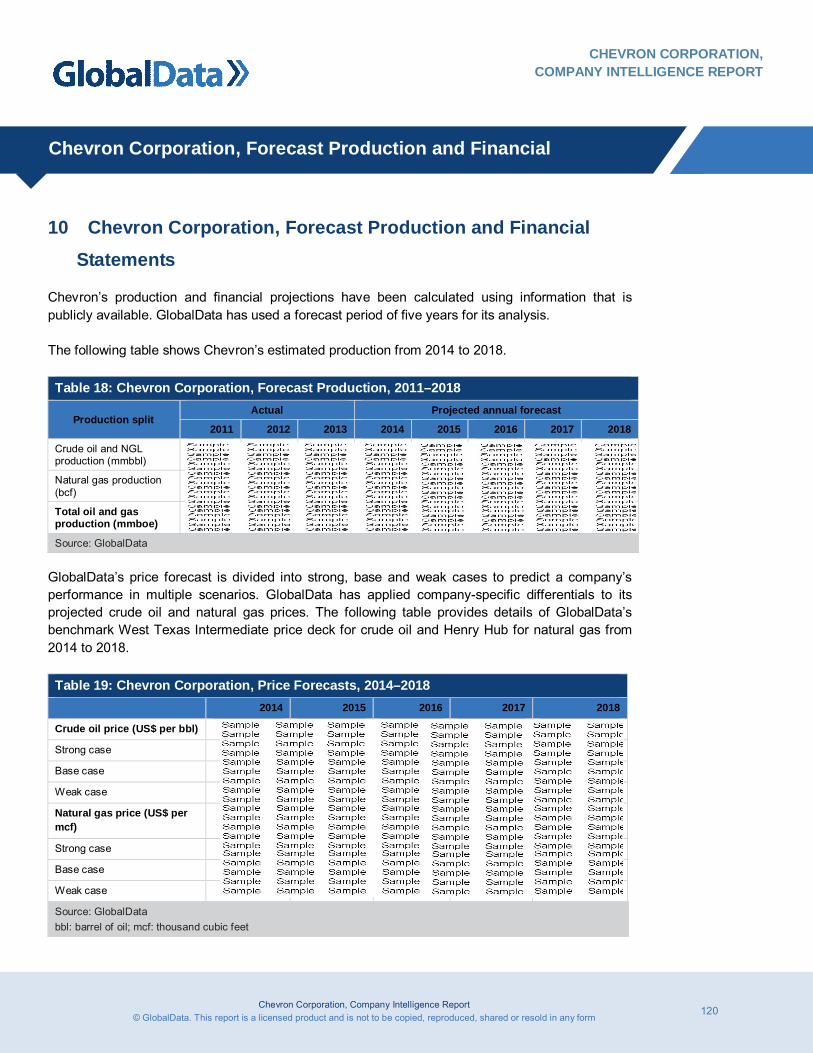
Chevron’s production and financial projections have been calculated using information that is publicly available. GlobalData has used a forecast period of five years for its analysis. The following table shows Chevron’s estimated production from 2014 to 2018.
Table 18: Chevron Corporation, Forecast Production, 2011–2018
Production split Actual Projected annual forecast
2011 2012 2013 2014 2015 2016 2017 2018
Crude oil and NGL production (mmbbl)
675 644 632 653 668 676 673 696
Natural gas production (bcf)
1,803 1,852 1,895 1,863 2,009 2,306 2,791 2,997
Total oil and gas production (mmboe)
975 953 948 964 1,003 1,060 1,138 1,196
Source: GlobalData
GlobalData’s price forecast is divided into strong, base and weak cases to predict a company’s performance in multiple scenarios. GlobalData has applied company-specific differentials to its projected crude oil and natural gas prices. The following table provides details of GlobalData’s benchmark West Texas Intermediate price deck for crude oil and Henry Hub for natural gas from 2014 to 2018.
Table 19: Chevron Corporation, Price Forecasts, 2014–2018 2014 2015 2016 2017 2018
Crude oil price (US$ per bbl)
Strong case 109.5 102.6 99.1 97.3 96.4
Base case 99.6 93.3 90.1 88.5 87.7
Weak case 89.6 83.9 81.1 79.6 78.9
Natural gas price (US$ per mcf)
Strong case 5.0 4.3 4.4 4.6 4.8
Base case 4.5 3.9 4.0 4.2 4.4
Weak case 4.1 3.5 3.6 3.8 4.0
Source: GlobalData bbl: barrel of oil; mcf: thousand cubic feet
Chevron Corporation, Company Intelligence Report 121 © GlobalData. This report is a licensed product and is not to be copied, reproduced, shared or resold in any form
CHEVRON CORPORATION, COMPANY INTELLIGENCE REPORT
Chevron Corporation, Forecast Production and Financial Statements
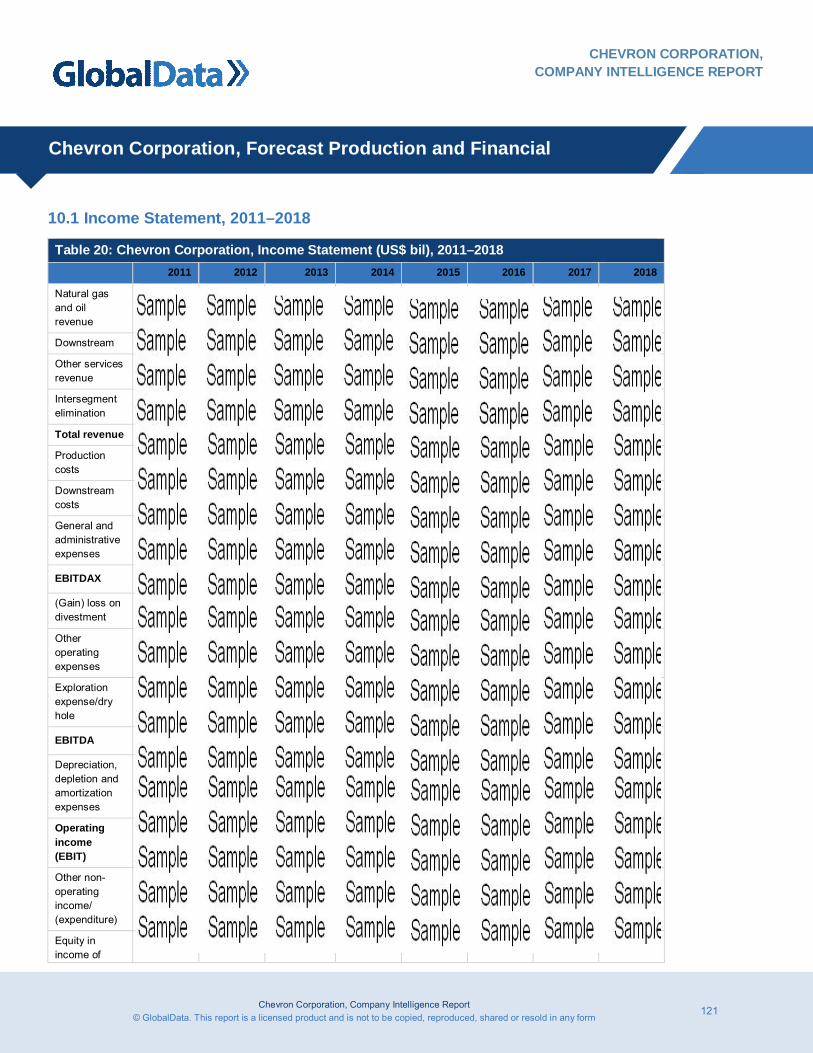
10.1 Income Statement, 2011–2018
Table 20: Chevron Corporation, Income Statement (US$ bil), 2011–2018 2011 2012 2013 2014 2015 2016 2017 2018
Natural gas and oil revenue
82.84 77.20 75.56 80.37 78.99 79.46 81.27 84.80
Downstream 214.30 204.46 195.03 198.94 202.91 206.97 211.11 215.33
Other services revenue
1.64 1.73 1.92 1.95 1.99 2.03 2.07 2.12
Intersegment elimination
54.41 52.80 52.35 52.37 55.98 59.76 64.03 66.17
Total revenue 244.37 230.59 220.16 228.89 227.92 228.70 230.43 236.07
Production costs
12.95 13.87 14.71 14.96 15.57 16.46 17.67 18.57
Downstream costs
149.92 140.77 134.70 137.84 140.60 143.41 146.28 149.20
General and administrative expenses
4.75 4.72 4.51 4.61 4.59 4.60 4.64 4.75
EBITDAX 76.75 71.23 66.24 71.48 67.16 64.22 61.84 63.55
(Gain) loss on divestment
(1.50) (4.20) (0.71) - - - - -
Other operating expenses
24.33 21.08 22.98 22.79 22.79 22.79 22.79 22.79
Exploration expense/dry hole
1.22 1.73 1.86 1.11 - - - -
EBITDA 52.71 52.63 42.11 47.57 44.36 41.43 39.04 40.76
Depreciation, depletion and amortization expenses
12.91 13.41 14.19 13.90 16.55 19.01 21.55 24.09
Operating income (EBIT)
39.80 39.21 27.92 33.67 27.81 22.42 17.50 16.67
Other non-operating income/ (expenditure)
0.47 0.23 0.46 0.39 0.39 0.39 0.39 0.39
Equity in income of
7.36 6.89 7.53 7.68 7.83 7.99 8.15 8.31
Chevron Corporation, Company Intelligence Report 122 © GlobalData. This report is a licensed product and is not to be copied, reproduced, shared or resold in any form
CHEVRON CORPORATION, COMPANY INTELLIGENCE REPORT
Chevron Corporation, Forecast Production and Financial Statements
affiliates
EBT 47.63 46.33 35.91 41.74 36.03 30.79 26.03 25.37
Current 19.04 17.98 12.43 15.78 13.62 11.64 9.84 9.59
Deferred 1.59 2.02 1.88 1.75 1.51 1.29 1.09 1.07
Total income tax
20.63 20.00 14.31 17.53 15.13 12.93 10.93 10.65
Tax rate (%) 43 43 40 42 42 42 42 42
Share of total taxes deferred (%)
8 10 13 10 10 10 10 10
Share of total taxes paid (%)
92 90 87 90 90 90 90 90
Profit after tax
27.01 26.34 21.60 24.21 20.90 17.86 15.10 14.71
Minority interest
0.11 0.16 0.17 0.20 0.17 0.14 0.12 0.12
Reported net income to common shareholders
26.90 26.18 21.42 24.01 20.73 17.72 14.98 14.60
Weighted average shares outstanding (bil)
1.99 1.95 1.92 1.87 1.83 1.79 1.75 1.71
Fully diluted shares outstanding (bil)
1.99 1.95 1.92 1.87 1.83 1.79 1.75 1.71
Basic EPS 13.54 13.43 11.18 12.81 11.31 9.90 8.57 8.55
Dilutive EPS 13.54 13.43 11.18 12.81 11.31 9.90 8.57 8.55
Source: GlobalData EBITDAX: Earnings Before Interest, Taxes, Depreciation, Amortization and Exploration; EPS: Earnings Per Share (US$/share) Values in parenthesis are negative
Chevron Corporation, Company Intelligence Report 123 © GlobalData. This report is a licensed product and is not to be copied, reproduced, shared or resold in any form
CHEVRON CORPORATION, COMPANY INTELLIGENCE REPORT
Chevron Corporation, Forecast Production and Financial Statements
10.2 Balance Sheet (2011–2018)
Table 21: Chevron Corporation, Balance Sheet (US$ bil), 2011–2018 2011 2012 2013 2014 2015 2016 2017 2018
Cash and cash equivalents*
15.86 20.94 16.25 11.07 11.40 11.44 11.52 11.80
Restricted cash 4.21 0.97 0.27 0.27 0.27 0.27 0.27 0.27
Accounts receivable
21.79 21.00 21.62 22.48 22.38 22.46 22.63 23.19
Inventories 5.54 6.14 6.38 6.53 6.67 6.83 7.00 7.16
Prepaid expenditure
5.83 6.67 5.73 5.86 5.83 5.85 5.90 6.04
Long-term receivables
2.23 3.05 2.83 2.83 2.83 2.83 2.83 2.83
Investment in unconsolidated entities
22.87 23.72 25.50 26.58 27.67 28.79 29.93 31.10
Property, plant and equipment
122.61 141.35 164.83 185.62 201.07 214.06 225.51 234.42
Other current and non-current assets
8.53 9.14 10.34 10.34 10.34 10.34 10.34 10.34
Total assets 209.47 232.98 253.75 271.57 288.47 302.87 315.93 327.16
Accounts payable
22.15 22.78 22.82 23.33 23.85 24.41 25.04 25.62
Accrued expenditure
5.29 5.74 5.40 5.52 5.50 5.51 5.56 5.69
Domestic and foreign income taxes
4.58 4.34 3.09 3.79 3.27 2.80 2.36 2.30
Current portion of long-term debt
- - - - 0.75 2.00 2.00 -
Short term and long-term debt
10.02 12.09 20.33 22.73 27.84 32.43 38.78 45.27
Deferred and other income taxes
15.54 17.67 21.30 23.05 24.57 25.86 26.95 28.02
Other current and non-current liabilities
29.71 32.53 30.38 30.38 30.38 30.38 30.38 30.38
Total liabilities 87.29 95.15 103.33 108.80 116.15 123.40 131.07 137.29
Chevron Corporation, Company Intelligence Report 124 © GlobalData. This report is a licensed product and is not to be copied, reproduced, shared or resold in any form
CHEVRON CORPORATION, COMPANY INTELLIGENCE REPORT
Chevron Corporation, Forecast Production and Financial Statements
Common stock 1.83 1.83 1.83 1.83 1.83 1.83 1.83 1.83
Additional paid in-capital
15.16 15.50 15.71 15.71 15.71 15.71 15.71 15.71
Treasury stock (29.69) (33.88) (38.29) (43.38) (48.50) (53.68) (58.90) (64.16)
Retained earnings (deficit)
140.40 159.73 173.68 190.98 205.56 217.81 228.37 238.59
Accumulated loss/ other
(6.02) (6.37) (3.58) (3.58) (3.58) (3.58) (3.58) (3.58)
Deferred compensation
(0.30) (0.28) (0.24) (0.24) (0.24) (0.24) (0.24) (0.24)
Total shareholder equity
121.38 136.52 149.11 161.33 170.78 177.86 183.20 188.16
Non-controlling interest
0.80 1.31 1.31 1.44 1.54 1.61 1.66 1.71
Total equity 122.18 137.83 150.43 162.77 172.32 179.47 184.86 189.87
Total liability plus share-holder equity
209.47 232.98 253.75 271.57 288.47 302.87 315.93 327.16
Source: GlobalData *Includes short-term investment
Chevron Corporation, Company Intelligence Report 125 © GlobalData. This report is a licensed product and is not to be copied, reproduced, shared or resold in any form
CHEVRON CORPORATION, COMPANY INTELLIGENCE REPORT
Chevron Corporation, Forecast Production and Financial Statements
10.3 Cash Flow Statement, 2011–2018
Table 22: Chevron Corporation, Cash Flow Statement (US$ bil), 2011–2018 2011 2012 2013 2014 2015 2016 2017 2018
Net income 26.90 26.18 21.42 24.01 20.73 17.72 14.98 14.60
Depreciation, depletion and amortization
12.91 13.41 14.19 13.90 16.55 19.01 21.55 24.09
Deferred taxes 1.59 2.02 1.88 1.75 1.51 1.29 1.09 1.07
Dry hole and impairment expense
0.38 0.56 0.68 1.11 - - - -
Income from equity investment
(0.57) (1.35) (1.18) (1.08) (1.10) (1.12) (1.14) (1.16)
Minority interest 0.11 0.16 0.17 0.20 0.17 0.14 0.12 0.12
Change in working capital
2.32 0.36 (1.33) 0.21 (0.05) (0.15) (0.16) (0.20)
Other operating (2.54) (2.52) (0.83) - - - - -
Cash from operations
41.10 38.81 35.00 40.10 37.81 36.90 36.44 38.50
Capex (26.50) (30.94) (37.99) (39.80) (35.00) (35.00) (35.00) (35.00)
Asset acquisitions (3.41) - - - - - - -
Asset sales 3.52 2.78 1.14 4.00 3.00 3.00 2.00 2.00
Other investing (1.09) 3.37 1.23 - - - - -
Cash from investing
(27.49) (24.80) (35.61) (35.80) (32.00) (32.00) (33.00) (33.00)
Additions to (reductions in) short-term and long-term debt
(2.37) 2.05 8.25 2.39 5.86 5.85 6.35 4.49
Common and preferred dividends
(6.14) (6.84) (7.47) (6.71) (6.15) (5.46) (4.42) (4.38)
Treasury stock repurchases
(3.19) (4.14) (4.49) (5.09) (5.13) (5.17) (5.22) (5.26)
Dividends to minority interests
(0.07) (0.04) (0.10) (0.07) (0.07) (0.07) (0.07) (0.07)
Cash from (11.77) (8.98) (3.82) (9.48) (5.49) (4.86) (3.36) (5.22)
Chevron Corporation, Company Intelligence Report 126 © GlobalData. This report is a licensed product and is not to be copied, reproduced, shared or resold in any form
CHEVRON CORPORATION, COMPANY INTELLIGENCE REPORT
Chevron Corporation, Forecast Production and Financial Statements
financing
Effect of exchange rate changes on cash
(0.03)
0.04 (0.27) - - - - -
Total increase/decrease of cash
1.80 5.08 (4.69) (5.18) 0.33 0.04 0.09 0.28
Source: GlobalData
Chevron Corporation, Company Intelligence Report 229 © GlobalData. This report is a licensed product and is not to be copied, reproduced, shared or resold in any form
CHEVRON CORPORATION, COMPANY INTELLIGENCE REPORT
Appendix
18 Appendix
18.1 Abbreviations AIOC: Azerbaijan International Operating Company
AOSP: Athabasca Oil Sands Project
bbl: barrel of oil
bcf: billion cubic feet
boe: barrels of oil equivalent
BTC: Baku-Tbilisi-Ceyhan
CAGR: Compound Annual Growth Rate
Capex: Capital expenditure
CAR: Capacity and Reliability
CFO: Cash Flow from Operations
CPChem: Chevron Philips Chemicals
CPC: Caspian Pipeline Consortium
DACF: Debt-Adjusted Cash Flow
DUC: Danish Underground Consortium
E&P: Exploration and Production
EBIT: Earnings Before Interest and Taxes
EBITDA: Earnings Before Interest, Taxes, Depreciation and Amortization
EBITDAX: Earnings Before Interest, Taxes, Depreciation, Amortization and Exploration
EGP: Escravos Gas Project
EGTL: Escravos Gas-to-Liquids
EPS: Earnings Per Share
ESR: Enhanced Secondary Recovery
EV: Enterprise Value
F&D: Finding and Development
FEED: Front End Engineering Design
FGP: Future Growth Project
FPU: Floating Production Unit
Chevron Corporation, Company Intelligence Report 230 © GlobalData. This report is a licensed product and is not to be copied, reproduced, shared or resold in any form
CHEVRON CORPORATION, COMPANY INTELLIGENCE REPORT
Appendix
FSO: Floating Storage and Offloading
FST: Fina Sonangol Texaco
GLA: Greater Longui Area
GoM: Gulf of Mexico
HSE: Hibernia Southern Extension
LHS: Left Hand Side
LNG: Liquefied Natural Gas
LPG: Liquefied Petroleum Gas
LSP: Large-Scale Steamflood Pilot
mbd: thousand barrels of oil per day
mboed: thousand barrels of oil equivalent per day
mcf: thousand cubic feet
mmbbl: million barrels of oil
mmbd: million barrels of oil per day
mmboe: million barrels of oil equivalent
mmboed: million barrels of oil equivalent per day
mmcfd: million cubic feet per day
mmtpa: million metric tons per annum
NGL: Natural Gas Liquids
NWS: North West Shelf
OML: Oil Mining Lease
PSC: production sharing contract
PV: Present Value
PZ: Partitioned Zone
RHS: Right-Hand Side
tcf: trillion cubic feet
TCO: Tengizchevroil
TSR: Total Shareholder Return
WI: Working Interest
Chevron Corporation, Company Intelligence Report 231 © GlobalData. This report is a licensed product and is not to be copied, reproduced, shared or resold in any form
CHEVRON CORPORATION, COMPANY INTELLIGENCE REPORT
Appendix
WPMP: Wellhead Pressure Management Project
X: multiple
Y-o-Y: Year-on-Year
Chevron Corporation, Company Intelligence Report 232 © GlobalData. This report is a licensed product and is not to be copied, reproduced, shared or resold in any form
CHEVRON CORPORATION, COMPANY INTELLIGENCE REPORT
Appendix
18.2 Sources Chevron (2013a). Chevron Corporation Annual Report. Chevron Corporation. Available from: http://investor.chevron.com/phoenix.zhtml?c=130102&p=irol-SECText&TEXT=aHR0cDovL2FwaS50ZW5rd2l6YXJkLmNvbS9maWxpbmcueG1sP2lwYWdlPTk0MTI0NzQmRFNFUT0wJlNFUT0wJlNRREVTQz1TRUNUSU9OX0VOVElSRSZzdWJzaWQ9NTc%3d [Accessed on June 9, 2014]
Chevron (2013b). Chevron Corporation Annual Report Supplement. Chevron Corporation. Available from: http://www.chevron.com/documents/pdf/chevron2013annualreportsupplement.pdf? [Accessed on June 9, 2014]
Chevron (2013c). Chevron Corporation Credit Suisse 19th Annual Energy Summit. Chevron Corporation. Available from: http://investor.chevron.com/phoenix.zhtml?c=130102&p=irol-EventDetails&EventId=5097369 [Accessed on June 9, 2014]
Chevron (2013d). Chevron Corporation Upstream. Chevron Corporation. Available from: http://phx.corporate-ir.net/External.File?item=UGFyZW50SUQ9MjI0MjU2fENoaWxkSUQ9LTF8VHlwZT0z&t=1 [Accessed on June 9, 2014]
Chevron (2013e). Chevron Corporation Upstream. Chevron Corporation. Available from: http://phx.corporate-ir.net/External.File?item=UGFyZW50SUQ9MjI0MjU5fENoaWxkSUQ9LTF8VHlwZT0z&t=1 [Accessed on June 9, 2014]
Chevron (2014). Chevron Corporation Investor Presentation. Chevron Corporation. Available from: http://phx.corporate- ir.net/External.File?item=UGFyZW50SUQ9MjM2MDQ1fENoaWxkSUQ9LTF8VHlwZT0z&t=1 [Accessed on August 19, 2014]
Yahoo (2014a). Summary. Yahoo Finance. Available from: http://finance.yahoo.com/q?s=CVX [Accessed on August 1, 2014]
Yahoo (2014b). Historical Prices. Yahoo Finance. Available from: http://finance.yahoo.com/q/hp?s=CVX+Historical+Prices [Accessed on August 1, 2014]
Chevron Corporation, Company Intelligence Report 233 © GlobalData. This report is a licensed product and is not to be copied, reproduced, shared or resold in any form
CHEVRON CORPORATION, COMPANY INTELLIGENCE REPORT
Appendix
18.3 Research Methodology GlobalData’s dedicated research and analysis teams consist of experienced professionals with advanced statistical expertise and marketing, market research and consulting backgrounds in the energy industry.
GlobalData adheres to the codes of practice of the Market Research Society (www.mrs.org.uk) and Strategic and Competitive Intelligence Professionals (www.scip.org).
All GlobalData databases are continuously updated and revised.
18.3.1 Coverage
The objective of updating GlobalData’s coverage is to ensure that it represents the most up-to-date vision of the industry possible.
Changes to the industry taxonomy are built on the basis of extensive research of company, association and competitor sources.
Company coverage is based on three key factors: market capitalization; revenues; and media attention and innovation and market potential.
An exhaustive search of 56 member exchanges is conducted and companies are prioritized on the basis of their market capitalization.
The estimated revenues of all major companies, including private and governmental, are gathered and used to prioritize coverage.
Companies that are making the news or that are of particular interest due to their innovative approach are prioritized.
GlobalData aims to cover all major news events and deals in the energy industry, updated on a daily basis.
18.3.2 Secondary Research
The research process begins with extensive secondary research using internal and external sources to gather qualitative and quantitative information relating to each market.
The secondary research sources that are typically referred to include, but are not limited to:
Company websites, annual reports, financial reports, broker reports, investor presentations and SEC filings
Industry trade journals and other technical literature
Internal proprietary and external databases
National government documents, statistical databases and market reports
News articles, press releases and web-casts specific to the companies operating in the market
Chevron Corporation, Company Intelligence Report 234 © GlobalData. This report is a licensed product and is not to be copied, reproduced, shared or resold in any form
CHEVRON CORPORATION, COMPANY INTELLIGENCE REPORT
Appendix
18.3.3 Primary Research
GlobalData conducts hundreds of primary interviews each year with industry participants and commentators in order to validate its data and analysis. A typical research interview fulfills the following functions:
Provides first-hand information on market size, market trends, growth trends, competitive landscape and future outlook
Helps to validate and strengthen secondary research findings
Further develops the analysis team’s expertise and market understanding
18.4 Disclaimer All Rights Reserved.
No part of this publication may be reproduced, stored in a retrieval system or transmitted in any form by any means; electronic, mechanical, photocopying, recording or otherwise, without the prior permission of the publisher, GlobalData.