Embed Size (px)
Citation preview

106 Rolls-Royce Holdings plc Annual Report 2015
Financial Statements
FINANCIAL STATEMENTS
CONSOLIDATED FINANCIAL STATEMENTS
Consolidated income statement 107
Consolidated statement of comprehensive income 108
Consolidated balance sheet 109
Consolidated cash flow statement 110
Consolidated statement of changes in equity 112
Notes to the Consolidated Financial Statements 113
1 Accounting policies 113
2 Segmental analysis 122
3 Research and development 127
4 Net financing 127
5 Taxation 128
6 Earnings per ordinary share 130
7 Employee information 131
8 Auditors’ remuneration 131
9 Intangible assets 132
10 Property, plant and equipment 134
11 Investments 135
12 Inventories 138
13 Trade and other receivables 138
14 Cash and cash equivalents 138
15 Borrowings 139
16 Trade and other payables 139
17 Financial instruments 140
18 Provisions for liabilities and charges 148
19 Post-retirement benefits 149
20 Share capital 153
21 Share-based payments 153
22 Leases 154
23 Contingent liabilities 155
24 Related party transactions 156
25 Acquisitions and disposals 156
COMPANY FINANCIAL STATEMENTS
Company balance sheet 157
Company statement of changes in equity 157
Notes to the Company Financial Statements 158
1 Accounting policies 158
2 Investments – subsidiary undertakings 158
3 Financial liabilities 158
4 Share capital 159
5 Contingent liabilities 159
6 Other Information 159

Rolls-Royce Holdings plc Annual Report 2015 107
Financial Statements
Financial Statements
CONSOLIDATED INCOME STATEMENTFor the year ended 31 December 2015
Notes2015
£m2014
£m
Continuing operationsRevenue 2 13,725 13,736 Cost of sales (10,459) (10,533)Gross profit 3,266 3,203 Other operating income 10 10 Commercial and administrative costs (1,059) (1,124)Research and development costs 3 (818) (793)Share of results of joint ventures and associates 11 100 94 Operating profit 1,499 1,390 Profit on acquisition/reclassification of joint ventures – 2 Profit on disposal of businesses 2 6 Profit before financing and taxation 2 1,501 1,398
Financing income 4 115 121 Financing costs 4 (1,456) (1,452)Net financing (1,341) (1,331)
Profit before taxation 1 160 67 Taxation 5 (76) (151)Profit for the year from continuing operations 84 (84)
Discontinued operationsProfit for the year from ordinary activities 2 – 4 Profit on disposal – 138 Profit for the year from discontinued operations – 142
Profit for the year 84 58
Attributable to:Ordinary shareholders 83 69 Non-controlling interests 1 (11)
Profit for the year 84 58
Earnings per ordinary share attributable to ordinary shareholders: 6From continuing operations
Basic 4.51p (3.90)pDiluted 4.48p (3.90)p
From continuing and discontinued operationsBasic 4.51p 3.68pDiluted 4.48p 3.68p
Payments to ordinary shareholders in respect of the year: 17Per share 16.37p 23.10pTotal 301 435
1 Underlying profit before taxation 2 1,432 1,620

108 Rolls-Royce Holdings plc Annual Report 2015
Financial Statements
CONSOLIDATED STATEMENT OF COMPREHENSIVE INCOMEFor the year ended 31 December 2015
Notes2015
£m2014
£m
Profit for the year 84 58
Other comprehensive income (OCI)Movements in post-retirement schemes 19 (722) 1,192 Related tax movements 257 (431)Items that will not be reclassified to profit or loss (465) 761
Foreign exchange translation differences on foreign operations (129) (158)Reclassified to income statement on disposal of businesses 1 (29)Share of OCI of joint ventures and associates 11 (19) (13)Related tax movements 5 (2) (2)Items that may be reclassified to profit or loss (149) (202)
Total comprehensive income for the year (530) 617
Attributable to:Ordinary shareholders (530) 650 Non-controlling interests – (33)
Total comprehensive income for the year (530) 617

Rolls-Royce Holdings plc Annual Report 2015 109
Financial Statements
Financial Statements
Notes2015
£m2014
£m
ASSETSIntangible assets 9 4,645 4,804 Property, plant and equipment 10 3,490 3,446 Investments – joint ventures and associates 11 576 539 Investments – other 11 33 31 Other financial assets 17 83 107 Deferred tax assets 5 318 369 Post-retirement scheme surpluses 19 1,063 1,740 Non-current assets 10,208 11,036 Inventories 12 2,637 2,768 Trade and other receivables 13 6,244 5,509 Taxation recoverable 23 19 Other financial assets 17 29 22 Short-term investments 2 7 Cash and cash equivalents 14 3,176 2,862 Assets held for sale 5 1 Current assets 12,116 11,188 TOTAL ASSETS 22,324 22,224
LIABILITIESBorrowings 15 (419) (68)Other financial liabilities 17 (331) (209)Trade and other payables 16 (6,923) (6,791)Current tax liabilities (164) (184)Provisions for liabilities and charges 18 (336) (433)Current liabilities (8,173) (7,685)Borrowings 15 (2,883) (2,193)Other financial liabilities 17 (1,651) (717)Trade and other payables 16 (2,317) (2,445)Non-current tax liabilities (1) (10)Deferred tax liabilities 5 (839) (1,228)Provisions for liabilities and charges 18 (304) (374)Post-retirement scheme deficits 19 (1,140) (1,185)Non-current liabilities (9,135) (8,152)TOTAL LIABILITIES (17,308) (15,837)
NET ASSETS 5,016 6,387
EQUITYCalled-up share capital 20 367 376 Share premium account 180 179 Capital redemption reserve 161 159 Cash flow hedging reserve (100) (81)Other reserves (51) 78 Retained earnings 4,457 5,671 Equity attributable to ordinary shareholders 5,014 6,382 Non-controlling interests 2 5 TOTAL EQUITY 5,016 6,387
The financial statements on pages 107 to 156 were approved by the Board on 11 February 2016 and signed on its behalf by:
WARREN EAST Chief Executive DAVID SMITH Chief Financial Officer
CONSOLIDATED BALANCE SHEETAt 31 December 2015

110 Rolls-Royce Holdings plc Annual Report 2015
Financial Statements
CONSOLIDATED CASH FLOW STATEMENTFor the year ended 31 December 2015
Notes2015
£m2014
£m
Reconciliation of cash flows from operating activitiesOperating profit from continuing operations 1,499 1,390 Operating loss from discontinued operations – (1)Operating profit 1,499 1,389 Loss/(profit) on disposal of property, plant and equipment 8 (3)Share of results of joint ventures and associates 11 (100) (94)Dividends received from joint ventures and associates 11 63 73 Return of capital from joint ventures 11 – 3 Gain on consolidation of previously non-consolidated subsidiary – (3)Amortisation and impairment of intangible assets 9 432 367 Depreciation and impairment of property, plant and equipment 10 378 375 Impairment of investments 11 2 – (Decrease)/increase in provisions (151) 129 Decrease in inventories 63 166 Increase in trade and other receivables (836) (878)Increase in trade and other payables 242 214 Cash flows on other financial assets and liabilities held for operating purposes (305) (30)Net defined benefit post-retirement cost recognised in profit before financing 19 213 170 Cash funding of defined benefit post-retirement schemes (259) (322)Share-based payments 21 5 21 Net cash inflow from operating activities before taxation 1,254 1,577 Taxation paid (160) (276)Net cash inflow from operating activities 1,094 1,301
Cash flows from investing activitiesAdditions of unlisted investments (6) (11)Additions of intangible assets (408) (477)Disposals of intangible assets 4 –Purchases of property, plant and equipment (487) (648)Government grants received 8 11 Disposals of property, plant and equipment 33 65 Acquisitions of businesses (5) (3)Acquisition of non-controlling interest – (1,937)Disposal of discontinued operations (121) 1,027 Disposals of other businesses 2 24 Investments in joint ventures and associates (15) (17)Net cash outflow from investing activities (995) (1,966)
Cash flows from financing activitiesRepayment of loans (54) (233)Proceeds from increase in loans and finance leases 1,150 49 Capital element of finance lease payments (1) – Net cash flow from increase/(decrease) in borrowings and finance leases 1,095 (184)Interest received 5 18 Interest paid (58) (63)Interest element of finance lease payments (2) –Decrease in short-term investments 5 313 Issue of ordinary shares (net of expenses) 32 1 Purchase of ordinary shares – share buyback (433) (69)Purchase of ordinary shares – other (2) (2)Dividend paid to non-controlling interest – (76)Redemption of C Shares (421) (406)Net cash inflow/(outflow) from financing activities 221 (468)
Change in cash and cash equivalents 320 (1,133)Cash and cash equivalents at 1 January 2,862 3,987 Exchange (losses)/gains on cash and cash equivalents (6) 8 Cash and cash equivalents at 31 December 3,176 2,862

Rolls-Royce Holdings plc Annual Report 2015 111
Financial Statements
Financial Statements
2015£m
2014£m
Reconciliation of movements in cash and cash equivalents to movements in net fundsChange in cash and cash equivalents 320 (1,133)Cash flow from (increase)/decrease in borrowings and finance leases (1,095) 184 Cash flow from decrease in short-term investments (5) (313)Change in net funds resulting from cash flows (780) (1,262)Net funds (excluding cash and cash equivalents) of businesses acquired – (30)Exchange gains on net funds 3 19 Fair value adjustments 45 (59)Movement in net funds (732) (1,332)Net funds at 1 January excluding the fair value of swaps 608 1,940 Net funds at 31 December excluding the fair value of swaps (124) 608 Fair value of swaps hedging fixed rate borrowings 13 58 Net funds at 31 December (111) 666
The movement in net funds (defined by the Group as including the items shown below) is as follows:
At 1 January
2015£m
Fundsflow
£m
Exchange differences
£m
Fair value adjustments
£mReclassifications
£m
At31 December
2015£m
Cash at bank and in hand 739 (69) (8) – – 662Money-market funds 692 92 (1) – – 783Short-term deposits 1,431 297 3 – – 1,731Cash and cash equivalents 2,862 320 (6) – – 3,176Short-term investments 7 (5) – – – 2Other current borrowings (67) (64) – 8 (294) (417)Non-current borrowings (2,149) (1,027) 12 37 294 (2,833)Finance leases (45) (4) (3) – – (52)Net funds excluding fair value of swaps 608 (780) 3 45 – (124)Fair value of swaps hedging fixed rate borrowings 58 (45) 13Net funds 666 (780) 3 – – (111)

112 Rolls-Royce Holdings plc Annual Report 2015
Financial Statements
CONSOLIDATED STATEMENT OF CHANGES IN EQUITYFor the year ended 31 December 2015
Attributable to ordinary shareholders Non-controlling
interests (NCI)£mNotes
Share capital
£m
Share premium
£m
Capital redemption
reserve£m
Cash flow hedging
reserve1
£m
Other reserves2
£m
Retained earnings3
£mTotal
£m
Totalequity
£m
At 1 January 2014 376 80 163 (68) 250 4,804 5,605 698 6,303 Profit for the year – – – – – 69 69 (11) 58 Foreign exchange translation differences on foreign operations – – – – (141) – (141) (17) (158)Reclassified to income statement on disposal of businesses – – – – (29) – (29) – (29)Movement on post-retirement schemes 19 – – – – – 1,199 1,199 (7) 1,192 Share of other comprehensive income of joint ventures and associates 11 – – – (13) – – (13) – (13)Related tax movements 5 – – – – (2) (433) (435) 2 (433)Total comprehensive income for the year – – – (13) (172) 835 650 (33) 617 Arising on issues of ordinary shares 20 2 99 – – – (100) 1 – 1 Issue of C Shares 17 – – (414) – – 2 (412) – (412)Redemption of C Shares 17 – – 408 – – (408) – – – Ordinary shares purchased – share buyback 4 – – – – – (69) (69) – (69)Ordinary shares cancelled 4 20 (2) – 2 – – – – – – Ordinary shares purchased – other – – – – – (2) (2) – (2)Share-based payments – direct to equity 5 – – – – – 29 29 – 29 Transactions with NCI – acquisition of NCI shares – – – – – 584 584 (584) – Dividend paid to NCI – – – – – – – (76) (76)Related tax movements 5 – – – – – (4) (4) – (4)Other changes in equity in the year – 99 (4) – – 32 127 (660) (533)
At 1 January 2015 376 179 159 (81) 78 5,671 6,382 5 6,387 Profit for the year – – – – – 83 83 1 84 Foreign exchange translation differences on foreign operations – – – – (128) – (128) (1) (129)Reclassified to income statement on disposal of businesses – – – – 1 – 1 – 1 Movement on post-retirement schemes 19 – – – – – (722) (722) – (722)Share of other comprehensive income of joint ventures and associates 11 – – – (19) – – (19) – (19)Related tax movements 5 – – – – (2) 257 255 – 255 Total comprehensive income for the year – – – (19) (129) (382) (530) – (530)Arising on issues of ordinary shares – 1 – – – – 1 – 1 Issue of C Shares 17 – – (430) – – 2 (428) – (428)Redemption of C Shares 17 – – 423 – – (423) – – – Ordinary shares purchased – share buyback 4 – – – – – (433) (433) – (433)Ordinary shares cancelled 4 20 (9) – 9 – – – – – – Ordinary shares purchased – other – – – – – (2) (2) – (2)Share-based payments – direct to equity 5 – – – – – 30 30 – 30 Transactions with NCI – – – – – – – (3) (3)Related tax movements 5 – – – – – (6) (6) – (6)Other changes in equity in the year (9) 1 2 – – (832) (838) (3) (841)
At 31 December 2015 367 180 161 (100) (51) 4,457 5,014 2 5,016 1 See accounting policies note 1.2 Other reserves include a merger reserve of £3m (2014: £3m, 2013 £3m) and a translation reserve of £(54)m (2014: £75m, 2013: £247m).3 At 31 December 2015, 5,894,064 ordinary shares with a net book value of £52m (2014 14,561,097, 2013 11,960,535 ordinary shares with net book values of £129m and £91m
respectively) were held for the purpose of share-based payment plans and included in retained earnings. During the year, 10,892,026 ordinary shares with a net book value of £98m (2014 7,770,113 shares with a net book value of £64m) vested in share-based payment plans. During the year the Company acquired 224,993 (2014 169,404) of its ordinary shares via reinvestment of dividends received on its own shares and purchased 2,000,000 (2014 nil) of its ordinary shares through purchases on the London Stock Exchange. During the year, the Company issued no new ordinary shares (2014 10,200,000) to the Group’s share trust for its employees share-based payment plans with a net book value of nil (2014 £100m).
4 Following the completion of the sale of the Energy business to Siemens on 1 December 2014 and further to the announcement on 19 June 2014 of a £1bn share buyback, the Company put in place a programme to enable the purchase of its ordinary shares. The aim of the buyback was to reduce the issued share capital of the Company, helping enhance returns for shareholders. In the period to 31 December 2014, 8,215,000 shares were purchased at an average price of 840p. These shares were cancelled. In the year to 31 December 2015, 46,016,303 shares were purchased at an average price of 937p. 44,016,303 of these shares were cancelled and 2,000,000 were retained for use in share-based payment programmes. On 6 July 2015, the Company announced that the share buyback programme had been curtailed at the to-date total of £500m.
5 Share-based payments – direct to equity is the net of the credit to equity in respect of the share-based payment charge to the income statement and the actual cost of shares vesting, excluding those vesting from own shares.

NOTES TO THE CONSOLIDATED FINANCIAL STATEMENTS
1 Accounting policiesTHE COMPANYRolls-Royce Holdings plc (the ‘Company’) is a company domiciled in the United Kingdom. The consolidated financial statements of the Company for the year ended 31 December 2015 consist of the consolidation of the financial statements of the Company and its subsidiaries (together referred to as the ‘Group’) and include the Group’s interest in jointly controlled and associated entities.
BASIS OF PREPARATION AND STATEMENT OF COMPLIANCEIn accordance with European Union (EU) regulations, these financial statements have been prepared in accordance with International Financial Reporting Standards (IFRS) issued by the International Accounting Standards Board (IASB), as adopted for use in the EU effective at 31 December 2015 (Adopted IFRS).
The Company has elected to prepare its individual company financial statements under FRS 101 Reduced Disclosure Framework. This year is the first year that the financial statements have been prepared under FRS 101. They are set out on pages 157 to 159 and the accounting policies in respect of Company financial statements are set out on page 158.
These consolidated financial statements have been prepared on the historical cost basis except where Adopted IFRS requires the revaluation of financial instruments to fair value and certain other assets and liabilities on an alternative basis – most significantly post-retirement scheme obligations are valued on the basis required by IAS 19 Employee Benefits – and on a going concern basis as described on page 57.
The consolidated financial statements are presented in sterling which is the Company’s functional currency.
The preparation of financial statements in conformity with Adopted IFRS requires management to make judgements and estimates that affect the reported amounts of assets and liabilities at the date of the financial statements and the reported amounts of revenues and expenses during the reporting period. Actual results could differ from those estimates.
KEY AREAS OF JUDGEMENTIntroductionThe Group generates a significant portion of its revenues and profit on aftermarket arrangements arising from the installed original equipment (OE) fleet. As a consequence, the Group will often agree contractual prices for OE deliveries that take into account the anticipated aftermarket arrangements. Accounting policies reflect this aspect of the business model, in particular the policies for the recognition of contractual aftermarket rights and the linkage of OE and aftermarket arrangements.
When a civil large engine is sold, the economic benefits received usually far exceed the cash receivable under the contract, due to the rights to valuable aftermarket spare parts business. However, because the value of this right cannot be estimated with enough precision, accounting standards require that the revenue recognised in the accounts on sale of the engine is restricted to a total amount that results in a break even position. The amount of the revenue recognised in excess of cash receivable is recognised as an intangible asset, which is called a ‘contractual aftermarket right’ (previously referred to as a ‘recoverable engine cost’; this change has been made to reflect better the nature of the asset).
There is only one circumstance where accounting standards require the recognition of more of the value of the aftermarket rights when an engine is sold. This occurs where a long-term aftermarket contract (generally a TotalCare agreement – TCA) and an engine sale contract have been negotiated together. In this circumstance, the part of the aftermarket rights covered by the TCA can be valued much more precisely and is recognised at the time of the engine sale through accounting for the engine sale and TCA as a single contract. Nevertheless, the accounting profit recognised is still less than the economic benefits on the sale as there will be other valuable aftermarket rights (for instance for the period beyond the TCA term or for the sale of parts which are outside the scope of the TCA) which cannot be recognised.
The Group enters into arrangements with long-term suppliers to share the risks and rewards of major programmes – risk and revenue sharing arrangements (RRSAs). The accounting policy for these arrangements has been chosen, consistent with Adopted IFRS, to reflect their commercial effect.
The key judgements in determining these accounting policies are described below.
Contractual aftermarket rights (CARs)On delivery of Civil Aerospace engines, the Group has contractual rights to supply aftermarket parts to the customers and its intellectual rights, warranty arrangements and, where relevant, statutory airworthiness or other regulatory requirements provide reasonable control over this supply. The Directors consider that these rights meet the definition of an intangible asset in IAS 38 Intangible Assets. However, the Directors do not consider that it is possible to determine a reliable fair value for this intangible asset. Accordingly, an intangible asset (CAR) is only recognised on the occasions where the contractual price of the engine is below the cost of manufacture and then only to the extent of this deficit, as this amount is reliably measureable. An equal amount of revenue is recognised at the same point. Where a long-term aftermarket contract is linked to the OE contract (see below), the contractual price of the engine (including amounts allocated from the aftermarket contract) is above its cost of manufacture; consequently no CAR is recognised.
Rolls-Royce Holdings plc Annual Report 2015 113
Financial Statements
Financial Statements

NOTES TO THE CONSOLIDATED FINANCIAL STATEMENTS CONTINUED
1 Accounting policies continuedMeasure of performance on long-term aftermarket contractsA large proportion of the Group’s activities relate to long-term aftermarket contracts, in particular TotalCare and similar arrangements in the Aerospace Division. Under these contracts, the Group’s primary obligation is to maintain customers’ equipment in an operational condition and achieves this by undertaking various activities, such as engine monitoring, line maintenance and repair and overhaul, over the period of the contract. In general, the Directors consider that the stage of performance of the contract should be by reference to the obligation to maintain an operational fleet and that this is best measured by the operation of the fleet. Accordingly, stage of performance is measured by reference to flying hours of each fleet under contract.
Linkage of original and long-term aftermarket contracts Where the key terms of a long-term aftermarket contract are substantively agreed (eg. in a term sheet) at the same time as an OE contract with the operator, the Directors consider these to be linked for accounting purposes and they are treated as a single contract, as this best reflects the overall commercial effect. Where the OE contract is not with the operator, eg. where it is with an OE manufacturer or a lessor, the contracts are not linked as they were not negotiated on a unified basis.
Risk and revenue sharing arrangementsRRSAs with key suppliers (workshare partners) are a feature of our Civil Aerospace business. Under these contractual arrangements the key commercial objectives are that: (i) during the development phase the workshare partner shares in the risks of developing an engine by performing its own development work, providing development parts and paying a non-refundable cash entry fee; and (ii) during the production phase it supplies components in return for a share of the programme revenues as a ‘life of type’ supplier (ie. as long as the engine remains in service). The share of development costs borne by the workshare partner and of the revenues it receives reflect the partner’s proportionate cost of providing its production parts compared to the overall manufacturing cost of the engine. The share is based on a jointly agreed forecast at the commencement of the arrangement.
These arrangements are complex and have features that could be indicative of: a collaboration agreement, including sharing of risk and cost in a development programme; a long-term supply agreement; sharing of intellectual property; or a combination of these. In summary, and as described below, the Directors’ view is that the development and production phases of the contract should be considered separately in accounting for the RRSA, which results in the entry fee being matched against the non-recurring costs incurred by the Group.
Having considered the features above, the Directors considered that there is no directly applicable IFRS to determine an accounting policy for the recognition of entry fees of this nature in the income statement. Consequently, in developing an accounting treatment for such entry fees that best reflects the commercial objectives of the contractual arrangement, the Directors have analysed these features in the context of relevant accounting pronouncements (including those of other standard setters where these do not conflict with IFRS) and have weighed the importance of each feature in faithfully representing the overall commercial effect. The most important considerations that need to be balanced are: the transfer of development risk; the workshare partner receiving little standalone value from the payment of the entry fee; and the overall effect being collaboration between the parties which falls short of being a joint venture as the Group controls the programme. Also important in the analysis is the fact that, whilst the Group and the workshare partner share risks and rewards through the life of the contract, these risks and rewards are very different during the development and production phases.
In this context, the entry fee might be considered to represent: an amount paid as an equalisation of development costs; a payment to secure a long-term supply arrangement; a purchase of intellectual property; or some combination thereof. The accounting under these different scenarios could include: recognition of the entry fee to match the associated costs in the income statement; being spread over the life of the programme as a reduction in the cost of supply during production; or being spread over the time period of the access to the intellectual property by the workshare partner.
The Directors consider that the most important features of the arrangement are the risk sharing and that the entry fee represents a contribution to the development costs that the Group incurs in excess of its proportionate programme share. The key judgements taken in reaching this view are: the entry fee is determined by the parties on that basis and the contract specifies that, in the event that a derivative engine is to be developed, additional entry fees will also be calculated on this basis; the workshare partners describe the entry fee in this way; although the workshare partner receives little stand-alone value from paying the entry fee, the entry fee together with its own development activities represent its aggregate investment in the collaboration; the amount of the entry fee does not include any amount in excess of that necessary to equalise forecast development costs; the Group is not ‘on risk’ for the full development costs it incurs but for that amount less the entry fees received; and, as far as can be determined, this appears to be common industry accounting for arrangements of this type, under both Adopted IFRS and US accounting standards (which the Directors do not believe conflicts with IFRS in this regard).
The resulting accounting policy (described on page 117) represents the commercial effect of the contractual arrangements in that the Group recognises only those development costs to which it is exposed (and thus reflects the significant transfer of development risk to the workshare partner) and the costs of supply of parts during the production phase is measured at the workshare partner’s share of programme revenues (which we consider to be a commercial fair value). The Directors do not consider that accounting which would result in entry fees only being recognised in the production phase would appropriately reflect the sharing of development risk. Accordingly, the Directors believe that the policy adopted best reflects the commercial objectives of the arrangements, the nature of the relationship with the workshare partner and is in accordance with Adopted IFRS.
114 Rolls-Royce Holdings plc Annual Report 2015
Financial Statements

1 Accounting policies continuedAs described in the 2013 Annual Report, an alternative view is that the RRSA contract cannot be divided into separate development and production phases, as the fees and development components received by the Group during the development phase are exchanged for the obligation to pay the supplier a predetermined share of any sales receipts during the production phase. On this basis the entry fees received would be deferred in their entirety and recognised over the period of production. The size of the difference between the two approaches is monitored and is not currently expected to become material in the foreseeable future. The impact of the different approaches on profit before tax and net assets, which is not considered to be material, is as follows:
2015 2014
Reported profit before tax
£m
Underlying profit before tax
£mNet assets
£m
Reported profit before tax
£m
Underlying profit before tax
£mNet assets
£m
Adopted policy 160 1,432 5,016 67 1,617 6,387Difference (28)1 (28) (435) (30)1 (30) (402)Alternative policy 132 1,404 4,581 37 1,587 5,985
1 If the alternative policy were adopted, the difference would be included in profit before financing, which would change from £1,501m as reported to £1,473m (2014: £1,398m to £1,368m)
Internally generated development costsIAS 38 requires that internally generated development costs should only be recognised if strict criteria are met, in particular relating to technical feasibility and generation of future economic benefits. The Directors consider that, due to the complex nature of new equipment programmes, these criteria are not met until relatively late in the programme – Civil Aerospace programmes represent around half of development costs recognised; for these, the criteria are generally satisfied around the time of the initial engine certification.
Customer financing contingent liabilitiesThe Group has contingent liabilities in respect of financing support provided to customers. In order to assess whether a provision should be recognised, judgement as to the likelihood of these crystallising is required. This judgement is based on an assessment on the knowledge of the customers’ fleet plans, the underlying value of the security provided and, where appropriate, the customers’ creditworthiness.
KEY SOURCES OF ESTIMATION UNCERTAINTYIn applying the accounting policies, estimates are made in many areas; the actual outcome may differ from that calculated. The key sources of estimation uncertainty at the balance sheet date, that have a significant risk of causing material adjustment to the carrying amounts of assets and liabilities within the next financial year are set out below. The estimation of the relevant assets and liabilities involves the combination of a number of assumptions. Sensitivities are disclosed in the relevant notes where this is appropriate and practicable.
Forecasts and discount ratesThe carrying values of a number of items on the balance sheet are dependent on the estimates of future cash flows arising from the Group’s operations, in particular:
• The assessment of whether the goodwill and other intangible assets (carrying value at 31 December 2015: £1,502m, 31 December 2014: £1,658m) arising on the consolidation of RRPS is impaired is dependent of the present value of the future cash flows expected to be generated by the business.
• The assessment as to whether there are any indications of impairment of development, participation, certification, customer relationships and contractual aftermarket rights recognised as intangible assets (carrying values at 31 December 2015: £2,533m, 31 December 2014: £2,533m) is dependent on estimates of cash flows generated by the relevant assets and the discount rate used to calculate a present value. These estimates include the performance of long-term contractual arrangements as described below, as well as estimates for future market share, pricing and unit cost for uncontracted business. The risk of impairment is generally higher for newer programmes and for customer specific intangible assets (CARs) for launch customers and typically reduces as programmes become more established.
Assessment of long-term contractual arrangementsThe Group has long-term contracts that fall into different accounting periods and which can extend over significant periods – the most significant of these are long-term service arrangements in the Civil Aerospace business. The estimated revenues and costs are inherently imprecise and significant estimates are required to assess: engine flying hours, time on wing and other operating parameters; the pattern of future maintenance activity and the costs to be incurred; and life cycle cost improvements over the term of the contracts. The estimates take account of the inherent uncertainties and the risk of non-recovery of any resulting contract balances. During 2015, the methodologies for making these estimates were reviewed and refined.
Post-retirement benefitsThe Group’s defined benefit pension schemes and similar arrangements are assessed annually in accordance with IAS 19. The accounting valuation, which is based on assumptions determined with independent actuarial advice, resulted in a net deficit of £77m before deferred taxation being recognised on the balance sheet at 31 December 2015 (31 December 2014: net surplus £555m). The size of the net surplus/deficit is sensitive to the market value of the assets held by the schemes and to actuarial assumptions, which include price inflation, pension and salary increases, the discount rate used in assessing actuarial liabilities, mortality and other demographic assumptions and the levels of contributions. Further details are included in note 19.
Rolls-Royce Holdings plc Annual Report 2015 115
Financial Statements
Financial Statements

NOTES TO THE CONSOLIDATED FINANCIAL STATEMENTS CONTINUED
1 Accounting policies continuedProvisionsAs described in the accounting policy on page 120, the Group measures provisions (carrying value at 31 December 2015: £640m, 31 December 2014: £807m) at the Directors’ best estimate of the expenditure required to settle the obligation at the balance sheet date. These estimates take account of information available and different possible outcomes.
TaxationThe tax payable on profits is determined based on tax laws and regulations that apply in each of the numerous jurisdictions in which the Group operates. Where the precise impact of these laws and regulations is unclear, or uncertain, then reasonable estimates may be used to determine the tax charge included in the financial statements.
The main area of uncertainty is in relation to cross border transactions, entered into in the normal course of business, as the amount of income or profit taxable in each country involved can be subjective and therefore open to interpretation by the relevant tax authorities. This can result in disputes and possibly litigation.
Accruals for tax contingencies require management to make judgements and estimates of exposures in relation to tax audit issues and other areas of uncertainty. Contingent liabilities, including in respect of any tax disputes or litigation, are covered in note 23 (contingent liabilities). All provisions are in current liabilities. Any liability relating to interest or penalties on tax liabilities is included in the tax charge.
Deferred tax assets are recognised to the extent it is probable that future taxable profits will be available, against which the deductable temporary difference can be utilised, based on management’s assumptions relating to the amounts and timing of future taxable profits.
Further details on the Group’s tax position can be found on page 176.
SIGNIFICANT ACCOUNTING POLICIESThe Group’s significant accounting policies are set out below. These accounting policies have been applied consistently to all periods presented in these consolidated financial statements and by all Group entities.
Basis of consolidationThe Group consolidated financial statements include the financial statements of the Company and its subsidiary undertakings together with the Group’s share of the results of joint arrangements and associates made up to 31 December. In line with common practice in Germany, a small number of immaterial subsidiaries of Rolls-Royce Power Systems are not consolidated and are carried at cost in other investments. If such subsidiaries become material, they are consolidated. The difference between the net assets recognised and the investment cost eliminated is recognised in other operating income.
A subsidiary is an entity controlled by the Company. Control exists when the Company has power over an entity, exposure to variable returns from its involvement with an entity and the ability to use its power over an entity so as to affect the Company’s returns.
A joint arrangement is an entity in which the Group holds a long-term interest and which is jointly controlled by the Group and one or more other venturers under a contractual arrangement. Joint arrangements may be either joint ventures or joint operations. An associate is an entity, being neither a subsidiary nor a joint arrangement, in which the Group holds a long-term interest and where the Group has a significant influence. The results of joint ventures and associates are accounted for using the equity method of accounting. Joint operations are accounted for using proportionate accounting.
Any subsidiary undertakings, joint arrangements or associates sold or acquired during the year are included up to, or from, the date of change of control. Transactions with non-controlling interests are recorded directly in equity.
Where a put option over shares held by a non-controlling interest has been agreed, the Group recognises a liability for the estimated exercise value of that option. Movements in the estimated liability after initial recognition are recognised in the income statement.
All intra-group transactions, balances, income and expenses are eliminated on consolidation. Adjustments are made to eliminate the profit or loss arising on transactions with joint arrangements and associates to the extent of the Group’s interest in the entity.
Revenue recognitionRevenues comprise sales to outside customers after discounts, excluding value added taxes.
Sales of products (both original equipment and spare parts) are recognised when the significant risks and rewards of ownership of the goods are transferred to the customer, the sales price agreed and the receipt of payment can be assured – this is generally on delivery. On occasion, the Group may participate in the financing of OE, most commonly by the provision of guarantees as described in note 18. In such circumstances, the contingent obligations arising under these arrangements are taken into account in assessing when the significant risks and rewards of ownership have been transferred to the customer. As described on page 113, a sale of OE at a contractual price below its cost of manufacture is considered to give rise to revenue to the extent that an intangible asset (contractual aftermarket right) is recognised at the same time.
116 Rolls-Royce Holdings plc Annual Report 2015
Financial Statements

1 Accounting policies continued Sales of services are recognised by reference to the stage of completion based on services performed to date. As described on page 114, the assessment of the stage of completion is dependent on the nature of the contract, but will generally be based on: flying hours or equivalent for long-term aftermarket arrangements where the service is provided on a continuous basis; costs incurred to the extent these relate to services performed up to the reporting date; or achievement of contractual milestones where relevant.
As described on page 114, sales of products and services are treated as though they are a single contract where these components have been negotiated as a single commercial package and are so closely interrelated that they do not operate independently of each other and are considered to form a single transaction with an overall profit margin. The total revenue is allocated between the two components such that the total agreed discount to list prices is allocated to revenue for each of the two components pro rata, based on list prices. The revenue is then recognised for each component on this basis as the products are delivered and services provided, as described above. Where the contractual price of the OE component is below the revenue allocated from the combined arrangement, this will give rise to an asset included in ‘amounts recoverable on contracts’. This asset reduces as services are provided, increases as costs are incurred, and reduces to zero by the end of the contract. Where the balance is a liability, it is recognised in ‘accruals and deferred income’.
Provided that the outcome of construction contracts can be assessed with reasonable certainty, the revenues and costs on such contracts are recognised based on stage of completion and the overall contract profitability. Full provision is made for any estimated losses to completion of contracts, having regard to the overall substance of the arrangements.
Progress payments received, when greater than recorded revenue, are deducted from the value of work in progress except to the extent that payments on account exceed the value of work in progress on any contract where the excess is included in accruals and deferred income within trade and other payables. The amount by which recorded revenue of long-term contracts is in excess of payments on account is classified as amounts recoverable on contracts and is separately disclosed within trade and other receivables.
TotalCare arrangementsAs described above, these are accounted for on a stage of completion basis, with the stage of completion based on the proportion of flying hours completed compared to the total estimated under the contract. In making the assessment of future revenues, costs and the level of profit recognised the Group takes account of: (i) the forecast utilisation of the engines by the operator; (ii) the forecast costs to maintain the engines in accordance with the contractual requirements – the principal variables being the time between shop visits and the cost of each shop visit; and (iii) the recoverability of any contract asset arising. The Group benchmarks the forecast costs against previous programmes, recognising that the reliability of the forecasts will improve as operational experience of the engine increases. To the extent that actual costs differ from forecast costs or that forecast costs change, the cumulative impact is recognised in the period. An allowance is made against forecast contract revenues given the potential for reduced engine flying hours based on historical forecasting accuracy, the risk of aircraft being parked by the customer and the customer’s creditworthiness (previously assessed against contract assets arising, based on both the customer’s creditworthiness and an assessment of the importance of the particular engine fleet to the customer). Again, changes in this allowance are recognised in the period.
Risk and revenue sharing arrangements (RRSAs)As described on page 114, the Group enters into arrangements with certain workshare partners under which these suppliers: (i) contribute to the forecast costs of developing an engine by performing their own development work, providing development parts and paying a non-refundable cash entry fee; and (ii) supply components for the production phase for which they receive consideration, which is an agreed proportion of the total programme revenues. Both the suppliers’ contributions to the forecast non-recurring development costs and their consideration are determined by reference to their proportionate forecast scopes of supply relative to that of the engine overall. Once the forecast costs and the scopes of supply have been agreed at the inception of the contract, each party is then accountable for its own incurred costs. No accounting entries are recorded when the suppliers undertake development work or when development components are supplied. Cash sums received are recognised in the income statement, as a reduction in research and development costs incurred, to match the expensing of the Group’s related costs – where the cash sums are received in advance of the related costs being expensed or where the related costs are capitalised as intangible assets, the recognition of the cash received is deferred (in accruals and deferred income) to match the recognition of the related expense or the amortisation of the related intangible asset respectively. The payments to suppliers of their shares of the programme revenues for their production components are charged to cost of sales as programme revenues arise.
The Group has arrangements with partners who do not undertake development work or supply parts. Such arrangements are considered to be financial instruments as defined by IAS 32 Financial Instruments: Presentation and are accounted for using the amortised cost method.
Government investmentWhere a government or similar body has previously invested in a development programme, the Group treats payments to that body as royalty payments, which are matched to related sales.
Government grantsGovernment grants are recognised in the income statement so as to match them with the related expenses that they are intended to compensate. Where grants are received in advance of the related expenses, they are included in the balance sheet as deferred income. Non-monetary grants are recognised at fair value.
Rolls-Royce Holdings plc Annual Report 2015 117
Financial Statements
Financial Statements
NOTES TO THE CONSOLIDATED FINANCIAL STATEMENTS CONTINUED
1 Accounting policies continuedInterestInterest receivable/payable is credited/charged to the income statement using the effective interest method. Where borrowing costs are attributable to the acquisition, construction or production of a qualifying asset, such costs are capitalised as part of the specific asset.
TaxationThe tax charge/credit on the profit or loss for the year comprises current and deferred tax:
• Current tax is the expected tax payable for the year, using tax rates enacted or substantively enacted at the balance sheet date, and any adjustment to tax payable in respect of previous years.
• Deferred tax is provided using the balance sheet liability method, providing for temporary differences between the carrying amounts of the assets and liabilities for financial reporting purposes and the amounts used for tax purposes and is calculated using the enacted or substantively enacted rates that are expected to apply when the asset or liability is settled.
Tax is charged or credited in the income statement or other comprehensive income (OCI) as appropriate, except when it relates to items credited or charged directly to equity in which case the tax is also dealt with in equity.
Deferred tax liabilities are recognised for taxable temporary differences arising on investments in subsidiaries and joint arrangements, except where the Group is able to control the reversal of the temporary difference and it is probable that the temporary difference will not reverse in the foreseeable future. Deferred tax is not recognised on taxable temporary differences arising on the initial recognition of goodwill or for temporary differences arising from the initial recognition of assets and liabilities in a transaction that is not a business combination and that affects neither accounting nor taxable profit.
Deferred tax assets are recognised only to the extent that it is probable that future taxable profits will be available against which the assets can be utilised.
Foreign currency translationTransactions denominated in currencies other than the functional currency of the transacting Group undertaking are translated into the functional currency at the exchange rates ruling on the date of the transaction. Monetary assets and liabilities denominated in foreign currencies are translated into the relevant functional currency at the rate ruling at the year end. Exchange differences arising on foreign exchange transactions and the retranslation of assets and liabilities into functional currencies at the rate ruling at the year end are taken into account in determining profit before taxation.
The trading results of Group undertakings are translated into sterling at the average exchange rates for the year. The assets and liabilities of overseas undertakings, including goodwill and fair value adjustments arising on acquisition, are translated at the exchange rates ruling at the year end. Exchange adjustments arising from the retranslation of the opening net investments, and from the translation of the profits or losses at average rates, are recognised in OCI. The cumulative amount of exchange adjustments was, on transition to IFRS in 2004, deemed to be nil.
Financial instrumentsIAS 39 Financial Instruments: Recognition and Measurement requires the classification of financial instruments into separate categories for which the accounting requirement is different. The Group has classified its financial instruments as follows:
• short-term investments are generally classified as available for sale;• short-term deposits (principally comprising funds held with banks and other financial institutions), trade receivables and short-term
investments not designated as available for sale are classified as loans and receivables;• borrowings, trade payables, financial RRSAs, put options on NCI, and C Shares are classified as other liabilities; and• derivatives, comprising foreign exchange contracts, interest rate swaps and commodity swaps are classified as fair value through profit
or loss.
Financial instruments are recognised at the contract date and initially measured at fair value. Their subsequent measurement depends on their classification:
• Available for sale assets are held at fair value. Changes in fair value arising from changes in exchange rates are included in the income statement. All other changes in fair value are taken to equity. On disposal, the accumulated changes in value recorded in equity are included in the gain or loss recorded in the income statement.
• Loans and receivables and other liabilities are held at amortised cost and not revalued (except for changes in exchange rates and forecast contractual cash flows, which are included in the income statement) unless they are included in a fair value hedge accounting relationship. Where such a hedging relationship exists, the instruments are revalued in respect of the risk being hedged, with the change in value included in the income statement.
• Fair value through profit or loss items are held at fair value. Changes in fair value are included in the income statement unless the instrument is included in a cash flow hedge. If the instruments are included in an effective cash flow hedging relationship, changes in value are taken to equity. When the hedged forecast transaction occurs, amounts previously recorded in equity are recognised in the income statement.
Financial instruments are derecognised on expiry or when all contractual rights and obligations are transferred.
118 Rolls-Royce Holdings plc Annual Report 2015
Financial Statements

1 Accounting policies continuedHedge accountingThe Group does not generally apply hedge accounting in respect of forward foreign exchange contracts or commodity swaps held to manage the cash flow exposures of forecast transactions denominated in foreign currencies or in commodities respectively.
The Group applies hedge accounting in respect of transactions entered into to manage the fair value and cash flow exposures of its borrowings. Forward foreign exchange contracts are held to manage the fair value exposures of borrowings denominated in foreign currencies and are designated as fair value hedges. Interest rate swaps are held to manage the interest rate exposures and are designated as fair value or cash flow hedges of fixed and floating rate borrowings respectively.
Changes in the fair values of derivatives designated as fair value hedges and changes in fair value of the related hedged item are recognised directly in the income statement.
Changes in the fair values of derivatives that are designated as cash flow hedges and are effective are recognised directly in equity. Any ineffectiveness in the hedging relationships is included in the income statement. The amounts deferred in equity are recognised in the income statement to match the recognition of the hedged item.
Hedge accounting is discontinued when the hedging instrument expires or is sold, terminated, exercised, or no longer qualifies for hedge accounting. At that time, for cash flow hedges and if the forecast transaction remains probable, any cumulative gain or loss on the hedging instrument recognised in equity is retained in equity until the forecast transaction occurs. If a hedged transaction is no longer expected to occur, the net cumulative gain or loss previously recognised in equity is transferred to the income statement.
The portion of a gain or loss on an instrument used to hedge a net investment in a foreign operation that is determined to be an effective hedge is recognised directly in equity. The ineffective portion is recognised immediately in the income statement. Gains and losses accumulated in the translation reserve will be recycled to profit when the foreign operation is sold.
Business combinations and goodwillOn the acquisition of a business, fair values are attributed to the identifiable assets and liabilities and contingent liabilities unless the fair value cannot be measured reliably, in which case the value is subsumed into goodwill. Where fair values of acquired contingent liabilities cannot be measured reliably, the assumed contingent liability is not recognised but is disclosed in the same manner as other contingent liabilities.
Goodwill recognised represents the excess of the fair value of the purchase consideration over the fair value to the Group of the net of the identifiable assets acquired and the liabilities assumed. On transition to IFRS on 1 January 2004, business combinations were not retrospectively adjusted to comply with Adopted IFRS and goodwill was recognised based on the carrying value under the previous accounting policies. Goodwill in respect of the acquisition of a subsidiary is recognised as an intangible asset. Goodwill arising on the acquisition of joint arrangements and associates is included in the carrying value of the investment.
Certification costs and participation feesCosts incurred in respect of meeting regulatory certification requirements for new civil aero-engine/aircraft combinations including payments made to airframe manufacturers for this and participation fees are carried forward in intangible assets to the extent that they can be recovered out of future sales and are charged to the income statement over the programme life, up to a maximum of 15 years from the entry into service of the product.
Research and developmentIn accordance with IAS 38 Intangible Assets, expenditure incurred on research and development is distinguished as relating either to a research phase or to a development phase.
All research phase expenditure is charged to the income statement. Development expenditure is capitalised as an internally generated intangible asset only if it meets strict criteria, relating in particular to technical feasibility and generation of future economic benefits. As described on page 115, the Group considers that it is not possible to distinguish reliably between research and development activities until relatively late in the programme.
Expenditure capitalised is amortised over its useful economic life, up to a maximum of 15 years from the entry into service of the product.
Contractual aftermarket rightsAs described under key judgements on page 113, the Group may sell OE to customers at a price below its cost, on the basis that it also receives valuable aftermarket rights. Such a sale is considered to give rise to an intangible asset which is recognised, in accordance with IAS 38, at the same time as the revenue at an amount equal to the cash deficit and is amortised on a straight-line basis over the period that highly probable aftermarket sales are expected to be earned.
Customer relationshipsThe fair value of customer relationships recognised as a result of a business combination relate to the acquired company’s established relationships with its existing customers that result in repeat purchases and customer loyalty. Amortisation occurs on a straight-line basis over its useful economic life, up to a maximum of 15 years.
Rolls-Royce Holdings plc Annual Report 2015 119
Financial Statements
Financial Statements

NOTES TO THE CONSOLIDATED FINANCIAL STATEMENTS CONTINUED
1 Accounting policies continuedSoftwareThe cost of acquiring software that is not specific to an item of property, plant and equipment is classified as an intangible asset and amortised over its useful economic life, up to a maximum of five years.
Property, plant and equipmentProperty, plant and equipment are stated at cost less accumulated depreciation and any provision for impairment in value.
Depreciation is provided on a straight-line basis to write off the cost, less the estimated residual value, of property, plant and equipment over their estimated useful lives. No depreciation is provided on assets in the course of construction. Estimated useful lives are as follows:
i) land and buildings, as advised by the Group’s professional advisers: a) freehold buildings – five to 45 years (average 25 years); b) leasehold buildings – lower of adviser’s estimates or period of lease; c) no depreciation is provided on freehold land;ii) plant and equipment – five to 25 years (average 13 years);iii) aircraft and engines – five to 20 years (average 13 years).
Operating leasesPayments made and rentals received under operating lease arrangements are charged/credited to the income statement on a straight-line basis.
Impairment of non-current assetsImpairment of non-current assets is considered in accordance with IAS 36 Impairment of Assets. Where the asset does not generate cash flows that are independent of other assets, impairment is considered for the cash-generating unit to which the asset belongs. Goodwill and intangible assets not yet available for use are tested for impairment annually. Other intangible assets, property, plant and equipment and investments are assessed for any indications of impairment annually. If any indication of impairment is identified, an impairment test is performed to estimate the recoverable amount.
If the recoverable amount of an asset (or cash-generating unit) is estimated to be below the carrying value, the carrying value is reduced to the recoverable amount and the impairment loss recognised as an expense. The recoverable amount is the higher of value in use or fair value less costs to sell, if this is readily available. The value in use is the present value of future cash flows using a pre-tax discount rate that reflects the time value of money and the risk specific to the asset.
InventoriesInventories and work in progress are valued at the lower of cost and net realisable value on a first-in, first-out basis. Cost comprises direct materials and, where applicable, direct labour costs and those overheads, including depreciation of property, plant and equipment, that have been incurred in bringing the inventories to their present location and condition. Net realisable value represents the estimated selling prices less all estimated costs of completion and costs to be incurred in marketing, selling and distribution.
Cash and cash equivalentsCash and cash equivalents include cash at bank and in hand, investments in money-market funds and short-term deposits with a maturity of three months or less on inception. The Group considers overdrafts (repayable on demand) to be an integral part of its cash management activities and these are included in cash and cash equivalents for the purposes of the cash flow statement.
ProvisionsProvisions are recognised when the Group has a present obligation as a result of a past event, and it is probable that the Group will be required to settle that obligation. Provisions are measured at the Directors’ best estimate of the expenditure required to settle the obligation at the balance sheet date, and are discounted to present value where the effect is material.
Post-retirement benefitsPensions and similar benefits (principally healthcare) are accounted for under IAS 19 Employee Benefits.
For defined benefit plans, obligations are measured at discounted present value, using a discount rate derived from high-quality corporate bonds denominated in the currency of the plan, whilst plan assets are recorded at fair value. Surpluses in schemes are recognised as assets only if they represent economic benefits available to the Group in the future. A liability is recognised to the extent that the minimum funding requirements in respect of past service will give rise to an unrecognisable surplus.
The service and financing costs of such plans are recognised separately in the income statement:
• current service costs are spread systematically over the lives of employees;• past service costs are recognised immediately; and• financing costs are recognised in the periods in which they arise.
Actuarial gains and losses and movements in unrecognised surpluses and minimum funding liabilities are recognised immediately in OCI.
Payments to defined contribution schemes are charged as an expense as they fall due.
120 Rolls-Royce Holdings plc Annual Report 2015
Financial Statements
1 Accounting policies continuedShare-based paymentsThe Group provides share-based payment arrangements to certain employees. These are principally equity-settled arrangements and are measured at fair value (excluding the effect of non-market based vesting conditions) at the date of grant. The fair value is expensed on a straight-line basis over the vesting period. The amount recognised as an expense is adjusted to reflect the actual number of shares or options that will vest, except where additional shares vest as a result of the total shareholder return (TSR) performance condition in the Performance Share Plan (PSP).
Cash-settled share options (grants in the International ShareSave plan) are measured at fair value at the balance sheet date. The Group recognises a liability at the balance sheet date based on these fair values, taking into account the estimated number of options that will actually vest and the relative completion of the vesting period. Changes in the value of this liability are recognised in the income statement for the year.
The cost of shares of Rolls-Royce Holdings plc held by the Group for the purpose of fulfilling obligations in respect of employee share plans is deducted from equity in the consolidated balance sheet. See note 21 for a further description of the share-based payment plans.
Sales financing supportIn connection with the sale of its products, the Group will, on occasion, provide financing support for its customers. These arrangements fall into two categories: credit-based guarantees and asset-value guarantees. In accordance with the requirements of IAS 39 and IFRS 4 Insurance Contracts, credit-based guarantees are treated as insurance contracts. The Group considers asset-value guarantees to be non-financial liabilities and accordingly these are also treated as insurance contracts. As described on page 115, the Directors consider the likelihood of crystallisation in assessing whether provision is required for any contingent liabilities.
The Group’s contingent liabilities relating to financing arrangements are spread over many years and relate to a number of customers and a broad product portfolio, and are reported on a discounted basis.
Revisions to Adopted IFRS in 2015There were no changes to accounting standards that had a material impact on the 2015 financial statements.
Revisions to IFRS not applicable in 2015Standards and interpretations issued by the IASB are only applicable if endorsed by the EU.
Once endorsed, IFRS 9 Financial Instruments will simplify the classification of financial assets for measurement purposes, but is not anticipated to have a significant impact on the financial statements.
IFRS 15 Revenue from Contracts with Customers (effective for the year ending 31 December 2018, not yet endorsed by the EU) provides a single, principles-based five-step model to be applied to all sales contracts, based on the transfer of control of goods and services to customers. It replaces the separate models for goods, services and construction contracts currently included in IAS 11 Construction Contracts and IAS 18 Revenue. Given the nature of the Group’s long-term contracts, it is likely that the adoption of IFRS 15 will require significant judgement.
Based on the provisional assessment, IFRS 15 will have a significant impact on the timing of recognition of revenue on individual long-term contracts, most particularly in the Civil Aerospace business, although this impact is likely to be significantly reduced at a Group level when all long-term contracts (with different start and end dates) are combined. The key areas of judgement are: (i) whether contractual aftermarket rights can continue to be recognised; (ii) whether OE and TotalCare contracts can be linked for accounting purposes; and (iii) how performance should be measured on TotalCare contracts. The Group will continue to assess the impact during 2016 and also consider the interpretations of other aerospace and defence companies .
IFRS 16 Leases (effective for the year ending 31 December 2019, not yet endorsed by the EU) will require all leases to be recognised on the balance sheet. Currently, IAS 17 Leases only requires leases categorised as finance leases to be recognised on the balance sheet, with leases categorised as operating leases not recognised. In broad terms, the impact will be to recognise a lease liability and corresponding asset for the operating lease commitments set out in note 22.
The Group does not consider that any other standards, amendments or interpretations issued by the IASB, but not yet applicable, will have a significant impact on the financial statements.
Rolls-Royce Holdings plc Annual Report 2015 121
Financial Statements
Financial Statements

NOTES TO THE CONSOLIDATED FINANCIAL STATEMENTS CONTINUED
2 Segmental analysisThe analysis by Division (business segment) is presented in accordance with IFRS 8 Operating Segments, on the basis of those segments whose operating results are regularly reviewed by the Board (the Chief Operating Decision Maker as defined by IFRS 8), as follows:
AEROSPACE DIVISION:Civil – development, manufacture, marketing and sales of commercial aero engines and aftermarket services.Defence – development, manufacture, marketing and sales of military aero engines and aftermarket services.
LAND & SEA DIVISION:Power Systems – development, manufacture, marketing and sales of reciprocating engines and power systems.Marine – development, manufacture, marketing and sales of marine-power propulsion systems and aftermarket services.Nuclear – development, manufacture, marketing and sales of nuclear systems for civil power generation and naval
propulsion systems.
The Energy business was sold on 1 December 2014 and is excluded from the 2014 comparative figures. The residual businesses previously included in the Energy sector and costs associated with the wind-down are shown as ‘Other’.
The operating results reviewed by the Board are prepared on an underlying basis, which the Board considers reflects better the economic substance of the Group’s trading during the year. Additional disclosure of the two segments is also provided. The principles adopted to determine underlying results are:
Underlying revenues – Where revenues are denominated in a currency other than the functional currency of the Group undertaking, these reflect the achieved exchange rates arising on settled derivative contracts.
Underlying profit before financing – Where transactions are denominated in a currency other than the functional currency of the Group undertaking, this reflects the transactions at the achieved exchange rates on settled derivative contracts. In addition, adjustments have been made to exclude one-off past service credits on post-retirement schemes, exceptional restructuring costs, the effect of acquisition accounting and the impairment of goodwill.
Underlying profit before taxation – In addition to those adjustments in underlying profit before financing:
• includes amounts realised from settled derivative contracts and revaluation of relevant assets and liabilities to exchange rates forecast to be achieved from future settlement of derivative contracts; and
• excludes unrealised amounts arising from revaluations required by IAS 39 Financial Instruments: Recognition and Measurement, changes in value of financial RRSA contracts arising from changes in forecast payments, changes in the value of put options on NCI and the net impact of financing costs related to post-retirement scheme benefits.
Taxation – the tax effect of the adjustments above are excluded from the underlying tax charge. In addition changes in the amount of recoverable advance corporation tax recognised and the impact of changes in tax rates are also excluded.
This analysis also includes a reconciliation of the underlying results to those reported in the consolidated income statement.
122 Rolls-Royce Holdings plc Annual Report 2015
Financial Statements

2 Segmental analysis continuedAerospace Land & Sea
Inter-segment
£m
Total reportable segments
£mCivil
£mDefence
£mTotal
£m
Power Systems
£mMarine
£mNuclear
£mOther 1
£m
Intra-segment
£mTotal
£m
Year ended 31 December 2015Underlying revenue from sale of original equipment 3,258 801 4,059 1,618 773 251 76 (53) 2,665 – 6,724 Underlying revenue from aftermarket services 3,675 1,234 4,909 767 551 436 20 (53) 1,721 – 6,630 Total underlying revenue 6,933 2,035 8,968 2,385 1,324 687 96 (106) 4,386 – 13,354 Gross profit 1,526 579 2,105 635 260 111 64 7 1,077 – 3,182 Commercial and administrative costs (296) (124) (420) (275) (201) (53) (4) – (533) – (953)Restructuring (7) (8) (15) (4) (16) (2) (2) – (24) – (39)Research and development costs (515) (73) (588) (162) (28) 14 (1) – (177) – (765)Share of results of joint ventures and associates 104 19 123 – – – (5) – (5) – 118 Underlying profit before financing and taxation 812 393 1,205 194 15 70 52 7 338 – 1,543
Segment assets 11,229 1,437 12,666 3,376 1,481 300 119 – 5,276 (850) 17,092 Investments in joint ventures and associates 545 12 557 8 7 3 1 – 19 – 576 Segment liabilities (8,709) (1,698) (10,407) (1,017) (783) (324) (120) – (2,244) 850 (11,801)Net assets/(liabilities) 3,065 (249) 2,816 2,367 705 (21) – – 3,051 – 5,867 Investment in intangible assets, property, plant and equipment and joint ventures and associates 668 84 752 108 36 18 – – 162 – 914 Depreciation, amortisation and impairment 410 58 468 197 111 23 11 – 342 – 810
Year ended 31 December 2014 Underlying revenue from sale of original equipment 2 3,463 816 4,279 1,893 1,070 230 24 (78) 3,139 – 7,418 Underlying revenue from aftermarket services 2 3,374 1,253 4,627 827 639 408 22 (77) 1,819 – 6,446 Total underlying revenue 6,837 2,069 8,906 2,720 1,709 638 46 (155) 4,958 – 13,864 Gross profit 1,675 567 2,242 742 425 119 8 (13) 1,281 – 3,523 Commercial and administrative costs (283) (112) (395) (296) (254) (61) (10) – (621) – (1,016)Restructuring (82) (55) (137) (7) (4) (1) – – (12) – (149)Research and development costs (461) (50) (511) (183) (29) (7) – – (219) – (730)Share of results of joint ventures and associates 93 16 109 (3) – – – – (3) – 106 Underlying profit before financing and taxation 942 366 1,308 253 138 50 (2) (13) 426 – 1,734
Segment assets 10,268 1,460 11,728 3,581 1,636 333 621 (22) 6,149 (1,269) 16,608 Investments in joint ventures and associates 507 13 520 7 5 3 4 – 19 – 539 Segment liabilities (7,418) (1,743) (9,161) (1,100) (1,075) (389) (491) – (3,055) 1,269 (10,947)Net assets/(liabilities) 3,357 (270) 3,087 2,488 566 (53) 134 (22) 3,113 – 6,200 Investment in intangible assets, property, plant and equipment and joint ventures and associates 836 78 914 144 36 23 8 – 211 – 1,125 Depreciation, amortisation and impairment 381 49 430 221 38 22 13 – 294 – 724
1 Energy business retained following 2014 disposal.2 The basis for the allocation of Civil Aerospace revenues on linked TotalCare contracts between OE and aftermarket has been reviewed and amendments made to reflect better the
commercial substance of the combined contracts. Historically, the allocation has resulted in OE revenue and aftermarket revenue reflecting the contractual terms rather than the commercial substance of the contracts. The 2014 figures have been restated on the same basis; the impact was an increase in OE revenue of £198m and an equal decrease in aftermarket revenue.
Rolls-Royce Holdings plc Annual Report 2015 123
Financial Statements
Financial Statements

NOTES TO THE CONSOLIDATED FINANCIAL STATEMENTS CONTINUED
2 Segmental analysis continuedRECONCILIATION TO REPORTED RESULTS
Total reportable segments
£m
Underlying central items
£m
Totalunderlying
£m
Underlying adjustments
£m
Discontinued business
£mGroup
£mYear ended 31 December 2015Revenue from sale of original equipment 6,724 6,724 215 6,939 Revenue from aftermarket services 6,630 6,630 156 6,786 Total revenue 13,354 13,354 371 13,725 Gross profit 3,182 3,182 84 3,266 Other operating income – – – 10 10 Commercial and administrative costs (953) (51)1 (1,004) (55) (1,059)Restructuring (39) – (39) 39 – Research and development costs (765) – (765) (53) (818)Share of results of joint ventures and associates 118 – 118 (18) 100 Profit on disposal of businesses – – – 2 2 Profit before financing and taxation 1,543 (51) 1,492 9 1,501 Net financing (60) (60) (1,281) (1,341)Profit before taxation (111) 1,432 (1,272) 160 Taxation (351) (351) 275 (76)Profit for the year from continuing operations 1,081 (997) 84 Profit for the year from discontinued operations – – – Profit for the year 1,081 (997) 84 Attributable to:Ordinary shareholders 1,080 (997) 83 Non-controlling interests 1 – 1
Year ended 31 December 2014Revenue from sale of original equipment 7,418 7,418 (1) 7,417 Revenue from aftermarket services 6,446 6,446 (127) 6,319 Total revenue 13,864 13,864 (128) 13,736 Gross profit 3,523 3,523 (320) 3,203 Other operating income – – – 10 10 Commercial and administrative costs (1,016) (53)1 (1,069) (55) (1,124)Restructuring (149) – (149) 149 – Research and development costs (730) – (730) (63) (793)Share of results of joint ventures and associates 106 – 106 (12) 94 Profit on transfer of joint ventures to subsidiaries – – – 2 2 Profit on disposal of businesses – – – 6 6 Profit before financing and taxation 1,734 (53) 1,681 (283) 1,398 Net financing (61) (61) (1,270) (1,331)Profit before taxation (114) 1,620 (1,553) 67 Taxation (388) (388) 237 (151)Profit for the year from continuing operations 1,232 (1,316) (84)Profit for the year from discontinued operations – – 142 142 Profit for the year 1,232 (1,316) 142 58 Attributable to:Ordinary shareholders 1,226 (1,299) 142 69 Non-controlling interests 6 (17) – (11)
1 Central corporate costs.
CASH FLOWS FROM DISCONTINUED OPERATIONS2014
£mRevenue 713Profit before taxation 1Tax on ordinary activities 3Profit for the year from ordinary activities 4Profit on disposal of discontinued operations 136Tax on profit on disposal of discontinued operations 2Profit for the year from discontinued operations 142Net cash outflow from operating activities (127)Net cash outflow from investing activities (35)Net change in cash and cash equivalents (162)
124 Rolls-Royce Holdings plc Annual Report 2015
Financial Statements

2 Segmental analysis continuedUNDERLYING ADJUSTMENTS
2015 2014
Revenue£m
Profit beforefinancing
£m
Net financing
£mTaxation
£mRevenue
£m
Profit beforefinancing
£m
Net financing
£mTaxation
£m
Underlying performance previously reported 14,588 1,678 (61) (387)
Energy disposed in 2014 (724) 3 – (1)Underlying performance 13,354 1,492 (60) (351) 13,864 1,681 (61) (388)
Revenue recognised at exchange rate on date of transaction 371 – – – (128) – – – Realised losses/(gains) on settled derivative contracts 1 – 287 (35) – – (91) (5) – Net unrealised fair value changes to derivative contracts 2 – (9) (1,306) – – (15) (1,141) – Effect of currency on contract accounting – (9) – – – 13 – – Revaluation of trading assets and liabilities – (13) 20 – – (11) (8) – Put option on NCI and financial RRSAs – foreign exchange differences and other unrealised changes in value – – 8 – – – (87) – Effect of acquisition accounting 3 – (124) – – – (142) – – Impairment of goodwill – (75) – – – – – –Net post-retirement scheme financing – – 32 – – – (29) – Gain on reclassification of joint ventures to subsidiaries – – – – – 2 – – Disposal of businesses – 2 – – – 6 – – Restructuring 4 – (49) – – – (39) – – Other – (1) – – – (6) – – Related tax effect 5 – – – 275 – – – 237 Total underlying adjustments 371 9 (1,281) 275 (128) (283) (1,270) 237
Reported per consolidated income statement 13,725 1,501 (1,341) (76) 13,736 1,398 (1,331) (151)
1 Realised losses/(gains) on settled derivative contracts include adjustments to reflect the losses/(gains) in the same period as the related trading cash flows.2 Unrealised fair value changes to derivative contracts included in profit before financing: (i) include those included in equity accounted joint ventures; and (ii) exclude those for which
the related trading contracts have been cancelled when the fair value changes are recognised immediately in underlying profit.3 The adjustment eliminates charges recognised as a result of recognising assets in acquired businesses at fair value.4 Restructuring is excluded from underlying performance when it concerns the closure of a significant business or site.5 2015 includes an £18m credit relating to changes in UK tax rates. 2014 included a charge of £64m for the derecognition of advance corporation tax.
The reconciliation of underlying earnings per ordinary share is shown in note 6.
RECONCILIATION TO THE BALANCE SHEET2015
£m2014
£m
Reportable segment assets 17,092 16,608 Investments in joint ventures and associates 576 539 Cash and cash equivalents and short-term investments 3,178 2,869 Fair value of swaps hedging fixed rate borrowings 74 80 Income tax assets 341 388 Post-retirement scheme surpluses 1,063 1,740 Total assets 22,324 22,224 Reportable segment liabilities (11,801) (10,947)Borrowings (3,302) (2,261)Fair value of swaps hedging fixed rate borrowings (61) (22)Income tax liabilities (1,004) (1,422)Post-retirement scheme deficits (1,140) (1,185)Total liabilities (17,308) (15,837)Net assets 5,016 6,387
Rolls-Royce Holdings plc Annual Report 2015 125
Financial Statements
Financial Statements

NOTES TO THE CONSOLIDATED FINANCIAL STATEMENTS CONTINUED
2 Segmental analysis continuedGEOGRAPHICAL SEGMENTS The Group’s revenue by destination from continuing operations is as follows:
2015£m
2014£m
United Kingdom 1,780 1,599 Germany 642 734 Switzerland 782 670 Norway 280 322 France 249 292 Italy 222 201 Spain 200 113 Russia 59 86 Rest of Europe 786 575 Europe 5,000 4,592 United States of America 3,591 3,751 Canada 475 472 North America 4,066 4,223 South America 425 407 Saudi Arabia 365 327 Rest of Middle East 445 418 Middle East 810 745 China 1,236 1,290 South Korea 278 485 Singapore 549 396 Malaysia 78 280 Japan 136 272 India 99 161 Rest of Asia 546 493 Asia 2,922 3,377 Africa 144 115 Australasia 278 207 Other 80 70
13,725 13,736
No single customer represented 10% or more of the Group’s revenue.
The carrying amounts of the Group’s non-current assets, excluding financial instruments, deferred tax assets and post-employment benefit surpluses, by the geographical area in which the assets are located, are as follows:
2015£m
2014£m
United Kingdom 4,072 3,864 United States of America 835 827 Nordic countries 598 724 Germany 2,339 2,493 Other 900 912
8,744 8,820
126 Rolls-Royce Holdings plc Annual Report 2015
Financial Statements

3 Research and development2015
£m2014
£m
Expenditure in the year (831) (818)Capitalised as intangible assets 51 83 Amortisation of capitalised costs (136) (125)Net research and development cost (916) (860)Entry fees received 83 51 Entry fees deferred in respect of charges in future years (28) (38)Recognition of previously deferred entry fees 43 54 Net cost recognised in the income statement (818) (793)Underlying adjustments relating to effects of acquisition accounting and foreign exchange 53 63 Net underlying cost recognised in the income statement (765) (730)Discontinued operations (25)Net underlying cost recognised in the income statement previously reported (755)
4 Net financing
Notes
2015 2014
Per consolidated
income statement
£m
Underlyingfinancing 2
£m
Per consolidated
income statement
£m
Underlyingfinancing 2
£m
Financing incomeInterest receivable 12 12 17 17 Fair value gains on foreign currency contracts 1 17 – – 2 – Put option on NCI and financial RRSAs – foreign exchange differences and other unrealised changes in value 17 21 – 89 – Finance income on post-retirement scheme surpluses 19 65 – 13 – Net foreign exchange gains 3 17 32 – –
115 44 121 17 Financing costsInterest payable (71) (71) (63) (63)Fair value losses on foreign currency contracts 1 17 (1,217) – (1,127) – Put option on NCI and financial RRSAs – financing 17 (8) (8) (7) (5)Put option on NCI and financial RRSAs – foreign exchange differences and other unrealised changes in value 17 (13) – (174) – Fair value losses on commodity derivatives 1 17 (89) – (15) – Finance cost on post-retirement scheme deficits 19 (33) – (42) – Net foreign exchange losses – – (13) – Other financing charges (25) (25) (11) (10)
(1,456) (104) (1,452) (78)Net financing (1,341) (60) (1,331) (61)
Analysed as:Net interest payable (59) (59) (46) (46)Net post-retirement scheme financing 32 – (29) – Net other financing (1,314) (1) (1,256) (15)Net financing (1,341) (60) (1,331) (61)1 Net loss on fair value items through profit or loss (1,306) – (1,140) –
2 See note 2 3 The underlying financing income includes £34m from gains on settlement of foreign exchange contracts following the receipt in the UK of dividends from overseas subsidiaries.
Rolls-Royce Holdings plc Annual Report 2015 127
Financial Statements
Financial Statements

NOTES TO THE CONSOLIDATED FINANCIAL STATEMENTS CONTINUED
5 TaxationUK Overseas Total
2015£m
2014£m
2015£m
2014£m
2015£m
2014£m
Current taxCurrent tax charge for the year 9 8 157 240 166 248 Less double tax relief – – – – – –
9 8 157 240 166 248 Adjustments in respect of prior years 6 1 (23) 12 (17) 13
15 9 134 252 149 261
Deferred taxDeferred tax credit for the year (37) (72) (23) (77) (60) (149)Adjustments in respect of prior years 10 (14) (5) (11) 5 (25)Derecognition of advance corporation tax – 64 – – – 64 Deferred tax credit resulting from reduction in tax rates (18) – – – (18) –
(45) (22) (28) (88) (73) (110)
Recognised in the income statement (30) (13) 106 164 76 151
OTHER TAX CREDITS/(CHARGES)OCI Equity
Items that will not be reclassified
Items that may be reclassified
2015£m
2014£m
2015£m
2014£m
2015£m
2014£m
Current tax:Share-based payments – direct to equity – 3
Deferred tax:Movement in post-retirement schemes 257 (431)Share-based payments – direct to equity (6) (7)Net investment hedge (2) (2)
257 (431) (2) (2) (6) (4)
TAX RECONCILIATION ON CONTINUING OPERATIONS 2015
£m2014
£m
Profit before taxation 160 67 Less share of results of joint ventures and associates (note 11) (100) (94)Profit before taxation excluding joint ventures and associates 60 (27)
Nominal tax charge at UK corporation tax rate 20.25% (2014: 21.5%) 12 (6)UK R&D credit – (6)Rate differences 1 63 71 Impairment of goodwill 13 – Change in value of put option on NCI – 17Other permanent differences 5 22 Benefit to deferred tax from previously unrecognised tax losses and temporary differences (7) (3)Tax losses in year not recognised in deferred tax 20 4 Adjustments in respect of prior years (12) (12)Derecognition of advance corporation tax – 64 Reduction in closing deferred taxes resulting from decrease in tax rates (18) –
76 151 Underlying items (note 2) 351 388 Non-underlying items (275) (237)
76 151
1 Rate differences mainly relate to tax on profits in countries, such as the US and Germany, which have higher tax rates than the UK.
128 Rolls-Royce Holdings plc Annual Report 2015
Financial Statements

5 Taxation continuedTAX ON DISCONTINUED OPERATIONS
2015£m
2014£m
Tax credit on ordinary activities of the discontinued operations – (3)Tax credit on profit on disposal of discontinued operations – (2)
– (5)
DEFERRED TAXATION ASSETS AND LIABILITIES2015
£m2014
£m
At 1 January (859) (566)Amount credited to income statement 73 120 Amount credited/(charged) to other comprehensive income 255 (433)Amount charged to equity (6) (7)Acquisition of businesses – (3)Exchange differences 16 30
At 31 December (521) (859)Deferred tax assets 318 369 Deferred tax liabilities (839) (1,228)
(521) (859)
The analysis of the deferred tax position is as follows:At
1 January 2015
£m
Recognisedin income
statement £m
Recognisedin OCI
£m
Recognisedin equity
£m
Exchange differences
£m
At 31 December
2015£m
Intangible assets (455) 52 – – 11 (392)Property, plant and equipment (195) 7 – – (2) (190)Other temporary differences 97 (69) (2) (7) 2 21 Amounts recoverable on contracts (526) (13) – – – (539)Pensions and other post-retirement scheme benefits (324) (30) 257 – 7 (90)Foreign exchange and commodity financial assets and liabilities 135 171 – – – 306 Losses 393 (49) – 1 (2) 343 R&D expenditure credit 16 4 – – – 20 Advance corporation tax – – – – – –
(859) 73 255 (6) 16 (521)
At 1 January
2014£m
Recognisedin income
statement £m
Recognisedin OCI
£m
Recognisedin equity
£m
Disposals of businesses
£m
Exchange movements
£m
At 31 December
2014£m
Intangible assets (511) 41 – – – 15 (455)Property, plant and equipment (210) 20 – – (6) 1 (195)Other temporary differences 80 23 (2) (10) (1) 7 97 Amounts recoverable on contracts (380) (146) – – – – (526)Pensions and other post-retirement scheme benefits 153 (54) (431) – – 8 (324)Foreign exchange and commodity financial assets and liabilities (92) 226 – – – 1 135 Losses 323 65 – 3 4 (2) 393 R&D expenditure credit 7 9 – – – 16 Advance corporation tax 64 (64) – – – – –
(566) 120 (433) (7) (3) 30 (859)Included in: Taxation 110 Discontinued operations 10
Rolls-Royce Holdings plc Annual Report 2015 129
Financial Statements
Financial Statements

NOTES TO THE CONSOLIDATED FINANCIAL STATEMENTS CONTINUED
5 Taxation continuedUNRECOGNISED DEFERRED TAX ASSETS
2015£m
2014£m
Advance corporation tax 182 182 Losses and other unrecognised deferred tax assets 36 35 Deferred tax not recognised on unused tax losses and other items on the basis that future economic benefit is uncertain 1 218 217
1 Advance corporation tax, tax losses and other deductible temporary differences are not expected to expire under current legislation.
DEFERRED TAXATION ASSETS AND LIABILITIES
The Summer Budget 2015 announced that the UK corporation tax rate will reduce to 19% from 1 April 2017 and 18% from 1 April 2020; these reductions were substantively enacted on 26 October 2015. As the reductions were substantively enacted prior to the year end, the closing deferred tax assets and liabilities have been calculated at this rate. The resulting charges or credits have been recognised in the income statement except to the extent that they relate to items previously charged or credited to OCI or equity. Accordingly, in 2015, £18m has been credited to the income statement and £3m has been charged directly to equity.
The temporary differences associated with investments in subsidiaries, joint ventures and associates, for which a deferred tax liability has not been recognised, aggregate to £347m (2014: £512m). No deferred tax liability has been recognised on the potential withholding tax due on the remittance of undistributed profits as the Group is able to control the timing of such remittances and it is probable that consent will not be given in the foreseeable future.
6 Earnings per ordinary shareBasic earnings per ordinary share (EPS) are calculated by dividing the profit attributable to ordinary shareholders by the weighted average number of ordinary shares in issue during the year, excluding ordinary shares held under trust, which have been treated as if they had been cancelled.
Diluted EPS are calculated by adjusting the weighted average number of ordinary shares in issue during the year for the bonus element of share options.
2015 2014
Basic
Potentially dilutive
share options Diluted Basic
Potentially dilutive
share options Diluted1
Profit attributable to ordinary shareholders (£m):Continuing operations 83 83 (73) (73)Discontinued operations – – 142 142
83 83 69 69 Weighted average number of ordinary shares (millions) 1,839 12 1,851 1,874 18 1,892 EPS (pence):
Continuing operations 4.51 (0.03) 4.48 (3.90) – (3.90)Discontinued operations – – – 7.58 – 7.58
4.51 (0.03) 4.48 3.68 – 3.68
1 As profit from continuing operations is negative, the effect of potentially dilutive ordinary shares is anti-dilutive.
The reconciliation between underlying EPS and basic EPS is as follows:2015 2014
Pence £m Pence £m
Underlying EPS/Underlying profit attributable to ordinary shareholders 58.73 1,080 65.42 1,226 Total underlying adjustments to profit before tax (note 2) (69.17) (1,272) (82.88) (1,553)Related tax effects 14.95 275 12.65 237 Profit on disposal of discontinued operations – – 7.58 142 Related NCI effects – – 0.91 17
EPS/Profit attributable to ordinary shareholders 4.51 83 3.68 69 Diluted underlying EPS 58.35 64.80
130 Rolls-Royce Holdings plc Annual Report 2015
Financial Statements

7 Employee information2015
Number2014
Number
Average number of employeesUnited Kingdom 23,200 24,500 United States of America 6,400 7,900 Canada 1,100 1,500 Germany 10,700 10,500 Nordics 3,800 4,000 Rest of world 5,300 5,700
50,500 54,100 Civil 23,200 23,900 Defence 6,400 7,000 Aerospace 29,600 30,900 Power Systems 10,600 10,700 Marine 6,000 6,400 Nuclear 4,100 4,100 Other (2014: included discontinued operations) 200 2,000Land & Sea 20,900 23,200
50,500 54,100
£m £m
Group employment costs 1
Wages and salaries 2,442 2,646 Social security costs 334 362 Share-based payments (note 21) 5 21 Pensions and other post-retirement scheme benefits (note 19) 299 328
3,080 3,357
1 Remuneration of key management personnel is shown in note 24.
8 Auditors’ remunerationFees payable to the Company’s auditors and its associates were as follows:
2015£m
2014£m
Fees payable to the Company's auditors for the audit of the Company's annual financial statements 1 0.3 0.2 Fees payable to the Company's auditors and its associates for the audit of the Company's subsidiaries pursuant to legislation 5.6 5.5Total fees payable for audit services 5.9 5.7 Fees payable to the Company's auditors and its associates for other services:
Audit related assurance services 2 1.3 1.1 Taxation compliance services 0.4 0.7 All other services – 0.4
7.6 7.9Fees payable in respect of the Group's pension schemes:
Audit 0.2 0.2
1 The level of fees payable to the Company’s auditors for the audit of the Company’s annual financial statements reflects the fact that limited incremental work is required in respect of the audit of these financial statements. Rolls-Royce plc, a subsidiary of the Company, is also required to prepare consolidated financial statements and the fees payable to the Company’s auditors for the audit of those financial statements, including the audit of the sub-consolidation, is included in the audit of the Company’s subsidiaries pursuant to legislation.
2 This includes £0.3m (2014: £0.3m) for the review of the half-year report.
Rolls-Royce Holdings plc Annual Report 2015 131
Financial Statements
Financial Statements

132 Rolls-Royce Holdings plc Annual Report 2015
Financial Statements
NOTES TO THE CONSOLIDATED FINANCIAL STATEMENTS CONTINUED
9 Intangible assets
Goodwill£m
Certificationcosts and
participation fees£m
Developmentexpenditure
£m
Contractualaftermarket
rights£m
Customer relationships
£mSoftware
£mOther
£mTotal
£m
Cost:At 1 January 2014 1,861 928 1,646 580 475 453 532 6,475
Reclassifications 1 (8) – 4 – 11 19 (28) (2)Exchange differences (112) (8) (43) – (17) (1) (28) (209)Additions – 159 100 93 – 83 42 477 Acquisitions of businesses 1 – – – – – – 1 Disposals of businesses (67) – – (35) – (11) – (113)
At 1 January 2015 1,675 1,079 1,707 638 469 543 518 6,629 Exchange differences (87) (7) (32) – (14) – (16) (156)Additions – 73 55 161 – 79 40 408 Acquisitions of businesses 1 – – – 1 – 1 3 Disposals – – – – – (6) – (6)
At 31 December 2015 1,589 1,145 1,730 799 456 616 543 6,878
Accumulated amortisation:At 1 January 2014 23 265 444 352 69 198 137 1,488
Reclassifications 1 (8) – 4 – (11) 5 6 (4)Exchange differences – – (9) – (4) – (6) (19)Charge for the year 2 – 46 125 37 42 63 53 366 Impairment 1 – – – – – – 1 Disposal of business – – – – – (7) – (7)
At 1 January 2015 16 311 564 389 96 259 190 1,825 Exchange differences (5) (1) (10) – (3) – (3) (22)Charge for the year 2 – 63 137 55 46 68 38 407 Impairment 75 – – – – – – 75 Reversal of impairment – – – (50) – – – (50)Disposals – – – – – (2) – (2)
At 31 December 2015 86 373 691 394 139 325 225 2,233
Net book value:At 31 December 2015 1,503 772 1,039 405 317 291 318 4,645 At 31 December 2014 1,659 768 1,143 249 373 284 328 4,804 At 1 January 2014 1,838 663 1,202 228 406 255 395 4,987
1 In 2013, following the acquisition of RRPS, the Group revised the classification of intangible assets. During 2014, a number of minor inconsistencies in these classifications were identified and amended. The net movement of £2m relates to software previously included in property, plant and equipment.
2 Charged to cost of sales except development costs, which are charged to research and development costs.
GOODWILLIn accordance with the requirements of IAS 36 Impairment of Assets, goodwill is allocated to the Group’s cash-generating units, or groups of cash-generating units, that are expected to benefit from the synergies of the business combination that gave rise to the goodwill as follows:
CASH-GENERATING UNIT (CGU) OR GROUP OF CGUsPrimary reporting
segment2015
£m2014
£m
Rolls-Royce Deutschland Ltd & Co KG Civil Aerospace 202 215 Commercial marine – arising from the acquisitions of Vinters Limited and Scandinavian Electric Holding AS Marine 491 552 Commercial marine – arising from the acquisition of ODIM ASA Marine 25 77 Rolls-Royce Power Systems AG Power Systems 739 760 Other Various 46 55
1,503 1,659

Rolls-Royce Holdings plc Annual Report 2015 133
Financial Statements
Financial Statements
9 Intangible assets continuedGoodwill has been tested for impairment during 2015 on the following basis:
• The carrying values of goodwill have been assessed by reference to value in use. These have been estimated using cash flows from the most recent forecasts prepared by management, which are consistent with past experience and external sources of information on market conditions. Given the long-term and established nature of many of the Group’s products (product lives are often measured in decades), these forecasts generally cover the next ten years. Growth rates for the period not covered by the forecasts are based on a range of growth rates 2.0-2.75%) that reflect the products, industries and countries in which the relevant CGU or group of CGUs operate.
• The key assumptions for the impairment tests are the discount rate and, in the cash flow projections, the programme assumptions, the growth rates and the impact of foreign exchange rates on the relationship between selling prices and costs. Impairment tests are performed using prevailing exchange rates.
• The pre-tax cash flow projections have been discounted at rates based on the Group’s weighted average cost of capital, adjusted for specific risk where appropriate. The discount rate used, before taking account of specific risks, is 13% (2014: 13%).
As a result of the continuing poor market conditions in the Marine offshore business caused by the low crude oil price and the consequential reduced order intake in the period, the Group has recognised an impairment loss of £69m (included in the total impairment charge of £75m) to the carrying value of goodwill of cash generating units in this market. This is included in cost of sales in the income statement, but excluded from the underlying results. The impairment loss primarily relates to the cash generating units Scandinavian Electric Holding AS (acquired in 2008) and ODIM ASA (acquired in 2010), which are both business operations included in Marine. The impairment loss is based on a value in use calculation using cash flows forecast over a ten-year period and a pre-tax discount rate of 13% which indicated a recoverable amount of £74m compared with a pre-impairment carrying value of £143m.
The principal value in use assumptions for goodwill balances considered to be individually significant are:
• Rolls-Royce Power Systems AG – Volume of equipment deliveries, pricing achieved and cost escalation. These are based on current and known future programmes, estimates of capture of market share and long-term economic forecasts. The principal foreign exchange exposures are on translating income in a variety of non-functional currencies into euros. For the purposes of the impairment only, cash flows from recent management forecasts for a five-year period have been included. Cash flows beyond five years are assumed to grow at 2% (2014 2%). Reasonably possible change in the key assumptions would cause the value in use of the goodwill to fall below its carrying value, which include a reduction in the level of cash generation of 9%, or an increase in the assumed discount rate of 2%.
• Rolls-Royce Deutschland Ltd & Co KG – Volume of engine deliveries, flying hours of installed fleet and cost escalation. These are based on current and known future programmes, estimates of customers’ fleet requirements and long-term economic forecasts. The principal foreign exchange exposure is on translating US dollar income into euros. For the purposes of the impairment test only, cash flows beyond the ten-year forecasts are assumed to grow at 2.5% (2014: 2.5%). The Directors do not consider that any reasonably possible change in the key assumptions would cause the value in use of the goodwill to fall below its carrying value. The overall level of business would need to reduce by more than 69% to cause an impairment of this balance.
• Vinters Limited – Volume of equipment deliveries, capture of aftermarket and cost escalation. These are based on current and known future programmes, estimates of customers’ fleet requirements and long-term economic forecasts. The principal foreign exchange exposures are on translating income in a variety of non-functional currencies into Norwegian kroner. For the purposes of the impairment test only, cash flows beyond the ten-year forecasts are assumed to grow at 2.5% (2014: 2.5%). The Directors do not consider that any reasonably possible change in the key assumptions would cause the value in use of the goodwill to fall below its carrying value. The overall level of business would need to reduce by more than 54% to cause an impairment of this balance.
OTHER INTANGIBLE ASSETSCertification costs and participation fees, development costs and contractual aftermarket rights have been reviewed for impairment in accordance with the requirements of IAS 36 Impairment of Assets. Where an impairment test was considered necessary, it has been performed on the following basis:
• The carrying values have been assessed by reference to value in use. These have been estimated using cash flows from the most recent forecasts prepared by management, which are consistent with past experience and external sources of information on market conditions over the lives of the respective programmes.
• The key assumptions underlying cash flow projections are assumed market share, programme timings, unit cost assumptions, discount rates, and foreign exchange rates.
• The pre-tax cash flow projections have been discounted at 11% (2014: 11%), based on the Group’s weighted average cost of capital, reduced where relevant to take account of the lower risk associated with contracted aftermarket flows.
No impairment is required on this basis. However, a combination of changes in assumptions and adverse movements in variables that are outside the Group’s control (discount rate, exchange rate and airframe delays), could result in impairment in future years.
During the year, following analysis of the first major overhauls of the Trent 1000 engines, the recoverable amount of certain contractual aftermarket rights have been reassessed. This analysis demonstrated that the aftermarket cash flows from the engines were better than originally assumed, arising from both operational and contractual performance improvements. As a result of this analysis, the value in use (based on a pre-tax discount rate of 9%) has increased to around £140m, exceeding the unimpaired carrying value of £72m. Accordingly, cumulative impairments prior to 2015 of £50m have been reversed. This reversal is included in the Civil Aerospace business cost of sales.

134 Rolls-Royce Holdings plc Annual Report 2015
Financial Statements
NOTES TO THE CONSOLIDATED FINANCIAL STATEMENTS CONTINUED
10 Property, plant and equipmentLand and buildings
£m
Plant and equipment
£m
Aircraft and engines
£m
In course of construction
£mTotal
£m
Cost:At 1 January 2014 1,297 3,490 324 700 5,811
Exchange differences (23) (42) (1) 2 (64)Additions 24 160 57 427 668 Acquisitions of businesses – – 38 – 38 Disposals of businesses (88) (94) (77) (28) (287)Reclassifications 134 137 32 (305) (2)Disposals/write-offs (10) (51) (52) (1) (114)
At 1 January 2015 1,334 3,600 321 795 6,050 Exchange differences (20) (39) (2) (3) (64)Additions 18 117 19 340 494 Acquisitions of businesses – 1 – – 1 Disposals of businesses – (1) – – (1)Reclassifications 81 335 7 (423) – Transferred to assets held for sale (8) (23) (2) – (33)Disposals/write-offs (30) (96) (4) (1) (131)
At 31 December 2015 1,375 3,894 339 708 6,316
Accumulated depreciation:At 1 January 2014 386 1,949 84 – 2,419
Exchange differences (8) (26) – – (34)Charge for the year 1 49 294 31 – 374 Impairment – – – 1 1 Reclassifications (29) (62) (9) – (100)Disposals/write-offs (7) (46) (3) – (56)
At 1 January 2015 391 2,109 103 1 2,604 Exchange differences (7) (24) (1) – (32)Charge for the year 1 48 299 26 – 373 Impairment 3 2 – – 5 Disposals of businesses – (1) – – (1)Transferred to assets held for sale (5) (20) (1) – (26)Disposals/write-offs (14) (81) (2) – (97)
At 31 December 2015 416 2,284 125 1 2,826
Net book value:At 31 December 2015 959 1,610 214 707 3,490 At 31 December 2014 943 1,491 218 794 3,446 At 1 January 2014 911 1,541 240 700 3,392
1 Depreciation charged during the year is presented in the income statement or included in the cost of inventory as appropriate.

Rolls-Royce Holdings plc Annual Report 2015 135
Financial Statements
Financial Statements
10 Property, plant and equipment continuedProperty, plant and equipment includes:
2015£m
2014£m
Net book value of finance leased assets:Land and buildings 5 6 Plant and equipment 7 9 Aircraft and engines 40 43
Assets held for use in operating leases:Cost 321 267 Depreciation (87) (64)Net book value 234 203
Capital expenditure commitments 167 194 Cost of fully depreciated assets 853 792
The Group’s share of equity accounted entities’ capital commitments is £75m (2014: £82m).
11 InvestmentsCOMPOSITION OF THE GROUPThe entities contributing to the Group’s financial results are listed on pages 160 to 166.
NON-CONTROLLING INTERESTSIn 2015 the Group did not have any material non-wholly owned subsidiaries. On 7 March 2014, Daimler AG announced its intention to exercise its put option on its 50% of Rolls-Royce Power Systems Holding GmbH (RRPSH). Formal notice of this intention was served on 24 March 2014. From this date, the Group had an effective economic interest in RRPSH of 100% and NCI of £584m was transferred to retained earnings. The Group acquired the shares on 26 August 2014, giving it a 100% interest in RRPSH.
Summarised financial information for RRPSH is as follows:At
24 March 20141
£m
Current assets 1,529 Non-current assets 2,511 Current liabilities (974)Non-current liabilities (1,118)Equity attributable to Rolls-Royce shareholders 1,364 Non-controlling interests 584
1 Immediately prior to the exercise of the put option
Period to 24 March
2014 £m
Revenue 551 Loss for the period (25)
Attributable to ordinary shareholders (12)Non-controlling interests (12)
Total comprehensive income for the period (69)Attributable to ordinary shareholders (35)Non-controlling interests (35)
Dividends paid to non-controlling interests (76)Cash flow from operating activities 33 Cash flow from investing activities (17)Cash flow from financing activities (158)Net cash outflow (142)

136 Rolls-Royce Holdings plc Annual Report 2015
Financial Statements
NOTES TO THE CONSOLIDATED FINANCIAL STATEMENTS CONTINUED
11 Investments continuedEQUITY ACCOUNTED AND OTHER INVESTMENTS
Equity accounted Other
Joint ventures£m
Associates£m
Total£m
Unlisted£m
At 1 January 2014 599 2 601 27 Reclassification 1 (25) – (25) – Exchange differences 7 – 7 (2)Additions 15 2 17 11 Taxation paid by the Group 3 – 3 – Transfer to subsidiary (1) – (1) – Share of retained profit 23 – 23 – Disposals (70) – (70) – Return of capital (3) – (3) – Consolidation of previously non-consolidated subsidiary – – – (5)Share of OCI – may be reclassified to profit or loss (13) – (13) –
At 1 January 2015 535 4 539 31 Exchange differences 7 – 7 (2)Additions 12 3 15 6 Taxation paid by the Group (3) – (3) – Share of retained profit/(loss) 42 (5) 37 – Impairment – – – (2)Share of OCI – may be reclassified to profit or loss (19) – (19) –
At 31 December 2015 574 2 576 33
1 The reclassification relates to an adjustment in 2013 relating to transactions between the Group and a joint venture which was included in creditors. It was transferred to investments in joint ventures in 2014.
RECONCILIATION TO THE INCOME STATEMENT AND CASH FLOW STATEMENTContinuing operations Discontinued operations Total
2015£m
2014£m
2015£m
2014£m
2015£m
2014£m
Share of profit after tax 100 94 – 2 100 96 Share of dividends paid (63) (71) – (2) (63) (73)Share of retained profit 37 23 – – 37 23
The following joint ventures are considered to be individually material to the Group:Principal location Activity Ownership interest
Alpha Partners Leasing Limited (APL) UK Aero engine leasing 50.0%Hong Kong Aero Engine Services Limited (HAESL) Hong Kong Aero engine repair and overhaul 45.0%Singapore Aero Engine Services Pte Limited (SAESL) Singapore Aero engine repair and overhaul 39.0%Industria de Turbo Propulsores SA (ITP) Spain Aero engine component manufacture and maintenance 46.9%

Rolls-Royce Holdings plc Annual Report 2015 137
Financial Statements
Financial Statements
11 Investments continuedSummarised financial information of the Group’s individually material joint ventures is as follows:
APL HAESL SAESL ITP
2015 £m
2014 £m
2015 £m
2014 £m
2015£m
2014 £m
2015 £m
2014 £m
Revenue 130 105 652 652 626 815 520 529 Profit from continuing operations 65 39 27 34 46 60 40 24 Post-tax profit from discontinued operations – – – – – – – – Profit for the year 65 39 27 34 46 60 40 24 Other comprehensive operations – – – – – – – – Total comprehensive income for the year 65 39 27 34 46 60 40 24 Dividends received during the year (29) (13) (23) (30) (35) (56) (19) (19)Profit for the year included the following:
Depreciation and amortisation (59) (47) (8) (8) (5) (5) (37) (37)Interest income – – – – – – 10 19 Interest expense (17) (15) (1) (1) – (1) (16) (12)Income tax expense (7) (11) (5) (7) – – 7 4
Current assets 129 72 223 159 218 207 576 603 Non-current assets 1,349 1,171 85 86 125 102 554 525 Current liabilities (70) (62) (116) (61) (75) (88) (416) (415)Non-current liabilities (1,123) (959) (38) (37) (136) (106) (431) (418)Net assets 285 222 154 147 132 115 283 295 Included in the above:
Cash and cash equivalents 20 11 4 8 10 11 225 256 Current financial liabilities 1 (19) (13) – – – – (25) (10)Non-current financial liabilities 1 (969) (815) (30) (29) (136) (106) (273) (282)
1 Excluding trade and other payables.
Reconciliation to the carrying amount recognised in the consolidated financial statementsOwnership interest 50.0% 50.0% 45.0% 45.0% 39.0% 39.0% 46.9% 46.9%Group share of net assets above 143 111 69 66 51 45 133 138
The summarised aggregated results of the Group’s share of all equity accounted investments is as follows:Joint ventures Associates Total
2015£m
2014£m
2015£m
2014£m
2015£m
2014£m
Assets:Non-current assets 1,998 1,911 – 2 1,998 1,913 Current assets 843 715 2 4 845 719
Liabilities: 2
Current liabilities (541) (519) – (1) (541) (520)Non-current liabilities (1,726) (1,572) – (1) (1,726) (1,573)
574 535 2 4 576 539 2 Liabilities include borrowings of: (1,473) (1,376) – – (1,473) (1,376)
Post-tax profit from continuing operations 105 94 (5) – 100 94 Post-tax profit from discontinued operations – 2 – – – 2 Profit for the year 105 96 (5) – 100 96 Other comprehensive income (19) (13) – – – (13)Total comprehensive income for the year 86 83 (5) – 100 83

138 Rolls-Royce Holdings plc Annual Report 2015
Financial Statements
NOTES TO THE CONSOLIDATED FINANCIAL STATEMENTS CONTINUED
12 Inventories2015
£m2014
£m
Raw materials 509 553 Work in progress 882 984 Long-term contracts work in progress 23 22 Finished goods 1,173 1,149 Payments on account 50 60
2,637 2,768
Inventories stated at net realisable value 221 265 Amount of inventory write-down 64 62 Reversal of inventory write-down 14 1
13 Trade and other receivables2015
£m2014
£m
Trade receivables 1,612 1,531 Amounts recoverable on contracts 1 3,179 2,684 Amounts owed by joint ventures and associates 252 309 Other receivables 1,006 785 Prepayments and accrued income 195 200
6,244 5,509
Analysed as:Financial instruments (note 17):
Trade receivables and similar items 2,061 1,981 Other non-derivative financial assets 843 671
Non-financial instruments 3,340 2,857 6,244 5,509
Trade and other receivables expected to be recovered in more than one year:Trade receivables 57 40 Amounts recoverable on contracts 2,768 2,444 Amounts owed by joint ventures and associates 1 – Other receivables 131 61 Prepayments and accrued income 68 55
3,025 2,600
1 Amounts recoverable on contracts include £2,994m (2014: £2,492m) of TotalCare assets
14 Cash and cash equivalents2015
£m2014
£m
Cash at bank and in hand 662 739 Money-market funds 783 692 Short-term deposits 1,731 1,431
3,176 2,862
Overdrafts (note 15) – – Cash and cash equivalents per cash flow statement (page 110 ) 3,176 2,862
Cash held as collateral against third party obligations (note 18) 35 42
Cash and cash equivalents at 31 December 2015 include £21m (2014: £30m) that is not available for general use by the Group. This balance relates to cash held in non-wholly owned subsidiaries and the Group’s captive insurance company.

Rolls-Royce Holdings plc Annual Report 2015 139
Financial Statements
Financial Statements
15 BorrowingsCurrent Non-current Total
2015£m
2014£m
2015£m
2014£m
2015£m
2014£m
UnsecuredOverdrafts – – – – – – Bank loans 217 12 330 392 547 404 7 3⁄8% Notes 2016 £200m 200 – – 200 200 200 6.55% Notes 2015 US$83m 1 – 55 – – – 55 6.75% Notes 2019 £500m 2 – – 536 547 536 547 2.375% Notes 2020 US$500m 1 – – 333 – 333 – 2.125% Notes 2021 €750m 1 – – 576 615 576 615 3.625% Notes 2025 US$1,000m 1 – – 668 – 668 – 3.375% Notes 2026 £375m 2 – – 390 395 390 395
SecuredObligations under finance leases 3 2 1 50 44 52 45
419 68 2,883 2,193 3,302 2,261
1 These notes are the subject of interest rate swap agreements under which the Group has undertaken to pay floating rates of interest, and currency swaps which form a fair value hedge. 2 These notes are the subject of interest rate swap agreements under which the Group has undertaken to pay floating rates of interest which form a fair value hedge. 3 Obligations under finance leases are secured by related leased assets.
16 Trade and other payablesCurrent Non-current Total
2015£m
2014£m
2015£m
2014£m
2015£m
2014£m
Payments received on account 1 1,491 1,291 516 860 2,007 2,151 Trade payables 1,397 1,348 23 13 1,420 1,361 Amounts owed to joint ventures and associates 197 235 2 4 199 239 Other taxation and social security 90 109 1 1 91 110 Other payables 1,784 1,756 361 320 2,145 2,076 Accruals and deferred income 1,964 2,052 1,414 1,247 3,378 3,299
6,923 6,791 2,317 2,445 9,240 9,236 1 Includes payments received on account from joint ventures
and associates 161 158 35 99 196 257
Included within trade and other payables are government grants of £64m (2014: £80m). During the year, £21m (2014: £24m) of government grants were released to the income statement.
Included in accruals and deferred income are deferred receipts from RRSA workshare partners of £228m (2014: £244m) and £783m (2014: £687m) of TotalCare liabilities.
Trade and other payables are analysed as follows:2015
£m2014
£m
Financial instruments (note 17):Trade payables and similar items 3,101 3,049 Other non-derivative financial liabilities 817 831
Non-financial instruments 5,322 5,356 9,240 9,236

140 Rolls-Royce Holdings plc Annual Report 2015
Financial Statements
NOTES TO THE CONSOLIDATED FINANCIAL STATEMENTS CONTINUED
17 Financial instrumentsCARRYING VALUES AND FAIR VALUES OF FINANCIAL INSTRUMENTS
Notes
Basis for determining
fair value
Assets Liabilities Total
Fair value through
profit or loss£m
Loans and receivables
£m
Available for sale
£mCash
£m
Fair value through
profit or loss£m
Other£m £m
2015Unlisted non-current asset investments 11 A – 33 – – – – 33 Trade receivables and similar items 13 B – 2,061 – – – – 2,061 Other non-derivative financial assets 13 B – 843 – – – – 843 Derivative financial assets 1 C 112 – – – – – 112 Short-term investments B – 2 – – – – 2 Cash and cash equivalents 14 B – 1,731 783 662 – – 3,176 Borrowings 15 D – – – – – (3,302) (3,302)Derivative financial liabilities 1 C – – – – (1,843) – (1,843)Financial RRSAs E – – – – – (110) (110)C Shares B – – – – – (29) (29)Trade payables and similar items 16 B – – – – – (3,101) (3,101)Other non-derivative financial liabilities 16 B – – – – – (817) (817)
112 4,670 783 662 (1,843) (7,359) (2,975)
2014Unlisted non-current asset investments 11 A – 31 – – – – 31 Trade receivables and similar items 13 B – 1,981 – – – – 1,981 Other non-derivative financial assets 13 B – 671 – – – – 671 Derivative financial assets 1 C 129 – – – – – 129 Short-term investments B – 7 – – – – 7 Cash and cash equivalents 14 B – 1,431 692 739 – – 2,862 Borrowings 15 D – – – – – (2,261) (2,261)Derivative financial liabilities 1 C – – – – (759) – (759)Financial RRSAs E – – – – – (145) (145)C Shares B – – – – – (22) (22)Trade payables and similar items 16 B – – – – – (3,049) (3,049)Other non-derivative financial liabilities 16 B – – – – – (831) (831)
129 4,121 692 739 (759) (6,308) (1,386)
1 In the event of counterparty default relating to derivative financial assets and liabilities, offsetting would apply and financial assets and liabilities held with the same counterparty would net off. If this occurred with every counterparty, total financial assets would be nil and liabilities £1,731m.
Fair values equate to book values for both 2015 and 2014, with the following exceptions: 2015 2014
Book value£m
Fair value£m
Book value£m
Fair value£m
Borrowings (3,302) (3,312) (2,261) (2,362)Financial RRSAs (110) (110) (145) (152)
The fair value of a financial instrument is the price at which an asset could be exchanged, or a liability settled, between knowledgeable, willing parties in an arms-length transaction. Fair values have been determined with reference to available market information at the balance sheet date, using the methodologies described below.A These primarily comprise unconsolidated companies where fair value approximates to the book value.B Fair values are assumed to approximate to cost either due to the short-term maturity of the instruments or because the interest rate of the investments is reset after periods not
exceeding six months.C Fair values of derivative financial assets and liabilities are estimated by discounting expected future contractual cash flows using prevailing interest rate curves. Amounts
denominated in foreign currencies are valued at the exchange rate prevailing at the balance sheet date. These financial instruments are included on the balance sheet at fair value, derived from observable market prices (Level 2 as defined by IFRS 13 Fair Value Measurement).
D Borrowings are carried at amortised cost. Amounts denominated in foreign currencies are valued at the exchange rate prevailing at the balance sheet date.E The fair value of RRSAs is estimated by discounting expected future cash flows. The contractual cash flows are based on future trading activity, which is estimated based on latest
forecasts (Level 3 as defined by IFRS 13).
IFRS 13 Fair Value Measurement defines a three level valuation hierarchy:Level 1 – quoted prices for similar instrumentsLevel 2 – directly observable market inputs other than Level 1 inputsLevel 3 – inputs not based on observable market data

Rolls-Royce Holdings plc Annual Report 2015 141
Financial Statements
Financial Statements
17 Financial instruments continuedCARRYING VALUES OF OTHER FINANCIAL ASSETS AND LIABILITIES
Foreign exchange contracts
£m
Commodity contracts
£m
Interest rate contracts
£m
Total derivatives
£m
Financial RRSAs
£mC Shares
£mTotal
£m
2015Non-current assets 3 – 80 83 – – 83 Current assets 29 – – 29 – – 29 Assets 32 – 80 112 – – 112 Current liabilities (244) (39) – (283) (19) (29) (331)Non-current liabilities (1,428) (65) (67) (1,560) (91) – (1,651)Liabilities (1,672) (104) (67) (1,843) (110) (29) (1,982)
(1,640) (104) 13 (1,731) (110) (29) (1,870)2014Non-current assets 28 – 79 107 – – 107 Current assets 22 – – 22 – – 22 Assets 50 – 79 129 – – 129 Current liabilities (144) (21) – (165) (22) (22) (209)Non-current liabilities (545) (22) (27) (594) (123) – (717)Liabilities (689) (43) (27) (759) (145) (22) (926)
(639) (43) 52 (630) (145) (22) (797)
DERIVATIVE FINANCIAL INSTRUMENTSThe Group uses various financial instruments to manage its exposure to movements in foreign exchange rates. Where the effectiveness of a hedging relationship in a cash flow hedge is demonstrated, changes in the fair value that are deemed effective are included in the cash flow hedge reserve and released to match actual payments on the hedged item. The Group uses commodity swaps to manage its exposure to movements in the price of commodities (jet fuel and base metals). To hedge the currency risk associated with a borrowing denominated in US dollars, the Group has currency derivatives designated as part of fair value hedges. The Group uses interest rate swaps and forward rate agreements to manage its exposure to movements in interest rates.
Movements in the fair values of derivative financial assets and liabilities were as follows:Foreign exchange instruments Commodity instruments Interest rate instruments Total
2015£m
2014£m
2015£m
2014£m
2015£m
2014£m
2015£m
2014£m
At 1 January (639) 498 (43) (39) 52 (6) (630) 453 Currency options at inception 1 (20) – – – – – (20) – Movements in fair value hedges 2 1 3 – – (36) 58 (35) 61 Movements in other derivative contracts 3 (1,217) (1,125) (89) (15) – – (1,306) (1,140)Contracts settled 4 235 (15) 28 11 (3) – 260 (4)
At 31 December (1,640) (639) (104) (43) 13 52 (1,731) (630)
1 The Group has written currency options to sell USD and buy GBP as part of a commercial agreement. The fair value of this option on inception is treated as a discount to the customer2 Gain on related hedged items £35m (2014: £61m loss)3 Included in financing4 Includes £8m contracts settled in fair value hedges (2014: £nil). Contracts settled in 2014 included a loss of £76m in relation to contracts put in place to hedge the settlement of the
put option on RRPS
EXERCISE PRICE OF PUT OPTION ON NON-CONTROLLING INTERESTS AND FINANCIAL RISK AND REVENUE SHARING ARRANGEMENTSThe Group has financial liabilities arising from financial RRSAs. These financial liabilities are valued at each reporting date using the amortised cost method. This involves calculating the present value of the forecast cash flows of the arrangements using the internal rate of return at the inception of the arrangements as the discount rate.
The Group had agreed a put option with Daimler AG, such that Daimler could sell its interest in Rolls-Royce Power Systems Holding GmbH to the Group. Daimler AG exercised this option on 24 March 2014 and the Group acquired Daimler’s 50% share of RRPSH on 26 August 2014. Prior to this, the fair value of the exercise value of this option was included as a financial liability.
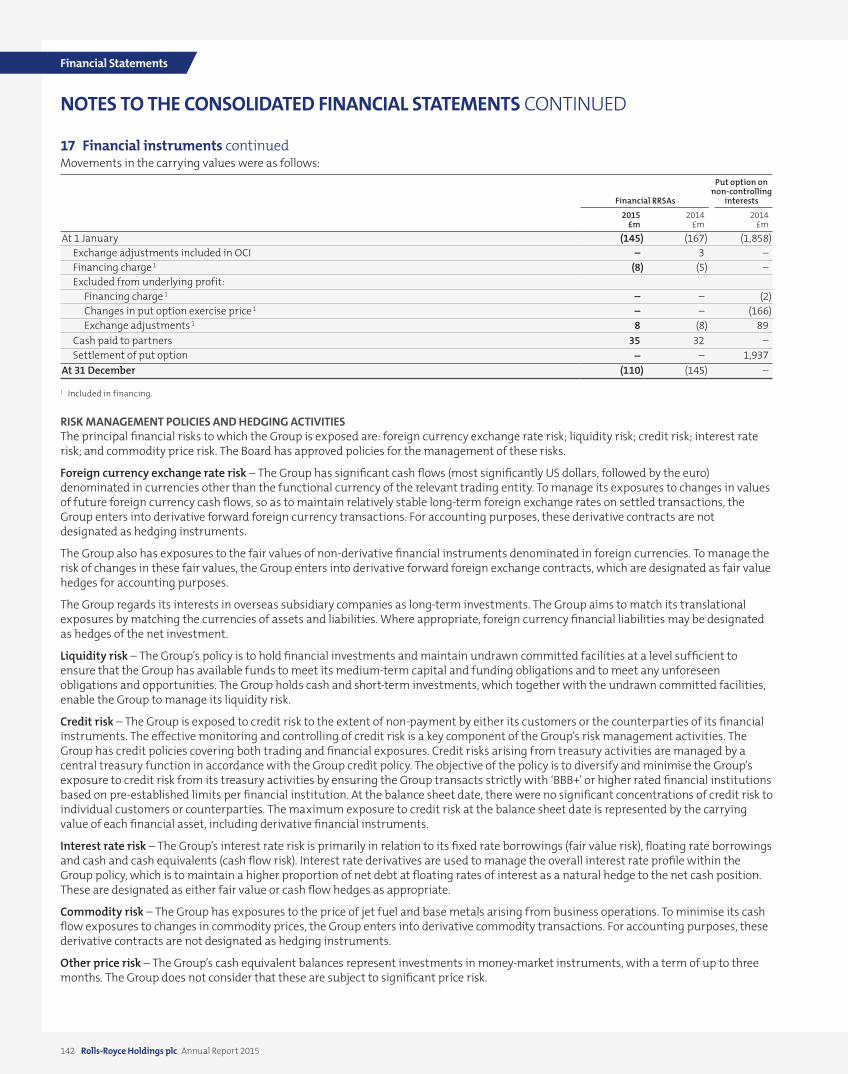
142 Rolls-Royce Holdings plc Annual Report 2015
Financial Statements
NOTES TO THE CONSOLIDATED FINANCIAL STATEMENTS CONTINUED
17 Financial instruments continued Movements in the carrying values were as follows:
Financial RRSAs
Put option on non-controlling
interests
2015£m
2014£m
2014£m
At 1 January (145) (167) (1,858)Exchange adjustments included in OCI – 3 – Financing charge 1 (8) (5) – Excluded from underlying profit:
Financing charge 1 – – (2)Changes in put option exercise price 1 – – (166)Exchange adjustments 1 8 (8) 89
Cash paid to partners 35 32 – Settlement of put option – – 1,937
At 31 December (110) (145) –
1 Included in financing.
RISK MANAGEMENT POLICIES AND HEDGING ACTIVITIES The principal financial risks to which the Group is exposed are: foreign currency exchange rate risk; liquidity risk; credit risk; interest rate risk; and commodity price risk. The Board has approved policies for the management of these risks.
Foreign currency exchange rate risk – The Group has significant cash flows (most significantly US dollars, followed by the euro) denominated in currencies other than the functional currency of the relevant trading entity. To manage its exposures to changes in values of future foreign currency cash flows, so as to maintain relatively stable long-term foreign exchange rates on settled transactions, the Group enters into derivative forward foreign currency transactions. For accounting purposes, these derivative contracts are not designated as hedging instruments.
The Group also has exposures to the fair values of non-derivative financial instruments denominated in foreign currencies. To manage the risk of changes in these fair values, the Group enters into derivative forward foreign exchange contracts, which are designated as fair value hedges for accounting purposes.
The Group regards its interests in overseas subsidiary companies as long-term investments. The Group aims to match its translational exposures by matching the currencies of assets and liabilities. Where appropriate, foreign currency financial liabilities may be designated as hedges of the net investment.
Liquidity risk – The Group’s policy is to hold financial investments and maintain undrawn committed facilities at a level sufficient to ensure that the Group has available funds to meet its medium-term capital and funding obligations and to meet any unforeseen obligations and opportunities. The Group holds cash and short-term investments, which together with the undrawn committed facilities, enable the Group to manage its liquidity risk.
Credit risk – The Group is exposed to credit risk to the extent of non-payment by either its customers or the counterparties of its financial instruments. The effective monitoring and controlling of credit risk is a key component of the Group’s risk management activities. The Group has credit policies covering both trading and financial exposures. Credit risks arising from treasury activities are managed by a central treasury function in accordance with the Group credit policy. The objective of the policy is to diversify and minimise the Group’s exposure to credit risk from its treasury activities by ensuring the Group transacts strictly with ‘BBB+’ or higher rated financial institutions based on pre-established limits per financial institution. At the balance sheet date, there were no significant concentrations of credit risk to individual customers or counterparties. The maximum exposure to credit risk at the balance sheet date is represented by the carrying value of each financial asset, including derivative financial instruments.
Interest rate risk – The Group’s interest rate risk is primarily in relation to its fixed rate borrowings (fair value risk), floating rate borrowings and cash and cash equivalents (cash flow risk). Interest rate derivatives are used to manage the overall interest rate profile within the Group policy, which is to maintain a higher proportion of net debt at floating rates of interest as a natural hedge to the net cash position. These are designated as either fair value or cash flow hedges as appropriate.
Commodity risk – The Group has exposures to the price of jet fuel and base metals arising from business operations. To minimise its cash flow exposures to changes in commodity prices, the Group enters into derivative commodity transactions. For accounting purposes, these derivative contracts are not designated as hedging instruments.
Other price risk – The Group’s cash equivalent balances represent investments in money-market instruments, with a term of up to three months. The Group does not consider that these are subject to significant price risk.

Rolls-Royce Holdings plc Annual Report 2015 143
Financial Statements
Financial Statements
17 Financial instruments continuedDERIVATIVE FINANCIAL INSTRUMENTSThe nominal amounts, analysed by year of expected maturity, and fair values of derivative financial instruments are as follows:
Expected maturity Fair value
Nominalamount
£m
Withinone year
£m
Between one and
two years£m
Betweentwo and
five years£m
Afterfive years
£mAssets
£mLiabilities
£m
At 31 December 2015Foreign exchange contracts:
Fair value hedges – – – – – – – Non-hedge accounted 22,418 5,736 4,266 11,637 779 32 (1,672)
Interest rate contracts:Fair value hedges 2,437 – – 500 1,937 74 (61)Non-hedge accounted – – – – – 6 (6)
Commodity contracts:Non-hedge accounted 268 90 72 83 23 – (104)
25,123 5,826 4,338 12,220 2,739 112 (1,843)At 31 December 2014Foreign exchange contracts:
Fair value hedges 46 46 – – – 6 – Non-hedge accounted 20,889 5,431 4,793 10,665 – 44 (689)
Interest rate contracts:Fair value hedges 1,512 53 – 500 959 74 (22)Non-hedge accounted 2 2 – – – 5 (5)
Commodity contracts:Non-hedge accounted 240 79 62 71 28 – (43)
22,689 5,611 4,855 11,236 987 129 (759)
As described above, all derivative financial instruments are entered into for risk management purposes, although these may not be designated into hedging relationships for accounting purposes.
CURRENCY ANALYSISDerivative financial instruments related to foreign exchange risks are denominated in the following currencies:
Currencies purchased forward
Sterling£m
US dollar£m
Euro£m
Other£m
Total£m
At 31 December 2015Currencies sold forward:
Sterling – 383 – 221 604 US dollar 18,869 – 1,552 902 21,323 Euro 2 76 – 125 203 Other 131 12 143 2 288
At 31 December 2014Currencies sold forward:
Sterling – 429 – 199 628 US dollar 16,659 – 2,014 938 19,611 Euro 150 61 – 185 396 Other 167 9 114 10 300
Other derivative financial instruments are denominated in the following currencies:2015
£m 2014
£m
Sterling 875 877 US dollar 1,279 292 Euro 550 584

144 Rolls-Royce Holdings plc Annual Report 2015
Financial Statements
NOTES TO THE CONSOLIDATED FINANCIAL STATEMENTS CONTINUED
17 Financial instruments continuedNon-derivative financial instruments are denominated in the following currencies:
Sterling£m
US dollar£m
Euro£m
Other£m
Total£m
At 31 December 2015Unlisted non-current investments – 1 31 1 33 Trade receivables and similar items 131 1,228 613 89 2,061 Other non-derivative financial assets 280 350 102 111 843 Short-term investments – – – 2 2 Cash and cash equivalents 1,554 959 446 217 3,176 Assets 1,965 2,538 1,192 420 6,115 Borrowings (1,369) (1,162) (768) (3) (3,302)Financial RRSAs – (75) (35) – (110)C Shares (29) – – – (29)Trade payables and similar items (1,536) (859) (523) (183) (3,101)Other non-derivative financial liabilities (242) (303) (139) (133) (817)Liabilities (3,176) (2,399) (1,465) (319) (7,359)
(1,211) 139 (273) 101 (1,244)
At 31 December 2014Unlisted non-current investments – – 30 1 31 Trade receivables and similar items 232 1,180 479 90 1,981 Other non-derivative financial assets 400 53 101 117 671 Short-term investments – – – 7 7 Cash and cash equivalents 513 1,404 619 326 2,862 Assets 1,145 2,637 1,229 541 5,552 Borrowings (1,341) (101) (819) – (2,261)Financial RRSAs – (97) (48) – (145)C Shares (22) – – – (22)Trade payables and similar items (1,489) (887) (545) (128) (3,049)Other non-derivative financial liabilities (248) (333) (161) (89) (831)Liabilities (3,100) (1,418) (1,573) (217) (6,308)
(1,955) 1,219 (344) 324 (756)
CURRENCY EXPOSURESThe Group’s actual currency exposures after taking account of derivative foreign currency contracts, which are not designated as hedging instruments for accounting purposes are as follows:
Functional currency of Group operationsSterling
£mUS dollar
£mEuro
£mOther
£mTotal
£m
At 31 December 2015Sterling – – 1 27 28 US dollar (12) 1 – 8 (3)Euro 4 – – – 4 Other – 3 1 (1) 3 At 31 December 2014Sterling – 28 2 35 65 US dollar (2) – (1) 8 5 Euro 2 5 – 11 18 Other 5 19 6 1 31

Rolls-Royce Holdings plc Annual Report 2015 145
Financial Statements
Financial Statements
17 Financial instruments continuedAGEING BEYOND CONTRACTUAL DUE DATE OF FINANCIAL ASSETS
Withinterms
£m
Up tothree
monthsoverdue
£m
Betweenthree
months andone yearoverdue
£m
More thanone yearoverdue
£mTotal
£m
At 31 December 2015Unlisted non-current asset investments 33 – – – 33 Trade receivables and similar items 1,745 184 98 34 2,061 Other non-derivative financial assets 835 5 1 2 843 Derivative financial assets 112 – – – 112 Short-term investments 2 – – – 2 Cash and cash equivalents 3,176 – – – 3,176
5,903 189 99 36 6,227
At 31 December 2014Unlisted non-current asset investments 31 – – – 31 Trade receivables and similar items 1,657 206 104 14 1,981 Other non-derivative financial assets 667 4 – – 671 Derivative financial assets 129 – – – 129 Short-term investments 7 – – – 7 Cash and cash equivalents 2,862 – – – 2,862
5,353 210 104 14 5,681
CONTRACTUAL MATURITY ANALYSIS OF FINANCIAL LIABILITIES Gross values
Withinone year
£m
Betweenone and
two years£m
Betweentwo and
five years£m
Afterfive years
£mDiscounting
£m
Carryingvalue
£m
At 31 December 2015Borrowings (530) (161) (1,317) (1,897) 603 (3,302)Derivative financial liabilities (286) (329) (1,026) (314) 112 (1,843)Financial RRSAs (16) (20) (76) (10) 12 (110)C Shares (29) – – – – (29)Trade payables and similar items (3,059) (38) (4) – – (3,101)Other non-derivative financial liabilities (640) (43) (74) (60) – (817)
(4,560) (591) (2,497) (2,281) 727 (9,202)
At 31 December 2014Borrowings (148) (385) (214) (1,880) 366 (2,261)Derivative financial liabilities (174) (115) (324) (181) 35 (759)Financial RRSAs (17) (19) (72) (52) 15 (145)C Shares (22) – – – – (22)Trade payables and similar items (3,012) (32) (2) (3) – (3,049)Other non-derivative financial liabilities (650) (95) (20) (66) – (831)
(4,023) (646) (632) (2,182) 416 (7,067)

146 Rolls-Royce Holdings plc Annual Report 2015
Financial Statements
NOTES TO THE CONSOLIDATED FINANCIAL STATEMENTS CONTINUED
17 Financial instruments continuedINTEREST RATE RISKIn respect of income earning financial assets and interest bearing financial liabilities, the following table indicates their effective interest rates and the periods in which they reprice. The value shown is the carrying amount.
At 31 December 2015
Period in which interest rate reprices
Effective interest rate
%Total
£m
6 monthsor less
£m6-12 months
£mShort-term investments 1 2 2 – Cash and cash equivalents 2 3,176 3,176 – Unsecured bank loans
Other borrowings (129) (1) – £200m floating rate loan GBP LIBOR + 1.26 (200) (200) – £43m floating rate loan GBP LIBOR + 0.402 (43) (43) – €125m fixed rate loan 2.6000% (92) – – €75m fixed rate loan 2.0600% (55) – – €50m fixed rate loan 2.3500% (28) – –
Unsecured bond issues7 3⁄8% Notes 2016 £200m 7.3750% (200) – – 6.75% Notes 2019 £500m 6.7500% (536) – – Effect of interest rate swaps GBP LIBOR + 2.9824 – (536) – 2.375% Notes 2020 $500m 2.3750% (333) – – Effect of interest rate swaps GBP LIBOR + 0.8410 – (333) – 2.125% Notes 2021 €750m 2.1250% (576) – – Effect of interest rate swaps GBP LIBOR + 0.7005 – (576) – 3.625% Notes 2025 $1,000m 3.6250% (668) – – Effect of interest rate swaps GBP LIBOR + 1.4658 – (668) – 3.375% Notes 2026 £375m 3.3750% (390) – – Effect of interest rate swaps GBP LIBOR + 0.8930 – (390) –
Other securedObligations under finance leases 4.1089% (52)
(124)
At 31 December 2014
Period in which interest rate reprices
Effective interest rate
%Total
£m
6 monthsor less
£m6-12 months
£mShort-term investments 1 7 5 2 Cash and cash equivalents 2 2,862 2,862 – Unsecured bank loans
Other borrowings (12) (1) – Interest rate swaps 5.8156% – 2 (2)£200m floating rate loan GBP LIBOR + 1.26 (200) (200) – €125m fixed rate loan 2.6000% (97) – – €75m fixed rate loan 2.0600% (59) – – €50m fixed rate loan 2.3500% (36) – –
Unsecured bond issues7 3⁄8% Notes 2016 £200m 7.3750% (200) – – 6.55% Notes 2015 US$83m 6.5500% (55) – (55) Effect of interest rate swaps USD LIBOR + 1.24 – (55) 55 6.75% Notes 2019 £500m 6.7500% (547) – – Effect of interest rate swaps GBP LIBOR + 2.9824 – (547) – 2.125% Notes 2021 €750m 2.1250% (615) – – Effect of interest rate swaps GBP LIBOR + 0.7005 – (615) – 3.375% Notes 2026 £375m 3.3750% (395) – – Effect of interest rate swaps GBP LIBOR + 0.8930 – (395) –
Other securedObligations under finance leases 4.1089% (45) (1) (1)
608
1 Interest on the short-term investments are at fixed rates.2 Cash and cash equivalents comprise bank balances and demand deposits and earn interest at rates based on daily deposit rates

Rolls-Royce Holdings plc Annual Report 2015 147
Financial Statements
Financial Statements
17 Financial instruments continuedSome of the Group’s borrowings are subject to the Group meeting certain obligations, including customary financial covenants. If the Group fails to meet its obligations these arrangements give rights to the lenders, upon agreement, to accelerate repayment of the facilities. There are no rating triggers contained in any of the Group’s facilities that could require the Group to accelerate or repay any facility for a given movement in the Group’s credit rating.
In addition, the Group has £1,780m (2014: £1,277m) of undrawn committed borrowing facilities available for at least the next two years.
SENSITIVITY ANALYSIS
Sensitivities at 31 December (all other variables held constant) – impact on profit after tax and equity2015
£m2014
£m
Sterling 10% weaker against the US dollar (1,574) (1,336)Sterling 10% stronger against the US dollar 1,288 1,093 Euro 10% weaker against the US dollar (130) (147)Euro 10% stronger against the US dollar 111 123 Sterling 10% weaker against the Euro 18 15 Sterling 10% stronger against the Euro (15) (12)Commodity prices 10% lower (13) (15)Commodity prices 10% higher 13 15
At 31 December 2015 the Group had no material sensitivity to changes in interest rates on that date. The main interest rate sensitivity for the Group arises as a result of the gross up of net cash and this is mitigated as described under the interest rate risk management policies on page 142.
C SHARES AND PAYMENTS TO SHAREHOLDERSThe Company issues non-cumulative redeemable preference shares (C Shares) as an alternative to paying a cash dividend. C Shares in respect of a year are issued in the following year. Shareholders are able to redeem any number of their C Shares for cash. Any C Shares retained attract a dividend of 75% of LIBOR on the 0.1p nominal value of each share, paid on a twice-yearly basis, and have limited voting rights. The Company has the option to compulsorily redeem the C Shares, at any time, if the aggregate number of C Shares in issue is less than 10% of the aggregate number of C Shares issued, or on the acquisition or capital restructuring of the Company.
Movements in issued and fully paid C Shares during the year were as follows:2015 2014
Millions
Nominalvalue
£m Millions
Nominalvalue
£m
At 1 January 22,005 22 16,286 16 Issued 429,536 430 413,669 414 Redeemed (422,581) (423) (407,950) (408)
At 31 December 28,960 29 22,005 22
Payments to shareholders in respect of the year represent the value of C Shares to be issued in respect of the results for the year. Issues of C Shares were declared as follows:
2015 2014
Penceper share £m
Penceper share £m
Interim 9.27 170 9.00 170 Final 7.10 131 14.10 265
16.37 301 23.10 435

148 Rolls-Royce Holdings plc Annual Report 2015
Financial Statements
NOTES TO THE CONSOLIDATED FINANCIAL STATEMENTS CONTINUED
18 Provisions for liabilities and chargesAt
1 January2015
£m
Exchangedifferences
£m
Disposal of
businesses£m
Unused amountsreversed
£m
Charged toincome
statement£m
Utilised£m
At31 December
2015£m
Warranty and guarantees 426 (14) (1) (28) 106 (108) 381 Contract loss 41 (1) – (1) 10 (13) 36 Restructuring 122 – – (30) 106 (132) 66 Customer financing 47 – – (27) 11 (11) 20 Insurance 65 – – (5) 15 (8) 67 Other 106 (2) – (9) 2 (27) 70
807 (17) (1) (100) 250 (299) 640 Current liabilities 433 336 Non-current liabilities 374 304
Provisions for warranties and guarantees primarily relate to products sold and generally cover a period of up to three years.
Provisions for contract loss and restructuring are generally expected to be utilised within two years.
In connection with the sale of its products the Group will, on some occasions, provide financing support for its customers – generally in respect of civil aircraft. The Group’s commitments relating to these financing arrangements are spread over many years, relate to a number of customers and a broad product portfolio and are generally secured on the asset subject to the financing. These include commitments of US$3.1bn to provide borrowing facilities to enable customers to purchase aircraft (of which approximately US$322m could be called during 2016). These facilities may only be used if the customer is unable to obtain financing elsewhere and are priced at a premium to the market rate. Consequently the Directors do not consider that there is a significant exposure arising from the provision of these facilities.
Customer financing provisions cover guarantees provided for asset value and/or financing. These guarantees, the risks arising and the process used to assess the extent of the risk are described under the heading ‘Customer financing’ in the Financial review on page 46. It is estimated that the provision will be utilised as follows:
2015£m
2014£m
Potential claims with specific claim dates:In one year or less 3 32 In more than one year but less than five years 12 11 In more than five years 5 4
20 47
Commitments on delivered aircraft in excess of the amounts provided are shown in the table below. These are reported on a discounted basis at the Group’s borrowing rate to reflect better the time span over which these exposures could arise. These amounts do not represent values that are expected to crystallise. The commitments are denominated in US dollars. As the Group does not generally adopt cash flow hedge accounting for future foreign exchange transactions, this amount is reported, together with the sterling equivalent at the reporting date spot rate. The values of aircraft providing security are based on advice from a specialist aircraft appraiser.
2015 2014
£m $m £m $m
Gross commitments 269 399 388 605 Value of security 1 (136) (201) (245) (382)Indemnities (79) (118) (84) (132)Net commitments 54 80 59 91 Net commitments with security reduced by 20% 2 78 115 90 140 1 Security includes unrestricted cash collateral of: 35 52 42 66
2 Although sensitivity calculations are complex, the reduction of relevant security by 20% illustrates the sensitivity to changes in this assumption.
The Group’s captive insurance company retains a portion of the exposures it insures on behalf of the remainder of the Group. Significant delays occur in the notification and settlement of claims and judgement is involved in assessing outstanding liabilities, the ultimate cost and timing of which cannot be known with certainty at the balance sheet date. The insurance provisions are based on information currently available, however it is inherent in the nature of the business that ultimate liabilities may vary. Provisions for outstanding claims are established to cover the outstanding expected liability as well as claims incurred but not yet reported.
Other provisions comprise a number of liabilities with varying expected utilisation rates.

Rolls-Royce Holdings plc Annual Report 2015 149
Financial Statements
Financial Statements
19 Post-retirement benefitsThe Group operates a number of defined benefit and defined contribution schemes:
• UK defined benefit schemes are funded, with the assets held in separate trustee administered funds. Employees are entitled to retirement benefits based on either their final or career average salaries and length of service; and
• Overseas defined benefit schemes are a mixture of funded and unfunded plans and provide benefits in line with local practice. Additionally in the US, and to a lesser extent in some other countries, the Group’s employment practices include the provision of healthcare and life insurance benefits for retired employees. These schemes are unfunded.
The valuations of the defined benefit schemes are based on the most recent funding valuations, where relevant, updated by the scheme actuaries to 31 December 2015.
The defined benefit schemes expose the Group to actuarial risks such as longevity, interest rate, inflation and investment risks. In the UK, and in the principal US pension schemes, the Group has adopted investment policies to mitigate some of these risks. This involves investing a significant proportion of the schemes’ assets in Liability Driven Investment portfolios, which hold investments designed to offset interest rate and inflation rate risks. In addition, in the UK, the Rolls-Royce Pension Fund has invested in a longevity swap, which is designed to offset longevity risks in respect of existing pensioners.
In the UK, surpluses are recognised on schemes where, on ultimate wind-up when there are longer any remaining members, any surplus will be returned to the Group.
AMOUNTS RECOGNISED IN THE INCOME STATEMENT2015 2014
UKschemes
£m
Overseasschemes
£mTotal
£m
UKschemes
£m
Overseasschemes
£mTotal
£m
Defined benefit schemes:Current service cost and administrative expenses 169 52 221 156 45 201 Past-service and curtailment (credit)/cost (16) 8 (8) (18) (13) (31)
153 60 213 138 32 170 Defined contribution schemes 33 85 118 32 97 129 Operating cost 186 145 331 170 129 299 Net financing in respect of defined benefit schemes (65) 33 (32) (11) 40 29 Total income statement charge 121 178 299 159 169 328
The operating cost is charged as follows:Defined benefit Defined contribution Total
2015£m
2014£m
2015£m
2014£m
2015£m
2014£m
Cost of sales 147 117 80 84 227 201 Commercial and administrative costs 32 21 21 23 53 44 Research and development 34 27 17 17 51 44 Operating cost – continuing operations 213 165 118 124 331 289 Discontinued operations – 5 – 5 – 10 Total operating cost 213 170 118 129 331 299
The Group operates a PaySave scheme in the UK. This is a salary sacrifice scheme under which employees elect to stop making employee contributions and the Group makes additional contributions in return for a reduction in gross contractual pay. As a result, there is a decrease in wages and salaries and a corresponding increase in pension costs of £32m (2014: £35m) in the year.
Net financing comprises:2015 2014
UKschemes
£m
Overseasschemes
£mTotal
£m
UKschemes
£m
Overseasschemes
£mTotal
£m
Financing on scheme obligations 375 57 432 390 64 454 Financing on scheme assets (440) (24) (464) (427) (24) (451)Financing on unrecognised surpluses and minimum funding liability – – – 26 – 26 Net financing (income)/charge in respect of defined benefit schemes (65) 33 (32) (11) 40 29
Financing income on scheme surpluses (65) – (65) (13) – (13)Financing cost on scheme deficits – 33 33 2 40 42

150 Rolls-Royce Holdings plc Annual Report 2015
Financial Statements
NOTES TO THE CONSOLIDATED FINANCIAL STATEMENTS CONTINUED
19 Post-retirement benefits continuedAMOUNTS RECOGNISED IN OCI IN RESPECT OF DEFINED BENEFIT SCHEMES
2015 2014
UKschemes
£m
Overseasschemes
£mTotal
£m
UKschemes
£m
Overseasschemes
£mTotal
£m
Actuarial gains and losses arising from demographic assumptions (185) 8 (177) 23 (17) 6 Actuarial gains and losses arising from financial assumptions (70) 70 – (1,099) (228) (1,327)Actuarial gains and losses arising from experience adjustments 56 8 64 (343) (17) (360)Return on scheme assets excluding financing income (593) (16) (609) 2,258 55 2,313 Movement in unrecognised surplus and related finance cost – – – 513 – 513 Movement in minimum funding liability and related finance cost – – – 47 – 47 Included in other comprehensive income (792) 70 (722) 1,399 (207) 1,192
AMOUNTS RECOGNISED IN THE BALANCE SHEET IN RESPECT OF DEFINED BENEFIT SCHEMES2015 2014
UKschemes
£m
Overseasschemes
£mTotal
£m
UKschemes
£m
Overseasschemes
£mTotal
£m
Present value of funded obligations (10,914) (650) (11,564) (10,606) (664) (11,270)Fair value of scheme assets 11,957 597 12,554 12,341 593 12,934 Net asset/(liability) on funded schemes 1,043 (53) 990 1,735 (71) 1,664 Present value of unfunded obligations – (1,067) (1,067) – (1,109) (1,109)Net asset/(liability) recognised in the balance sheet 1,043 (1,120) (77) 1,735 (1,180) 555
Post-retirement scheme surpluses 1,059 4 1,063 1,735 5 1,740 Post-retirement scheme deficits (16) (1,124) (1,140) – (1,185) (1,185)
Overseas schemes are located in the following countries:2015 2014
Assets£m
Obligations£m
Net£m
Assets£m
Obligations£m
Net£m
Canada 152 (188) (36) 160 (208) (48)Germany – (553) (553) – (592) (592)US pension schemes 429 (513) (84) 414 (508) (94)US healthcare schemes – (426) (426) – (423) (423)Other 16 (37) (21) 19 (42) (23)Net asset/(liability) recognised in the balance sheet 597 (1,717) (1,120) 593 (1,773) (1,180)
DEFINED BENEFIT SCHEMESAssumptionsSignificant actuarial assumptions for UK schemes (weighted average, weighted by the size of the obligation) used at the balance sheet date were as follows:
2015 2014
Discount rate 3.6% 3.6%Inflation assumption (RPI) 1 3.2% 3.2%Rate of increase in salaries 4.0% 4.2%Male life expectancy from age 65: current pensioner 22.8 years 22.5 years future pensioner currently aged 45 24.8 years 24.1 years
1 This is the assumption for the Retail Price Index. The Consumer Price Index is assumed to be 1.1% lower
Discount rates are determined by reference to the market yields on AA rated corporate bonds. The rate is determined by using the profile of forecast benefit payments to derive a weighted average discount rate from the yield curve.
The inflation assumption is determined by the market implied assumption based on the yields on long-term indexed linked government securities and increases in salaries are based on actual experience, allowing for promotion, of the real increase above inflation.
The mortality assumptions adopted for the UK pension schemes are derived from the SAP actuarial tables, with future improvements in line with the CMI 2015 core projections and long-term improvements of 1.5%. Where appropriate, these are adjusted to take account of the relevant scheme’s actual experience.

Rolls-Royce Holdings plc Annual Report 2015 151
Financial Statements
Financial Statements
19 Post-retirement benefits continuedOther assumptions have been set on advice from the relevant actuary, having regard to the latest trends in scheme experience and the assumptions used in the most recent funding valuation. The rate of increase of pensions in payment is based on the rules of the relevant scheme, combined with the inflation assumption where the increase is capped.
Assumptions for overseas schemes are less significant and are based on advice from local actuaries. The principal assumptions are:2015 2014
Discount rate 3.6% 3.3%Inflation assumption 2.2% 2.2%Long-term healthcare cost trend rate 5.0% 5.0%Male life expectancy from age 65: current pensioner 21.1 years 21.1 years future pensioner currently aged 45 23.3 years 23.3 years
Changes in present value of defined benefit obligations2015 2014
UKschemes
£m
Overseasschemes
£mTotal
£m
UKschemes
£m
Overseasschemes
£mTotal
£m
At 1 January (10,606) (1,773) (12,379) (9,046) (1,493) (10,539)Exchange differences – 17 17 – (7) (7)Current service cost (164) (50) (214) (151) (44) (195)Past service cost 16 (5) 11 18 16 34 Finance cost (375) (58) (433) (390) (63) (453)Contributions by employees (3) (4) (7) (4) (5) (9)Benefits paid out 417 75 492 376 71 447 Disposal of businesses – – – 10 16 26 Actuarial (losses)/gains (199) 84 (115) (1,419) (266) (1,685)Settlement curtailment – – – – 6 6 Other movements – (3) (3) – (4) (4)
At 31 December (10,914) (1,717) (12,631) (10,606) (1,773) (12,379)Funded schemes (10,914) (650) (11,564) (10,606) (664) (11,270)Unfunded schemes – (1,067) (1,067) – (1,109) (1,109)
The defined benefit obligations are in respect of: Active plan participants (4,273) (921) (5,194) (4,170) (974) (5,144) Deferred plan participants (1,946) (130) (2,076) (2,009) (97) (2,106) Pensioners (4,695) (666) (5,361) (4,427) (702) (5,129)Weighted average duration of obligations (years) 18 16 17 17 16 17
Changes in fair value of scheme assets2015 2014
UKschemes
£m
Overseasschemes
£mTotal
£m
UKschemes
£m
Overseasschemes
£mTotal
£m
At 1 January 12,341 593 12,934 9,776 504 10,280 Exchange differences – (2) (2) – 18 18 Administrative expenses (5) (2) (7) (5) (1) (6)Financing 440 24 464 427 24 451 Return on plan assets excluding financing (593) (16) (609) 2,258 55 2,313 Contributions by employer 188 71 259 257 65 322 Contributions by employees 3 4 7 4 5 9 Benefits paid out (417) (75) (492) (376) (71) (447)Settlements/curtailment – – – – (6) (6)
At 31 December 11,957 597 12,554 12,341 593 12,934 Total return on scheme assets (153) 8 (145) 2,685 79 2,764

152 Rolls-Royce Holdings plc Annual Report 2015
Financial Statements
NOTES TO THE CONSOLIDATED FINANCIAL STATEMENTS CONTINUED
19 Post-retirement benefits continuedFair value of scheme assets at 31 December
2015 2014
UKschemes
£m
Overseasschemes
£mTotal
£m
UKschemes
£m
Overseasschemes
£mTotal
£m
Sovereign debt 7,283 297 7,580 7,282 167 7,449 Derivatives on sovereign debt (5) (1) (6) (2,622) 2 (2,620)Corporate debt instruments 1,977 239 2,216 2,053 237 2,290 Interest rate swaps 1,868 – 1,868 4,218 – 4,218 Inflation swaps (477) – (477) (360) – (360)Cash and similar instruments 118 21 139 193 127 320 Liability driven investment (LDI) portfolios 1 10,764 556 11,320 10,764 533 11,297 Longevity swap 2 (142) – (142) 10 – 10 Listed equities 810 1 811 787 3 790 Unlisted equities 232 – 232 216 – 216 Sovereign debt 110 3 113 105 4 109 Corporate debt instruments 24 – 24 15 – 15 Cash 68 21 89 166 32 198 Other 91 16 107 278 21 299 Fair value of scheme assets 11,957 597 12,554 12,341 593 12,934
1 A portfolio of gilt and swap contracts, backed by LIBOR generating assets, that is designed to hedge the majority of the interest rate and inflation risks associated with the schemes’ obligations.
2 Under the longevity swap, the Rolls-Royce Pension Fund has agreed an average life expectancy of pensioners with a counterparty. If pensioners live longer than expected the counterparty will make payments to the Fund to offset the additional cost of paying pensioners. If the reverse applies the cost of paying pensioners will be reduced but the scheme will be required to make payments to the counterparty. The longevity swap is valued at fair value in accordance with IFRS 13 (Level 3).
The scheme assets do not include any of the Group’s own financial instruments, nor any property occupied by, or other assets used by, the Group. The longevity swap is valued by the scheme actuaries based on the difference between the agreed longevity assumptions at inception and actual longevity experience. All other fair values are provided by the fund managers. Where available, the fair values are quoted prices (eg. listed equity, sovereign debt and corporate bonds). Unlisted investments (private equity) are included at values provided by the fund manager in accordance with relevant guidance. Other significant assets are valued based on observable inputs such as yield curves.
Movements in unrecognised surplus and minimum funding liability2015 2014
UKschemes
£m
Overseasschemes
£mTotal
£m
UKschemes
£m
Overseasschemes
£mTotal
£m
At 1 January – – – (534) – (534)Movements in unrecognised surplus through OCI 1 – – – 513 – 513 Movements in minimum funding liability through OCI 2 – – – 47 – 47 Related finance costs – – – (26) – (26)
At 31 December – – – – – –
1 Where a surplus has arisen on a scheme, in accordance with IAS 19 and IFRIC 14, the surplus is recognised as an asset only if it represents an unconditional economic benefit available to the Group in the future. Any surplus in excess of this benefit is not recognised in the balance sheet. During 2014, the rules of one scheme were amended, which removed the restriction on recognising the surplus.
2 A minimum funding liability arises where the statutory funding requirements require future contributions in respect of past service that will result in a future unrecognisable surplus.
FUTURE CONTRIBUTIONSThe Group expects to contribute approximately £260m to its defined benefit schemes in 2016.
In the UK, the funding is set on the basis of a triennial funding valuation by the actuaries for which the assumptions may differ from those above. In particular, the discount rate used to value the obligations takes account of the investment strategy, rather than being based on market yields of AA corporate bonds. As a result of these valuations, the Group and the scheme trustees agree a Schedule of Contributions (SoC), which sets out the required contributions from the employer and employees for current service. Where the scheme is in deficit, the SoC also includes required contributions from the employer to eliminate the deficit. The most recent agreed triennial valuations for the principal schemes are:
Obligations at 31 December 2015
£m Valuation date
Rolls-Royce Pension Fund (7,871) 31 March 2015Rolls-Royce Group Pension Scheme (1,913) 5 April 2013Vickers Group Pension Scheme (702) 31 March 2013

Rolls-Royce Holdings plc Annual Report 2015 153
Financial Statements
Financial Statements
19 Post-retirement benefits continuedSensitivitiesThe calculations of the defined benefit obligations are sensitive to the assumptions set out above. The following table summarises how the estimated impact of a change in a significant assumption would affect the UK defined benefit obligation at 31 December 2015, while holding all other assumptions constant. This sensitivity analysis may not be representative of the actual change in the defined benefit obligation as it is unlikely that the change in assumptions would occur in isolation of one another as some of the assumptions may be correlated.
For the most significant funded schemes, the investment strategies are designed to hedge the risks from interest rates and inflation on an economic basis and in the Rolls-Royce Pension Fund in the UK, the longevity of pensioners. Where appropriate, the table also includes the corresponding movement in the value of the plan assets.
£m
Reduction in the discount rate of 0.25% 1 Obligation (524)Plan assets (LDI portfolio) 569
Increase in inflation of 0.25% 1 Obligation (249)Plan assets (LDI portfolio) 231
Real increase in salaries of 0.25% Obligations (86)One year increase in life expectancy Obligations (308)
1 The difference between the sensitivities on obligations and plan assets arises largely due to differences in the methods used to value the obligations for accounting and economic purposes. On an economic basis the correlation is approximately 97% for discount rates and 89% for inflation.
20 Share capitalNon-equity Equity
SpecialShareof £1
Nominalvalue
£m
Ordinary shares
of 20p each Millions
Nominalvalue
£m
Issued and fully paidAt 1 January 2014 1 – 1,880 376
Proceeds from shares issued for share option schemes 10 2Purchase and cancellation of ordinary shares (8) (2)
At 31 December 2014 1 – 1,882 376Purchase and cancellation of ordinary shares (44) (9)
At 31 December 2015 1 – 1,838 367
The rights attaching to each class of share are set out on page 178.
In accordance with IAS 32 Financial Instruments: Presentation, the Company’s non-cumulative redeemable preference shares (C Shares) are classified as financial liabilities. Accordingly, movements in C Shares are included in note 17.
21 Share-based paymentsEFFECT OF SHARE-BASED PAYMENT TRANSACTIONS ON THE GROUP’S RESULTS AND FINANCIAL POSITION
2015£m
2014£m
Total expense recognised for equity-settled share-based payments transactions 6 26 Total credit recognised for cash-settled share-based payments transactions (1) (5)Share-based payments recognised in the consolidated income statement 5 21 Liability for cash-settled share-based payment transactions – 13
A description of the share-based payment plans is included in the Directors’ Remuneration Report on pages 77 to 89.

154 Rolls-Royce Holdings plc Annual Report 2015
Financial Statements
NOTES TO THE CONSOLIDATED FINANCIAL STATEMENTS CONTINUED
21 Share-based payments continuedMOVEMENTS IN THE GROUP’S SHARE-BASED PAYMENT PLANS DURING THE YEAR
ShareSave PSP APRA
NumberMillions
Weighted average
exercise pricePence
NumberMillions
NumberMillions
Outstanding at 1 January 2014 26.0 660 12.0 3.1 Granted – – 2.9 1.1 Additional entitlements arising from TSR performance – – 0.5 – Additional shares accrued from reinvestment of C Shares – – – 0.1 Forfeited (1.0) 775 (1.2) (0.2)Exercised (0.5) 487 (4.4) (1.7)
Outstanding at 1 January 2015 24.5 660 9.8 2.4 Granted 13.0 617 3.0 – Additional entitlements arising from TSR performance – – 0.5 – Forfeited (4.6) 908 (2.9) (0.1)Exercised (9.7) 445 (1.7) (1.4)
Outstanding 31 December 2015 23.2 677 8.7 0.9 Exercisable at 31 December 2015 – – – – Exercisable at 31 December 2014 – – – –
As share options are exercised throughout the year, the weighted average share price during the year of 820p (2014: 1013p) is representative of the weighted average share price at the date of exercise. The closing price at 31 December 2015 was 575p (2014: 870p).
FAIR VALUES OF SHARE-BASED PAYMENT PLANSThe weighted average fair value per share of equity-settled share-based payment plans granted during the year, estimated at the date of grant, are as follows:
2015 2014PSP – 25% TSR uplift 1,015p 1,105p PSP – 50% TSR uplift 1,036p 1,227p ShareSave – 3 year grant 192p n/a ShareSave – 5 year grant 219p n/a APRA n/a 984p
PSPThe fair value of shares awarded under the PSP is calculated using a pricing model that takes account of the non-entitlement to dividends (or equivalent) during the vesting period and the market-based performance condition based on expectations about volatility and the correlation of share price returns in the group of FTSE 100 companies and which incorporates into the valuation the interdependency between share price performance and TSR vesting. This adjustment increases the fair value of the award relative to the share price at the date of grant.
ShareSaveThe fair value of the options granted under the ShareSave plan is calculated using a binomial pricing model that assumes that participants will exercise their options at the beginning of the six-month window if the share price is greater than the exercise price. Otherwise it assumes that options are held until the expiration of their contractual term. This results in an expected life that falls somewhere between the start and end of the exercise window.
APRAThe fair value of shares awarded under APRA is calculated as the share price on the date of the award, excluding expected dividends (or equivalent).
22 LeasesOPERATING LEASESLeases as lessee
2015£m
2014£m
Rentals paid – hire of plant and machinery 122 123 – hire of other assets 124 75 Non-cancellable operating lease rentals are payable as follows:
Within one year 190 182 Between one and five years 488 542 After five years 496 438
1,174 1,162

Rolls-Royce Holdings plc Annual Report 2015 155
Financial Statements
Financial Statements
22 Leases continuedLeases as lessor
2015£m
2014£m
Rentals received – credited within revenue from aftermarket services 3 15 Non-cancellable operating lease rentals are receivable as follows:
Within one year 12 16 Between one and five years 12 30 After five years 8 13
32 59
The Group acts as lessee and lessor for both land and buildings and gas turbine engines, and acts as lessee for some plant and equipment.
• Sublease payments of £1m (2014: £1m) and sublease receipts of £3m (2014: £12m) were recognised in the income statement in the year.• Purchase options exist on aero engines, land and buildings and plant and equipment with the period to the purchase option date
varying between one to eight years.• Renewal options exist on aero engines, land and buildings and plant and equipment with the period to the renewal option varying
between one to 52 years at terms to be negotiated upon renewal.• Escalation clauses exist on some leases and are linked to LIBOR.• The total future minimum sublease payments expected to be made is £3m (2014: £6m) and sublease receipts expected to be received
are £24m (2014: £31m).
FINANCE LEASESFinance lease liabilities are payable as follows:
2015 2014
Payments£m
Interest£m
Principal£m
Payments£m
Interest£m
Principal£m
Within one year 5 2 3 3 2 1Between one and five years 18 8 10 13 7 6After five years 46 7 39 47 9 38
69 17 52 63 18 45
23 Contingent liabilitiesContingent liabilities in respect of customer financing commitments are described in note 18.
On 6 December 2012, the Company announced that it had passed information to the Serious Fraud Office (SFO), following a request from the SFO for information about allegations of malpractice in overseas markets. On 23 December 2013, the Company announced that it had been informed by the SFO that it had commenced a formal investigation. Since the initial announcement, the Company has continued its investigations and is engaging with the SFO and other authorities in the UK, the USA and elsewhere in relation to the matters of concern.
The consequence of these disclosures will be decided by the regulatory authorities. It is too early to predict the outcomes, but these could include the prosecution of individuals and of the Group. Accordingly, the potential for fines, penalties or other consequences cannot currently be assessed. As the investigation is ongoing, it is not yet possible to identify the timescale in which these issues might be resolved.
Contingent liabilities exist in respect of guarantees provided by the Group in the ordinary course of business for product delivery, performance and reliability. The Group has, in the normal course of business, entered into arrangements in respect of export finance, performance bonds, countertrade obligations and minor miscellaneous items. Various Group undertakings are parties to legal actions and claims which arise in the ordinary course of business, some of which are for substantial amounts. As a consequence of the insolvency of an insurer as previously reported, the Group is no longer fully insured against known and potential claims from employees who worked for certain of the Group’s UK-based businesses for a period prior to the acquisition of those businesses by the Group. While the outcome of some of these matters cannot precisely be foreseen, the Directors do not expect any of these arrangements, legal actions or claims, after allowing for provisions already made, to result in significant loss to the Group.
The Group’s share of equity accounted entities’ contingent liabilities is £11m (2014: £11m).
156 Rolls-Royce Holdings plc Annual Report 2015
Financial Statements
NOTES TO THE CONSOLIDATED FINANCIAL STATEMENTS CONTINUED
24 Related party transactions2015
£m 2014
£m
Sales of goods and services to joint ventures and associates 1,896 2,138 Purchases of goods and services from joint ventures and associates (2,266) (2,544)Operating lease payments to joint ventures and associates (88) (81)Guarantees of joint ventures' and associates' borrowings 9 9 Dividends received from joint ventures and associates 63 73 RRSA receipts from joint ventures and associates 16 2 Other income received from joint ventures and associates 2 2
Included in sales of goods and services to joint ventures and associates are sales of spare engines amounting to £189m (2014: £138m). Profit recognised in the year on such sales amounted to £71m (2014: £54m), including profit on current year sales and recognition of profit deferred on sales in previous years.
The aggregated balances with joint ventures are shown in notes 13 and 16. Transactions with Group pension schemes are shown in note 19.
In the course of normal operations, related party transactions entered into by the Group have been contracted on an arms-length basis.
Key management personnel are deemed to be the Directors and the members of the ELT as set out on pages 58 to 61. Remuneration for key management personnel is shown below:
2015£m
2014£m
Salaries and short-term benefits 8 9Post-retirement schemes – 1 Share-based payments – 4
8 14
More detailed information regarding the Directors’ remuneration, shareholdings, pension entitlements, share options and other long-term incentive plans is shown in the Directors’ Remuneration Report on pages 77 to 89. The charge for share-based payments above is based on when the award is charged to the income statement in accordance with IFRS 2 Share-Based Payments, rather than when the shares vest, which is the basis used in the Directors’ Remuneration Report.
25 Acquisitions and disposalsACQUISITIONSOn 27 March 2015, the Group acquired 100% of R.O.V. Technologies Inc. for US$8m. The acquisition gave rise to goodwill of £1m and other intangible assets of £2m.
DISPOSALSOn 27 November 2015, the Group completed the sale of its Michell Bearings business (comprising a business based in the UK, and a 51% shareholding in Michell Bearings (India) Pvt Ltd, a subsidiary company based in Bangalore) for net consideration of £2m.

Rolls-Royce Holdings plc Annual Report 2015 157
Financial Statements
Financial Statements
COMPANY BALANCE SHEETAt 31 December 2015
Notes2015
£m2014
£m
AssetsNon-current assetsInvestments – subsidiary undertakings 2 12,016 12,015Current assetsTrade and other receivables – 57 TOTAL ASSETS 12,016 12,072
LiabilitiesCurrent liabilitiesOther financial liabilities 3 (29) (22)Trade and other payables (842) – TOTAL LIABILITIES (871) (22)
NET ASSETS 11,145 12,050
EquityCalled-up share capital 4 367 376 Share premium account 180 179 Merger reserve 7,359 7,789 Capital redemption reserve 1,699 1,267 Other reserve 126 124 Retained earnings 1,414 2,315 TOTAL EQUITY 11,145 12,050
The financial statements on pages 157 to 159 were approved by the Board on 11 February 2016 and signed on its behalf by:
WARREN EAST Chief Executive DAVID SMITH Chief Financial Officer
Company’s registered number: 7524813
COMPANY STATEMENT OF CHANGES IN EQUITYFor the year ended 31 December 2015
Attributable to ordinary shareholders
Sharecapital
£m
Share premium
£m
Mergerreserve
£m
Capitalredemption
reserve£m
Otherreserve1
£m
Retained earnings
£m
Totalequity
£m
At 1 January 2015 376 179 7,789 1,267 124 2,315 12,050 Profit for the year – – – – – – –Shares issued to share trust – 1 – – – – 1Cancellation of ordinary shares (9) – – 9 – – –Purchase of ordinary shares – – – – – (414) (414)Issue of C Shares – – (430) – – – (430)Redemption of C Shares – – – 423 – (423) –Share-based payments – direct to equity – – – – 2 (64) (62)
At 31 December 2015 367 180 7,359 1,699 126 1,414 11,145 1 The ‘Other reserve’ represents the value of share-based payments in respect of employees of subsidiary undertakings for which payment has not been received
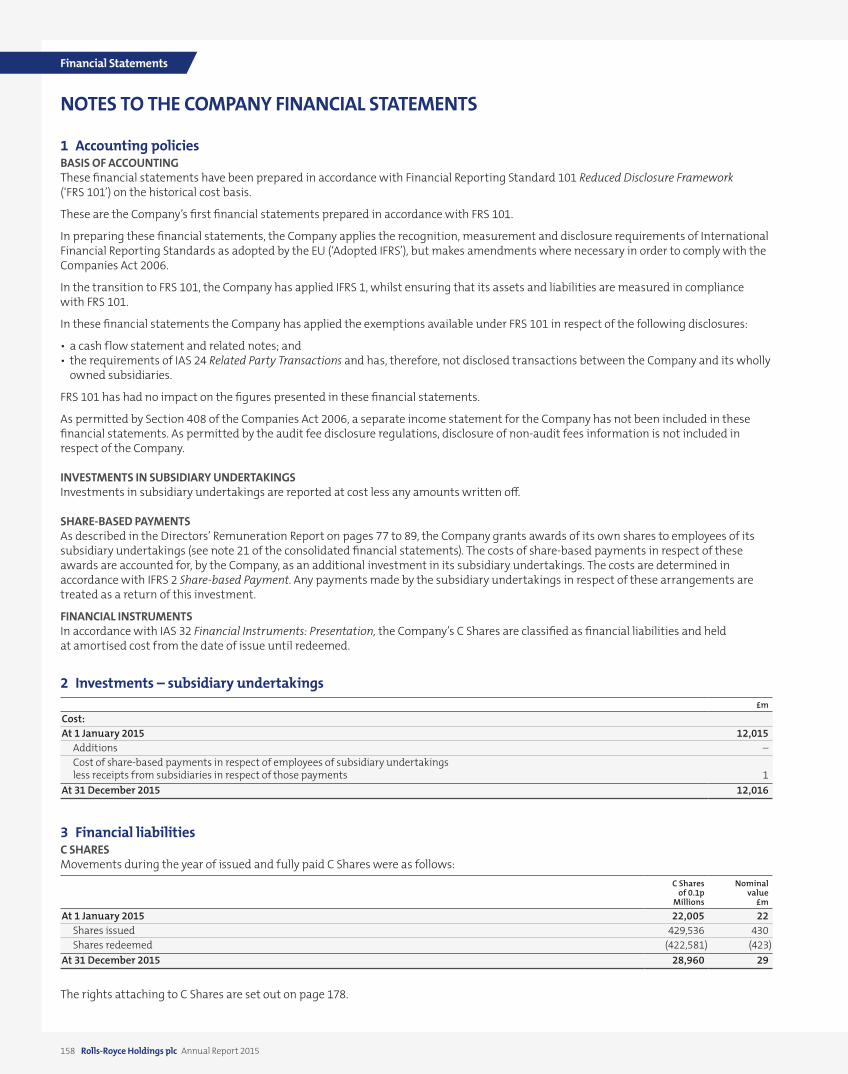
158 Rolls-Royce Holdings plc Annual Report 2015
Financial Statements
NOTES TO THE COMPANY FINANCIAL STATEMENTS
1 Accounting policiesBASIS OF ACCOUNTINGThese financial statements have been prepared in accordance with Financial Reporting Standard 101 Reduced Disclosure Framework (‘FRS 101’) on the historical cost basis.
These are the Company’s first financial statements prepared in accordance with FRS 101.
In preparing these financial statements, the Company applies the recognition, measurement and disclosure requirements of International Financial Reporting Standards as adopted by the EU (‘Adopted IFRS’), but makes amendments where necessary in order to comply with the Companies Act 2006.
In the transition to FRS 101, the Company has applied IFRS 1, whilst ensuring that its assets and liabilities are measured in compliance with FRS 101.
In these financial statements the Company has applied the exemptions available under FRS 101 in respect of the following disclosures:
• a cash flow statement and related notes; and• the requirements of IAS 24 Related Party Transactions and has, therefore, not disclosed transactions between the Company and its wholly
owned subsidiaries.
FRS 101 has had no impact on the figures presented in these financial statements.
As permitted by Section 408 of the Companies Act 2006, a separate income statement for the Company has not been included in these financial statements. As permitted by the audit fee disclosure regulations, disclosure of non-audit fees information is not included in respect of the Company.
INVESTMENTS IN SUBSIDIARY UNDERTAKINGSInvestments in subsidiary undertakings are reported at cost less any amounts written off.
SHARE-BASED PAYMENTSAs described in the Directors’ Remuneration Report on pages 77 to 89, the Company grants awards of its own shares to employees of its subsidiary undertakings (see note 21 of the consolidated financial statements). The costs of share-based payments in respect of these awards are accounted for, by the Company, as an additional investment in its subsidiary undertakings. The costs are determined in accordance with IFRS 2 Share-based Payment. Any payments made by the subsidiary undertakings in respect of these arrangements are treated as a return of this investment.
FINANCIAL INSTRUMENTSIn accordance with IAS 32 Financial Instruments: Presentation, the Company’s C Shares are classified as financial liabilities and held at amortised cost from the date of issue until redeemed.
2 Investments – subsidiary undertakings£m
Cost:At 1 January 2015 12,015
Additions – Cost of share-based payments in respect of employees of subsidiary undertakings less receipts from subsidiaries in respect of those payments 1
At 31 December 2015 12,016
3 Financial liabilitiesC SHARESMovements during the year of issued and fully paid C Shares were as follows:
C Sharesof 0.1p
Millions
Nominalvalue
£m
At 1 January 2015 22,005 22 Shares issued 429,536 430 Shares redeemed (422,581) (423)
At 31 December 2015 28,960 29
The rights attaching to C Shares are set out on page 178.

Rolls-Royce Holdings plc Annual Report 2015 159
Financial Statements
Financial Statements
4 Share capitalNon-equity Equity
SpecialShareof £1
Preference shares of
£1 each
Nominalvalue
£m
Ordinaryshares of20p eachMillions
Nominalvalue
£m
Issued and fully paidAt 1 January 2015 1 – – 1,882 376
Cancellation of ordinary shares (44) (9)At 31 December 2015 1 – – 1,838 367
The rights attaching to each class of share are set out on page 178.
In accordance with IAS 32, the Company’s non-cumulative redeemable preference shares (C Shares) are classified as financial liabilities. Accordingly, movements in C Shares are included in note 3.
5 Contingent liabilitiesWhere the Company enters into financial guarantee contracts to guarantee the indebtedness of other companies within its group, the Company considers these to be insurance arrangements, and accounts for them as such. In this respect, the Company treats the guarantee contract as a contingent liability until such time as it becomes probable that the Company will be required to make a payment under the guarantee.
At 31 December 2015, these guarantees amounted to £1,937m (2014: £959m).
6 Other information
EMOLUMENTS OF DIRECTORSThe remuneration of the Directors of the Company is shown in the Directors’ Remuneration Report on pages 77 to 89.
EMPLOYEESThe Company had no employees in 2015.
SHARE-BASED PAYMENTSShares in the Company have been granted to employees of the Group as part of share-based payment plans, and are charged in the employing company.