Embed Size (px)
Citation preview


04 Statement of Management’s Responsibility for Financial Statements
05 Independent Auditor’s Report
07 Statements of Financial Position
08 Statements of Income
10 Statements of Comprehensive Income
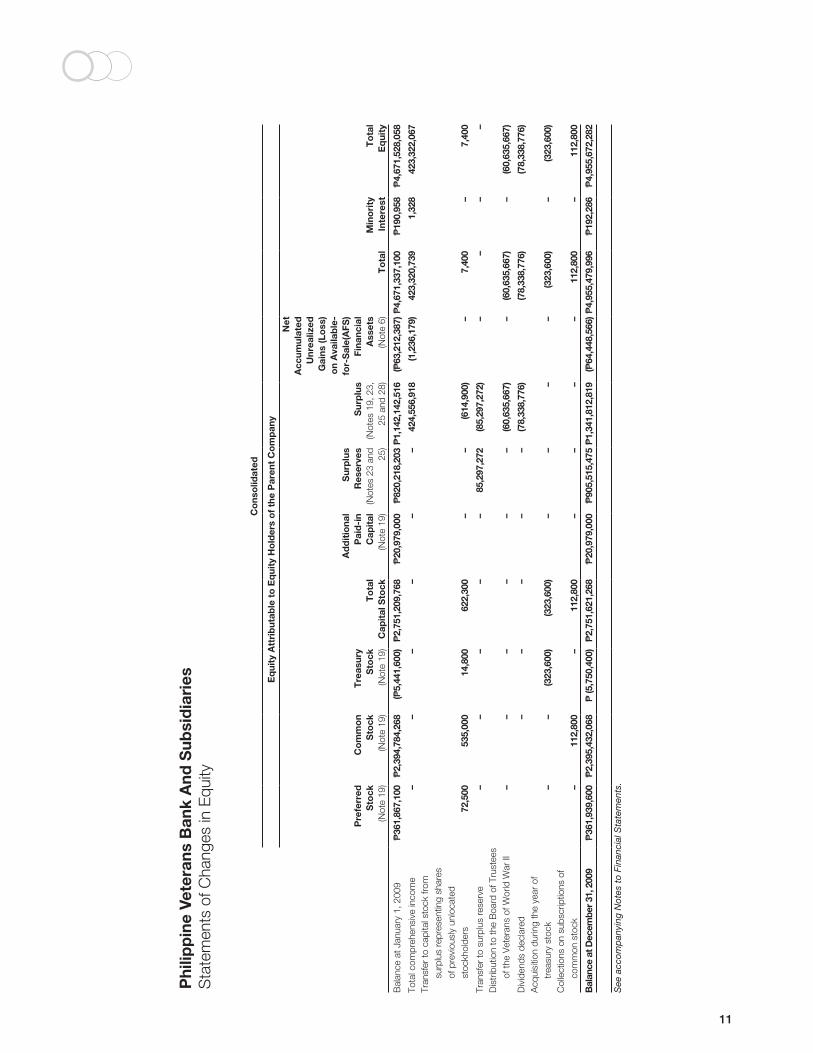
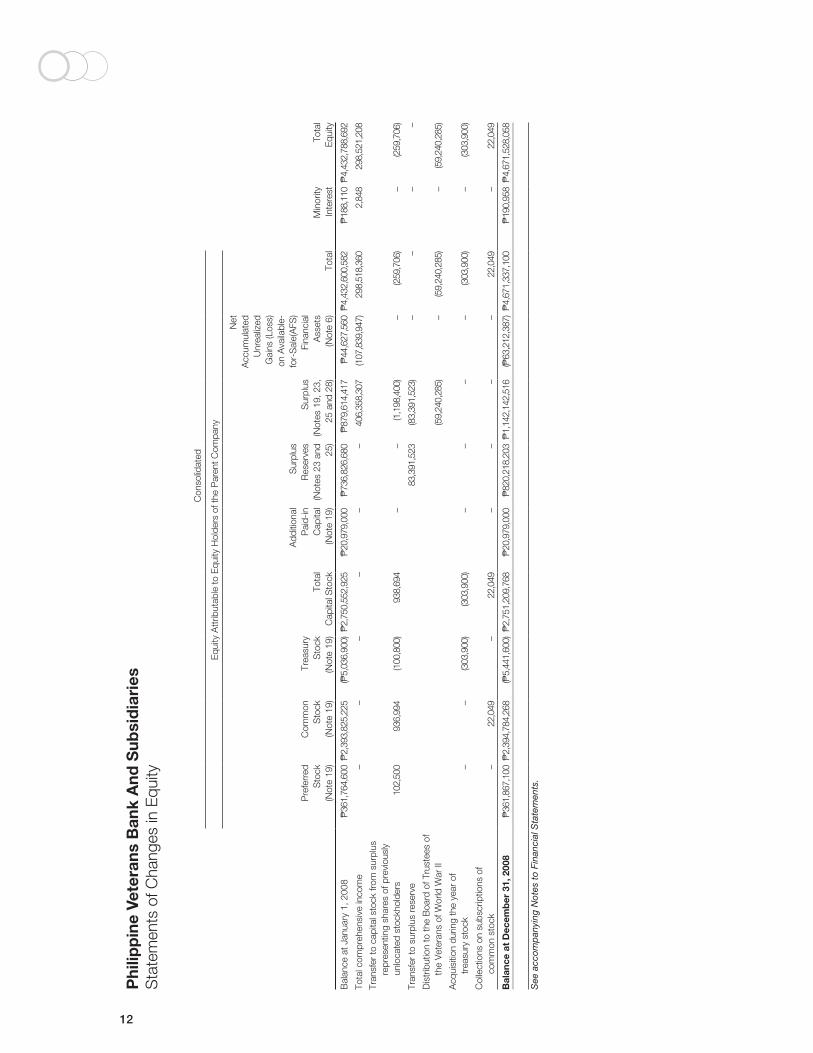
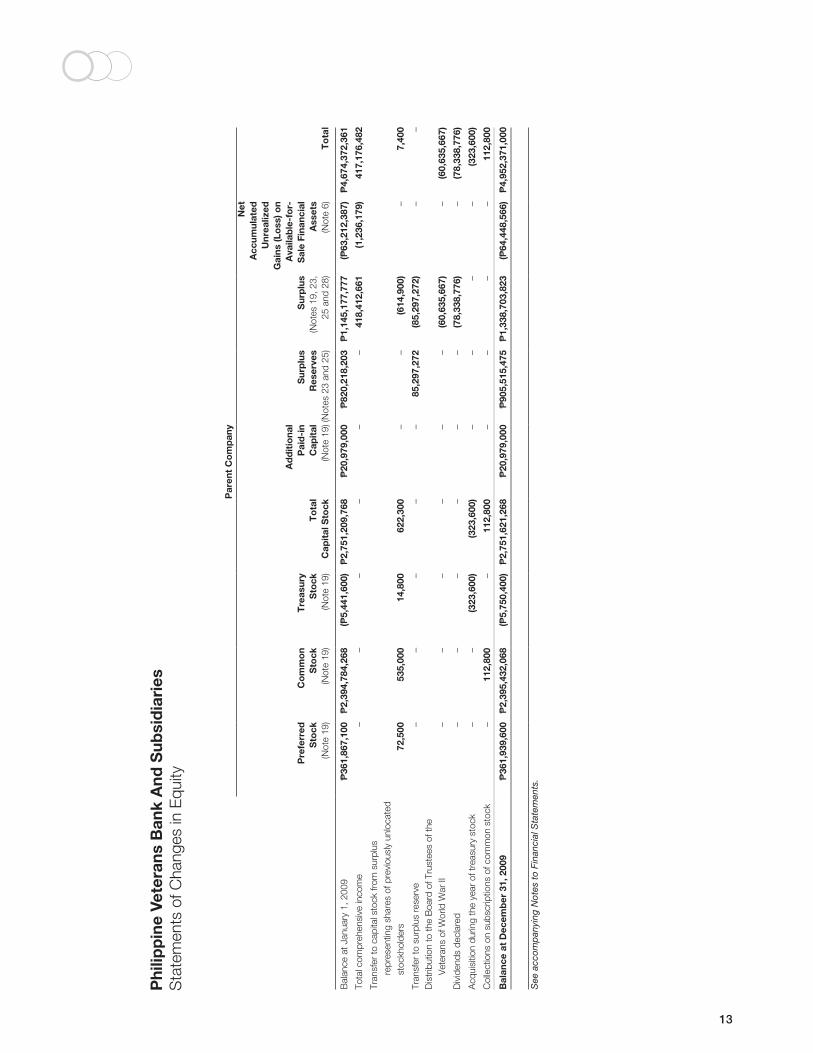
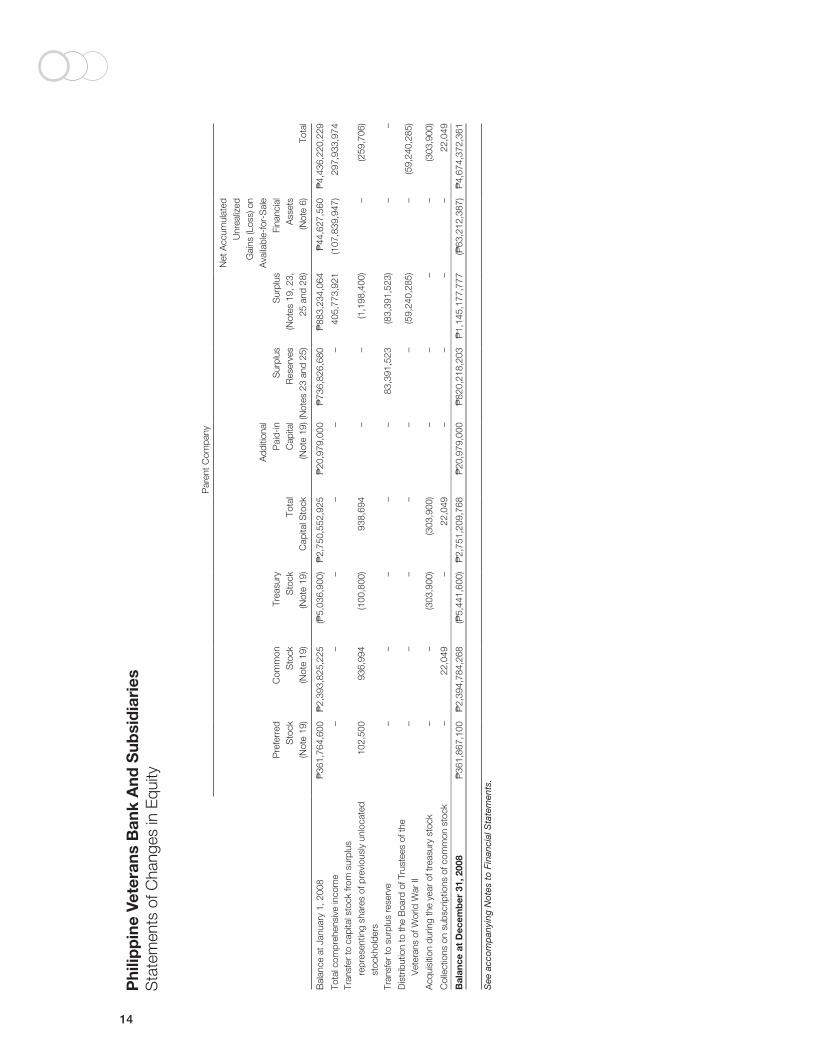
11 Statements of Changes in Equity
15 Statements of Cash Flows
17 Notes to Financial Statements
Financial Statements and Independent Auditor’s ReportYears Ended December 31, 2009 and 2008
Philippine Veterans Bank and Subsidiaries
4
Statement of Management Responsibility for Financial Statements
The management of Philippine Veterans Bank (the Bank) is responsible for all information and representations contained in the consolidated and parent company financial statements as of December 31, 2009 and 2008 and for the schedules referred therein as of December 31, 2009. The consolidated and parent company financial statements have been prepared in conformity with generally accounting principles in the Philippines and reflect amounts that are based on the best estimates and informed judgment of management with appropriate consideration to materiality.
In this regard, management maintains a system of accounting and reporting which provides for the necessary internal controls to ensure that transactions are properly authorized and recorded, assets are safeguarded against unauthorized use or disposition and liabilities are recognized. The management likewise discloses to the Company’s Audit Committee and to its external auditor: (i) all significant deficiencies in the design or operation of internal controls that could adversely affect its ability to record, process and report financial data; (ii) material weaknesses in internal controls; and (iii) any fraud that involves management or other employees who exercise significant roles in internal controls.
The Board of Directors reviews the consolidated and parent company financial statements before such statements are approved and submitted to the stockholders of the Bank.
SyCip Gorres Velayo & Co., the independent auditors appointed by the stockholders, have examined the consolidated and parent company financial statements in accordance with generally accepted audting standards in the Philippines and have expressed its opinion on the fairness of presentation upon completion of such examination, in its report to the Board of Directors and stockholders.
EMMANUEL V. DE OCAMPO Chairman
RICARDO A. BALBIDO, JR.President & Chief Executive Officer
TERESITA E. LOGARTASenior Vice-PresidentComptroller
Independent Auditors Report
5
The Stockholders and the Board of DirectorsPhilippine Veterans Bank
We have audited the accompanying financial statements of Philippine Veterans Bank and Subsidiaries (the Group) and of Philippine Veterans Bank (the Parent Company), which comprise the consolidated and the parent company statements of financial position as at December 31, 2009 and 2008, and the consolidated and parent company statements of income, the consolidated and the parent company statements of comprehensive income, the consolidated and the parent company statements of changes in equity and the consolidated and the parent company statements of cash flows for the years then ended, and a summary of significant accounting policies and other explanatory notes.
Management’s Responsibility for the Financial StatementsManagement is responsible for the preparation and fair presentation of these financial statements in accordance with Philippine Financial Reporting Standards. This responsibility includes: designing, implementing and maintaining internal control relevant to the preparation and fair presentation of financial statements that are free from material misstatement, whether due to fraud or error; selecting and applying appropriate accounting policies; and making accounting estimates that are reasonable in the circumstances.
Auditors’ ResponsibilityOur responsibility is to express an opinion on these financial statements based on our audits. We conducted our audits in accordance with Philippine Standards on Auditing. Those standards require that we comply with ethical requirements and plan and perform the audit to obtain reasonable assurance whether the financial statements are free from material misstatement.
An audit involves performing procedures to obtain audit evidence about the amounts and disclosures in the financial statements. The procedures selected depend on the auditor’s judgment, including the assessment of the risks of material misstatement of the financial statements, whether due to fraud or error. In making those risk assessments, the auditor considers internal control relevant to the entity’s preparation and fair presentation of the financial statements in order to design audit procedures that are appropriate in the circumstances, but not for the purpose of expressing an opinion on the effectiveness of the entity’s internal control. An audit also includes evaluating the appropriateness of accounting policies used and the reasonableness of accounting estimates made by management, as well as evaluating the overall presentation of the financial statements.
We believe that the audit evidence we have obtained is sufficient and appropriate to provide a basis for our audit opinion.
6
Independent Auditors Report
OpinionAs discussed in Note 28 to the financial statements, in 2008, the Parent Company recognized P1,103.69 million of the required allowance for probable losses on Interbank call loans (IBCL) to a thrift bank of P1,138.60 million in 2006. The remaining required allowance and the required provision on the additional IBCL in 2007 totaling to P565.91 million and the required allowance on accounts receivable amounting to P19.54 million and P886.00 million, representing the uninsured deposits assumed in 2009 and 2008, respectively, were deferred over 20 years as approved by the Banko Sentral ng Pilipinas. The Philippine Financial Reporting Standards require that the allowance on the IBCL be charged against 2007 and 2006 operations and the allowance on accounts receivable be charged against 2009 and 2008 operations. Had such allowance been charged to the proper accounting period, the Group and the Parent Company’s net income in 2009 and 2008 would have been increased by P4.43 million and P152.38 million, net of related deferred income tax, respectively, and both the surplus and total assets would have been decreased by P1,011.91 million as of December 31, 2009 and P1,016.34 million as of December 31, 2008. As further discussed in Note 28, management computed that the earnings of the government securities from the special liquidity support will effectively cover the required allowance on the Parent Company’s IBCL to the thrift bank and the assumed uninsured deposits.
As discussed in Note 7 to the financial statements, the Parent Company sold a non-performing asset (NPA) to a special purpose vehicle (SPV) company on a without recourse basis. In accordance with regulatory accounting policies prescribed by the Bangko Sentral ng Pilipinas for banks and financial institutions availing of the provisions of RA No. 9182, the Special Purpose Vehicle Act of 2002, losses amounting to P63.4 million from the sale of the NPA to the SPV company were deferred and are being amortized over a ten-year period. Had the loss from the sale of NPA been charged against current operations as required by the Philippine Financial Reporting Standards, the Group and the Parent Company’s total assets as of December 31, 2009 and net income in 2009 would have been decreased by P61.1 million.
In our opinion, except for the effects on the 2009 and 2008 consolidated and parent company financial statements of the matters discussed in the preceding paragraphs, the consolidated and the parent company financial statements present fairly, in all material respects, the financial position of the Group and of the Parent Company as of December 31, 2009 and 2008, and their financial performance and their cash flows for the years then ended in accordance with Philippine Financial Reporting Standards.
SYCIP GORRES VELAYO & CO.
Janet A. ParaisoPartnerCPA Certificate No. 92305SEC Accreditation No. 0778-ATax Identification No. 193-975-241PTR No. 2087360, January 4, 2010, Makati City
April 13, 2010
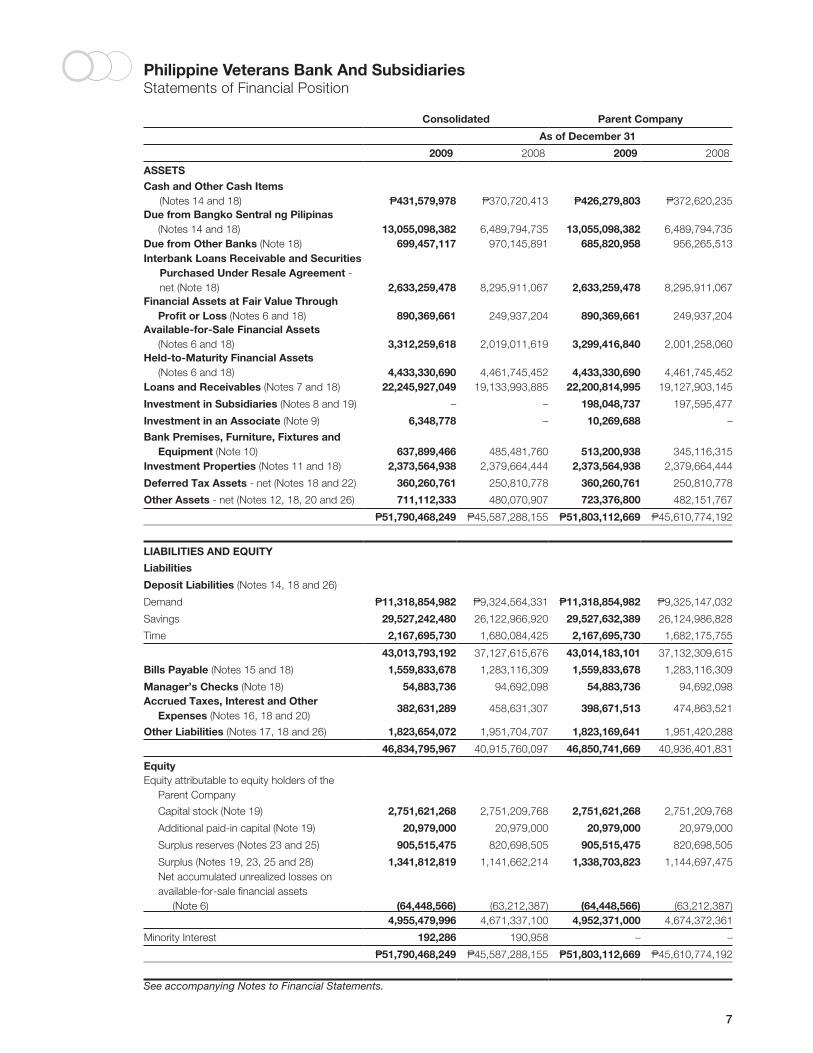
Philippine Veterans Bank And SubsidiariesStatements of Financial Position
7
Consolidated Parent Company
As of December 31
2009 2008 2009 2008
ASSETSCash and Other Cash Items
(Notes 14 and 18) P431,579,978 P370,720,413 P426,279,803 P372,620,235Due from Bangko Sentral ng Pilipinas
(Notes 14 and 18) 13,055,098,382 6,489,794,735 13,055,098,382 6,489,794,735Due from Other Banks (Note 18) 699,457,117 970,145,891 685,820,958 956,265,513Interbank Loans Receivable and Securities
Purchased Under Resale Agreement - net (Note 18) 2,633,259,478 8,295,911,067 2,633,259,478 8,295,911,067
Financial Assets at Fair Value Through Profit or Loss (Notes 6 and 18) 890,369,661 249,937,204 890,369,661 249,937,204
Available-for-Sale Financial Assets (Notes 6 and 18) 3,312,259,618 2,019,011,619 3,299,416,840 2,001,258,060
Held-to-Maturity Financial Assets (Notes 6 and 18) 4,433,330,690 4,461,745,452 4,433,330,690 4,461,745,452
Loans and Receivables (Notes 7 and 18) 22,245,927,049 19,133,993,885 22,200,814,995 19,127,903,145
Investment in Subsidiaries (Notes 8 and 19) – – 198,048,737 197,595,477
Investment in an Associate (Note 9) 6,348,778 – 10,269,688 –
Bank Premises, Furniture, Fixtures and Equipment (Note 10) 637,899,466 485,481,760 513,200,938 345,116,315
Investment Properties (Notes 11 and 18) 2,373,564,938 2,379,664,444 2,373,564,938 2,379,664,444
Deferred Tax Assets - net (Notes 18 and 22) 360,260,761 250,810,778 360,260,761 250,810,778
Other Assets - net (Notes 12, 18, 20 and 26) 711,112,333 480,070,907 723,376,800 482,151,767
P51,790,468,249 P45,587,288,155 P51,803,112,669 P45,610,774,192
LIABILITIES AND EQUITY
Liabilities
Deposit Liabilities (Notes 14, 18 and 26)
Demand P11,318,854,982 P9,324,564,331 P11,318,854,982 P9,325,147,032
Savings 29,527,242,480 26,122,966,920 29,527,632,389 26,124,986,828
Time 2,167,695,730 1,680,084,425 2,167,695,730 1,682,175,755
43,013,793,192 37,127,615,676 43,014,183,101 37,132,309,615
Bills Payable (Notes 15 and 18) 1,559,833,678 1,283,116,309 1,559,833,678 1,283,116,309
Manager’s Checks (Note 18) 54,883,736 94,692,098 54,883,736 94,692,098Accrued Taxes, Interest and Other
Expenses (Notes 16, 18 and 20)382,631,289 458,631,307 398,671,513 474,863,521
Other Liabilities (Notes 17, 18 and 26) 1,823,654,072 1,951,704,707 1,823,169,641 1,951,420,288
46,834,795,967 40,915,760,097 46,850,741,669 40,936,401,831
EquityEquity attributable to equity holders of the
Parent Company
Capital stock (Note 19) 2,751,621,268 2,751,209,768 2,751,621,268 2,751,209,768
Additional paid-in capital (Note 19) 20,979,000 20,979,000 20,979,000 20,979,000
Surplus reserves (Notes 23 and 25) 905,515,475 820,698,505 905,515,475 820,698,505
Surplus (Notes 19, 23, 25 and 28) 1,341,812,819 1,141,662,214 1,338,703,823 1,144,697,475 Net accumulated unrealized losses on
available-for-sale financial assets (Note 6) (64,448,566) (63,212,387) (64,448,566) (63,212,387)
4,955,479,996 4,671,337,100 4,952,371,000 4,674,372,361
Minority Interest 192,286 190,958 – –
P51,790,468,249 P45,587,288,155 P51,803,112,669 P45,610,774,192
See accompanying Notes to Financial Statements.
8
Consolidated Parent CompanyYears Ended December 31
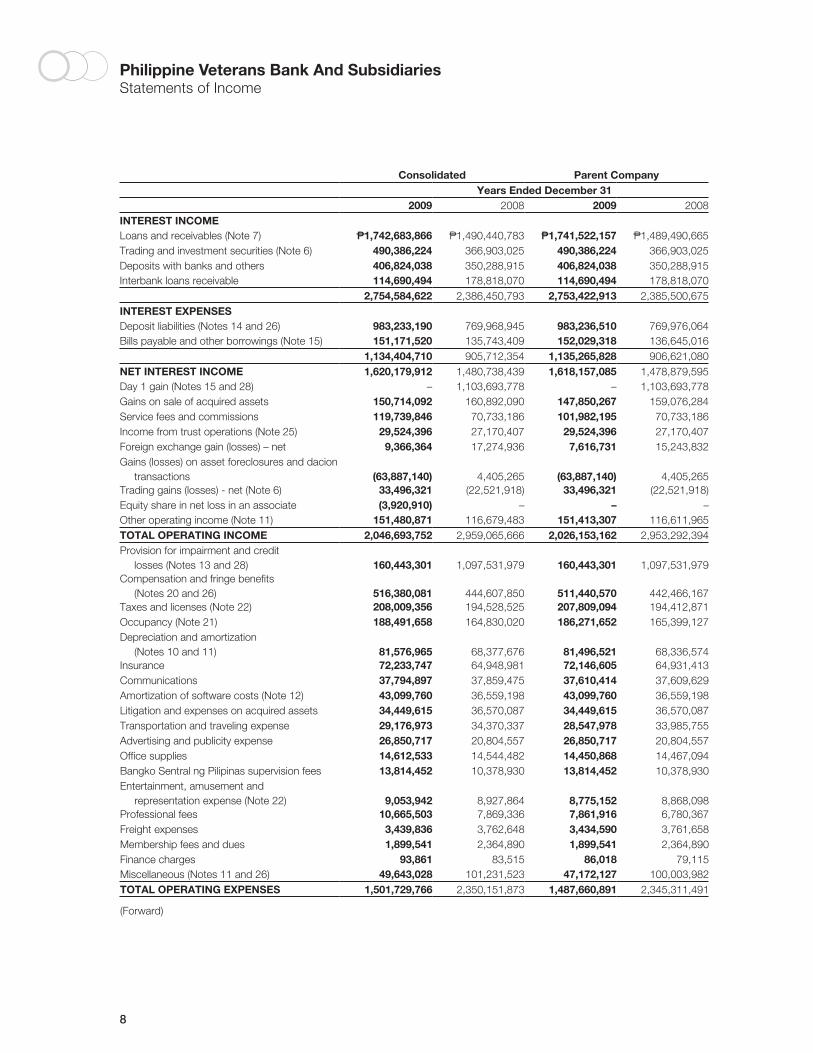
2009 2008 2009 2008INTEREST INCOMELoans and receivables (Note 7) P1,742,683,866 P1,490,440,783 P1,741,522,157 P1,489,490,665Trading and investment securities (Note 6) 490,386,224 366,903,025 490,386,224 366,903,025Deposits with banks and others 406,824,038 350,288,915 406,824,038 350,288,915Interbank loans receivable 114,690,494 178,818,070 114,690,494 178,818,070
2,754,584,622 2,386,450,793 2,753,422,913 2,385,500,675INTEREST EXPENSESDeposit liabilities (Notes 14 and 26) 983,233,190 769,968,945 983,236,510 769,976,064Bills payable and other borrowings (Note 15) 151,171,520 135,743,409 152,029,318 136,645,016
1,134,404,710 905,712,354 1,135,265,828 906,621,080NET INTEREST INCOME 1,620,179,912 1,480,738,439 1,618,157,085 1,478,879,595Day 1 gain (Notes 15 and 28) – 1,103,693,778 – 1,103,693,778Gains on sale of acquired assets 150,714,092 160,892,090 147,850,267 159,076,284Service fees and commissions 119,739,846 70,733,186 101,982,195 70,733,186Income from trust operations (Note 25) 29,524,396 27,170,407 29,524,396 27,170,407Foreign exchange gain (losses) – net 9,366,364 17,274,936 7,616,731 15,243,832Gains (losses) on asset foreclosures and dacion
transactions (63,887,140) 4,405,265 (63,887,140) 4,405,265Trading gains (losses) - net (Note 6) 33,496,321 (22,521,918) 33,496,321 (22,521,918)Equity share in net loss in an associate (3,920,910) – – –Other operating income (Note 11) 151,480,871 116,679,483 151,413,307 116,611,965TOTAL OPERATING INCOME 2,046,693,752 2,959,065,666 2,026,153,162 2,953,292,394Provision for impairment and credit
losses (Notes 13 and 28) 160,443,301 1,097,531,979 160,443,301 1,097,531,979Compensation and fringe benefits
(Notes 20 and 26) 516,380,081 444,607,850 511,440,570 442,466,167Taxes and licenses (Note 22) 208,009,356 194,528,525 207,809,094 194,412,871Occupancy (Note 21) 188,491,658 164,830,020 186,271,652 165,399,127Depreciation and amortization
(Notes 10 and 11) 81,576,965 68,377,676 81,496,521 68,336,574Insurance 72,233,747 64,948,981 72,146,605 64,931,413Communications 37,794,897 37,859,475 37,610,414 37,609,629Amortization of software costs (Note 12) 43,099,760 36,559,198 43,099,760 36,559,198Litigation and expenses on acquired assets 34,449,615 36,570,087 34,449,615 36,570,087Transportation and traveling expense 29,176,973 34,370,337 28,547,978 33,985,755Advertising and publicity expense 26,850,717 20,804,557 26,850,717 20,804,557Office supplies 14,612,533 14,544,482 14,450,868 14,467,094Bangko Sentral ng Pilipinas supervision fees 13,814,452 10,378,930 13,814,452 10,378,930Entertainment, amusement and
representation expense (Note 22) 9,053,942 8,927,864 8,775,152 8,868,098Professional fees 10,665,503 7,869,336 7,861,916 6,780,367Freight expenses 3,439,836 3,762,648 3,434,590 3,761,658Membership fees and dues 1,899,541 2,364,890 1,899,541 2,364,890Finance charges 93,861 83,515 86,018 79,115Miscellaneous (Notes 11 and 26) 49,643,028 101,231,523 47,172,127 100,003,982TOTAL OPERATING EXPENSES 1,501,729,766 2,350,151,873 1,487,660,891 2,345,311,491
(Forward)
Philippine Veterans Bank And SubsidiariesStatements of Income
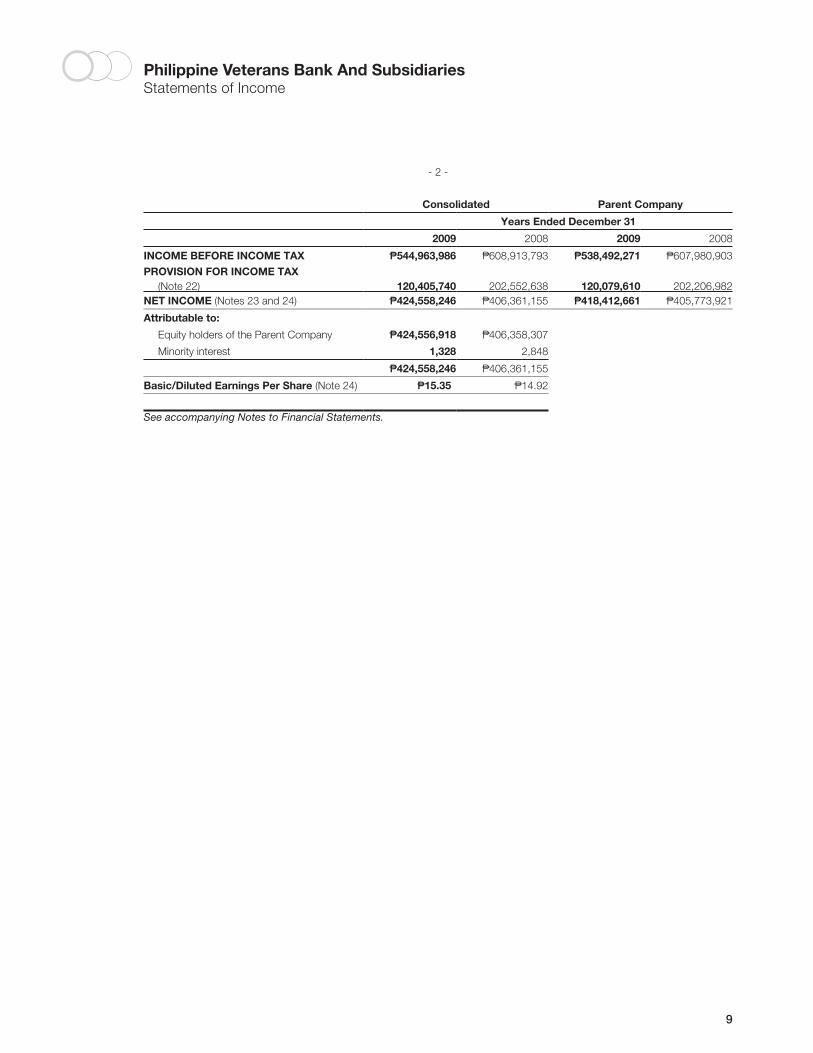
Philippine Veterans Bank And SubsidiariesStatements of Income
9
- 2 -
Consolidated Parent Company
Years Ended December 31
2009 2008 2009 2008
INCOME BEFORE INCOME TAX P544,963,986 P608,913,793 P538,492,271 P607,980,903
PROVISION FOR INCOME TAX (Note 22) 120,405,740 202,552,638 120,079,610 202,206,982
NET INCOME (Notes 23 and 24) P424,558,246 P406,361,155 P418,412,661 P405,773,921
Attributable to:
Equity holders of the Parent Company P424,556,918 P406,358,307
Minority interest 1,328 2,848
P424,558,246 P406,361,155
Basic/Diluted Earnings Per Share (Note 24) P15.35 P14.92
See accompanying Notes to Financial Statements.
10
Consolidated Parent Company
Years Ended December 31
2009 2008 2009 2008
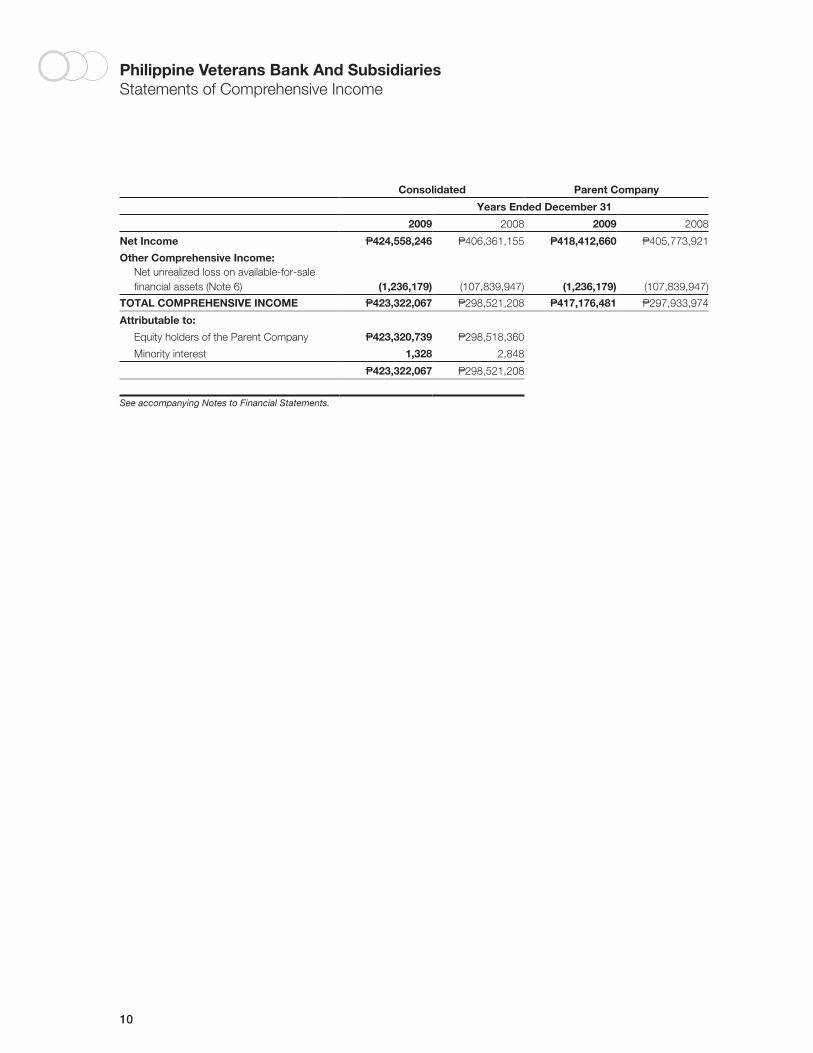
Net Income P424,558,246 P406,361,155 P418,412,660 P405,773,921
Other Comprehensive Income: Net unrealized loss on available-for-sale
financial assets (Note 6) (1,236,179) (107,839,947) (1,236,179) (107,839,947)
TOTAL COMPREHENSIVE INCOME P423,322,067 P298,521,208 P417,176,481 P297,933,974
Attributable to:
Equity holders of the Parent Company P423,320,739 P298,518,360
Minority interest 1,328 2,848
P423,322,067 P298,521,208
See accompanying Notes to Financial Statements.
Philippine Veterans Bank And SubsidiariesStatements of Comprehensive Income
Phi
lipp
ine
Vete
rans
Ban
k A
nd S
ubsi
dia
ries
Sta
tem
ents
of C
hang
es in
Equ
ity
11
Co
nso
lidat
ed
Eq
uity
Att
rib
utab
le t
o E
qui
ty H
old
ers
of
the
Par
ent
Co
mp
any
Pre
ferr
edS
tock
(Not
e 19
)
Co
mm
on
Sto
ck(N
ote
19)
Tre
asur
yS
tock
(Not
e 19
)T
ota
lC
apit
al S
tock
Ad
dit
iona
lP
aid
-in
Cap
ital
(Not
e 19
)
Sur
plu
sR
eser
ves
(Not
es 2
3 an
d 25
)
Sur
plu
s(N
otes
19,
23,
25
and
28)
Net
A
ccum
ulat
edU
nrea
lized
Gai
ns (L
oss
) o
n A
vaila
ble
-fo
r-S
ale(
AFS
) Fi
nanc
ial
Ass
ets
(Not
e 6)
To
tal
Min
ori
tyIn
tere
stT
ota
lE
qui
ty
Bal
ance
at J
anua
ry 1
, 200
9P
361,
867,
100
P2,
394,
784,
268
(P5,
441,
600)
P2,
751,
209,
768
P20
,979
,000
P82
0,21
8,20
3P
1,14
2,14
2,51
6(P
63,2
12,3
87)
P4,
671,
337,
100
P19
0,95
8P
4,67
1,52
8,05
8
Tota
l com
preh
ensi
ve in
com
e–
––
––
–42
4,55
6,91
8(1
,236
,179
)42
3,32
0,73
91,
328
423,
322,
067
Tran
sfer
to c
apita
l sto
ck fr
om
surp
lus
repr
esen
ting
shar
es
of p
revi
ousl
y un
loca
ted
stoc
khol
ders
72,5
0053
5,00
014
,800
622,
300
––
(614
,900
)–
7,40
0–
7,40
0
Tran
sfer
to s
urpl
us r
eser
ve
––
––
–85
,297
,272
(85,
297,
272)
––
––
Dis
trib
utio
n to
the
Boa
rd o
f Tru
stee
s of
the
Vet
eran
s of
Wor
ld W
ar II
––
––
––
(60,
635,
667)
–(6
0,63
5,66
7)–
(60,
635,
667)
Div
iden
ds d
ecla
red
––
––
–(7
8,33
8,77
6)(7
8,33
8,77
6)(7
8,33
8,77
6)A
cqui
sitio
n du
ring
the
year
of
trea
sury
sto
ck–
–(3
23,6
00)
(323
,600
)–
––
–(3
23,6
00)
–(3
23,6
00)
Col
lect
ions
on
subs
crip
tions
of
com
mon
sto
ck–
112,
800
–11
2,80
0–
––
–11
2,80
0–
112,
800
Bal
ance
at D
ecem
ber 3
1, 2
009
P36
1,93
9,60
0P
2,39
5,43
2,06
8P
(5,7
50,4
00)
P2,
751,
621,
268
P20
,979
,000
P90
5,51
5,47
5P
1,34
1,81
2,81
9(P
64,4
48,5
66)
P4,
955,
479,
996
P19
2,28
6P
4,95
5,67
2,28
2
See
acc
omp
anyi
ng N
otes
to
Fina
ncia
l Sta
tem
ents
.
12
Con
solid
ated
Equ
ity A
ttrib
utab
le to
Equ
ity H
olde
rs o
f the
Par
ent C
ompa
ny
Pre
ferr
edS
tock
(Not
e 19
)
Com
mon
Sto
ck(N
ote
19)
Trea
sury
Sto
ck(N
ote
19)
Tota
lC
apita
l Sto
ck
Add
ition
alP
aid-
inC
apita
l(N
ote
19)
Sur
plus
Res
erve
s(N
otes
23
and
25)
Sur
plus
(Not
es 1
9, 2
3,
25 a
nd 2
8)
Net
A
ccum
ulat
edU
nrea
lized
Gai
ns (L
oss)
on
Ava
ilabl
e-fo
r-S
ale(
AFS
) Fi
nanc
ial
Ass
ets
(Not
e 6)
Tota
lM
inor
ityIn
tere
stTo
tal
Equ
ity
Bal
ance
at J
anua
ry 1
, 200
8P
361,
764,
600
P2,
393,
825,
225
(P5,
036,
900)
P2,
750,
552,
925
P20
,979
,000
P73
6,82
6,68
0P
879,
614,
417
P44
,627
,560
P4,
432,
600,
582
P18
8,11
0P
4,43
2,78
8,69
2
Tota
l com
preh
ensi
ve in
com
e–
––
––
–40
6,35
8,30
7(1
07,8
39,9
47)
298,
518,
360
2,84
829
8,52
1,20
8
Tran
sfer
to c
apita
l sto
ck fr
om s
urpl
us
repr
esen
ting
shar
es o
f pre
viou
sly
unlo
cate
d st
ockh
olde
rs10
2,50
093
6,99
4(1
00,8
00)
938,
694
––
(1,1
98,4
00)
–(2
59,7
06)
–(2
59,7
06)
Tran
sfer
to s
urpl
us r
eser
ve
83,3
91,5
23(8
3,39
1,52
3)–
––
–
Dis
trib
utio
n to
the
Boa
rd o
f Tru
stee
s of
th
e V
eter
ans
of W
orld
War
II(5
9,24
0,28
5)–
(59,
240,
285)
–(5
9,24
0,28
5)
Acq
uisi
tion
durin
g th
e ye
ar o
f tr
easu
ry s
tock
––
(303
,900
)(3
03,9
00)
––
––
(303
,900
)–
(303
,900
)
Col
lect
ions
on
subs
crip
tions
of
com
mon
sto
ck–
22,0
49–
22,0
49–
––
–22
,049
–22
,049
Bal
ance
at
Dec
emb
er 3
1, 2
008
P36
1,86
7,10
0P
2,39
4,78
4,26
8(P
5,44
1,60
0)P
2,75
1,20
9,76
8P
20,9
79,0
00P
820,
218,
203
P1,
142,
142,
516
(P63
,212
,387
)P
4,67
1,33
7,10
0P
190,
958
P4,
671,
528,
058
See
acc
omp
anyi
ng N
otes
to
Fina
ncia
l Sta
tem
ents
.
Phi
lipp
ine
Vete
rans
Ban
k A
nd S
ubsi
dia
ries
Sta
tem
ents
of C
hang
es in
Equ
ity
13
Par
ent
Co
mp
any
Pre
ferr
edS
tock
(Not
e 19
)
Co
mm
on
Sto
ck(N
ote
19)
Tre
asur
yS
tock
(Not
e 19
)T
ota
lC
apit
al S
tock
Ad
dit
iona
lP
aid
-in
Cap
ital
(Not
e 19
)
Sur
plu
sR
eser
ves
(Not
es 2
3 an
d 25
)
Sur
plu
s(N
otes
19,
23,
25
and
28)
Net
A
ccum
ulat
edU
nrea
lized
Gai
ns (L
oss
) on
Ava
ilab
le-f
or-
Sal
e Fi
nanc
ial
Ass
ets
(Not
e 6)
To
tal
Bal
ance
at J
anua
ry 1
, 200
9P
361,
867,
100
P2,
394,
784,
268
(P5,
441,
600)
P2,
751,
209,
768
P20
,979
,000
P82
0,21
8,20
3P
1,14
5,17
7,77
7(P
63,2
12,3
87)
P4,
674,
372,
361
Tota
l com
preh
ensi
ve in
com
e–
––
––
–41
8,41
2,66
1(1
,236
,179
)41
7,17
6,48
2
Tran
sfer
to c
apita
l sto
ck fr
om s
urpl
us
repr
esen
ting
shar
es o
f pre
viou
sly
unlo
cate
d st
ockh
olde
rs72
,500
535,
000
14,8
0062
2,30
0–
–(6
14,9
00)
–7,
400
Tran
sfer
to s
urpl
us r
eser
ve
––
––
–85
,297
,272
(85,
297,
272)
––
Dis
trib
utio
n to
the
Boa
rd o
f Tru
stee
s of
the
Vet
eran
s of
Wor
ld W
ar II
––
––
––
(60,
635,
667)
–(6
0,63
5,66
7)
Div
iden
ds d
ecla
red
––
––
––
(78,
338,
776)
–(7
8,33
8,77
6)
Acq
uisi
tion
durin
g th
e ye
ar o
f tre
asur
y st
ock
––
(323
,600
)(3
23,6
00)
––
––
(323
,600
)
Col
lect
ions
on
subs
crip
tions
of c
omm
on s
tock
–11
2,80
0–
112,
800
––
––
112,
800
Bal
ance
at
Dec
emb
er 3
1, 2
009
P36
1,93
9,60
0P
2,39
5,43
2,06
8(P
5,75
0,40
0)P
2,75
1,62
1,26
8P
20,9
79,0
00P
905,
515,
475
P1,
338,
703,
823
(P64
,448
,566
)P
4,95
2,37
1,00
0
See
acc
omp
anyi
ng N
otes
to
Fina
ncia
l Sta
tem
ents
.
Phi
lipp
ine
Vete
rans
Ban
k A
nd S
ubsi
dia
ries
Sta
tem
ents
of C
hang
es in
Equ
ity
14
Par
ent C
ompa
ny
Pre
ferr
edS
tock
(Not
e 19
)
Com
mon
Sto
ck(N
ote
19)
Trea
sury
Sto
ck(N
ote
19)
Tota
lC
apita
l Sto
ck
Add
ition
alP
aid-
inC
apita
l(N
ote
19)
Sur
plus
Res
erve
s(N
otes
23
and
25)
Sur
plus
(Not
es 1
9, 2
3,
25 a
nd 2
8)
Net
Acc
umul
ated
Unr
ealiz
edG
ains
(Los
s) o
nA
vaila
ble-
for-
Sal
e Fi
nanc
ial
Ass
ets
(Not
e 6)
Tota
l
Bal
ance
at J
anua
ry 1
, 200
8P
361,
764,
600
P2,
393,
825,
225
(P5,
036,
900)
P2,
750,
552,
925
P20
,979
,000
P73
6,82
6,68
0P
883,
234,
064
P44
,627
,560
P4,
436,
220,
229
Tota
l com
preh
ensi
ve in
com
e–
––
––
–40
5,77
3,92
1(1
07,8
39,9
47)
297,
933,
974
Tran
sfer
to c
apita
l sto
ck fr
om s
urpl
us
repr
esen
ting
shar
es o
f pre
viou
sly
unlo
cate
d st
ockh
olde
rs10
2,50
093
6,99
4(1
00,8
00)
938,
694
––
(1,1
98,4
00)
–(2
59,7
06)
Tran
sfer
to s
urpl
us r
eser
ve
––
––
–83
,391
,523
(83,
391,
523)
––
Dis
trib
utio
n to
the
Boa
rd o
f Tru
stee
s of
the
Vet
eran
s of
Wor
ld W
ar II
––
––
––
(59,
240,
285)
–(5
9,24
0,28
5)
Acq
uisi
tion
durin
g th
e ye
ar o
f tre
asur
y st
ock
––
(303
,900
)(3
03,9
00)
––
––
(303
,900
)
Col
lect
ions
on
subs
crip
tions
of c
omm
on s
tock
–22
,049
–22
,049
––
––
22,0
49
Bal
ance
at
Dec
emb
er 3
1, 2
008
P36
1,86
7,10
0P
2,39
4,78
4,26
8(P
5,44
1,60
0)P
2,75
1,20
9,76
8P
20,9
79,0
00P
820,
218,
203
P1,
145,
177,
777
(P63
,212
,387
)P
4,67
4,37
2,36
1
See
acc
omp
anyi
ng N
otes
to
Fina
ncia
l Sta
tem
ents
.
Phi
lipp
ine
Vete
rans
Ban
k A
nd S
ubsi
dia
ries
Sta
tem
ents
of C
hang
es in
Equ
ity
15
Consolidated Parent Company
Years Ended December 31
2009 2008 2009 2008
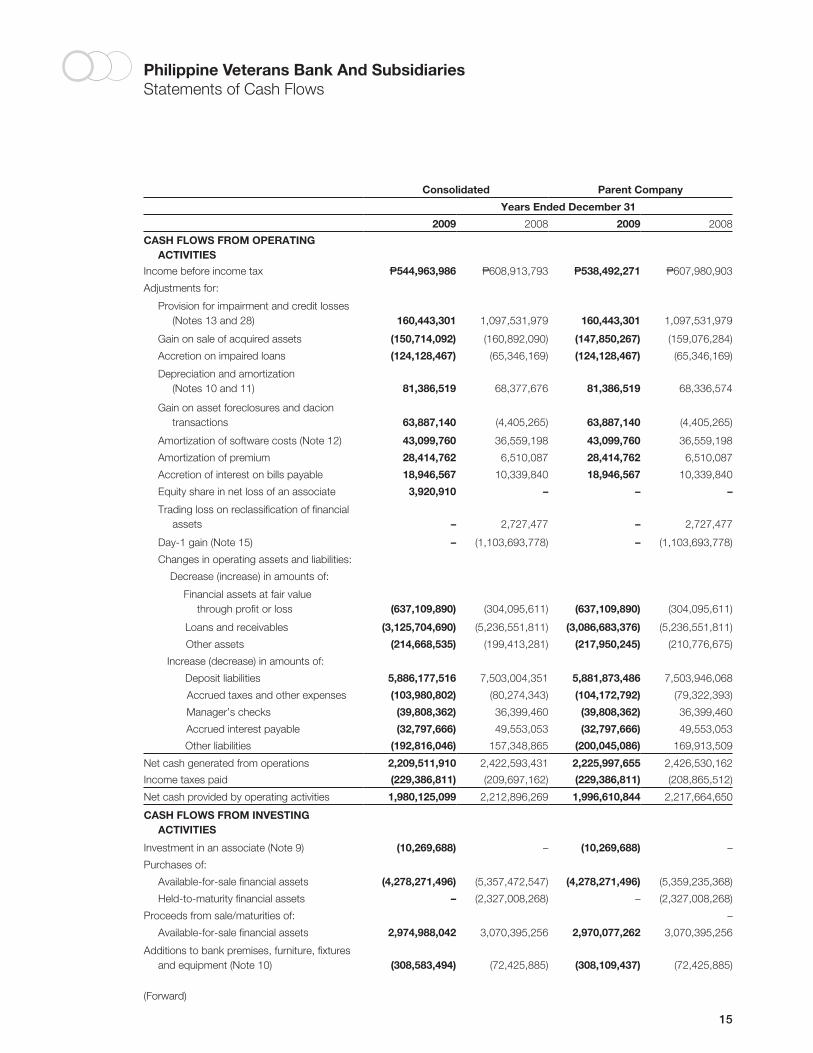
CASH FLOWS FROM OPERATING ACTIVITIES
Income before income tax P544,963,986 P608,913,793 P538,492,271 P607,980,903
Adjustments for:
Provision for impairment and credit losses (Notes 13 and 28) 160,443,301 1,097,531,979 160,443,301 1,097,531,979
Gain on sale of acquired assets (150,714,092) (160,892,090) (147,850,267) (159,076,284)
Accretion on impaired loans (124,128,467) (65,346,169) (124,128,467) (65,346,169)
Depreciation and amortization (Notes 10 and 11) 81,386,519 68,377,676 81,386,519 68,336,574
Gain on asset foreclosures and dacion transactions 63,887,140 (4,405,265) 63,887,140 (4,405,265)
Amortization of software costs (Note 12) 43,099,760 36,559,198 43,099,760 36,559,198
Amortization of premium 28,414,762 6,510,087 28,414,762 6,510,087
Accretion of interest on bills payable 18,946,567 10,339,840 18,946,567 10,339,840
Equity share in net loss of an associate 3,920,910 – – –
Trading loss on reclassification of financial assets – 2,727,477 – 2,727,477
Day-1 gain (Note 15) – (1,103,693,778) – (1,103,693,778)
Changes in operating assets and liabilities:
Decrease (increase) in amounts of:
Financial assets at fair value through profit or loss (637,109,890) (304,095,611) (637,109,890) (304,095,611)
Loans and receivables (3,125,704,690) (5,236,551,811) (3,086,683,376) (5,236,551,811)
Other assets (214,668,535) (199,413,281) (217,950,245) (210,776,675)
Increase (decrease) in amounts of:
Deposit liabilities 5,886,177,516 7,503,004,351 5,881,873,486 7,503,946,068
Accrued taxes and other expenses (103,980,802) (80,274,343) (104,172,792) (79,322,393)
Manager’s checks (39,808,362) 36,399,460 (39,808,362) 36,399,460
Accrued interest payable (32,797,666) 49,553,053 (32,797,666) 49,553,053
Other liabilities (192,816,046) 157,348,865 (200,045,086) 169,913,509
Net cash generated from operations 2,209,511,910 2,422,593,431 2,225,997,655 2,426,530,162
Income taxes paid (229,386,811) (209,697,162) (229,386,811) (208,865,512)
Net cash provided by operating activities 1,980,125,099 2,212,896,269 1,996,610,844 2,217,664,650
CASH FLOWS FROM INVESTING ACTIVITIES
Investment in an associate (Note 9) (10,269,688) – (10,269,688) –
Purchases of:
Available-for-sale financial assets (4,278,271,496) (5,357,472,547) (4,278,271,496) (5,359,235,368)
Held-to-maturity financial assets – (2,327,008,268) – (2,327,008,268)
Proceeds from sale/maturities of: –
Available-for-sale financial assets 2,974,988,042 3,070,395,256 2,970,077,262 3,070,395,256
Additions to bank premises, furniture, fixtures and equipment (Note 10) (308,583,494) (72,425,885) (308,109,437) (72,425,885)
Philippine Veterans Bank And SubsidiariesStatements of Cash Flows
(Forward)
16
Consolidated Parent Company
Years Ended December 31
2009 2008 2009 2008
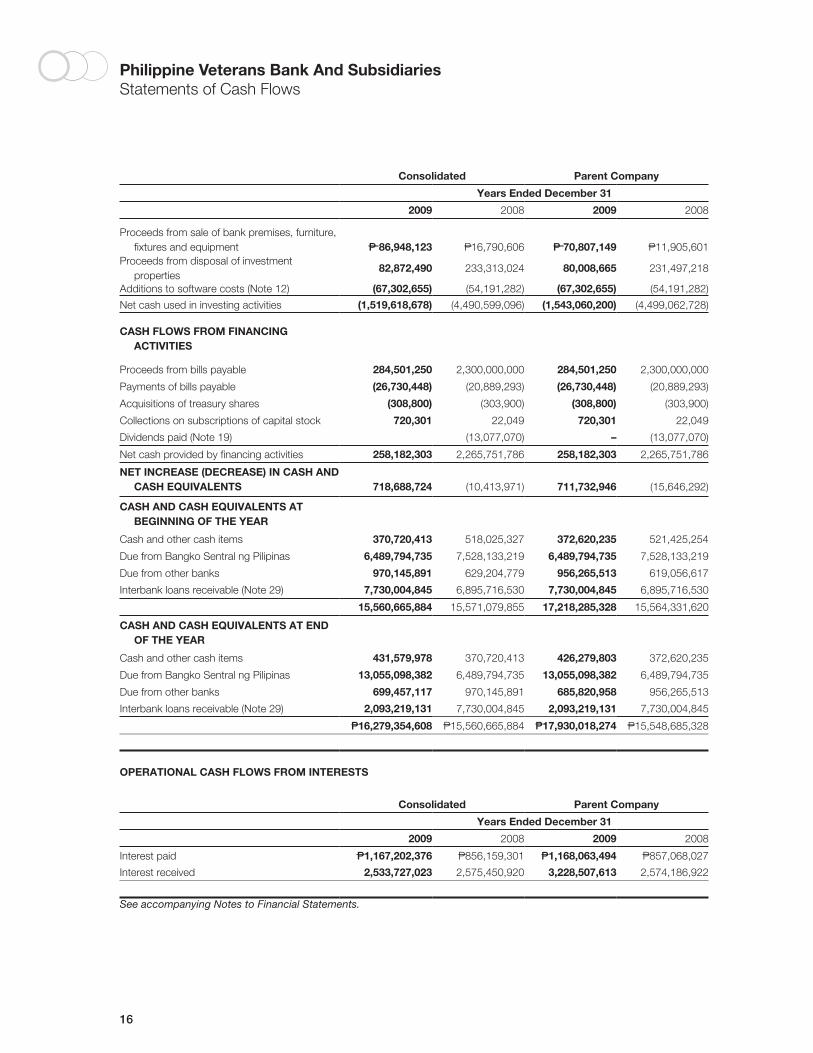
Proceeds from sale of bank premises, furniture, fixtures and equipment P 86,948,123 P16,790,606 P 70,807,149 P11,905,601
Proceeds from disposal of investment properties
82,872,490 233,313,024 80,008,665 231,497,218
Additions to software costs (Note 12) (67,302,655) (54,191,282) (67,302,655) (54,191,282)
Net cash used in investing activities (1,519,618,678) (4,490,599,096) (1,543,060,200) (4,499,062,728)
CASH FLOWS FROM FINANCING ACTIVITIES
Proceeds from bills payable 284,501,250 2,300,000,000 284,501,250 2,300,000,000
Payments of bills payable (26,730,448) (20,889,293) (26,730,448) (20,889,293)
Acquisitions of treasury shares (308,800) (303,900) (308,800) (303,900)
Collections on subscriptions of capital stock 720,301 22,049 720,301 22,049
Dividends paid (Note 19) (13,077,070) – (13,077,070)
Net cash provided by financing activities 258,182,303 2,265,751,786 258,182,303 2,265,751,786
NET INCREASE (DECREASE) IN CASH AND CASH EQUIVALENTS 718,688,724 (10,413,971) 711,732,946 (15,646,292)
CASH AND CASH EQUIVALENTS AT BEGINNING OF THE YEAR
Cash and other cash items 370,720,413 518,025,327 372,620,235 521,425,254
Due from Bangko Sentral ng Pilipinas 6,489,794,735 7,528,133,219 6,489,794,735 7,528,133,219
Due from other banks 970,145,891 629,204,779 956,265,513 619,056,617
Interbank loans receivable (Note 29) 7,730,004,845 6,895,716,530 7,730,004,845 6,895,716,530
15,560,665,884 15,571,079,855 17,218,285,328 15,564,331,620
CASH AND CASH EQUIVALENTS AT END OF THE YEAR
Cash and other cash items 431,579,978 370,720,413 426,279,803 372,620,235
Due from Bangko Sentral ng Pilipinas 13,055,098,382 6,489,794,735 13,055,098,382 6,489,794,735
Due from other banks 699,457,117 970,145,891 685,820,958 956,265,513
Interbank loans receivable (Note 29) 2,093,219,131 7,730,004,845 2,093,219,131 7,730,004,845
P16,279,354,608 P15,560,665,884 P17,930,018,274 P15,548,685,328
OPERATIONAL CASH FLOWS FROM INTERESTS
Consolidated Parent Company
Years Ended December 31
2009 2008 2009 2008
Interest paid P1,167,202,376 P856,159,301 P1,168,063,494 P857,068,027
Interest received 2,533,727,023 2,575,450,920 3,228,507,613 2,574,186,922
See accompanying Notes to Financial Statements.
Philippine Veterans Bank And SubsidiariesStatements of Cash Flows
17
1. Corporate Information
Philippine Veterans Bank (the Parent Company) operates as a domestic commercial bank and provides services such as deposit-taking, loans and trade finance, domestic and foreign fund transfers, treasury, foreign exchange and trust services. The subsidiaries are engaged primarily in real estate and insurance business. Principal place of business is of the Parent Company at 101 V.A. Rufino corner Dela Rosa Streets, Legaspi Village, Makati City.
On June 18, 1963, the Philippine Veterans Bank was created with the enactment of Republic Act No. 3518, which became its charter.
On October 30, 2003, the Board of Directors (BOD) approved the merger of Monarch Properties, Inc. (MPI), a wholly owned subsidiary, with the Parent Company. The merger was subsequently approved by the Parent Company’s stockholders on May 30, 2005. As of December 31, 2009, the approval of the merger is still pending with the SEC and BSP.
2. Summary of Significant Accounting Policies
Basis of PreparationThe accompanying financial statements have been prepared on a historical basis except for financial assets at fair value through profit or loss (FVPL) and available-for-sale (AFS) financial assets that are measured at fair value.
The accompanying financial statements of the Parent Company include the accounts maintained in the Regular Banking Unit (RBU) and Foreign Currency Deposit Unit (FCDU).
For financial reporting purposes, FCDU accounts and foreign currency denominated accounts in the RBU are translated into their equivalents in Philippine Peso (see accounting policy on Foreign currency translation). The financial statements of these units are combined after eliminating inter-unit accounts.
The consolidated financial statements are presented in Philippine Peso (P) which is also the Parent Company’s functional currency.
Statement of ComplianceThe Group and the Parent Company prepared its financial statements in accordance with Philippine Financial Reporting Standards (PFRS), except for the recognition in 2008 of the allowance for credit losses on interbank call loans (IBCL) to a thrift bank required in 2007 and 2006, and the staggered recognition of the remaining required allowance for credit losses on IBCL and the required allowance for credit losses on accounts receivable over 20 years approved by BSP as discussed in Note 28 and the deferral of loss on sale of non-performing assets to a Special Purpose Vehicle as discussed in Note 7.
Basis of ConsolidationThe financial statements which include the financial statements of the Parent Company and its subsidiaries (collectively referred to as “the Group”) are prepared for the same reporting year as the Parent Company, using consistent accounting policies.
The Parent Company has the following wholly and majority owned subsidiaries:
SubsidiaryCountry ofIncorporation
Principal ActivitiesEffectivePercentageof Ownership
Vetgroup Intervest Projects, Inc. Philippines Real estate 100.00Monarch Properties, Inc. Philippines Real estate 100.00Veterans Venture Capital Corporation Philippines Financing 60.00
All significant intra-group balances, transactions, income and expenses and profits and losses resulting from intra-group transactions are eliminated in full in the consolidation.
Subsidiaries are fully consolidated from the date on which control is transferred to the Group. Control is achieved where the Group has the power to govern the financial and operating policies of an entity so as to obtain benefits from its activities. Consolidation of subsidiaries ceases when control is transferred out of the Group or Parent Company.
Philippine Veterans Bank And SubsidiariesNotes to Financial Statements

18
The results of subsidiaries acquired or disposed of during the year are included in the consolidated statement of income from the date of acquisition or up to the date of disposal, as appropriate.
Minority InterestMinority interest represents the portion of profit or loss and the net assets not held by the Group and is presented separately in the consolidated statement of income and within equity in the consolidated statement of financial position, separately from Parent Company’s equity. Acquisitions of minority interest are accounted for using the entity concept method, whereby the difference between the consideration and the book value of the share of the net assets acquired is recognized as an equity transaction. Minority interest represents the equity interest in Veterans Venture Capital Corporation, a 60% owned subsidiary.
Changes in Accounting PolicesThe accounting policies are consistent with the previous year except for the adoption of the following amendments to PFRS and Philippine Interpretations starting January 1, 2009:
New Standards and Interpretations• PAS1,Presentation of Financial Statements effective January 1, 2009• PAS23,Borrowing Cost (Revised) effective January 1, 2009• PFRS8,Operating Segments effective January 1, 2009• PhilippineInterpretationIFRIC13,Customer Loyalty Programmes effective July 1, 2008• PhilippineInterpretationIFRIC16,Hedges of a Net Investment in a Foreign Operations effective October 1, 2008• PhilippineInterpretationIFRIC18,Transfer of Assets from Customers effective July 1, 2009
Amendments to Standards• PAS1andPAS32Amendments,Puttable Financial Instruments and Obligations Arising on Liquidation effective January 1, 2009• PFRS1andPAS27Amendments,Cost of an Investment in a Subsidiary, Joint Controlled Entity or Associate effective January 1, 2009• PFRS2Amendment,Vesting Conditions and Cancellations effective January 1, 2009• PFRS7Amendment,Improving Disclosures about Financial Instruments effective January 1, 2009• PhilippineInterpretationIFRIC9andPAS39Amendments,Embedded Derivatives effective June 30, 2009• ImprovementstoPFRSs(2008)• ImprovementstoPFRSs(2009),withrespecttotheamendmenttotheAppendixtoPAS18,Revenue
New and amended standards that have been adopted and that have impact on the financial statements and disclosures of the Group are described below:
Philippine Accounting Standards (PAS) 1, Presentation of Financial StatementsThe revised standard separates owner and non-owner changes in equity. The statement of changes in equity includes only details of transactions with owners, with non-owner changes in equity presented in a reconciliation of each component of equity. In addition, the standard introduces the statement of comprehensive income: it presents all items of recognized income and expense, either in one single statement, or in two linked statements. The Group has elected to present two linked statements.
Amendments to StandardsPFRS 7 Amendments - Improving Disclosures about Financial InstrumentsThe amendments to PFRS 7, Financial Instruments: Disclosures, require additional disclosures about fair value measurement and liquidity risk. Fair value measurements related to items recorded at fair value are to be disclosed by source of inputs using a three level fair value hierarchy, by class, for all financial instruments recognized at fair value. In addition, a reconciliation between the beginning and ending balance for level 3 fair value measurements is now required, as well as significant transfers between levels in the fair value hierarchy. The amendments also clarify the requirements for liquidity risk disclosures with respect to derivative transactions and financial assets used for liquidity management. The fair value measurement disclosures are presented in Note 5. The liquidity risk disclosures are not significantly impacted by the amendments and are presented in Note 4.
Philippine Veterans Bank And SubsidiariesNotes to Financial Statements
Veterans Bank 2009 Annual Report
19
Improvements to PFRS 2008The omnibus amendments to PFRSs issued in 2008 were issued primarily with a view to remove inconsistencies and clarify wordings. There are separate transitional provisions for each standard. The adoption of the amendments resulted in changes in accounting policies but did not have any impact on the financial position or performance of the Group.
Significant Accounting Policies
Foreign Currency TranslationTransactions and balancesThe books of accounts of the RBU are maintained in Philippine pesos, while those of the FCDU are maintained in USD. For financial reporting purposes, foreign currency-denominated monetary assets and liabilities of the RBU are translated in Philippine peso based on the Philippine Dealing and Exchange Corporation (PDEx) closing rate prevailing at end of the year. Transactions denominated in foreign currencies are recorded using the exchange rates prevailing at the transaction dates. Foreign exchange differences are recognized in the statement of income.
Non-monetary items that are measured in terms of historical cost in a foreign currency are translated using the exchange rates as at the dates of the initial transactions. Non-monetary items measured at fair value in a foreign currency are translated using the exchange rates at the date when the fair value was determined.
FCDUAs at the reporting date, the assets and liabilities of FCDU are translated into the Parent Company’s presentation currency (the Philippine peso) at PDEx closing rate prevailing at the statement of financial position date, and their income and expenses are translated at PDEx weighted average rates for the period. Exchange differences arising on translation are taken to statement of comprehensive income.
Financial Instruments - Initial Recognition and Subsequent MeasurementDate of recognitionPurchases or sales of financial assets that require delivery of assets within the time frame established by regulation or convention in the marketplace are recognized on the settlement date - the date that an asset is delivered to or by the Group. Securities transactions are also recognized on settlement date basis. Deposits, amounts due to banks and customers and loans are recognized when cash is received by the Group or advanced to the borrowers.
Initial recognition of financial instrumentsAll financial assets and financial liabilities are initially recognized at fair value. Except for financial assets and financial liabilities at FVPL, the initial measurement of financial assets and financial liabilities includes transaction costs. The Group classifies its financial assets in the following categories: financial assets at FVPL, HTM financial assets, AFS financial assets, and loans and receivables. The financial liabilities, on the other hand, are classified into (a) financial liabilities at FVPL and (b) other financial liabilities. The classification depends on the purpose for which the financial assets were acquired and whether they are quoted in an active market and for HTM financial assets, the ability and intention to hold the investment until maturity. Management determines the classification of its investments at initial recognition and, where allowed and appropriate, re-evaluates such designation at every reporting date.
Reclassification of financial assetsA financial asset is reclassified out of the FVPL category when the following conditions are met:
• thefinancialassetisnolongerheldforthepurposeofsellingorrepurchasingitinthenearterm;and• thereisararecircumstance.
A financial asset that is reclassified out of the FVPL category is reclassified at its fair value on the date of reclassification. Any gain or loss already recognized in the statement of is not reversed. The fair value of the financial asset on the date of reclassification becomes its new cost or amortized cost, as applicable.
For financial assets reclassified out of the AFS category to held-to-maturity investments, any previous gain or loss on that asset that has been recognized under other comprehensive income in the statement of comprehensive income is amortized to profit or loss over the remaining life of the investment using the effective interest rate (EIR) method. Any
20
Philippine Veterans Bank And SubsidiariesNotes to Financial Statements
difference between the new amortize cost and the expected cash flows is also amortized over the remaining life of asset using EIR method. If the asset is subsequently determined to be impaired then the amount recorded under other comprehensive income is recycled to the statement of income.
Determination of fair valueThe fair value for financial instruments traded in active markets at the statement of financial position date is based on their quoted market price or dealer price quotations (bid price for long positions and ask price for short positions), without any deduction for transaction costs. When current bid and asking prices are not available, the price of the most recent transaction provides evidence of the current fair value as long as there has not been a significant change in economic circumstances since the time of the transaction.
For all other financial instruments not listed in an active market, the fair value is determined by using appropriate valuation techniques. Valuation techniques include net present value techniques, comparison to similar instruments for which market observable prices exist, options pricing models, and other relevant valuation models.
‘Day 1’ differenceWhere the transaction price in a non-active market is different from the fair value based on other observable current market transactions in the same instrument or based on a valuation technique whose variables include only data from observable market, the Group recognizes the difference between the transaction price and fair value (‘Day 1’ difference) in the statement of income unless it qualifies for recognition as some other type of assets. In cases where use is made of data which is not observable, the difference between the transaction price and model value is only recognized in the statement of income when the inputs become observable or when the instrument is derecognized. For each transaction, the Group determines the appropriate method of recognizing the ‘Day 1’ difference amount.
Financial assets or financial liabilities held for tradingFinancial assets or financial liabilities held for trading are recorded in the statement of financial position at fair value. Changes in fair value relating to the held-for-trading positions are recognized in ‘Trading gains (losses) - net’. Interest earned or incurred is recorded in ‘Interest income or expense’, respectively, while dividend income is recorded in ‘Other operating Income’ when the right to receive payment has been established.
Included in this classification are debt and equity securities which have been acquired principally for the purpose of selling or repurchasing in the near term. As of December 31, 2009 and 2008, the Group does not have financial liabilities held for trading.
Financial assets or financial liabilities designated at FVPLFinancial assets or financial liabilities classified in this category are designated by management on initial recognition when the following criteria are met:
• Thedesignationeliminatesorsignificantlyreducestheinconsistenttreatmentthatwouldotherwisearisefrom measuring the assets or liabilities or recognizing gains or losses on them on a different basis; or• Theassetsandliabilitiesarepartofagroupoffinancialassets,financialliabilitiesorbothwhicharemanagedand their performance evaluated on a fair value basis, in accordance with a documented risk management or investment strategy; or• Thefinancialinstrumentcontainsanembeddedderivative,unlesstheembeddedderivativedoesnotsignificantly modify the cash flows or it is clear, with little or no analysis, that it would not be separately recorded.
Designated financial assets and financial liabilities at FVPL are recorded in the statement of financial position at fair value. Changes in fair value are recorded in ‘Trading gains(losses) - net’ on financial assets and liabilities designated at FVPL. Interest earned or incurred is recorded in interest income or expense, respectively, while dividend income is recorded in ‘Other operating income’ according to the terms of the contract, or when the right of the payment has been established. As of December 31, 2009 and 2008, the Group has no existing financial assets or financial liabilities designated at FVPL.
HTM financial assetsHTM financial assets are quoted, non-derivative financial assets with fixed or determinable payments and fixed maturities for which the Group’s management has the positive intention and ability to hold to maturity. Where the Group would sell other than an insignificant amount of HTM financial assets, the entire category would be tainted and reclassified as AFS financial assets. After initial measurement, these investments are subsequently measured at amortized cost using the
Veterans Bank 2009 Annual Report
21
effective interest rate (EIR) method, less any impairment in value. Amortized cost is calculated by taking into account any discount or premium on acquisition and fees that are an integral part of the EIR. The amortization is included in ‘Interest income’ in the statement of income. Gains and losses are recognized in the statement of income when the HTM financial assets are derecognized and impaired, as well as through the amortization process. The losses arising from impairment of such investments are recognized in the statement of income under ‘Provision for impairment and credit losses.’
The effects of restatement on foreign currency denominated HTM financial assets are recognized in the statement of income.
Loans and receivables, amounts due from BSP and other banks, and interbank loans receivables and SPURAThis accounting policy relates to the statement of financial position captions ‘Due from BSP’, ‘Due from other banks’, ‘Interbank loans receivables and SPURA’, ‘Securities purchased under resale agreement’ and ‘Loans and receivables’. These are non derivative financial assets with fixed or determinable payments and fixed maturities that are not quoted in an active market. They are not entered into with the intention of immediate or short-term resale and are not classified as ‘Financial assets held for trading’, designated as ‘AFS financial assets’ or ‘financial assets designated at FVPL.’
After initial measurement, ‘Loans and receivables’, ‘Due from BSP’, ‘Due from other banks’ and ‘Interbank loans receivables’ and ‘SPURA’ are subsequently measured at amortized cost using the EIR method, less allowance for impairment. Amortized cost is calculated by taking into account any discount or premium on acquisition and fees and costs that are an integral part of the EIR. The amortization is included in the ‘Interest income’ in the statement of income. The losses arising from impairment are recognized in ‘Provision for impairment and credit losses’ in the statement of income.
AFS financial assetsAFS financial assets are those which are designated as such or do not qualify to be classified as designated as financial assets at FVPL, HTM financial assets or loans and receivables. They are purchased and held indefinitely, and may be sold in response to liquidity requirements or changes in market conditions. They include equity investments and other debt instruments.
After initial measurement, AFS financial assets are subsequently measured at fair value. The effective yield component of AFS debt securities, as well as the impact of restatement on foreign currency-denominated AFS debt securities, is reported in statement of income. The unrealized gains and losses arising from the fair valuation of AFS financial assets are excluded, net of tax, from reported income and are reported as ‘Net unrealized gains (losses) on AFS financial assets’ under other comprehensive income in the statement of comprehensive income.
When the security is disposed of, the cumulative gain (losses) or loss previously recognized in equity is recognized as ‘Trading gains (losses) - net’ in the statement of income. Where the Group holds more than one investment in the same security, these are deemed to be disposed of on a specific identification. Interests earned on holding AFS financial assets are reported as interest income using the EIR. Dividends earned on holding AFS financial assets are recognized in the statement of income as ‘Other operating income’ when the right to receive payment has been established. The losses arising from impairment of such investments are recognized as ‘Provisions for impairment and credit losses’ in the statement of income.
Bills payable and other borrowed fundsIssued financial instruments or their components, which are not designated as financial liabilities at FVPL, are classified as liabilities under ‘Bills payable” or other appropriate financial liability accounts, where the substance of the contractual arrangement results in the Group having an obligation either to deliver cash or another financial asset to the holder, or to satisfy the obligation other than by the exchange of a fixed amount of cash or another financial asset for a fixed number of own equity shares. The components of issued financial instruments that contain both liability and equity elements are accounted for separately, with the equity component being assigned the residual amount after deducting from the instrument as a whole the amount separately determined as the fair value of the liability component on the date of issue.
After initial measurement, bills payable and similar financial liabilities not qualified as and not designated as FVPL, are subsequently measured at amortized cost using the EIR method. Amortized cost is calculated by taking into account any discount or premium on the issue and fees that are an integral part of the EIR.
22
Philippine Veterans Bank And SubsidiariesNotes to Financial Statements
Derecognition of Financial Assets and LiabilitiesFinancial assetsA financial asset (or, where applicable, a part of a financial asset or part of a group of financial assets) is derecognized where:
• therightstoreceivecashflowsfromtheassethaveexpired;or• theGroupretainstherighttoreceivecashflowsfromtheasset,buthasassumedanobligationtopaytheminfull without material delay to a third party under a “pass-through” arrangement; or• theGrouphastransferreditsrightstoreceivecashflowsfromtheassetandeither(a)hastransferredsubstantiallyall the risks and rewards of the asset, or (b) has neither transferred nor retained the risk and rewards of the asset but has transferred the control of the asset.
Where the Group has transferred its rights to receive cash flows from an asset or has entered into a pass-through arrangement, and has neither transferred nor retained substantially all the risks and rewards of the asset nor transferred control of the asset, the asset is recognized to the extent of the Group’s continuing involvement in the asset. Continuing involvement that takes the form of a guarantee over the transferred asset is measured at the lower of original carrying amount of the asset and the maximum amount of consideration that the Group could be required to repay.
Financial liabilitiesA financial liability is derecognized when the obligation under the liability is discharged or cancelled or has expired. Where an existing financial liability is replaced by another from the same lender on substantially different terms, or the terms of an existing liability are substantially modified, such an exchange or modification is treated as a derecognition of the original liability and the recognition of a new liability, and the difference in the respective carrying amounts is recognized in statement of income.
Repurchase and reverse repurchase agreementsSecurities sold under agreements to repurchase at a specified future date (‘repos’) are not derecognized from the statement of financial position. The corresponding cash received, including accrued interest, is recognized in the statement of financial position as a loan to the Group, reflecting the economic substance of such transaction.
‘Securities purchased under resale agreements’ (SPURA) are recorded as loans and advances to banks or counterparty. The difference between the purchase price and resale price is treated as interest income and is accrued over the life of the agreement using EIR.
Impairment of Financial AssetsThe Group assesses at each statement of financial position date whether there is objective evidence that a financial asset or group of financial assets is impaired. A financial asset or a group of financial assets is deemed to be impaired if, and only if, there is objective evidence of impairment as a result of one or more events that has occurred after the initial recognition of the asset (an incurred ‘loss event’) and that loss event (or events) has an impact on the estimated future cash flows of the financial asset or the group of financial assets that can be reliably estimated. Evidence of impairment may include indications that the borrower or a group of borrowers is experiencing significant financial difficulty, default or delinquency in interest or principal payments, the probability that they will enter bankruptcy or other financial reorganization and where observable data indicate that there is measurable decrease in the estimated future cash flows, such as changes in arrears or economic conditions that correlate with defaults.
Financial assets at amortized cost For financial assets at amortized cost which includes HTM financial assets, Loans and receivables, Due from BSP, Interbank loans receivables SPURA and due from other banks, the Group first assesses whether objective evidence of impairment exists individually for financial assets that are individually significant, or collectively for financial assets that are not individually significant. If there is objective evidence that an impairment loss has been incurred, the amount of the loss is measured as the difference between the asset’s carrying amount and the present value of the estimated future cash flows (excluding future credit losses that have not been incurred). If the Group determines that no objective evidence of impairment exists for individually assessed financial asset, whether significant or not, it includes the asset in a group of financial assets with similar credit risk characteristics and collectively assesses for impairment. Those characteristics are relevant to the estimation of future cash flows for groups of such assets by being indicative of the debtors’ ability to pay all amounts due according to the contractual terms of the assets being evaluated. Assets that are individually assessed for impairment and for which an impairment loss is, or continues to be, recognized are not included in a collective assessment for impairment.
Veterans Bank 2009 Annual Report
23
The carrying amount of the asset is reduced through use of an allowance account and the amount of loss is charged to the statement of income. Interest income continues to be recognized based on the original effective interest rate of the asset. Loans, together with the associated allowance accounts, are written off when there is no realistic prospect of future recovery and all collateral has been realized. If, in a subsequent year, the amount of the estimated impairment loss decreases because of an event occurring after the impairment was recognized, the previously recognized impairment loss is credited to ‘Provision for credit and impairment losses’ in the statement of income and the allowance account is reduced. If a future write-off is later recovered, any amounts formerly charged are credited to the ‘Provision for credit and impairment losses’ in the statement of income.
The estimated future cash flows are discounted at the financial asset’s original effective interest rate. If a loan has a variable interest rate, the discount rate for measuring any impairment loss is the current effective interest rate, adjusted for the original credit risk premium. The calculation of the present value of the estimated future cash flows of a collateralized financial asset reflects the cash flows that may result from foreclosure less costs for obtaining and selling the collateral, whether or not foreclosure is probable.
For the purpose of a collective evaluation of impairment, financial assets are grouped on the basis of such credit risk characteristics as industry, collateral type, past-due status and term. Future cash flows in a group of financial assets that are collectively evaluated for impairment are estimated on the basis of historical loss experience for assets with credit risk characteristics similar to those in the Parent Company. Historical loss experience is adjusted on the basis of current observable data to reflect the effects of current conditions that did not affect the period on which the historical loss experience is based and to remove the effects of conditions in the historical period that do not exist currently. Estimates of changes in future cash flows reflect, and are directionally consistent with changes in related observable data from period to period (such changes in property prices, payment status, or other factors that are indicative of incurred losses in the Bank and their magnitude). The methodology and assumptions used for estimating future cash flows are reviewed regularly by the Parent Company to reduce any differences between loss estimates and actual loss experience.
AFS Financial AssetsFor AFS financial assets, the Group assesses at each statement of financial position date whether there is objective evidence that a financial asset or group of financial assets is impaired.
In case of equity investments classified as AFS financial assets, this would include a significant or prolonged decline in the fair value of the investments below its cost. Where there is evidence of impairment, the cumulative loss measured as the difference between the acquisition cost and the current fair value, less any impairment loss on that financial asset previously recognized in the statement of income is removed from statement of comprehensive income and recognized in the statement of income. Impairment losses on equity investments are not reversed through the statement of income. Increases in fair value after impairment are recognized as other comprehensive income in the statement of comprehensive income.
In the case of debt instruments classified as AFS financial assets, impairment is assessed based on the same criteria as financial assets carried at amortized cost. Future interest income is based on the reduced amount an is accrued on the rate of interest used to discount future cash flows for the purpose of measuring impairment loss. Such accrual is recorded as part of ‘interest income’ in the statement of income. If, in subsequent year, the fair value of a debt instrument increased and the increase can be objectively related to an event occurring after the impairment loss was recognized in the statement of income, the impairment loss is reversed through the statement of income.
Restructured loansWhere possible, the Group seeks to restructure loans rather than to take possession of collateral. This may involve extending the payment arrangements and the agreement of new loan conditions. Once the terms have been renegotiated, the loan is no longer considered past due. Management continuously reviews restructured loans to ensure that all criteria are met and that future payments are likely to occur. The loans continue to be subject to an individual or collective impairment assessment, calculated using the loan’s original EIR. The difference between the recorded value of the original loan and the present value of the restructured cash flows, discounted at the original EIR, is recognized in ‘Provisions for impairment and credit losses’ in the statement of income.
Loss on sale of non-performing asset (NPA) to a special purpose vehicle (SPV) companyLoss on sale of NPA to an SPV company on a without recourse basis is deferred over a ten-year period in accordance with

24
Philippine Veterans Bank And SubsidiariesNotes to Financial Statements
regulatory accounting policies prescribed by the Bangko Sentral ng Pilipinas for banks and financial institutions availing of the provisions of RA No. 9182, the Special Purpose Vehicle Act of 2002.
Offsetting Financial InstrumentsFinancial assets and financial liabilities are offset and the net amount reported in the statement of financial position if, and only if, there is a currently enforceable legal right to offset the recognized amounts and there is an intention to settle on a net basis, or to realize the asset and settle the liability simultaneously. This is not generally the case with master netting agreements, and therefore, the related assets and liabilities are presented gross in the statement of financial position.
Revenue RecognitionRevenue is recognized to the extent that it is probable that economic benefits will flow to the Group and the revenue can be reliably measured. The following specific recognition criteria must also be met before revenue is recognized:
Interest incomeFor all financial instruments measured at amortized cost and interest bearing financial instruments classified as AFS and financial assets, interest income is recorded at the EIR, which is the rate that exactly discounts estimated future cash payments or receipts through the expected life of the financial instrument or a shorter period, where appropriate, to the net carrying amount of the financial asset or financial liability. The calculation takes into account all contractual terms of the financial instrument, includes any fees or incremental costs that are directly attributable to the instrument and are an integral part of the EIR, but not future credit losses. The adjusted carrying amount is calculated based on the original EIR. The change in carrying amount is recorded as ‘Interest income’.
Once the recorded value of a financial asset or group of similar financial assets has been reduced due to an impairment loss, interest income continues to be recognized using the original EIR applied to the new carrying amount.
Service fees and commission incomeLoan commitment fees are recognized as earned over the terms of the credit lines granted to each borrower. Loan syndication fees are recognized upon completion of all syndication activities and where the Group does not have further obligations to perform under the syndication agreement.
Service charges and penalties are recognized only upon collection or accrued where there is a reasonable degree of certainty as to their collectibility.
Rental incomeRental income arising on investment properties is accounted for on a straight-line basis over the lease terms on ongoing leases.
Dividend incomeDividend income is recognized when the Group’s right to receive payment is established.
Trading gains (losses) - netResults arising from trading activities including all gains and losses from changes in fair value for financial assets and financial liabilities held for trading and gains and losses from disposal of financial assets held for trading and AFS financial assets.
Other incomeIncome from sale of services is recognized upon rendition of the service. Income from sale of properties is recognized upon completion of the earning process and the collectibility of the sales price is reasonably assured.
Cash and Cash EquivalentsFor purposes of reporting cash flows, cash and cash equivalents include cash and other cash items, amounts due from BSP and other banks, and interbank loans receivable with original maturities of three months or less from dates of placements and that are subject to insignificant risk of changes in value.
Investments in Subsidiaries and AssociateInvestment in subsidiariesSubsidiaries are all entities over which the Group has the power to govern the financial and operating policies, which generally accompanies a shareholding of more than one half of the voting rights. The existence and effect of potential
Veterans Bank 2009 Annual Report
25
voting rights that are currently exercisable or convertible are considered when assessing whether the Group controls another entity.
Investments in subsidiaries are carried at cost, less impairment in value, in the separate or parent company financial statements (see accounting policy on Basis of Consolidation).
Investment in an AssociateAssociates are entities which the Group has significant influence but not control, generally accompanying a shareholding of between 20% and 50% of the voting rights. In the consolidated financial statements, investment in associates is accounted for under the equity method of accounting. Under the equity method, the investment in the associate is carried in the statement of financial position at cost plus post acquisition changes in the Group’s share of net assets of the associate. The consolidated statement of income reflects the share of the results of operations of the associate.
The investment in an associate is in the Parent Company’s financial statement is carried at cost less accumulated impairment, if any.
Bank Premises, Furniture, Fixtures and EquipmentLand is stated at cost less any impairment in value and depreciable properties including buildings, leasehold improvements, and furniture, fixtures and equipment are stated at cost less accumulated depreciation and amortization, and any impairment in value. Such cost includes the cost of replacing part of the plant and equipment when that cost is incurred, if the recognition criteria are met but excludes repairs and maintenance costs.
Depreciation is calculated on the straight-line method over the estimated useful life of the depreciable assets.
The estimated useful lives of the property and equipment follow:
Buildings 20 yearsFurniture, fixtures and equipment 5 yearsLeasehold improvements 5 years or lease term, whichever is shorter
The depreciation and amortization method and useful life are reviewed at least at each reporting date to ensure that the method and period of depreciation and amortization are consistent with the expected pattern of economic benefits from items of property and equipment.
An item of property and equipment is derecognized upon disposal or when no future economic benefits are expected from its use or disposal. Any gain or loss arising on derecognition of the asset (calculated as the difference between the net disposal proceeds and the carrying amount of the asset) is included in the statement of income in the year the asset is derecognized.
Investment PropertiesInvestment properties are measured initially at cost, including transaction costs. An investment property acquired through an exchange transaction is measured at fair value of the asset acquired unless the fair value of such an asset cannot be measured in which case the investment property acquired is measured at the carrying amount of asset given up. Foreclosed properties are classified under ‘Investment properties’ upon; (a) entry of judgment in case of juridical foreclosure; (b) execution of the Sheriff’s Certificate of sale in case of extra-judicial foreclosure; or (c) notarization of the Deed of Dacion in case of dation in payment (dacion en pago).
Subsequent to initial recognition, depreciable investment properties are carried at cost less accumulated depreciation and any impairment in value.
Investment properties are derecognized when they have either been disposed of or when the investment property is permanently withdrawn from use and no future benefit is expected from its disposal. Any gains or losses on the retirement or disposal of an investment property are recognized in the statement of income in ‘Gain (Loss) on sale of acquired assets’ in the year of retirement or disposal.
Expenditures incurred after the investment properties have been put into operations, such as repairs and maintenance costs, are normally charged against current operations in the period in which the costs are incurred.
26
Philippine Veterans Bank And SubsidiariesNotes to Financial Statements
Depreciation is calculated for buildings and improvement on a straight-line basis over the estimated useful life of 10 years from the time of acquisition.
Transfers are made to investment properties when, and only when, there is a change in use evidenced by ending of owner occupation, commencement of an operating lease to another party or ending of construction or development. Transfers are made from investment properties when, and only when, there is a change in use evidenced by commencement of owner occupation or commencement of development with a view to sale.
Computer Software CostsSoftware costs are capitalized on the basis of the cost incurred to acquire and bring to use the specific software. These costs, included in ‘Other assets’, are amortized over five years on a straight-line basis.
Costs associated with maintaining the computer software programs are recognized as expense when incurred.
Impairment of Bank Premises, Furniture, Fixtures and Equipment, Investment Properties and Computer Software CostsAt each reporting date, the Group assesses whether there is any indication that its nonfinancial assets may be impaired. When an indicator of impairment exists or when an annual impairment testing for an asset is required, the Group makes a formal estimate of recoverable amount. Recoverable amount is the higher of an asset’s (or cash-generating unit’s) fair value less costs to sell and its value in use and is determined for an individual asset, unless the asset does not generate cash inflows that are largely independent of those from other assets or groups of assets, in which case the recoverable amount is assessed as part of the cash generating unit to which it belongs. Where the carrying amount of an asset (or cash generating unit) exceeds its recoverable amount, the asset (or cash generating unit) is considered impaired and is written down to its recoverable amount. In assessing value in use, the estimated future cash flows are discounted to their present value using a pre-tax discount rate that reflects current market assessments of the time value of money and the risks specific to the asset (or cash generating unit).
An impairment loss is charged against operations in the year in which it arises.
An assessment is made at each reporting date as to whether there is any indication that previously recognized impairment losses may no longer exist or may have decreased. If such indication exists, the recoverable amount is estimated. A previously recognized impairment loss is reversed only if there has been a change in the estimates used to determine the asset’s recoverable amount since the last impairment loss was recognized. If that is the case, the carrying amount of the asset is increased to its recoverable amount. That increased amount cannot exceed the carrying amount that would have been determined, net of depreciation, had no impairment loss been recognized for the asset in prior years. Such reversal is recognized in the statement of income unless the asset is carried at a revalued amount, in which case the reversal is treated as a revaluation increase. After such a reversal, the depreciation expense is adjusted in future years to allocate the asset’s revised carrying amount, less any residual value, on a systematic basis over its remaining life.
LeasesThe determination of whether an arrangement is, or contains a lease is based on the substance of the arrangement and requires an assessment of whether the fulfillment of the arrangement is dependent on the use of a specific asset or assets and the arrangement conveys a right to use the asset. A reassessment is made after inception of the lease only if one of the following applies:
(a) There is a change in contractual terms, other than a renewal or extension of the arrangement;(b) A renewal option is exercised or extension granted, unless that term of the renewal or extension was initially included
in the lease term;(c) There is a change in the determination of whether fulfillment is dependent on a specified asset; or(d) There is a substantial change to the asset.
Where a reassessment is made, lease accounting shall commence or cease from the date when the change in circumstances gave rise to the reassessment for scenarios (a), (c) or (d) above, and at the date of renewal or extension period for scenario (b).
Veterans Bank 2009 Annual Report
27
Group as lessee (Finance leases)Finance leases, which transfer to the Parent Company substantially all the risks and benefits incidental to the ownership of the leased item, are capitalized at the inception of the lease at the fair value of the leased property or, if lower, at the present value of the minimum lease payments and included in ‘Bank premise, furniture, fixtures and equipment’ with the corresponding liability to the lessor included in ‘Accrued taxes, interest and other expenses’. Lease payments are apportioned between the finance charges and reduction of the lease liability so as to achieve a constant rate of interest on the remaining balance of the liability. Finance charged directly to ‘Interest expense’.
Capitalized leases assets are depreciated over the shorter of the estimated useful lives of the assets or the respective lease terms, if there is no reasonable certainty that the Parent Company will obtain ownership by the end of the lease term.
Group as lessor (Operating leases)Leases where the Group does not transfer substantially all the risk and benefits of ownership of the assets are classified as operating leases. Initial direct costs incurred in negotiating operating leases are added to the carrying amount of the leased asset and recognized over the lease term on the same basis as the rental income. Contingent rents are recognized as revenue in the period in which they are earned.
Group as lessee (Operating leases)Leases where the lessor retains substantially all the risk and benefits of ownership of the assets are classified as operating leases. Operating lease payments are recognized as an expense in the statement of income on a straight-line basis over the lease term.
Retirement CostThe Parent Company is covered by a noncontributory defined benefit retirement plan (the Plan).
The retirement cost of the Parent Company is determined using the projected unit credit method. Under this method, the current service cost is the present value of retirement benefits payable in the future with respect to services rendered in the current period.
The liability recognized in the statement of financial position in respect of the defined benefit pension plan is the present value of the defined benefit obligation at the statement of financial position date less the fair value of plan assets, together with adjustments for unrecognized actuarial gains or losses and past service costs. The defined benefit obligation is calculated annually by an independent actuary using the projected unit credit method. The present value of the defined benefit obligation is determined by discounting the estimated future cash outflows using interest rate on government bonds that have terms to maturity approximating the terms of the related retirement liability. Actuarial gains and losses arising from experience adjustments and changes in actuarial assumptions are credited to or charged against income when the net cumulative unrecognized actuarial gains and losses at the end of the previous period exceeded 10.00% of the higher of the defined benefit obligation and the fair value of plan assets at that date. These gains or losses are recognized over the expected average remaining working lives of the employees participating in the Plan.
Past-service costs, if any, are recognized immediately in the statement of income, unless the changes to the pension plan are conditional on the employees remaining in service for a specified period of time (the vesting period). In this case, the past-service costs are amortized on a straight-line basis over the vesting period.
The defined benefit asset or liability comprises the present value of the defined benefit obligation less past-service costs not yet recognized and less the fair value of plan assets out of which the obligations are to be settled directly. The value of any asset is restricted to the sum of any past service cost not yet recognized and the present value of any economic benefits available in the form of refunds from the plan or reductions in the future contributions to the plan.
ProvisionsProvisions are recognized when the Group has a present obligation (legal or constructive) as a result of a past event and it is probable that an outflow of resources embodying economic benefits will be required to settle the obligation and a reliable estimate can be made of the amount of the obligation. Where the Group expects some or all of a provision to be reimbursed, for example, under an insurance contract, the reimbursement is recognized as a separate asset but only when the reimbursement is virtually certain. The expense relating to any provision is presented in the statement of income, net of any reimbursement. If the effect of the time value of money is material, provisions are determined by discounting the expected future cash flows at a pre-tax rate that reflects current market assessments of the time value of money and, where appropriate, the risks specific to the liability. Where discounting is used, the increase in the provision due to the passage of time is recognized as interest expense.
28
Philippine Veterans Bank And SubsidiariesNotes to Financial Statements
Contingent Liabilities and Contingent AssetsContingent liabilities are not recognized in the financial statements but are disclosed unless the possibility of an outflow of resources embodying economic benefits is remote. Contingent assets are not recognized but are disclosed in the financial statements when an inflow of economic benefits is probable.
Borrowing CostsBorrowing costs are recognized as expense in the year in which these costs are incurred. Borrowing costs that are directly attributable to the acquisition, construction or production of a qualifying asset are capitalized as part of the cost of that asset.
Income TaxesCurrent taxesCurrent tax assets and liabilities for the current and prior periods are measured at the amount expected to be recovered from or paid to the taxation authorities. The tax rates and the tax laws used to compute the amount are those that are enacted or substantially enacted at the statement of financial position date.
Deferred taxesDeferred tax is provided using the balance sheet liability method on all temporary differences at the statement of financial position date between the tax bases of assets and liabilities and their carrying amounts for financial reporting purposes.
Deferred tax liabilities are recognized for all taxable temporary differences, including asset revaluations. Deferred tax assets are recognized for all deductible temporary differences, carryforward of unused tax credits from the excess of minimum corporate income tax (MCIT) over the regular corporate income tax (RCIT), and unused net operating loss carryover (NOLCO), to the extent that it is probable that sufficient taxable profit will be available against which the deductible temporary differences and carry forward of unused MCIT and unused NOLCO can be utilized. Deferred tax, however, is not recognized on temporary differences that arise from the initial recognition of an asset or liability in a transaction that is not a business combination and, at the time of the transaction, affects neither the accounting income nor taxable income or loss.
Deferred tax liabilities are not provided on non-taxable temporary differences associated with investments in domestic subsidiaries and associates.
The carrying amount of deferred tax assets is reviewed at each statement of financial position date and reduced to the extent that it is no longer probable that sufficient taxable profit will be available to allow all or part of the deferred asset to be utilized. Unrecognized deferred tax assets are reassessed at each statement of financial position date and are recognized to the extent that it has become probable that future taxable profit will allow the deferred tax asset to be recovered.
Deferred tax assets and liabilities are measured at the tax rates that are applicable to the period when the asset is realized or the liability is settled, based on tax rates (and tax laws) that have been enacted or substantively enacted at the statement of financial position date.
Current tax and deferred tax relating to items recognized directly in equity are also recognized in equity and not in the statement of income.
Deferred tax assets and deferred tax liabilities are offset if a legally enforceable right exists to set off current tax assets against current tax liabilities and deferred taxes related to the same taxable entity and the same taxation authority.
Earnings per ShareBasic earnings per share (EPS) is computed by dividing net income attributable to common shareholders for the year by the weighted average number of common shares outstanding during the year after giving retroactive effect to stock dividends declared and stock rights exercised during the year, if any. The Group does not have dilutive potential common shares.
Dividends on Common SharesDividends on common shares are recognized as a liability and deducted from equity when approved by the BOD of the Parent Company. Dividends declared after the statement of financial position date are dealt with as an event after the statement of financial position date.
Veterans Bank 2009 Annual Report
29
Subsequent EventsAny post-year-end events that provide additional information about the Group’s position at the statement of financial position date (adjusting events) are reflected in the financial statements. Post-year-end events that are not adjusting events, if any, are disclosed in the notes when material to the financial statements.
Fiduciary ActivitiesAssets and income arising from fiduciary activities together with related undertakings to return such assets to customers are excluded from the financial statements where the Parent Company acts in a fiduciary capacity such as nominee, trustee or agent.
EquityCapital stock is measured at par value for all shares issued. When the Parent Company issues more than one class of stock, a separate account is maintained for each class of stock and the number of shares issued.
When the shares are sold at a premium, the difference between the proceeds and the par value is credited to “Additional Paid-in Capital” account. When shares are issued for a consideration other than cash, the proceeds are measured by the fair value of the consideration received. In case the shares are issued to extinguish or settle the liability of the Parent Company, the shares shall be measured either at the fair value of the shares issued or fair value of the liability settled, whichever is more reliably determinable.
Expense RecognitionExpenses are recognized in the statement of income when decrease in future economic benefit related to a decrease in an asset or an increase in a liability has arisen that can be measured reliably.
Expenses are recognized in the statement of income:
• Onthebasisofadirectassociationbetweenthecostsincurredandtheearningofspecificitemsofincome;• Onthebasisofsystematicandrationalallocationprocedureswheneconomicbenefitsareexpectedtoarise
over several accounting periods and the association can only be broadly or indirectly determined; or• Immediatelywhenexpenditureproducesnofutureeconomicbenefitsorwhen,andtotheextentthat,future
economic benefits do not qualify or cease to qualify, for recognition in the statements of financial position as an asset.
Future Changes in Accounting PoliciesThe Group will adopt the following standards and interpretations enumerated below when these become effective. Except as otherwise indicated, the Group does not expect the adoption of these new and amended PFRS and Philippine Interpretations to have significant impact on its financial statements.
PFRS 3, Business Combinations (Revised) and PAS 27, Consolidated and Separate Financial Statements (Amended)The revised standards are effective for annual periods beginning on or after July 1, 2009. PFRS 3 (Revised) introduces significant changes in the accounting for business combinations occurring after this date. Changes affect the valuation of non-controlling interest, the accounting for transaction costs, the initial recognition and subsequent measurement of a contingent consideration and business combinations achieved in stages. These changes will impact the amount of goodwill recognized, the reported results in the period that an acquisition occurs and future reported results. PAS 27 (Amended) requires that a change in the ownership interest of a subsidiary (without loss of control) is accounted for as a transaction with owners in their capacity as owners. Therefore, such transactions will no longer give rise to goodwill, nor will it give rise to a gain or loss. Furthermore, the amended standard changes the accounting for losses incurred by the subsidiary as well as the loss of control of a subsidiary. The changes by PFRS 3 (Revised) and PAS 27 (Amended) will affect future acquisitions or loss of control of subsidiaries and transactions with non-controlling interests. PFRS 3 (Revised) will be applied prospectively while PAS 27 (Amended) will be applied retrospectively with few exceptions.
Philippine Interpretation IFRIC 17, Distributions of Non-Cash Assets to OwnersThis Interpretation is effective for annual periods beginning on or after July 1, 2009 with early application permitted. It provides guidance on how to account for non-cash distributions to owners. The interpretation clarifies when to recognize a liability, how to measure it and the associated assets, and when to derecognize the asset and liability.
30
Philippine Veterans Bank And SubsidiariesNotes to Financial Statements
Philippine Interpretation IFRIC 15, Agreement for Construction of Real EstateThis Interpretation, effective for annual periods beginning on or after January 1, 2012, covers accounting for revenue and associated expenses by entities that undertake the construction of real estate directly or through subcontractors. The Interpretation requires that revenue on construction of real estate be recognized only upon completion, except when such contract qualifies a construction contract to be accounted for under PAS 11, Construction Contracts, or involves rendering of services in which case revenue is recognized based on stage of completion. Contract involving provision of services with the construction materials and where the risks and reward of ownership are transferred to the buyer on a continuous basis will also be accounted for based on stage of completion.
Amendments to StandardsPAS 39 Amendment - Eligible Hedged ItemsThe amendment to PAS 39, Financial Instruments: Recognition and Measurement, effective for annual periods beginning on or after July 1, 2009, clarifies that an entity is permitted to designate a portion of the fair value changes or cash flow variability of a financial instrument as a hedged item. This also covers the designation of inflation as a hedged risk or portion in particular situations.
PFRS 2 Amendments - Group Cash-settled Share-based Payment TransactionsThe amendments to PFRS 2, Share-based Payments, effective for annual periods beginning on or after January 1, 2010, clarify the scope and the accounting for group cash-settled share-based payment transactions.
Improvements to PFRS 2009The omnibus amendments to PFRS issued in 2009 were issued primarily with a view to remove inconsistencies and clarify wording. The amendments are effective for annual periods financial years January 1, 2010 except otherwise stated. The Group has not yet adopted the following amendments and anticipates that these changes will have no material effect on the financial statements.
• PFRS2,Share-based Payment, clarifies that the contribution of a business on formation of a joint venture and combinations under common control are not within the scope of PFRS 2 even though they are out of scope of PFRS 3, Business Combinations (Revised). The amendment is effective for financial years on or after July 1, 2009.
• PFRS5,Non-current Assets Held for Sale and Discontinued Operations, clarifies that the disclosures required in respect of non-current assets and disposal groups classified as held for sale or discontinued operations are only those set out in PFRS 5. The disclosure requirements of other PFRS only apply if specifically required for such non-current assets or discontinued operations.
• PFRS8,Operating Segment Information, clarifies that segment assets and liabilities need only be reported when those assets and liabilities are included in measures that are used by the chief operating decision maker.
• PAS1,Presentation of Financial Statements, clarifies that the terms of a liability that could result, at anytime, in its settlement by the issuance of equity instruments at the option of the counterparty do not affect its classification.
• PAS7,Statement of Cash Flows, explicitly states that only expenditure that results in a recognized asset can be classified as a cash flow from investing activities.
• PAS17,Leases, removes the specific guidance on classifying land as a lease. Prior to the amendment, leases of land were classified as operating leases. The amendment now requires that leases of land are classified as either ‘finance’ or ‘operating’ in accordance with the general principles of PAS 17. The amendments will be applied retrospectively.
• PAS36,Impairment of Assets, clarifies that the largest unit permitted for allocating goodwill, acquired in a business combination, is the operating segment as defined in PFRS 8 before aggregation for reporting purposes.
• PAS38,Intangible Assets, clarifies that if an intangible asset acquired in a business combination is identifiable only with another intangible asset, the acquirer may recognize the group of intangible assets as a single asset provided the individual assets have similar useful lives. Also clarifies that the valuation techniques presented for determining the fair
value of intangible assets acquired in a business combination that are not traded in active markets are only examples and are not restrictive on the methods that can be used.
Veterans Bank 2009 Annual Report
31
• PAS39,Financial Instruments: Recognition and Measurement, clarifies the following:- that a prepayment option is considered closely related to the host contract when the exercise price of
a prepayment option reimburses the lender up to the approximate present value of lost interest for the remaining term of the host contract.
- that the scope exemption for contracts between an acquirer and a vendor in a business combination to buy or sell an acquiree at a future date applies only to binding forward contracts, and not derivative contracts where further actions by either party are still to be taken.
- that gains or losses on cash flow hedges of a forecast transaction that subsequently results in the recognition of a financial instrument or on cash flow hedges of recognized financial instruments should be reclassified in the period that the hedged forecast cash flows affect profit or loss.
• AmendmenttoPhilippineInterpretationIFRIC9,Reassessment of Embedded Derivatives, clarifies that it does not apply to possible reassessment at the date of acquisition, to embedded derivatives in contracts acquired in a business combination between entities or businesses under common control or the formation of joint venture.
• AmendmenttoPhilippineInterpretationIFRIC16,Hedge of a Net Investment in a Foreign Operation, states that, in a hedge of a net investment in a foreign operation, qualifying hedging instruments may be held by any entity or entities within the group, including the foreign operation itself, as long as the designation, documentation and effectiveness requirements of PAS 39 that relate to a net investment hedge are satisfied.
3. Significant Accounting Judgments and Estimates
The preparation of the financial statements in accordance with PFRS requires the Group to make estimates and assumptions that affect the reported amounts of assets, liabilities, income and expenses and disclosure of contingent assets and contingent liabilities. Future events may occur which will cause the judgments and assumptions used in arriving at the estimates to change. The effects of any change in estimates are reflected in the financial statements as they become reasonably determinable.
Judgments and estimates are continually evaluated and are based on historical experience and other factors, including expectations of future events that are believed to be reasonable under the circumstances.
Judgments(a) Operating lease commitment - the Group as lessor
The Group has entered into commercial property leases on its investment properties. Based in the evaluation of the terms and condition of the agreements, the Group has determined that it retains all the significant risks and rewards of ownership over these properties which are leased out as operating leases. In determining whether or not there is indication of operating lease treatment, the Group considers retention of ownership title to the leased property, period of lease contract relative to the estimated useful economic life of the leased property, bearer of executory costs, and among others.
(b) Operating lease commitment - the Group as lesseeThe Group has entered into property leases as a lessee for its office premises. The Group has determined that the lessor retained all the significant risks and rewards of ownership over this property. In determining whether or not there is indication of operating lease treatment, the Group considers retention of ownership title to the leased property, period of lease contract relative to the estimated useful economic life of the leased property, bearer of executory costs, and among others.
(c) Finance lease commitment - the Parent company as lesseeThe Parent Company has entered into property leases as a lessee for its head office. The Parent Comapny has determined that the lessor has transferred substantially all the significant risks and rewards of ownership over this property to the Parent Company and the lease is accounted for as finance lease. In determining whether or not there is indication of operating lease treatment, the Parent Company considers retention of ownership title to the leased property, period of lease contract relative to the estimated useful economic life of the leased property, bearer of executory costs, and among others.
32
Philippine Veterans Bank And SubsidiariesNotes to Financial Statements
(d) Fair value of financial instrumentsWhere the fair values of financial assets and financial liabilities recorded on the statement of financial position cannot be derived from active markets, they are determined using a variety of valuation techniques that include the use of mathematical models. The input to these models is taken from observable markets where possible, but where this is not feasible, a degree of judgment is required in establishing fair values. The judgments include considerations of liquidity and model inputs. The valuation of financial instruments is described in more detail in Note 5.
(e) HTM financial assetsThe classification to HTM financial assets requires significant judgment. In making this judgment, the Group evaluates its intention and ability to hold such investments to maturity. If the Group fails to keep these investments to maturity other than in certain specific circumstances - for example, selling an insignificant amount close to maturity - it will be required to reclassify the entire portfolio as AFS investments. The investments would therefore be measured at fair value and not at amortized cost.
(f) Financial assets not quoted in an active marketThe Group classifies financial assets by evaluating, among others, whether the asset is quoted or not in an active market. Included in the evaluation on whether a financial asset is quoted in an active market is the determination on whether quoted prices are readily and regularly available, and whether those prices represent actual and regularly occurring market transactions on an arm’s length basis.
(g) Functional currencyPAS 21 requires management to use its judgment to determine the entity’s functional currency such that it most faithfully represents the economic effects of the underlying transactions, events and conditions that are relevant to the entity. In making this judgment, the Group considers the following:
a) the currency that mainly influences sales prices for financial instruments and services (this will often be the currency in which sales prices for its financial instruments and services are denominated and settled)
b) the currency in which funds from financing activities are generated; andc) the currency in which receipts from operating activities are usually retained.
The Group determined that its functional currency is Philippine peso.
Estimates(a) Credit losses on loans and receivables
The Group reviews its loan portfolios and receivables to assess impairment at each reporting date with updating provisions made during the intervals as necessary based on the continuing analysis and monitoring of individual accounts by credit officers. In determining whether an impairment loss should be recorded in the statement of income, the Group makes judgments as to whether there is any observable data indicating that there is a measurable decrease in the estimated future cash flows from a portfolio of loans before the decrease can be identified with an individual loan in that portfolio. This evidence may include observable data indicating that there has been an adverse change in the payment status of borrowers in a group, or national or local economic conditions that correlate with defaults on assets in the group. Management uses estimates in the amount and timing of future cash flows when determining the level of allowance required. Such estimates are based on assumptions about a number of factors and actual results may differ, resulting to future changes in the allowance.
In addition to specific allowance against individually significant loans and receivables, the Group also makes a collective impairment allowance against exposures which, although not specifically identified as requiring a specific allowance, have a greater risk of default than when originally granted. This collective allowance is based on any deterioration in the internal rating of the loan or investment since it was granted or acquired. These internal ratings take into consideration factors such as any deterioration in country risk, industry, and technological obsolescence, as well as identified structural weaknesses or deterioration in cash flows.
As of December 31, 2009 and 2008, allowance for credit losses on loans and receivables amounted to P1.27 billion and P1.07 billion, respectively, both for the Group and Parent Company. Loans and receivables are carried at P22.25 billion and P22.20 billion by the Group and Parent Company, respectively, as of December 31, 2009 and P19.13 billion and P19.13 billion by the Group and Parent Company respectively, as of December 31, 2008 (see Note 7).
Veterans Bank 2009 Annual Report
33
(b) Fair value of financial instrumentsThe fair values of financial instruments that are not quoted in active markets are determined by using valuation techniques. Where valuation techniques are used to determine fair values, they are validated and periodically reviewed by qualified personnel independent of the area that created them. All models are reviewed before they are used, and models are calibrated to ensure that outputs reflect actual data and comparative market prices. To the extent practical, models use only observable data, however areas such as credit risk (both own and counterparty), volatilities and correlations require management to make estimates. Changes in assumptions about these factors could affect reported fair value of financial instruments. Refer to Note 5 for the information on the carrying amounts of these instruments.
Valuation of unquoted equity investments are normally based on one of the following:
• recentarm’slengthmarkettransactions;• currentfairvalueofanotherinstrumentthatissubstantiallythesame;• theexpectedcashflowsdiscountedatcurrentratesapplicablefortermswithsimilartermsandrisk
characteristics; or• othervaluationmodels.
The determination of the cash flows and discount factors for unquoted equity investments requires significant estimation. The Parent Company calibrates the valuation techniques periodically and tests them for validity using either prices from observable current market transactions in the same instrument or from other available observable market data.
Unquoted equity instruments are carried at cost less any impairment if (a) the range of reasonable fair value estimate is significant and (b) the probabilities of the various estimates cannot be reasonably assessed.
As of December 31, 2009 and 2008, unquoted AFS equity securities amounted to P39.27 million and P45.95 million, respectively, for the Group and P13.42 million and P13.42 million, respectively, for the Parent Company. (see Note 6)
(d) Impairment of AFS equity investmentsThe Group treats AFS equity investments as impaired when there has been a significant or prolonged decline in the fair value below its cost or where other objective evidence of impairment exists. The determination of what is ‘significant’ or ‘prolonged’ requires judgment. The Group treats ‘significant’ generally as 20% or more and ‘prolonged’ greater than 12 months. In addition, the Group evaluates other factors, including normal volatility in share price for quoted equities and the future cash flows and the discount factors for unquoted equities.
In addition, impairment may be appropriate when there is evidence of deterioration in the financial health of the investee, industry and sector performance, changes in technology, and operational and financing cash flows. As of December 31, 2009 and 2008, allowance for impairment losses on AFS equity investments amounted to P138.97 million and P140.73 million, respectively, for the Group and P125.96 million and P125.45 million, respectively, for the Parent Company and (see Note 6).
As of December 31, 2009 and 2008, AFS equity investments amounted to P39.85 million and P59.68 million, respectively, for the Group and P40.42 million and P41.93 million, respectively, for the Parent Company (see Note 6).
(e) Present value of retirement obligationThe cost of defined benefit pension plan and other post employment benefits is determined using actuarial valuations. The actuarial valuation involves making assumptions about discount rates, expected rates of return on assets, future salary increases, mortality rates and future pension increases. Due to the long term nature of these plans, such estimates are subject to significant uncertainty.
The expected rates of return on plan assets of 6.50% and 6.00% in 2009 and 2008, respectively, were based on the average historical premium of the fund assets. The assumed discount rates were determined using the market yields on Philippine government bonds with terms consistent with the expected employee benefit payout as of statement of financial position dates.
34
Philippine Veterans Bank And SubsidiariesNotes to Financial Statements
As of December 31, 2009 and 2008, the present value of the retirement obligation for both the Group and the Parent Company amounted to P114.17 million and P44.92 million, respectively (see Note 20).
(f) Recognition of deferred income taxesDeferred tax assets are recognized for all unused tax losses to the extent that it is probable that taxable profit will be available against which the losses can be utilized. Significant management judgment is required to determine the amount of deferred tax assets that can be recognized, based upon the likely timing and level of future taxable profits together with future tax planning strategies.
As of December 31, 2009 and 2008, the recognized deferred tax assets - net for the Group amounted to P356.29 and P250.60 million, respectively, and for the Parent Company amounted to P360.26 and P250.81 million (see Note 22).
(g) Impairment of bank premises, furniture, fixtures and equipment and investment propertiesThe Group assesses impairment on assets whenever events or changes in circumstances indicate that the carrying amount of an asset may not be recoverable. The factors that the Group and the Parent Company consider important which could trigger an impairment review include the following:
• significantunderperformancerelativetoexpectedhistoricalorprojectedfutureoperatingresults;• significantchangesinthemannerofuseoftheacquiredassetsorthestrategyforoverallbusiness;and• significantnegativeindustryoreconomictrends.
The Group recognizes an impairment loss whenever the carrying amount of an asset exceeds its recoverable amount. The recoverable amount is computed using the value in use approach. Recoverable amounts are estimated for individual assets or, if it is not possible, for the cash-generating unit to which the asset belongs.
As of December 31, 2009 and 2008, the carrying value of the bank premises, furniture, fixtures and equipment and investment properties amounted to P637.90 million and P2.38 billion and, P485.48 million and P2.38 billion, respectively, for the Group and P513.20 million and P2.38 billion and, P345.12 million and P2.38 billion, respectively, for the Parent Company.
(h) ContingenciesThe Group is currently involved in various legal proceedings. The estimate of the probable costs for the resolution of these claims has been developed in consultation with outside counsel handling the Group’s defense in these matters and is based upon an analysis of potential results. The Group currently does not believe that these proceedings will have a material adverse effect on its financial position. It is possible, however, that future results of operations could be materially affected by changes in the estimates or in the effectiveness of the strategies relating to these proceedings (see Note 27).
4. Financial Risk Management
IntroductionThe Group has exposure to the following risks from its use of financial instruments:
• Creditrisk• Liquidityrisk• Marketrisk
Risk Management FrameworkRisk is an inherent part of the Parent’s Company business activities. The Parent’s Company risk management framework and governance structure are intended to provide comprehensive controls and ongoing management of these risks. The risk management process is an ongoing identification, measurement, monitoring or control and reporting. It is critical to the Bank’s soundness and profitability as it is continually exposed to credit risk, liquidity risk and market risk.
Risk identification: The Parent’s Company exposure to risk through its daily business dealings, including lending, trading and capital market activities, is identified and aggregated through the Parent Company’s risk management infrastructure.
Veterans Bank 2009 Annual Report
35
Risk measurement: The Parent’s Company measures risk using a variety of methodologies, including calculating potential liquidity outflows, Earnings-at-Risk (EAR) and Value-at-Risk (VaR), and by performing sensitivity and scenario analyses (“stress testing”) on strategic portfolios in the Parent Company’s statement of financial position.
Risk monitoring or control: The Parent’s Company risk management policies and procedures incorporate risk mitigation strategies and include approval limits by customer, product and industry. These limits are monitored on a regular basis.
Risk reporting: Risk reporting is executed on a per type of risk basis. This information is reported to Senior Management, Risk and Compliance Committee (RCCom) and BOD on a regular basis.
Risk GovernanceThe BOD has the ultimate responsibility for understanding the nature and the level of risks taken by the Parent Company. The BOD has created various committees such as the Credit Committee (CreCom), Audit Committee (AC), and RCCom to assist in the performance of its responsibilities for the management of risk. These committees are composed of members of the board supported by the Risk Management Department, Compliance Department and Audit Department.
The RCCom sets risk limits, policies and standards for risk identification, analysis and control especially credit, market, liquidity and operational risks. The RCCom monitors the sensitivity of the Parent Company’s portfolios to changes in the market, such as price, banking regulations and the effects on the profitability of the Parent Company. The AC reviews and recommends approval to the BOD for the internal audit programs, policies and procedures and oversees proper implementation and adherence of such. The risk management system of the Parent Company is annually reviewed by both internal and external auditors to ensure its effectiveness and adequacy relative to the Bank’s risk taking activities. The CreCom of the BOD reviews, approves or recommends approval to the Executive Committee (ExCom) and/or to the BOD credit and credit related proposals, policies and procedures, loan products and lending programs.
In the transactional level, Senior Management has created various management committees to oversee the management of the various risks of the business. The Asset and Liability Committee (ALCO) is responsible for ensuring market and liquidity risks are adequately managed both on long term and day-to-day bases. The President’s CreCom has been delegated with credit authority limits and recommends credit proposals and policies to the CreCom of the BOD for proposals beyond its credit authority limit. The Operations Committee reviews operational policies and procedures and recommends the same for approval by the BOD. The Remedial Management Committee monitors the status and performance of the non-performing loans of the Parent Company. All other aspects of the business are managed by the Management Committee to ensure that all risk activities are in line with the business objectives of the Parent Company.
Excessive Risk ConcentrationConcentrations arise when a number of counterparties are engaged in similar business activities, or activities in the same geographic region, or have similar economic features that would cause their ability to meet contractual obligations to be similarly affected by changes in economic, political or other conditions. Concentrations indicate the relative sensitivity of the Parent Company’s performance to developments affecting a particular industry or geographical location.
In order to avoid excessive concentrations of risk, the Parent Company’s policies and procedures include specific guidelines focusing on maintaining a diversified portfolio. Identified concentrations of credit risks are controlled and managed accordingly. Selective hedging is used within the Parent Company to manage risk concentrations at both the relationship and industry levels.
Credit RiskCredit risk is the risk of financial loss due to default of a counterparty to perform its financial obligation to the Parent Company. The Parent Company has developed policies and practices that are designed to preserve the independence and integrity of decision-making and ensure credit risks are assessed accurately, approved properly, monitored regularly and managed actively at both the transaction and portfolio levels. The policy framework establishes credit approval authorities, concentration limits, risk-rating methodologies, portfolio-review parameters and guidelines for management of distressed exposure. Credit risk is managed by the Parent Company by setting and monitoring limits for individual counterparties, and groups of counterparties as well as periodically assessing the credit worthiness of its counterparties. In addition, the Parent Company obtains collateral where appropriate and collateral agreements with counterparties, and limits the duration of exposure.
36
Philippine Veterans Bank And SubsidiariesNotes to Financial Statements
Credit risk is overseen by BOD through its CreCom and RCC. The BOD sets credit policies and delegates credit authority limits to Management to facilitate the approval of credit transactions. All credit proposals prior to BOD approval or confirmation goes thru the scrutiny of the President’s CreCom and the CreCom of the BOD. The Remedial Management Committee manages and monitors the performance and collection of distressed accounts.
For purposes of assessing credit risk, the Parent Company established an Internal Credit Risk Rating System (ICRRS). There are three internal credit risk rating systems of the Parent Company. The first ICRRS covers all corporate borrowers including small and medium enterprise (SME) regardless of asset size, requiring corporates with assets of P15 million and above to submit financial statements that are audited by SEC-accredited auditing firms. The second ICRRS covers financial institutions. This is used for establishment of counterparty credit lines for the Parent Company’s treasury transactions. Lastly, the Parent Company also adopted a ICRRS for local government borrowers.
The ICRRS assesses two main aspects of the borrower, namely, the Borrower Risk Rating (BRR) and the Loan Exposure Rating (LER). The BRR provides an assessment of the creditworthiness of the borrower, without considering the proposed facility and security arrangements. The LER presents an assessment of the proposed facilities with the corresponding security arrangements if available.
The Parent Company sets industry exposure limits to monitor credit risk concentration per industry type. It also establishes the credit risk tolerance of the company to the various industry sectors. Moreover, a periodic review is conducted on credit concentration on large exposures. Per BSP definition, large exposures are those credit exposures with an outstanding balance of 5% or more of the total qualifying capital. A limit is also applied on the maximum aggregate loan the Bank can expose itself vis-à-vis its total assets. It further sets a limit on the maximum capital it can utilize to cover loan exposures. As of December 31, 2009 and 2008, all industry exposures are within approved limit. Moreover, there were ten (10) large exposures with a combined total of P5.08 billion of which P1.35 billion is sovereign guaranteed.
The ICRRS contains the following:
a. BRR - The BRR is an assessment of the credit worthiness of the borrower (or guarantor) without considering the type or amount of the facility and security arrangements. It is an indicator of the probability that a borrower cannot meet its credit obligations in foreseen manner. The assessment is described below:
Component Description Credit Factor WeightFinancial Condition Refers to the financial condition of the borrower as
indicated by certain financial ratios. The Financial Factor Evaluation shall be conducted manually.
40%
Industry Analysis Refers to the prospects of the industry as well as the company’s performance and position in the industry.
15%
Management Quality Refers to the management’s ability to run the company successfully.
15%
Credit Dealings Refers to the company’s business relationship with banks, suppliers and even its customers and the public as a whole.
15%
Collateral Business with the Bank
Refers to the existing business relationship. 5%
Existence Refers to number of years company has been existing. 10%
b. LER - The LER is determined for each individual facility considering the term of the facility, security arrangement and quality of documentation. This factor can downgrade or upgrade the BRR based on the elements relating to cover (collateral including pledged cash deposits and guarantee), quality of documentation and structure of transactions.
c. Risk Asset Acceptance Criteria (RAAC) - the combination of BRR and LER results to RAAC. The current risk grading framework consists of ten grades reflecting varying degrees of risk of default and the
availability of collateral or other credit risk mitigation. The following table shows the description of ICRRS grade:
Veterans Bank 2009 Annual Report
37
Credit Quality ICRRS Grade Description
High Grade
AAA Superior
AA Strong
A Good
BBB Satisfactory
Standard Grade
BB Acceptable
B Watchlist
CCC Specially mentioned
Substandard Grade
CC Substandard
C Doubtful
Impaired
D Loss
SuperiorThis rating is given to a borrower with no history of delinquencies or defaults, highly liquid and sustaining strong operating trends, unlikely to be affected by external factors and has a competent management that uses current business models.
StrongThis rating is given to borrowers with the same characteristics as those rated as “superior” rating, but is only adequately liquid.
GoodThis rating is given to a borrower with no history of default in the last 12 months. The entity’s borrowing base can support its line of credit, and it is meeting performance expectations. It is unlikely to be affected by external factors and has a competent management that uses current business models.
SatisfactoryThis rating is given to a borrower that pays as agreed, but is not necessarily non-delinquent. The entity has adequate to marginal liquidity and generally meets performance expectations. While there are external factors that may affect the entity, these will likely be overcome. A lack of key management experience may be a current problem for the entity, and such could be brought about by a recent departure of a key employee.
AcceptableThis rating is given to a borrower that is current in its payments while not necessarily paying as agreed. The entity has marginal liquidity and has a declining trend in operations or an imbalanced position in the balance sheet, though not to the point that repayment is jeopardized.
There are identified external disruptions though the impact on the entity is uncertain. There may also be some turnover causing key management positions to stay vacant.
WatchlistThis rating is given to a borrower that may either be current in its payments, or 30 to 60 days past due. The entity has marginal liquidity and may not be meeting performance expectations, even having defaulted on some of its loans. There are identified disruptions that negatively affect the entity’s performance, though there are near-term solutions. Management may also have changed its business model with negative implications for the entity.
Specially MentionedThe borrower in this rating shows evidence of weakness in its financial condition, having expected financial difficulties. There is a real risk that the entity’s ability to pay the interest and principal on time could be jeopardized. The entity’s ability or willingness to service debt is in doubt, likely causing a need to reschedule payments.
38
Philippine Veterans Bank And SubsidiariesNotes to Financial Statements
SubstandardFor a ‘substandard’ borrower, the debt burden has become too heavy, only to be made worse by weak or negative cash flows and interest coverage. This makes the collection of principal or interest payments questionable, causing an assessment of default at up to 50%. Unless given closer supervision, the institution will likely suffer a future loss. External factors may be causing an adverse trend, or there may be a significant weakness in the entity’s collateral. Management has an unfavorable record and lacks managerial capability.
DoubtfulThis rating is given to a nonperforming borrower where a payment default has occurred, due to the borrower’s inability or unwillingness to service debt over an extended period of time. Loss is unavoidable and significant, although the extent of probable loss on the loan cannot be exactly quantified at the current time. However, there may be external factors that may strengthen the entity’s assets, e.g. merger, acquisition, and capital injection. Management has an unfavorable record and lacks managerial capability.
LossThis rating is given to a borrower when debt service or the prospect for re-establishment of credit worthiness, has become remote. This may be due to the fact that the borrower and/or his co-makers have become insolvent, thus the lender may already be preparing foreclosure procedures. A full provision is made on that part of the principal which is not fully and adequately covered. While the loan covers basically worthless assets, writing off these loans is neither practical nor desirable for the lender.
Maximum exposure to credit risk before collateral held or other credit enhancementsAn analysis of the maximum exposure to credit risk without taking into account of any collateral held or other credit enhancements is shown below (amounts in thousands):
Consolidated Parent Company
2009 2008 2009 2008
Credit risk exposures relating to on-balance sheet assets are as follow:
Loans and receivables
Due from BSP P13,055,098 P6,489,795 P13,055,098 P6,489,795
Due from other banks 699,457 970,146 685,821 956,266
Interbank loans receivable and SPURA 3,762,819 8,295,911 3,762,819 8,295,911
Loans and discounts
Corporate 10,063,670 9,147,223 10,063,670 9,147,223
Individual 2,740,680 2,936,172 2,740,654 2,936,139
Government 5,945,630 3,747,747 5,945,630 3,747,747
Unquoted debt securities 2,902,328 2,744,798 2,902,328 2,744,798
Accounts receivables 1,151,719 1,082,154 1,122,878 1,080,474
Accrued interest receivable 509,679 384,535 509,675 384,497
Sales contract receivable 204,248 166,031 188,007 161,691
41,035,328 37,068,206 40,976,580 37,048,235
Allowance for credit losses (2,401,587) (2,178,360) (2,401,587) (2,178,360)
38,633,741 34,889,846 38,574,993 34,869,875
(Forward)
Veterans Bank 2009 Annual Report
39
Consolidated Parent Company
2009 2008 2009 2008
Financial assets at FVPL
Held-for-trading
Government P890,370 P249,937 P890,370 P249,937
AFS financial assets - net
Government securities 3,258,993 1,959,330 3,258,993 1,959,330
Equity securities
Quoted 39,847 13,736 27,004 28,508
Unquoted 13,420 45,945 13,420 13,420
3,312,260 2,019,011 3,299,417 2,001,258
HTM financial assets - net
Government 4,433,331 4,461,745 4,433,331 4,461,745
Contingent assets 647,034 372,677 647,034 372,677
P47,916,736 P41,993,216 P47,845,145 P41,955,492Concentration of risks of financial assets with credit risk exposureAn analysis of concentrations of credit risk at the reporting date is shown below (amounts in thousands):
Consolidated
2009
Loans andReceivables
Loans andadvancesto banks*
Investmentsecurities** Total
Real estate, renting and business activities P4,212,354 P– P– P4,212,354
Agricultural, hunting and forestry 3,847,414 – – 3,847,414
Philippine government – – 8,748,874 8,748,874
Other community, Social and Personal services 2,906,438 – – 2,906,438
Household consumption 85,094 – – 85,094
Financial intermediaries 778,736 17,517,375 – 18,296,111
Manufacturing (various industries) 935,073 – 160 935,233
Wholesale and retail trade 1,071,297 – – 1,071,297
Hotel and restaurants 664,383 – – 664,383
Construction 69,824 – – 69,824
Electricity, gas and water 230,607 – 41 230,648
Education 167,645 – – 167,645
Transportation, storage and communication 196,018 – – 196,018
Public administration, local government 3,571,524 – – 3,571,524
(Forward)
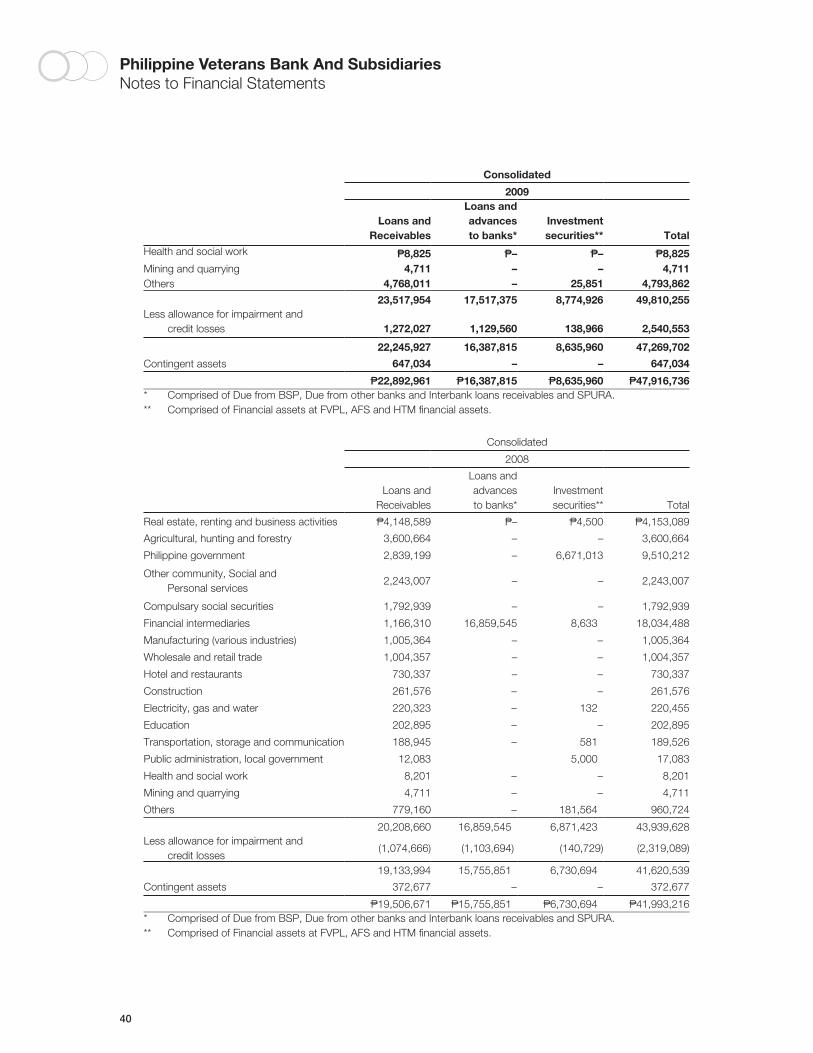
40
Philippine Veterans Bank And SubsidiariesNotes to Financial Statements
Consolidated
2009
Loans andReceivables
Loans andadvancesto banks*
Investmentsecurities** Total
Health and social work P8,825 P– P– P8,825Mining and quarrying 4,711 – – 4,711Others 4,768,011 – 25,851 4,793,862
23,517,954 17,517,375 8,774,926 49,810,255Less allowance for impairment and
credit losses 1,272,027 1,129,560 138,966 2,540,553
22,245,927 16,387,815 8,635,960 47,269,702
Contingent assets 647,034 – – 647,034
P22,892,961 P16,387,815 P8,635,960 P47,916,736* Comprised of Due from BSP, Due from other banks and Interbank loans receivables and SPURA.** Comprised of Financial assets at FVPL, AFS and HTM financial assets.
Consolidated
2008
Loans andReceivables
Loans andadvancesto banks*
Investmentsecurities** Total
Real estate, renting and business activities P4,148,589 P– P4,500 P4,153,089
Agricultural, hunting and forestry 3,600,664 – – 3,600,664
Philippine government 2,839,199 – 6,671,013 9,510,212
Other community, Social and Personal services
2,243,007 – – 2,243,007
Compulsary social securities 1,792,939 – – 1,792,939
Financial intermediaries 1,166,310 16,859,545 8,633 18,034,488
Manufacturing (various industries) 1,005,364 – – 1,005,364
Wholesale and retail trade 1,004,357 – – 1,004,357
Hotel and restaurants 730,337 – – 730,337
Construction 261,576 – – 261,576
Electricity, gas and water 220,323 – 132 220,455
Education 202,895 – – 202,895
Transportation, storage and communication 188,945 – 581 189,526
Public administration, local government 12,083 5,000 17,083
Health and social work 8,201 – – 8,201
Mining and quarrying 4,711 – – 4,711
Others 779,160 – 181,564 960,724
20,208,660 16,859,545 6,871,423 43,939,628Less allowance for impairment and
credit losses(1,074,666) (1,103,694) (140,729) (2,319,089)
19,133,994 15,755,851 6,730,694 41,620,539
Contingent assets 372,677 – – 372,677
P19,506,671 P15,755,851 P6,730,694 P41,993,216* Comprised of Due from BSP, Due from other banks and Interbank loans receivables and SPURA.** Comprised of Financial assets at FVPL, AFS and HTM financial assets.
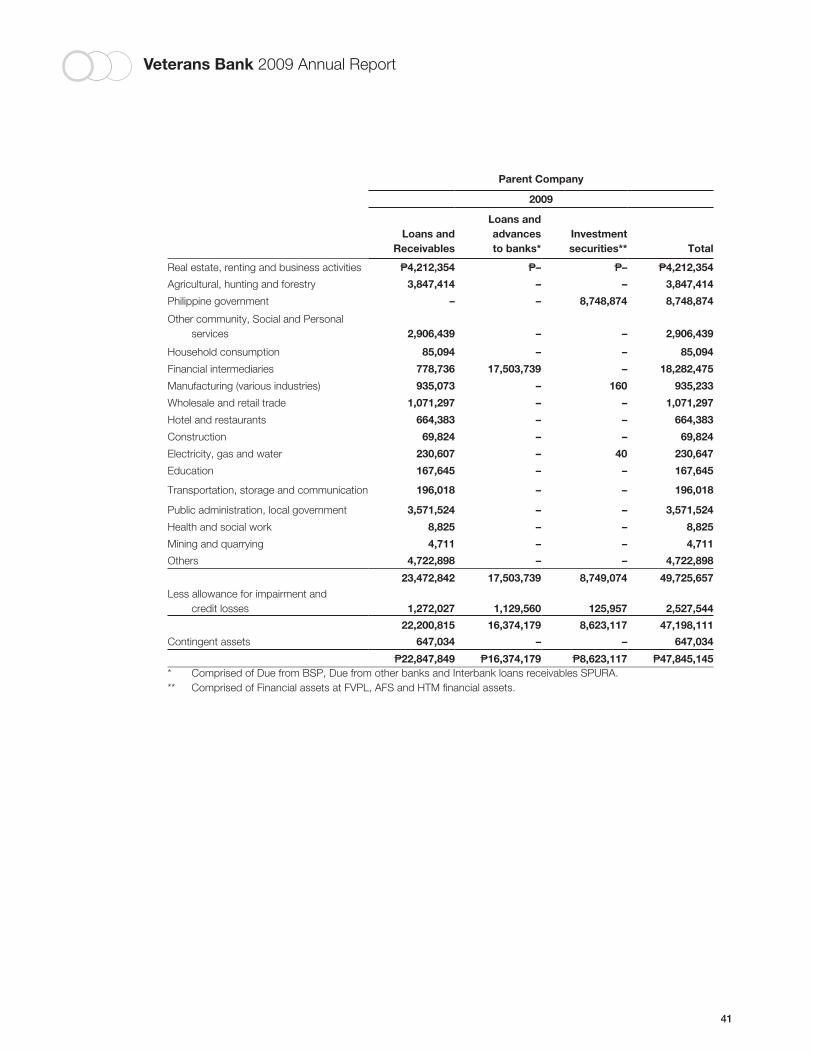
Veterans Bank 2009 Annual Report
41
Parent Company
2009
Loans andReceivables
Loans andadvancesto banks*
Investmentsecurities** Total
Real estate, renting and business activities P4,212,354 P– P– P4,212,354
Agricultural, hunting and forestry 3,847,414 – – 3,847,414
Philippine government – – 8,748,874 8,748,874
Other community, Social and Personal services 2,906,439 – – 2,906,439
Household consumption 85,094 – – 85,094
Financial intermediaries 778,736 17,503,739 – 18,282,475
Manufacturing (various industries) 935,073 – 160 935,233
Wholesale and retail trade 1,071,297 – – 1,071,297
Hotel and restaurants 664,383 – – 664,383
Construction 69,824 – – 69,824
Electricity, gas and water 230,607 – 40 230,647
Education 167,645 – – 167,645
Transportation, storage and communication 196,018 – – 196,018
Public administration, local government 3,571,524 – – 3,571,524
Health and social work 8,825 – – 8,825
Mining and quarrying 4,711 – – 4,711
Others 4,722,898 – – 4,722,898
23,472,842 17,503,739 8,749,074 49,725,657
Less allowance for impairment and credit losses 1,272,027 1,129,560 125,957 2,527,544
22,200,815 16,374,179 8,623,117 47,198,111
Contingent assets 647,034 – – 647,034
P22,847,849 P16,374,179 P8,623,117 P47,845,145* Comprised of Due from BSP, Due from other banks and Interbank loans receivables SPURA.** Comprised of Financial assets at FVPL, AFS and HTM financial assets.
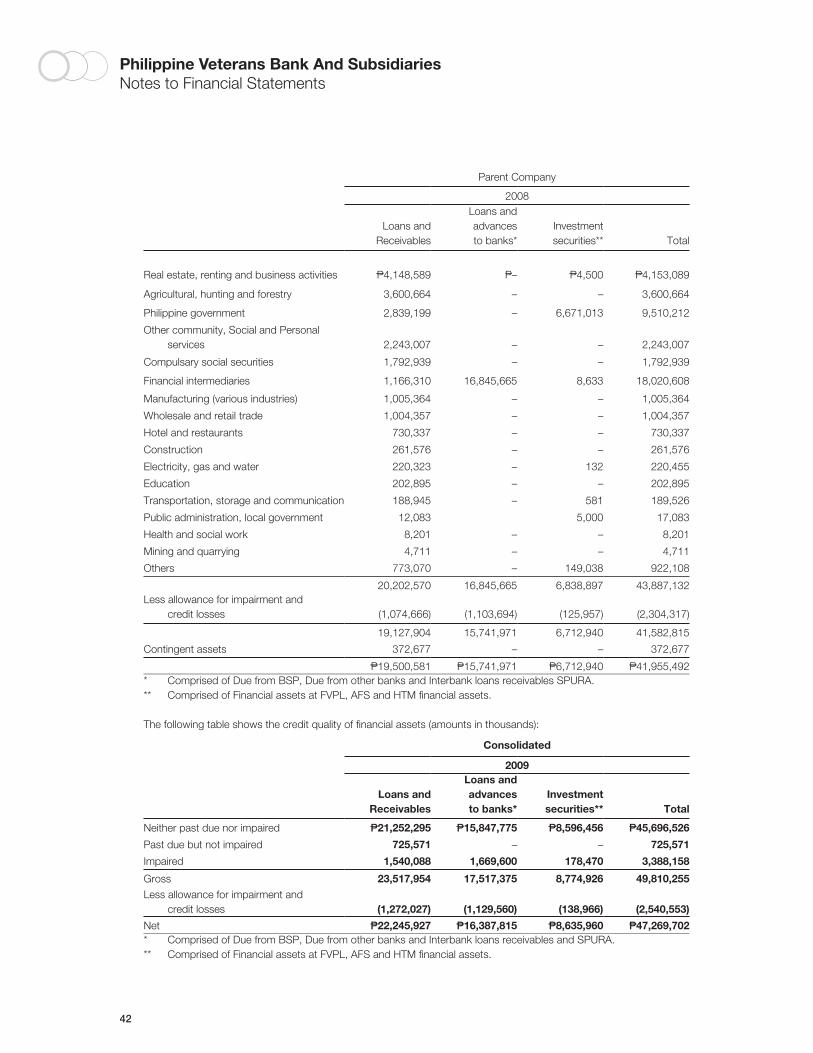
42
Philippine Veterans Bank And SubsidiariesNotes to Financial Statements
Parent Company
2008
Loans andReceivables
Loans andadvancesto banks*
Investmentsecurities** Total
Real estate, renting and business activities P4,148,589 P– P4,500 P4,153,089
Agricultural, hunting and forestry 3,600,664 – – 3,600,664
Philippine government 2,839,199 – 6,671,013 9,510,212
Other community, Social and Personal services 2,243,007 – – 2,243,007
Compulsary social securities 1,792,939 – – 1,792,939
Financial intermediaries 1,166,310 16,845,665 8,633 18,020,608
Manufacturing (various industries) 1,005,364 – – 1,005,364
Wholesale and retail trade 1,004,357 – – 1,004,357
Hotel and restaurants 730,337 – – 730,337
Construction 261,576 – – 261,576
Electricity, gas and water 220,323 – 132 220,455
Education 202,895 – – 202,895
Transportation, storage and communication 188,945 – 581 189,526
Public administration, local government 12,083 5,000 17,083
Health and social work 8,201 – – 8,201
Mining and quarrying 4,711 – – 4,711
Others 773,070 – 149,038 922,108
20,202,570 16,845,665 6,838,897 43,887,132Less allowance for impairment and
credit losses (1,074,666) (1,103,694) (125,957) (2,304,317)
19,127,904 15,741,971 6,712,940 41,582,815
Contingent assets 372,677 – – 372,677
P19,500,581 P15,741,971 P6,712,940 P41,955,492* Comprised of Due from BSP, Due from other banks and Interbank loans receivables SPURA.** Comprised of Financial assets at FVPL, AFS and HTM financial assets.
The following table shows the credit quality of financial assets (amounts in thousands):
Consolidated
2009
Loans andReceivables
Loans andadvancesto banks*
Investmentsecurities** Total
Neither past due nor impaired P21,252,295 P15,847,775 P8,596,456 P45,696,526
Past due but not impaired 725,571 – – 725,571
Impaired 1,540,088 1,669,600 178,470 3,388,158
Gross 23,517,954 17,517,375 8,774,926 49,810,255Less allowance for impairment and
credit losses (1,272,027) (1,129,560) (138,966) (2,540,553)
Net P22,245,927 P16,387,815 P8,635,960 P47,269,702* Comprised of Due from BSP, Due from other banks and Interbank loans receivables and SPURA.** Comprised of Financial assets at FVPL, AFS and HTM financial assets.
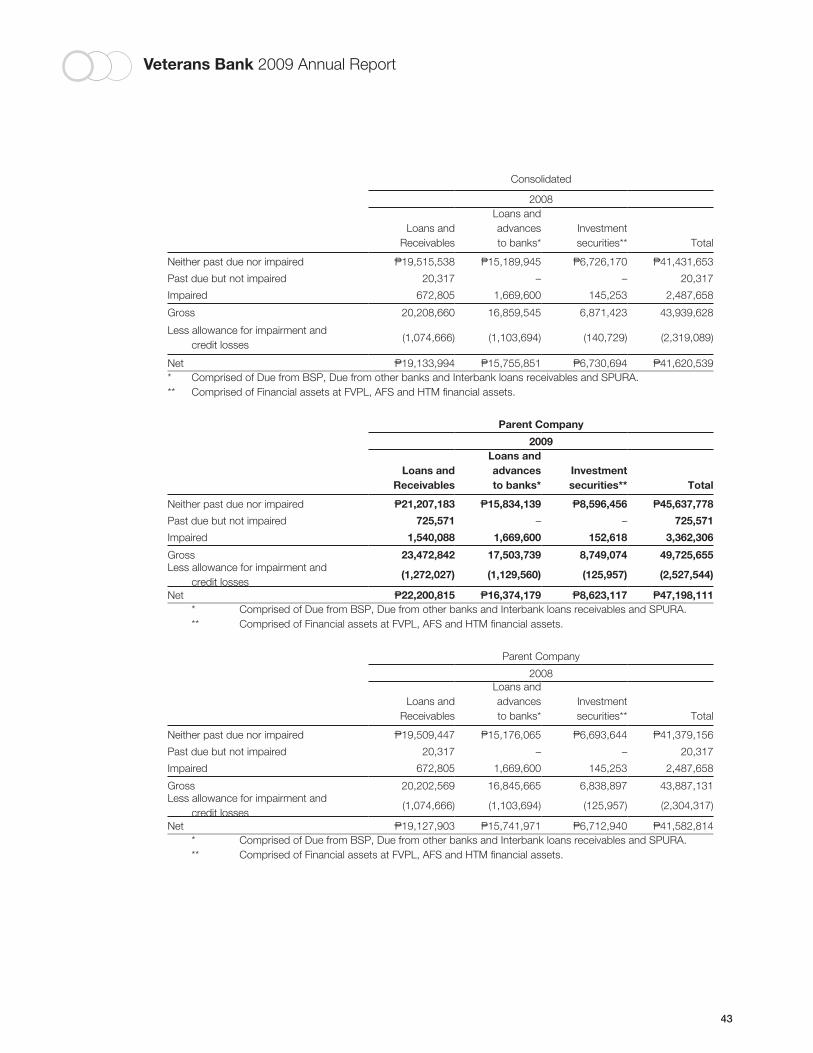
Veterans Bank 2009 Annual Report
43
Consolidated
2008
Loans andReceivables
Loans andadvancesto banks*
Investmentsecurities** Total
Neither past due nor impaired P19,515,538 P15,189,945 P6,726,170 P41,431,653
Past due but not impaired 20,317 – – 20,317
Impaired 672,805 1,669,600 145,253 2,487,658
Gross 20,208,660 16,859,545 6,871,423 43,939,628
Less allowance for impairment and credit losses
(1,074,666) (1,103,694) (140,729) (2,319,089)
Net P19,133,994 P15,755,851 P6,730,694 P41,620,539* Comprised of Due from BSP, Due from other banks and Interbank loans receivables and SPURA.** Comprised of Financial assets at FVPL, AFS and HTM financial assets.
Parent Company
2009
Loans andReceivables
Loans andadvancesto banks*
Investmentsecurities** Total
Neither past due nor impaired P21,207,183 P15,834,139 P8,596,456 P45,637,778
Past due but not impaired 725,571 – – 725,571
Impaired 1,540,088 1,669,600 152,618 3,362,306
Gross 23,472,842 17,503,739 8,749,074 49,725,655Less allowance for impairment and
credit losses(1,272,027) (1,129,560) (125,957) (2,527,544)
Net P22,200,815 P16,374,179 P8,623,117 P47,198,111* Comprised of Due from BSP, Due from other banks and Interbank loans receivables and SPURA.** Comprised of Financial assets at FVPL, AFS and HTM financial assets.
Parent Company
2008
Loans andReceivables
Loans andadvancesto banks*
Investmentsecurities** Total
Neither past due nor impaired P19,509,447 P15,176,065 P6,693,644 P41,379,156
Past due but not impaired 20,317 – – 20,317
Impaired 672,805 1,669,600 145,253 2,487,658
Gross 20,202,569 16,845,665 6,838,897 43,887,131Less allowance for impairment and
credit losses(1,074,666) (1,103,694) (125,957) (2,304,317)
Net P19,127,903 P15,741,971 P6,712,940 P41,582,814* Comprised of Due from BSP, Due from other banks and Interbank loans receivables and SPURA.** Comprised of Financial assets at FVPL, AFS and HTM financial assets.
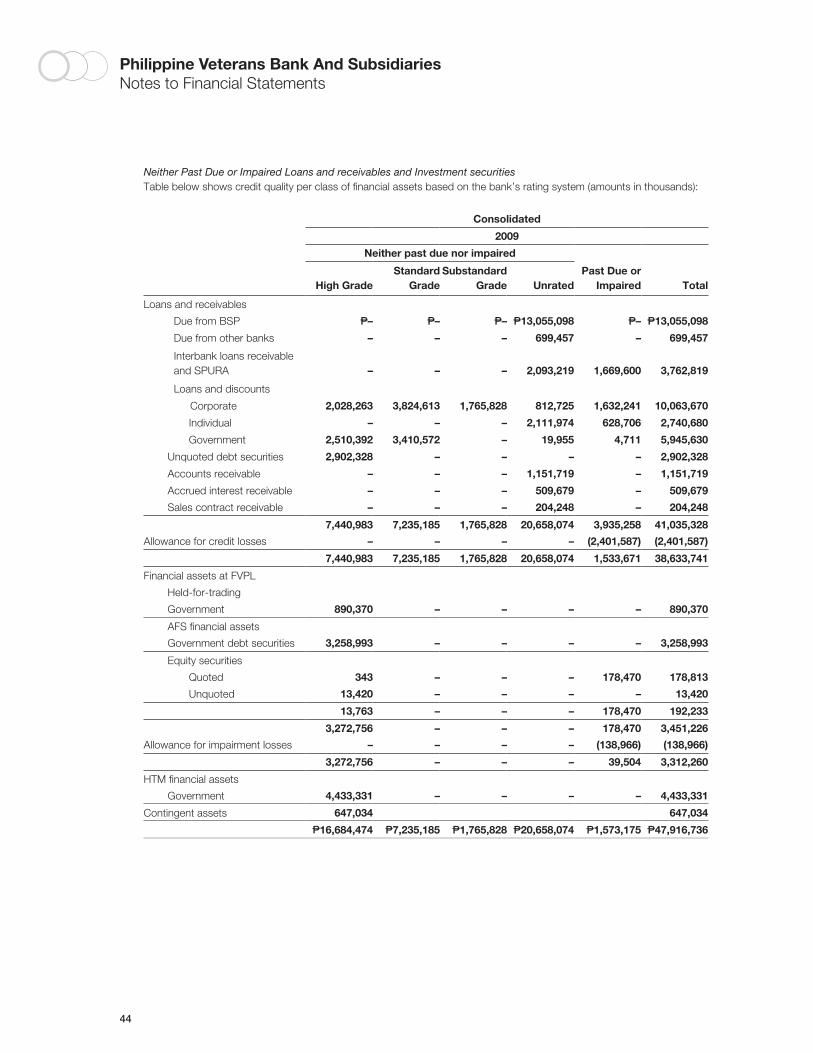
44
Philippine Veterans Bank And SubsidiariesNotes to Financial Statements
Neither Past Due or Impaired Loans and receivables and Investment securitiesTable below shows credit quality per class of financial assets based on the bank’s rating system (amounts in thousands):
Consolidated
2009
Neither past due nor impaired
High GradeStandard
GradeSubstandard
Grade UnratedPast Due or
Impaired Total
Loans and receivables
Due from BSP P– P– P– P13,055,098 P– P13,055,098
Due from other banks – – – 699,457 – 699,457
Interbank loans receivable and SPURA – – – 2,093,219 1,669,600 3,762,819
Loans and discounts
Corporate 2,028,263 3,824,613 1,765,828 812,725 1,632,241 10,063,670
Individual – – – 2,111,974 628,706 2,740,680
Government 2,510,392 3,410,572 – 19,955 4,711 5,945,630
Unquoted debt securities 2,902,328 – – – – 2,902,328
Accounts receivable – – – 1,151,719 – 1,151,719
Accrued interest receivable – – – 509,679 – 509,679
Sales contract receivable – – – 204,248 – 204,248
7,440,983 7,235,185 1,765,828 20,658,074 3,935,258 41,035,328
Allowance for credit losses – – – – (2,401,587) (2,401,587)
7,440,983 7,235,185 1,765,828 20,658,074 1,533,671 38,633,741
Financial assets at FVPL
Held-for-trading
Government 890,370 – – – – 890,370
AFS financial assets
Government debt securities 3,258,993 – – – – 3,258,993
Equity securities
Quoted 343 – – – 178,470 178,813
Unquoted 13,420 – – – – 13,420
13,763 – – – 178,470 192,233
3,272,756 – – – 178,470 3,451,226
Allowance for impairment losses – – – – (138,966) (138,966)
3,272,756 – – – 39,504 3,312,260
HTM financial assets
Government 4,433,331 – – – – 4,433,331
Contingent assets 647,034 647,034
P16,684,474 P7,235,185 P1,765,828 P20,658,074 P1,573,175 P47,916,736
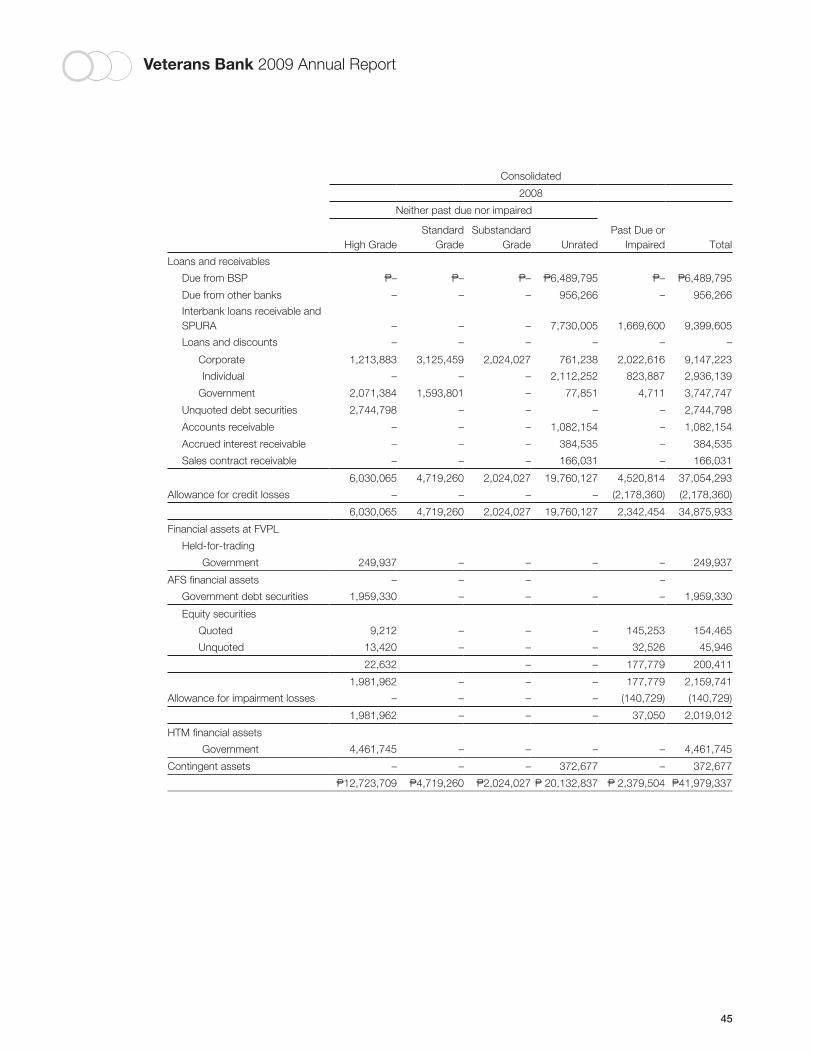
Veterans Bank 2009 Annual Report
45
Consolidated
2008
Neither past due nor impaired
High GradeStandard
GradeSubstandard
Grade UnratedPast Due or
Impaired Total
Loans and receivables
Due from BSP P– P– P– P6,489,795 P– P6,489,795
Due from other banks – – – 956,266 – 956,266
Interbank loans receivable and SPURA – – – 7,730,005 1,669,600 9,399,605
Loans and discounts – – – – – –
Corporate 1,213,883 3,125,459 2,024,027 761,238 2,022,616 9,147,223
Individual – – – 2,112,252 823,887 2,936,139
Government 2,071,384 1,593,801 – 77,851 4,711 3,747,747
Unquoted debt securities 2,744,798 – – – – 2,744,798
Accounts receivable – – – 1,082,154 – 1,082,154
Accrued interest receivable – – – 384,535 – 384,535
Sales contract receivable – – – 166,031 – 166,031
6,030,065 4,719,260 2,024,027 19,760,127 4,520,814 37,054,293
Allowance for credit losses – – – – (2,178,360) (2,178,360)
6,030,065 4,719,260 2,024,027 19,760,127 2,342,454 34,875,933
Financial assets at FVPL
Held-for-trading
Government 249,937 – – – – 249,937
AFS financial assets – – – –
Government debt securities 1,959,330 – – – – 1,959,330
Equity securities
Quoted 9,212 – – – 145,253 154,465
Unquoted 13,420 – – – 32,526 45,946
22,632 – – 177,779 200,411
1,981,962 – – – 177,779 2,159,741
Allowance for impairment losses – – – – (140,729) (140,729)
1,981,962 – – – 37,050 2,019,012
HTM financial assets
Government 4,461,745 – – – – 4,461,745
Contingent assets – – – 372,677 – 372,677
P12,723,709 P4,719,260 P2,024,027 P 20,132,837 P 2,379,504 P41,979,337
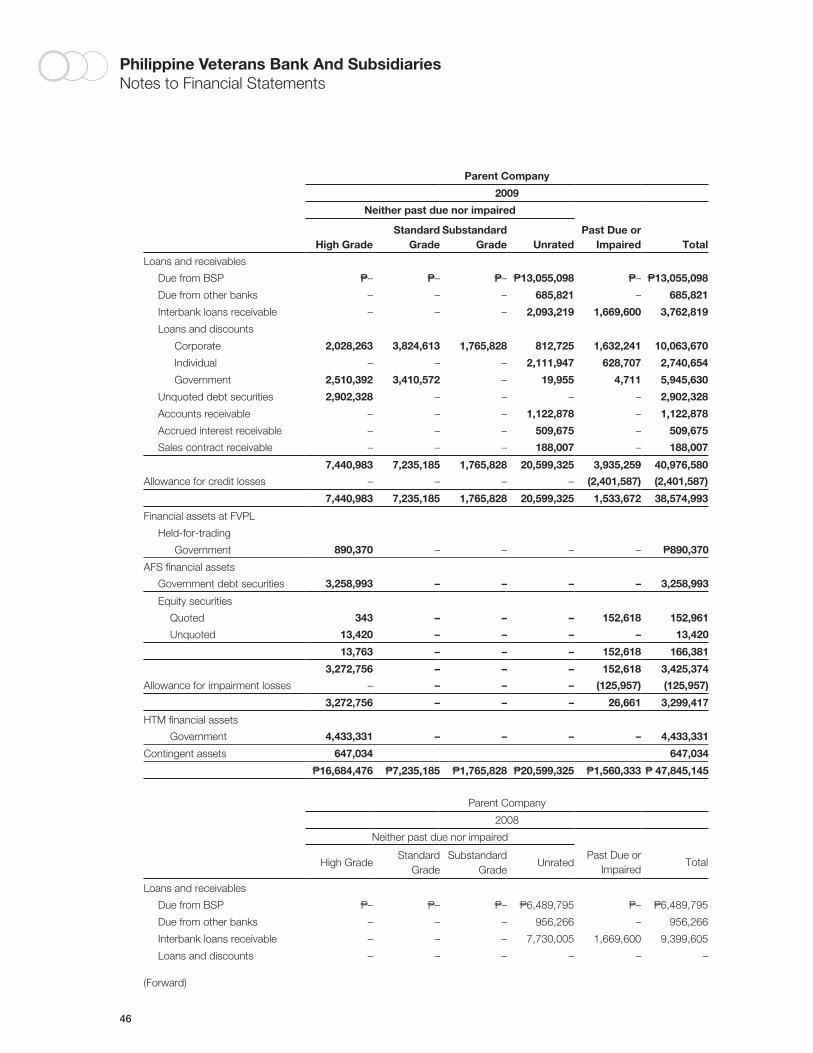
46
Philippine Veterans Bank And SubsidiariesNotes to Financial Statements
Parent Company
2009
Neither past due nor impaired
High GradeStandard
GradeSubstandard
Grade UnratedPast Due or
Impaired Total
Loans and receivables
Due from BSP P– P– P– P13,055,098 P– P13,055,098
Due from other banks – – – 685,821 – 685,821
Interbank loans receivable – – – 2,093,219 1,669,600 3,762,819
Loans and discounts
Corporate 2,028,263 3,824,613 1,765,828 812,725 1,632,241 10,063,670
Individual – – – 2,111,947 628,707 2,740,654
Government 2,510,392 3,410,572 – 19,955 4,711 5,945,630
Unquoted debt securities 2,902,328 – – – – 2,902,328
Accounts receivable – – – 1,122,878 – 1,122,878
Accrued interest receivable – – – 509,675 – 509,675
Sales contract receivable – – – 188,007 – 188,007
7,440,983 7,235,185 1,765,828 20,599,325 3,935,259 40,976,580
Allowance for credit losses – – – – (2,401,587) (2,401,587)
7,440,983 7,235,185 1,765,828 20,599,325 1,533,672 38,574,993
Financial assets at FVPL
Held-for-trading
Government 890,370 – – – – P890,370
AFS financial assets
Government debt securities 3,258,993 – – – – 3,258,993
Equity securities
Quoted 343 – – – 152,618 152,961
Unquoted 13,420 – – – – 13,420
13,763 – – – 152,618 166,381
3,272,756 – – – 152,618 3,425,374
Allowance for impairment losses – – – – (125,957) (125,957)
3,272,756 – – – 26,661 3,299,417
HTM financial assets
Government 4,433,331 – – – – 4,433,331
Contingent assets 647,034 647,034
P16,684,476 P7,235,185 P1,765,828 P20,599,325 P1,560,333 P 47,845,145
Parent Company
2008
Neither past due nor impaired
High GradeStandard
GradeSubstandard
GradeUnrated
Past Due orImpaired
Total
Loans and receivables
Due from BSP P– P– P– P6,489,795 P– P6,489,795
Due from other banks – – – 956,266 – 956,266
Interbank loans receivable – – – 7,730,005 1,669,600 9,399,605
Loans and discounts – – – – – –
(Forward)
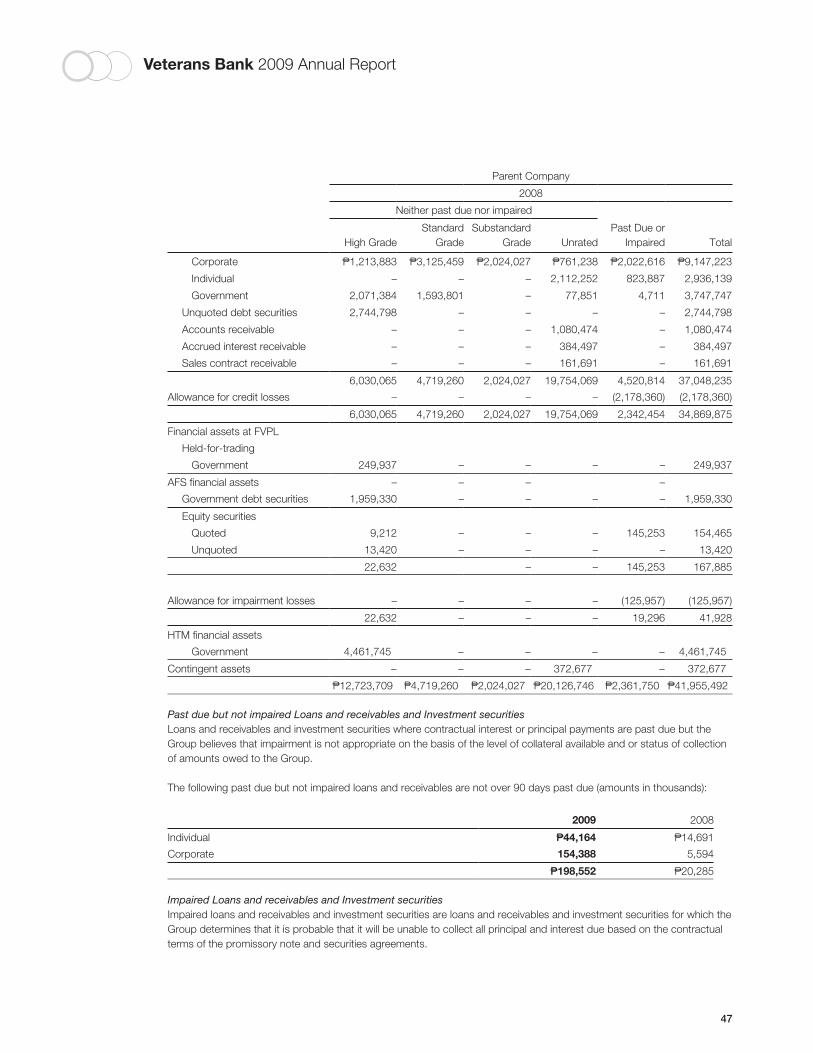
Veterans Bank 2009 Annual Report
47
Parent Company
2008
Neither past due nor impaired
High GradeStandard
GradeSubstandard
Grade UnratedPast Due or
Impaired Total
Corporate P1,213,883 P3,125,459 P2,024,027 P761,238 P2,022,616 P9,147,223
Individual – – – 2,112,252 823,887 2,936,139
Government 2,071,384 1,593,801 – 77,851 4,711 3,747,747
Unquoted debt securities 2,744,798 – – – – 2,744,798
Accounts receivable – – – 1,080,474 – 1,080,474
Accrued interest receivable – – – 384,497 – 384,497
Sales contract receivable – – – 161,691 – 161,691
6,030,065 4,719,260 2,024,027 19,754,069 4,520,814 37,048,235
Allowance for credit losses – – – – (2,178,360) (2,178,360)
6,030,065 4,719,260 2,024,027 19,754,069 2,342,454 34,869,875
Financial assets at FVPL
Held-for-trading
Government 249,937 – – – – 249,937
AFS financial assets – – – –
Government debt securities 1,959,330 – – – – 1,959,330
Equity securities
Quoted 9,212 – – – 145,253 154,465
Unquoted 13,420 – – – – 13,420
22,632 – – 145,253 167,885
Allowance for impairment losses – – – – (125,957) (125,957)
22,632 – – – 19,296 41,928
HTM financial assets
Government 4,461,745 – – – – 4,461,745
Contingent assets – – – 372,677 – 372,677
P12,723,709 P4,719,260 P2,024,027 P20,126,746 P2,361,750 P41,955,492
Past due but not impaired Loans and receivables and Investment securitiesLoans and receivables and investment securities where contractual interest or principal payments are past due but the Group believes that impairment is not appropriate on the basis of the level of collateral available and or status of collection of amounts owed to the Group.
The following past due but not impaired loans and receivables are not over 90 days past due (amounts in thousands):
2009 2008
Individual P44,164 P14,691
Corporate 154,388 5,594
P198,552 P20,285
Impaired Loans and receivables and Investment securitiesImpaired loans and receivables and investment securities are loans and receivables and investment securities for which the Group determines that it is probable that it will be unable to collect all principal and interest due based on the contractual terms of the promissory note and securities agreements.
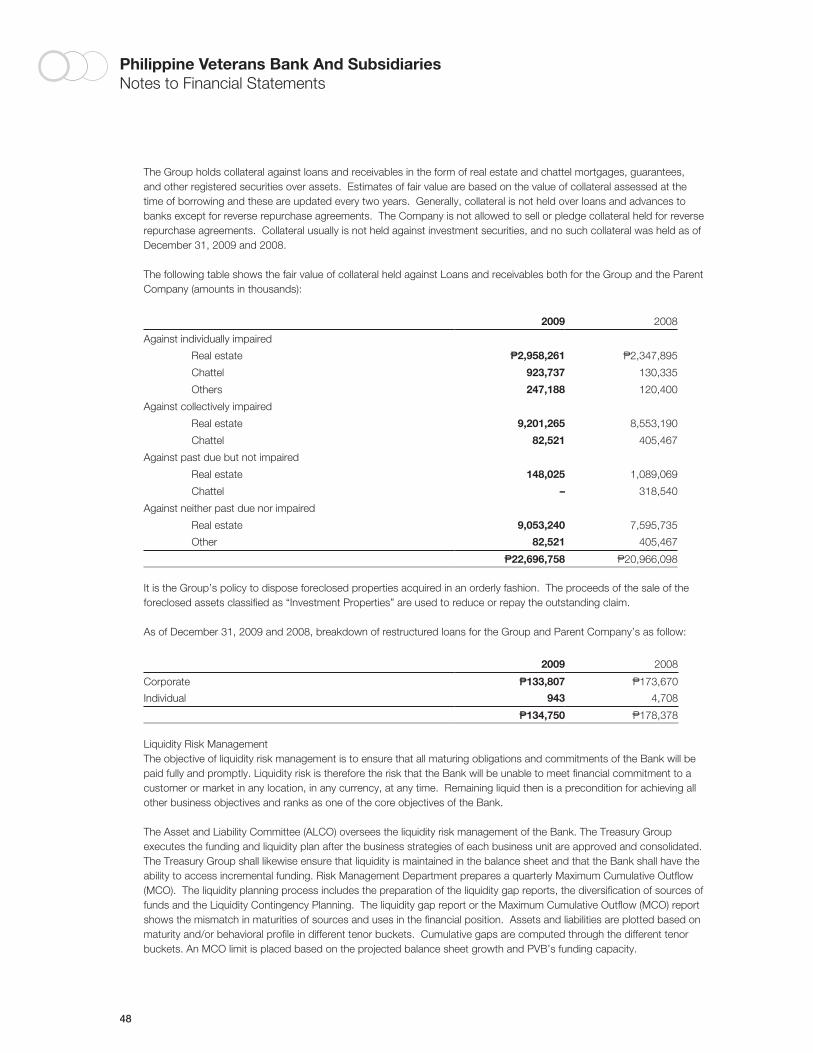
48
Philippine Veterans Bank And SubsidiariesNotes to Financial Statements
The Group holds collateral against loans and receivables in the form of real estate and chattel mortgages, guarantees, and other registered securities over assets. Estimates of fair value are based on the value of collateral assessed at the time of borrowing and these are updated every two years. Generally, collateral is not held over loans and advances to banks except for reverse repurchase agreements. The Company is not allowed to sell or pledge collateral held for reverse repurchase agreements. Collateral usually is not held against investment securities, and no such collateral was held as of December 31, 2009 and 2008.
The following table shows the fair value of collateral held against Loans and receivables both for the Group and the Parent Company (amounts in thousands):
2009 2008
Against individually impaired
Real estate P2,958,261 P2,347,895
Chattel 923,737 130,335
Others 247,188 120,400
Against collectively impaired
Real estate 9,201,265 8,553,190
Chattel 82,521 405,467
Against past due but not impaired
Real estate 148,025 1,089,069
Chattel – 318,540
Against neither past due nor impaired
Real estate 9,053,240 7,595,735
Other 82,521 405,467
P22,696,758 P20,966,098
It is the Group’s policy to dispose foreclosed properties acquired in an orderly fashion. The proceeds of the sale of the foreclosed assets classified as “Investment Properties” are used to reduce or repay the outstanding claim.
As of December 31, 2009 and 2008, breakdown of restructured loans for the Group and Parent Company’s as follow:
2009 2008
Corporate P133,807 P173,670
Individual 943 4,708
P134,750 P178,378
Liquidity Risk ManagementThe objective of liquidity risk management is to ensure that all maturing obligations and commitments of the Bank will be paid fully and promptly. Liquidity risk is therefore the risk that the Bank will be unable to meet financial commitment to a customer or market in any location, in any currency, at any time. Remaining liquid then is a precondition for achieving all other business objectives and ranks as one of the core objectives of the Bank.
The Asset and Liability Committee (ALCO) oversees the liquidity risk management of the Bank. The Treasury Group executes the funding and liquidity plan after the business strategies of each business unit are approved and consolidated. The Treasury Group shall likewise ensure that liquidity is maintained in the balance sheet and that the Bank shall have the ability to access incremental funding. Risk Management Department prepares a quarterly Maximum Cumulative Outflow (MCO). The liquidity planning process includes the preparation of the liquidity gap reports, the diversification of sources of funds and the Liquidity Contingency Planning. The liquidity gap report or the Maximum Cumulative Outflow (MCO) report shows the mismatch in maturities of sources and uses in the financial position. Assets and liabilities are plotted based on maturity and/or behavioral profile in different tenor buckets. Cumulative gaps are computed through the different tenor buckets. An MCO limit is placed based on the projected balance sheet growth and PVB’s funding capacity.
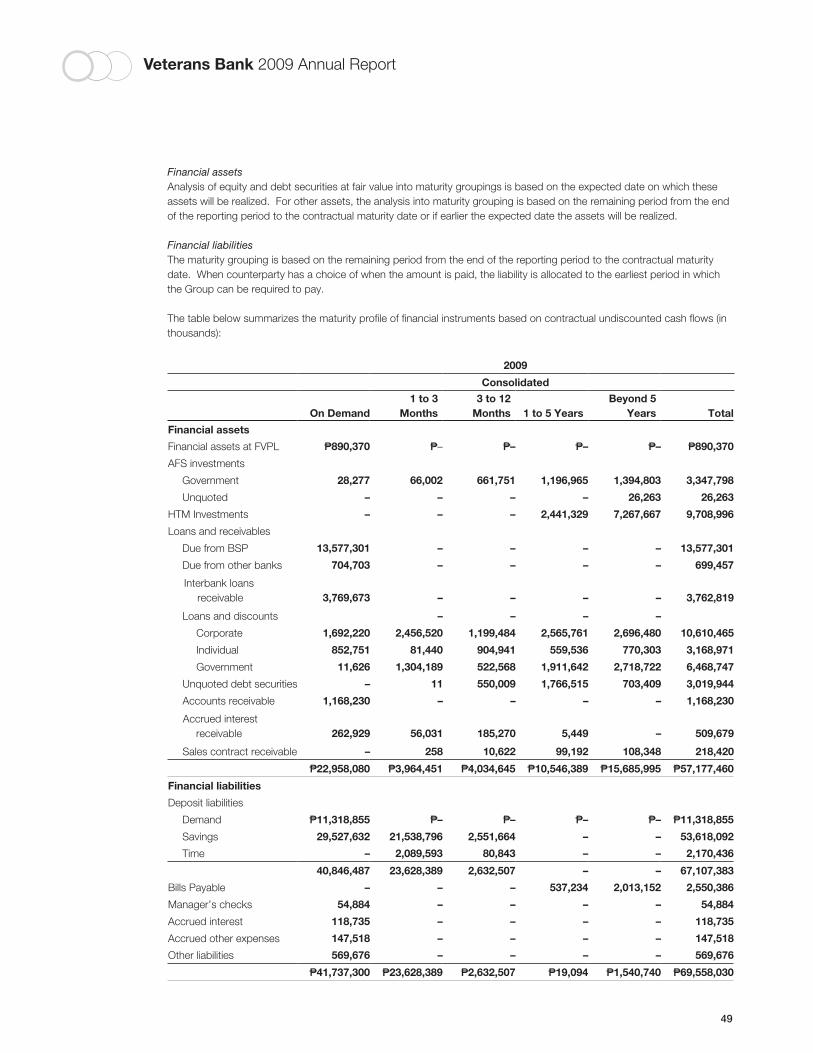
Veterans Bank 2009 Annual Report
49
Financial assetsAnalysis of equity and debt securities at fair value into maturity groupings is based on the expected date on which these assets will be realized. For other assets, the analysis into maturity grouping is based on the remaining period from the end of the reporting period to the contractual maturity date or if earlier the expected date the assets will be realized.
Financial liabilitiesThe maturity grouping is based on the remaining period from the end of the reporting period to the contractual maturity date. When counterparty has a choice of when the amount is paid, the liability is allocated to the earliest period in which the Group can be required to pay.
The table below summarizes the maturity profile of financial instruments based on contractual undiscounted cash flows (in thousands):
2009
Consolidated
On Demand1 to 3
Months3 to 12
Months 1 to 5 YearsBeyond 5
Years Total
Financial assets
Financial assets at FVPL P890,370 P– P– P– P– P890,370
AFS investments
Government 28,277 66,002 661,751 1,196,965 1,394,803 3,347,798
Unquoted – – – – 26,263 26,263
HTM Investments – – – 2,441,329 7,267,667 9,708,996
Loans and receivables
Due from BSP 13,577,301 – – – – 13,577,301
Due from other banks 704,703 – – – – 699,457
Interbank loans receivable 3,769,673 – – – – 3,762,819
Loans and discounts – – – –
Corporate 1,692,220 2,456,520 1,199,484 2,565,761 2,696,480 10,610,465
Individual 852,751 81,440 904,941 559,536 770,303 3,168,971
Government 11,626 1,304,189 522,568 1,911,642 2,718,722 6,468,747
Unquoted debt securities – 11 550,009 1,766,515 703,409 3,019,944
Accounts receivable 1,168,230 – – – – 1,168,230
Accrued interest receivable 262,929 56,031 185,270 5,449 – 509,679
Sales contract receivable – 258 10,622 99,192 108,348 218,420
P22,958,080 P3,964,451 P4,034,645 P10,546,389 P15,685,995 P57,177,460
Financial liabilities
Deposit liabilities
Demand P11,318,855 P– P– P– P– P11,318,855
Savings 29,527,632 21,538,796 2,551,664 – – 53,618,092
Time – 2,089,593 80,843 – – 2,170,436
40,846,487 23,628,389 2,632,507 – – 67,107,383
Bills Payable – – – 537,234 2,013,152 2,550,386
Manager’s checks 54,884 – – – – 54,884
Accrued interest 118,735 – – – – 118,735
Accrued other expenses 147,518 – – – – 147,518
Other liabilities 569,676 – – – – 569,676
P41,737,300 P23,628,389 P2,632,507 P19,094 P1,540,740 P69,558,030
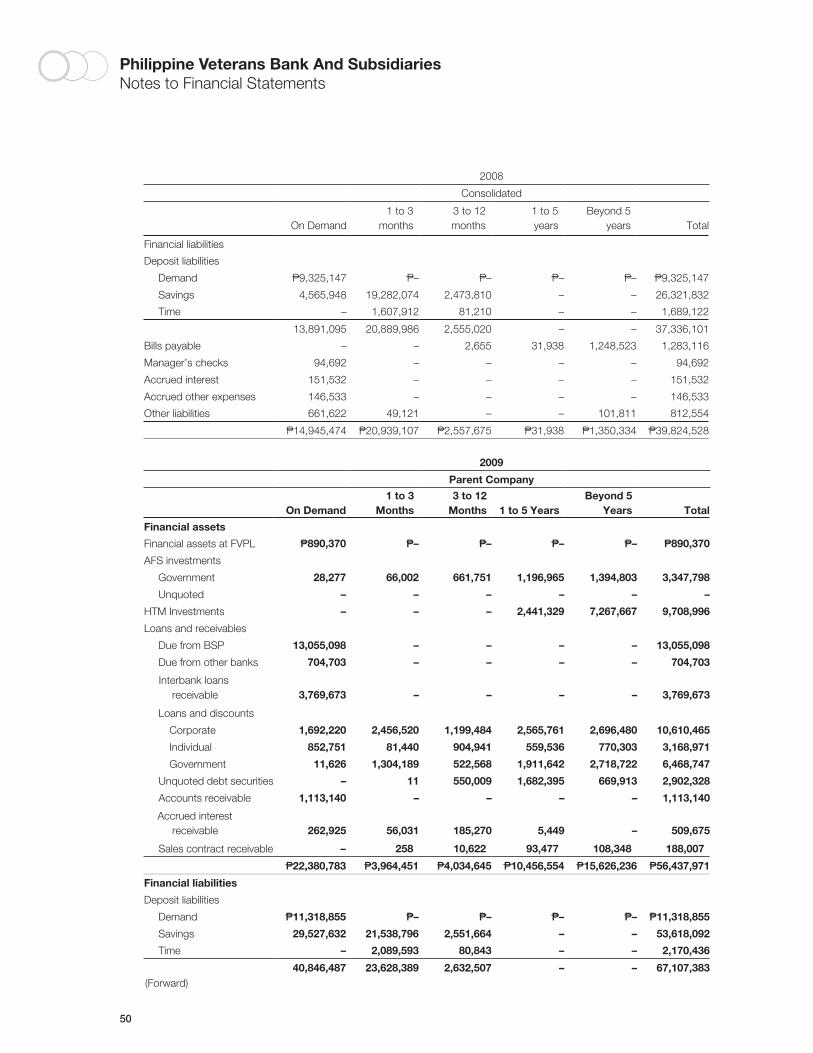
50
Philippine Veterans Bank And SubsidiariesNotes to Financial Statements
2008
Consolidated
On Demand1 to 3
months3 to 12months
1 to 5years
Beyond 5years Total
Financial liabilities
Deposit liabilities
Demand P9,325,147 P– P– P– P– P9,325,147
Savings 4,565,948 19,282,074 2,473,810 – – 26,321,832
Time – 1,607,912 81,210 – – 1,689,122
13,891,095 20,889,986 2,555,020 – – 37,336,101
Bills payable – – 2,655 31,938 1,248,523 1,283,116
Manager’s checks 94,692 – – – – 94,692
Accrued interest 151,532 – – – – 151,532
Accrued other expenses 146,533 – – – – 146,533
Other liabilities 661,622 49,121 – – 101,811 812,554
P14,945,474 P20,939,107 P2,557,675 P31,938 P1,350,334 P39,824,528
2009
Parent Company
On Demand1 to 3
Months3 to 12
Months 1 to 5 YearsBeyond 5
Years Total
Financial assets
Financial assets at FVPL P890,370 P– P– P– P– P890,370
AFS investments
Government 28,277 66,002 661,751 1,196,965 1,394,803 3,347,798
Unquoted – – – – – –
HTM Investments – – – 2,441,329 7,267,667 9,708,996
Loans and receivables
Due from BSP 13,055,098 – – – – 13,055,098
Due from other banks 704,703 – – – – 704,703
Interbank loans receivable 3,769,673 – – – – 3,769,673
Loans and discounts
Corporate 1,692,220 2,456,520 1,199,484 2,565,761 2,696,480 10,610,465
Individual 852,751 81,440 904,941 559,536 770,303 3,168,971
Government 11,626 1,304,189 522,568 1,911,642 2,718,722 6,468,747
Unquoted debt securities – 11 550,009 1,682,395 669,913 2,902,328
Accounts receivable 1,113,140 – – – – 1,113,140
Accrued interest receivable 262,925 56,031 185,270 5,449 – 509,675
Sales contract receivable – 258 10,622 93,477 108,348 188,007
P22,380,783 P3,964,451 P4,034,645 P10,456,554 P15,626,236 P56,437,971
Financial liabilities
Deposit liabilities
Demand P11,318,855 P– P– P– P– P11,318,855
Savings 29,527,632 21,538,796 2,551,664 – – 53,618,092
Time – 2,089,593 80,843 – – 2,170,436
40,846,487 23,628,389 2,632,507 – – 67,107,383(Forward)
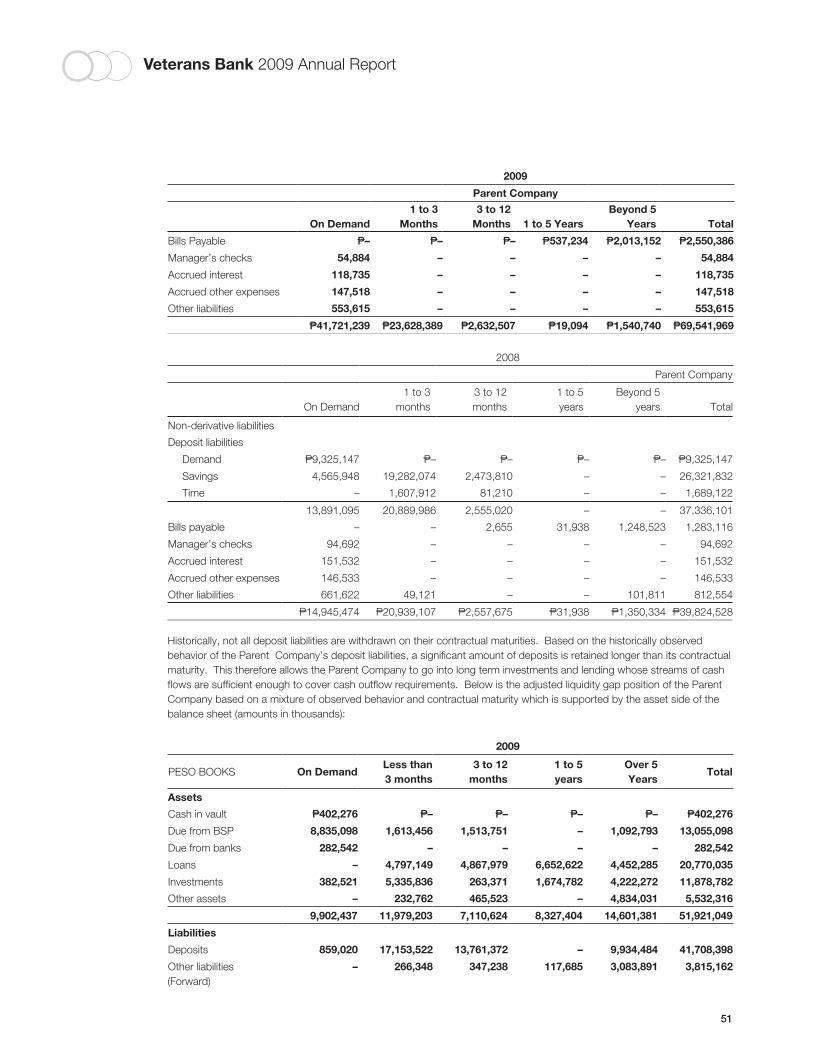
Veterans Bank 2009 Annual Report
51
2009
Parent Company
On Demand1 to 3
Months3 to 12
Months 1 to 5 YearsBeyond 5
Years Total
Bills Payable P– P– P– P537,234 P2,013,152 P2,550,386
Manager’s checks 54,884 – – – – 54,884
Accrued interest 118,735 – – – – 118,735
Accrued other expenses 147,518 – – – – 147,518
Other liabilities 553,615 – – – – 553,615
P41,721,239 P23,628,389 P2,632,507 P19,094 P1,540,740 P69,541,969
2008
Parent Company
On Demand1 to 3
months3 to 12months
1 to 5years
Beyond 5years Total
Non-derivative liabilities
Deposit liabilities
Demand P9,325,147 P– P– P– P– P9,325,147
Savings 4,565,948 19,282,074 2,473,810 – – 26,321,832
Time – 1,607,912 81,210 – – 1,689,122
13,891,095 20,889,986 2,555,020 – – 37,336,101
Bills payable – – 2,655 31,938 1,248,523 1,283,116
Manager’s checks 94,692 – – – – 94,692
Accrued interest 151,532 – – – – 151,532
Accrued other expenses 146,533 – – – – 146,533
Other liabilities 661,622 49,121 – – 101,811 812,554
P14,945,474 P20,939,107 P2,557,675 P31,938 P1,350,334 P39,824,528
Historically, not all deposit liabilities are withdrawn on their contractual maturities. Based on the historically observed behavior of the Parent Company’s deposit liabilities, a significant amount of deposits is retained longer than its contractual maturity. This therefore allows the Parent Company to go into long term investments and lending whose streams of cash flows are sufficient enough to cover cash outflow requirements. Below is the adjusted liquidity gap position of the Parent Company based on a mixture of observed behavior and contractual maturity which is supported by the asset side of the balance sheet (amounts in thousands):
2009
PESO BOOKS On DemandLess than3 months
3 to 12months
1 to 5 years
Over 5Years
Total
Assets
Cash in vault P402,276 P– P– P– P– P402,276
Due from BSP 8,835,098 1,613,456 1,513,751 – 1,092,793 13,055,098
Due from banks 282,542 – – – – 282,542
Loans – 4,797,149 4,867,979 6,652,622 4,452,285 20,770,035
Investments 382,521 5,335,836 263,371 1,674,782 4,222,272 11,878,782
Other assets – 232,762 465,523 – 4,834,031 5,532,316
9,902,437 11,979,203 7,110,624 8,327,404 14,601,381 51,921,049
Liabilities
Deposits 859,020 17,153,522 13,761,372 – 9,934,484 41,708,398
Other liabilities – 266,348 347,238 117,685 3,083,891 3,815,162(Forward)
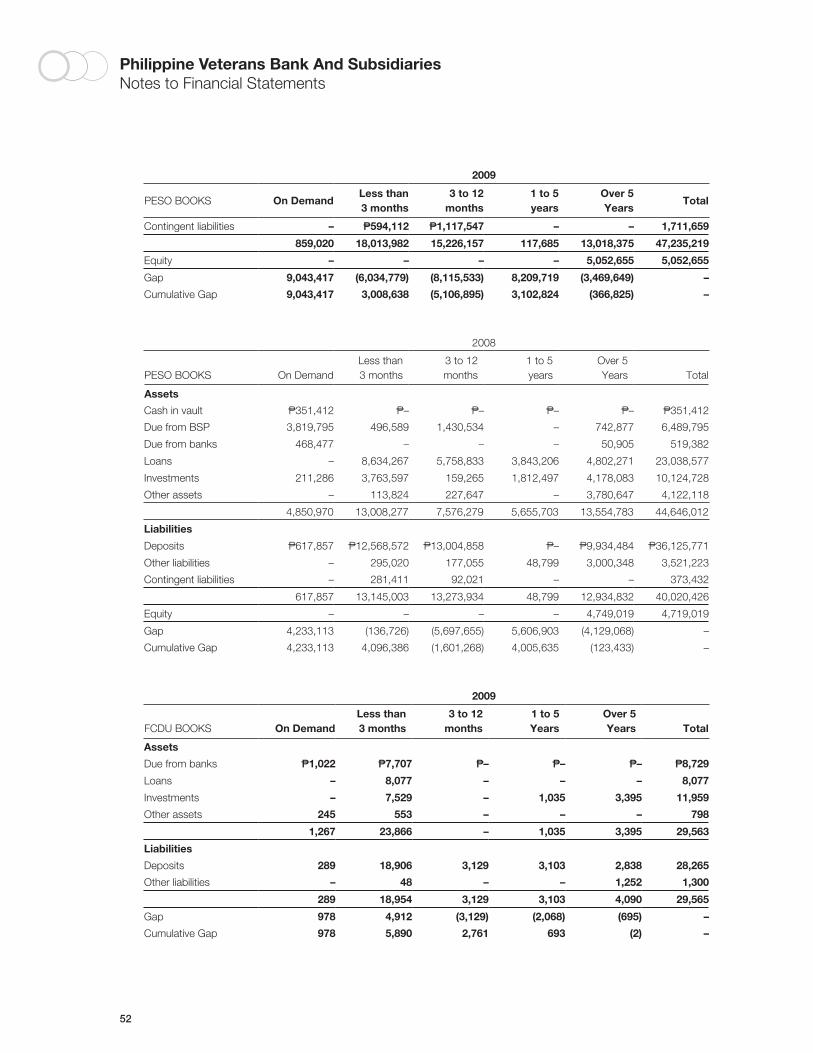
52
Philippine Veterans Bank And SubsidiariesNotes to Financial Statements
2009
PESO BOOKS On DemandLess than3 months
3 to 12months
1 to 5 years
Over 5Years
Total
Contingent liabilities – P594,112 P1,117,547 – – 1,711,659
859,020 18,013,982 15,226,157 117,685 13,018,375 47,235,219
Equity – – – – 5,052,655 5,052,655
Gap 9,043,417 (6,034,779) (8,115,533) 8,209,719 (3,469,649) –
Cumulative Gap 9,043,417 3,008,638 (5,106,895) 3,102,824 (366,825) –
2008
PESO BOOKS On DemandLess than3 months
3 to 12months
1 to 5 years
Over 5Years Total
Assets
Cash in vault P351,412 P– P– P– P– P351,412
Due from BSP 3,819,795 496,589 1,430,534 – 742,877 6,489,795
Due from banks 468,477 – – – 50,905 519,382
Loans – 8,634,267 5,758,833 3,843,206 4,802,271 23,038,577
Investments 211,286 3,763,597 159,265 1,812,497 4,178,083 10,124,728
Other assets – 113,824 227,647 – 3,780,647 4,122,118
4,850,970 13,008,277 7,576,279 5,655,703 13,554,783 44,646,012
Liabilities
Deposits P617,857 P12,568,572 P13,004,858 P– P9,934,484 P36,125,771
Other liabilities – 295,020 177,055 48,799 3,000,348 3,521,223
Contingent liabilities – 281,411 92,021 – – 373,432
617,857 13,145,003 13,273,934 48,799 12,934,832 40,020,426
Equity – – – – 4,749,019 4,719,019
Gap 4,233,113 (136,726) (5,697,655) 5,606,903 (4,129,068) –
Cumulative Gap 4,233,113 4,096,386 (1,601,268) 4,005,635 (123,433) –
2009
FCDU BOOKS On DemandLess than3 months
3 to 12months
1 to 5 Years
Over 5Years Total
Assets
Due from banks P1,022 P7,707 P– P– P– P8,729
Loans – 8,077 – – – 8,077
Investments – 7,529 – 1,035 3,395 11,959
Other assets 245 553 – – – 798
1,267 23,866 – 1,035 3,395 29,563
Liabilities
Deposits 289 18,906 3,129 3,103 2,838 28,265
Other liabilities – 48 – – 1,252 1,300
289 18,954 3,129 3,103 4,090 29,565
Gap 978 4,912 (3,129) (2,068) (695) –
Cumulative Gap 978 5,890 2,761 693 (2) –
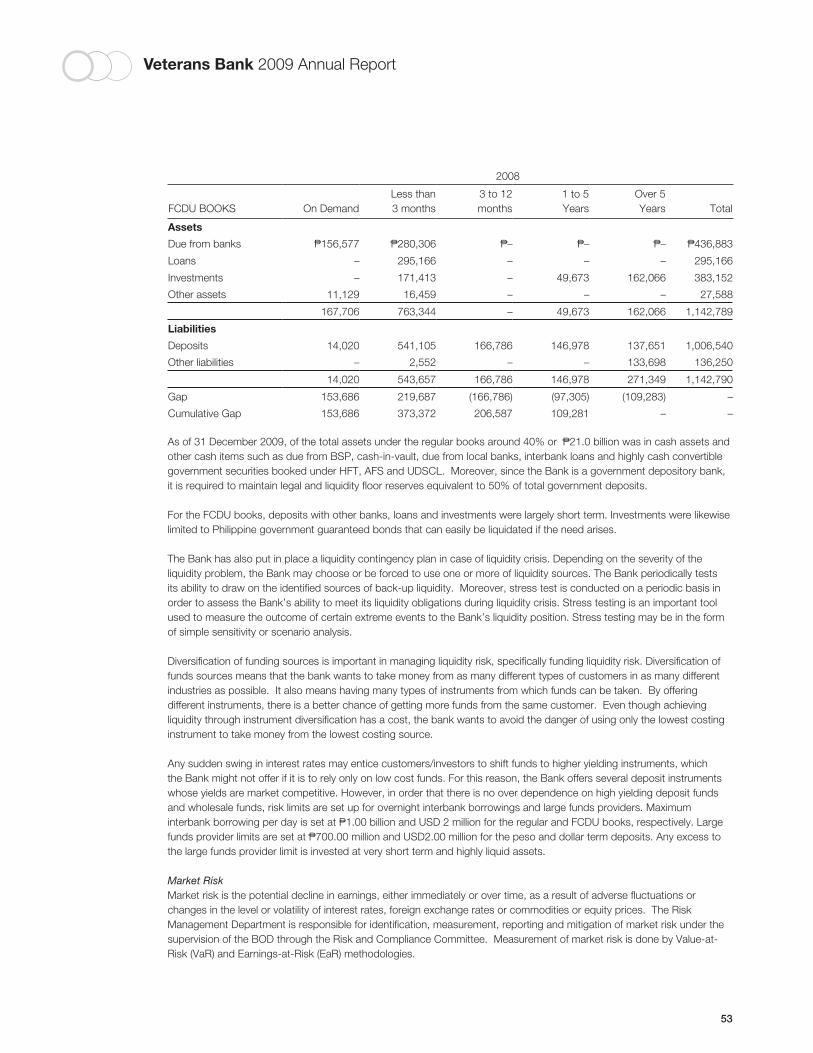
Veterans Bank 2009 Annual Report
53
2008
FCDU BOOKS On DemandLess than3 months
3 to 12months
1 to 5 Years
Over 5Years Total
Assets
Due from banks P156,577 P280,306 P– P– P– P436,883
Loans – 295,166 – – – 295,166
Investments – 171,413 – 49,673 162,066 383,152
Other assets 11,129 16,459 – – – 27,588
167,706 763,344 – 49,673 162,066 1,142,789
Liabilities
Deposits 14,020 541,105 166,786 146,978 137,651 1,006,540
Other liabilities – 2,552 – – 133,698 136,250
14,020 543,657 166,786 146,978 271,349 1,142,790
Gap 153,686 219,687 (166,786) (97,305) (109,283) –
Cumulative Gap 153,686 373,372 206,587 109,281 – –
As of 31 December 2009, of the total assets under the regular books around 40% or P21.0 billion was in cash assets and other cash items such as due from BSP, cash-in-vault, due from local banks, interbank loans and highly cash convertible government securities booked under HFT, AFS and UDSCL. Moreover, since the Bank is a government depository bank, it is required to maintain legal and liquidity floor reserves equivalent to 50% of total government deposits.
For the FCDU books, deposits with other banks, loans and investments were largely short term. Investments were likewise limited to Philippine government guaranteed bonds that can easily be liquidated if the need arises.
The Bank has also put in place a liquidity contingency plan in case of liquidity crisis. Depending on the severity of the liquidity problem, the Bank may choose or be forced to use one or more of liquidity sources. The Bank periodically tests its ability to draw on the identified sources of back-up liquidity. Moreover, stress test is conducted on a periodic basis in order to assess the Bank’s ability to meet its liquidity obligations during liquidity crisis. Stress testing is an important tool used to measure the outcome of certain extreme events to the Bank’s liquidity position. Stress testing may be in the form of simple sensitivity or scenario analysis.
Diversification of funding sources is important in managing liquidity risk, specifically funding liquidity risk. Diversification of funds sources means that the bank wants to take money from as many different types of customers in as many different industries as possible. It also means having many types of instruments from which funds can be taken. By offering different instruments, there is a better chance of getting more funds from the same customer. Even though achieving liquidity through instrument diversification has a cost, the bank wants to avoid the danger of using only the lowest costing instrument to take money from the lowest costing source.
Any sudden swing in interest rates may entice customers/investors to shift funds to higher yielding instruments, which the Bank might not offer if it is to rely only on low cost funds. For this reason, the Bank offers several deposit instruments whose yields are market competitive. However, in order that there is no over dependence on high yielding deposit funds and wholesale funds, risk limits are set up for overnight interbank borrowings and large funds providers. Maximum interbank borrowing per day is set at P1.00 billion and USD 2 million for the regular and FCDU books, respectively. Large funds provider limits are set at P700.00 million and USD2.00 million for the peso and dollar term deposits. Any excess to the large funds provider limit is invested at very short term and highly liquid assets.
Market RiskMarket risk is the potential decline in earnings, either immediately or over time, as a result of adverse fluctuations or changes in the level or volatility of interest rates, foreign exchange rates or commodities or equity prices. The Risk Management Department is responsible for identification, measurement, reporting and mitigation of market risk under the supervision of the BOD through the Risk and Compliance Committee. Measurement of market risk is done by Value-at-Risk (VaR) and Earnings-at-Risk (EaR) methodologies.
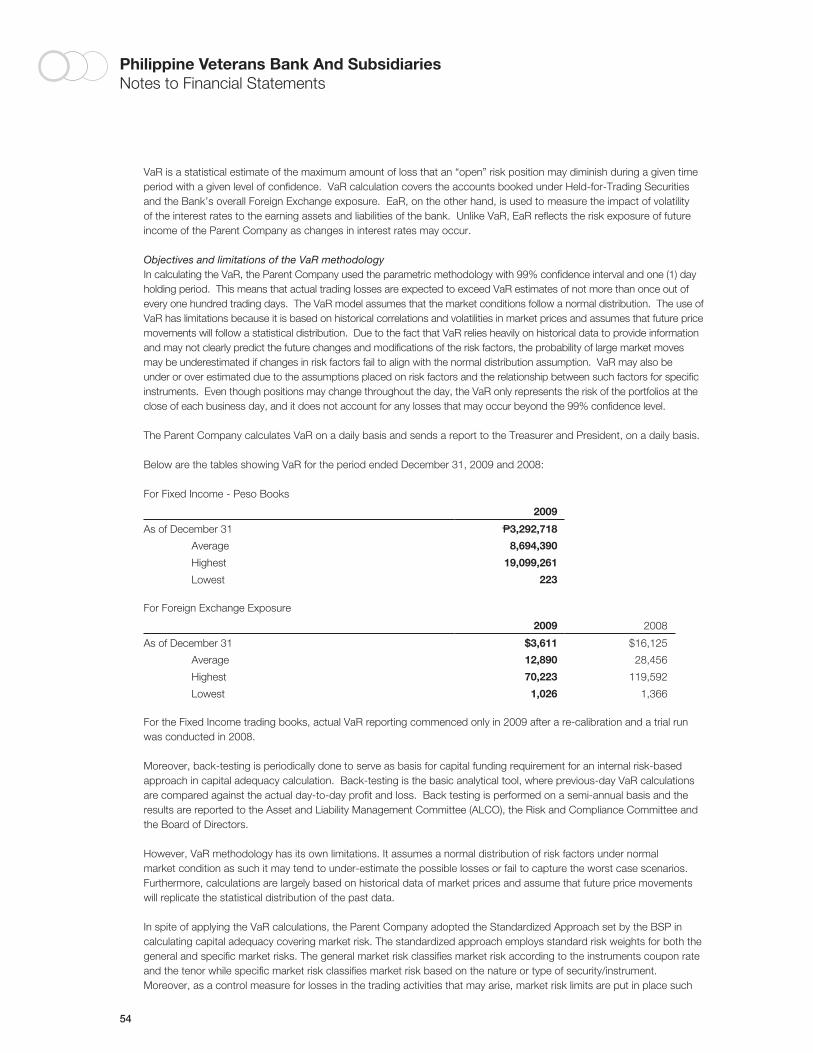
54
Philippine Veterans Bank And SubsidiariesNotes to Financial Statements
VaR is a statistical estimate of the maximum amount of loss that an “open” risk position may diminish during a given time period with a given level of confidence. VaR calculation covers the accounts booked under Held-for-Trading Securities and the Bank’s overall Foreign Exchange exposure. EaR, on the other hand, is used to measure the impact of volatility of the interest rates to the earning assets and liabilities of the bank. Unlike VaR, EaR reflects the risk exposure of future income of the Parent Company as changes in interest rates may occur.
Objectives and limitations of the VaR methodologyIn calculating the VaR, the Parent Company used the parametric methodology with 99% confidence interval and one (1) day holding period. This means that actual trading losses are expected to exceed VaR estimates of not more than once out of every one hundred trading days. The VaR model assumes that the market conditions follow a normal distribution. The use of VaR has limitations because it is based on historical correlations and volatilities in market prices and assumes that future price movements will follow a statistical distribution. Due to the fact that VaR relies heavily on historical data to provide information and may not clearly predict the future changes and modifications of the risk factors, the probability of large market moves may be underestimated if changes in risk factors fail to align with the normal distribution assumption. VaR may also be under or over estimated due to the assumptions placed on risk factors and the relationship between such factors for specific instruments. Even though positions may change throughout the day, the VaR only represents the risk of the portfolios at the close of each business day, and it does not account for any losses that may occur beyond the 99% confidence level.
The Parent Company calculates VaR on a daily basis and sends a report to the Treasurer and President, on a daily basis.
Below are the tables showing VaR for the period ended December 31, 2009 and 2008:
For Fixed Income - Peso Books
2009
As of December 31 P3,292,718
Average 8,694,390
Highest 19,099,261
Lowest 223
For Foreign Exchange Exposure
2009 2008
As of December 31 $3,611 $16,125
Average 12,890 28,456
Highest 70,223 119,592
Lowest 1,026 1,366
For the Fixed Income trading books, actual VaR reporting commenced only in 2009 after a re-calibration and a trial run was conducted in 2008.
Moreover, back-testing is periodically done to serve as basis for capital funding requirement for an internal risk-based approach in capital adequacy calculation. Back-testing is the basic analytical tool, where previous-day VaR calculations are compared against the actual day-to-day profit and loss. Back testing is performed on a semi-annual basis and the results are reported to the Asset and Liability Management Committee (ALCO), the Risk and Compliance Committee and the Board of Directors.
However, VaR methodology has its own limitations. It assumes a normal distribution of risk factors under normal market condition as such it may tend to under-estimate the possible losses or fail to capture the worst case scenarios. Furthermore, calculations are largely based on historical data of market prices and assume that future price movements will replicate the statistical distribution of the past data.
In spite of applying the VaR calculations, the Parent Company adopted the Standardized Approach set by the BSP in calculating capital adequacy covering market risk. The standardized approach employs standard risk weights for both the general and specific market risks. The general market risk classifies market risk according to the instruments coupon rate and the tenor while specific market risk classifies market risk based on the nature or type of security/instrument.Moreover, as a control measure for losses in the trading activities that may arise, market risk limits are put in place such
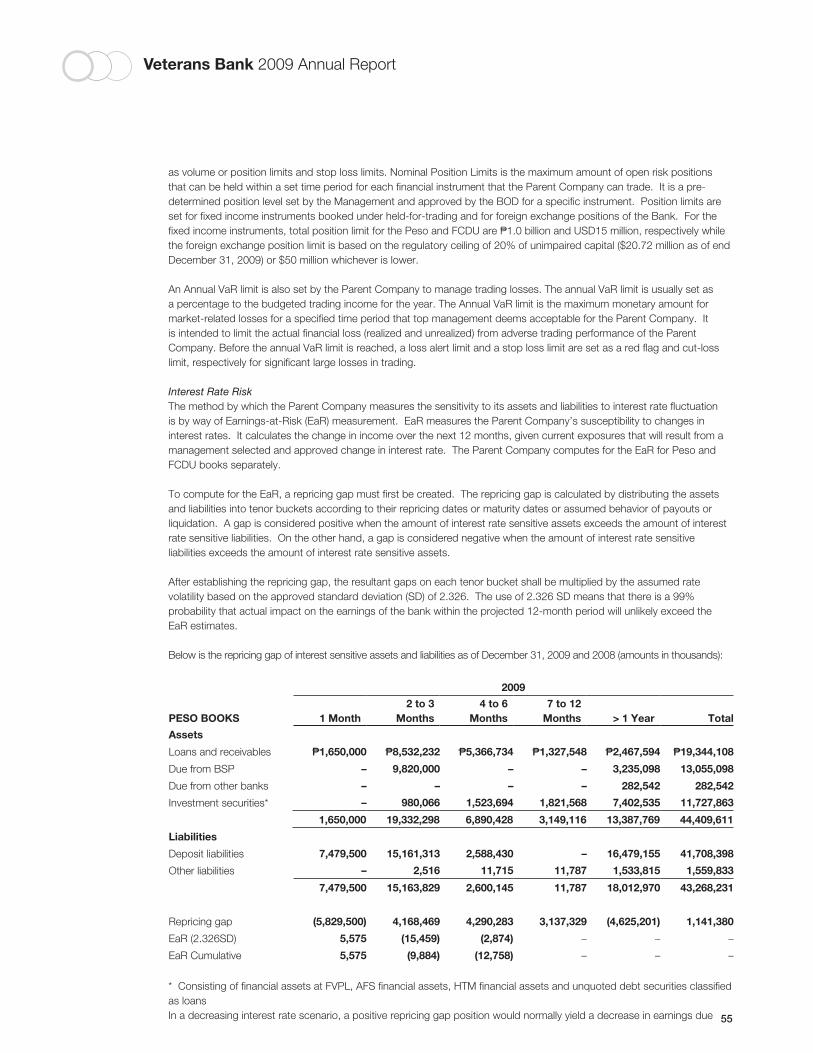
Veterans Bank 2009 Annual Report
55
as volume or position limits and stop loss limits. Nominal Position Limits is the maximum amount of open risk positions that can be held within a set time period for each financial instrument that the Parent Company can trade. It is a pre-determined position level set by the Management and approved by the BOD for a specific instrument. Position limits are set for fixed income instruments booked under held-for-trading and for foreign exchange positions of the Bank. For the fixed income instruments, total position limit for the Peso and FCDU are P1.0 billion and USD15 million, respectively while the foreign exchange position limit is based on the regulatory ceiling of 20% of unimpaired capital ($20.72 million as of end December 31, 2009) or $50 million whichever is lower.
An Annual VaR limit is also set by the Parent Company to manage trading losses. The annual VaR limit is usually set as a percentage to the budgeted trading income for the year. The Annual VaR limit is the maximum monetary amount for market-related losses for a specified time period that top management deems acceptable for the Parent Company. It is intended to limit the actual financial loss (realized and unrealized) from adverse trading performance of the Parent Company. Before the annual VaR limit is reached, a loss alert limit and a stop loss limit are set as a red flag and cut-loss limit, respectively for significant large losses in trading.
Interest Rate RiskThe method by which the Parent Company measures the sensitivity to its assets and liabilities to interest rate fluctuation is by way of Earnings-at-Risk (EaR) measurement. EaR measures the Parent Company’s susceptibility to changes in interest rates. It calculates the change in income over the next 12 months, given current exposures that will result from a management selected and approved change in interest rate. The Parent Company computes for the EaR for Peso and FCDU books separately.
To compute for the EaR, a repricing gap must first be created. The repricing gap is calculated by distributing the assets and liabilities into tenor buckets according to their repricing dates or maturity dates or assumed behavior of payouts or liquidation. A gap is considered positive when the amount of interest rate sensitive assets exceeds the amount of interest rate sensitive liabilities. On the other hand, a gap is considered negative when the amount of interest rate sensitive liabilities exceeds the amount of interest rate sensitive assets.
After establishing the repricing gap, the resultant gaps on each tenor bucket shall be multiplied by the assumed rate volatility based on the approved standard deviation (SD) of 2.326. The use of 2.326 SD means that there is a 99% probability that actual impact on the earnings of the bank within the projected 12-month period will unlikely exceed the EaR estimates.
Below is the repricing gap of interest sensitive assets and liabilities as of December 31, 2009 and 2008 (amounts in thousands):
2009
PESO BOOKS 1 Month2 to 3
Months4 to 6
Months7 to 12
Months > 1 Year Total
Assets
Loans and receivables P1,650,000 P8,532,232 P5,366,734 P1,327,548 P2,467,594 P19,344,108
Due from BSP – 9,820,000 – – 3,235,098 13,055,098
Due from other banks – – – – 282,542 282,542
Investment securities* – 980,066 1,523,694 1,821,568 7,402,535 11,727,863
1,650,000 19,332,298 6,890,428 3,149,116 13,387,769 44,409,611
Liabilities
Deposit liabilities 7,479,500 15,161,313 2,588,430 – 16,479,155 41,708,398
Other liabilities – 2,516 11,715 11,787 1,533,815 1,559,833
7,479,500 15,163,829 2,600,145 11,787 18,012,970 43,268,231
Repricing gap (5,829,500) 4,168,469 4,290,283 3,137,329 (4,625,201) 1,141,380
EaR (2.326SD) 5,575 (15,459) (2,874) – – –
EaR Cumulative 5,575 (9,884) (12,758) – – –
* Consisting of financial assets at FVPL, AFS financial assets, HTM financial assets and unquoted debt securities classified as loansIn a decreasing interest rate scenario, a positive repricing gap position would normally yield a decrease in earnings due
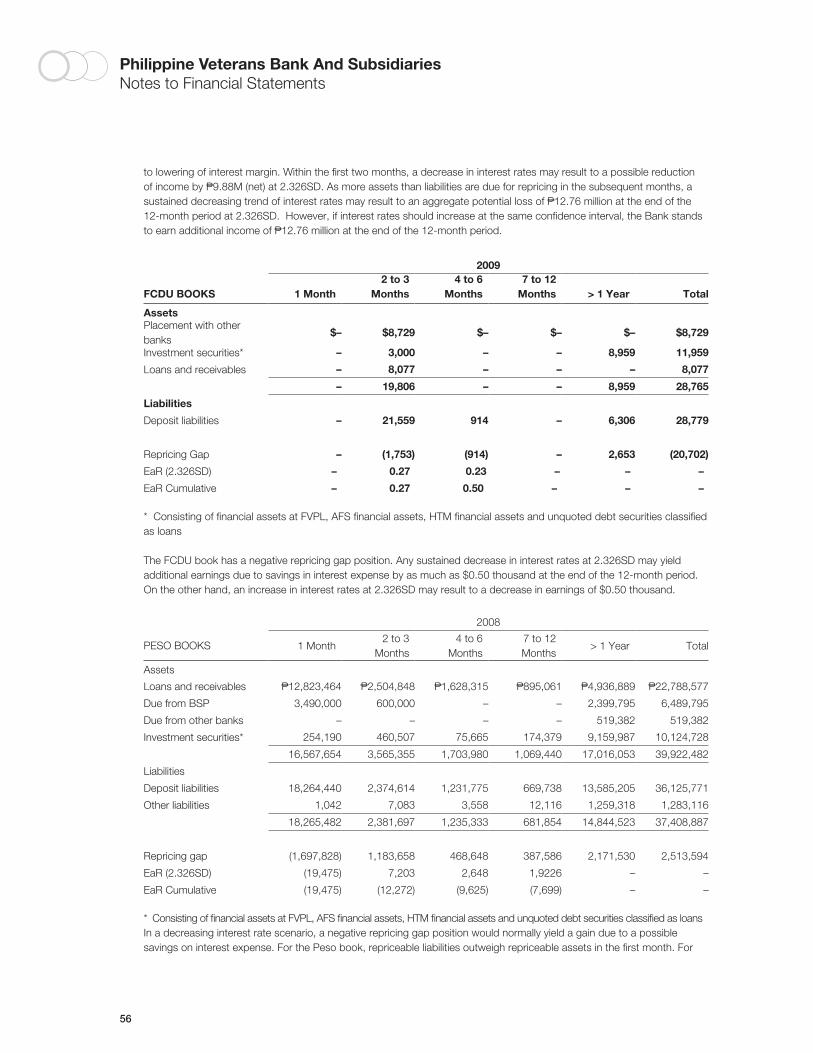
56
Philippine Veterans Bank And SubsidiariesNotes to Financial Statements
to lowering of interest margin. Within the first two months, a decrease in interest rates may result to a possible reduction of income by P9.88M (net) at 2.326SD. As more assets than liabilities are due for repricing in the subsequent months, a sustained decreasing trend of interest rates may result to an aggregate potential loss of P12.76 million at the end of the 12-month period at 2.326SD. However, if interest rates should increase at the same confidence interval, the Bank stands to earn additional income of P12.76 million at the end of the 12-month period.
2009
FCDU BOOKS 1 Month2 to 3
Months4 to 6
Months7 to 12
Months > 1 Year Total
AssetsPlacement with other banks
$– $8,729 $– $– $– $8,729
Investment securities* – 3,000 – – 8,959 11,959
Loans and receivables – 8,077 – – – 8,077
– 19,806 – – 8,959 28,765
Liabilities
Deposit liabilities – 21,559 914 – 6,306 28,779
Repricing Gap – (1,753) (914) – 2,653 (20,702)
EaR (2.326SD) – 0.27 0.23 – – –
EaR Cumulative – 0.27 0.50 – – –
* Consisting of financial assets at FVPL, AFS financial assets, HTM financial assets and unquoted debt securities classified as loans
The FCDU book has a negative repricing gap position. Any sustained decrease in interest rates at 2.326SD may yield additional earnings due to savings in interest expense by as much as $0.50 thousand at the end of the 12-month period. On the other hand, an increase in interest rates at 2.326SD may result to a decrease in earnings of $0.50 thousand.
2008
PESO BOOKS 1 Month2 to 3
Months4 to 6
Months7 to 12Months
> 1 Year Total
Assets
Loans and receivables P12,823,464 P2,504,848 P1,628,315 P895,061 P4,936,889 P22,788,577
Due from BSP 3,490,000 600,000 – – 2,399,795 6,489,795
Due from other banks – – – – 519,382 519,382
Investment securities* 254,190 460,507 75,665 174,379 9,159,987 10,124,728
16,567,654 3,565,355 1,703,980 1,069,440 17,016,053 39,922,482
Liabilities
Deposit liabilities 18,264,440 2,374,614 1,231,775 669,738 13,585,205 36,125,771
Other liabilities 1,042 7,083 3,558 12,116 1,259,318 1,283,116
18,265,482 2,381,697 1,235,333 681,854 14,844,523 37,408,887
Repricing gap (1,697,828) 1,183,658 468,648 387,586 2,171,530 2,513,594
EaR (2.326SD) (19,475) 7,203 2,648 1,9226 – –
EaR Cumulative (19,475) (12,272) (9,625) (7,699) – –
* Consisting of financial assets at FVPL, AFS financial assets, HTM financial assets and unquoted debt securities classified as loansIn a decreasing interest rate scenario, a negative repricing gap position would normally yield a gain due to a possible savings on interest expense. For the Peso book, repriceable liabilities outweigh repriceable assets in the first month. For
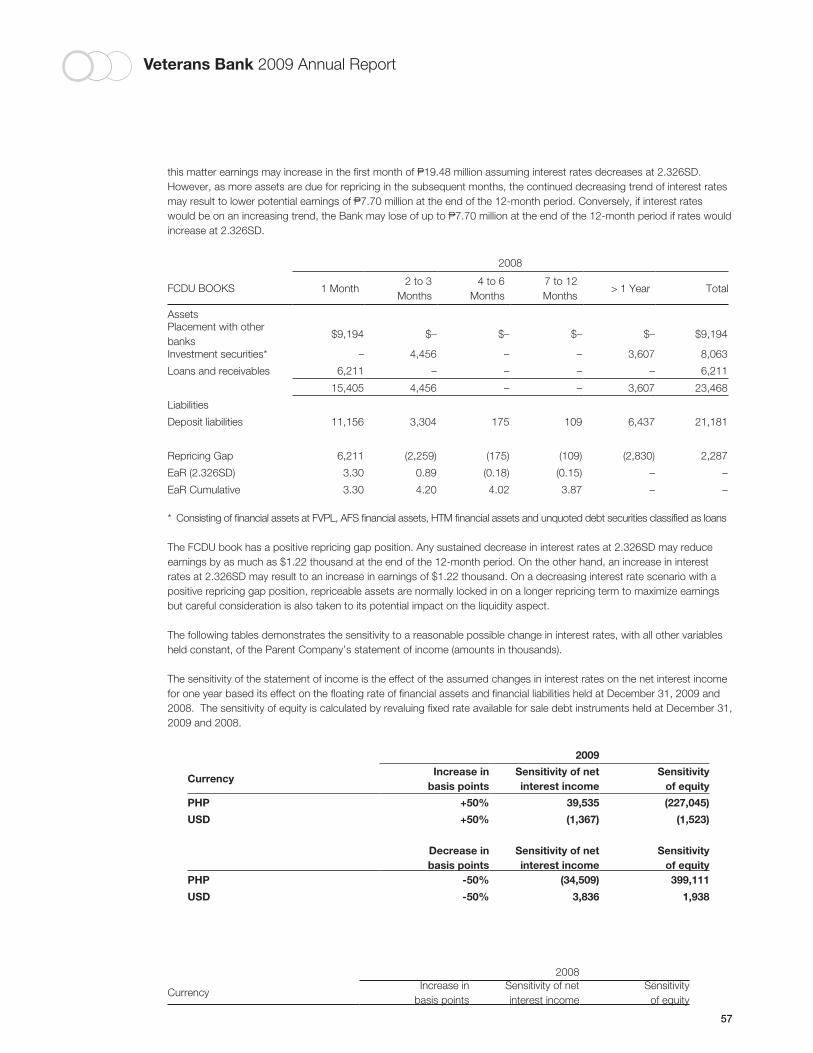
Veterans Bank 2009 Annual Report
57
this matter earnings may increase in the first month of P19.48 million assuming interest rates decreases at 2.326SD. However, as more assets are due for repricing in the subsequent months, the continued decreasing trend of interest rates may result to lower potential earnings of P7.70 million at the end of the 12-month period. Conversely, if interest rates would be on an increasing trend, the Bank may lose of up to P7.70 million at the end of the 12-month period if rates would increase at 2.326SD.
2008
FCDU BOOKS 1 Month2 to 3
Months4 to 6
Months7 to 12Months
> 1 Year Total
AssetsPlacement with other banks
$9,194 $– $– $– $– $9,194
Investment securities* – 4,456 – – 3,607 8,063
Loans and receivables 6,211 – – – – 6,211
15,405 4,456 – – 3,607 23,468
Liabilities
Deposit liabilities 11,156 3,304 175 109 6,437 21,181
Repricing Gap 6,211 (2,259) (175) (109) (2,830) 2,287
EaR (2.326SD) 3.30 0.89 (0.18) (0.15) – –
EaR Cumulative 3.30 4.20 4.02 3.87 – –
* Consisting of financial assets at FVPL, AFS financial assets, HTM financial assets and unquoted debt securities classified as loans
The FCDU book has a positive repricing gap position. Any sustained decrease in interest rates at 2.326SD may reduce earnings by as much as $1.22 thousand at the end of the 12-month period. On the other hand, an increase in interest rates at 2.326SD may result to an increase in earnings of $1.22 thousand. On a decreasing interest rate scenario with a positive repricing gap position, repriceable assets are normally locked in on a longer repricing term to maximize earnings but careful consideration is also taken to its potential impact on the liquidity aspect.
The following tables demonstrates the sensitivity to a reasonable possible change in interest rates, with all other variables held constant, of the Parent Company’s statement of income (amounts in thousands).
The sensitivity of the statement of income is the effect of the assumed changes in interest rates on the net interest income for one year based its effect on the floating rate of financial assets and financial liabilities held at December 31, 2009 and 2008. The sensitivity of equity is calculated by revaluing fixed rate available for sale debt instruments held at December 31, 2009 and 2008.
2009
CurrencyIncrease in
basis pointsSensitivity of netinterest income
Sensitivityof equity
PHP +50% 39,535 (227,045)
USD +50% (1,367) (1,523)
Decrease inbasis points
Sensitivity of netinterest income
Sensitivityof equity
PHP -50% (34,509) 399,111
USD -50% 3,836 1,938
2008
CurrencyIncrease in
basis pointsSensitivity of netinterest income
Sensitivityof equity
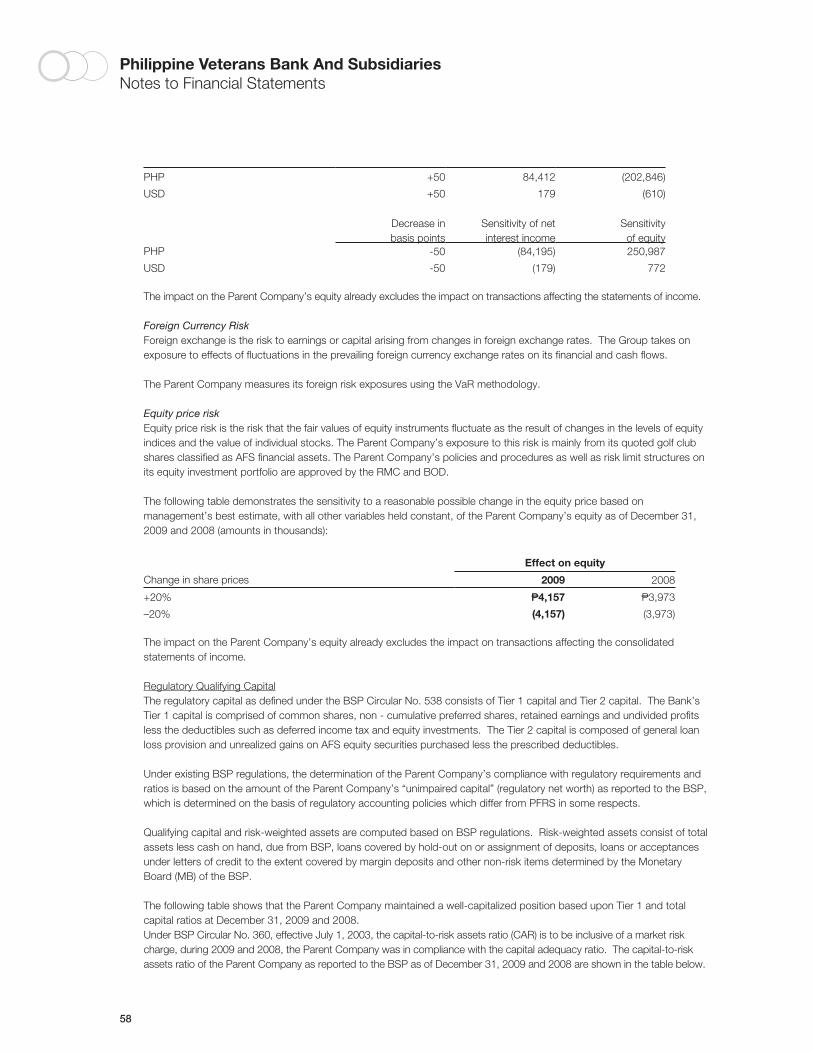
58
Philippine Veterans Bank And SubsidiariesNotes to Financial Statements
PHP +50 84,412 (202,846)
USD +50 179 (610)
Decrease inbasis points
Sensitivity of netinterest income
Sensitivityof equity
PHP -50 (84,195) 250,987
USD -50 (179) 772
The impact on the Parent Company’s equity already excludes the impact on transactions affecting the statements of income.
Foreign Currency Risk Foreign exchange is the risk to earnings or capital arising from changes in foreign exchange rates. The Group takes on
exposure to effects of fluctuations in the prevailing foreign currency exchange rates on its financial and cash flows.
The Parent Company measures its foreign risk exposures using the VaR methodology.
Equity price riskEquity price risk is the risk that the fair values of equity instruments fluctuate as the result of changes in the levels of equity indices and the value of individual stocks. The Parent Company’s exposure to this risk is mainly from its quoted golf club shares classified as AFS financial assets. The Parent Company’s policies and procedures as well as risk limit structures on its equity investment portfolio are approved by the RMC and BOD.
The following table demonstrates the sensitivity to a reasonable possible change in the equity price based on management’s best estimate, with all other variables held constant, of the Parent Company’s equity as of December 31, 2009 and 2008 (amounts in thousands):
Effect on equity
Change in share prices 2009 2008
+20% P4,157 P3,973
–20% (4,157) (3,973)
The impact on the Parent Company’s equity already excludes the impact on transactions affecting the consolidated statements of income.
Regulatory Qualifying CapitalThe regulatory capital as defined under the BSP Circular No. 538 consists of Tier 1 capital and Tier 2 capital. The Bank’s Tier 1 capital is comprised of common shares, non - cumulative preferred shares, retained earnings and undivided profits less the deductibles such as deferred income tax and equity investments. The Tier 2 capital is composed of general loan loss provision and unrealized gains on AFS equity securities purchased less the prescribed deductibles.
Under existing BSP regulations, the determination of the Parent Company’s compliance with regulatory requirements and ratios is based on the amount of the Parent Company’s “unimpaired capital” (regulatory net worth) as reported to the BSP, which is determined on the basis of regulatory accounting policies which differ from PFRS in some respects.
Qualifying capital and risk-weighted assets are computed based on BSP regulations. Risk-weighted assets consist of total assets less cash on hand, due from BSP, loans covered by hold-out on or assignment of deposits, loans or acceptances under letters of credit to the extent covered by margin deposits and other non-risk items determined by the Monetary Board (MB) of the BSP.
The following table shows that the Parent Company maintained a well-capitalized position based upon Tier 1 and total capital ratios at December 31, 2009 and 2008.Under BSP Circular No. 360, effective July 1, 2003, the capital-to-risk assets ratio (CAR) is to be inclusive of a market risk charge, during 2009 and 2008, the Parent Company was in compliance with the capital adequacy ratio. The capital-to-risk assets ratio of the Parent Company as reported to the BSP as of December 31, 2009 and 2008 are shown in the table below.
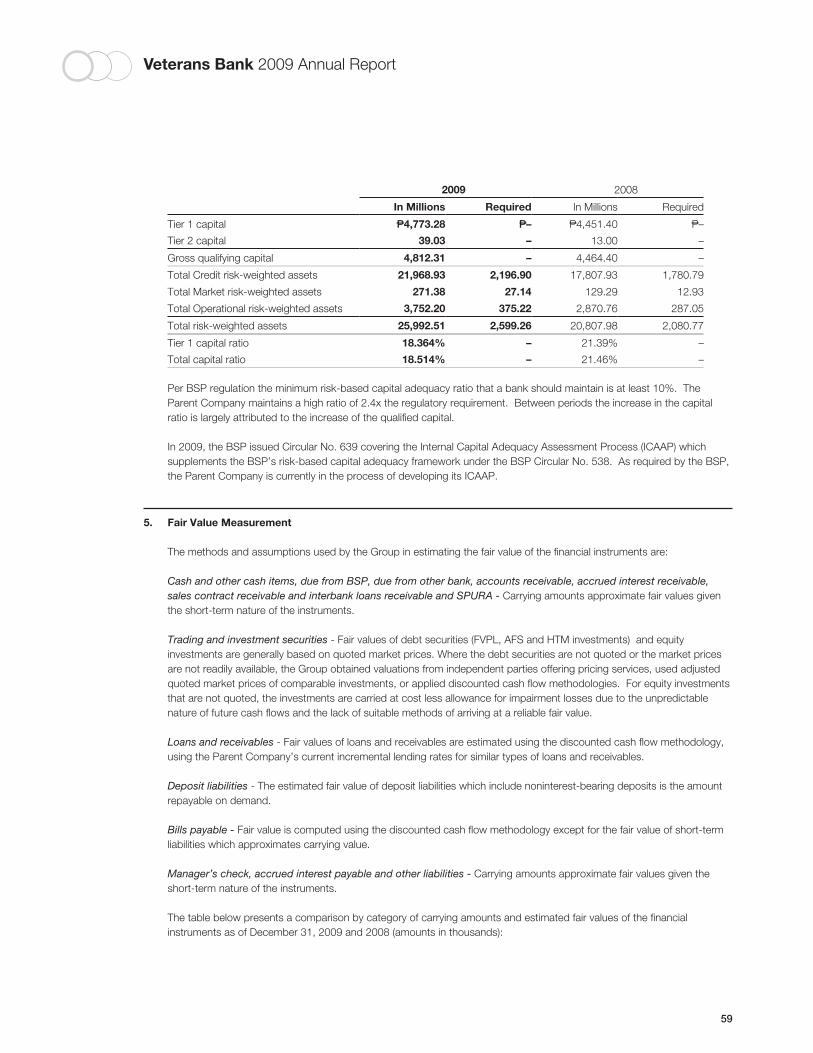
Veterans Bank 2009 Annual Report
59
2009 2008
In Millions Required In Millions Required
Tier 1 capital P4,773.28 P– P4,451.40 P–
Tier 2 capital 39.03 – 13.00 –
Gross qualifying capital 4,812.31 – 4,464.40 –
Total Credit risk-weighted assets 21,968.93 2,196.90 17,807.93 1,780.79
Total Market risk-weighted assets 271.38 27.14 129.29 12.93
Total Operational risk-weighted assets 3,752.20 375.22 2,870.76 287.05
Total risk-weighted assets 25,992.51 2,599.26 20,807.98 2,080.77
Tier 1 capital ratio 18.364% – 21.39% –
Total capital ratio 18.514% – 21.46% –
Per BSP regulation the minimum risk-based capital adequacy ratio that a bank should maintain is at least 10%. The Parent Company maintains a high ratio of 2.4x the regulatory requirement. Between periods the increase in the capital ratio is largely attributed to the increase of the qualified capital.
In 2009, the BSP issued Circular No. 639 covering the Internal Capital Adequacy Assessment Process (ICAAP) which supplements the BSP’s risk-based capital adequacy framework under the BSP Circular No. 538. As required by the BSP, the Parent Company is currently in the process of developing its ICAAP.
5. Fair Value Measurement
The methods and assumptions used by the Group in estimating the fair value of the financial instruments are:
Cash and other cash items, due from BSP, due from other bank, accounts receivable, accrued interest receivable, sales contract receivable and interbank loans receivable and SPURA - Carrying amounts approximate fair values given the short-term nature of the instruments.
Trading and investment securities - Fair values of debt securities (FVPL, AFS and HTM investments) and equity investments are generally based on quoted market prices. Where the debt securities are not quoted or the market prices are not readily available, the Group obtained valuations from independent parties offering pricing services, used adjusted quoted market prices of comparable investments, or applied discounted cash flow methodologies. For equity investments that are not quoted, the investments are carried at cost less allowance for impairment losses due to the unpredictable nature of future cash flows and the lack of suitable methods of arriving at a reliable fair value.
Loans and receivables - Fair values of loans and receivables are estimated using the discounted cash flow methodology, using the Parent Company’s current incremental lending rates for similar types of loans and receivables.
Deposit liabilities - The estimated fair value of deposit liabilities which include noninterest-bearing deposits is the amount repayable on demand.
Bills payable - Fair value is computed using the discounted cash flow methodology except for the fair value of short-term liabilities which approximates carrying value.
Manager’s check, accrued interest payable and other liabilities - Carrying amounts approximate fair values given the short-term nature of the instruments.
The table below presents a comparison by category of carrying amounts and estimated fair values of the financial instruments as of December 31, 2009 and 2008 (amounts in thousands):
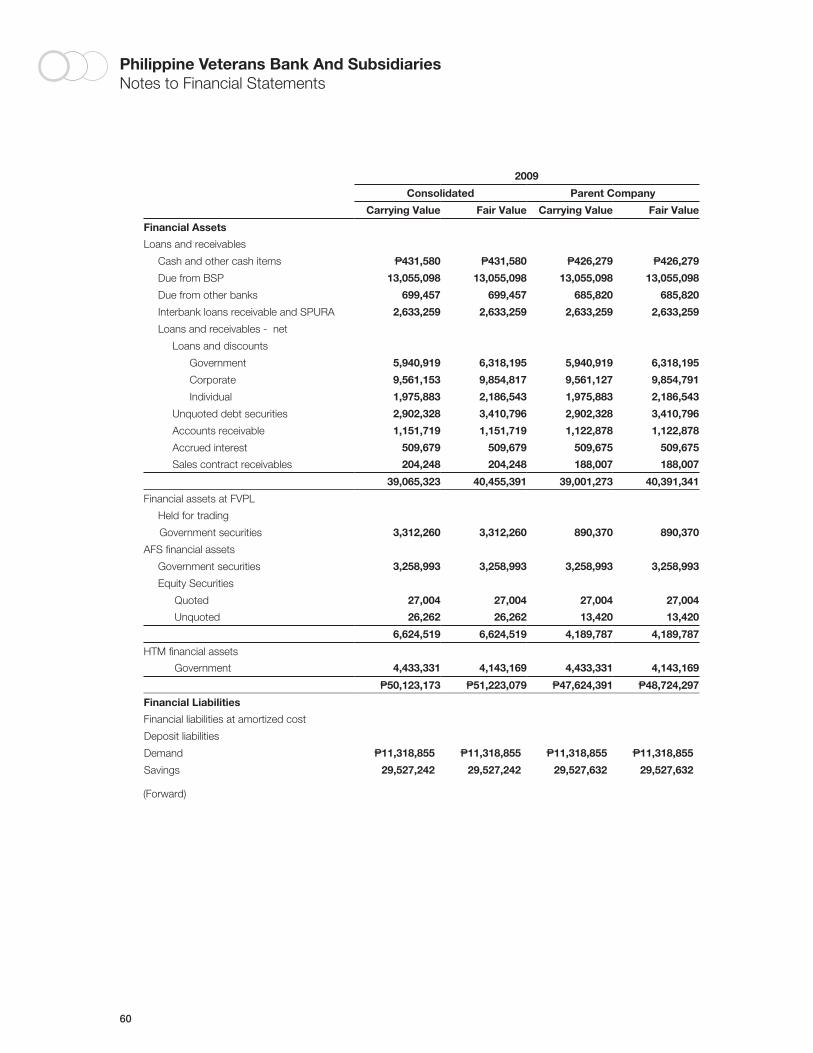
60
Philippine Veterans Bank And SubsidiariesNotes to Financial Statements
2009
Consolidated Parent Company
Carrying Value Fair Value Carrying Value Fair Value
Financial Assets
Loans and receivables
Cash and other cash items P431,580 P431,580 P426,279 P426,279
Due from BSP 13,055,098 13,055,098 13,055,098 13,055,098
Due from other banks 699,457 699,457 685,820 685,820
Interbank loans receivable and SPURA 2,633,259 2,633,259 2,633,259 2,633,259
Loans and receivables - net
Loans and discounts
Government 5,940,919 6,318,195 5,940,919 6,318,195
Corporate 9,561,153 9,854,817 9,561,127 9,854,791
Individual 1,975,883 2,186,543 1,975,883 2,186,543
Unquoted debt securities 2,902,328 3,410,796 2,902,328 3,410,796
Accounts receivable 1,151,719 1,151,719 1,122,878 1,122,878
Accrued interest 509,679 509,679 509,675 509,675
Sales contract receivables 204,248 204,248 188,007 188,007
39,065,323 40,455,391 39,001,273 40,391,341
Financial assets at FVPL
Held for trading
Government securities 3,312,260 3,312,260 890,370 890,370
AFS financial assets
Government securities 3,258,993 3,258,993 3,258,993 3,258,993
Equity Securities
Quoted 27,004 27,004 27,004 27,004
Unquoted 26,262 26,262 13,420 13,420
6,624,519 6,624,519 4,189,787 4,189,787
HTM financial assets
Government 4,433,331 4,143,169 4,433,331 4,143,169
P50,123,173 P51,223,079 P47,624,391 P48,724,297
Financial Liabilities
Financial liabilities at amortized cost
Deposit liabilities
Demand P11,318,855 P11,318,855 P11,318,855 P11,318,855
Savings 29,527,242 29,527,242 29,527,632 29,527,632
(Forward)
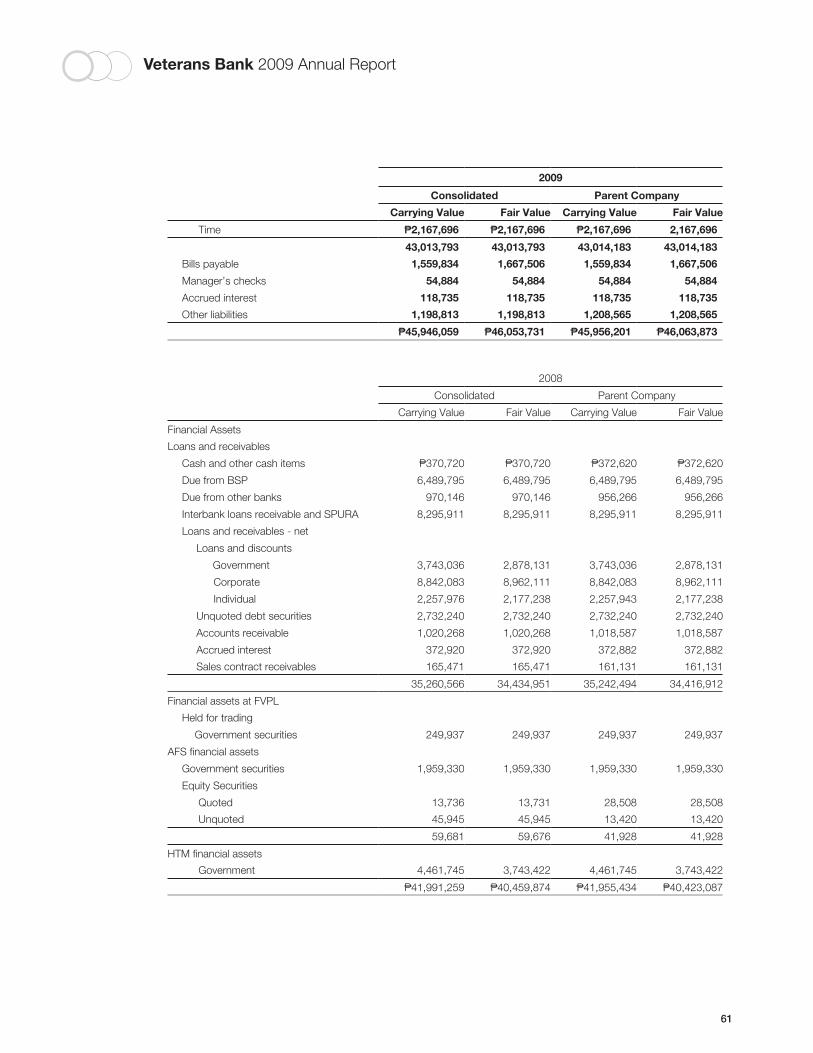
Veterans Bank 2009 Annual Report
61
2009
Consolidated Parent Company
Carrying Value Fair Value Carrying Value Fair Value
Time P2,167,696 P2,167,696 P2,167,696 2,167,696
43,013,793 43,013,793 43,014,183 43,014,183
Bills payable 1,559,834 1,667,506 1,559,834 1,667,506
Manager’s checks 54,884 54,884 54,884 54,884
Accrued interest 118,735 118,735 118,735 118,735
Other liabilities 1,198,813 1,198,813 1,208,565 1,208,565
P45,946,059 P46,053,731 P45,956,201 P46,063,873
2008
Consolidated Parent Company
Carrying Value Fair Value Carrying Value Fair Value
Financial Assets
Loans and receivables
Cash and other cash items P370,720 P370,720 P372,620 P372,620
Due from BSP 6,489,795 6,489,795 6,489,795 6,489,795
Due from other banks 970,146 970,146 956,266 956,266
Interbank loans receivable and SPURA 8,295,911 8,295,911 8,295,911 8,295,911
Loans and receivables - net
Loans and discounts
Government 3,743,036 2,878,131 3,743,036 2,878,131
Corporate 8,842,083 8,962,111 8,842,083 8,962,111
Individual 2,257,976 2,177,238 2,257,943 2,177,238
Unquoted debt securities 2,732,240 2,732,240 2,732,240 2,732,240
Accounts receivable 1,020,268 1,020,268 1,018,587 1,018,587
Accrued interest 372,920 372,920 372,882 372,882
Sales contract receivables 165,471 165,471 161,131 161,131
35,260,566 34,434,951 35,242,494 34,416,912
Financial assets at FVPL
Held for trading
Government securities 249,937 249,937 249,937 249,937
AFS financial assets
Government securities 1,959,330 1,959,330 1,959,330 1,959,330
Equity Securities
Quoted 13,736 13,731 28,508 28,508
Unquoted 45,945 45,945 13,420 13,420
59,681 59,676 41,928 41,928
HTM financial assets
Government 4,461,745 3,743,422 4,461,745 3,743,422
P41,991,259 P40,459,874 P41,955,434 P40,423,087
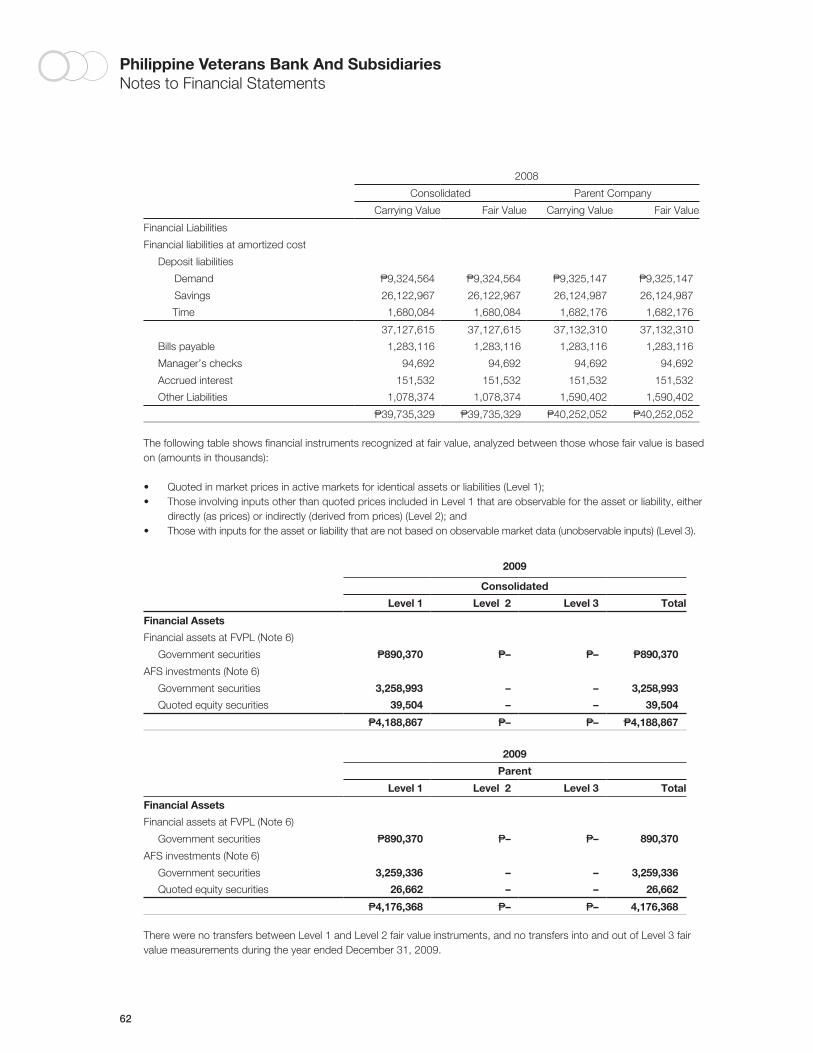
62
Philippine Veterans Bank And SubsidiariesNotes to Financial Statements
2008
Consolidated Parent Company
Carrying Value Fair Value Carrying Value Fair Value
Financial Liabilities
Financial liabilities at amortized cost
Deposit liabilities
Demand P9,324,564 P9,324,564 P9,325,147 P9,325,147
Savings 26,122,967 26,122,967 26,124,987 26,124,987
Time 1,680,084 1,680,084 1,682,176 1,682,176
37,127,615 37,127,615 37,132,310 37,132,310
Bills payable 1,283,116 1,283,116 1,283,116 1,283,116
Manager’s checks 94,692 94,692 94,692 94,692
Accrued interest 151,532 151,532 151,532 151,532
Other Liabilities 1,078,374 1,078,374 1,590,402 1,590,402
P39,735,329 P39,735,329 P40,252,052 P40,252,052
The following table shows financial instruments recognized at fair value, analyzed between those whose fair value is based on (amounts in thousands):
• Quotedinmarketpricesinactivemarketsforidenticalassetsorliabilities(Level1);• ThoseinvolvinginputsotherthanquotedpricesincludedinLevel1thatareobservablefortheassetorliability,either
directly (as prices) or indirectly (derived from prices) (Level 2); and • Those with inputs for the asset or liability that are not based on observable market data (unobservable inputs) (Level 3).
2009
Consolidated
Level 1 Level 2 Level 3 Total
Financial Assets
Financial assets at FVPL (Note 6)
Government securities P890,370 P– P– P890,370
AFS investments (Note 6)
Government securities 3,258,993 – – 3,258,993
Quoted equity securities 39,504 – – 39,504
P4,188,867 P– P– P4,188,867
2009
Parent
Level 1 Level 2 Level 3 Total
Financial Assets
Financial assets at FVPL (Note 6)
Government securities P890,370 P– P– 890,370
AFS investments (Note 6)
Government securities 3,259,336 – – 3,259,336
Quoted equity securities 26,662 – – 26,662
P4,176,368 P– P– 4,176,368
There were no transfers between Level 1 and Level 2 fair value instruments, and no transfers into and out of Level 3 fair value measurements during the year ended December 31, 2009.
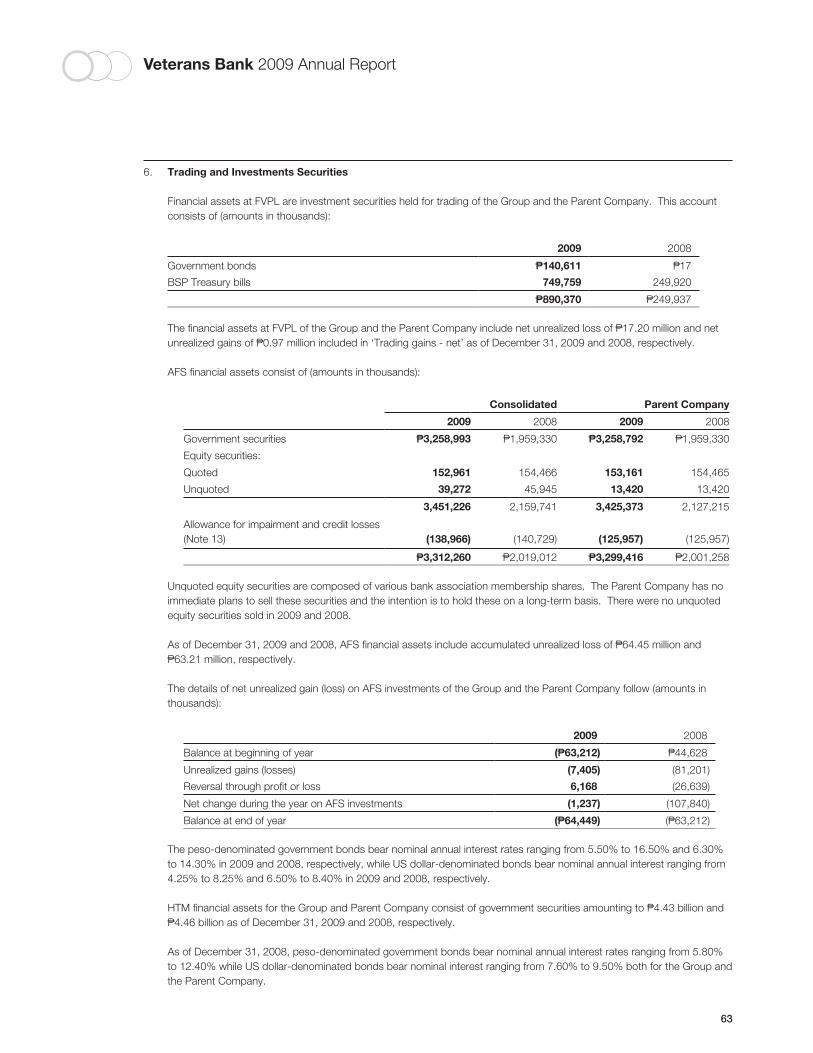
Veterans Bank 2009 Annual Report
63
6. Trading and Investments Securities
Financial assets at FVPL are investment securities held for trading of the Group and the Parent Company. This account consists of (amounts in thousands):
2009 2008
Government bonds P140,611 P17
BSP Treasury bills 749,759 249,920
P890,370 P249,937
The financial assets at FVPL of the Group and the Parent Company include net unrealized loss of P17.20 million and net unrealized gains of P0.97 million included in ‘Trading gains - net’ as of December 31, 2009 and 2008, respectively.
AFS financial assets consist of (amounts in thousands):
Consolidated Parent Company
2009 2008 2009 2008
Government securities P3,258,993 P1,959,330 P3,258,792 P1,959,330
Equity securities:
Quoted 152,961 154,466 153,161 154,465
Unquoted 39,272 45,945 13,420 13,420
3,451,226 2,159,741 3,425,373 2,127,215
Allowance for impairment and credit losses (Note 13) (138,966) (140,729) (125,957) (125,957)
P3,312,260 P2,019,012 P3,299,416 P2,001,258
Unquoted equity securities are composed of various bank association membership shares. The Parent Company has no immediate plans to sell these securities and the intention is to hold these on a long-term basis. There were no unquoted equity securities sold in 2009 and 2008.
As of December 31, 2009 and 2008, AFS financial assets include accumulated unrealized loss of P64.45 million and P63.21 million, respectively.
The details of net unrealized gain (loss) on AFS investments of the Group and the Parent Company follow (amounts in thousands):
2009 2008
Balance at beginning of year (P63,212) P44,628
Unrealized gains (losses) (7,405) (81,201)
Reversal through profit or loss 6,168 (26,639)
Net change during the year on AFS investments (1,237) (107,840)
Balance at end of year (P64,449) (P63,212)
The peso-denominated government bonds bear nominal annual interest rates ranging from 5.50% to 16.50% and 6.30% to 14.30% in 2009 and 2008, respectively, while US dollar-denominated bonds bear nominal annual interest ranging from 4.25% to 8.25% and 6.50% to 8.40% in 2009 and 2008, respectively.
HTM financial assets for the Group and Parent Company consist of government securities amounting to P4.43 billion and P4.46 billion as of December 31, 2009 and 2008, respectively.
As of December 31, 2008, peso-denominated government bonds bear nominal annual interest rates ranging from 5.80% to 12.40% while US dollar-denominated bonds bear nominal interest ranging from 7.60% to 9.50% both for the Group and the Parent Company.
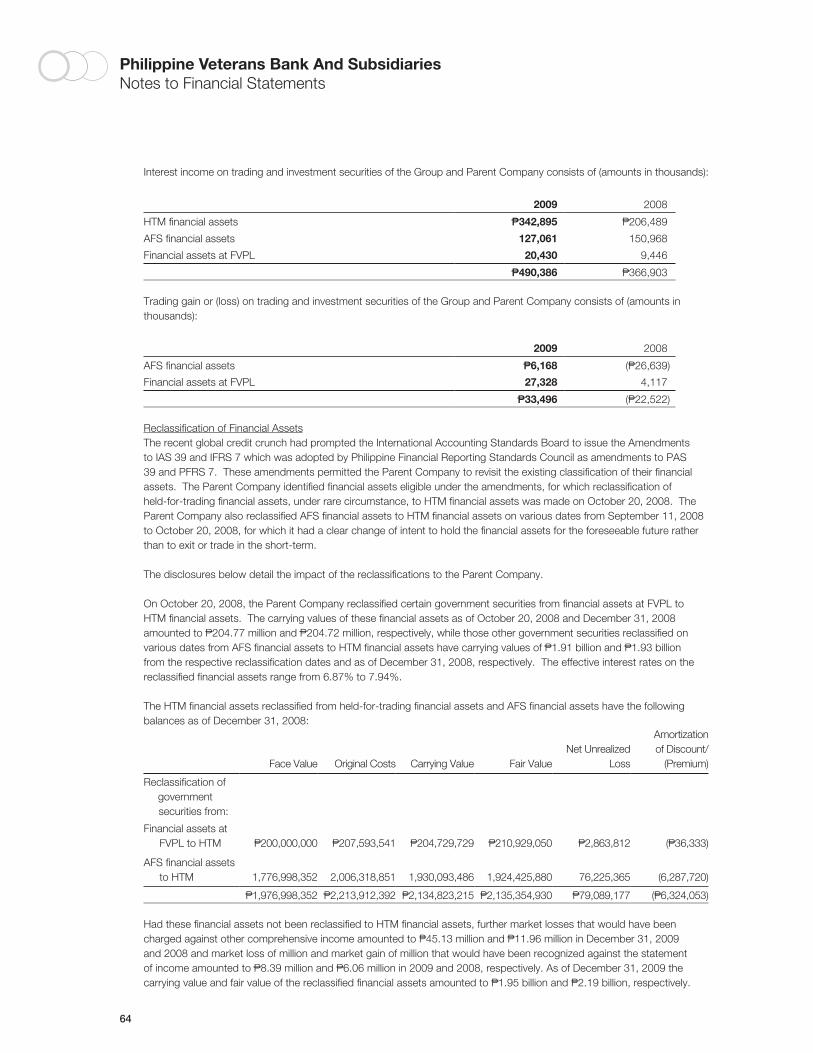
64
Philippine Veterans Bank And SubsidiariesNotes to Financial Statements
Interest income on trading and investment securities of the Group and Parent Company consists of (amounts in thousands):
2009 2008
HTM financial assets P342,895 P206,489
AFS financial assets 127,061 150,968
Financial assets at FVPL 20,430 9,446
P490,386 P366,903
Trading gain or (loss) on trading and investment securities of the Group and Parent Company consists of (amounts in thousands):
2009 2008
AFS financial assets P6,168 (P26,639)
Financial assets at FVPL 27,328 4,117
P33,496 (P22,522)
Reclassification of Financial AssetsThe recent global credit crunch had prompted the International Accounting Standards Board to issue the Amendments to IAS 39 and IFRS 7 which was adopted by Philippine Financial Reporting Standards Council as amendments to PAS 39 and PFRS 7. These amendments permitted the Parent Company to revisit the existing classification of their financial assets. The Parent Company identified financial assets eligible under the amendments, for which reclassification of held-for-trading financial assets, under rare circumstance, to HTM financial assets was made on October 20, 2008. The Parent Company also reclassified AFS financial assets to HTM financial assets on various dates from September 11, 2008 to October 20, 2008, for which it had a clear change of intent to hold the financial assets for the foreseeable future rather than to exit or trade in the short-term.
The disclosures below detail the impact of the reclassifications to the Parent Company.
On October 20, 2008, the Parent Company reclassified certain government securities from financial assets at FVPL to HTM financial assets. The carrying values of these financial assets as of October 20, 2008 and December 31, 2008 amounted to P204.77 million and P204.72 million, respectively, while those other government securities reclassified on various dates from AFS financial assets to HTM financial assets have carrying values of P1.91 billion and P1.93 billion from the respective reclassification dates and as of December 31, 2008, respectively. The effective interest rates on the reclassified financial assets range from 6.87% to 7.94%.
The HTM financial assets reclassified from held-for-trading financial assets and AFS financial assets have the following balances as of December 31, 2008:
Face Value Original Costs Carrying Value Fair ValueNet Unrealized
Loss
Amortizationof Discount/
(Premium)
Reclassification of government securities from:
Financial assets at FVPL to HTM P200,000,000 P207,593,541 P204,729,729 P210,929,050 P2,863,812 (P36,333)
AFS financial assets to HTM 1,776,998,352 2,006,318,851 1,930,093,486 1,924,425,880 76,225,365 (6,287,720)
P1,976,998,352 P2,213,912,392 P2,134,823,215 P2,135,354,930 P79,089,177 (P6,324,053)
Had these financial assets not been reclassified to HTM financial assets, further market losses that would have been charged against other comprehensive income amounted to P45.13 million and P11.96 million in December 31, 2009 and 2008 and market loss of million and market gain of million that would have been recognized against the statement of income amounted to P8.39 million and P6.06 million in 2009 and 2008, respectively. As of December 31, 2009 the carrying value and fair value of the reclassified financial assets amounted to P1.95 billion and P2.19 billion, respectively.
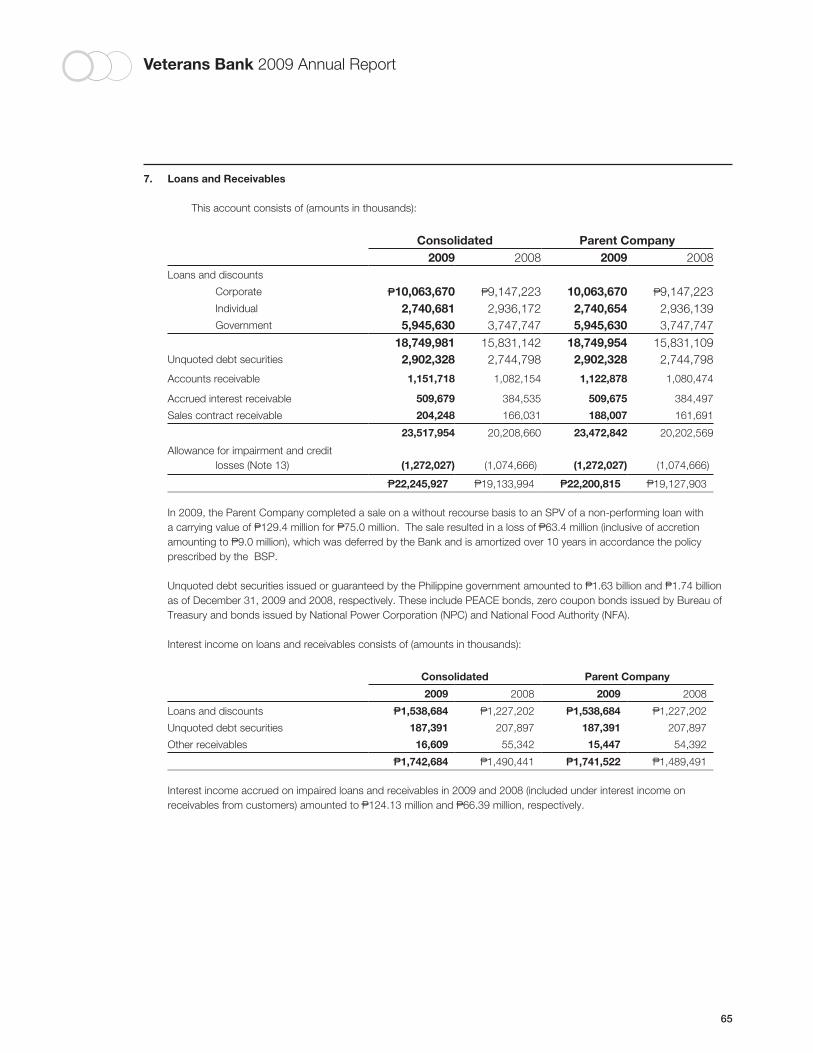
Veterans Bank 2009 Annual Report
65
7. Loans and Receivables
This account consists of (amounts in thousands):
Consolidated Parent Company2009 2008 2009 2008
Loans and discounts
Corporate P10,063,670 P9,147,223 10,063,670 P9,147,223 Individual 2,740,681 2,936,172 2,740,654 2,936,139 Government 5,945,630 3,747,747 5,945,630 3,747,747
18,749,981 15,831,142 18,749,954 15,831,109Unquoted debt securities 2,902,328 2,744,798 2,902,328 2,744,798
Accounts receivable 1,151,718 1,082,154 1,122,878 1,080,474
Accrued interest receivable 509,679 384,535 509,675 384,497
Sales contract receivable 204,248 166,031 188,007 161,691
23,517,954 20,208,660 23,472,842 20,202,569
Allowance for impairment and credit losses (Note 13) (1,272,027) (1,074,666) (1,272,027) (1,074,666)
P22,245,927 P19,133,994 P22,200,815 P19,127,903
In 2009, the Parent Company completed a sale on a without recourse basis to an SPV of a non-performing loan with a carrying value of P129.4 million for P75.0 million. The sale resulted in a loss of P63.4 million (inclusive of accretion amounting to P9.0 million), which was deferred by the Bank and is amortized over 10 years in accordance the policy prescribed by the BSP.
Unquoted debt securities issued or guaranteed by the Philippine government amounted to P1.63 billion and P1.74 billion as of December 31, 2009 and 2008, respectively. These include PEACE bonds, zero coupon bonds issued by Bureau of Treasury and bonds issued by National Power Corporation (NPC) and National Food Authority (NFA).
Interest income on loans and receivables consists of (amounts in thousands):
Consolidated Parent Company
2009 2008 2009 2008
Loans and discounts P1,538,684 P1,227,202 P1,538,684 P1,227,202
Unquoted debt securities 187,391 207,897 187,391 207,897
Other receivables 16,609 55,342 15,447 54,392
P1,742,684 P1,490,441 P1,741,522 P1,489,491
Interest income accrued on impaired loans and receivables in 2009 and 2008 (included under interest income on receivables from customers) amounted to P124.13 million and P66.39 million, respectively.
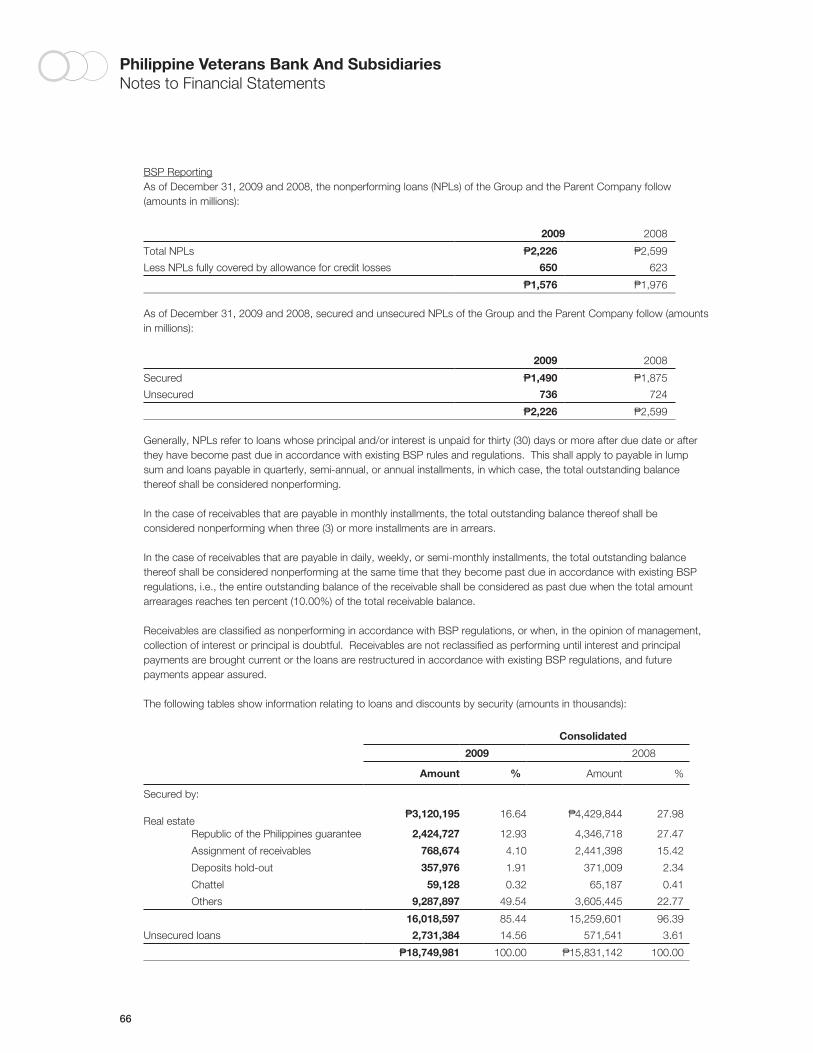
66
Philippine Veterans Bank And SubsidiariesNotes to Financial Statements
BSP ReportingAs of December 31, 2009 and 2008, the nonperforming loans (NPLs) of the Group and the Parent Company follow (amounts in millions):
2009 2008
Total NPLs P2,226 P2,599
Less NPLs fully covered by allowance for credit losses 650 623
P1,576 P1,976
As of December 31, 2009 and 2008, secured and unsecured NPLs of the Group and the Parent Company follow (amounts in millions):
2009 2008
Secured P1,490 P1,875
Unsecured 736 724
P2,226 P2,599
Generally, NPLs refer to loans whose principal and/or interest is unpaid for thirty (30) days or more after due date or after they have become past due in accordance with existing BSP rules and regulations. This shall apply to payable in lump sum and loans payable in quarterly, semi-annual, or annual installments, in which case, the total outstanding balance thereof shall be considered nonperforming.
In the case of receivables that are payable in monthly installments, the total outstanding balance thereof shall be considered nonperforming when three (3) or more installments are in arrears.
In the case of receivables that are payable in daily, weekly, or semi-monthly installments, the total outstanding balance thereof shall be considered nonperforming at the same time that they become past due in accordance with existing BSP regulations, i.e., the entire outstanding balance of the receivable shall be considered as past due when the total amount arrearages reaches ten percent (10.00%) of the total receivable balance.
Receivables are classified as nonperforming in accordance with BSP regulations, or when, in the opinion of management, collection of interest or principal is doubtful. Receivables are not reclassified as performing until interest and principal payments are brought current or the loans are restructured in accordance with existing BSP regulations, and future payments appear assured.
The following tables show information relating to loans and discounts by security (amounts in thousands):
Consolidated
2009 2008
Amount % Amount %
Secured by: Real estate
P3,120,195 16.64 P4,429,844 27.98
Republic of the Philippines guarantee 2,424,727 12.93 4,346,718 27.47
Assignment of receivables 768,674 4.10 2,441,398 15.42
Deposits hold-out 357,976 1.91 371,009 2.34
Chattel 59,128 0.32 65,187 0.41
Others 9,287,897 49.54 3,605,445 22.77
16,018,597 85.44 15,259,601 96.39
Unsecured loans 2,731,384 14.56 571,541 3.61
P18,749,981 100.00 P15,831,142 100.00
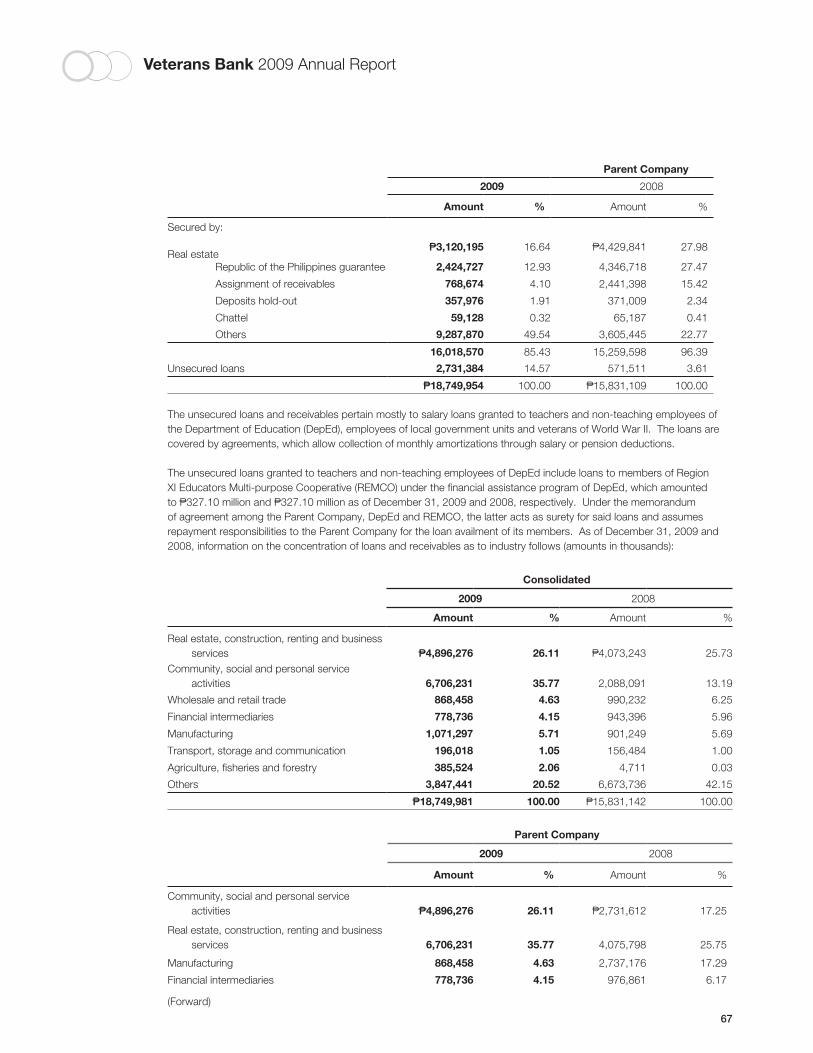
Veterans Bank 2009 Annual Report
67
Parent Company
2009 2008
Amount % Amount %
Secured by: Real estate
P3,120,195 16.64 P4,429,841 27.98
Republic of the Philippines guarantee 2,424,727 12.93 4,346,718 27.47
Assignment of receivables 768,674 4.10 2,441,398 15.42
Deposits hold-out 357,976 1.91 371,009 2.34
Chattel 59,128 0.32 65,187 0.41
Others 9,287,870 49.54 3,605,445 22.77
16,018,570 85.43 15,259,598 96.39
Unsecured loans 2,731,384 14.57 571,511 3.61
P18,749,954 100.00 P15,831,109 100.00
The unsecured loans and receivables pertain mostly to salary loans granted to teachers and non-teaching employees of the Department of Education (DepEd), employees of local government units and veterans of World War II. The loans are covered by agreements, which allow collection of monthly amortizations through salary or pension deductions.
The unsecured loans granted to teachers and non-teaching employees of DepEd include loans to members of Region XI Educators Multi-purpose Cooperative (REMCO) under the financial assistance program of DepEd, which amounted to P327.10 million and P327.10 million as of December 31, 2009 and 2008, respectively. Under the memorandum of agreement among the Parent Company, DepEd and REMCO, the latter acts as surety for said loans and assumes repayment responsibilities to the Parent Company for the loan availment of its members. As of December 31, 2009 and 2008, information on the concentration of loans and receivables as to industry follows (amounts in thousands):
Consolidated
2009 2008
Amount % Amount %
Real estate, construction, renting and business services P4,896,276 26.11 P4,073,243 25.73
Community, social and personal service activities 6,706,231 35.77 2,088,091 13.19
Wholesale and retail trade 868,458 4.63 990,232 6.25
Financial intermediaries 778,736 4.15 943,396 5.96
Manufacturing 1,071,297 5.71 901,249 5.69
Transport, storage and communication 196,018 1.05 156,484 1.00
Agriculture, fisheries and forestry 385,524 2.06 4,711 0.03
Others 3,847,441 20.52 6,673,736 42.15
P18,749,981 100.00 P15,831,142 100.00
Parent Company
2009 2008
Amount % Amount %
Community, social and personal service activities P4,896,276 26.11 P2,731,612 17.25
Real estate, construction, renting and business services 6,706,231 35.77 4,075,798 25.75
Manufacturing 868,458 4.63 2,737,176 17.29
Financial intermediaries 778,736 4.15 976,861 6.17
(Forward)
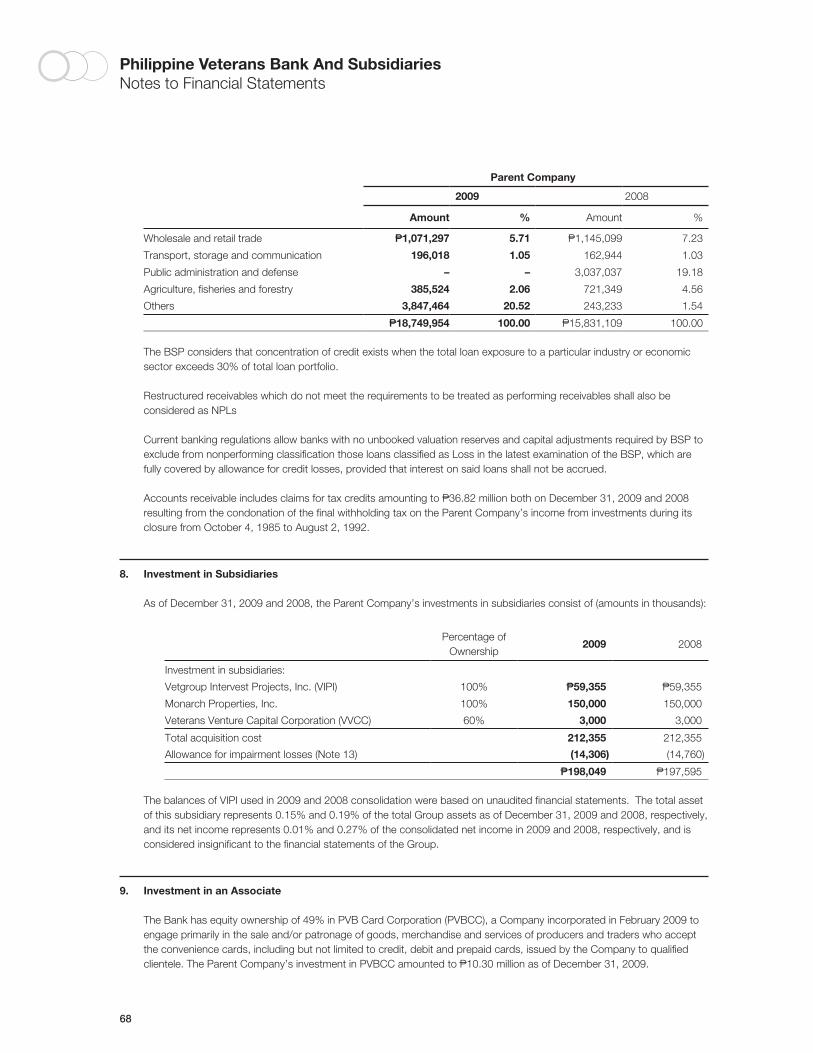
68
Philippine Veterans Bank And SubsidiariesNotes to Financial Statements
Parent Company
2009 2008
Amount % Amount %
Wholesale and retail trade P1,071,297 5.71 P1,145,099 7.23
Transport, storage and communication 196,018 1.05 162,944 1.03
Public administration and defense – – 3,037,037 19.18
Agriculture, fisheries and forestry 385,524 2.06 721,349 4.56
Others 3,847,464 20.52 243,233 1.54
P18,749,954 100.00 P15,831,109 100.00
The BSP considers that concentration of credit exists when the total loan exposure to a particular industry or economic sector exceeds 30% of total loan portfolio.
Restructured receivables which do not meet the requirements to be treated as performing receivables shall also be considered as NPLs
Current banking regulations allow banks with no unbooked valuation reserves and capital adjustments required by BSP to exclude from nonperforming classification those loans classified as Loss in the latest examination of the BSP, which are fully covered by allowance for credit losses, provided that interest on said loans shall not be accrued.
Accounts receivable includes claims for tax credits amounting to P36.82 million both on December 31, 2009 and 2008 resulting from the condonation of the final withholding tax on the Parent Company’s income from investments during its closure from October 4, 1985 to August 2, 1992.
8. Investment in Subsidiaries
As of December 31, 2009 and 2008, the Parent Company’s investments in subsidiaries consist of (amounts in thousands):
Percentage of Ownership
2009 2008
Investment in subsidiaries:
Vetgroup Intervest Projects, Inc. (VIPI) 100% P59,355 P59,355
Monarch Properties, Inc. 100% 150,000 150,000
Veterans Venture Capital Corporation (VVCC) 60% 3,000 3,000
Total acquisition cost 212,355 212,355
Allowance for impairment losses (Note 13) (14,306) (14,760)
P198,049 P197,595
The balances of VIPI used in 2009 and 2008 consolidation were based on unaudited financial statements. The total asset of this subsidiary represents 0.15% and 0.19% of the total Group assets as of December 31, 2009 and 2008, respectively, and its net income represents 0.01% and 0.27% of the consolidated net income in 2009 and 2008, respectively, and is considered insignificant to the financial statements of the Group.
9. Investment in an Associate
The Bank has equity ownership of 49% in PVB Card Corporation (PVBCC), a Company incorporated in February 2009 to engage primarily in the sale and/or patronage of goods, merchandise and services of producers and traders who accept the convenience cards, including but not limited to credit, debit and prepaid cards, issued by the Company to qualified clientele. The Parent Company’s investment in PVBCC amounted to P10.30 million as of December 31, 2009.
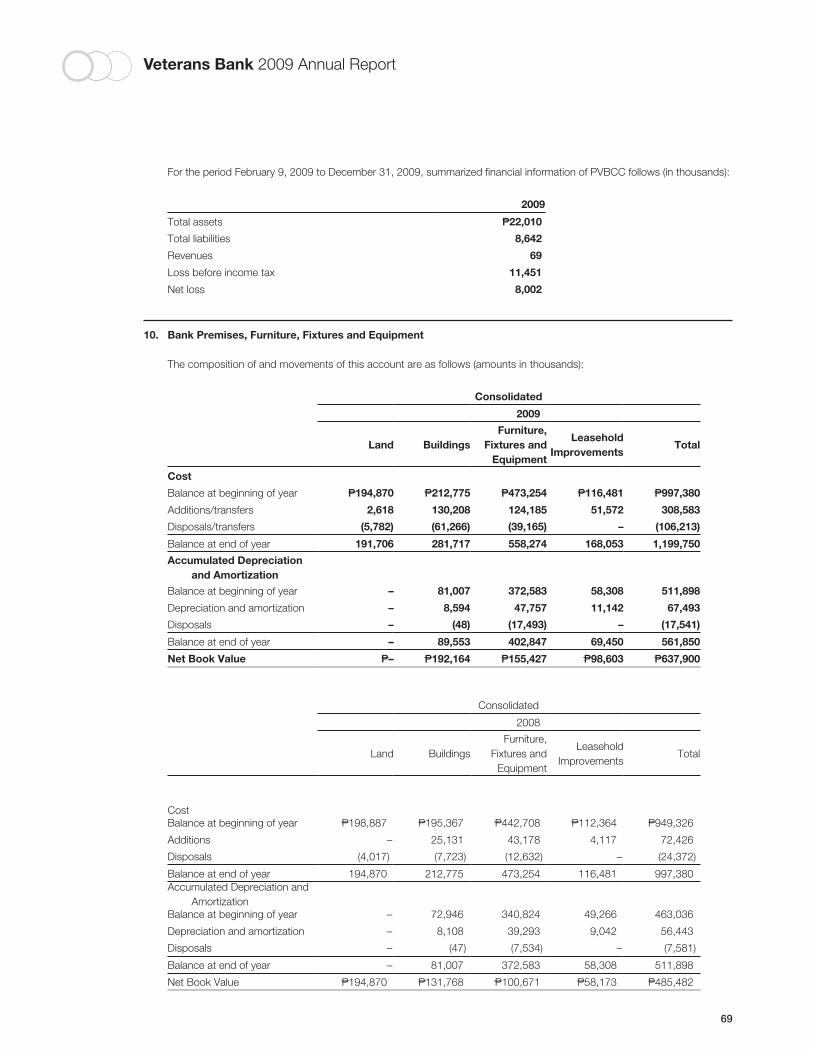
Veterans Bank 2009 Annual Report
69
For the period February 9, 2009 to December 31, 2009, summarized financial information of PVBCC follows (in thousands):
2009
Total assets P22,010
Total liabilities 8,642
Revenues 69
Loss before income tax 11,451
Net loss 8,002
10. Bank Premises, Furniture, Fixtures and Equipment
The composition of and movements of this account are as follows (amounts in thousands):
Consolidated
2009
Land BuildingsFurniture,
Fixtures andEquipment
LeaseholdImprovements
Total
Cost
Balance at beginning of year P194,870 P212,775 P473,254 P116,481 P997,380
Additions/transfers 2,618 130,208 124,185 51,572 308,583
Disposals/transfers (5,782) (61,266) (39,165) – (106,213)
Balance at end of year 191,706 281,717 558,274 168,053 1,199,750
Accumulated Depreciation and Amortization
Balance at beginning of year – 81,007 372,583 58,308 511,898
Depreciation and amortization – 8,594 47,757 11,142 67,493
Disposals – (48) (17,493) – (17,541)
Balance at end of year – 89,553 402,847 69,450 561,850
Net Book Value P– P192,164 P155,427 P98,603 P637,900
Consolidated
2008
Land BuildingsFurniture,
Fixtures andEquipment
LeaseholdImprovements
Total
CostBalance at beginning of year P198,887 P195,367 P442,708 P112,364 P949,326
Additions – 25,131 43,178 4,117 72,426
Disposals (4,017) (7,723) (12,632) – (24,372)
Balance at end of year 194,870 212,775 473,254 116,481 997,380Accumulated Depreciation and
AmortizationBalance at beginning of year – 72,946 340,824 49,266 463,036
Depreciation and amortization – 8,108 39,293 9,042 56,443
Disposals – (47) (7,534) – (7,581)
Balance at end of year – 81,007 372,583 58,308 511,898
Net Book Value P194,870 P131,768 P100,671 P58,173 P485,482
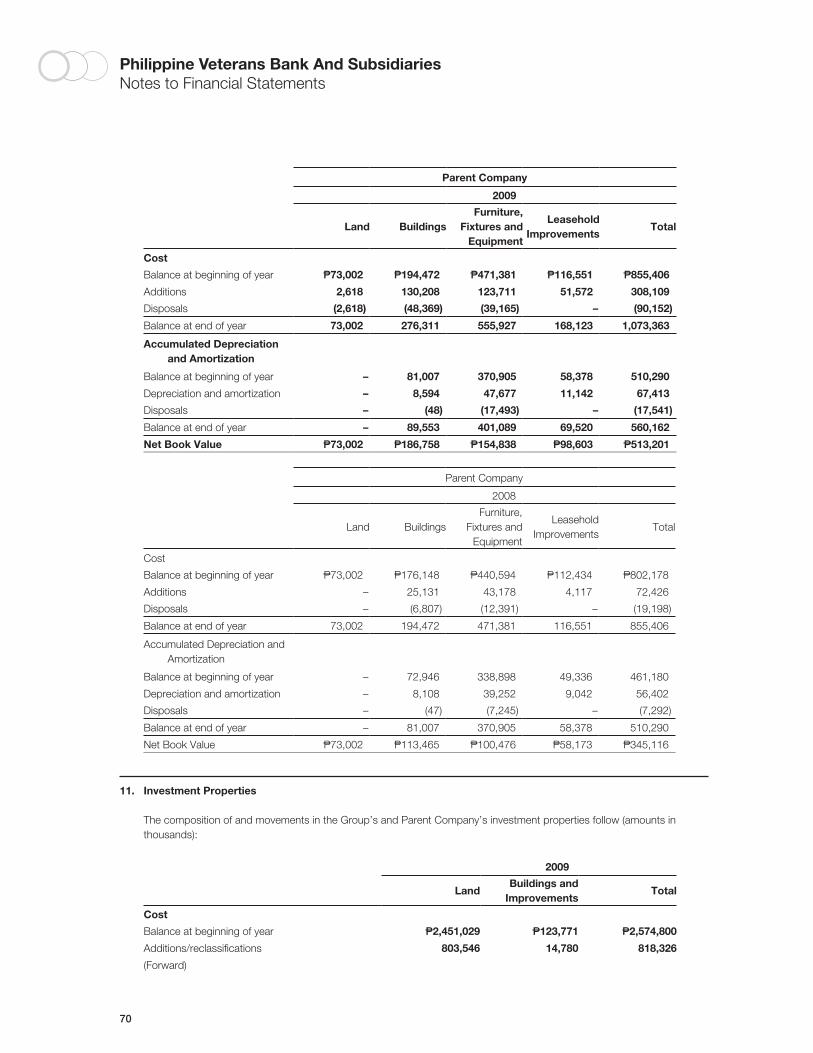
70
Philippine Veterans Bank And SubsidiariesNotes to Financial Statements
Parent Company
2009
Land BuildingsFurniture,
Fixtures andEquipment
LeaseholdImprovements
Total
Cost
Balance at beginning of year P73,002 P194,472 P471,381 P116,551 P855,406
Additions 2,618 130,208 123,711 51,572 308,109
Disposals (2,618) (48,369) (39,165) – (90,152)
Balance at end of year 73,002 276,311 555,927 168,123 1,073,363
Accumulated Depreciation and Amortization
Balance at beginning of year – 81,007 370,905 58,378 510,290
Depreciation and amortization – 8,594 47,677 11,142 67,413
Disposals – (48) (17,493) – (17,541)
Balance at end of year – 89,553 401,089 69,520 560,162
Net Book Value P73,002 P186,758 P154,838 P98,603 P513,201
Parent Company
2008
Land BuildingsFurniture,
Fixtures andEquipment
LeaseholdImprovements
Total
Cost
Balance at beginning of year P73,002 P176,148 P440,594 P112,434 P802,178
Additions – 25,131 43,178 4,117 72,426
Disposals – (6,807) (12,391) – (19,198)
Balance at end of year 73,002 194,472 471,381 116,551 855,406
Accumulated Depreciation and Amortization
Balance at beginning of year – 72,946 338,898 49,336 461,180
Depreciation and amortization – 8,108 39,252 9,042 56,402
Disposals – (47) (7,245) – (7,292)
Balance at end of year – 81,007 370,905 58,378 510,290
Net Book Value P73,002 P113,465 P100,476 P58,173 P345,116
11. Investment Properties
The composition of and movements in the Group’s and Parent Company’s investment properties follow (amounts in thousands):
2009
LandBuildings and
ImprovementsTotal
Cost
Balance at beginning of year P2,451,029 P123,771 P2,574,800
Additions/reclassifications 803,546 14,780 818,326
(Forward)
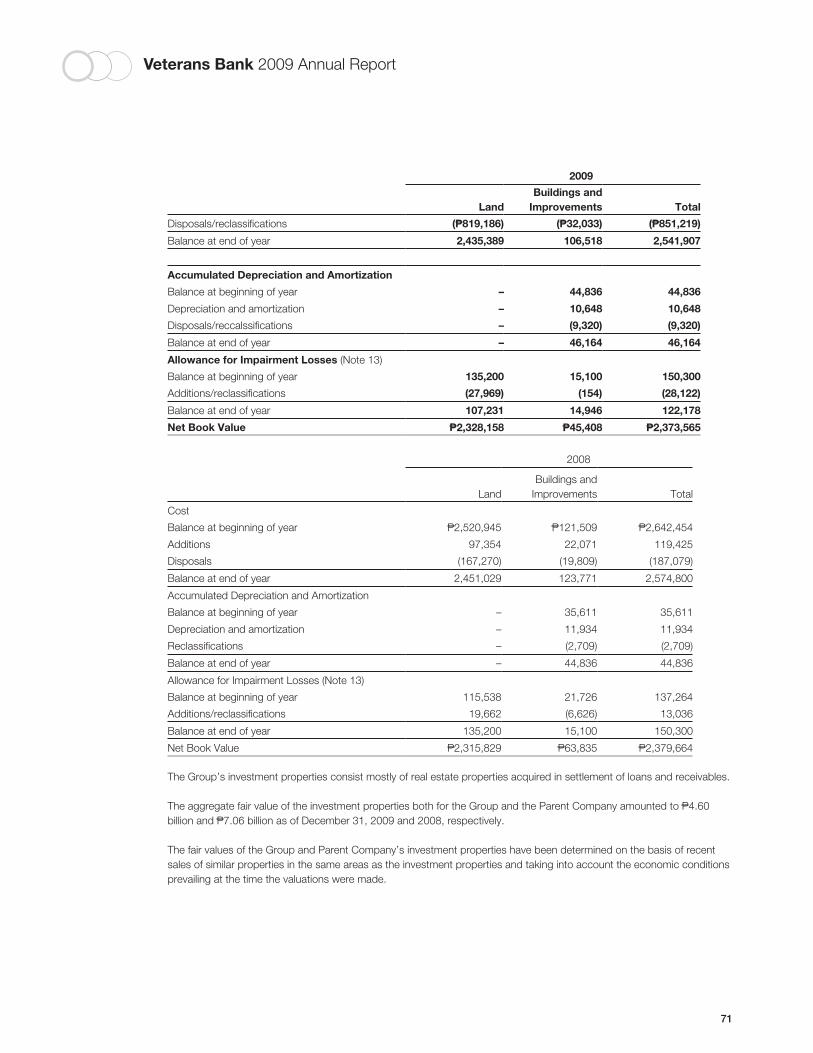
Veterans Bank 2009 Annual Report
71
2009
LandBuildings and
Improvements Total
Disposals/reclassifications (P819,186) (P32,033) (P851,219)
Balance at end of year 2,435,389 106,518 2,541,907
Accumulated Depreciation and Amortization
Balance at beginning of year – 44,836 44,836
Depreciation and amortization – 10,648 10,648
Disposals/reccalssifications – (9,320) (9,320)
Balance at end of year – 46,164 46,164
Allowance for Impairment Losses (Note 13)
Balance at beginning of year 135,200 15,100 150,300
Additions/reclassifications (27,969) (154) (28,122)
Balance at end of year 107,231 14,946 122,178
Net Book Value P2,328,158 P45,408 P2,373,565
2008
LandBuildings and
Improvements Total
Cost
Balance at beginning of year P2,520,945 P121,509 P2,642,454
Additions 97,354 22,071 119,425
Disposals (167,270) (19,809) (187,079)
Balance at end of year 2,451,029 123,771 2,574,800
Accumulated Depreciation and Amortization
Balance at beginning of year – 35,611 35,611
Depreciation and amortization – 11,934 11,934
Reclassifications – (2,709) (2,709)
Balance at end of year – 44,836 44,836
Allowance for Impairment Losses (Note 13)
Balance at beginning of year 115,538 21,726 137,264
Additions/reclassifications 19,662 (6,626) 13,036
Balance at end of year 135,200 15,100 150,300
Net Book Value P2,315,829 P63,835 P2,379,664
The Group’s investment properties consist mostly of real estate properties acquired in settlement of loans and receivables.
The aggregate fair value of the investment properties both for the Group and the Parent Company amounted to P4.60 billion and P7.06 billion as of December 31, 2009 and 2008, respectively.
The fair values of the Group and Parent Company’s investment properties have been determined on the basis of recent sales of similar properties in the same areas as the investment properties and taking into account the economic conditions prevailing at the time the valuations were made.
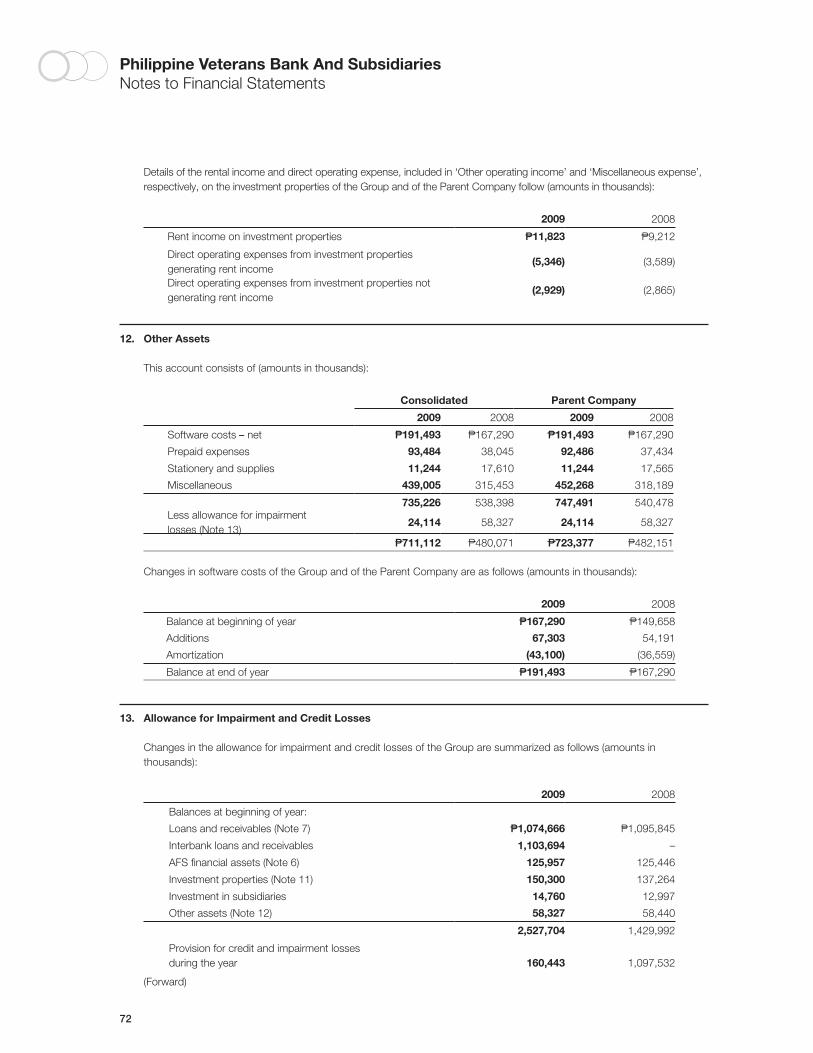
72
Philippine Veterans Bank And SubsidiariesNotes to Financial Statements
Details of the rental income and direct operating expense, included in ‘Other operating income’ and ‘Miscellaneous expense’, respectively, on the investment properties of the Group and of the Parent Company follow (amounts in thousands):
2009 2008
Rent income on investment properties P11,823 P9,212
Direct operating expenses from investment properties generating rent income
(5,346) (3,589)
Direct operating expenses from investment properties not generating rent income
(2,929) (2,865)
12. Other Assets
This account consists of (amounts in thousands):
Consolidated Parent Company
2009 2008 2009 2008
Software costs – net P191,493 P167,290 P191,493 P167,290
Prepaid expenses 93,484 38,045 92,486 37,434
Stationery and supplies 11,244 17,610 11,244 17,565
Miscellaneous 439,005 315,453 452,268 318,189
735,226 538,398 747,491 540,478Less allowance for impairmentlosses (Note 13)
24,114 58,327 24,114 58,327
P711,112 P480,071 P723,377 P482,151
Changes in software costs of the Group and of the Parent Company are as follows (amounts in thousands):
2009 2008
Balance at beginning of year P167,290 P149,658
Additions 67,303 54,191
Amortization (43,100) (36,559)
Balance at end of year P191,493 P167,290
13. Allowance for Impairment and Credit Losses
Changes in the allowance for impairment and credit losses of the Group are summarized as follows (amounts in thousands):
2009 2008
Balances at beginning of year:
Loans and receivables (Note 7) P1,074,666 P1,095,845
Interbank loans and receivables 1,103,694 –
AFS financial assets (Note 6) 125,957 125,446
Investment properties (Note 11) 150,300 137,264
Investment in subsidiaries 14,760 12,997
Other assets (Note 12) 58,327 58,440
2,527,704 1,429,992
Provision for credit and impairment losses during the year 160,443 1,097,532
(Forward)
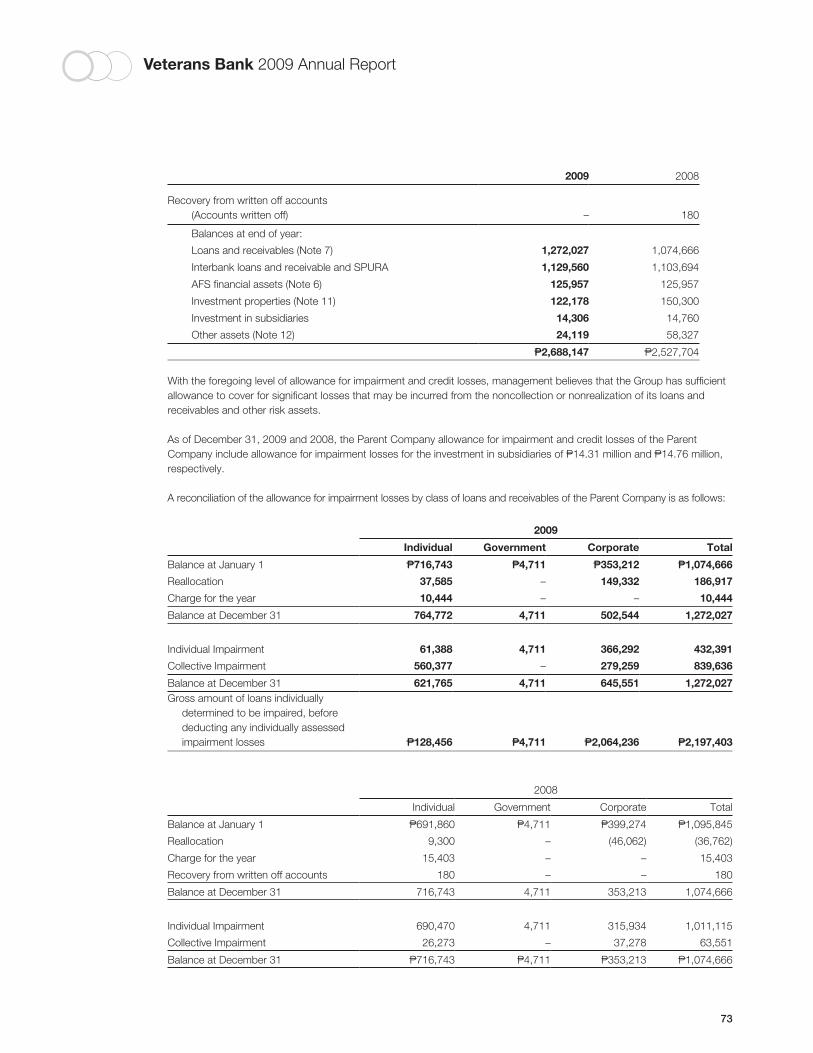
Veterans Bank 2009 Annual Report
73
2009 2008
Recovery from written off accounts (Accounts written off) – 180
Balances at end of year:
Loans and receivables (Note 7) 1,272,027 1,074,666
Interbank loans and receivable and SPURA 1,129,560 1,103,694
AFS financial assets (Note 6) 125,957 125,957
Investment properties (Note 11) 122,178 150,300
Investment in subsidiaries 14,306 14,760
Other assets (Note 12) 24,119 58,327
P2,688,147 P2,527,704
With the foregoing level of allowance for impairment and credit losses, management believes that the Group has sufficient allowance to cover for significant losses that may be incurred from the noncollection or nonrealization of its loans and receivables and other risk assets.
As of December 31, 2009 and 2008, the Parent Company allowance for impairment and credit losses of the Parent Company include allowance for impairment losses for the investment in subsidiaries of P14.31 million and P14.76 million, respectively.
A reconciliation of the allowance for impairment losses by class of loans and receivables of the Parent Company is as follows:
2009
Individual Government Corporate Total
Balance at January 1 P716,743 P4,711 P353,212 P1,074,666
Reallocation 37,585 – 149,332 186,917
Charge for the year 10,444 – – 10,444
Balance at December 31 764,772 4,711 502,544 1,272,027
Individual Impairment 61,388 4,711 366,292 432,391
Collective Impairment 560,377 – 279,259 839,636
Balance at December 31 621,765 4,711 645,551 1,272,027Gross amount of loans individually
determined to be impaired, before deducting any individually assessed impairment losses P128,456 P4,711 P2,064,236 P2,197,403
2008
Individual Government Corporate Total
Balance at January 1 P691,860 P4,711 P399,274 P1,095,845
Reallocation 9,300 – (46,062) (36,762)
Charge for the year 15,403 – – 15,403
Recovery from written off accounts 180 – – 180
Balance at December 31 716,743 4,711 353,213 1,074,666
Individual Impairment 690,470 4,711 315,934 1,011,115
Collective Impairment 26,273 – 37,278 63,551
Balance at December 31 P716,743 P4,711 P353,213 P1,074,666
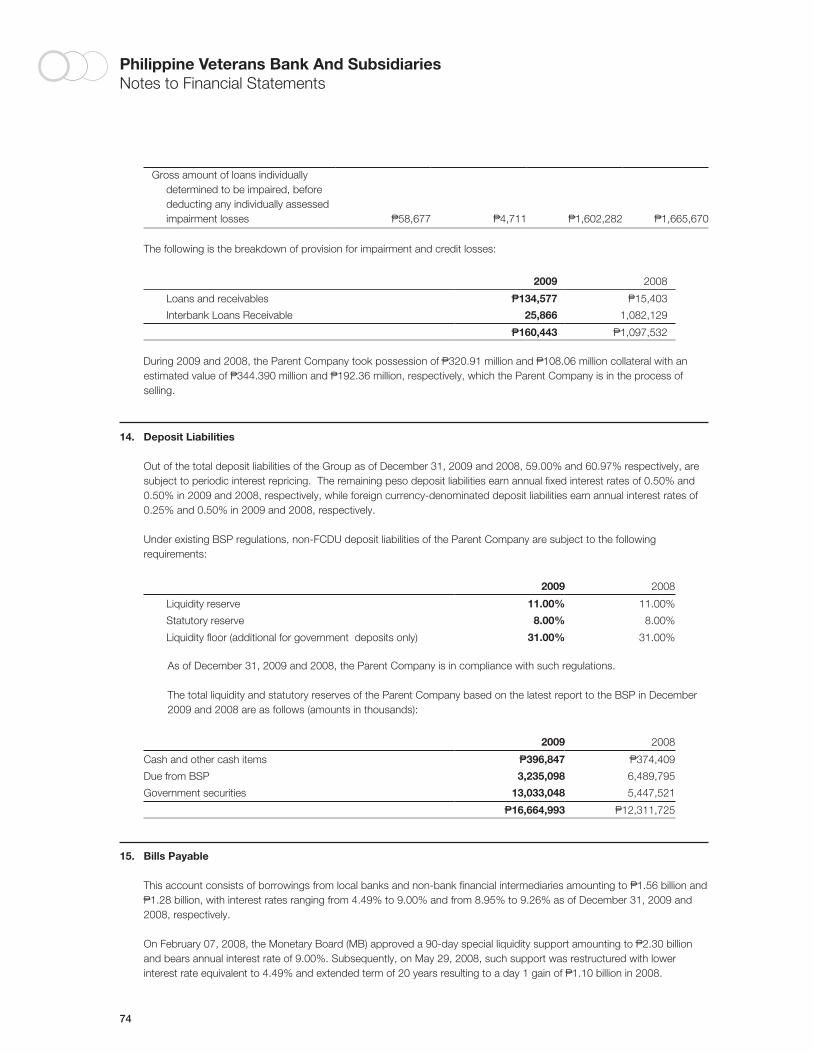
74
Philippine Veterans Bank And SubsidiariesNotes to Financial Statements
Gross amount of loans individually determined to be impaired, before deducting any individually assessed impairment losses P58,677 P4,711 P1,602,282 P1,665,670
The following is the breakdown of provision for impairment and credit losses:
2009 2008
Loans and receivables P134,577 P15,403
Interbank Loans Receivable 25,866 1,082,129
P160,443 P1,097,532
During 2009 and 2008, the Parent Company took possession of P320.91 million and P108.06 million collateral with an estimated value of P344.390 million and P192.36 million, respectively, which the Parent Company is in the process of selling.
14. Deposit Liabilities
Out of the total deposit liabilities of the Group as of December 31, 2009 and 2008, 59.00% and 60.97% respectively, are subject to periodic interest repricing. The remaining peso deposit liabilities earn annual fixed interest rates of 0.50% and 0.50% in 2009 and 2008, respectively, while foreign currency-denominated deposit liabilities earn annual interest rates of 0.25% and 0.50% in 2009 and 2008, respectively.
Under existing BSP regulations, non-FCDU deposit liabilities of the Parent Company are subject to the following requirements:
2009 2008
Liquidity reserve 11.00% 11.00%
Statutory reserve 8.00% 8.00%
Liquidity floor (additional for government deposits only) 31.00% 31.00%
As of December 31, 2009 and 2008, the Parent Company is in compliance with such regulations.
The total liquidity and statutory reserves of the Parent Company based on the latest report to the BSP in December 2009 and 2008 are as follows (amounts in thousands):
2009 2008
Cash and other cash items P396,847 P374,409
Due from BSP 3,235,098 6,489,795
Government securities 13,033,048 5,447,521
P16,664,993 P12,311,725
15. Bills Payable
This account consists of borrowings from local banks and non-bank financial intermediaries amounting to P1.56 billion and P1.28 billion, with interest rates ranging from 4.49% to 9.00% and from 8.95% to 9.26% as of December 31, 2009 and 2008, respectively.
On February 07, 2008, the Monetary Board (MB) approved a 90-day special liquidity support amounting to P2.30 billion and bears annual interest rate of 9.00%. Subsequently, on May 29, 2008, such support was restructured with lower interest rate equivalent to 4.49% and extended term of 20 years resulting to a day 1 gain of P1.10 billion in 2008.
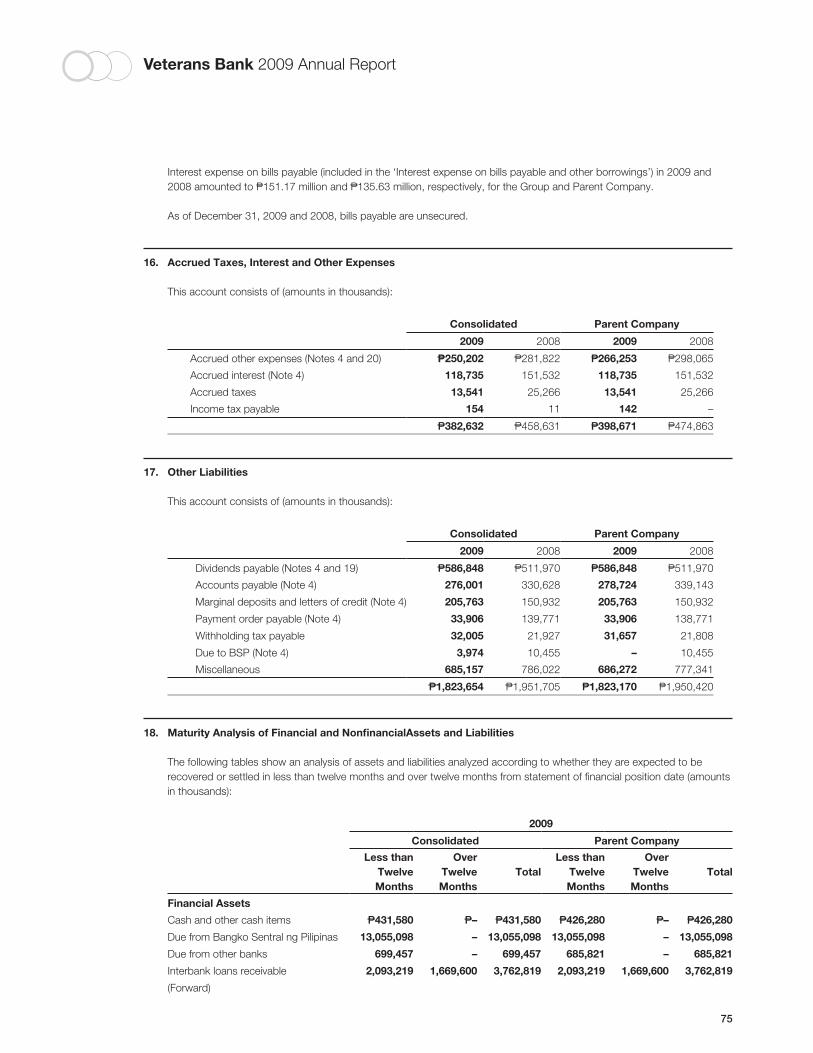
Veterans Bank 2009 Annual Report
75
Interest expense on bills payable (included in the ‘Interest expense on bills payable and other borrowings’) in 2009 and 2008 amounted to P151.17 million and P135.63 million, respectively, for the Group and Parent Company.
As of December 31, 2009 and 2008, bills payable are unsecured.
16. Accrued Taxes, Interest and Other Expenses
This account consists of (amounts in thousands):
Consolidated Parent Company
2009 2008 2009 2008
Accrued other expenses (Notes 4 and 20) P250,202 P281,822 P266,253 P298,065
Accrued interest (Note 4) 118,735 151,532 118,735 151,532
Accrued taxes 13,541 25,266 13,541 25,266
Income tax payable 154 11 142 –
P382,632 P458,631 P398,671 P474,863
17. Other Liabilities
This account consists of (amounts in thousands):
Consolidated Parent Company
2009 2008 2009 2008
Dividends payable (Notes 4 and 19) P586,848 P511,970 P586,848 P511,970
Accounts payable (Note 4) 276,001 330,628 278,724 339,143
Marginal deposits and letters of credit (Note 4) 205,763 150,932 205,763 150,932
Payment order payable (Note 4) 33,906 139,771 33,906 138,771
Withholding tax payable 32,005 21,927 31,657 21,808
Due to BSP (Note 4) 3,974 10,455 – 10,455
Miscellaneous 685,157 786,022 686,272 777,341
P1,823,654 P1,951,705 P1,823,170 P1,950,420
18. Maturity Analysis of Financial and NonfinancialAssets and Liabilities
The following tables show an analysis of assets and liabilities analyzed according to whether they are expected to be recovered or settled in less than twelve months and over twelve months from statement of financial position date (amounts in thousands):
2009
Consolidated Parent Company
Less thanTwelve Months
OverTwelveMonths
TotalLess than
Twelve Months
OverTwelveMonths
Total
Financial Assets
Cash and other cash items P431,580 P– P431,580 P426,280 P– P426,280
Due from Bangko Sentral ng Pilipinas 13,055,098 – 13,055,098 13,055,098 – 13,055,098
Due from other banks 699,457 – 699,457 685,821 – 685,821
Interbank loans receivable 2,093,219 1,669,600 3,762,819 2,093,219 1,669,600 3,762,819
(Forward)
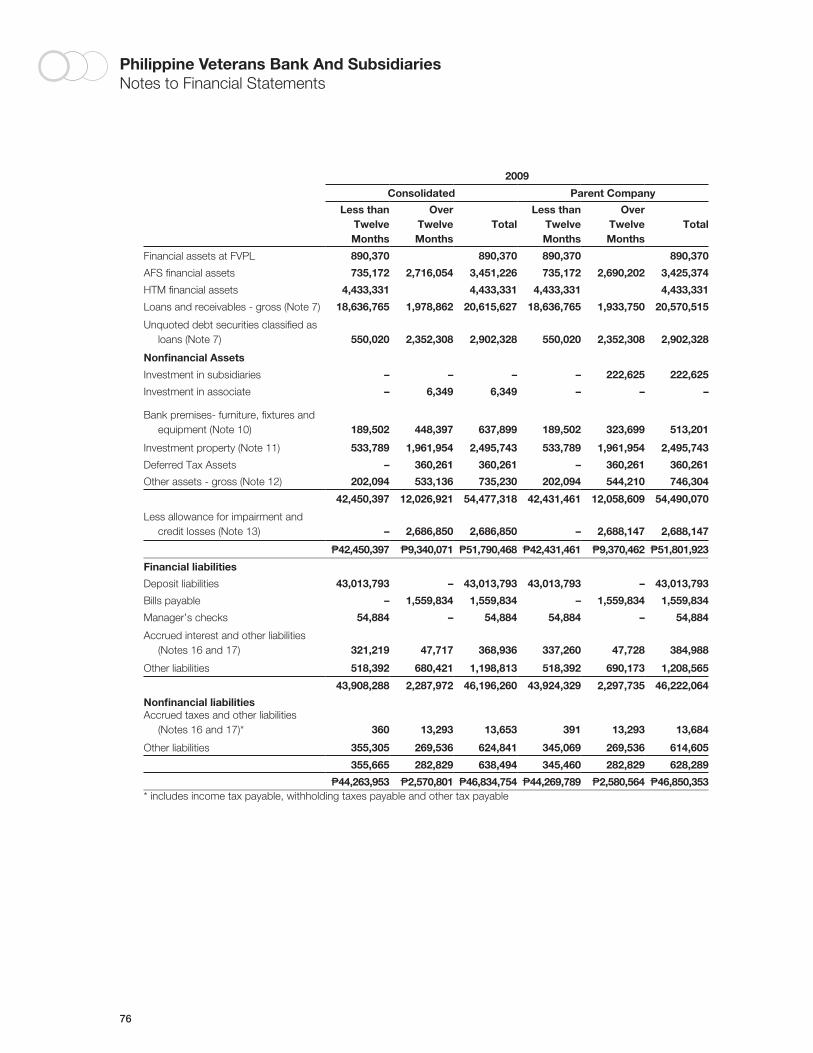
76
Philippine Veterans Bank And SubsidiariesNotes to Financial Statements
2009
Consolidated Parent Company
Less thanTwelve Months
OverTwelveMonths
TotalLess than
Twelve Months
OverTwelveMonths
Total
Financial assets at FVPL 890,370 890,370 890,370 890,370
AFS financial assets 735,172 2,716,054 3,451,226 735,172 2,690,202 3,425,374
HTM financial assets 4,433,331 4,433,331 4,433,331 4,433,331
Loans and receivables - gross (Note 7) 18,636,765 1,978,862 20,615,627 18,636,765 1,933,750 20,570,515
Unquoted debt securities classified as loans (Note 7) 550,020 2,352,308 2,902,328 550,020 2,352,308 2,902,328
Nonfinancial Assets
Investment in subsidiaries – – – – 222,625 222,625
Investment in associate – 6,349 6,349 – – –
Bank premises- furniture, fixtures and equipment (Note 10) 189,502 448,397 637,899 189,502 323,699 513,201
Investment property (Note 11) 533,789 1,961,954 2,495,743 533,789 1,961,954 2,495,743
Deferred Tax Assets – 360,261 360,261 – 360,261 360,261
Other assets - gross (Note 12) 202,094 533,136 735,230 202,094 544,210 746,304
42,450,397 12,026,921 54,477,318 42,431,461 12,058,609 54,490,070
Less allowance for impairment and credit losses (Note 13) – 2,686,850 2,686,850 – 2,688,147 2,688,147
P42,450,397 P9,340,071 P51,790,468 P42,431,461 P9,370,462 P51,801,923
Financial liabilities
Deposit liabilities 43,013,793 – 43,013,793 43,013,793 – 43,013,793
Bills payable – 1,559,834 1,559,834 – 1,559,834 1,559,834
Manager’s checks 54,884 – 54,884 54,884 – 54,884
Accrued interest and other liabilities (Notes 16 and 17) 321,219 47,717 368,936 337,260 47,728 384,988
Other liabilities 518,392 680,421 1,198,813 518,392 690,173 1,208,565
43,908,288 2,287,972 46,196,260 43,924,329 2,297,735 46,222,064
Nonfinancial liabilitiesAccrued taxes and other liabilities
(Notes 16 and 17)* 360 13,293 13,653 391 13,293 13,684
Other liabilities 355,305 269,536 624,841 345,069 269,536 614,605
355,665 282,829 638,494 345,460 282,829 628,289
P44,263,953 P2,570,801 P46,834,754 P44,269,789 P2,580,564 P46,850,353* includes income tax payable, withholding taxes payable and other tax payable
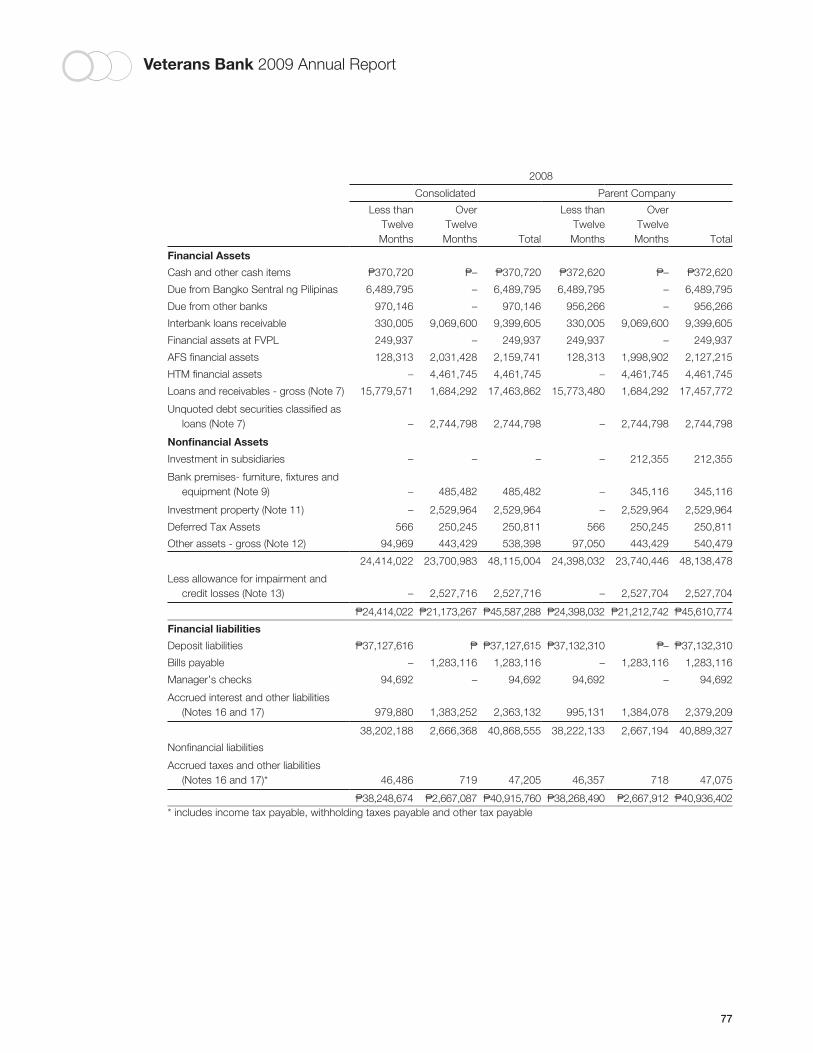
Veterans Bank 2009 Annual Report
77
2008
Consolidated Parent Company
Less thanTwelve Months
OverTwelveMonths Total
Less thanTwelve Months
OverTwelveMonths Total
Financial Assets
Cash and other cash items P370,720 P– P370,720 P372,620 P– P372,620
Due from Bangko Sentral ng Pilipinas 6,489,795 – 6,489,795 6,489,795 – 6,489,795
Due from other banks 970,146 – 970,146 956,266 – 956,266
Interbank loans receivable 330,005 9,069,600 9,399,605 330,005 9,069,600 9,399,605
Financial assets at FVPL 249,937 – 249,937 249,937 – 249,937
AFS financial assets 128,313 2,031,428 2,159,741 128,313 1,998,902 2,127,215
HTM financial assets – 4,461,745 4,461,745 – 4,461,745 4,461,745
Loans and receivables - gross (Note 7) 15,779,571 1,684,292 17,463,862 15,773,480 1,684,292 17,457,772
Unquoted debt securities classified as loans (Note 7) – 2,744,798 2,744,798 – 2,744,798 2,744,798
Nonfinancial Assets
Investment in subsidiaries – – – – 212,355 212,355
Bank premises- furniture, fixtures and equipment (Note 9) – 485,482 485,482 – 345,116 345,116
Investment property (Note 11) – 2,529,964 2,529,964 – 2,529,964 2,529,964
Deferred Tax Assets 566 250,245 250,811 566 250,245 250,811
Other assets - gross (Note 12) 94,969 443,429 538,398 97,050 443,429 540,479
24,414,022 23,700,983 48,115,004 24,398,032 23,740,446 48,138,478
Less allowance for impairment and credit losses (Note 13) – 2,527,716 2,527,716 – 2,527,704 2,527,704
P24,414,022 P21,173,267 P45,587,288 P24,398,032 P21,212,742 P45,610,774
Financial liabilities
Deposit liabilities P37,127,616 P P37,127,615 P37,132,310 P– P37,132,310
Bills payable – 1,283,116 1,283,116 – 1,283,116 1,283,116
Manager’s checks 94,692 – 94,692 94,692 – 94,692
Accrued interest and other liabilities (Notes 16 and 17) 979,880 1,383,252 2,363,132 995,131 1,384,078 2,379,209
38,202,188 2,666,368 40,868,555 38,222,133 2,667,194 40,889,327
Nonfinancial liabilities
Accrued taxes and other liabilities (Notes 16 and 17)* 46,486 719 47,205 46,357 718 47,075
P38,248,674 P2,667,087 P40,915,760 P38,268,490 P2,667,912 P40,936,402* includes income tax payable, withholding taxes payable and other tax payable
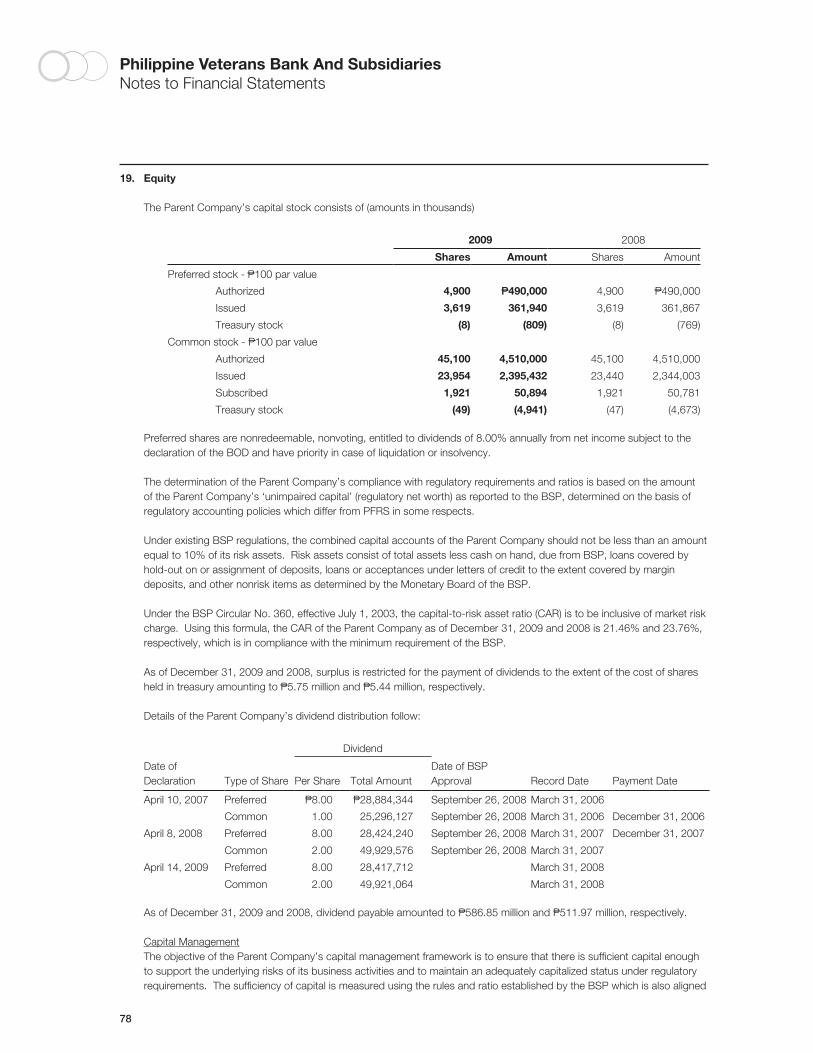
78
Philippine Veterans Bank And SubsidiariesNotes to Financial Statements
19. Equity
The Parent Company’s capital stock consists of (amounts in thousands)
2009 2008
Shares Amount Shares Amount
Preferred stock - P100 par value
Authorized 4,900 P490,000 4,900 P490,000
Issued 3,619 361,940 3,619 361,867
Treasury stock (8) (809) (8) (769)
Common stock - P100 par value
Authorized 45,100 4,510,000 45,100 4,510,000
Issued 23,954 2,395,432 23,440 2,344,003
Subscribed 1,921 50,894 1,921 50,781
Treasury stock (49) (4,941) (47) (4,673)
Preferred shares are nonredeemable, nonvoting, entitled to dividends of 8.00% annually from net income subject to the declaration of the BOD and have priority in case of liquidation or insolvency.
The determination of the Parent Company’s compliance with regulatory requirements and ratios is based on the amount of the Parent Company’s ‘unimpaired capital’ (regulatory net worth) as reported to the BSP, determined on the basis of regulatory accounting policies which differ from PFRS in some respects.
Under existing BSP regulations, the combined capital accounts of the Parent Company should not be less than an amount equal to 10% of its risk assets. Risk assets consist of total assets less cash on hand, due from BSP, loans covered by hold-out on or assignment of deposits, loans or acceptances under letters of credit to the extent covered by margin deposits, and other nonrisk items as determined by the Monetary Board of the BSP.
Under the BSP Circular No. 360, effective July 1, 2003, the capital-to-risk asset ratio (CAR) is to be inclusive of market risk charge. Using this formula, the CAR of the Parent Company as of December 31, 2009 and 2008 is 21.46% and 23.76%, respectively, which is in compliance with the minimum requirement of the BSP.
As of December 31, 2009 and 2008, surplus is restricted for the payment of dividends to the extent of the cost of shares held in treasury amounting to P5.75 million and P5.44 million, respectively.
Details of the Parent Company’s dividend distribution follow:
Dividend
Date of Declaration Type of Share Per Share Total Amount
Date of BSPApproval Record Date Payment Date
April 10, 2007 Preferred P8.00 P28,884,344 September 26, 2008 March 31, 2006
Common 1.00 25,296,127 September 26, 2008 March 31, 2006 December 31, 2006
April 8, 2008 Preferred 8.00 28,424,240 September 26, 2008 March 31, 2007 December 31, 2007
Common 2.00 49,929,576 September 26, 2008 March 31, 2007
April 14, 2009 Preferred 8.00 28,417,712 March 31, 2008
Common 2.00 49,921,064 March 31, 2008
As of December 31, 2009 and 2008, dividend payable amounted to P586.85 million and P511.97 million, respectively.
Capital Management The objective of the Parent Company’s capital management framework is to ensure that there is sufficient capital enough
to support the underlying risks of its business activities and to maintain an adequately capitalized status under regulatory requirements. The sufficiency of capital is measured using the rules and ratio established by the BSP which is also aligned
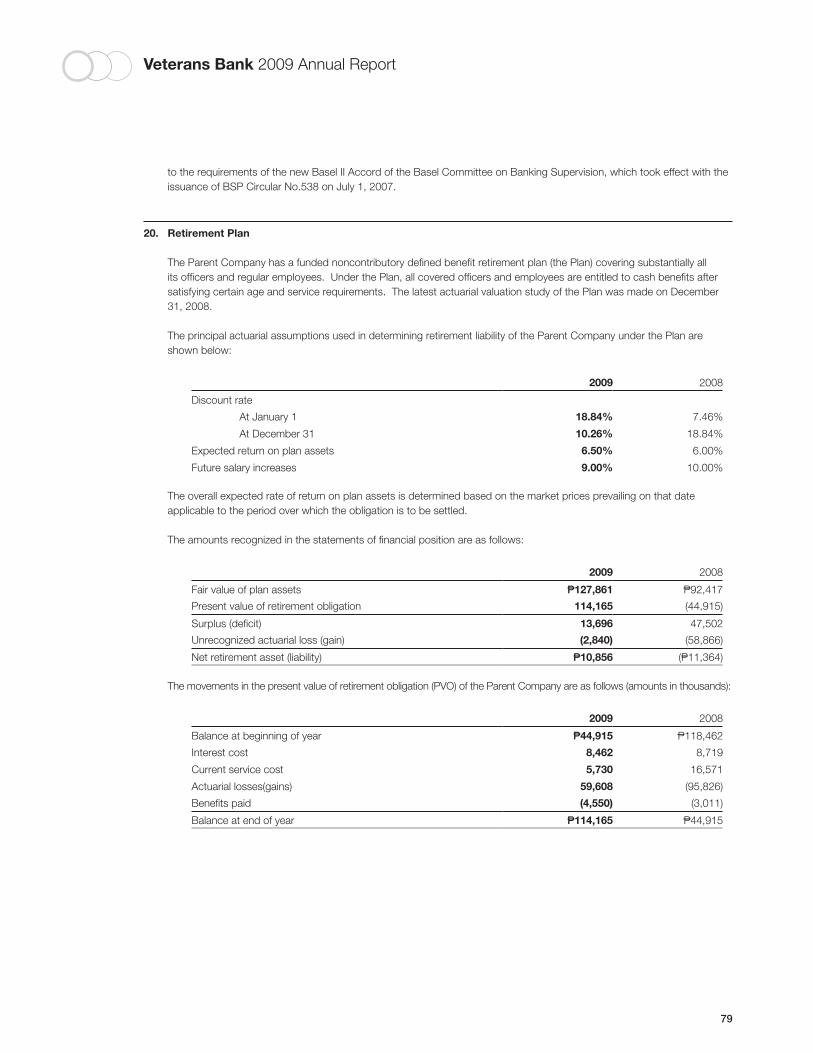
Veterans Bank 2009 Annual Report
79
to the requirements of the new Basel II Accord of the Basel Committee on Banking Supervision, which took effect with the issuance of BSP Circular No.538 on July 1, 2007.
20. Retirement Plan
The Parent Company has a funded noncontributory defined benefit retirement plan (the Plan) covering substantially all its officers and regular employees. Under the Plan, all covered officers and employees are entitled to cash benefits after satisfying certain age and service requirements. The latest actuarial valuation study of the Plan was made on December 31, 2008.
The principal actuarial assumptions used in determining retirement liability of the Parent Company under the Plan are shown below:
2009 2008
Discount rate
At January 1 18.84% 7.46%
At December 31 10.26% 18.84%
Expected return on plan assets 6.50% 6.00%
Future salary increases 9.00% 10.00%
The overall expected rate of return on plan assets is determined based on the market prices prevailing on that date applicable to the period over which the obligation is to be settled.
The amounts recognized in the statements of financial position are as follows:
2009 2008
Fair value of plan assets P127,861 P92,417
Present value of retirement obligation 114,165 (44,915)
Surplus (deficit) 13,696 47,502
Unrecognized actuarial loss (gain) (2,840) (58,866)
Net retirement asset (liability) P10,856 (P11,364)
The movements in the present value of retirement obligation (PVO) of the Parent Company are as follows (amounts in thousands):
2009 2008
Balance at beginning of year P44,915 P118,462
Interest cost 8,462 8,719
Current service cost 5,730 16,571
Actuarial losses(gains) 59,608 (95,826)
Benefits paid (4,550) (3,011)
Balance at end of year P114,165 P44,915
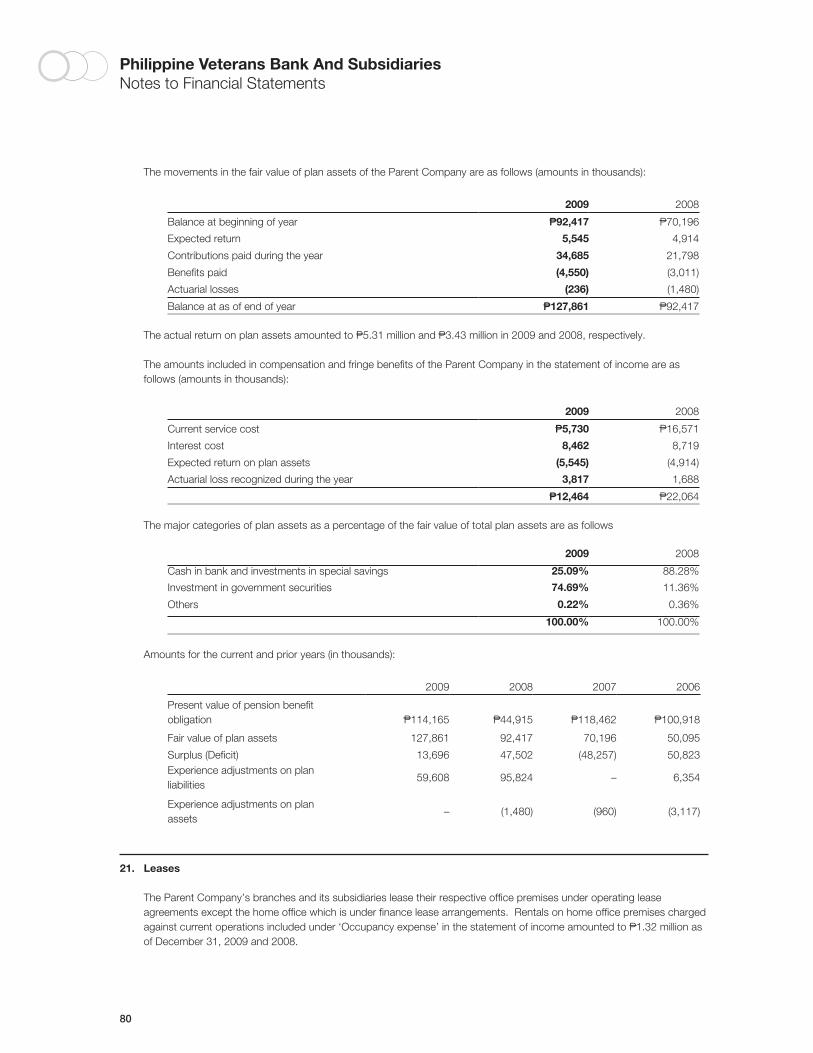
80
Philippine Veterans Bank And SubsidiariesNotes to Financial Statements
The movements in the fair value of plan assets of the Parent Company are as follows (amounts in thousands):
2009 2008
Balance at beginning of year P92,417 P70,196
Expected return 5,545 4,914
Contributions paid during the year 34,685 21,798
Benefits paid (4,550) (3,011)
Actuarial losses (236) (1,480)
Balance at as of end of year P127,861 P92,417
The actual return on plan assets amounted to P5.31 million and P3.43 million in 2009 and 2008, respectively.
The amounts included in compensation and fringe benefits of the Parent Company in the statement of income are as follows (amounts in thousands):
2009 2008
Current service cost P5,730 P16,571
Interest cost 8,462 8,719
Expected return on plan assets (5,545) (4,914)
Actuarial loss recognized during the year 3,817 1,688
P12,464 P22,064
The major categories of plan assets as a percentage of the fair value of total plan assets are as follows
2009 2008
Cash in bank and investments in special savings 25.09% 88.28%
Investment in government securities 74.69% 11.36%
Others 0.22% 0.36%
100.00% 100.00%
Amounts for the current and prior years (in thousands):
2009 2008 2007 2006
Present value of pension benefit obligation P114,165 P44,915 P118,462 P100,918
Fair value of plan assets 127,861 92,417 70,196 50,095
Surplus (Deficit) 13,696 47,502 (48,257) 50,823Experience adjustments on plan liabilities
59,608 95,824 – 6,354
Experience adjustments on plan assets
– (1,480) (960) (3,117)
21. Leases
The Parent Company’s branches and its subsidiaries lease their respective office premises under operating lease agreements except the home office which is under finance lease arrangements. Rentals on home office premises charged against current operations included under ‘Occupancy expense’ in the statement of income amounted to P1.32 million as of December 31, 2009 and 2008.
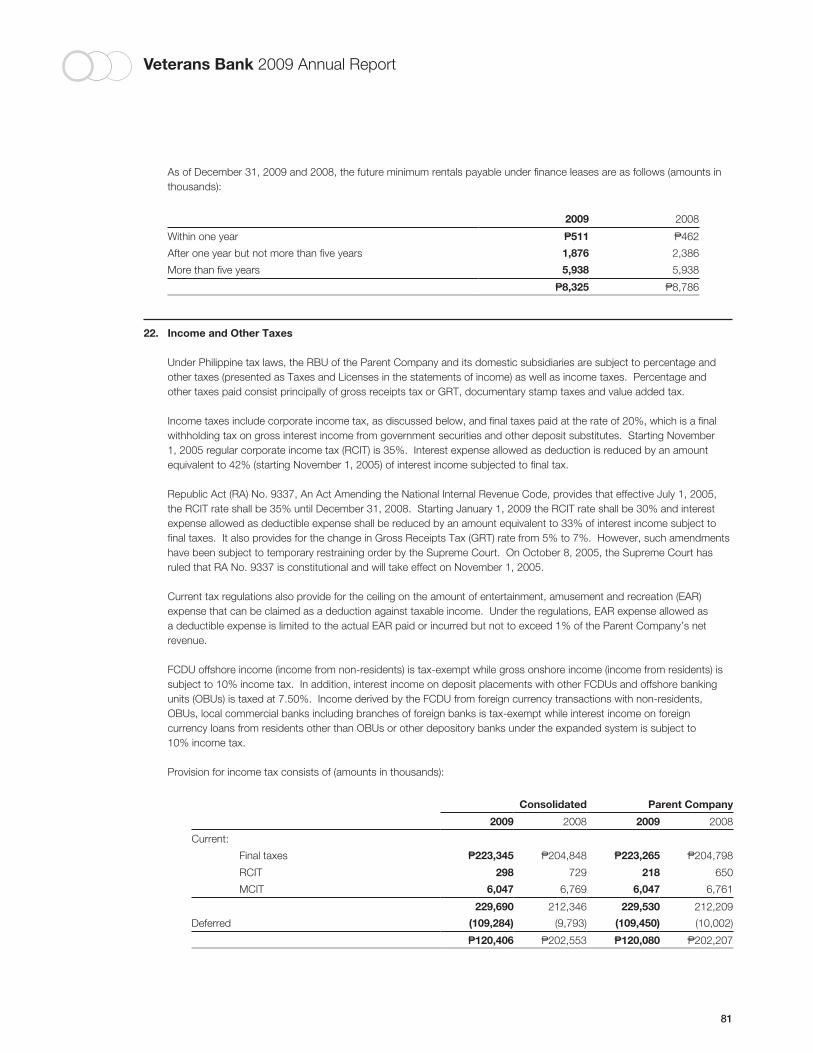
Veterans Bank 2009 Annual Report
81
As of December 31, 2009 and 2008, the future minimum rentals payable under finance leases are as follows (amounts in thousands):
2009 2008
Within one year P511 P462
After one year but not more than five years 1,876 2,386
More than five years 5,938 5,938
P8,325 P8,786
22. Income and Other Taxes
Under Philippine tax laws, the RBU of the Parent Company and its domestic subsidiaries are subject to percentage and other taxes (presented as Taxes and Licenses in the statements of income) as well as income taxes. Percentage and other taxes paid consist principally of gross receipts tax or GRT, documentary stamp taxes and value added tax.
Income taxes include corporate income tax, as discussed below, and final taxes paid at the rate of 20%, which is a final withholding tax on gross interest income from government securities and other deposit substitutes. Starting November 1, 2005 regular corporate income tax (RCIT) is 35%. Interest expense allowed as deduction is reduced by an amount equivalent to 42% (starting November 1, 2005) of interest income subjected to final tax.
Republic Act (RA) No. 9337, An Act Amending the National Internal Revenue Code, provides that effective July 1, 2005, the RCIT rate shall be 35% until December 31, 2008. Starting January 1, 2009 the RCIT rate shall be 30% and interest expense allowed as deductible expense shall be reduced by an amount equivalent to 33% of interest income subject to final taxes. It also provides for the change in Gross Receipts Tax (GRT) rate from 5% to 7%. However, such amendments have been subject to temporary restraining order by the Supreme Court. On October 8, 2005, the Supreme Court has ruled that RA No. 9337 is constitutional and will take effect on November 1, 2005.
Current tax regulations also provide for the ceiling on the amount of entertainment, amusement and recreation (EAR) expense that can be claimed as a deduction against taxable income. Under the regulations, EAR expense allowed as a deductible expense is limited to the actual EAR paid or incurred but not to exceed 1% of the Parent Company’s net revenue.
FCDU offshore income (income from non-residents) is tax-exempt while gross onshore income (income from residents) is subject to 10% income tax. In addition, interest income on deposit placements with other FCDUs and offshore banking units (OBUs) is taxed at 7.50%. Income derived by the FCDU from foreign currency transactions with non-residents, OBUs, local commercial banks including branches of foreign banks is tax-exempt while interest income on foreign currency loans from residents other than OBUs or other depository banks under the expanded system is subject to 10% income tax.
Provision for income tax consists of (amounts in thousands):
Consolidated Parent Company
2009 2008 2009 2008
Current:
Final taxes P223,345 P204,848 P223,265 P204,798
RCIT 298 729 218 650
MCIT 6,047 6,769 6,047 6,761
229,690 212,346 229,530 212,209
Deferred (109,284) (9,793) (109,450) (10,002)
P120,406 P202,553 P120,080 P202,207
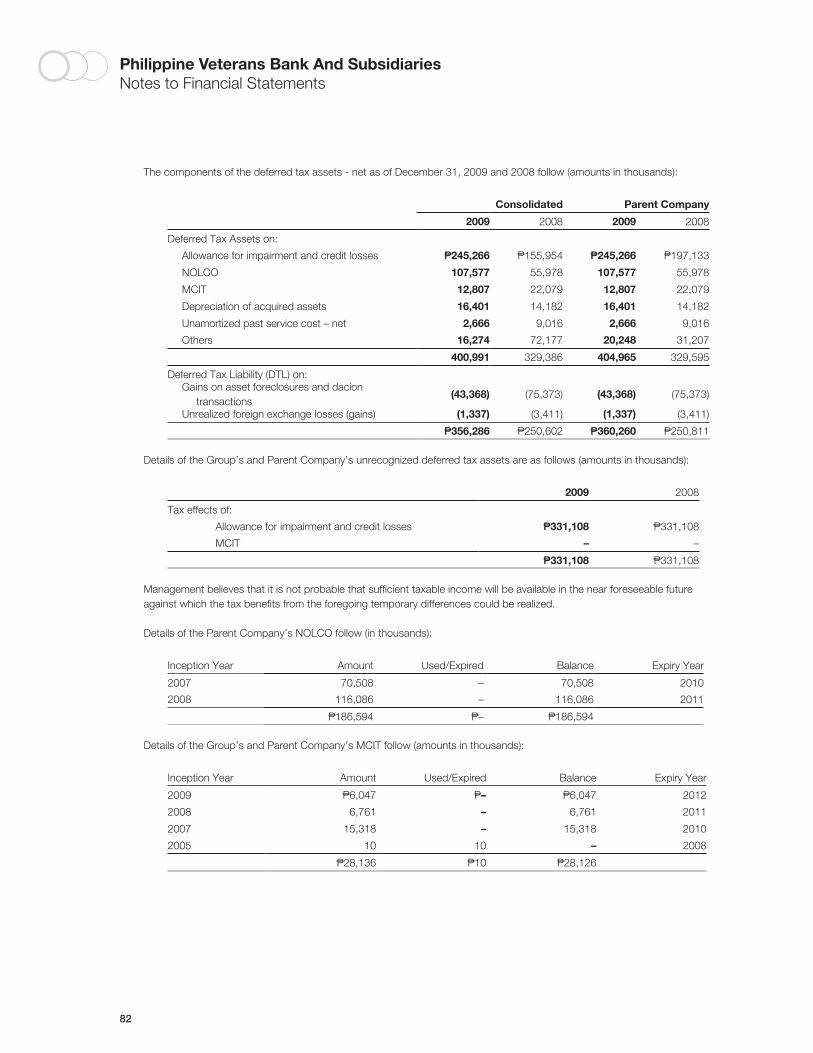
82
Philippine Veterans Bank And SubsidiariesNotes to Financial Statements
The components of the deferred tax assets - net as of December 31, 2009 and 2008 follow (amounts in thousands):
Consolidated Parent Company
2009 2008 2009 2008
Deferred Tax Assets on:
Allowance for impairment and credit losses P245,266 P155,954 P245,266 P197,133
NOLCO 107,577 55,978 107,577 55,978
MCIT 12,807 22,079 12,807 22,079
Depreciation of acquired assets 16,401 14,182 16,401 14,182
Unamortized past service cost – net 2,666 9,016 2,666 9,016
Others 16,274 72,177 20,248 31,207
400,991 329,386 404,965 329,595
Deferred Tax Liability (DTL) on: Gains on asset foreclosures and dacion
transactions(43,368) (75,373) (43,368) (75,373)
Unrealized foreign exchange losses (gains) (1,337) (3,411) (1,337) (3,411)
P356,286 P250,602 P360,260 P250,811
Details of the Group’s and Parent Company’s unrecognized deferred tax assets are as follows (amounts in thousands):
2009 2008
Tax effects of:
Allowance for impairment and credit losses P331,108 P331,108
MCIT – –
P331,108 P331,108
Management believes that it is not probable that sufficient taxable income will be available in the near foreseeable future against which the tax benefits from the foregoing temporary differences could be realized.
Details of the Parent Company’s NOLCO follow (in thousands):
Inception Year Amount Used/Expired Balance Expiry Year
2007 70,508 – 70,508 2010
2008 116,086 – 116,086 2011
P186,594 P– P186,594
Details of the Group’s and Parent Company’s MCIT follow (amounts in thousands):
Inception Year Amount Used/Expired Balance Expiry Year
2009 P6,047 P– P6,047 2012
2008 6,761 – 6,761 2011
2007 15,318 – 15,318 2010
2005 10 10 – 2008
P28,136 P10 P28,126
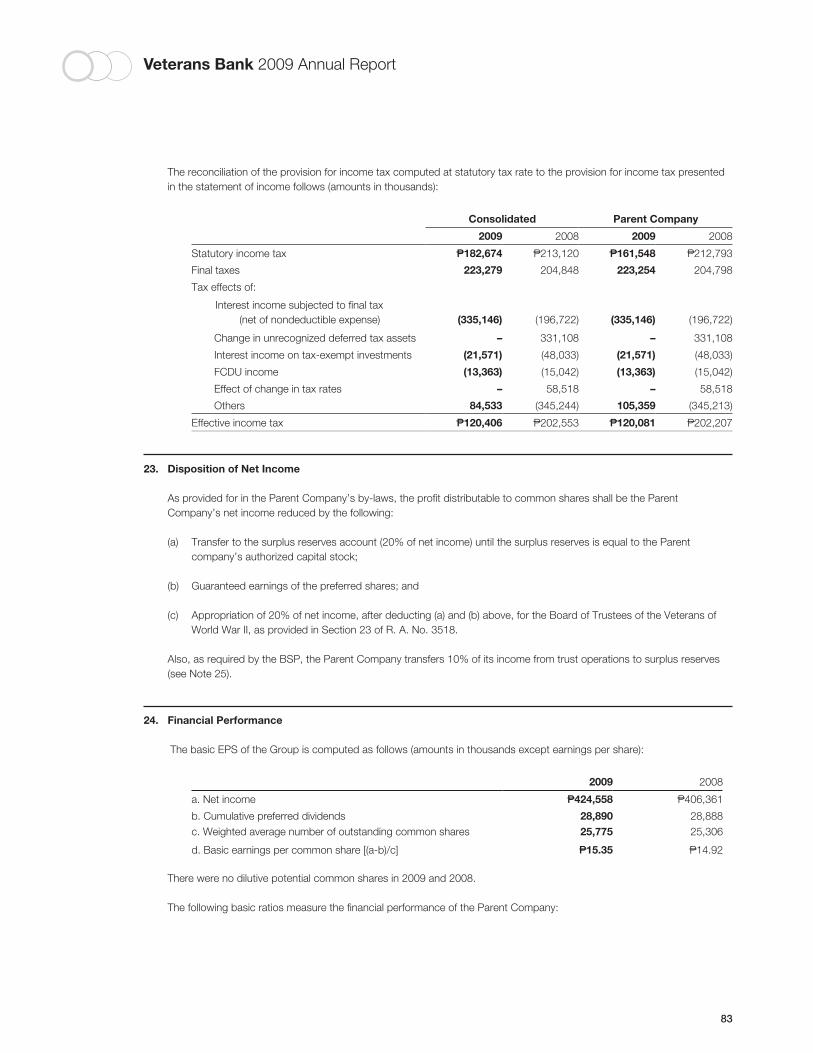
Veterans Bank 2009 Annual Report
83
The reconciliation of the provision for income tax computed at statutory tax rate to the provision for income tax presented in the statement of income follows (amounts in thousands):
Consolidated Parent Company
2009 2008 2009 2008
Statutory income tax P182,674 P213,120 P161,548 P212,793
Final taxes 223,279 204,848 223,254 204,798
Tax effects of:
Interest income subjected to final tax (net of nondeductible expense) (335,146) (196,722) (335,146) (196,722)
Change in unrecognized deferred tax assets – 331,108 – 331,108
Interest income on tax-exempt investments (21,571) (48,033) (21,571) (48,033)
FCDU income (13,363) (15,042) (13,363) (15,042)
Effect of change in tax rates – 58,518 – 58,518
Others 84,533 (345,244) 105,359 (345,213)
Effective income tax P120,406 P202,553 P120,081 P202,207
23. Disposition of Net Income
As provided for in the Parent Company’s by-laws, the profit distributable to common shares shall be the Parent Company’s net income reduced by the following:
(a) Transfer to the surplus reserves account (20% of net income) until the surplus reserves is equal to the Parent company’s authorized capital stock;
(b) Guaranteed earnings of the preferred shares; and
(c) Appropriation of 20% of net income, after deducting (a) and (b) above, for the Board of Trustees of the Veterans of World War II, as provided in Section 23 of R. A. No. 3518.
Also, as required by the BSP, the Parent Company transfers 10% of its income from trust operations to surplus reserves (see Note 25).
24. Financial Performance
The basic EPS of the Group is computed as follows (amounts in thousands except earnings per share):
2009 2008
a. Net income P424,558 P406,361
b. Cumulative preferred dividends 28,890 28,888c. Weighted average number of outstanding common shares 25,775 25,306
d. Basic earnings per common share [(a-b)/c] P15.35 P14.92
There were no dilutive potential common shares in 2009 and 2008.
The following basic ratios measure the financial performance of the Parent Company:
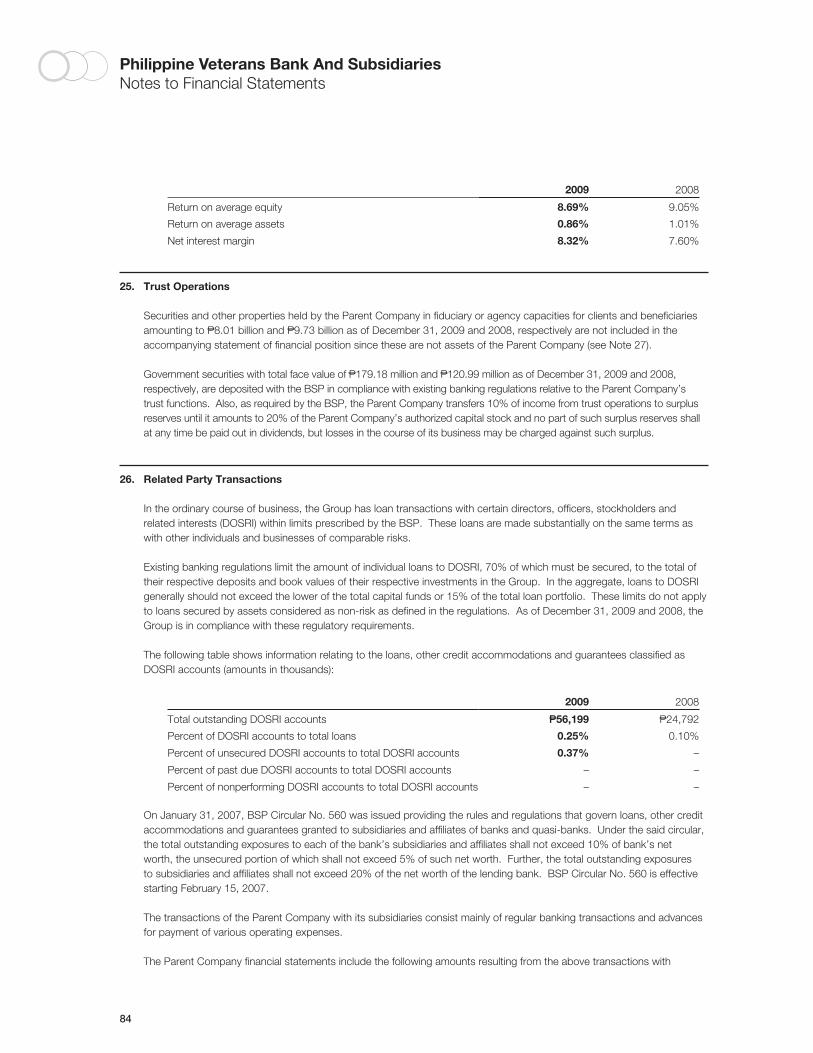
84
Philippine Veterans Bank And SubsidiariesNotes to Financial Statements
2009 2008
Return on average equity 8.69% 9.05%
Return on average assets 0.86% 1.01%
Net interest margin 8.32% 7.60%
25. Trust Operations
Securities and other properties held by the Parent Company in fiduciary or agency capacities for clients and beneficiaries amounting to P8.01 billion and P9.73 billion as of December 31, 2009 and 2008, respectively are not included in the accompanying statement of financial position since these are not assets of the Parent Company (see Note 27).
Government securities with total face value of P179.18 million and P120.99 million as of December 31, 2009 and 2008, respectively, are deposited with the BSP in compliance with existing banking regulations relative to the Parent Company’s trust functions. Also, as required by the BSP, the Parent Company transfers 10% of income from trust operations to surplus reserves until it amounts to 20% of the Parent Company’s authorized capital stock and no part of such surplus reserves shall at any time be paid out in dividends, but losses in the course of its business may be charged against such surplus.
26. Related Party Transactions
In the ordinary course of business, the Group has loan transactions with certain directors, officers, stockholders and related interests (DOSRI) within limits prescribed by the BSP. These loans are made substantially on the same terms as with other individuals and businesses of comparable risks.
Existing banking regulations limit the amount of individual loans to DOSRI, 70% of which must be secured, to the total of their respective deposits and book values of their respective investments in the Group. In the aggregate, loans to DOSRI generally should not exceed the lower of the total capital funds or 15% of the total loan portfolio. These limits do not apply to loans secured by assets considered as non-risk as defined in the regulations. As of December 31, 2009 and 2008, the Group is in compliance with these regulatory requirements.
The following table shows information relating to the loans, other credit accommodations and guarantees classified as DOSRI accounts (amounts in thousands):
2009 2008
Total outstanding DOSRI accounts P56,199 P24,792
Percent of DOSRI accounts to total loans 0.25% 0.10%
Percent of unsecured DOSRI accounts to total DOSRI accounts 0.37% –
Percent of past due DOSRI accounts to total DOSRI accounts – –
Percent of nonperforming DOSRI accounts to total DOSRI accounts – –
On January 31, 2007, BSP Circular No. 560 was issued providing the rules and regulations that govern loans, other credit accommodations and guarantees granted to subsidiaries and affiliates of banks and quasi-banks. Under the said circular, the total outstanding exposures to each of the bank’s subsidiaries and affiliates shall not exceed 10% of bank’s net worth, the unsecured portion of which shall not exceed 5% of such net worth. Further, the total outstanding exposures to subsidiaries and affiliates shall not exceed 20% of the net worth of the lending bank. BSP Circular No. 560 is effective starting February 15, 2007.
The transactions of the Parent Company with its subsidiaries consist mainly of regular banking transactions and advances for payment of various operating expenses.
The Parent Company financial statements include the following amounts resulting from the above transactions with
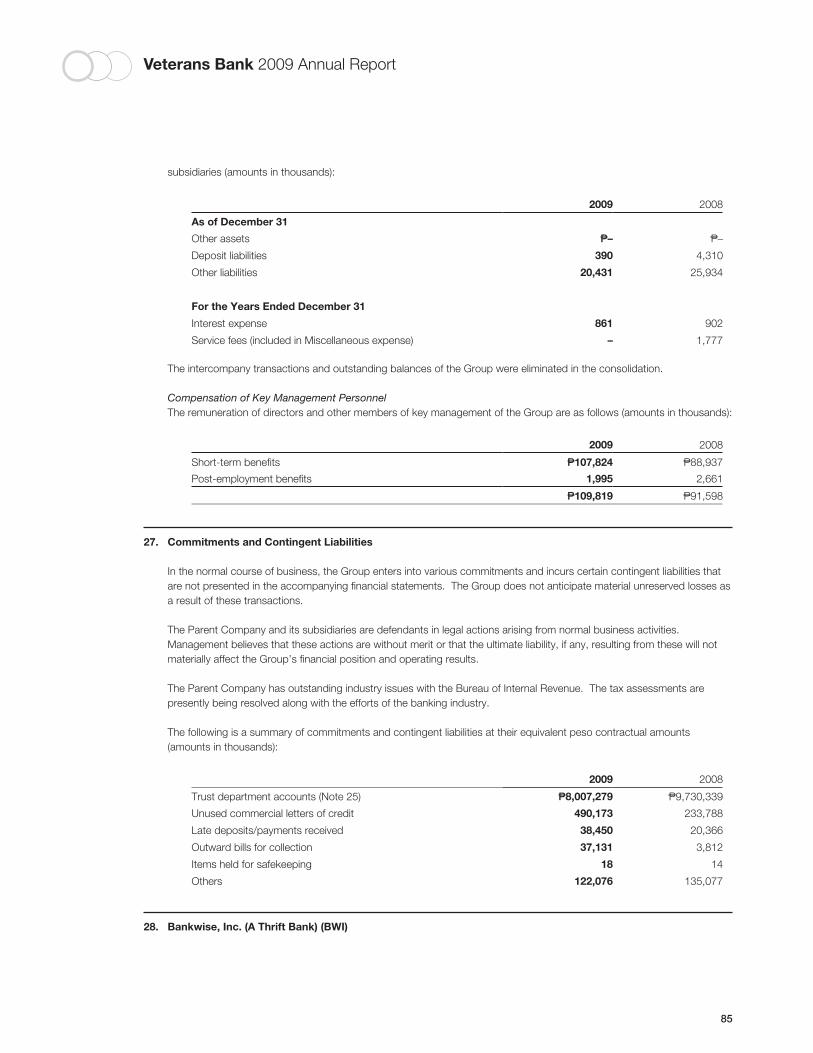
Veterans Bank 2009 Annual Report
85
subsidiaries (amounts in thousands):
2009 2008
As of December 31
Other assets P– P–
Deposit liabilities 390 4,310
Other liabilities 20,431 25,934
For the Years Ended December 31
Interest expense 861 902
Service fees (included in Miscellaneous expense) – 1,777
The intercompany transactions and outstanding balances of the Group were eliminated in the consolidation.
Compensation of Key Management PersonnelThe remuneration of directors and other members of key management of the Group are as follows (amounts in thousands):
2009 2008
Short-term benefits P107,824 P88,937
Post-employment benefits 1,995 2,661
P109,819 P91,598
27. Commitments and Contingent Liabilities
In the normal course of business, the Group enters into various commitments and incurs certain contingent liabilities that are not presented in the accompanying financial statements. The Group does not anticipate material unreserved losses as a result of these transactions.
The Parent Company and its subsidiaries are defendants in legal actions arising from normal business activities. Management believes that these actions are without merit or that the ultimate liability, if any, resulting from these will not materially affect the Group’s financial position and operating results.
The Parent Company has outstanding industry issues with the Bureau of Internal Revenue. The tax assessments are presently being resolved along with the efforts of the banking industry.
The following is a summary of commitments and contingent liabilities at their equivalent peso contractual amounts (amounts in thousands):
2009 2008
Trust department accounts (Note 25) P8,007,279 P9,730,339
Unused commercial letters of credit 490,173 233,788
Late deposits/payments received 38,450 20,366
Outward bills for collection 37,131 3,812
Items held for safekeeping 18 14
Others 122,076 135,077
28. Bankwise, Inc. (A Thrift Bank) (BWI)
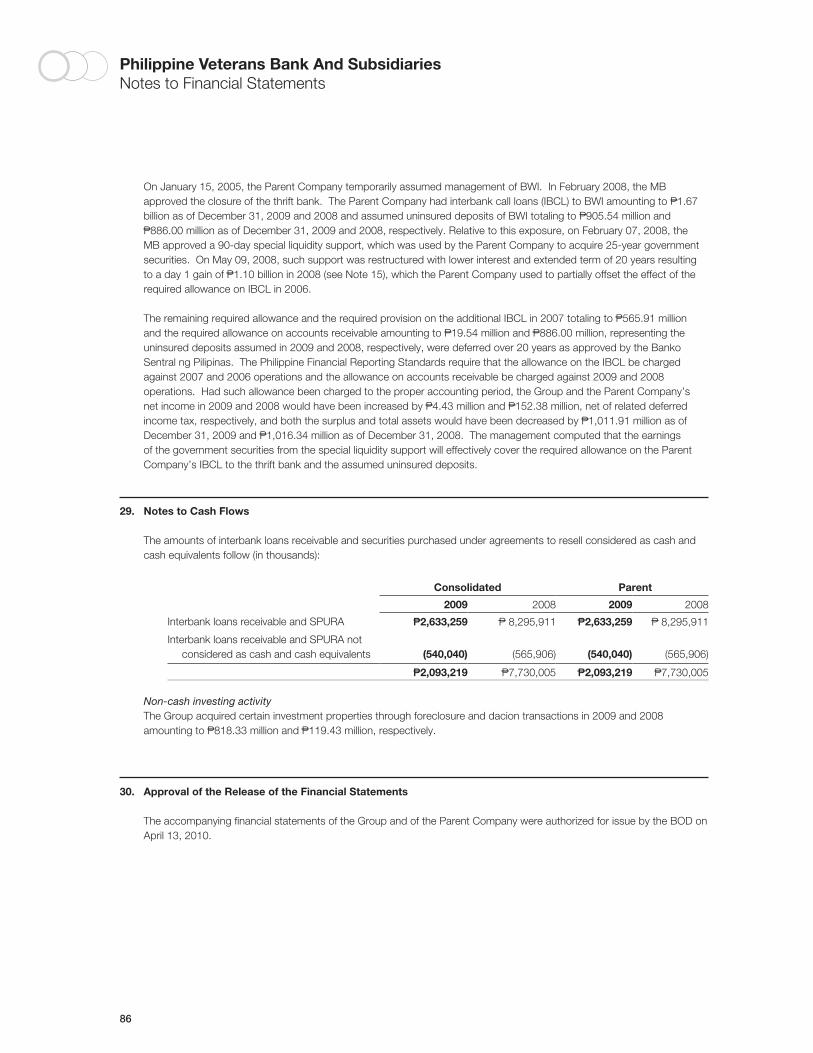
86
Philippine Veterans Bank And SubsidiariesNotes to Financial Statements
On January 15, 2005, the Parent Company temporarily assumed management of BWI. In February 2008, the MB approved the closure of the thrift bank. The Parent Company had interbank call loans (IBCL) to BWI amounting to P1.67 billion as of December 31, 2009 and 2008 and assumed uninsured deposits of BWI totaling to P905.54 million and P886.00 million as of December 31, 2009 and 2008, respectively. Relative to this exposure, on February 07, 2008, the MB approved a 90-day special liquidity support, which was used by the Parent Company to acquire 25-year government securities. On May 09, 2008, such support was restructured with lower interest and extended term of 20 years resulting to a day 1 gain of P1.10 billion in 2008 (see Note 15), which the Parent Company used to partially offset the effect of the required allowance on IBCL in 2006.
The remaining required allowance and the required provision on the additional IBCL in 2007 totaling to P565.91 million and the required allowance on accounts receivable amounting to P19.54 million and P886.00 million, representing the uninsured deposits assumed in 2009 and 2008, respectively, were deferred over 20 years as approved by the Banko Sentral ng Pilipinas. The Philippine Financial Reporting Standards require that the allowance on the IBCL be charged against 2007 and 2006 operations and the allowance on accounts receivable be charged against 2009 and 2008 operations. Had such allowance been charged to the proper accounting period, the Group and the Parent Company’s net income in 2009 and 2008 would have been increased by P4.43 million and P152.38 million, net of related deferred income tax, respectively, and both the surplus and total assets would have been decreased by P1,011.91 million as of December 31, 2009 and P1,016.34 million as of December 31, 2008. The management computed that the earnings of the government securities from the special liquidity support will effectively cover the required allowance on the Parent Company’s IBCL to the thrift bank and the assumed uninsured deposits.
29. Notes to Cash Flows
The amounts of interbank loans receivable and securities purchased under agreements to resell considered as cash and cash equivalents follow (in thousands):
Consolidated Parent
2009 2008 2009 2008
Interbank loans receivable and SPURA P2,633,259 P 8,295,911 P2,633,259 P 8,295,911
Interbank loans receivable and SPURA not considered as cash and cash equivalents (540,040) (565,906) (540,040) (565,906)
P2,093,219 P7,730,005 P2,093,219 P7,730,005
Non-cash investing activityThe Group acquired certain investment properties through foreclosure and dacion transactions in 2009 and 2008 amounting to P818.33 million and P119.43 million, respectively.
30. Approval of the Release of the Financial Statements
The accompanying financial statements of the Group and of the Parent Company were authorized for issue by the BOD on April 13, 2010.