Embed Size (px)
Citation preview
Independent auditors’ report to the shareholders 32
Financial statements Statement of financial position 33Statement of income 35Statement of comprehensive income 35Statement of changes in equity 36-37Statement of cash flows 38The formation, status and activities of APICORP 39
Significant accounting policies applied in the financial statements 40-49
Notes to the financial statements 50-78
Financial Statementsas at 31 December 2011
APICORP 31
INDEPENDENT AUDITORS’ REPORT TO THE SHAREHOLDERSArab Petroleum Investments Corporation, Dammam, Saudi Arabia7 April 2012
REPORT ON THE FINANCIAL STATEMENTSWe have audited the accompanying financial statements of Arab Petroleum Investments Corporation (“the Corporation”), which comprise the statement of financial position as at 31 December 2011, and the statements of income, comprehensive income, changes in equity and cash flows for the year then ended, and notes, comprising a summary of significant accounting policies and other explanatory information.
RESPONSIBILITy OF THE MANAGEMENT AND THE BOARD OF DIRECTORS FOR THE FINANCIAL STATEMENTSThe management and the Board of Directors of the Corporation are responsible for the preparation and fair presentation of these financial statements in accordance with International Financial Reporting Standards, and for such internal control as the management and the Board of Directors determine is necessary to enable the preparation of financial statements that are free from material misstatement, whether due to fraud or error.
AUDITORS’ RESPONSIBILITyOur responsibility is to express an opinion on these financial statements based on our audit. We conducted our audit in accordance with International Standards on Auditing. Those standards require that we comply with ethical requirements and plan and perform the audit to obtain reasonable assurance about whether the financial statements are free from material misstatement.
An audit involves performing procedures to obtain audit evidence about the amounts and disclosures in the financial statements. The procedures selected depend on our judgment, including the assessment of the risks of material misstatement of the financial statements, whether due to fraud or error. In making those risk assessments, we consider internal control relevant to the Corporation’s preparation and fair presentation of the financial statements in order to design audit procedures that are appropriate in the circumstances, but not for the purpose of expressing an opinion on the effectiveness of the Corporation’s internal control. An audit also includes evaluating the appropriateness of accounting policies used and the reasonableness of accounting estimates made by management, as well as evaluating the overall presentation of the financial statements.
We believe that the audit evidence we have obtained is sufficient and appropriate to provide a basis for our audit opinion.
OPINION In our opinion, the financial statements present fairly, in all material respects, the financial position of the Corporation as at 31 December 2011, and its financial performance and its cash flows for the year then ended in accordance with International Financial Reporting Standards.
KPMG FakhroAudit5th Floor, Chamber of Commerce BuildingPO Box 710, ManamaKingdom of Bahrain
CR No. 6220Tel +973 17 224807Fax +973 17 227443Web www.kpmg.com.bh
APICORP Annual Report 201132
APICORP 33
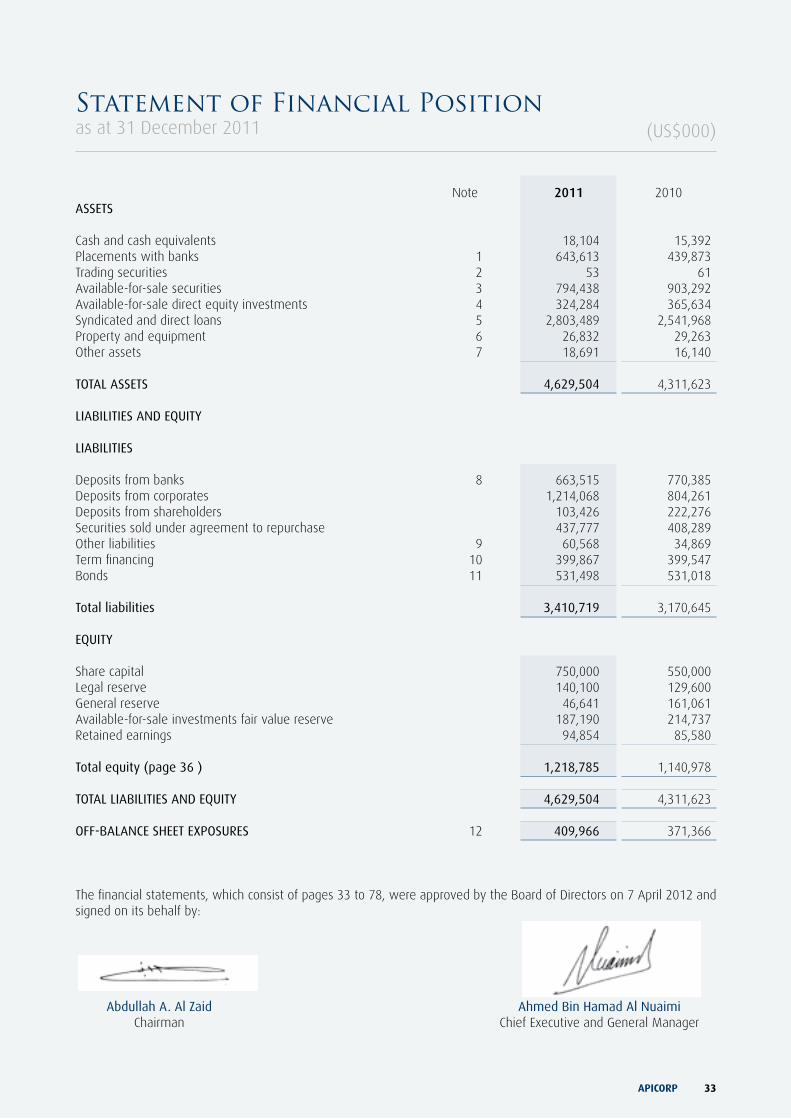
Statement of Financial Positionas at 31 December 2011
Note 2011 2010ASSETS
Cash and cash equivalents 18,104 15,392Placements with banks 1 643,613 439,873Trading securities 2 53 61Available-for-sale securities 3 794,438 903,292Available-for-sale direct equity investments 4 324,284 365,634Syndicated and direct loans 5 2,803,489 2,541,968Property and equipment 6 26,832 29,263Other assets 7 18,691 16,140 TOTAL ASSETS 4,629,504 4,311,623
LIABILITIES AND EQUITy
LIABILITIES Deposits from banks 8 663,515 770,385Deposits from corporates 1,214,068 804,261Deposits from shareholders 103,426 222,276Securities sold under agreement to repurchase 437,777 408,289Other liabilities 9 60,568 34,869Term financing 10 399,867 399,547Bonds 11 531,498 531,018 Total liabilities 3,410,719 3,170,645
EQUITy Share capital 750,000 550,000Legal reserve 140,100 129,600General reserve 46,641 161,061Available-for-sale investments fair value reserve 187,190 214,737Retained earnings 94,854 85,580
Total equity (page 36 ) 1,218,785 1,140,978
TOTAL LIABILITIES AND EQUITy 4,629,504 4,311,623
OFF-BALANCE SHEET EXPOSURES 12 409,966 371,366
The financial statements, which consist of pages 33 to 78, were approved by the Board of Directors on 7 April 2012 and signed on its behalf by:
Abdullah A. Al Zaid Ahmed Bin Hamad Al Nuaimi Chairman Chief Executive and General Manager
(US$000)
APICORP Annual Report 201134
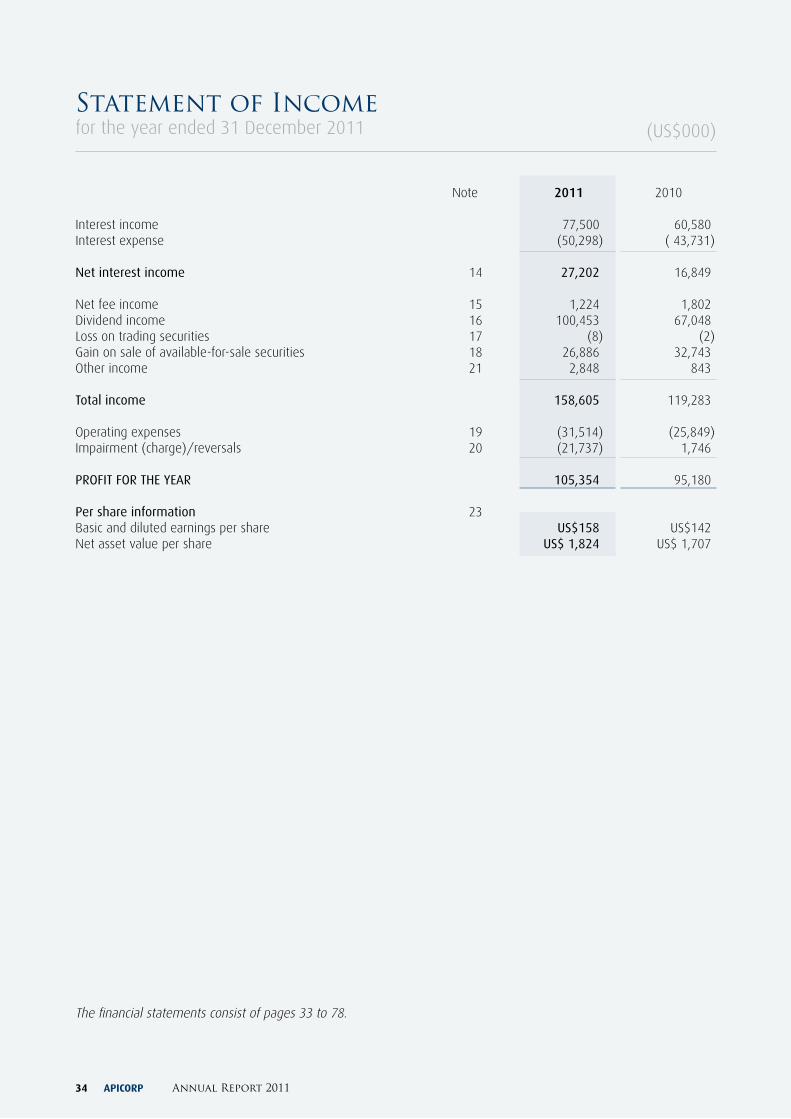
Statement of Incomefor the year ended 31 December 2011
Note 2011 2010
Interest income 77,500 60,580Interest expense (50,298) ( 43,731)
Net interest income 14 27,202 16,849
Net fee income 15 1,224 1,802Dividend income 16 100,453 67,048Loss on trading securities 17 (8) (2)Gain on sale of available-for-sale securities 18 26,886 32,743Other income 21 2,848 843
Total income 158,605 119,283
Operating expenses 19 (31,514) (25,849)Impairment (charge)/reversals 20 (21,737) 1,746
PROFIT FOR THE yEAR 105,354 95,180
Per share information 23 Basic and diluted earnings per share US$158 US$142Net asset value per share US$ 1,824 US$ 1,707
(US$000)
The financial statements consist of pages 33 to 78.
APICORP 35
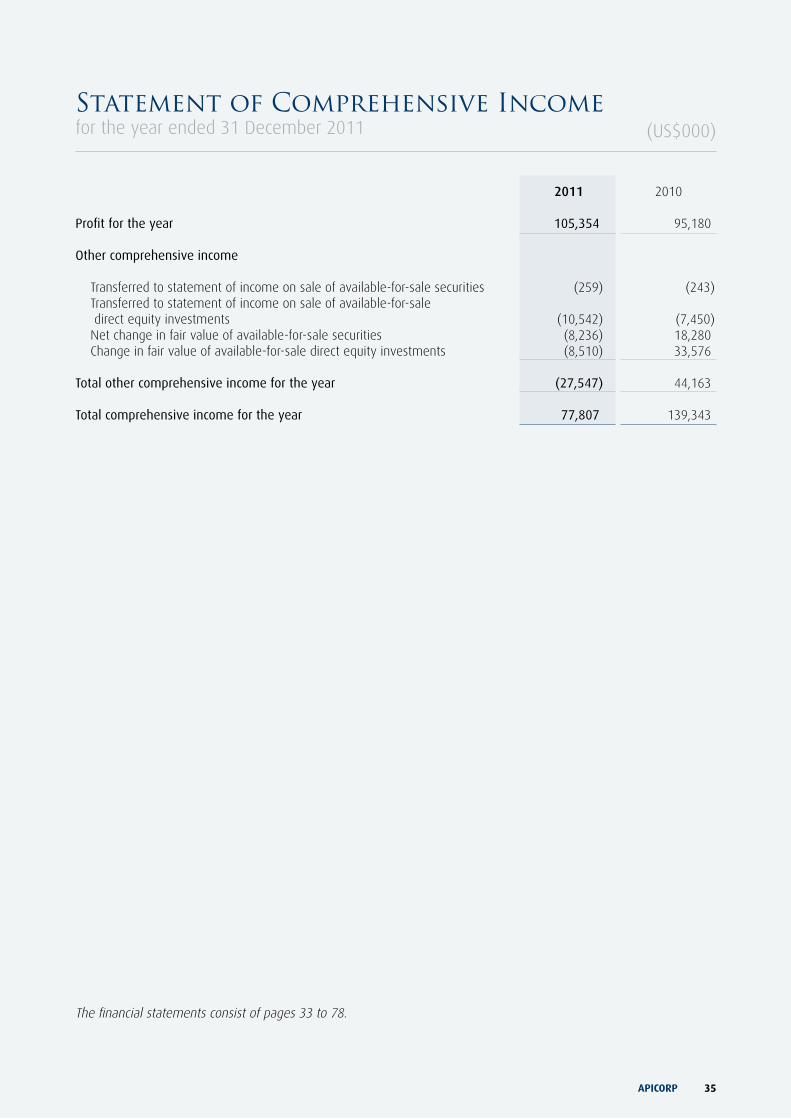
2011 2010 Profit for the year 105,354 95,180 Other comprehensive income
Transferred to statement of income on sale of available-for-sale securities (259) (243) Transferred to statement of income on sale of available-for-sale direct equity investments (10,542) (7,450)Net change in fair value of available-for-sale securities (8,236) 18,280Change in fair value of available-for-sale direct equity investments (8,510) 33,576
Total other comprehensive income for the year (27,547) 44,163 Total comprehensive income for the year 77,807 139,343
Statement of Comprehensive Incomefor the year ended 31 December 2011 (US$000)
The financial statements consist of pages 33 to 78.
(US$
000)
Stat
emen
t o
f C
han
ges
in
Eq
uit
yfo
r th
e ye
ar e
nded
31
Dec
embe
r 20
11
AP
ICO
RP
A
nn
ual
Rep
ort
201
136Th
e fin
anci
al s
tate
men
ts c
onsi
st o
f pag
es 3
3 to
78.
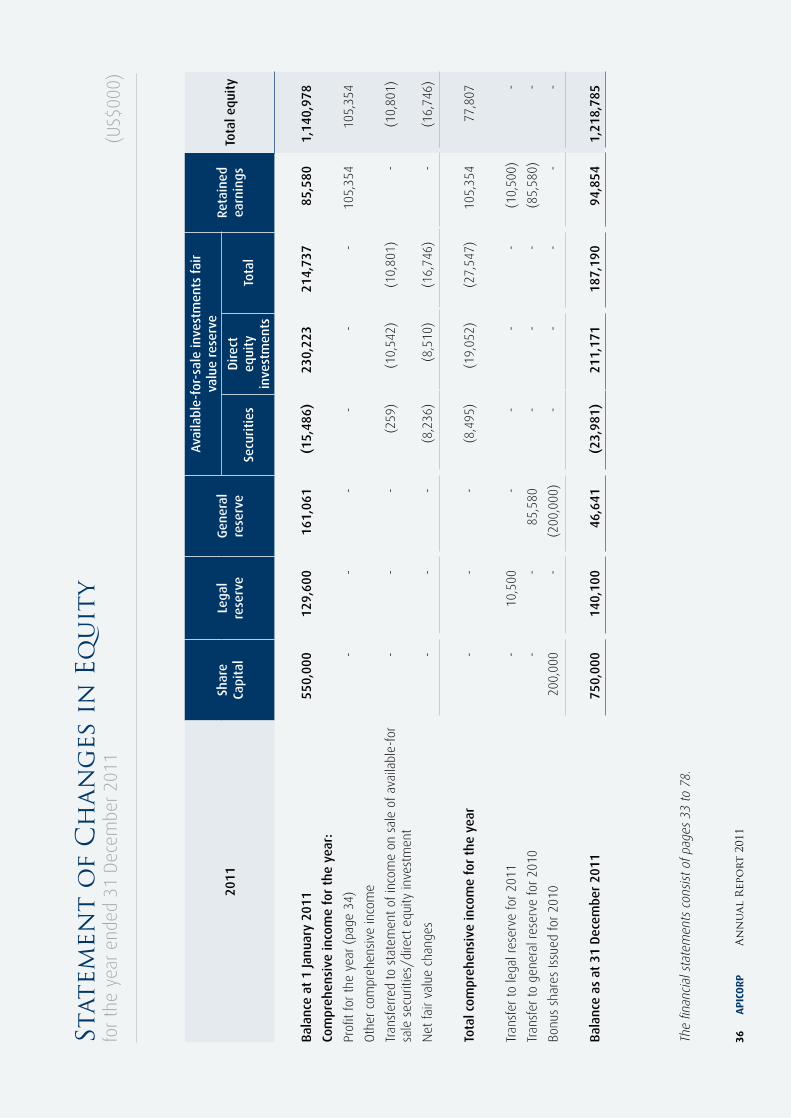
2011
Shar
e Ca
pita
lLe
gal
rese
rve
Gen
eral
re
serv
e
Ava
ilabl
e-fo
r-sa
le in
vest
men
ts f
air
valu
e re
serv
eRe
tain
ed
earn
ings
Tota
l equ
ity
Secu
riti
esD
irec
t eq
uity
in
vest
men
tsTo
tal
Bal
ance
at
1 Ja
nuar
y 20
1155
0,00
012
9,60
016
1,06
1(1
5,48
6)23
0,22
321
4,73
785
,580
1,14
0,97
8
Com
preh
ensi
ve in
com
e fo
r th
e ye
ar:
Profi
t fo
r th
e ye
ar (
page
34)
--
--
--
105,
354
105,
354
Oth
er c
ompr
ehen
sive
inco
me
Tran
sfer
red
to s
tate
men
t of
inco
me
on s
ale
of a
vaila
ble-
for
sale
sec
uriti
es/d
irect
equ
ity in
vest
men
t-
--
(259
)(1
0,54
2)(1
0,80
1)-
(10,
801)
Net
fair
valu
e ch
ange
s-
--
(8,2
36)
(8,5
10)
(16,
746)
-(1
6,74
6)
Tota
l com
preh
ensi
ve in
com
e fo
r th
e ye
ar-
--
(8,4
95)
(19,
052)
(27,
547)
105,
354
77,8
07
Tran
sfer
to
lega
l res
erve
for
2011
-10
,500
--
--
(10,
500)
-
Tran
sfer
to
gene
ral r
eser
ve fo
r 20
10-
-85
,580
--
-(8
5,58
0)-
Bonu
s sh
ares
Issu
ed fo
r 20
1020
0,00
0-
(200
,000
)-
--
--
Bal
ance
as
at 3
1 D
ecem
ber
2011
750,
000
140,
100
46,6
41(2
3,98
1)21
1,17
118
7,19
094
,854
1,21
8,78
5
(US$
000)
Stat
emen
t o
f C
han
ges
in
Eq
uit
y (C
ontin
ued)
for
the
year
end
ed 3
1 D
ecem
ber
2011
AP
ICO
RP
37Th
e fin
anci
al s
tate
men
ts c
onsi
st o
f pag
es 3
3 to
78.
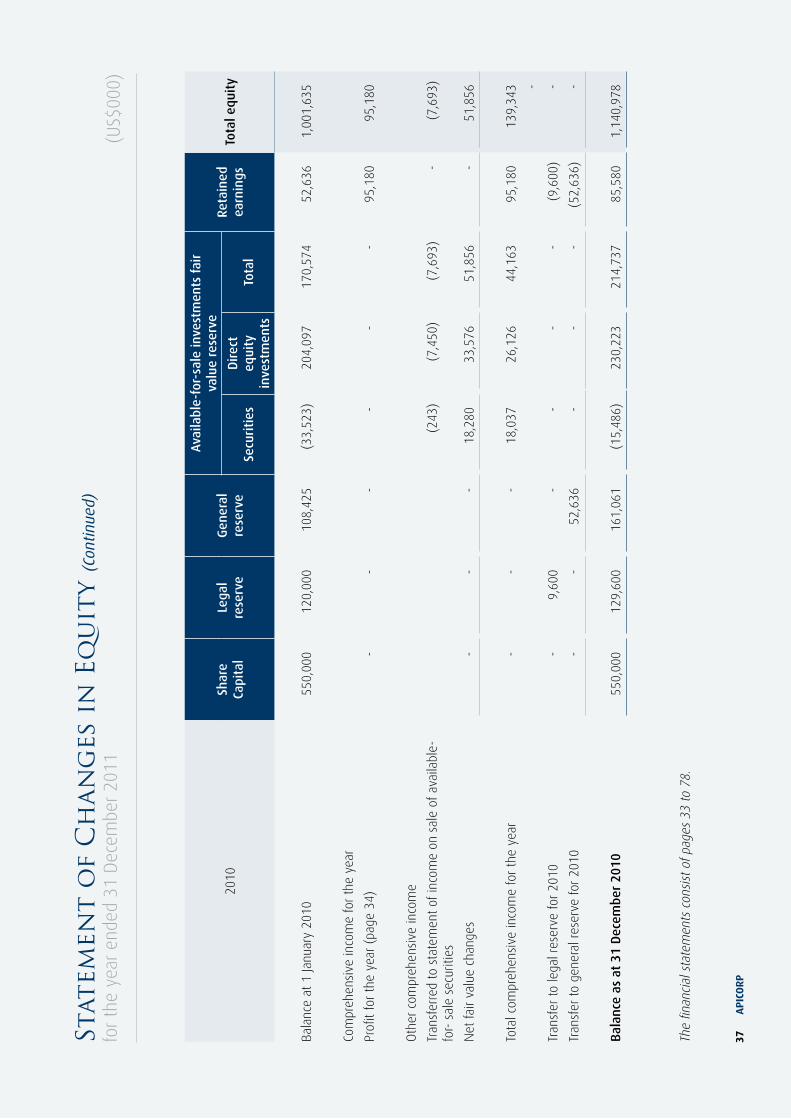
2010
Shar
e Ca
pita
lLe
gal
rese
rve
Gen
eral
re
serv
e
Ava
ilabl
e-fo
r-sa
le in
vest
men
ts f
air
valu
e re
serv
eRe
tain
ed
earn
ings
Tota
l equ
ity
Secu
riti
esD
irec
t eq
uity
in
vest
men
tsTo
tal
Bala
nce
at 1
Janu
ary
2010
550,
000
120,
000
108,
425
(33,
523)
204,
097
170,
574
52,6
361,
001,
635
Com
preh
ensi
ve in
com
e fo
r th
e ye
ar
Profi
t fo
r th
e ye
ar (
page
34)
--
--
--
95,1
8095
,180
Oth
er c
ompr
ehen
sive
inco
me
Tran
sfer
red
to s
tate
men
t of
inco
me
on s
ale
of a
vaila
ble-
for-
sal
e se
curit
ies
(243
)(7
,450
)(7
,693
)-
(7,6
93)
Net
fair
valu
e ch
ange
s-
--
18,2
8033
,576
51,8
56-
51,8
56
Tota
l com
preh
ensi
ve in
com
e fo
r th
e ye
ar-
--
18,0
3726
,126
44,1
6395
,180
139,
343 -
Tran
sfer
to
lega
l res
erve
for
2010
-9,
600
--
--
(9,6
00)
-
Tran
sfer
to
gene
ral r
eser
ve fo
r 20
10-
-52
,636
--
-(5
2,63
6)-
Bal
ance
as
at 3
1 D
ecem
ber
2010
550,
000
129,
600
161,
061
(15,
486)
230,
223
214,
737
85,5
801,
140,
978
APICORP Annual Report 201138
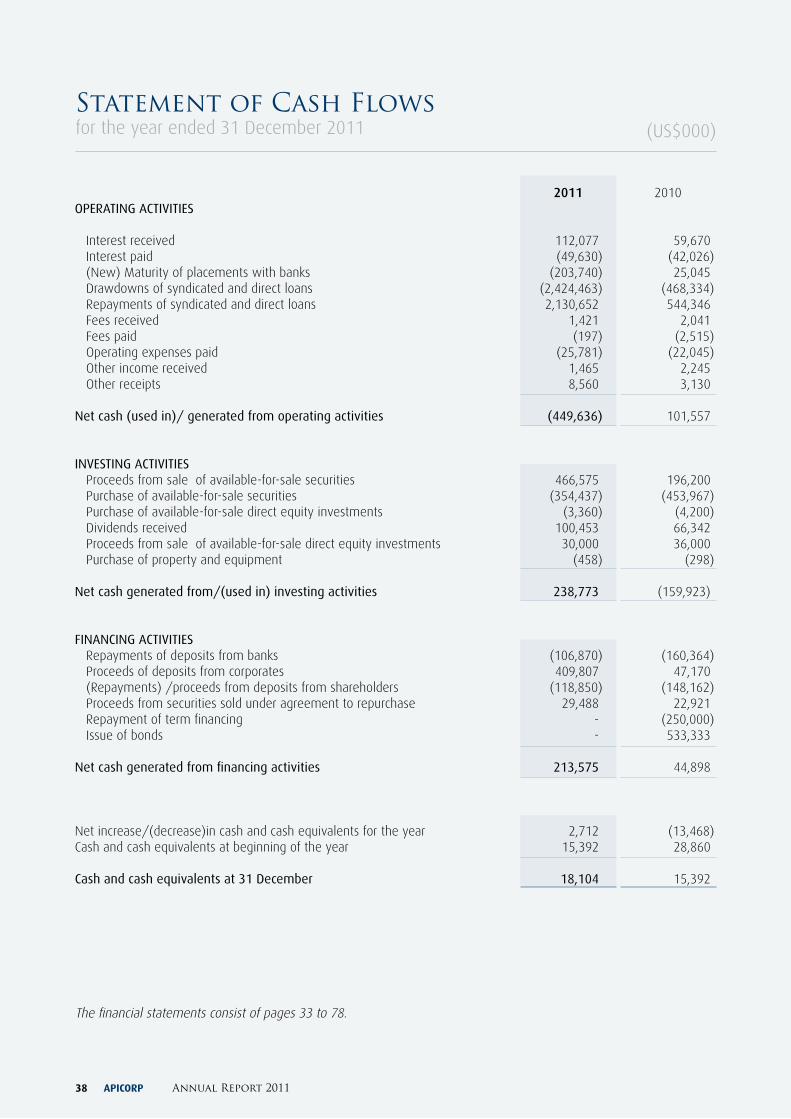
Statement of Cash Flowsfor the year ended 31 December 2011
2011 2010OPERATING ACTIVITIES
Interest received 112,077 59,670Interest paid (49,630) (42,026)(New) Maturity of placements with banks (203,740) 25,045Drawdowns of syndicated and direct loans (2,424,463) (468,334)Repayments of syndicated and direct loans 2,130,652 544,346Fees received 1,421 2,041Fees paid (197) (2,515)Operating expenses paid (25,781) (22,045)Other income received 1,465 2,245Other receipts 8,560 3,130
Net cash (used in)/ generated from operating activities (449,636) 101,557
INVESTING ACTIVITIES Proceeds from sale of available-for-sale securities 466,575 196,200Purchase of available-for-sale securities (354,437) (453,967)Purchase of available-for-sale direct equity investments (3,360) (4,200)Dividends received 100,453 66,342Proceeds from sale of available-for-sale direct equity investments 30,000 36,000Purchase of property and equipment (458) (298)
Net cash generated from/(used in) investing activities 238,773 (159,923)
FINANCING ACTIVITIES Repayments of deposits from banks (106,870) (160,364)Proceeds of deposits from corporates 409,807 47,170(Repayments) /proceeds from deposits from shareholders (118,850) (148,162)Proceeds from securities sold under agreement to repurchase 29,488 22,921Repayment of term financing - (250,000)Issue of bonds - 533,333
Net cash generated from financing activities 213,575 44,898
Net increase/(decrease)in cash and cash equivalents for the year 2,712 (13,468)Cash and cash equivalents at beginning of the year 15,392 28,860
Cash and cash equivalents at 31 December 18,104 15,392
(US$000)
The financial statements consist of pages 33 to 78.
APICORP 39
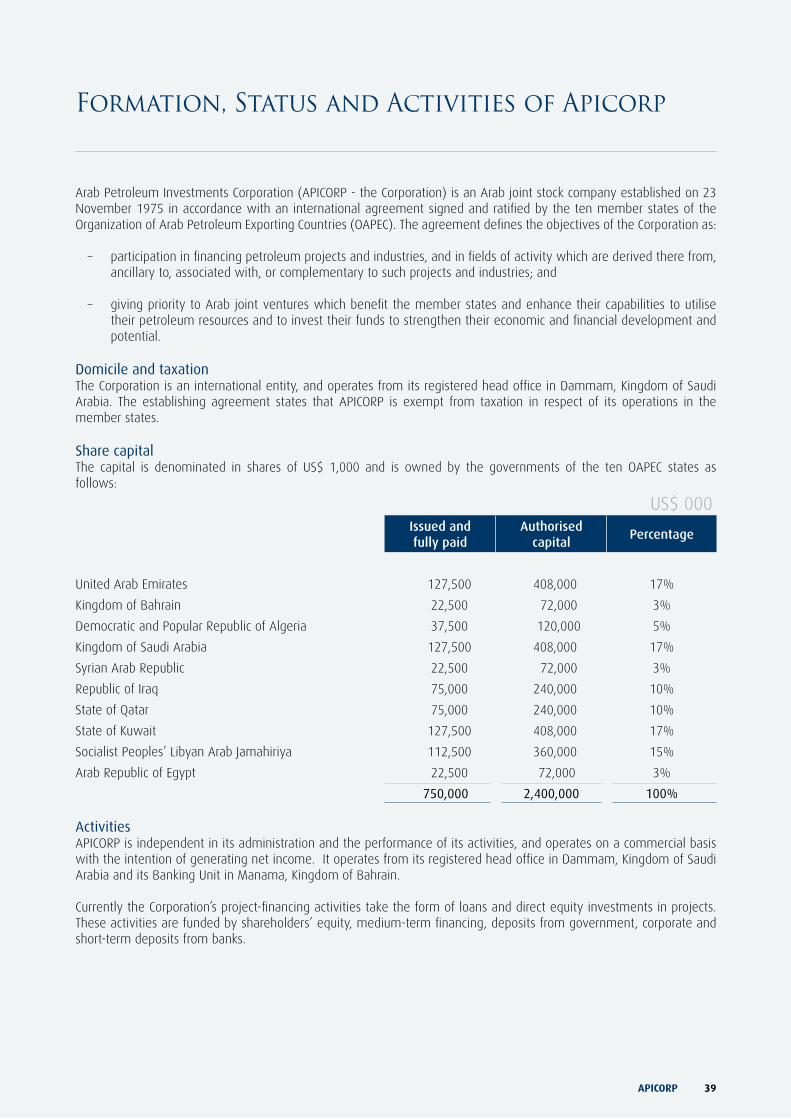
Arab Petroleum Investments Corporation (APICORP - the Corporation) is an Arab joint stock company established on 23 November 1975 in accordance with an international agreement signed and ratified by the ten member states of the Organization of Arab Petroleum Exporting Countries (OAPEC). The agreement defines the objectives of the Corporation as:
− participation in financing petroleum projects and industries, and in fields of activity which are derived there from, ancillary to, associated with, or complementary to such projects and industries; and
− giving priority to Arab joint ventures which benefit the member states and enhance their capabilities to utilise their petroleum resources and to invest their funds to strengthen their economic and financial development and potential.
Domicile and taxationThe Corporation is an international entity, and operates from its registered head office in Dammam, Kingdom of Saudi Arabia. The establishing agreement states that APICORP is exempt from taxation in respect of its operations in the member states.
Share capitalThe capital is denominated in shares of US$ 1,000 and is owned by the governments of the ten OAPEC states as follows:
US$ 000Issued and fully paid
Authorised capital
Percentage
United Arab Emirates 127,500 408,000 17%
Kingdom of Bahrain 22,500 72,000 3%
Democratic and Popular Republic of Algeria 37,500 120,000 5%
Kingdom of Saudi Arabia 127,500 408,000 17%
Syrian Arab Republic 22,500 72,000 3%
Republic of Iraq 75,000 240,000 10%
State of Qatar 75,000 240,000 10%
State of Kuwait 127,500 408,000 17%
Socialist Peoples’ Libyan Arab Jamahiriya 112,500 360,000 15%
Arab Republic of Egypt 22,500 72,000 3%
750,000 2,400,000 100% Activities APICORP is independent in its administration and the performance of its activities, and operates on a commercial basis with the intention of generating net income. It operates from its registered head office in Dammam, Kingdom of Saudi Arabia and its Banking Unit in Manama, Kingdom of Bahrain.
Currently the Corporation’s project-financing activities take the form of loans and direct equity investments in projects. These activities are funded by shareholders’ equity, medium-term financing, deposits from government, corporate and short-term deposits from banks.
Formation, Status and Activities of Apicorp
APICORP Annual Report 201140
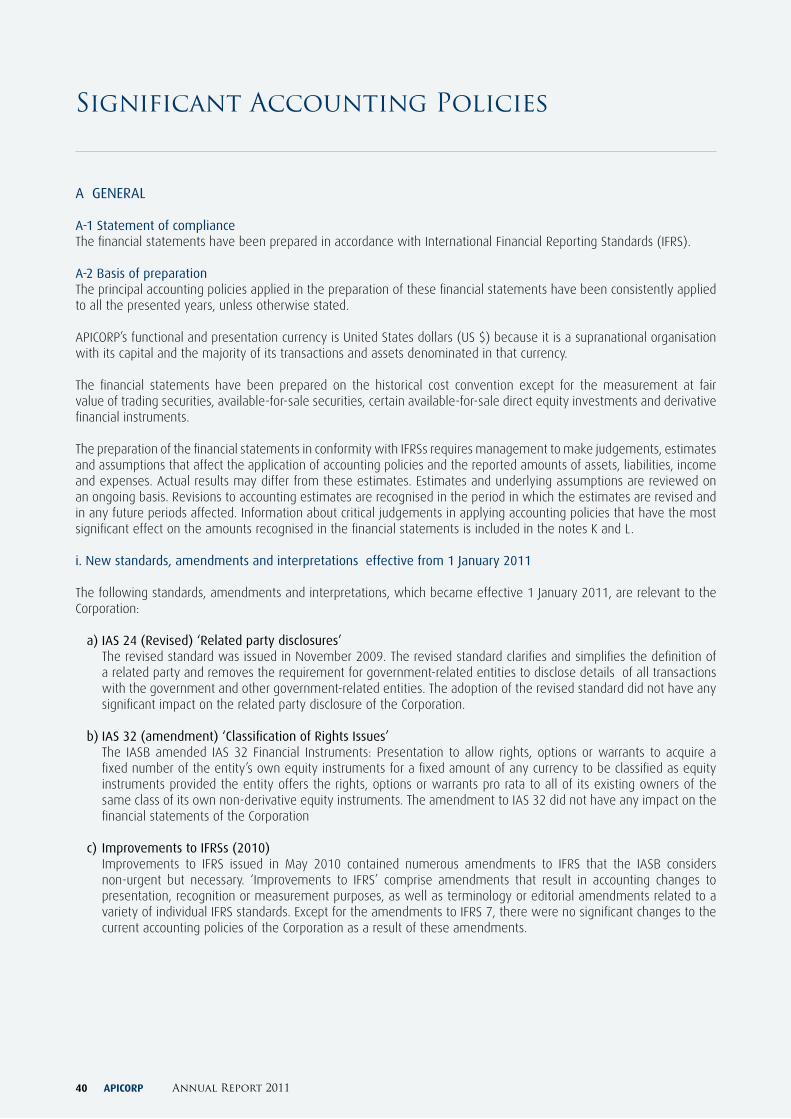
Significant Accounting Policies
A GENERAL
A-1 Statement of compliance The financial statements have been prepared in accordance with International Financial Reporting Standards (IFRS).
A-2 Basis of preparationThe principal accounting policies applied in the preparation of these financial statements have been consistently applied to all the presented years, unless otherwise stated.
APICORP’s functional and presentation currency is United States dollars (US $) because it is a supranational organisation with its capital and the majority of its transactions and assets denominated in that currency.
The financial statements have been prepared on the historical cost convention except for the measurement at fair value of trading securities, available-for-sale securities, certain available-for-sale direct equity investments and derivative financial instruments.
The preparation of the financial statements in conformity with IFRSs requires management to make judgements, estimates and assumptions that affect the application of accounting policies and the reported amounts of assets, liabilities, income and expenses. Actual results may differ from these estimates. Estimates and underlying assumptions are reviewed on an ongoing basis. Revisions to accounting estimates are recognised in the period in which the estimates are revised and in any future periods affected. Information about critical judgements in applying accounting policies that have the most significant effect on the amounts recognised in the financial statements is included in the notes K and L.
i. New standards, amendments and interpretations effective from 1 january 2011
The following standards, amendments and interpretations, which became effective 1 January 2011, are relevant to the Corporation:
a) IAS 24 (Revised) ‘Related party disclosures’ The revised standard was issued in November 2009. The revised standard clarifies and simplifies the definition of
a related party and removes the requirement for government-related entities to disclose details of all transactions with the government and other government-related entities. The adoption of the revised standard did not have any significant impact on the related party disclosure of the Corporation.
b) IAS 32 (amendment) ‘Classification of Rights Issues’ The IASB amended IAS 32 Financial Instruments: Presentation to allow rights, options or warrants to acquire a
fixed number of the entity’s own equity instruments for a fixed amount of any currency to be classified as equity instruments provided the entity offers the rights, options or warrants pro rata to all of its existing owners of the same class of its own non-derivative equity instruments. The amendment to IAS 32 did not have any impact on the financial statements of the Corporation
c) Improvements to IFRSs (2010) Improvements to IFRS issued in May 2010 contained numerous amendments to IFRS that the IASB considers
non-urgent but necessary. ‘Improvements to IFRS’ comprise amendments that result in accounting changes to presentation, recognition or measurement purposes, as well as terminology or editorial amendments related to a variety of individual IFRS standards. Except for the amendments to IFRS 7, there were no significant changes to the current accounting policies of the Corporation as a result of these amendments.
APICORP 41
A-2 Basis of preparation (continued)
Improvements to IFRSs 2010 – IFRS 7 Financial Instruments: DisclosuresThe amendments add an explicit statement that qualitative disclosure should be made in the context of the quantitative disclosures to better enable users to evaluate an entity’s exposure to risks arising from financial instruments. In addition, the IASB amended and removed existing disclosure requirements
ii. New standards, amendments and interpretations issued but not yet effective
The following standards and interpretations have been issued and are expected to be relevant to the Corporation in future periods, with effective dates on or after 1 January 2012.
a) IAS 1 (amendment) - Presentation of items of other comprehensive income The amendments to IAS 1 require that an entity present separately the items of other comprehensive income that
would be reclassified to profit or loss in the future if certain conditions are met from those that would never be reclassified to profit or loss. The amendment is effective for annual periods beginning on or after 1 July 2012 with an option of early application. The application of this amendment has no significant impact on the financial statements of the Corporation.
b) IAS 28 (2011) – Investment in Associates and joint ventures IAS 28 (2011) supersedes IAS 28 (2008). IAS 28 (2011) has been amended to include:
• IFRS 5 applies to an investment, or a portion of an investment, in an associate or a joint venture that meets the criteria to be classified as held for sale; and
• on cessation of significant influence or joint control, even if an investment in an associate becomes an investment in a joint venture or vice versa, the entity does not remeasure the retained interest.
The standard is effective for annual periods beginning on or after 1 January 2013 and is applied retrospectively. Early adoption is permitted provided that the entire suite of consolidation standards is adopted at the same time. The application of this amendment has no significant impact on the financial statements of the Corporation.
c) IFRS 7 (amendment ) – Disclosures: The amendments to IFRS 7 introduce new disclosure requirements:
• Transfer of financial assets: Transfers of financial assets are required to be disclosed including disclosures for financial assets that are not derecognised in their entirety; and financial assets that are derecognised in their entirety but for which the entity retains continuing involvement. The amendments are effective for annual periods beginning on or after 1 July 2011, but entities are not required to provide the disclosures for any period presented that begins before the date of initial application of the amendments. Early adoption is permitted.
• Offset of financial assets and liabilities: Disclosures are required for financial assets and financial liabilities that are offset in the statement of financial position or subject to master netting arrangements or similar agreements. The amendments to IFRS are effective for annual periods beginning on or after 1 January 2013 and interim periods within those annual periods. The amendments are to be applied retrospectively.
The Corporation does not expect to have any significant impact on the financial statements on application of these amendments.
Significant Accounting Policies (Continued)
APICORP Annual Report 201142
Significant Accounting Policies (Continued)
d) IFRS 9 - Financial Instruments Standard issued November 2009 IFRS 9 (2009) ‘Financial Instruments’ is the first standard issued as part of a wider project to replace IAS 39 ‘Financial
instruments: recognition and measurement’. IFRS 9 (2009) retains and simplifies the mixed measurement model and establishes two primary measurement categories for financial assets: amortised cost and fair value. The basis of classification depends on the entity’s business model and the contractual cash flow characteristics of the financial asset. The guidance in IAS 39 on impairment and hedge accounting continues to apply. The 2009 standard did not address financial liabilities.
Standard issued October 2010 IFRS 9 (2010) adds the requirements related to the classification and measurement of financial liabilities, and
de-recognition of financial assets and liabilities to the version issued in November 2009. It also includes those paragraphs of IAS 39 dealing with how to measure fair value and accounting for derivatives embedded in a contract that contains a host that is not a financial asset, as well as the requirements of IFRIC 9 “reassessment of Embedded Derivatives”.
The Corporation is considering the implications of the standard, the impact on the Corporation and timing of its adoption by the Corporation. While adoption of IFRS 9 is mandatory from 1 January 2013, earlier adoption is permitted. Prior periods need not be restated if an entity adopts the standard for reporting periods beginning before 1 January 2012. In its November 2011 meeting, the IASB tentatively decided to defer the mandatory effective date to 1 January 2015.
e) IFRS 12 Disclosures of interests in other entities IFRS 12 contains the disclosure requirements for entities that have interests in subsidiaries, joint arrangements
(i.e. joint operations or joint ventures), associates and/or unconsolidated structured entities, aiming to provide information to enable users to evaluate the nature of, and risks associated with, an entity’s interests in other entities; and the effects of those interests on the entity’s financial position, financial performance and cash flows.
The Corporation is yet to assess IFRS 12’s full impact. The standard is effective for annual periods beginning on or
after 1 January 2013. Early adoption is permitted provided that the entire suite is adopted at the same time. Entities are encouraged to provide information required by IFRS 12 before the effective date, but this early disclosure would not compel the entity to apply either IFRS 12 in its entirety or the other new consolidation standards.
f) IFRS 13 - Fair value measurement IFRS 13 replaces the fair value measurement guidance contained in individual IFRSs with a single source of fair
value measurement guidance. It defines fair value, establishes a framework for measuring fair value and sets out disclosure requirements for fair value measurements. It explains how to measure fair value when it is required or permitted by other IFRSs. It does not introduce new requirements to measure assets or liabilities at fair value, nor does it eliminate the practicability exceptions to fair value measurements that currently exist in certain standards.
The Corporation is considering the implications of the standard, the impact on the Corporation and timing of its adoption by the Corporation. The standard is effective for annual periods beginning on or after 1 January 2013 with an option of early adoption.
iii. Early adoption of standards
The Corporation did not early adopt new or amended standards/interpretations in 2011.
APICORP 43
A-3 Foreign currency transactionsTransactions in currencies other than US dollars (foreign currencies) are translated at the exchange rates ruling at the date of the transaction. All monetary assets and liabilities, except trading equities (non-monetary), denominated in foreign currencies, are translated into US dollars at rates prevailing at the balance sheet date. Differences arising from changes in exchange rates are recognised in the statement of income.
Available-for-sale equity investments (non-monetary assets) denominated in foreign currencies that are stated at fair value are translated to US dollars at prevailing exchange rates. Differences arising from changes in rates are included in the fair value reserve in equity. All other non-monetary assets and liabilities are stated at the historical rates of exchange.
Share capital originally contributed in Saudi Riyals is maintained at the historical rates of exchange.
B FINANCIAL ASSETS
B-1 ClassificationThe Corporation allocates financial assets to the following IAS 39 categories:
Trading securities are those that the Corporation acquires or incurs principally for the purpose of gains over the near-term or if it is part of a portfolio of identified financial instruments that are managed together and for which there is evidence of a recent actual pattern of short-term profit-taking. These consist of listed equity securities.
Available-for-sale investments are non-derivative financial assets that are not classified as held for trading or loans provided by the Corporation or held to maturity. Available-for-sale investments include certain debt securities, managed funds and direct equity investments.
Loans and receivables are non-derivative financial assets with fixed or determinable payments that are not quoted in an active market.
B-2 RecognitionAvailable-for-sale and held for trading financial assets are recognised on a trade date basis.
Loans are recognised on the day on which they are drawn down by the borrower.
B-3 MeasurementFinancial assets are measured initially recognised at fair value plus transaction costs except for financial assets held for trading where transaction costs are recognised in the statement of income. Subsequent to initial recognition, all trading and available-for-sale investments are re-measured to fair value, except in case of certain unlisted available-for-sale direct equity investments, where a reliable measure of fair value is not available and hence are carried at cost less impairment allowances, if any.
Gains and losses arising from a change in the fair value of trading securities and derivative instruments not designated as an accounting hedge are recognised in the statement of income in the period in which it arises.
Gains and losses arising from changes in the fair value of available-for-sale financial assets are recognised in other comprehensive income and presented in a fair value reserve as a separate component of equity. When the assets are sold, collected or otherwise disposed of, or are impaired, the cumulative gain or loss previously recognised in other comprehensive income, and presented in the fair value reserve in equity, is transferred to the profit or loss.
Loans are subsequently measured at amortised cost using the effective interest method, less allowance for impairment, if any. The unamortised portion of deferred participation and upfront fees received is deducted from the carrying values of the loans.
Significant Accounting Policies (Continued)
APICORP Annual Report 201144
B Financial Assets (continued)
B-4 AmortisationWhere financial assets, mainly bonds, have been purchased at a premium or a discount, the premiums and discounts are amortised, using the effective interest method, through the statement of income over the period from the date of purchase to the date of maturity.
B-5 Fair value measurement principlesFor financial assets traded in active markets, fair value is based on their quoted closing bid market prices or dealer price quotations at the balance sheet date without any deduction for transaction costs. For investments in managed funds, the net asset values quoted by the fund managers are considered representative of fair value of those investments.
B-6 De-recognitionFinancial assets are derecognised when the contractual rights to receive the cash flows from these assets have ceased to exist or the assets have been transferred and substantially all the risks and rewards of ownership of the assets are also transferred (that is, if substantially all the risks and rewards have not been transferred, the Corporation tests control to ensure that continuing involvement on the basis of any retained powers of control does not prevent derecognition).
B-7 ImpairmentAll financial assets that are not carried at fair value through profit or loss are assessed at each reporting date to determine whether there is objective evidence that it is impaired. A financial asset or a group of financial association is impaired only if objective evidence indicates that a loss event has occurred after the initial recognition of the asset, and that the loss event had a negative effect on the estimated future cash flows of that financial asset or group of financial assets that can be estimated reliably.
Assets carried at amortised cost
Objective evidence that financial assets are impaired can include default or delinquency by a borrower, restructuring of an amount due to the Corporation on terms that the Corporation would not consider otherwise, indications that a borrower or an issuer will enter bankruptcy, the disappearance of an active market for a security.
The Corporation considers evidence of impairment, for loans and other financial assets carried at amortised cost, at both a specific asset and collective level. All individually significant financial assets are assessed for specific impairment. All individually significant assets found not to be specifically impaired are then collectively assessed for any impairment that has been incurred but not yet identified. Assets that are not individually significant are collectively assessed for impairment by grouping together assets with similar risk characteristics. In assessing collective impairment, the Corporation uses historical trends of the probability of default, timing of recoveries and the amount of loss incurred, adjusted for management’s judgement as to whether current economic and credit conditions are such that the actual losses are likely to be greater or less than suggested by historical trends.
An impairment loss in respect of a financial asset measured at amortised cost is calculated as the difference between its carrying amount and the present value of the estimated future cash flows discounted at the asset’s original effective interest rate. Losses are recognised in profit or loss and reflected in an allowance account against receivables. If an asset has a variable interest rate, the discount rate for measuring any impairment loss is the current effective interest rate determined under the contract.
Significant Accounting Policies (Continued)
APICORP 45
B Financial Assets (continued)
B-7 Impairment (continued)
Interest on the impaired asset continues to be recognised through the unwinding of the discount.
If, in a subsequent period, the amount of the impairment loss decreases and the decrease can be related objectively to an event occurring after the impairment loss was recognised in profit or loss, then the impairment loss is reversed, with the amount of the reversal recognised in profit or loss.
Assets classified as available-for-sale
In case of equity investment classified as available-for-sale, a significant or prolonged decline in the fair value of security below its cost is objective evidence of impairment.
Debt instruments, classified as available-for-sale, are considered as impaired, if objective evidence indicates that a loss event has occurred after the initial recognition of the instrument, and that the loss event had a negative effect on the estimated future cash flows of that instrument that can be estimated reliably.
If any such evidence exists for available-for-sale financial assets, the cumulative loss, measured as the difference between the acquisition cost and the current fair value, less any impairment loss on that financial asset previously recognised in profit or loss, is removed from equity and recognised in the income statement. Impairment losses recognised in the statement of income on equity instruments are reversed directly through comprehensive income. For debt instruments classified as available-for-sale, if in a subsequent period, the fair value increases and the increase can be objectively related to an event occurring after the impairment loss was recognised in profit or loss, the impairment loss is reversed through the statement of income.
C FINANCIAL LIABILITIES
C-1 Initial recognition and measurementThe Corporation has the following non-derivative financial liabilities: deposits from banks, deposits from corporate, term financing and financing received under repurchase agreements for securities. Financial liabilities are initially recognized, on the trade date at which the Corporation becomes a part of the contractual provisions of the instrument, at fair value, representing the proceeds received net of premiums, discounts and transaction costs that are directly attributable to the financial liability.
C-2 Subsequent measurementAll financial liabilities are classified as non-trading liabilities and are measured at amortised cost using the effective interest rate method.
C-3 De recognitionFinancial liabilities are derecognised when the Corporation’s contractual obligations are discharged, cancelled or expire.
Significant Accounting Policies (Continued)
APICORP Annual Report 201146
D CASH AND CASH EQUIVALENTSFor the purpose of the statement of cash flows, cash and cash equivalents comprise cash balances on hand and bank balances with original maturities of less than 3 months, which are subject to insignificant risk of fluctuation in its realisable value.
E REPURCHASE AND RESALE AGREEMENTSAssets sold with a simultaneous commitment to repurchase at a specified future date (repos) are not derecognised, as the Corporation retains all or substantially all the risks and rewards of the transferred assets. Amounts received under these agreements are treated as liabilities and the difference between the sale and repurchase price treated as interest expense using the effective interest method.
Assets purchased with a corresponding commitment to resell at a specified future date (reverse repos) are not recognised in the balance sheet. Amounts paid under these agreements are treated as assets and the difference between the purchase and resale price treated as interest income using the effective interest method.
F PROPERTy AND EQUIPMENT
F-1 ClassificationItems of property and equipment are stated at cost less accumulated depreciation and impairment losses, if any.
Where an item of property and equipment comprises significant components having different useful lives, these components are accounted for as separate items of property and equipment. No borrowing costs have been capitalised.
F-2 Subsequent expenditureExpenditure incurred subsequently to replace a major component of an item of property and equipment that is accounted for separately is capitalised. Other subsequent expenditure is capitalised only when it increases the future economic benefits expected to accrue from the item of property and equipment.
All other expenditure, for example on maintenance and repairs, is expensed in the statement of income as incurred.
F-3 DepreciationDepreciation is charged to the statement of income on a straight-line basis over the estimated useful lives of the items of property and equipment, and of the major components that are accounted for separately. Land is not depreciated.
The estimated useful lives of the Corporation’s property and equipment are as follows:• Head office building (civil works and other major components) 20 to 40 years• Head office building (finishes, systems and equipment) 5 to 20 years• Housing compound buildings (including new extension) 15 years • Housing compound equipment, furniture and fittings 5 to 10 years• Office furniture, equipment and computer hardware (and related software) 3 to 10 years• Office fit outs capitalized at Bahrain branch are depreciated over un-expired period of lease or 5 years, whichever
is less.
The property and equipment residual values and useful lives are reviewed, and adjusted if appropriate, at each balance sheet date.
Significant Accounting Policies (Continued)
APICORP 47
G EMPLOyEES’ END OF SERVICE BENEFITSThe Corporation provides end of service benefits to its employees. The entitlement to these benefits is based upon the employees’ final salary and length of service subject to the completion of a minimum service period. Provision for the unfunded commitment (which is a defined benefit scheme under IAS 19) has been made by calculating the liability, had all the employees left at the balance sheet date.
H INCOME RECOGNITIONH-1 Interest income and expensesInterest income and interest expense for all interest-bearing financial instruments are recognised within “interest income” and “interest expense” in the statement of income using the effective interest rate method. When calculating the effective interest rate, the Corporation estimates future cash flows considering all contractual terms of the financial instrument, but not future credit losses. Fees, including loan origination less any early redemption fees are included in the calculation of the effective interest rate to the extent that they are considered to be an integral part of the effective interest rate.
H-2 Dividend incomeDividend income is recognised in the statement of income when the Corporation’s right to receive payment is established.
H-3 Fee incomeFee income arises from financial services provided by the Corporation including project and structured finance transactions, for example advising on underwriting and arranging syndicated loan facilities, and is recognised when the service is provided.
Fees that are analogous to interest and are considered to be part of the overall yield on loans, specifically participation and upfront fees are initially deferred and then amortised over the lives of the related loans. The amortised income is included in interest income.
H-4 Rent incomeRent income is recognised in the statement of income on a time apportionment basis.
I DERIVATIVE FINANCIAL INSTRUMENTSDerivative financial instruments are contracts, the value of which is derived from one or more underlying financial instruments and include interest rate swaps and forward currency contracts. The Corporation holds derivative financial instruments to hedge its foreign currency and interest rate risk exposures.
The Corporation designates interest rate swaps (“hedging instruments”) as fair value hedges to hedge the interest rate risk on its fixed income securities (“hedged items”) classified as available-for-sale securities. On initial designation of the hedge, the Corporation formally documents the relationship between the hedging instruments and hedged items, including the risk management objectives and strategy in undertaking the hedge transaction, together with the methods that will be used to assess the effectiveness of the hedging relationship. The Corporation makes an assessment, both at the inception of the hedge relationship as well as on an ongoing basis, whether the hedging instruments are expected to be “highly effective” in offsetting the changes in the fair value of the respective hedged items during the period for which the hedge is designated, and whether the actual results of each hedge are within a range of 80-125 percent.
Derivatives are recognised initially at fair value; attributable transaction costs are recognised in profit or loss as incurred. Subsequent to initial recognition, derivatives are measured at fair value, and changes therein are accounted for as described below.
Significant Accounting Policies (Continued)
APICORP Annual Report 201148
I Derivative Financial Instruments (continued)
I-1 Fair value hedgesWhen a derivative is designated as the hedging instrument in a hedge of the change in fair value of a recognised asset or liability or a firm commitment that could affect profit or loss, changes in the fair value of the derivative are recognised immediately in profit or loss together with changes in the fair value of the hedged item that are attributable to the hedged risk (in the same line item in the statement of income as the hedged item).
If the hedging derivative expires or is sold, terminated, or exercised, or the hedge no longer meets the criteria for fair value hedge accounting, or the hedge designation is revoked, hedge accounting is discontinued prospectively. Any adjustment up to that point to a hedged item for which the effective interest method is used, is amortised to profit or loss as part of the recalculated effective interest rate of the item over its remaining life.
I-2 Other non-trading derivativesWhen a derivative is not held for trading, and is not designated in a qualifying hedge relationship, all changes in its fair value are recognised immediately in profit or loss as a component of other income.
I-3 Fair valueThe fair value of forward exchange contracts is estimated by discounting the difference between the contractual forward price and the current forward price for the residual maturity of the contract using Zero Coupon curve (based on LIBOR). The fair value of interest rate swaps is determined by discounting estimated future cash flows based on the terms and maturity of each contract and the same Zero Coupon curve at the measurement date. Fair values recognized reflect the credit risk of the instrument and include adjustments to take account of the credit risk of the Corporation and counterparty when appropriate.
j FINANCIAL GUARANTEEFinancial guarantees are contracts that require the Corporation to make specified payments to reimburse the holder for a loss it incurs because a specified debtor fails to make payment when due in accordance with the terms of a debt instrument. Financial guarantee liabilities are recognised initially at their fair value, and the initial fair value is amortised over the life of the financial guarantee. The financial guarantee liability is subsequently carried at the higher of this J mortised amount and the present value of any expected payment when a payment under the guarantee has become probable.
K jUDGEMENTSIn the process of applying the Corporation’s accounting policies, management has made the following judgments, apart from those involving estimations, which have the most significant effect on the amounts recognised in the financial statements:
Impairment of available-for-sale investmentsThe Corporation considers available for sale equity investments that are at fair value, as impaired, when there has been a significant or prolonged decline in the fair value below its cost or where other objective evidence of impairment exists. The determination of what is “significant” or “prolonged” requires considerable judgment. In addition, objective evidence for impairment may be deterioration in the financial health of the investee, industry and sector performance, changes in technology and operational and financing cash flows.
Significant Accounting Policies (Continued)
APICORP 49
L ESTIMATION UNCERTAINTyThe key assumptions concerning the future and other key sources of estimation uncertainty at the balance sheet date, that have a significant risk of causing a material adjustment to the carrying amounts of assets and liabilities within the next financial year are discussed below:
L-1 Impairment losses on loans and advancesThe Corporation reviews its loans portfolio at every reporting period to assess whether a provision for impairment should be recorded in the statement of income. In particular, considerable judgment by Corporation is required in the estimation of the amount and timing of future cash flows when determining the level of provisions required. Such estimates are necessarily based on assumptions about several factors involving varying degrees of judgment and uncertainty, and actual results may differ resulting in future changes to such provisions.
L-2 Collective impairment provisions on loans and advancesIn addition to specific provisions against individually significant loans and advances, the Corporation also makes a collective impairment provision against loans and advances which although not specifically identified as requiring a specific provision have a greater risk of default than when originally granted. The amount of the provision is based on the historical loss pattern for loans within each category and is adjusted to reflect current economic changes. The loans are categorised based on various credit risk characteristics of the loans.
M PROVISIONSThe Corporation recognizes a provision when it has a present legal or constructive obligation as a result of past events; it is more likely than not that an outflow of resources will be required to settle the obligation; and the amount has been reliably estimated.
N LEGAL AND GENERAL RESERVESUnder Article 35 of APICORP’s establishment agreement and statute, 10% of annual net income is to be transferred to a legal reserve until such reserve equals the paid up share capital. The legal reserve is not available for distribution.
Article 35 also permits the creation of other reserves such as a general reserve. The general reserve may be applied as is consistent with the objectives of the Corporation, and as may be resolved by the General Assembly, on the recommendation of the Board of Directors.
O OFFSETTING FINANCIAL INSTRUMENTSFinancial assets and liabilities are offset and the net amount reported in the balance sheet where there is a legally enforceable right to offset the recognised amounts and there is an intention to settle on a net basis or realise the asset and settle the liability simultaneously.
Significant Accounting Policies (Continued)
APICORP Annual Report 201150
Notes to the Financial Statementsfor the year ended 31 December 2011
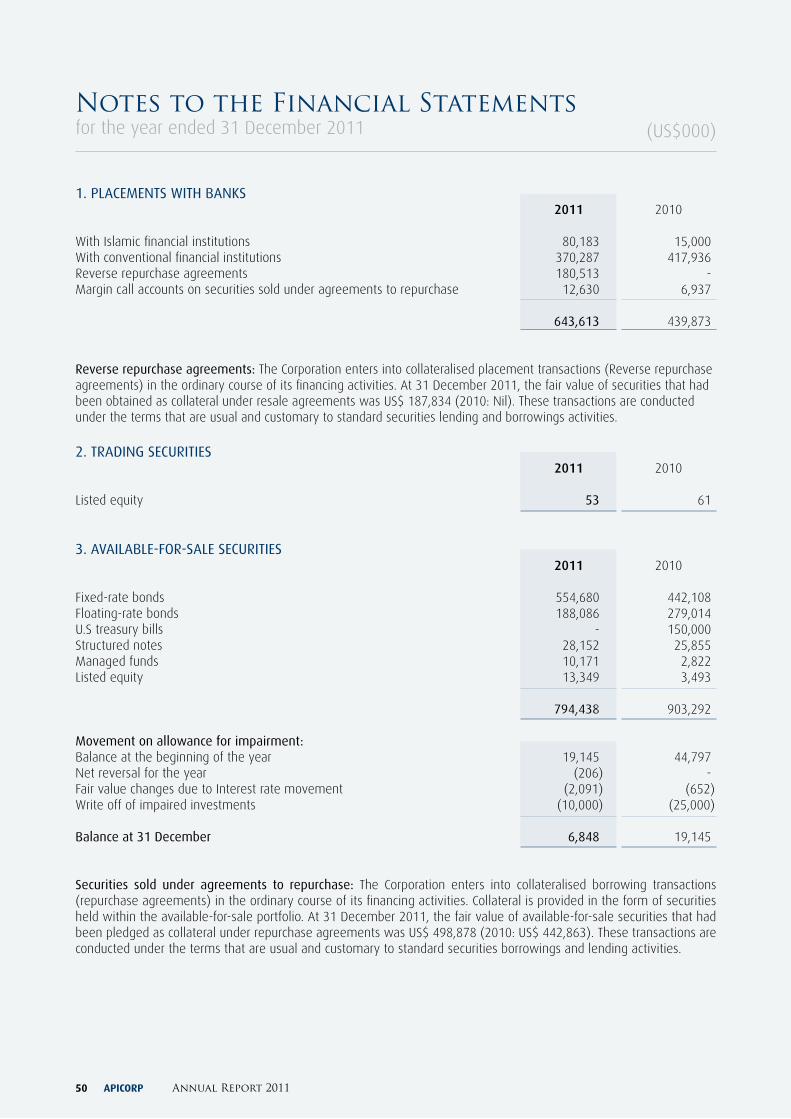
1. PLACEMENTS WITH BANKS 2011 2010
With Islamic financial institutions 80,183 15,000With conventional financial institutions 370,287 417,936Reverse repurchase agreements 180,513 -Margin call accounts on securities sold under agreements to repurchase 12,630 6,937 643,613 439,873
Reverse repurchase agreements: The Corporation enters into collateralised placement transactions (Reverse repurchase agreements) in the ordinary course of its financing activities. At 31 December 2011, the fair value of securities that had been obtained as collateral under resale agreements was US$ 187,834 (2010: Nil). These transactions are conducted under the terms that are usual and customary to standard securities lending and borrowings activities.
2. TRADING SECURITIES 2011 2010 Listed equity 53 61
3. AVAILABLE-FOR-SALE SECURITIES 2011 2010 Fixed-rate bonds 554,680 442,108Floating-rate bonds 188,086 279,014U.S treasury bills - 150,000Structured notes 28,152 25,855Managed funds 10,171 2,822Listed equity 13,349 3,493
794,438 903,292
Movement on allowance for impairment: Balance at the beginning of the year 19,145 44,797Net reversal for the year (206) -Fair value changes due to Interest rate movement (2,091) (652)Write off of impaired investments (10,000) (25,000) Balance at 31 December 6,848 19,145
Securities sold under agreements to repurchase: The Corporation enters into collateralised borrowing transactions (repurchase agreements) in the ordinary course of its financing activities. Collateral is provided in the form of securities held within the available-for-sale portfolio. At 31 December 2011, the fair value of available-for-sale securities that had been pledged as collateral under repurchase agreements was US$ 498,878 (2010: US$ 442,863). These transactions are conducted under the terms that are usual and customary to standard securities borrowings and lending activities.
(US$000)
APICORP 51
Notes to the Financial Statements (Continued)for the year ended 31 December 2011
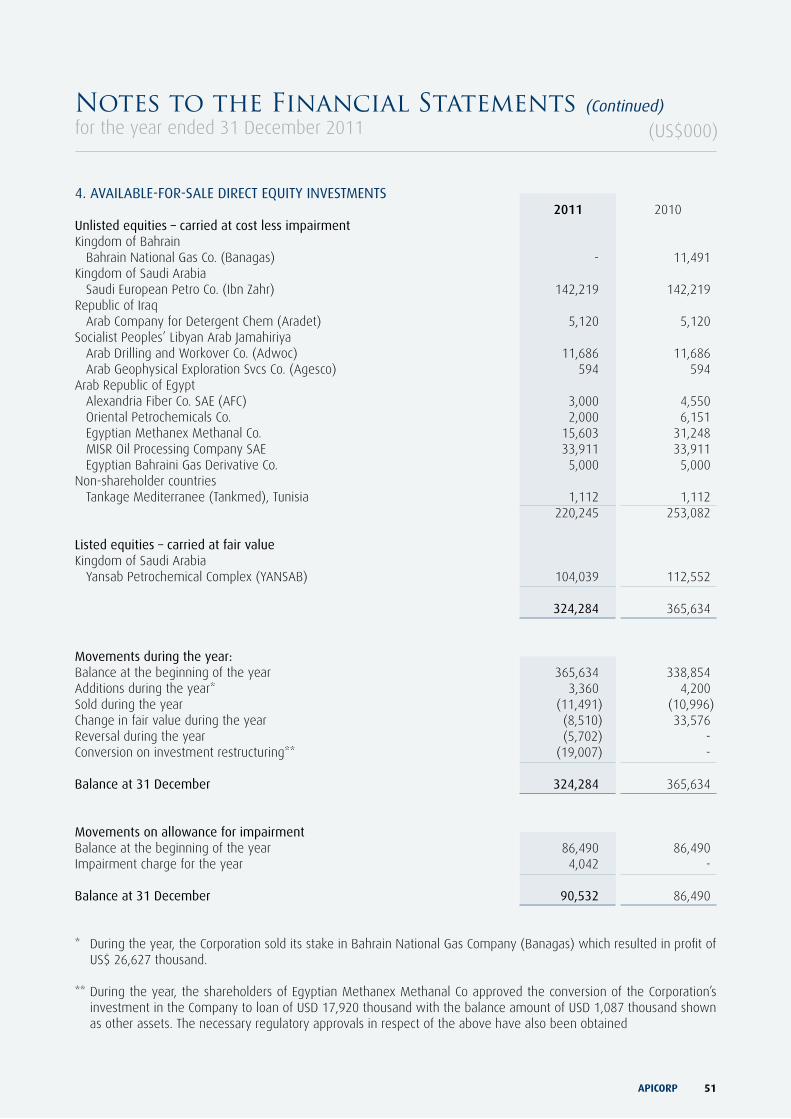
4. AVAILABLE-FOR-SALE DIRECT EQUITy INVESTMENTS 2011 2010Unlisted equities – carried at cost less impairmentKingdom of Bahrain Bahrain National Gas Co. (Banagas) - 11,491Kingdom of Saudi Arabia Saudi European Petro Co. (Ibn Zahr) 142,219 142,219Republic of Iraq Arab Company for Detergent Chem (Aradet) 5,120 5,120Socialist Peoples’ Libyan Arab Jamahiriya Arab Drilling and Workover Co. (Adwoc) 11,686 11,686 Arab Geophysical Exploration Svcs Co. (Agesco) 594 594Arab Republic of Egypt Alexandria Fiber Co. SAE (AFC) 3,000 4,550 Oriental Petrochemicals Co. 2,000 6,151 Egyptian Methanex Methanal Co. 15,603 31,248 MISR Oil Processing Company SAE 33,911 33,911 Egyptian Bahraini Gas Derivative Co. 5,000 5,000Non-shareholder countries Tankage Mediterranee (Tankmed), Tunisia 1,112 1,112 220,245 253,082
Listed equities – carried at fair valueKingdom of Saudi Arabia Yansab Petrochemical Complex (YANSAB) 104,039 112,552 324,284 365,634
Movements during the year:Balance at the beginning of the year 365,634 338,854Additions during the year* 3,360 4,200Sold during the year (11,491) (10,996)Change in fair value during the year (8,510) 33,576Reversal during the year (5,702) -Conversion on investment restructuring** (19,007) - Balance at 31 December 324,284 365,634
Movements on allowance for impairmentBalance at the beginning of the year 86,490 86,490Impairment charge for the year 4,042 - Balance at 31 December 90,532 86,490
* During the year, the Corporation sold its stake in Bahrain National Gas Company (Banagas) which resulted in profit of US$ 26,627 thousand.
** During the year, the shareholders of Egyptian Methanex Methanal Co approved the conversion of the Corporation’s investment in the Company to loan of USD 17,920 thousand with the balance amount of USD 1,087 thousand shown as other assets. The necessary regulatory approvals in respect of the above have also been obtained
(US$000)
APICORP Annual Report 201152
4. Available-for-sale direct equity investments (continued)
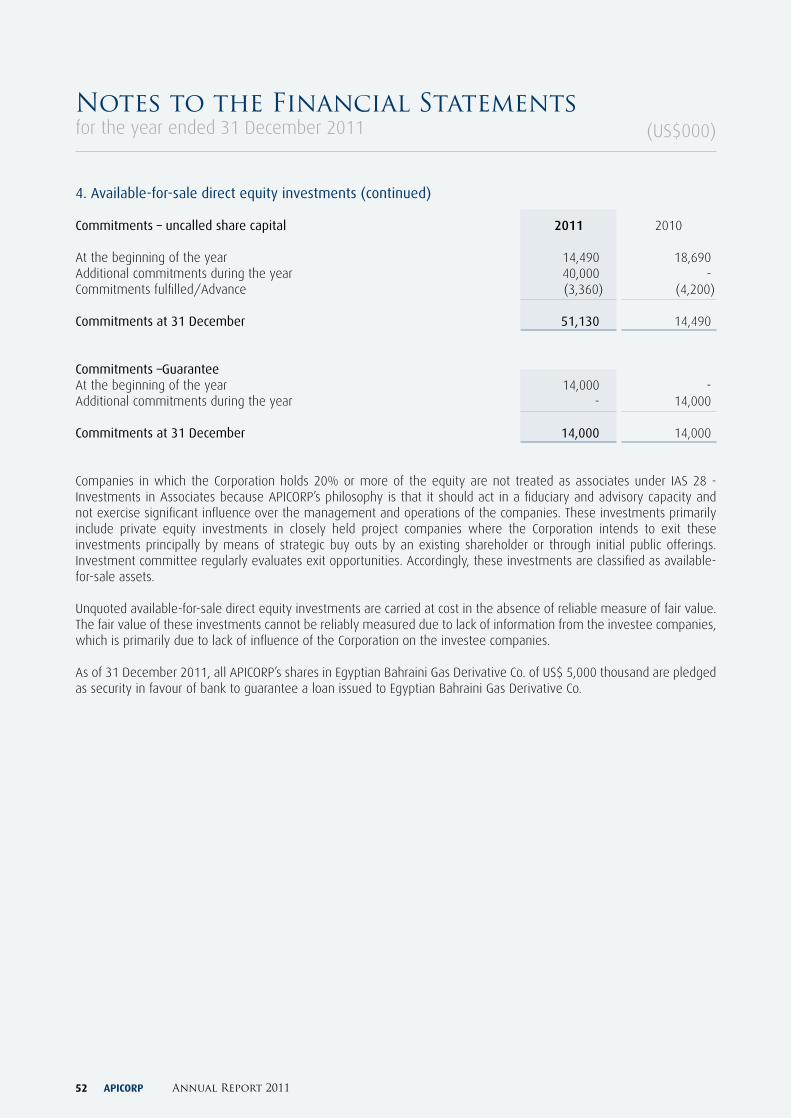
Commitments – uncalled share capital 2011 2010
At the beginning of the year 14,490 18,690Additional commitments during the year 40,000 -Commitments fulfilled/Advance (3,360) (4,200) Commitments at 31 December 51,130 14,490
Commitments –GuaranteeAt the beginning of the year 14,000 -Additional commitments during the year - 14,000 Commitments at 31 December 14,000 14,000
Companies in which the Corporation holds 20% or more of the equity are not treated as associates under IAS 28 - Investments in Associates because APICORP’s philosophy is that it should act in a fiduciary and advisory capacity and not exercise significant influence over the management and operations of the companies. These investments primarily include private equity investments in closely held project companies where the Corporation intends to exit these investments principally by means of strategic buy outs by an existing shareholder or through initial public offerings. Investment committee regularly evaluates exit opportunities. Accordingly, these investments are classified as available-for-sale assets.
Unquoted available-for-sale direct equity investments are carried at cost in the absence of reliable measure of fair value. The fair value of these investments cannot be reliably measured due to lack of information from the investee companies, which is primarily due to lack of influence of the Corporation on the investee companies.
As of 31 December 2011, all APICORP’s shares in Egyptian Bahraini Gas Derivative Co. of US$ 5,000 thousand are pledged as security in favour of bank to guarantee a loan issued to Egyptian Bahraini Gas Derivative Co.
(US$000)Notes to the Financial Statementsfor the year ended 31 December 2011
APICORP 53
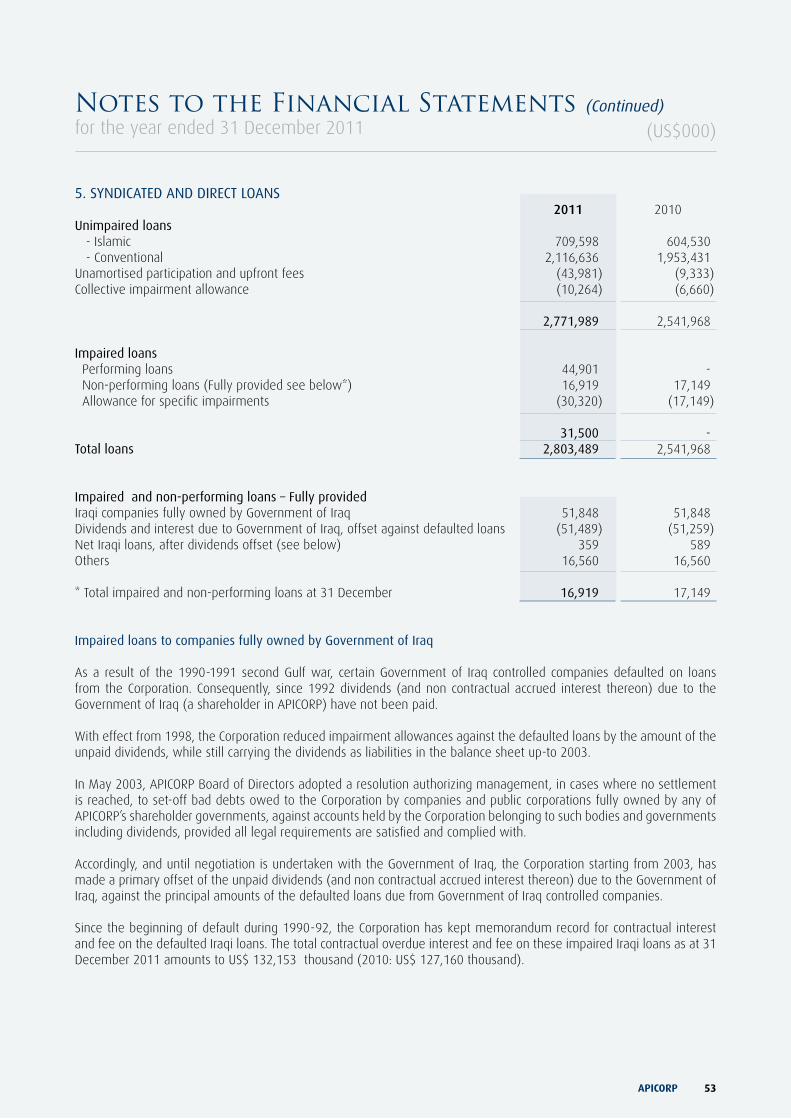
5. SyNDICATED AND DIRECT LOANS 2011 2010Unimpaired loans - Islamic 709,598 604,530 - Conventional 2,116,636 1,953,431Unamortised participation and upfront fees (43,981) (9,333)Collective impairment allowance (10,264) (6,660) 2,771,989 2,541,968
Impaired loans Performing loans 44,901 - Non-performing loans (Fully provided see below*) 16,919 17,149 Allowance for specific impairments (30,320) (17,149) 31,500 -Total loans 2,803,489 2,541,968
Impaired and non-performing loans – Fully provided Iraqi companies fully owned by Government of Iraq 51,848 51,848Dividends and interest due to Government of Iraq, offset against defaulted loans (51,489) (51,259)Net Iraqi loans, after dividends offset (see below) 359 589Others 16,560 16,560 * Total impaired and non-performing loans at 31 December 16,919 17,149
Impaired loans to companies fully owned by Government of Iraq
As a result of the 1990-1991 second Gulf war, certain Government of Iraq controlled companies defaulted on loans from the Corporation. Consequently, since 1992 dividends (and non contractual accrued interest thereon) due to the Government of Iraq (a shareholder in APICORP) have not been paid.
With effect from 1998, the Corporation reduced impairment allowances against the defaulted loans by the amount of the unpaid dividends, while still carrying the dividends as liabilities in the balance sheet up-to 2003.
In May 2003, APICORP Board of Directors adopted a resolution authorizing management, in cases where no settlement is reached, to set-off bad debts owed to the Corporation by companies and public corporations fully owned by any of APICORP’s shareholder governments, against accounts held by the Corporation belonging to such bodies and governments including dividends, provided all legal requirements are satisfied and complied with.
Accordingly, and until negotiation is undertaken with the Government of Iraq, the Corporation starting from 2003, has made a primary offset of the unpaid dividends (and non contractual accrued interest thereon) due to the Government of Iraq, against the principal amounts of the defaulted loans due from Government of Iraq controlled companies.
Since the beginning of default during 1990-92, the Corporation has kept memorandum record for contractual interest and fee on the defaulted Iraqi loans. The total contractual overdue interest and fee on these impaired Iraqi loans as at 31 December 2011 amounts to US$ 132,153 thousand (2010: US$ 127,160 thousand).
(US$000)Notes to the Financial Statements (Continued)for the year ended 31 December 2011
APICORP Annual Report 201154
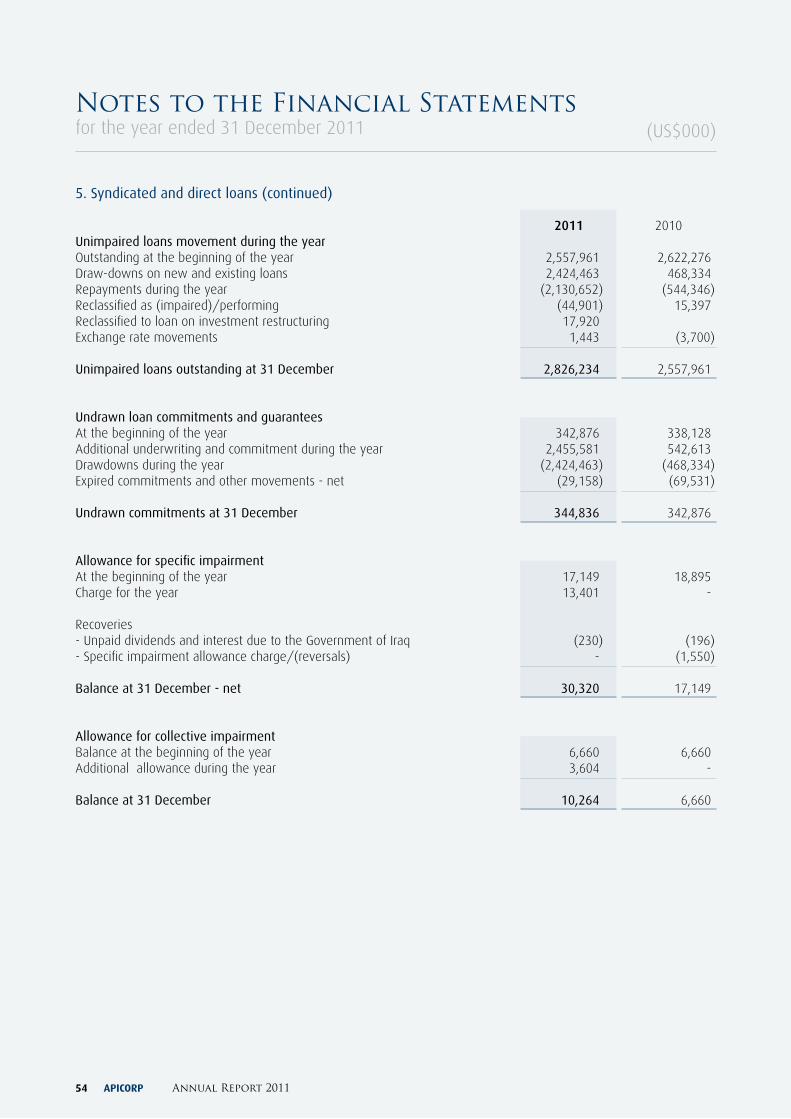
5. Syndicated and direct loans (continued)
2011 2010Unimpaired loans movement during the year Outstanding at the beginning of the year 2,557,961 2,622,276Draw-downs on new and existing loans 2,424,463 468,334Repayments during the year (2,130,652) (544,346)Reclassified as (impaired)/performing (44,901) 15,397Reclassified to loan on investment restructuring 17,920 Exchange rate movements 1,443 (3,700)
Unimpaired loans outstanding at 31 December 2,826,234 2,557,961
Undrawn loan commitments and guarantees At the beginning of the year 342,876 338,128Additional underwriting and commitment during the year 2,455,581 542,613Drawdowns during the year (2,424,463) (468,334)Expired commitments and other movements - net (29,158) (69,531)
Undrawn commitments at 31 December 344,836 342,876
Allowance for specific impairment At the beginning of the year 17,149 18,895Charge for the year 13,401 -
Recoveries - Unpaid dividends and interest due to the Government of Iraq (230) (196)- Specific impairment allowance charge/(reversals) - (1,550) Balance at 31 December - net 30,320 17,149
Allowance for collective impairment Balance at the beginning of the year 6,660 6,660Additional allowance during the year 3,604 - Balance at 31 December 10,264 6,660
(US$000)Notes to the Financial Statementsfor the year ended 31 December 2011
APICORP 55
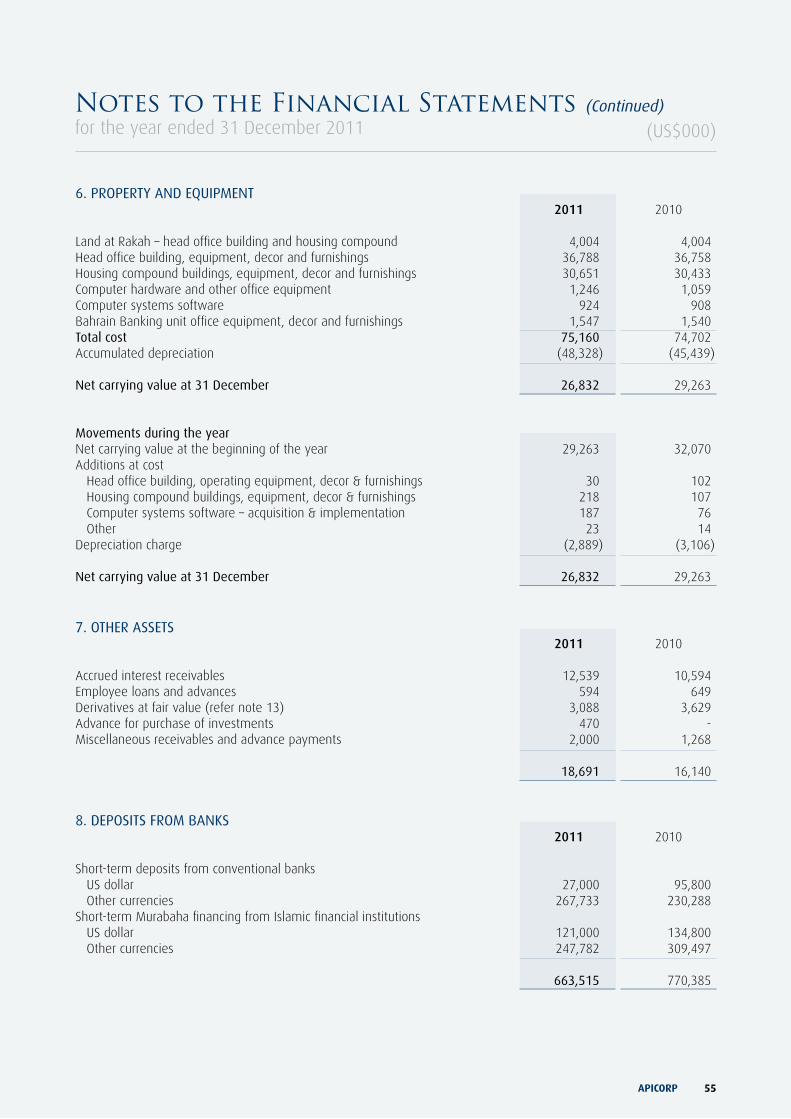
6. PROPERTy AND EQUIPMENT 2011 2010 Land at Rakah – head office building and housing compound 4,004 4,004Head office building, equipment, decor and furnishings 36,788 36,758Housing compound buildings, equipment, decor and furnishings 30,651 30,433Computer hardware and other office equipment 1,246 1,059Computer systems software 924 908Bahrain Banking unit office equipment, decor and furnishings 1,547 1,540Total cost 75,160 74,702Accumulated depreciation (48,328) (45,439) Net carrying value at 31 December 26,832 29,263
Movements during the year Net carrying value at the beginning of the year 29,263 32,070Additions at cost Head office building, operating equipment, decor & furnishings 30 102 Housing compound buildings, equipment, decor & furnishings 218 107 Computer systems software – acquisition & implementation 187 76 Other 23 14Depreciation charge (2,889) (3,106) Net carrying value at 31 December 26,832 29,263
7. OTHER ASSETS 2011 2010 Accrued interest receivables 12,539 10,594Employee loans and advances 594 649Derivatives at fair value (refer note 13) 3,088 3,629Advance for purchase of investments 470 -Miscellaneous receivables and advance payments 2,000 1,268 18,691 16,140
8. DEPOSITS FROM BANKS 2011 2010 Short-term deposits from conventional banks US dollar 27,000 95,800 Other currencies 267,733 230,288Short-term Murabaha financing from Islamic financial institutions US dollar 121,000 134,800 Other currencies 247,782 309,497
663,515 770,385
(US$000)Notes to the Financial Statements (Continued)for the year ended 31 December 2011
APICORP Annual Report 201156
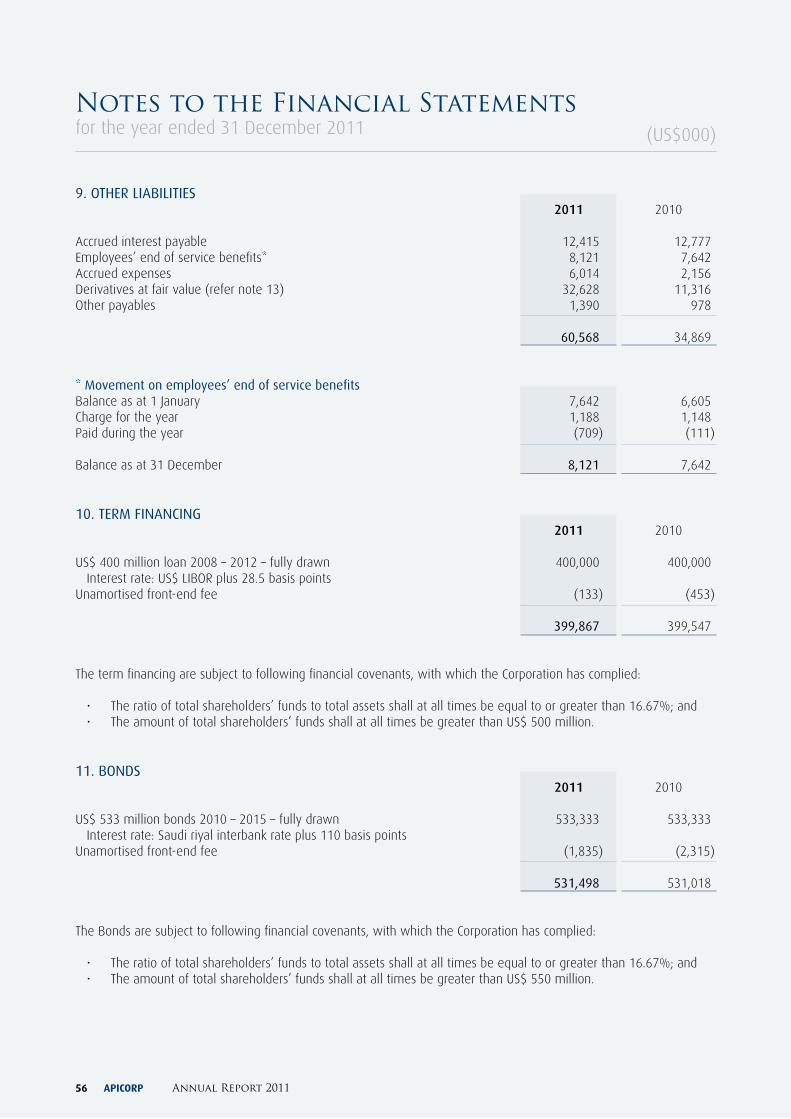
9. OTHER LIABILITIES 2011 2010 Accrued interest payable 12,415 12,777Employees’ end of service benefits* 8,121 7,642Accrued expenses 6,014 2,156Derivatives at fair value (refer note 13) 32,628 11,316Other payables 1,390 978 60,568 34,869
* Movement on employees’ end of service benefits Balance as at 1 January 7,642 6,605Charge for the year 1,188 1,148Paid during the year (709) (111) Balance as at 31 December 8,121 7,642
10. TERM FINANCING 2011 2010 US$ 400 million loan 2008 – 2012 – fully drawn 400,000 400,000 Interest rate: US$ LIBOR plus 28.5 basis points Unamortised front-end fee (133) (453) 399,867 399,547
The term financing are subject to following financial covenants, with which the Corporation has complied:
• The ratio of total shareholders’ funds to total assets shall at all times be equal to or greater than 16.67%; and• The amount of total shareholders’ funds shall at all times be greater than US$ 500 million.
11. BONDS 2011 2010 US$ 533 million bonds 2010 – 2015 – fully drawn 533,333 533,333 Interest rate: Saudi riyal interbank rate plus 110 basis points Unamortised front-end fee (1,835) (2,315) 531,498 531,018
The Bonds are subject to following financial covenants, with which the Corporation has complied:
• The ratio of total shareholders’ funds to total assets shall at all times be equal to or greater than 16.67%; and• The amount of total shareholders’ funds shall at all times be greater than US$ 550 million.
(US$000)
Notes to the Financial Statementsfor the year ended 31 December 2011
APICORP 57
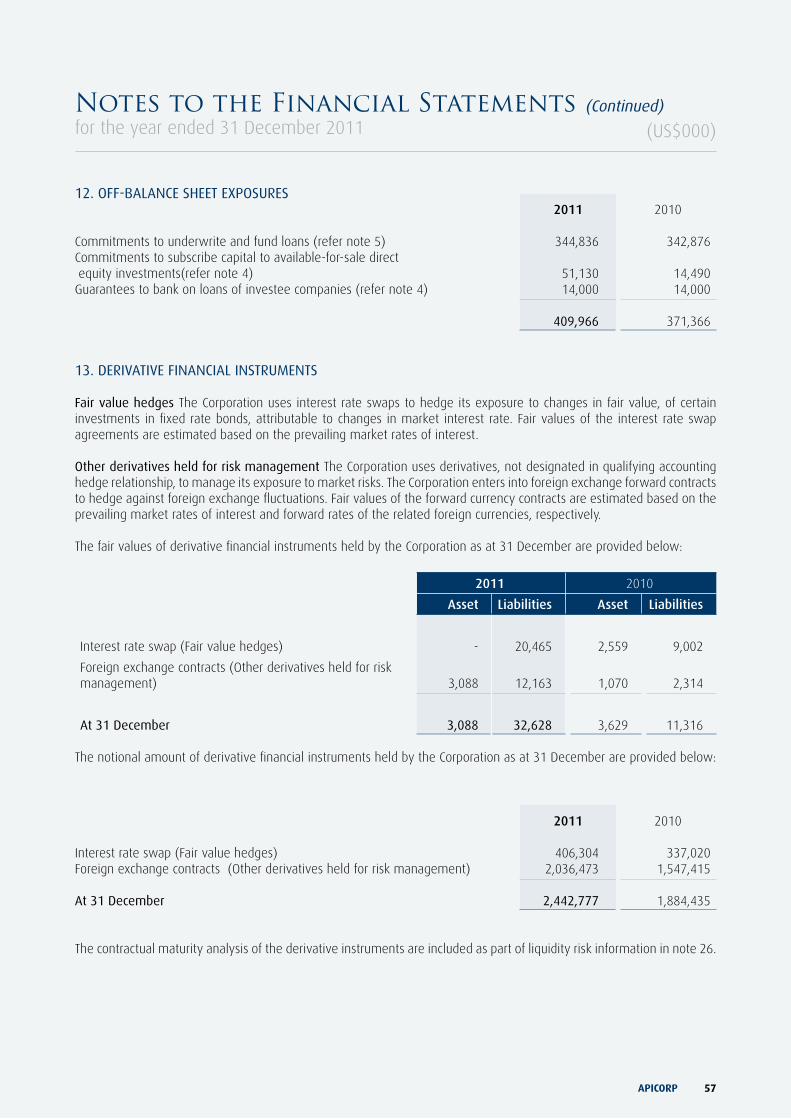
12. OFF-BALANCE SHEET EXPOSURES 2011 2010 Commitments to underwrite and fund loans (refer note 5) 344,836 342,876Commitments to subscribe capital to available-for-sale direct equity investments(refer note 4) 51,130 14,490Guarantees to bank on loans of investee companies (refer note 4) 14,000 14,000 409,966 371,366
13. DERIVATIVE FINANCIAL INSTRUMENTS
Fair value hedges The Corporation uses interest rate swaps to hedge its exposure to changes in fair value, of certain investments in fixed rate bonds, attributable to changes in market interest rate. Fair values of the interest rate swap agreements are estimated based on the prevailing market rates of interest.
Other derivatives held for risk management The Corporation uses derivatives, not designated in qualifying accounting hedge relationship, to manage its exposure to market risks. The Corporation enters into foreign exchange forward contracts to hedge against foreign exchange fluctuations. Fair values of the forward currency contracts are estimated based on the prevailing market rates of interest and forward rates of the related foreign currencies, respectively.
The fair values of derivative financial instruments held by the Corporation as at 31 December are provided below:
2011 2010
Asset Liabilities Asset Liabilities
Interest rate swap (Fair value hedges) - 20,465 2,559 9,002
Foreign exchange contracts (Other derivatives held for risk management) 3,088 12,163 1,070 2,314
At 31 December 3,088 32,628 3,629 11,316
The notional amount of derivative financial instruments held by the Corporation as at 31 December are provided below:
2011 2010
Interest rate swap (Fair value hedges) 406,304 337,020Foreign exchange contracts (Other derivatives held for risk management) 2,036,473 1,547,415 At 31 December 2,442,777 1,884,435
The contractual maturity analysis of the derivative instruments are included as part of liquidity risk information in note 26.
(US$000)Notes to the Financial Statements (Continued)for the year ended 31 December 2011
APICORP Annual Report 201158
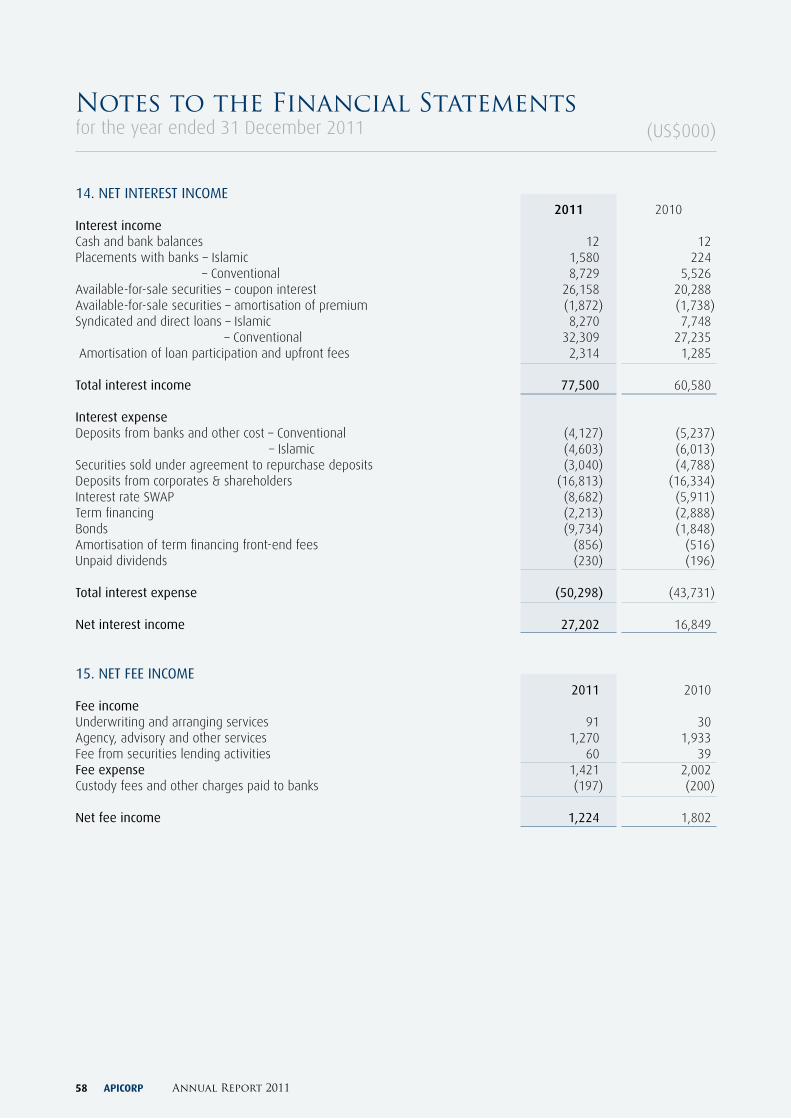
14. NET INTEREST INCOME 2011 2010Interest income Cash and bank balances 12 12Placements with banks – Islamic 1,580 224 – Conventional 8,729 5,526Available-for-sale securities – coupon interest 26,158 20,288Available-for-sale securities – amortisation of premium (1,872) (1,738)Syndicated and direct loans – Islamic 8,270 7,748 – Conventional 32,309 27,235 Amortisation of loan participation and upfront fees 2,314 1,285 Total interest income 77,500 60,580
Interest expense Deposits from banks and other cost – Conventional (4,127) (5,237) – Islamic (4,603) (6,013)Securities sold under agreement to repurchase deposits (3,040) (4,788)Deposits from corporates & shareholders (16,813) (16,334)Interest rate SWAP (8,682) (5,911)Term financing (2,213) (2,888)Bonds (9,734) (1,848)Amortisation of term financing front-end fees (856) (516)Unpaid dividends (230) (196) Total interest expense (50,298) (43,731) Net interest income 27,202 16,849
15. NET FEE INCOME 2011 2010Fee income Underwriting and arranging services 91 30Agency, advisory and other services 1,270 1,933Fee from securities lending activities 60 39Fee expense 1,421 2,002Custody fees and other charges paid to banks (197) (200) Net fee income 1,224 1,802
(US$000)Notes to the Financial Statementsfor the year ended 31 December 2011
APICORP 59
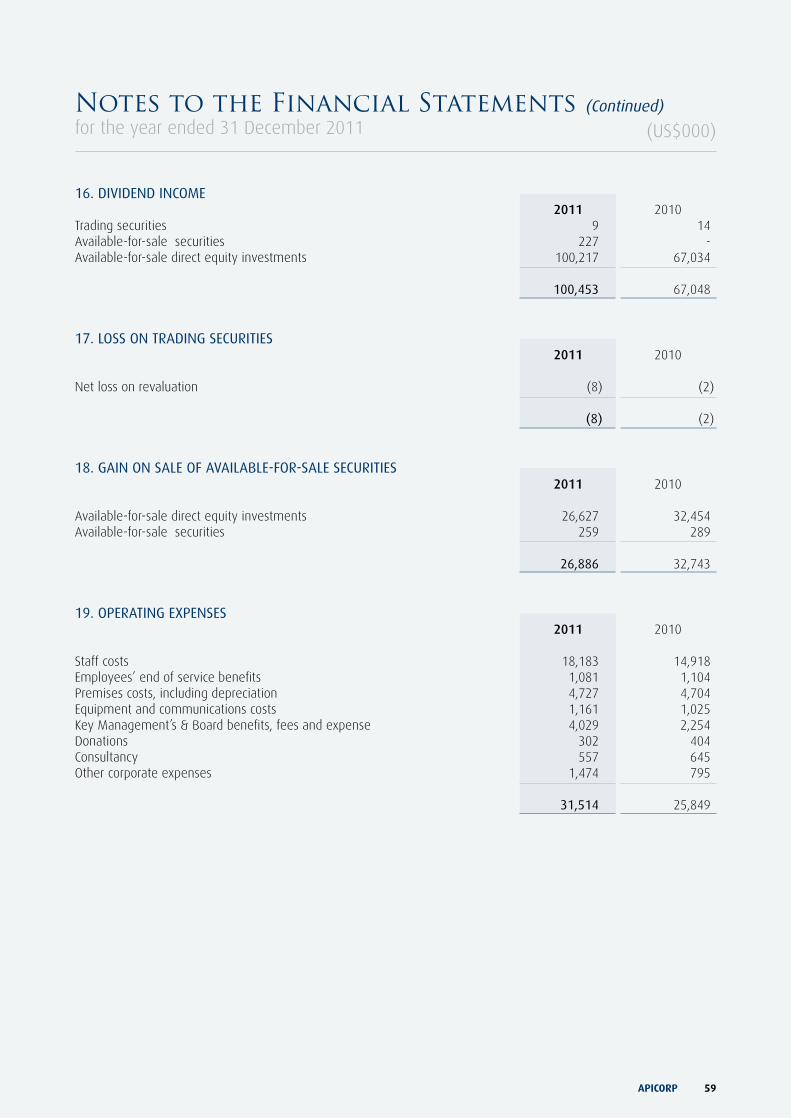
16. DIVIDEND INCOME 2011 2010Trading securities 9 14Available-for-sale securities 227 -Available-for-sale direct equity investments 100,217 67,034 100,453 67,048
17. LOSS ON TRADING SECURITIES 2011 2010 Net loss on revaluation (8) (2) (8) (2)
18. GAIN ON SALE OF AVAILABLE-FOR-SALE SECURITIES 2011 2010 Available-for-sale direct equity investments 26,627 32,454Available-for-sale securities 259 289
26,886 32,743
19. OPERATING EXPENSES 2011 2010 Staff costs 18,183 14,918Employees’ end of service benefits 1,081 1,104Premises costs, including depreciation 4,727 4,704Equipment and communications costs 1,161 1,025Key Management’s & Board benefits, fees and expense 4,029 2,254Donations 302 404Consultancy 557 645Other corporate expenses 1,474 795 31,514 25,849
(US$000)Notes to the Financial Statements (Continued)for the year ended 31 December 2011
APICORP Annual Report 201160
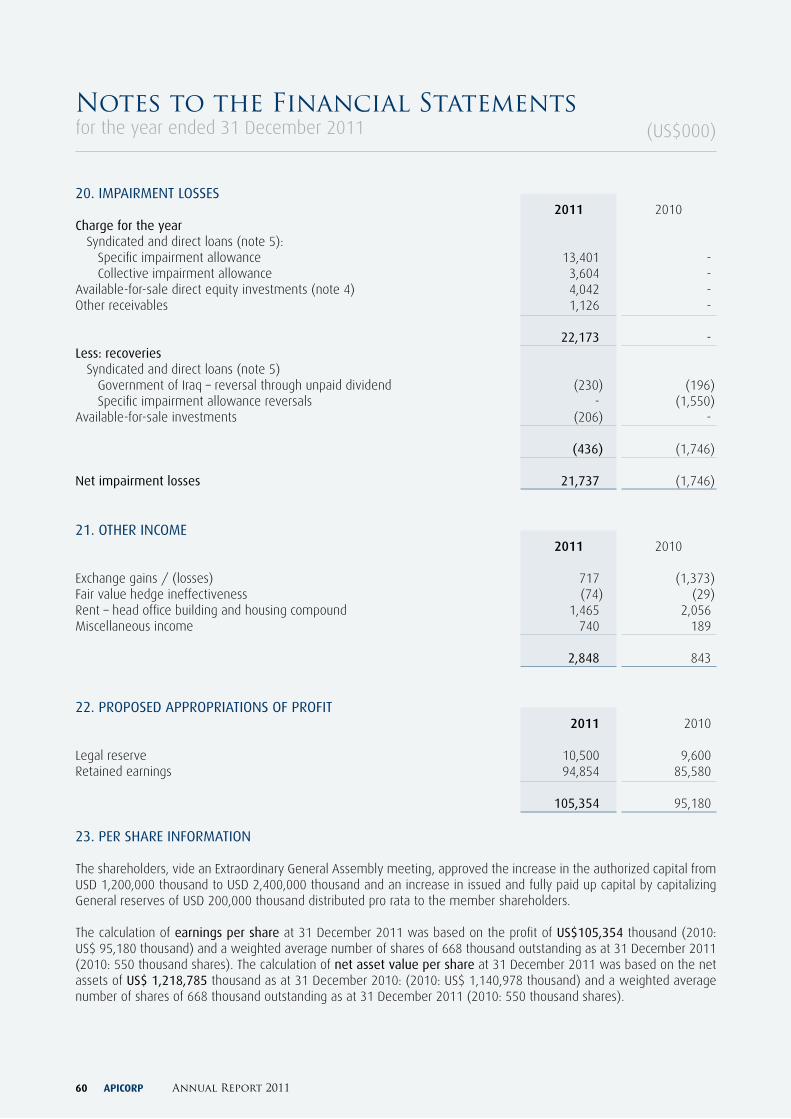
20. IMPAIRMENT LOSSES 2011 2010Charge for the year Syndicated and direct loans (note 5): Specific impairment allowance 13,401 - Collective impairment allowance 3,604 -Available-for-sale direct equity investments (note 4) 4,042 -Other receivables 1,126 - 22,173 -Less: recoveries Syndicated and direct loans (note 5) Government of Iraq – reversal through unpaid dividend (230) (196) Specific impairment allowance reversals - (1,550)Available-for-sale investments (206) -
(436) (1,746) Net impairment losses 21,737 (1,746)
21. OTHER INCOME 2011 2010 Exchange gains / (losses) 717 (1,373)Fair value hedge ineffectiveness (74) (29)Rent – head office building and housing compound 1,465 2,056Miscellaneous income 740 189 2,848 843
22. PROPOSED APPROPRIATIONS OF PROFIT 2011 2010 Legal reserve 10,500 9,600Retained earnings 94,854 85,580 105,354 95,180
23. PER SHARE INFORMATION
The shareholders, vide an Extraordinary General Assembly meeting, approved the increase in the authorized capital from USD 1,200,000 thousand to USD 2,400,000 thousand and an increase in issued and fully paid up capital by capitalizing General reserves of USD 200,000 thousand distributed pro rata to the member shareholders.
The calculation of earnings per share at 31 December 2011 was based on the profit of US$105,354 thousand (2010: US$ 95,180 thousand) and a weighted average number of shares of 668 thousand outstanding as at 31 December 2011 (2010: 550 thousand shares). The calculation of net asset value per share at 31 December 2011 was based on the net assets of US$ 1,218,785 thousand as at 31 December 2010: (2010: US$ 1,140,978 thousand) and a weighted average number of shares of 668 thousand outstanding as at 31 December 2011 (2010: 550 thousand shares).
(US$000)Notes to the Financial Statementsfor the year ended 31 December 2011
APICORP 61
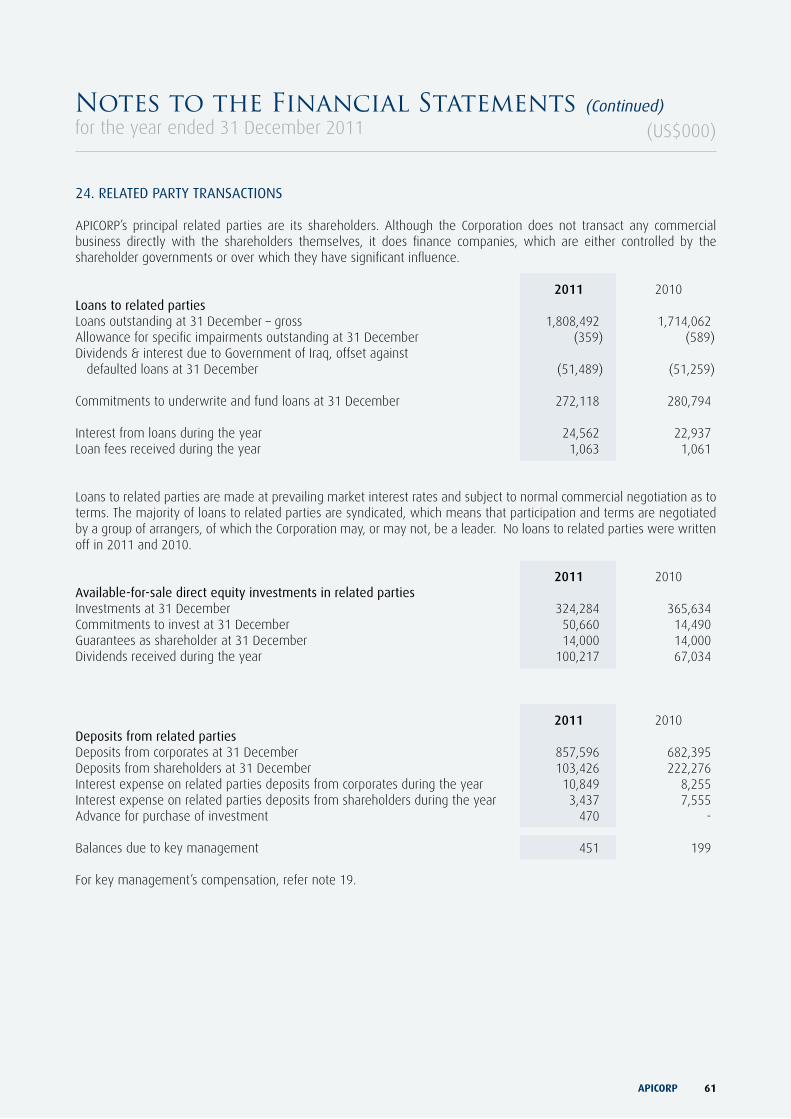
24. RELATED PARTy TRANSACTIONS
APICORP’s principal related parties are its shareholders. Although the Corporation does not transact any commercial business directly with the shareholders themselves, it does finance companies, which are either controlled by the shareholder governments or over which they have significant influence.
2011 2010Loans to related partiesLoans outstanding at 31 December – gross 1,808,492 1,714,062Allowance for specific impairments outstanding at 31 December (359) (589)Dividends & interest due to Government of Iraq, offset against defaulted loans at 31 December (51,489) (51,259)
Commitments to underwrite and fund loans at 31 December 272,118 280,794 Interest from loans during the year 24,562 22,937Loan fees received during the year 1,063 1,061
Loans to related parties are made at prevailing market interest rates and subject to normal commercial negotiation as to terms. The majority of loans to related parties are syndicated, which means that participation and terms are negotiated by a group of arrangers, of which the Corporation may, or may not, be a leader. No loans to related parties were written off in 2011 and 2010.
2011 2010Available-for-sale direct equity investments in related partiesInvestments at 31 December 324,284 365,634Commitments to invest at 31 December 50,660 14,490Guarantees as shareholder at 31 December 14,000 14,000Dividends received during the year 100,217 67,034
2011 2010Deposits from related parties Deposits from corporates at 31 December 857,596 682,395Deposits from shareholders at 31 December 103,426 222,276Interest expense on related parties deposits from corporates during the year 10,849 8,255Interest expense on related parties deposits from shareholders during the year 3,437 7,555Advance for purchase of investment 470 -
Balances due to key management 451 199
For key management’s compensation, refer note 19.
(US$000)Notes to the Financial Statements (Continued)for the year ended 31 December 2011
APICORP Annual Report 201162
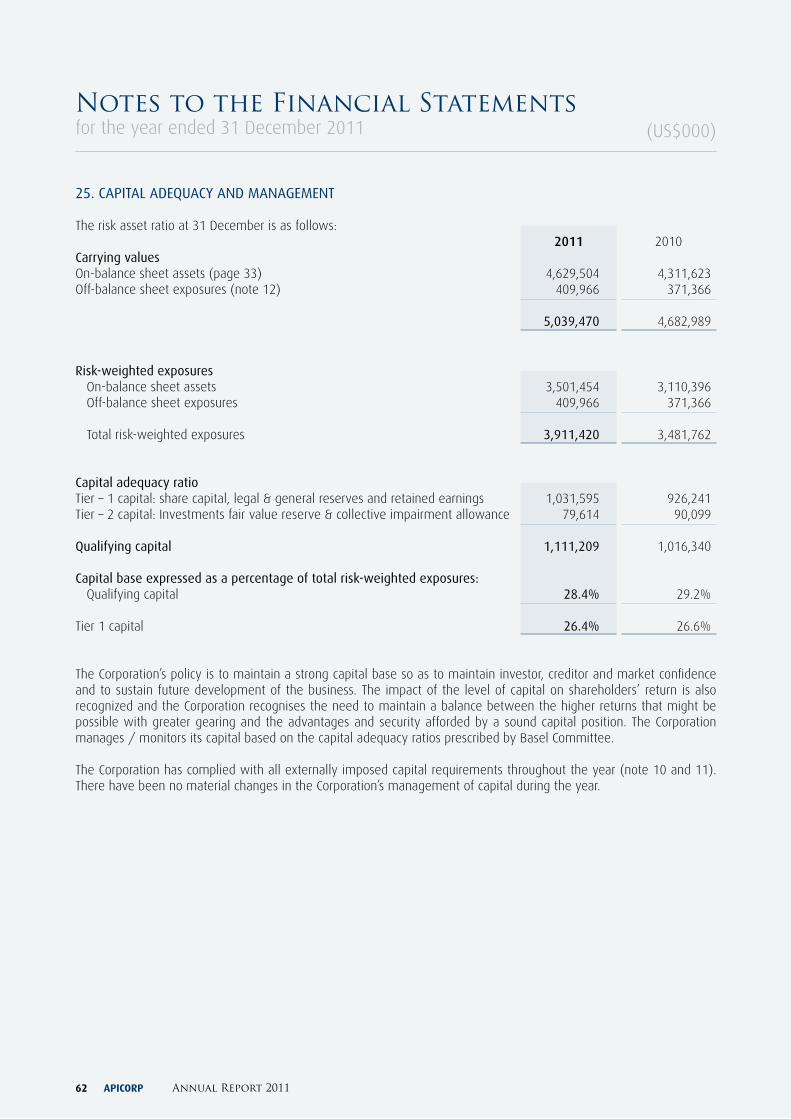
25. CAPITAL ADEQUACy AND MANAGEMENT
The risk asset ratio at 31 December is as follows: 2011 2010Carrying values On-balance sheet assets (page 33) 4,629,504 4,311,623Off-balance sheet exposures (note 12) 409,966 371,366 5,039,470 4,682,989
Risk-weighted exposures On-balance sheet assets 3,501,454 3,110,396 Off-balance sheet exposures 409,966 371,366 Total risk-weighted exposures 3,911,420 3,481,762
Capital adequacy ratio Tier – 1 capital: share capital, legal & general reserves and retained earnings 1,031,595 926,241 Tier – 2 capital: Investments fair value reserve & collective impairment allowance 79,614 90,099
Qualifying capital 1,111,209 1,016,340
Capital base expressed as a percentage of total risk-weighted exposures: Qualifying capital 28.4% 29.2% Tier 1 capital 26.4% 26.6%
The Corporation’s policy is to maintain a strong capital base so as to maintain investor, creditor and market confidence and to sustain future development of the business. The impact of the level of capital on shareholders’ return is also recognized and the Corporation recognises the need to maintain a balance between the higher returns that might be possible with greater gearing and the advantages and security afforded by a sound capital position. The Corporation manages / monitors its capital based on the capital adequacy ratios prescribed by Basel Committee.
The Corporation has complied with all externally imposed capital requirements throughout the year (note 10 and 11). There have been no material changes in the Corporation’s management of capital during the year.
(US$000)Notes to the Financial Statementsfor the year ended 31 December 2011
APICORP 63
26. FINANCIAL INSTRUMENTS AND RISK MANAGEMENT
Financial instrumentsA financial instrument is any contract that gives rise to both a financial asset in one enterprise and a financial liability or equity instrument in another enterprise. APICORP’s financial assets are principally trading securities, available-for-sale securities, placements with banks, syndicated and direct loans, available-for-sale direct equity investments and certain other assets.
Financial liabilities consist of commitments to lend and invest in equity, deposits from banks, term financing, certain other liabilities and guarantees.
These financial instruments expose APICORP to varying degrees of market risk (including currency, interest rate and price risks), credit risk and liquidity risk.
Credit risk managementCredit risk is the risk that a borrower or counter-party of APICORP will be unable or unwilling to meet a commitment that it has entered into with the Corporation, causing a financial loss to the Corporation. It arises from the lending, treasury and other activities undertaken by the Corporation. Policies and procedures have been established for the control and monitoring of all such exposures.
Proposed loans and available-for-sale direct equity investments are subject to systematic investigation, analysis and appraisal before being reviewed by the Credit Committee (consisting of the General Manager and Senior Managers of the Corporation), which makes appropriate recommendations to the Board of Directors, who have the ultimate authority to sanction commitments. These procedures, plus the fact that most of the loans are backed by sovereign guarantees and commitments and export credit agency cover, limit APICORP’s exposure to credit risk.
The Corporation faces a credit risk on undrawn commitments because it is potentially exposed to loss in an amount equal to the total unused commitments. However the eventual loss, if any, will be considerably less than the total unused commitments, since most commitments to extend credit are contingent upon borrowers maintaining specified credit standards. All loan commitments, whether drawn or undrawn, are subject to systematic monitoring so that potential problems may be detected early and remedial action taken.
Treasury activities are controlled by means of a framework of limits and external credit ratings. Dealing in marketable securities is primarily restricted to GCC countries, United States and major European stock exchanges. Dealings are only permitted with approved internationally rated banks, brokers and other counter-parties. Securities portfolios and investing policies are reviewed from time to time by the Assets and Liabilities Committee (“ALCO”).
(US$000)Notes to the Financial Statements (Continued)for the year ended 31 December 2011
APICORP Annual Report 201164
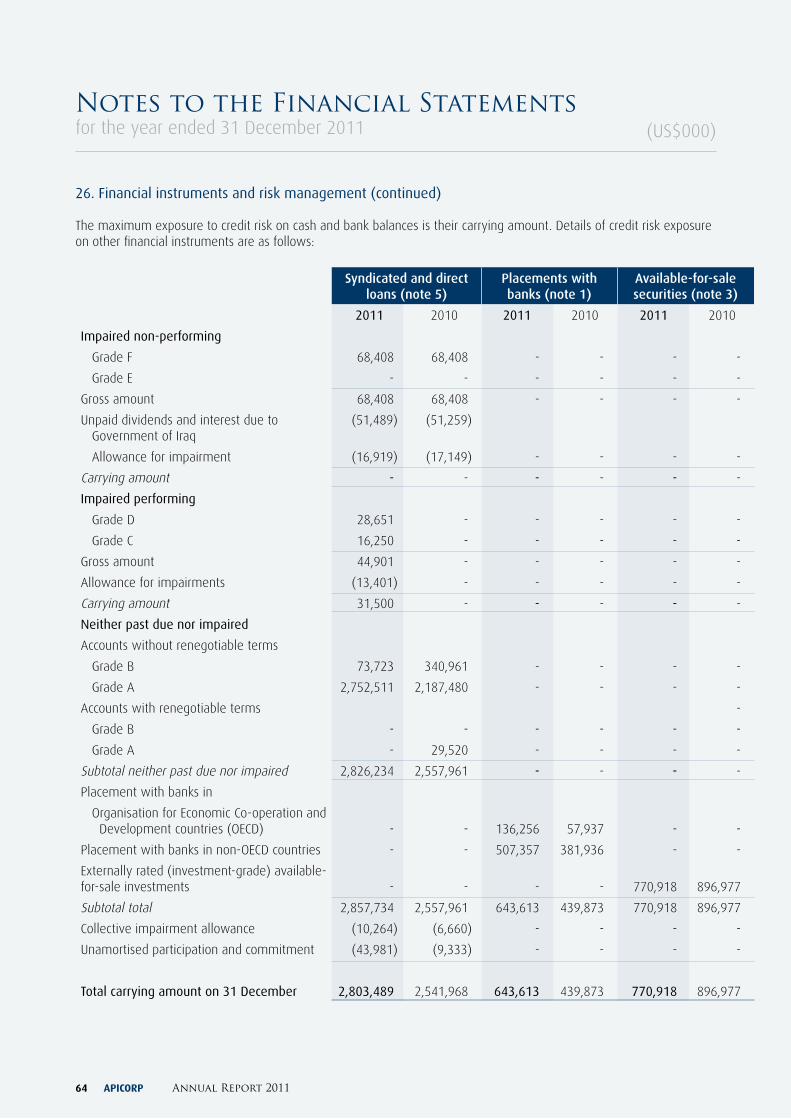
26. Financial instruments and risk management (continued)
The maximum exposure to credit risk on cash and bank balances is their carrying amount. Details of credit risk exposure on other financial instruments are as follows:
Syndicated and direct loans (note 5)
Placements with banks (note 1)
Available-for-sale securities (note 3)
2011 2010 2011 2010 2011 2010
Impaired non-performing
Grade F 68,408 68,408 - - - -
Grade E - - - - - -
Gross amount 68,408 68,408 - - - -
Unpaid dividends and interest due to Government of Iraq
(51,489) (51,259)
Allowance for impairment (16,919) (17,149) - - - -
Carrying amount - - - - - -
Impaired performing
Grade D 28,651 - - - - -
Grade C 16,250 - - - - -
Gross amount 44,901 - - - - -
Allowance for impairments (13,401) - - - - -
Carrying amount 31,500 - - - - -
Neither past due nor impaired
Accounts without renegotiable terms
Grade B 73,723 340,961 - - - -
Grade A 2,752,511 2,187,480 - - - -
Accounts with renegotiable terms -
Grade B - - - - - -
Grade A - 29,520 - - - -
Subtotal neither past due nor impaired 2,826,234 2,557,961 - - - -
Placement with banks in
Organisation for Economic Co-operation and Development countries (OECD) - - 136,256 57,937 - -
Placement with banks in non-OECD countries - - 507,357 381,936 - -
Externally rated (investment-grade) available-for-sale investments - - - - 770,918 896,977
Subtotal total 2,857,734 2,557,961 643,613 439,873 770,918 896,977
Collective impairment allowance (10,264) (6,660) - - - -
Unamortised participation and commitment (43,981) (9,333) - - - -
Total carrying amount on 31 December 2,803,489 2,541,968 643,613 439,873 770,918 896,977
(US$000)Notes to the Financial Statementsfor the year ended 31 December 2011
APICORP 65
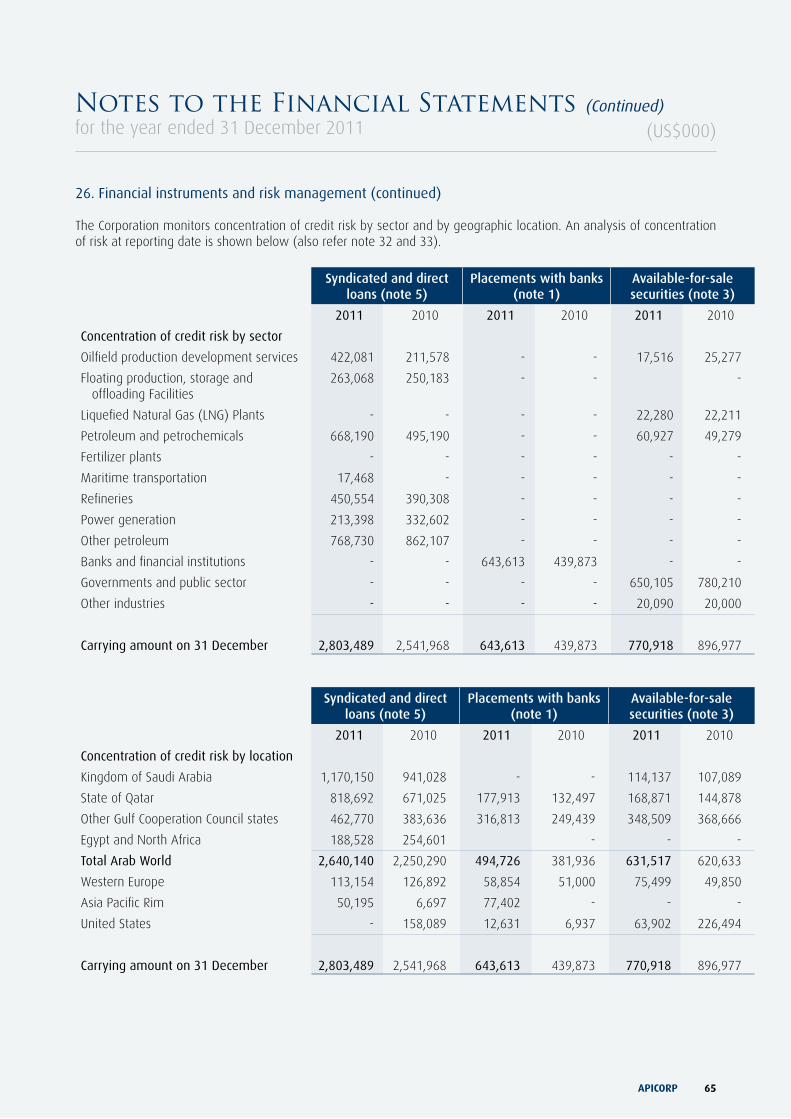
26. Financial instruments and risk management (continued)
The Corporation monitors concentration of credit risk by sector and by geographic location. An analysis of concentration of risk at reporting date is shown below (also refer note 32 and 33).
Syndicated and direct loans (note 5)
Placements with banks (note 1)
Available-for-sale securities (note 3)
2011 2010 2011 2010 2011 2010
Concentration of credit risk by sector
Oilfield production development services 422,081 211,578 - - 17,516 25,277
Floating production, storage and offloading Facilities
263,068 250,183 - - -
Liquefied Natural Gas (LNG) Plants - - - - 22,280 22,211
Petroleum and petrochemicals 668,190 495,190 - - 60,927 49,279
Fertilizer plants - - - - - -
Maritime transportation 17,468 - - - - -
Refineries 450,554 390,308 - - - -
Power generation 213,398 332,602 - - - -
Other petroleum 768,730 862,107 - - - -
Banks and financial institutions - - 643,613 439,873 - -
Governments and public sector - - - - 650,105 780,210
Other industries - - - - 20,090 20,000
Carrying amount on 31 December 2,803,489 2,541,968 643,613 439,873 770,918 896,977
Syndicated and direct loans (note 5)
Placements with banks (note 1)
Available-for-sale securities (note 3)
2011 2010 2011 2010 2011 2010
Concentration of credit risk by location
Kingdom of Saudi Arabia 1,170,150 941,028 - - 114,137 107,089
State of Qatar 818,692 671,025 177,913 132,497 168,871 144,878
Other Gulf Cooperation Council states 462,770 383,636 316,813 249,439 348,509 368,666
Egypt and North Africa 188,528 254,601 - - -
Total Arab World 2,640,140 2,250,290 494,726 381,936 631,517 620,633
Western Europe 113,154 126,892 58,854 51,000 75,499 49,850
Asia Pacific Rim 50,195 6,697 77,402 - - -
United States - 158,089 12,631 6,937 63,902 226,494
Carrying amount on 31 December 2,803,489 2,541,968 643,613 439,873 770,918 896,977
(US$000)Notes to the Financial Statements (Continued)for the year ended 31 December 2011
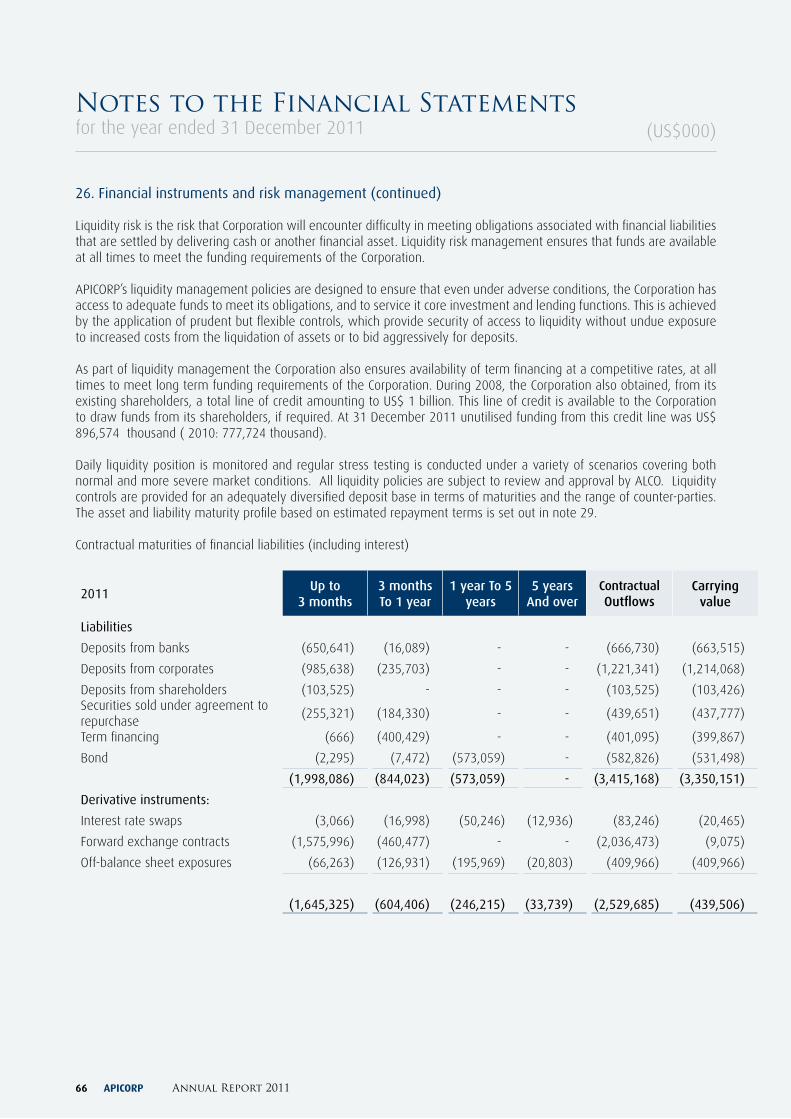
APICORP Annual Report 201166
(US$000)
26. Financial instruments and risk management (continued)
Liquidity risk is the risk that Corporation will encounter difficulty in meeting obligations associated with financial liabilities that are settled by delivering cash or another financial asset. Liquidity risk management ensures that funds are available at all times to meet the funding requirements of the Corporation.
APICORP’s liquidity management policies are designed to ensure that even under adverse conditions, the Corporation has access to adequate funds to meet its obligations, and to service it core investment and lending functions. This is achieved by the application of prudent but flexible controls, which provide security of access to liquidity without undue exposure to increased costs from the liquidation of assets or to bid aggressively for deposits.
As part of liquidity management the Corporation also ensures availability of term financing at a competitive rates, at all times to meet long term funding requirements of the Corporation. During 2008, the Corporation also obtained, from its existing shareholders, a total line of credit amounting to US$ 1 billion. This line of credit is available to the Corporation to draw funds from its shareholders, if required. At 31 December 2011 unutilised funding from this credit line was US$ 896,574 thousand ( 2010: 777,724 thousand).
Daily liquidity position is monitored and regular stress testing is conducted under a variety of scenarios covering both normal and more severe market conditions. All liquidity policies are subject to review and approval by ALCO. Liquidity controls are provided for an adequately diversified deposit base in terms of maturities and the range of counter-parties. The asset and liability maturity profile based on estimated repayment terms is set out in note 29.
Contractual maturities of financial liabilities (including interest)
2011Up to
3 months3 months To 1 year
1 year To 5 years
5 years And over
Contractual Outflows
Carrying value
Liabilities
Deposits from banks (650,641) (16,089) - - (666,730) (663,515)
Deposits from corporates (985,638) (235,703) - - (1,221,341) (1,214,068)
Deposits from shareholders (103,525) - - - (103,525) (103,426)Securities sold under agreement to repurchase
(255,321) (184,330) - - (439,651) (437,777)
Term financing (666) (400,429) - - (401,095) (399,867)
Bond (2,295) (7,472) (573,059) - (582,826) (531,498)
(1,998,086) (844,023) (573,059) - (3,415,168) (3,350,151)
Derivative instruments:
Interest rate swaps (3,066) (16,998) (50,246) (12,936) (83,246) (20,465)
Forward exchange contracts (1,575,996) (460,477) - - (2,036,473) (9,075)
Off-balance sheet exposures (66,263) (126,931) (195,969) (20,803) (409,966) (409,966)
(1,645,325) (604,406) (246,215) (33,739) (2,529,685) (439,506)
Notes to the Financial Statementsfor the year ended 31 December 2011
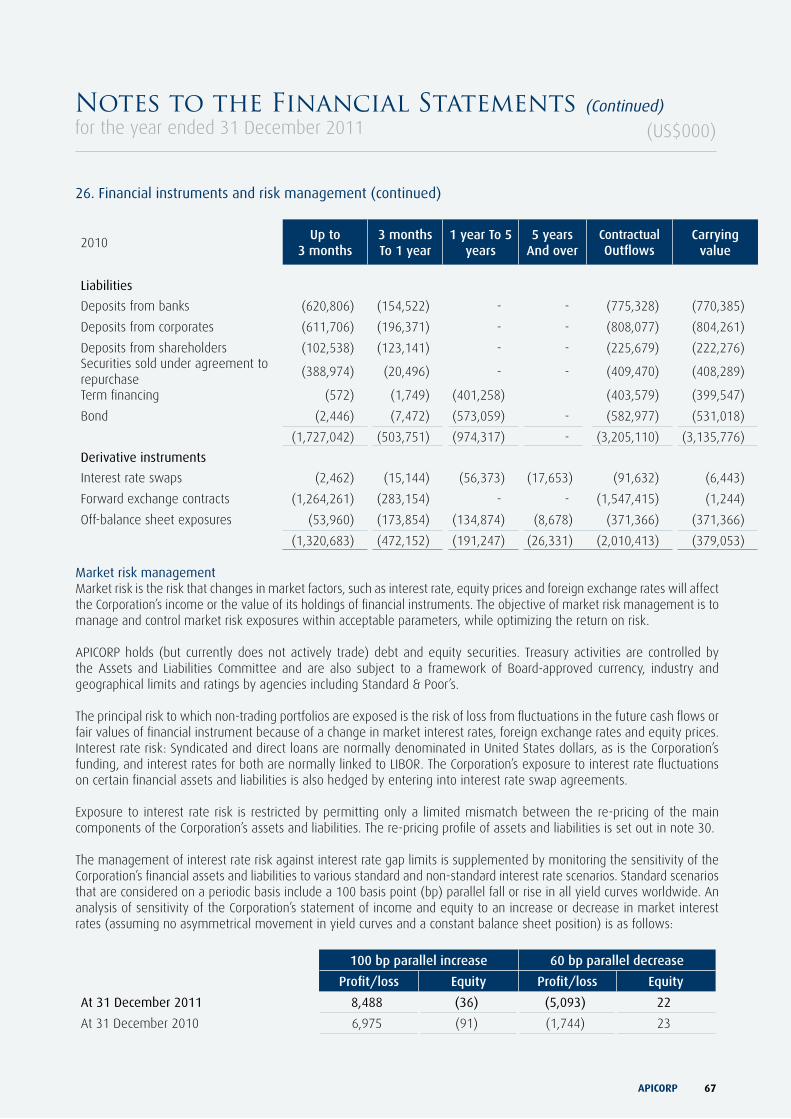
APICORP 67
26. Financial instruments and risk management (continued)
2010Up to
3 months3 months To 1 year
1 year To 5 years
5 years And over
Contractual Outflows
Carrying value
Liabilities
Deposits from banks (620,806) (154,522) - - (775,328) (770,385)
Deposits from corporates (611,706) (196,371) - - (808,077) (804,261)
Deposits from shareholders (102,538) (123,141) - - (225,679) (222,276)Securities sold under agreement to repurchase
(388,974) (20,496) - - (409,470) (408,289)
Term financing (572) (1,749) (401,258) (403,579) (399,547)
Bond (2,446) (7,472) (573,059) - (582,977) (531,018)
(1,727,042) (503,751) (974,317) - (3,205,110) (3,135,776)
Derivative instruments
Interest rate swaps (2,462) (15,144) (56,373) (17,653) (91,632) (6,443)
Forward exchange contracts (1,264,261) (283,154) - - (1,547,415) (1,244)
Off-balance sheet exposures (53,960) (173,854) (134,874) (8,678) (371,366) (371,366)
(1,320,683) (472,152) (191,247) (26,331) (2,010,413) (379,053)
Market risk managementMarket risk is the risk that changes in market factors, such as interest rate, equity prices and foreign exchange rates will affect the Corporation’s income or the value of its holdings of financial instruments. The objective of market risk management is to manage and control market risk exposures within acceptable parameters, while optimizing the return on risk.
APICORP holds (but currently does not actively trade) debt and equity securities. Treasury activities are controlled by the Assets and Liabilities Committee and are also subject to a framework of Board-approved currency, industry and geographical limits and ratings by agencies including Standard & Poor’s.
The principal risk to which non-trading portfolios are exposed is the risk of loss from fluctuations in the future cash flows or fair values of financial instrument because of a change in market interest rates, foreign exchange rates and equity prices.Interest rate risk: Syndicated and direct loans are normally denominated in United States dollars, as is the Corporation’s funding, and interest rates for both are normally linked to LIBOR. The Corporation’s exposure to interest rate fluctuations on certain financial assets and liabilities is also hedged by entering into interest rate swap agreements.
Exposure to interest rate risk is restricted by permitting only a limited mismatch between the re-pricing of the main components of the Corporation’s assets and liabilities. The re-pricing profile of assets and liabilities is set out in note 30.
The management of interest rate risk against interest rate gap limits is supplemented by monitoring the sensitivity of the Corporation’s financial assets and liabilities to various standard and non-standard interest rate scenarios. Standard scenarios that are considered on a periodic basis include a 100 basis point (bp) parallel fall or rise in all yield curves worldwide. An analysis of sensitivity of the Corporation’s statement of income and equity to an increase or decrease in market interest rates (assuming no asymmetrical movement in yield curves and a constant balance sheet position) is as follows:
100 bp parallel increase 60 bp parallel decrease
Profit/loss Equity Profit/loss Equity
At 31 December 2011 8,488 (36) (5,093) 22
At 31 December 2010 6,975 (91) (1,744) 23
(US$000)Notes to the Financial Statements (Continued)for the year ended 31 December 2011
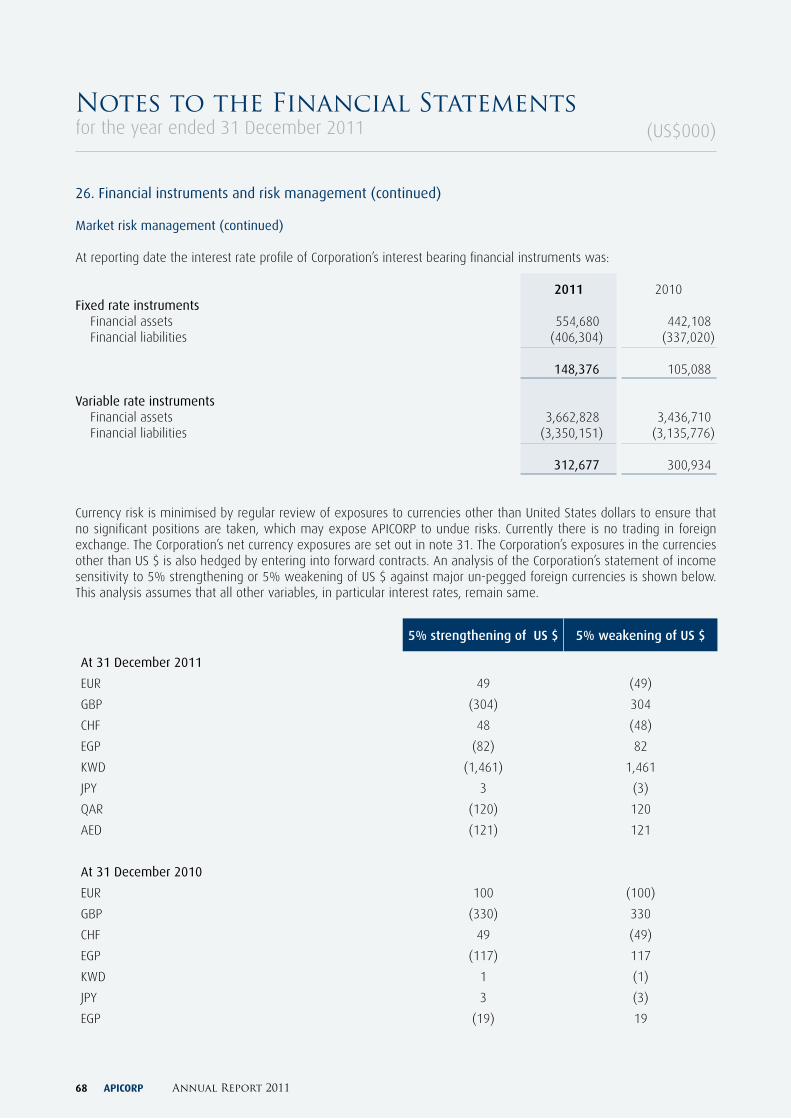
APICORP Annual Report 201168
(US$000)
26. Financial instruments and risk management (continued)
Market risk management (continued)
At reporting date the interest rate profile of Corporation’s interest bearing financial instruments was:
2011 2010Fixed rate instruments Financial assets 554,680 442,108 Financial liabilities (406,304) (337,020)
148,376 105,088
Variable rate instruments Financial assets 3,662,828 3,436,710 Financial liabilities (3,350,151) (3,135,776)
312,677 300,934
Currency risk is minimised by regular review of exposures to currencies other than United States dollars to ensure that no significant positions are taken, which may expose APICORP to undue risks. Currently there is no trading in foreign exchange. The Corporation’s net currency exposures are set out in note 31. The Corporation’s exposures in the currencies other than US $ is also hedged by entering into forward contracts. An analysis of the Corporation’s statement of income sensitivity to 5% strengthening or 5% weakening of US $ against major un-pegged foreign currencies is shown below. This analysis assumes that all other variables, in particular interest rates, remain same.
5% strengthening of US $ 5% weakening of US $
At 31 December 2011
EUR 49 (49)
GBP (304) 304
CHF 48 (48)
EGP (82) 82
KWD (1,461) 1,461
JPY 3 (3)
QAR (120) 120
AED (121) 121
At 31 December 2010
EUR 100 (100)
GBP (330) 330
CHF 49 (49)
EGP (117) 117
KWD 1 (1)
JPY 3 (3)
EGP (19) 19
Notes to the Financial Statementsfor the year ended 31 December 2011
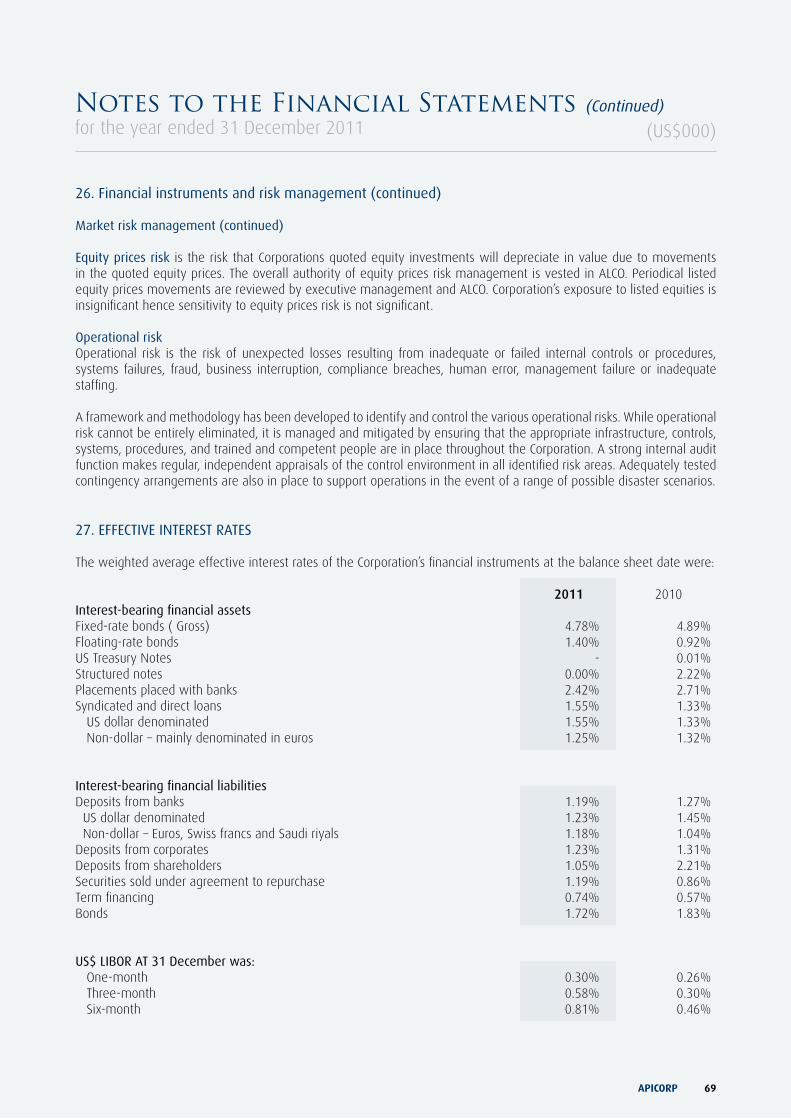
APICORP 69
26. Financial instruments and risk management (continued)
Market risk management (continued)
Equity prices risk is the risk that Corporations quoted equity investments will depreciate in value due to movements in the quoted equity prices. The overall authority of equity prices risk management is vested in ALCO. Periodical listed equity prices movements are reviewed by executive management and ALCO. Corporation’s exposure to listed equities is insignificant hence sensitivity to equity prices risk is not significant.
Operational riskOperational risk is the risk of unexpected losses resulting from inadequate or failed internal controls or procedures, systems failures, fraud, business interruption, compliance breaches, human error, management failure or inadequate staffing.
A framework and methodology has been developed to identify and control the various operational risks. While operational risk cannot be entirely eliminated, it is managed and mitigated by ensuring that the appropriate infrastructure, controls, systems, procedures, and trained and competent people are in place throughout the Corporation. A strong internal audit function makes regular, independent appraisals of the control environment in all identified risk areas. Adequately tested contingency arrangements are also in place to support operations in the event of a range of possible disaster scenarios.
27. EFFECTIVE INTEREST RATES
The weighted average effective interest rates of the Corporation’s financial instruments at the balance sheet date were:
2011 2010Interest-bearing financial assets Fixed-rate bonds ( Gross) 4.78% 4.89%Floating-rate bonds 1.40% 0.92%US Treasury Notes - 0.01%Structured notes 0.00% 2.22%Placements placed with banks 2.42% 2.71%Syndicated and direct loans 1.55% 1.33% US dollar denominated 1.55% 1.33% Non-dollar – mainly denominated in euros 1.25% 1.32%
Interest-bearing financial liabilities Deposits from banks 1.19% 1.27% US dollar denominated 1.23% 1.45% Non-dollar – Euros, Swiss francs and Saudi riyals 1.18% 1.04%Deposits from corporates 1.23% 1.31%Deposits from shareholders 1.05% 2.21%Securities sold under agreement to repurchase 1.19% 0.86%Term financing 0.74% 0.57%Bonds 1.72% 1.83%
US$ LIBOR AT 31 December was: One-month 0.30% 0.26% Three-month 0.58% 0.30% Six-month 0.81% 0.46%
(US$000)Notes to the Financial Statements (Continued)for the year ended 31 December 2011
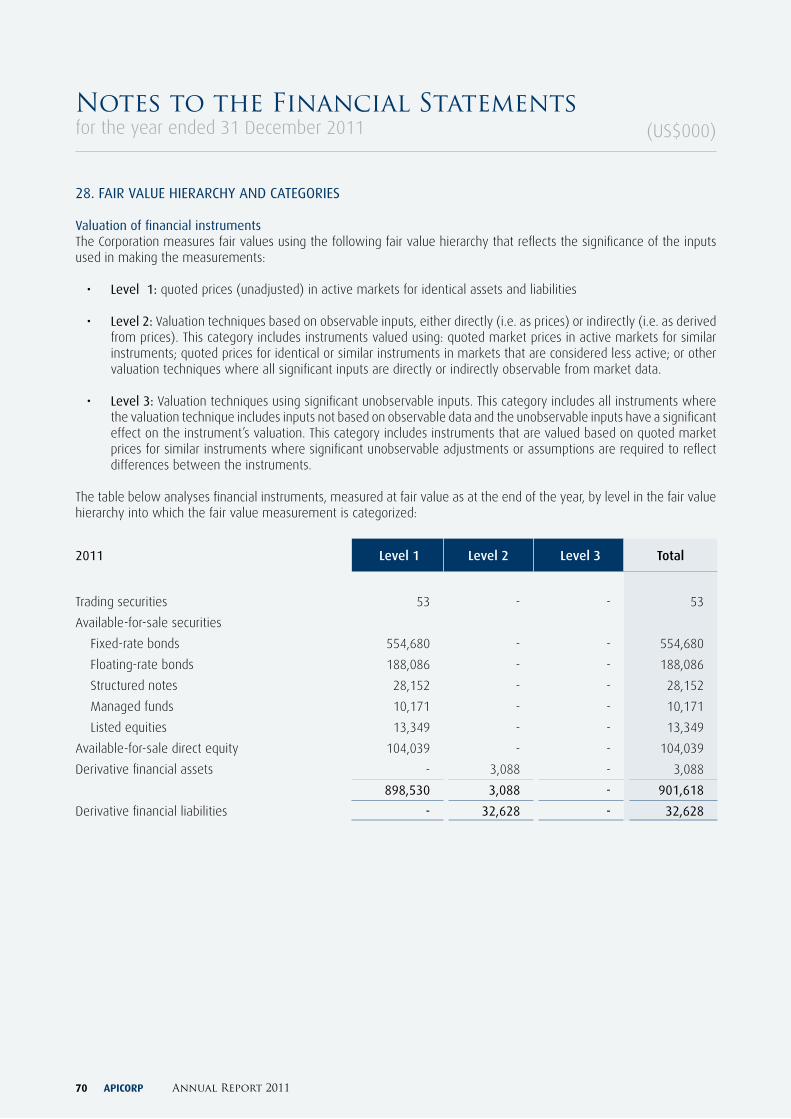
APICORP Annual Report 201170
(US$000)
28. FAIR VALUE HIERARCHy AND CATEGORIES
Valuation of financial instrumentsThe Corporation measures fair values using the following fair value hierarchy that reflects the significance of the inputs used in making the measurements:
• Level 1: quoted prices (unadjusted) in active markets for identical assets and liabilities
• Level 2: Valuation techniques based on observable inputs, either directly (i.e. as prices) or indirectly (i.e. as derived from prices). This category includes instruments valued using: quoted market prices in active markets for similar instruments; quoted prices for identical or similar instruments in markets that are considered less active; or other valuation techniques where all significant inputs are directly or indirectly observable from market data.
• Level 3: Valuation techniques using significant unobservable inputs. This category includes all instruments where the valuation technique includes inputs not based on observable data and the unobservable inputs have a significant effect on the instrument’s valuation. This category includes instruments that are valued based on quoted market prices for similar instruments where significant unobservable adjustments or assumptions are required to reflect differences between the instruments.
The table below analyses financial instruments, measured at fair value as at the end of the year, by level in the fair value hierarchy into which the fair value measurement is categorized:
2011 Level 1 Level 2 Level 3 Total
Trading securities 53 - - 53
Available-for-sale securities
Fixed-rate bonds 554,680 - - 554,680
Floating-rate bonds 188,086 - - 188,086
Structured notes 28,152 - - 28,152
Managed funds 10,171 - - 10,171
Listed equities 13,349 - - 13,349
Available-for-sale direct equity 104,039 - - 104,039
Derivative financial assets - 3,088 - 3,088
898,530 3,088 - 901,618
Derivative financial liabilities - 32,628 - 32,628
Notes to the Financial Statementsfor the year ended 31 December 2011
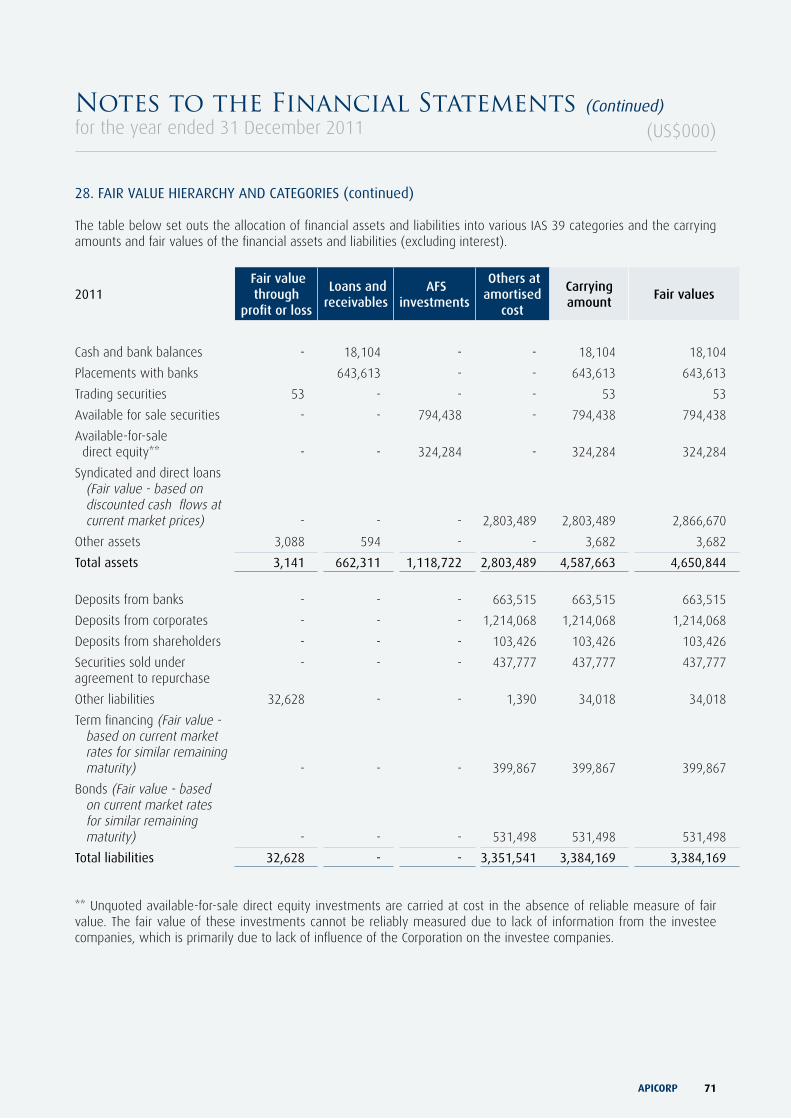
APICORP 71
28. FAIR VALUE HIERARCHy AND CATEGORIES (continued)
The table below set outs the allocation of financial assets and liabilities into various IAS 39 categories and the carrying amounts and fair values of the financial assets and liabilities (excluding interest).
2011 Fair value through
profit or loss
Loans and receivables
AFS investments
Others at amortised
cost
Carrying amount
Fair values
Cash and bank balances - 18,104 - - 18,104 18,104
Placements with banks 643,613 - - 643,613 643,613
Trading securities 53 - - - 53 53
Available for sale securities - - 794,438 - 794,438 794,438
Available-for-sale direct equity** - - 324,284 - 324,284 324,284
Syndicated and direct loans (Fair value - based on discounted cash flows at current market prices) - - - 2,803,489 2,803,489 2,866,670
Other assets 3,088 594 - - 3,682 3,682
Total assets 3,141 662,311 1,118,722 2,803,489 4,587,663 4,650,844
Deposits from banks - - - 663,515 663,515 663,515
Deposits from corporates - - - 1,214,068 1,214,068 1,214,068
Deposits from shareholders - - - 103,426 103,426 103,426
Securities sold under agreement to repurchase
- - - 437,777 437,777 437,777
Other liabilities 32,628 - - 1,390 34,018 34,018
Term financing (Fair value - based on current market rates for similar remaining maturity) - - - 399,867 399,867 399,867
Bonds (Fair value - based on current market rates for similar remaining maturity) - - - 531,498 531,498 531,498
Total liabilities 32,628 - - 3,351,541 3,384,169 3,384,169
** Unquoted available-for-sale direct equity investments are carried at cost in the absence of reliable measure of fair value. The fair value of these investments cannot be reliably measured due to lack of information from the investee companies, which is primarily due to lack of influence of the Corporation on the investee companies.
(US$000)Notes to the Financial Statements (Continued)for the year ended 31 December 2011
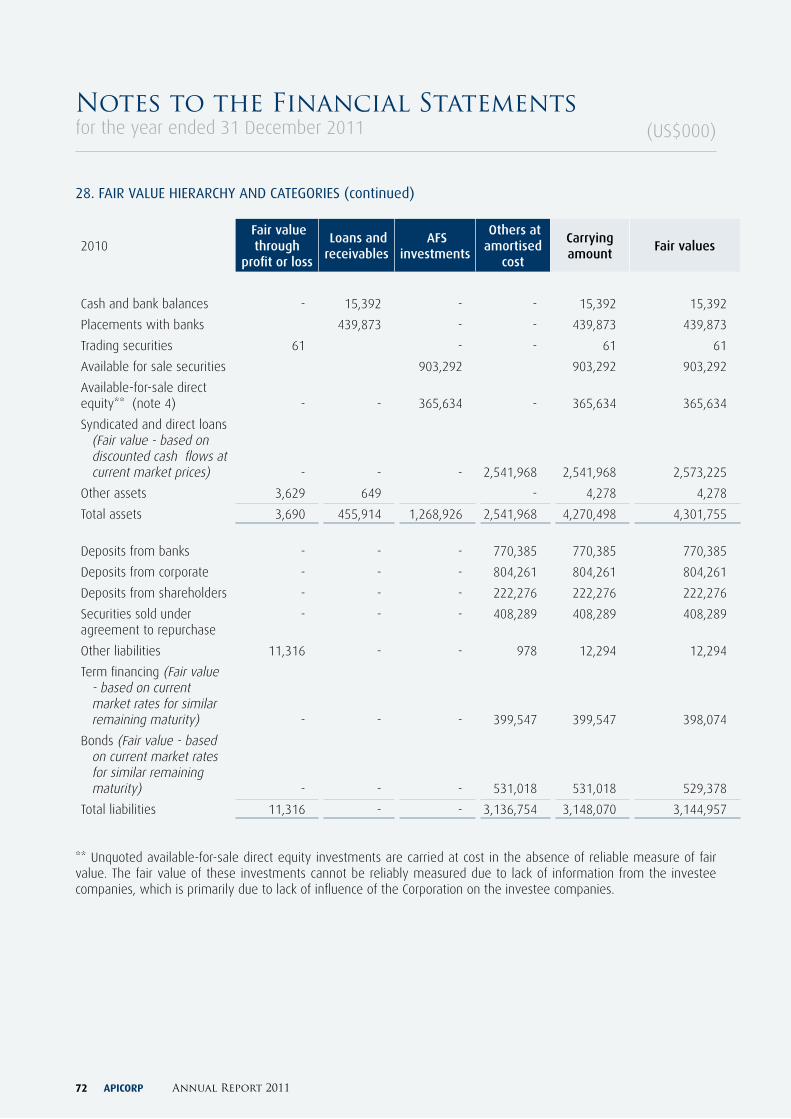
APICORP Annual Report 201172
(US$000)
2010 Fair value through
profit or loss
Loans and receivables
AFS investments
Others at amortised
cost
Carrying amount
Fair values
Cash and bank balances - 15,392 - - 15,392 15,392
Placements with banks 439,873 - - 439,873 439,873
Trading securities 61 - - 61 61
Available for sale securities 903,292 903,292 903,292
Available-for-sale direct equity** (note 4) - - 365,634 - 365,634 365,634
Syndicated and direct loans (Fair value - based on discounted cash flows at current market prices) - - - 2,541,968 2,541,968 2,573,225
Other assets 3,629 649 - 4,278 4,278
Total assets 3,690 455,914 1,268,926 2,541,968 4,270,498 4,301,755
Deposits from banks - - - 770,385 770,385 770,385
Deposits from corporate - - - 804,261 804,261 804,261
Deposits from shareholders - - - 222,276 222,276 222,276
Securities sold under agreement to repurchase
- - - 408,289 408,289 408,289
Other liabilities 11,316 - - 978 12,294 12,294
Term financing (Fair value - based on current market rates for similar remaining maturity) - - - 399,547 399,547 398,074
Bonds (Fair value - based on current market rates for similar remaining maturity) - - - 531,018 531,018 529,378
Total liabilities 11,316 - - 3,136,754 3,148,070 3,144,957
** Unquoted available-for-sale direct equity investments are carried at cost in the absence of reliable measure of fair value. The fair value of these investments cannot be reliably measured due to lack of information from the investee companies, which is primarily due to lack of influence of the Corporation on the investee companies.
28. FAIR VALUE HIERARCHy AND CATEGORIES (continued)
Notes to the Financial Statementsfor the year ended 31 December 2011
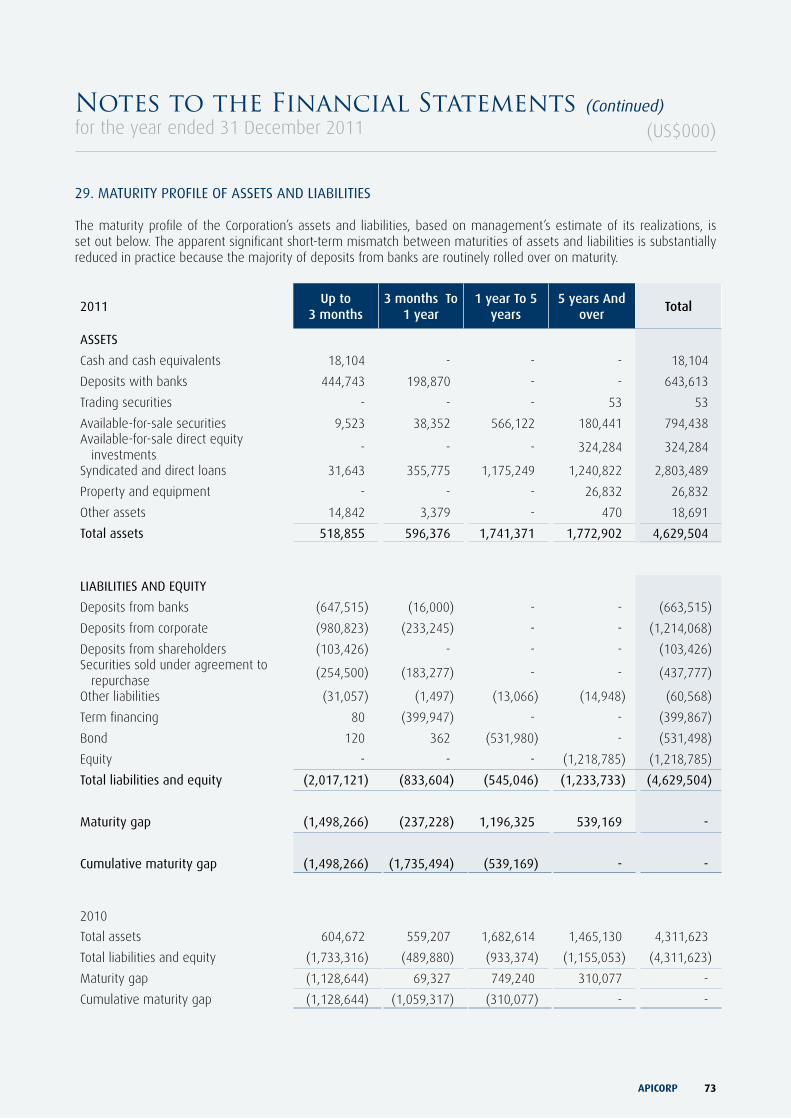
APICORP 73
29. MATURITy PROFILE OF ASSETS AND LIABILITIES
The maturity profile of the Corporation’s assets and liabilities, based on management’s estimate of its realizations, is set out below. The apparent significant short-term mismatch between maturities of assets and liabilities is substantially reduced in practice because the majority of deposits from banks are routinely rolled over on maturity.
2011Up to
3 months3 months To
1 year1 year To 5
years5 years And
overTotal
ASSETS
Cash and cash equivalents 18,104 - - - 18,104
Deposits with banks 444,743 198,870 - - 643,613
Trading securities - - - 53 53
Available-for-sale securities 9,523 38,352 566,122 180,441 794,438Available-for-sale direct equity investments
- - - 324,284 324,284
Syndicated and direct loans 31,643 355,775 1,175,249 1,240,822 2,803,489
Property and equipment - - - 26,832 26,832
Other assets 14,842 3,379 - 470 18,691
Total assets 518,855 596,376 1,741,371 1,772,902 4,629,504
LIABILITIES AND EQUITy
Deposits from banks (647,515) (16,000) - - (663,515)
Deposits from corporate (980,823) (233,245) - - (1,214,068)
Deposits from shareholders (103,426) - - - (103,426)Securities sold under agreement to repurchase
(254,500) (183,277) - - (437,777)
Other liabilities (31,057) (1,497) (13,066) (14,948) (60,568)
Term financing 80 (399,947) - - (399,867)
Bond 120 362 (531,980) - (531,498)
Equity - - - (1,218,785) (1,218,785)
Total liabilities and equity (2,017,121) (833,604) (545,046) (1,233,733) (4,629,504)
Maturity gap (1,498,266) (237,228) 1,196,325 539,169 -
Cumulative maturity gap (1,498,266) (1,735,494) (539,169) - -
2010
Total assets 604,672 559,207 1,682,614 1,465,130 4,311,623
Total liabilities and equity (1,733,316) (489,880) (933,374) (1,155,053) (4,311,623)
Maturity gap (1,128,644) 69,327 749,240 310,077 -
Cumulative maturity gap (1,128,644) (1,059,317) (310,077) - -
(US$000)Notes to the Financial Statements (Continued)for the year ended 31 December 2011
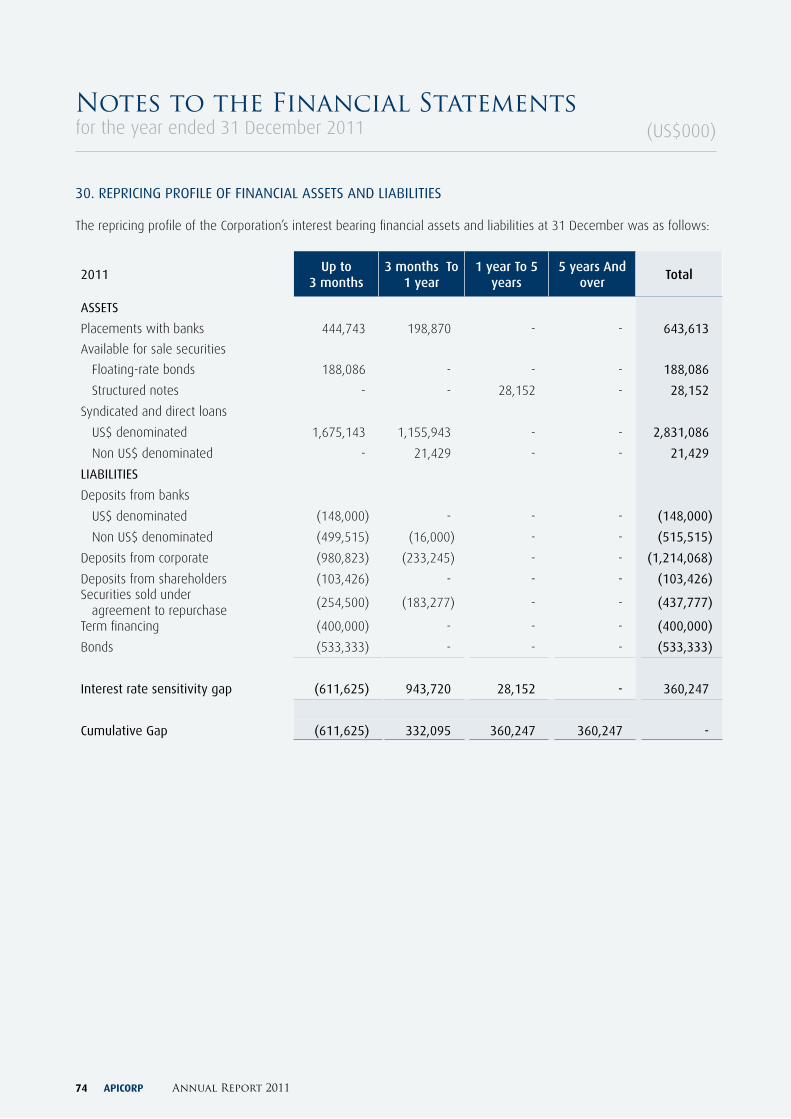
APICORP Annual Report 201174
(US$000)
30. REPRICING PROFILE OF FINANCIAL ASSETS AND LIABILITIES
The repricing profile of the Corporation’s interest bearing financial assets and liabilities at 31 December was as follows:
2011Up to
3 months3 months To
1 year1 year To 5
years5 years And
overTotal
ASSETS
Placements with banks 444,743 198,870 - - 643,613
Available for sale securities
Floating-rate bonds 188,086 - - - 188,086
Structured notes - - 28,152 - 28,152
Syndicated and direct loans
US$ denominated 1,675,143 1,155,943 - - 2,831,086
Non US$ denominated - 21,429 - - 21,429
LIABILITIES
Deposits from banks
US$ denominated (148,000) - - - (148,000)
Non US$ denominated (499,515) (16,000) - - (515,515)
Deposits from corporate (980,823) (233,245) - - (1,214,068)
Deposits from shareholders (103,426) - - - (103,426)Securities sold under agreement to repurchase
(254,500) (183,277) - - (437,777)
Term financing (400,000) - - - (400,000)
Bonds (533,333) - - - (533,333)
Interest rate sensitivity gap (611,625) 943,720 28,152 - 360,247
Cumulative Gap (611,625) 332,095 360,247 360,247 -
Notes to the Financial Statementsfor the year ended 31 December 2011
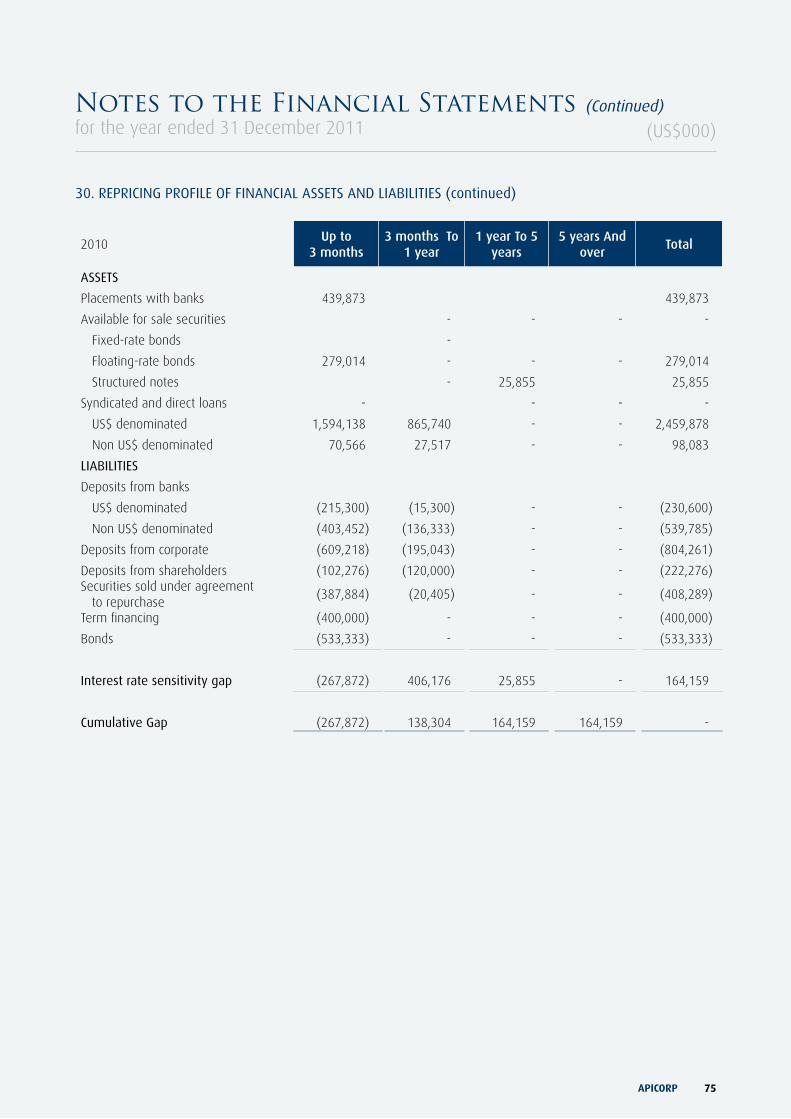
APICORP 75
30. REPRICING PROFILE OF FINANCIAL ASSETS AND LIABILITIES (continued)
2010Up to
3 months3 months To
1 year1 year To 5
years5 years And
overTotal
ASSETS
Placements with banks 439,873 439,873
Available for sale securities - - - -
Fixed-rate bonds -
Floating-rate bonds 279,014 - - - 279,014
Structured notes - 25,855 25,855
Syndicated and direct loans - - - -
US$ denominated 1,594,138 865,740 - - 2,459,878
Non US$ denominated 70,566 27,517 - - 98,083
LIABILITIES
Deposits from banks
US$ denominated (215,300) (15,300) - - (230,600)
Non US$ denominated (403,452) (136,333) - - (539,785)
Deposits from corporate (609,218) (195,043) - - (804,261)
Deposits from shareholders (102,276) (120,000) - - (222,276)Securities sold under agreement to repurchase
(387,884) (20,405) - - (408,289)
Term financing (400,000) - - - (400,000)
Bonds (533,333) - - - (533,333)
Interest rate sensitivity gap (267,872) 406,176 25,855 - 164,159
Cumulative Gap (267,872) 138,304 164,159 164,159 -
(US$000)Notes to the Financial Statements (Continued)for the year ended 31 December 2011
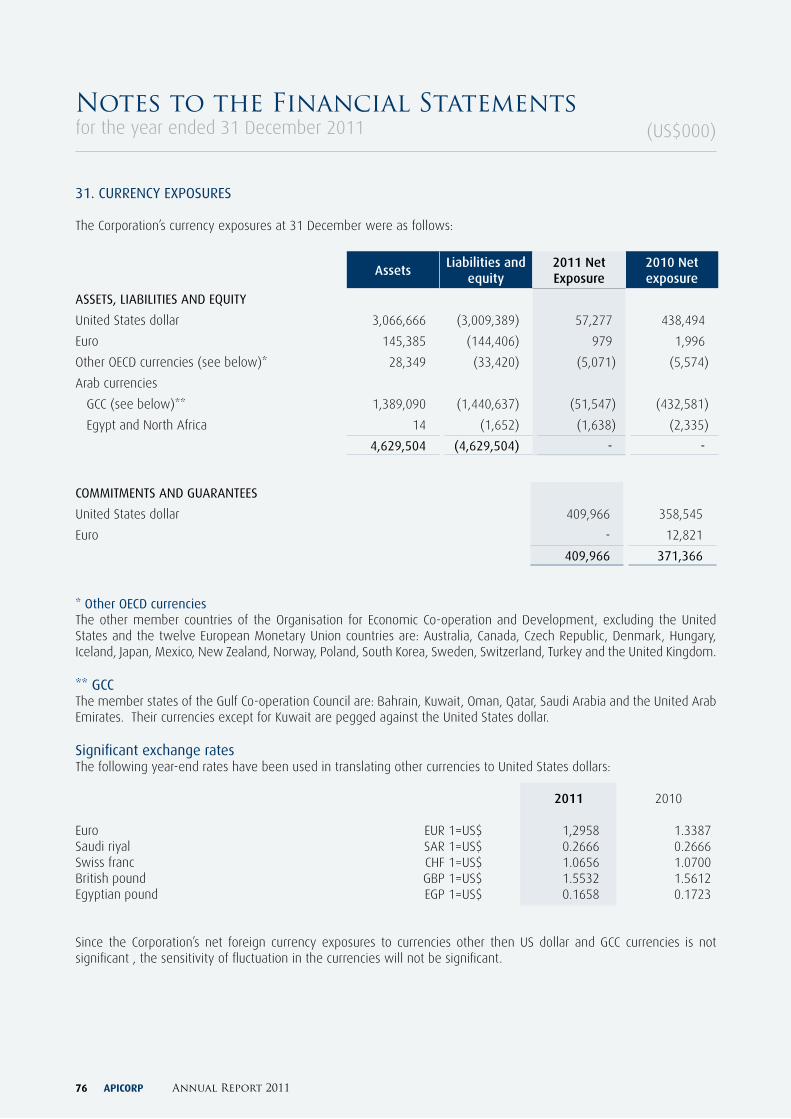
APICORP Annual Report 201176
(US$000)
31. CURRENCy EXPOSURES
The Corporation’s currency exposures at 31 December were as follows:
AssetsLiabilities and
equity2011 Net Exposure
2010 Net exposure
ASSETS, LIABILITIES AND EQUITy
United States dollar 3,066,666 (3,009,389) 57,277 438,494
Euro 145,385 (144,406) 979 1,996
Other OECD currencies (see below)* 28,349 (33,420) (5,071) (5,574)
Arab currencies
GCC (see below)** 1,389,090 (1,440,637) (51,547) (432,581)
Egypt and North Africa 14 (1,652) (1,638) (2,335)
4,629,504 (4,629,504) - -
COMMITMENTS AND GUARANTEES
United States dollar 409,966 358,545
Euro - 12,821
409,966 371,366
* Other OECD currenciesThe other member countries of the Organisation for Economic Co-operation and Development, excluding the United States and the twelve European Monetary Union countries are: Australia, Canada, Czech Republic, Denmark, Hungary, Iceland, Japan, Mexico, New Zealand, Norway, Poland, South Korea, Sweden, Switzerland, Turkey and the United Kingdom.
** GCCThe member states of the Gulf Co-operation Council are: Bahrain, Kuwait, Oman, Qatar, Saudi Arabia and the United Arab Emirates. Their currencies except for Kuwait are pegged against the United States dollar.
Significant exchange ratesThe following year-end rates have been used in translating other currencies to United States dollars: 2011 2010 Euro EUR 1=US$ 1,2958 1.3387Saudi riyal SAR 1=US$ 0.2666 0.2666Swiss franc CHF 1=US$ 1.0656 1.0700British pound GBP 1=US$ 1.5532 1.5612Egyptian pound EGP 1=US$ 0.1658 0.1723
Since the Corporation’s net foreign currency exposures to currencies other then US dollar and GCC currencies is not significant , the sensitivity of fluctuation in the currencies will not be significant.
Notes to the Financial Statementsfor the year ended 31 December 2011
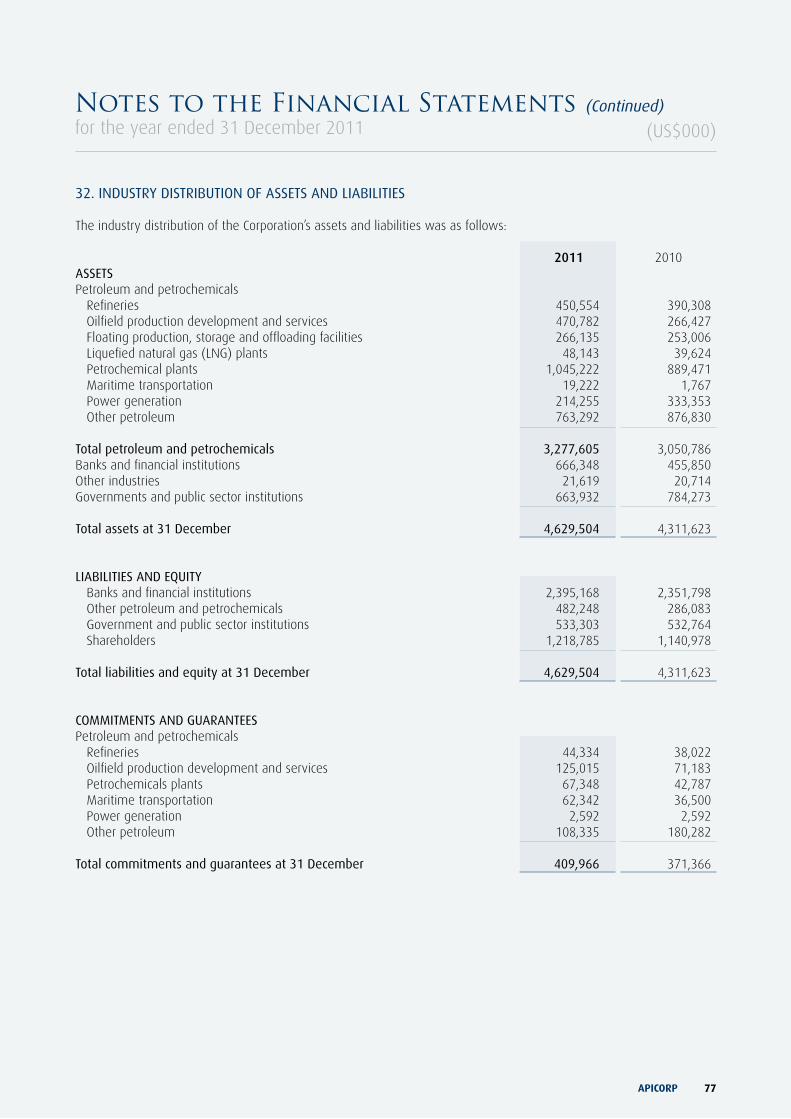
APICORP 77
32. INDUSTRy DISTRIBUTION OF ASSETS AND LIABILITIES
The industry distribution of the Corporation’s assets and liabilities was as follows: 2011 2010ASSETS Petroleum and petrochemicals Refineries 450,554 390,308 Oilfield production development and services 470,782 266,427 Floating production, storage and offloading facilities 266,135 253,006 Liquefied natural gas (LNG) plants 48,143 39,624 Petrochemical plants 1,045,222 889,471 Maritime transportation 19,222 1,767 Power generation 214,255 333,353 Other petroleum 763,292 876,830 Total petroleum and petrochemicals 3,277,605 3,050,786Banks and financial institutions 666,348 455,850Other industries 21,619 20,714Governments and public sector institutions 663,932 784,273 Total assets at 31 December 4,629,504 4,311,623
LIABILITIES AND EQUITy Banks and financial institutions 2,395,168 2,351,798 Other petroleum and petrochemicals 482,248 286,083 Government and public sector institutions 533,303 532,764 Shareholders 1,218,785 1,140,978 Total liabilities and equity at 31 December 4,629,504 4,311,623
COMMITMENTS AND GUARANTEES Petroleum and petrochemicals Refineries 44,334 38,022 Oilfield production development and services 125,015 71,183 Petrochemicals plants 67,348 42,787 Maritime transportation 62,342 36,500 Power generation 2,592 2,592 Other petroleum 108,335 180,282 Total commitments and guarantees at 31 December 409,966 371,366
(US$000)Notes to the Financial Statements (Continued)for the year ended 31 December 2011
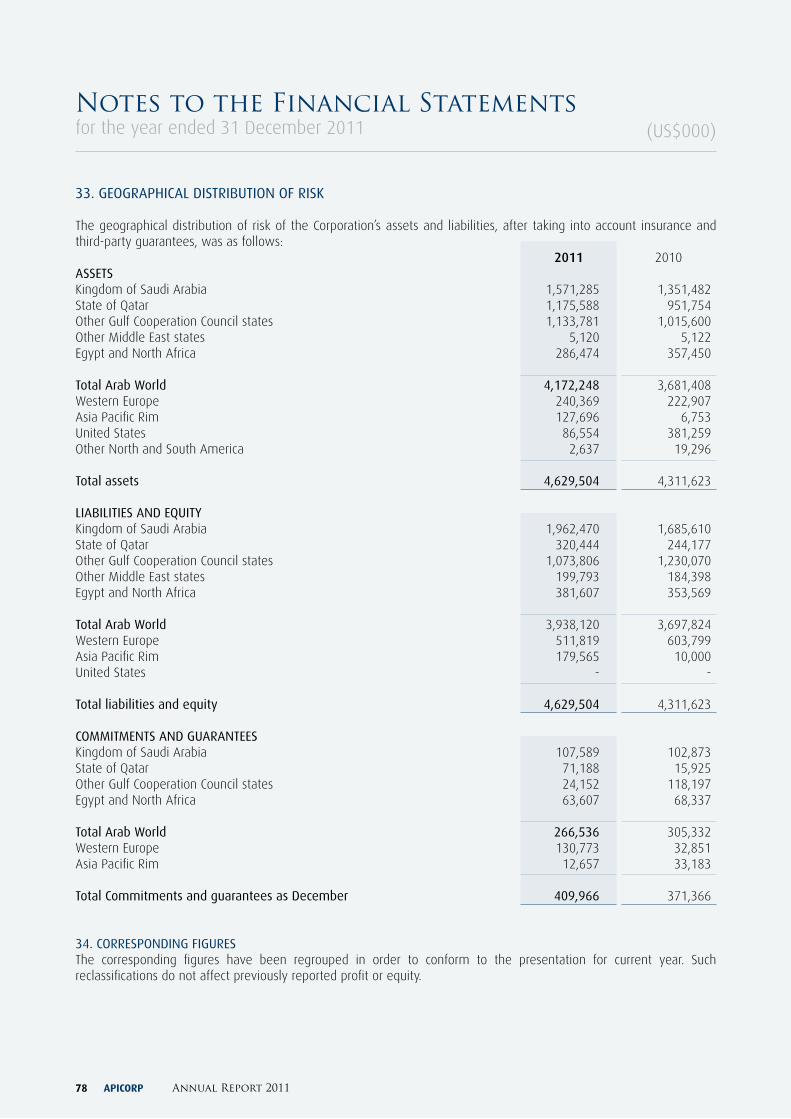
APICORP Annual Report 201178
33. GEOGRAPHICAL DISTRIBUTION OF RISK
The geographical distribution of risk of the Corporation’s assets and liabilities, after taking into account insurance and third-party guarantees, was as follows: 2011 2010ASSETS Kingdom of Saudi Arabia 1,571,285 1,351,482State of Qatar 1,175,588 951,754Other Gulf Cooperation Council states 1,133,781 1,015,600Other Middle East states 5,120 5,122Egypt and North Africa 286,474 357,450 Total Arab World 4,172,248 3,681,408 Western Europe 240,369 222,907Asia Pacific Rim 127,696 6,753United States 86,554 381,259Other North and South America 2,637 19,296 Total assets 4,629,504 4,311,623
LIABILITIES AND EQUITy Kingdom of Saudi Arabia 1,962,470 1,685,610State of Qatar 320,444 244,177Other Gulf Cooperation Council states 1,073,806 1,230,070Other Middle East states 199,793 184,398Egypt and North Africa 381,607 353,569 Total Arab World 3,938,120 3,697,824Western Europe 511,819 603,799Asia Pacific Rim 179,565 10,000United States - - Total liabilities and equity 4,629,504 4,311,623
COMMITMENTS AND GUARANTEES Kingdom of Saudi Arabia 107,589 102,873State of Qatar 71,188 15,925Other Gulf Cooperation Council states 24,152 118,197Egypt and North Africa 63,607 68,337
Total Arab World 266,536 305,332Western Europe 130,773 32,851Asia Pacific Rim 12,657 33,183 Total Commitments and guarantees as December 409,966 371,366
34. CORRESPONDING FIGURESThe corresponding figures have been regrouped in order to conform to the presentation for current year. Such reclassifications do not affect previously reported profit or equity.
(US$000)Notes to the Financial Statementsfor the year ended 31 December 2011