Embed Size (px)
Citation preview

79 Income statement79 Statement of comprehensive income80 Statement of financial position81 Statement of changes in equity82 Statement of cash flows83 Notes to the financial statements
Contents
Financial statements
uwa.edu.au 77
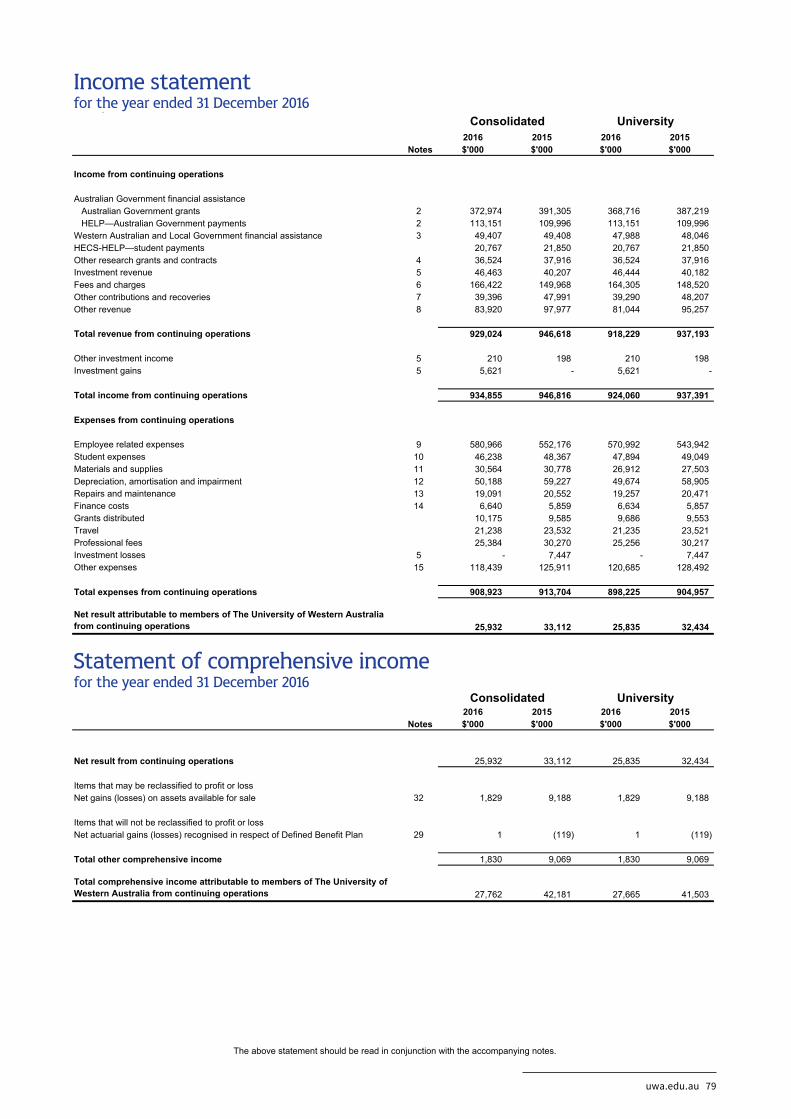
Consolidated University2016 2015 2016 2015
Notes $'000 $'000 $'000 $'000
Income from continuing operations
Australian Government financial assistance Australian Government grants 2 372,974 391,305 368,716 387,219 HELP—Australian Government payments 2 113,151 109,996 113,151 109,996Western Australian and Local Government financial assistance 3 49,407 49,408 47,988 48,046HECS-HELP—student payments 20,767 21,850 20,767 21,850Other research grants and contracts 4 36,524 37,916 36,524 37,916Investment revenue 5 46,463 40,207 46,444 40,182Fees and charges 6 166,422 149,968 164,305 148,520Other contributions and recoveries 7 39,396 47,991 39,290 48,207Other revenue 8 83,920 97,977 81,044 95,257
Total revenue from continuing operations 929,024 946,618 918,229 937,193
Other investment income 5 210 198 210 198Investment gains 5 5,621 - 5,621 -
Total income from continuing operations 934,855 946,816 924,060 937,391
Expenses from continuing operations
Employee related expenses 9 580,966 552,176 570,992 543,942Student expenses 10 46,238 48,367 47,894 49,049Materials and supplies 11 30,564 30,778 26,912 27,503Depreciation, amortisation and impairment 12 50,188 59,227 49,674 58,905Repairs and maintenance 13 19,091 20,552 19,257 20,471Finance costs 14 6,640 5,859 6,634 5,857Grants distributed 10,175 9,585 9,686 9,553Travel 21,238 23,532 21,235 23,521Professional fees 25,384 30,270 25,256 30,217Investment losses 5 - 7,447 - 7,447Other expenses 15 118,439 125,911 120,685 128,492
Total expenses from continuing operations 908,923 913,704 898,225 904,957
Net result attributable to members of The University of Western Australia from continuing operations 25,932 33,112 25,835 32,434
Consolidated University2016 2015 2016 2015
Notes $'000 $'000 $'000 $'000
Net result from continuing operations 25,932 33,112 25,835 32,434
Items that may be reclassified to profit or lossNet gains (losses) on assets available for sale 32 1,829 9,188 1,829 9,188
Items that will not be reclassified to profit or lossNet actuarial gains (losses) recognised in respect of Defined Benefit Plan 29 1 (119) 1 (119)
Total other comprehensive income 1,830 9,069 1,830 9,069
Total comprehensive income attributable to members of The University of Western Australia from continuing operations 27,762 42,181 27,665 41,503
for the year ended 31 December 2016
INCOME STATEMENTfor the year ended 31 December 2016
STATEMENT OF COMPREHENSIVE INCOME
The above statement should be read in conjunction with the accompanying notes.
Income statement for the year ended 31 December 2016
Statement of comprehensive income for the year ended 31 December 2016
uwa.edu.au 79
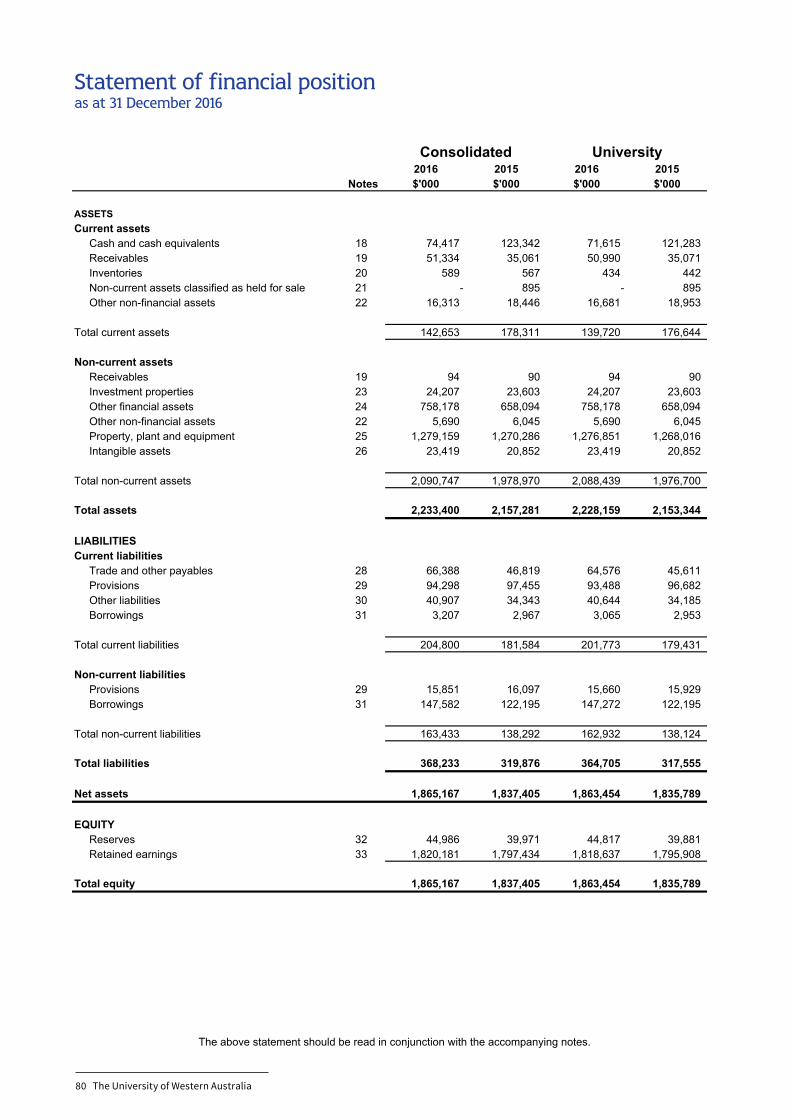
2016 2015 2016 2015Notes $'000 $'000 $'000 $'000
ASSETSCurrent assets Cash and cash equivalents 18 74,417 123,342 71,615 121,283 Receivables 19 51,334 35,061 50,990 35,071 Inventories 20 589 567 434 442 Non-current assets classified as held for sale 21 - 895 - 895 Other non-financial assets 22 16,313 18,446 16,681 18,953
Total current assets 142,653 178,311 139,720 176,644
Non-current assets Receivables 19 94 90 94 90 Investment properties 23 24,207 23,603 24,207 23,603 Other financial assets 24 758,178 658,094 758,178 658,094 Other non-financial assets 22 5,690 6,045 5,690 6,045 Property, plant and equipment 25 1,279,159 1,270,286 1,276,851 1,268,016 Intangible assets 26 23,419 20,852 23,419 20,852
Total non-current assets 2,090,747 1,978,970 2,088,439 1,976,700
Total assets 2,233,400 2,157,281 2,228,159 2,153,344
LIABILITIESCurrent liabilities Trade and other payables 28 66,388 46,819 64,576 45,611 Provisions 29 94,298 97,455 93,488 96,682 Other liabilities 30 40,907 34,343 40,644 34,185 Borrowings 31 3,207 2,967 3,065 2,953
Total current liabilities 204,800 181,584 201,773 179,431
Non-current liabilities Provisions 29 15,851 16,097 15,660 15,929 Borrowings 31 147,582 122,195 147,272 122,195
Total non-current liabilities 163,433 138,292 162,932 138,124
Total liabilities 368,233 319,876 364,705 317,555
Net assets 1,865,167 1,837,405 1,863,454 1,835,789
EQUITY Reserves 32 44,986 39,971 44,817 39,881 Retained earnings 33 1,820,181 1,797,434 1,818,637 1,795,908
Total equity 1,865,167 1,837,405 1,863,454 1,835,789
Consolidated University
STATEMENT OF FINANCIAL POSITIONas at 31 December 2016
The above statement should be read in conjunction with the accompanying notes.
Statement of financial position as at 31 December 2016
80 The University of Western Australia
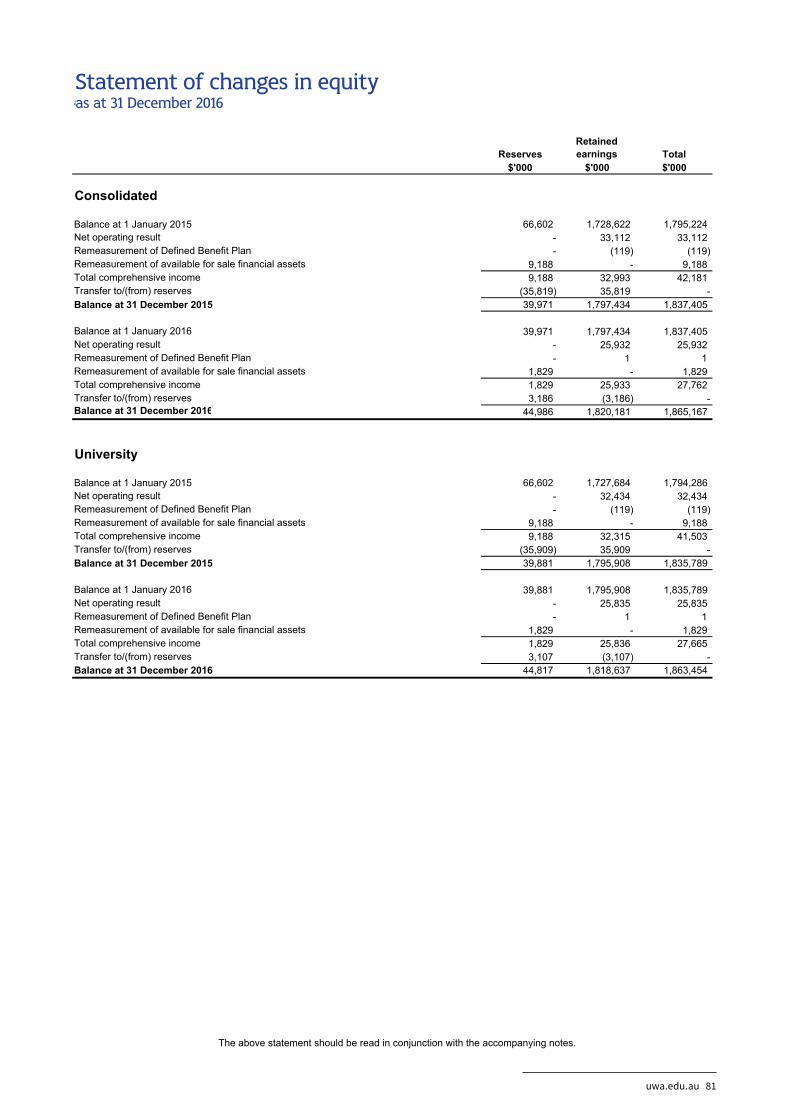
ReservesRetainedearnings Total
$'000 $'000 $'000
Consolidated
Balance at 1 January 2015 66,602 1,728,622 1,795,224Net operating result - 33,112 33,112Remeasurement of Defined Benefit Plan - (119) (119)Remeasurement of available for sale financial assets 9,188 - 9,188Total comprehensive income 9,188 32,993 42,181Transfer to/(from) reserves (35,819) 35,819 -Balance at 31 December 2015 39,971 1,797,434 1,837,405
Balance at 1 January 2016 39,971 1,797,434 1,837,405Net operating result - 25,932 25,932Remeasurement of Defined Benefit Plan - 1 1Remeasurement of available for sale financial assets 1,829 - 1,829Total comprehensive income 1,829 25,933 27,762Transfer to/(from) reserves 3,186 (3,186) -Balance at 31 December 2016 44,986 1,820,181 1,865,167
University
Balance at 1 January 2015 66,602 1,727,684 1,794,286Net operating result - 32,434 32,434Remeasurement of Defined Benefit Plan - (119) (119)Remeasurement of available for sale financial assets 9,188 - 9,188Total comprehensive income 9,188 32,315 41,503Transfer to/(from) reserves (35,909) 35,909 -Balance at 31 December 2015 39,881 1,795,908 1,835,789
Balance at 1 January 2016 39,881 1,795,908 1,835,789Net operating result - 25,835 25,835Remeasurement of Defined Benefit Plan - 1 1Remeasurement of available for sale financial assets 1,829 - 1,829Total comprehensive income 1,829 25,836 27,665Transfer to/(from) reserves 3,107 (3,107) -Balance at 31 December 2016 44,817 1,818,637 1,863,454
STATEMENT OF CHANGES IN EQUITYas at 31 December 2016
The above statement should be read in conjunction with the accompanying notes.
Statement of changes in equity as at 31 December 2016
uwa.edu.au 81
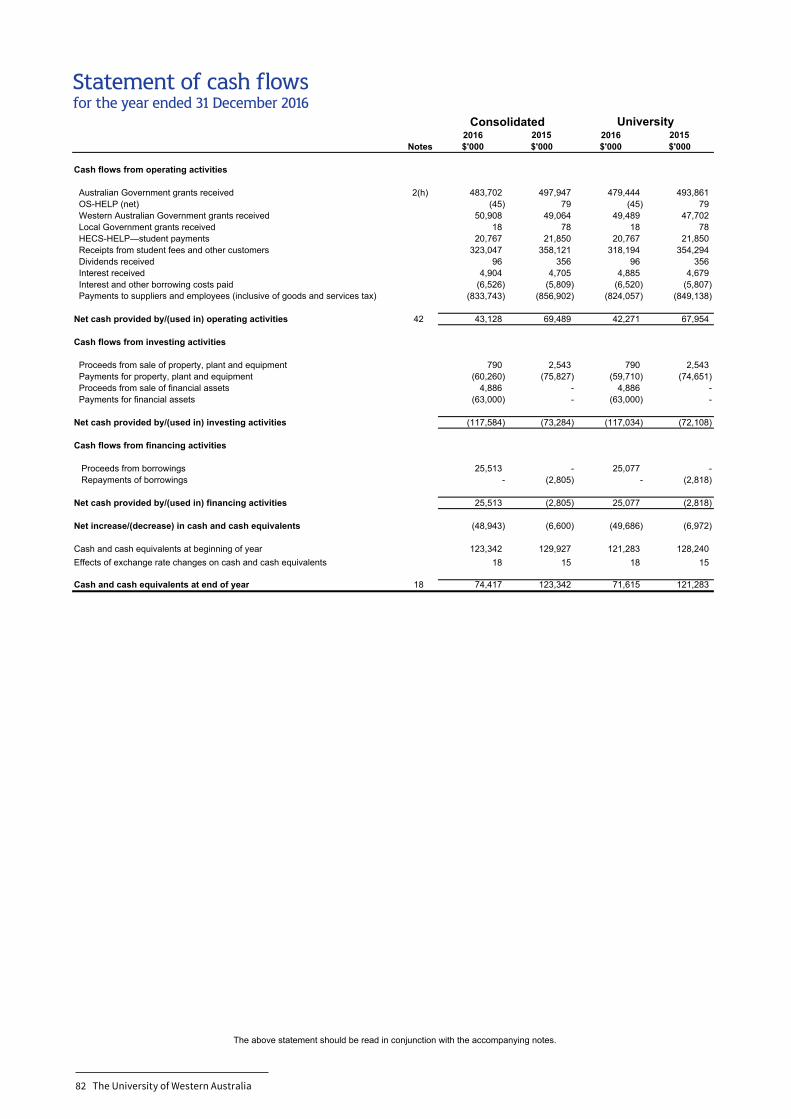
Consolidated2016 2015 2016 2015
Notes $'000 $'000 $'000 $'000
Cash flows from operating activities
Australian Government grants received 2(h) 483,702 497,947 479,444 493,861 OS-HELP (net) (45) 79 (45) 79 Western Australian Government grants received 50,908 49,064 49,489 47,702 Local Government grants received 18 78 18 78 HECS-HELP—student payments 20,767 21,850 20,767 21,850 Receipts from student fees and other customers 323,047 358,121 318,194 354,294 Dividends received 96 356 96 356 Interest received 4,904 4,705 4,885 4,679 Interest and other borrowing costs paid (6,526) (5,809) (6,520) (5,807) Payments to suppliers and employees (inclusive of goods and services tax) (833,743) (856,902) (824,057) (849,138)
Net cash provided by/(used in) operating activities 42 43,128 69,489 42,271 67,954
Cash flows from investing activities
Proceeds from sale of property, plant and equipment 790 2,543 790 2,543 Payments for property, plant and equipment (60,260) (75,827) (59,710) (74,651) Proceeds from sale of financial assets 4,886 - 4,886 - Payments for financial assets (63,000) - (63,000) -
Net cash provided by/(used in) investing activities (117,584) (73,284) (117,034) (72,108)
Cash flows from financing activities
Proceeds from borrowings 25,513 - 25,077 - Repayments of borrowings - (2,805) - (2,818)
Net cash provided by/(used in) financing activities 25,513 (2,805) 25,077 (2,818)
Net increase/(decrease) in cash and cash equivalents (48,943) (6,600) (49,686) (6,972)
Cash and cash equivalents at beginning of year 123,342 129,927 121,283 128,240Effects of exchange rate changes on cash and cash equivalents 18 15 18 15
Cash and cash equivalents at end of year 18 74,417 123,342 71,615 121,283
STATEMENT OF CASH FLOWSfor the year ended 31 December 2016
University
The above statement should be read in conjunction with the accompanying notes.
Statement of cash flows for the year ended 31 December 2016
82 The University of Western Australia
NOTES TO THE FINANCIAL STATEMENTS for the year ended 31 December 2016
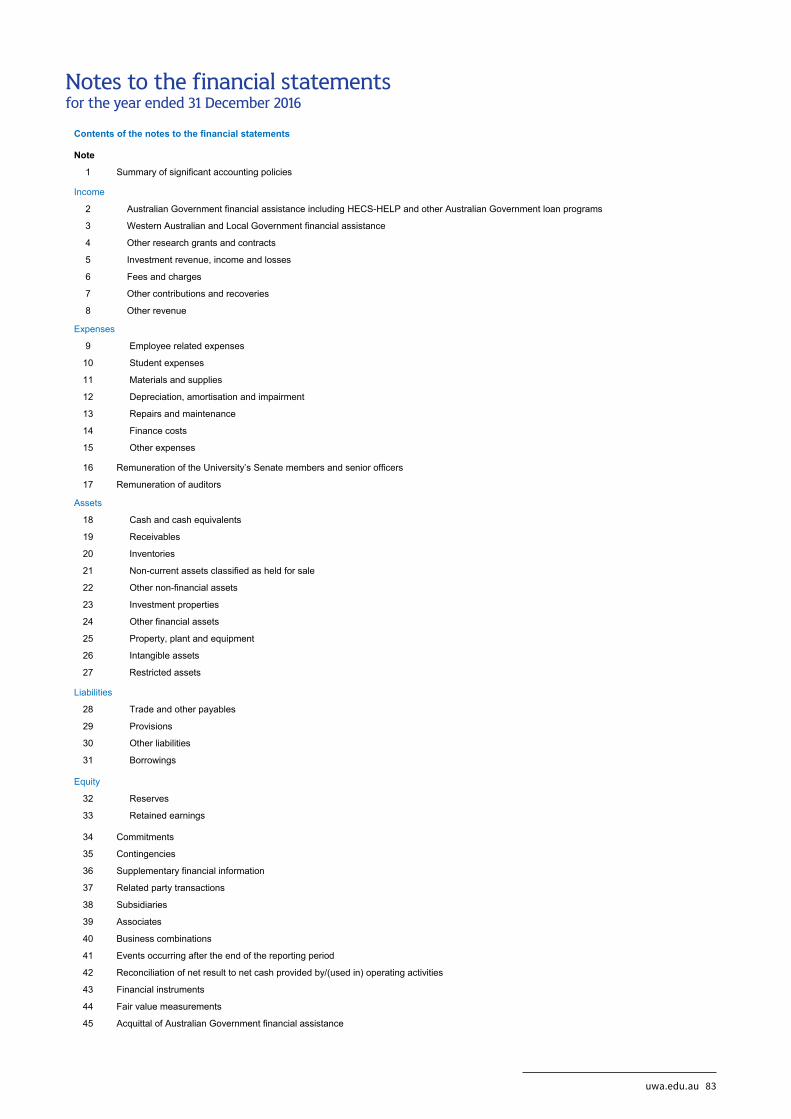
Contents of the notes to the financial statements
Note
1 Summary of significant accounting policies
Income
2 Australian Government financial assistance including HECS-HELP and other Australian Government loan programs
3 Western Australian and Local Government financial assistance
4 Other research grants and contracts
5 Investment revenue, income and losses
6 Fees and charges
7 Other contributions and recoveries
8 Other revenue
Expenses
9 Employee related expenses
10 Student expenses
11 Materials and supplies
12 Depreciation, amortisation and impairment
13 Repairs and maintenance
14 Finance costs
15 Other expenses
16 Remuneration of the University’s Senate members and senior officers
17 Remuneration of auditors
Assets
18 Cash and cash equivalents
19 Receivables
20 Inventories
21 Non-current assets classified as held for sale
22 Other non-financial assets
23 Investment properties
24 Other financial assets
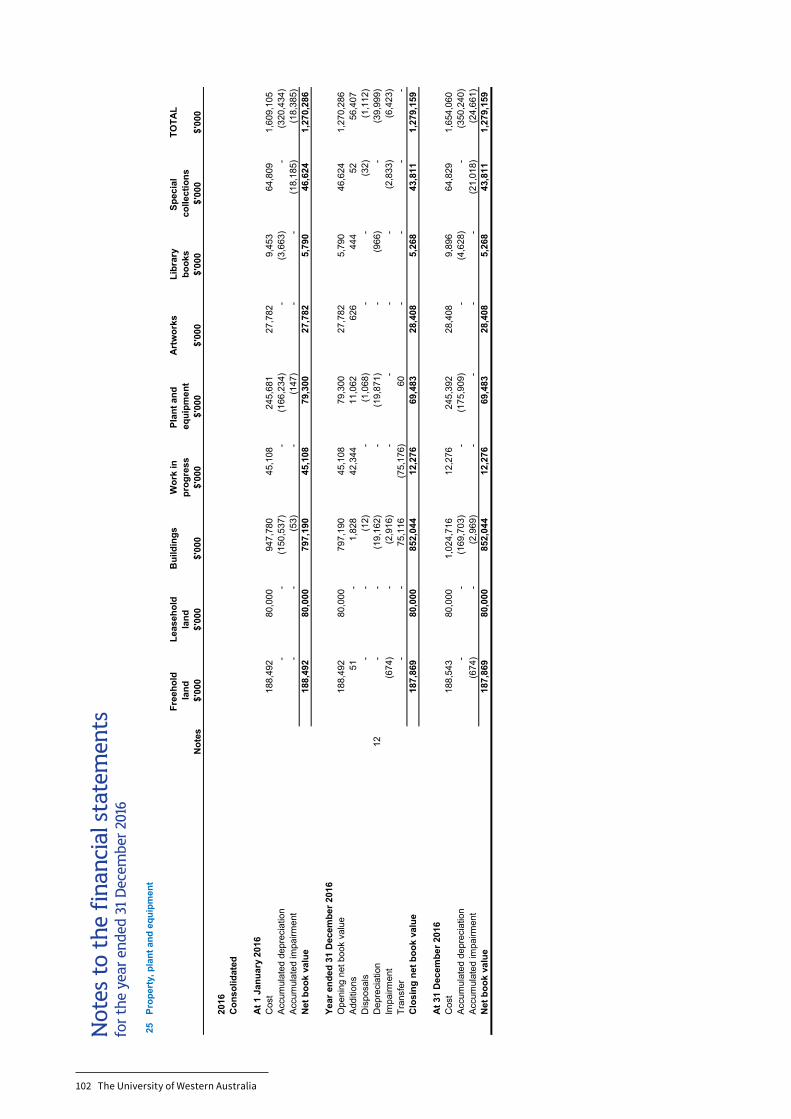
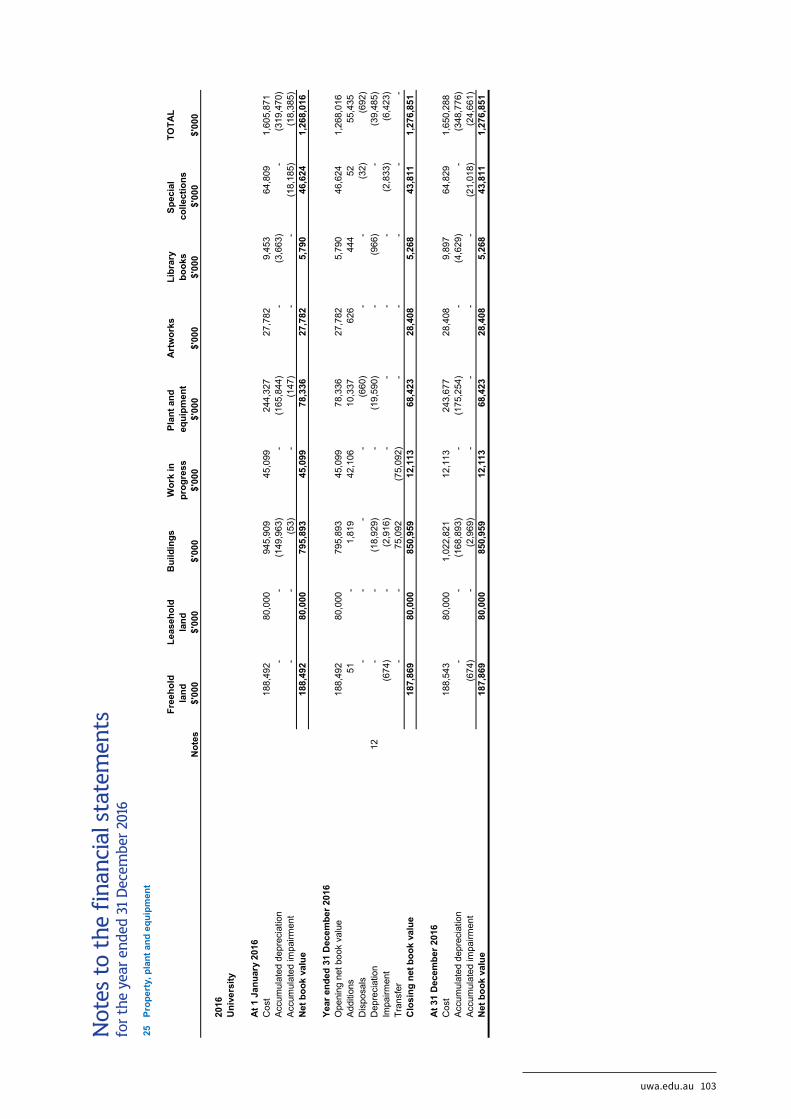
25 Property, plant and equipment
26 Intangible assets
27 Restricted assets
Liabilities
28 Trade and other payables
29 Provisions
30 Other liabilities
31 Borrowings
Equity
32 Reserves
33 Retained earnings
34 Commitments
35 Contingencies
36 Supplementary financial information
37 Related party transactions
38 Subsidiaries
39 Associates
40 Business combinations
41 Events occurring after the end of the reporting period
42 Reconciliation of net result to net cash provided by/(used in) operating activities
43 Financial instruments
44 Fair value measurements
45 Acquittal of Australian Government financial assistance
Notes to the financial statements for the year ended 31 December 2016
uwa.edu.au 83
NOTES TO THE FINANCIAL STATEMENTS for the year ended 31 December 2016
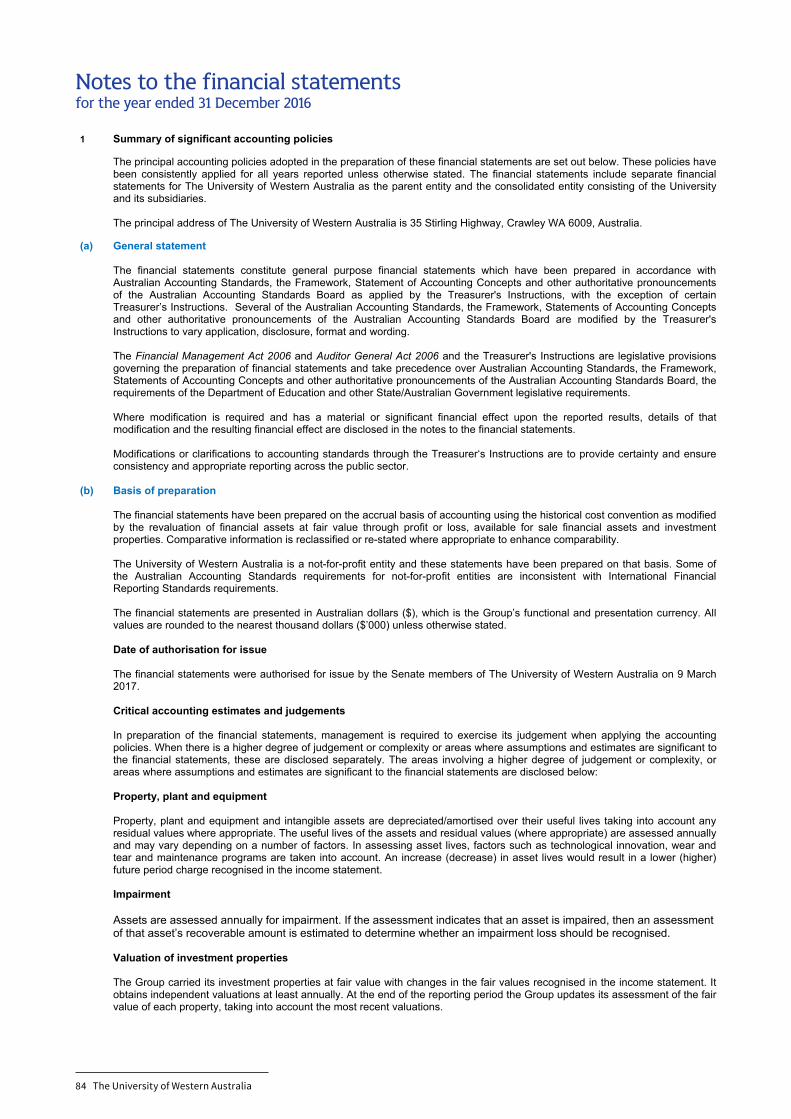
1 Summary of significant accounting policies
The principal accounting policies adopted in the preparation of these financial statements are set out below. These policies have been consistently applied for all years reported unless otherwise stated. The financial statements include separate financial statements for The University of Western Australia as the parent entity and the consolidated entity consisting of the University and its subsidiaries.
The principal address of The University of Western Australia is 35 Stirling Highway, Crawley WA 6009, Australia.
(a) General statement
The financial statements constitute general purpose financial statements which have been prepared in accordance with Australian Accounting Standards, the Framework, Statement of Accounting Concepts and other authoritative pronouncements of the Australian Accounting Standards Board as applied by the Treasurer's Instructions, with the exception of certain Treasurer’s Instructions. Several of the Australian Accounting Standards, the Framework, Statements of Accounting Concepts and other authoritative pronouncements of the Australian Accounting Standards Board are modified by the Treasurer's Instructions to vary application, disclosure, format and wording.
The Financial Management Act 2006 and Auditor General Act 2006 and the Treasurer's Instructions are legislative provisions governing the preparation of financial statements and take precedence over Australian Accounting Standards, the Framework, Statements of Accounting Concepts and other authoritative pronouncements of the Australian Accounting Standards Board, the requirements of the Department of Education and other State/Australian Government legislative requirements.
Where modification is required and has a material or significant financial effect upon the reported results, details of that modification and the resulting financial effect are disclosed in the notes to the financial statements.
Modifications or clarifications to accounting standards through the Treasurer‘s Instructions are to provide certainty and ensure consistency and appropriate reporting across the public sector.
(b) Basis of preparation
The financial statements have been prepared on the accrual basis of accounting using the historical cost convention as modified by the revaluation of financial assets at fair value through profit or loss, available for sale financial assets and investment properties. Comparative information is reclassified or re-stated where appropriate to enhance comparability.
The University of Western Australia is a not-for-profit entity and these statements have been prepared on that basis. Some of the Australian Accounting Standards requirements for not-for-profit entities are inconsistent with International Financial Reporting Standards requirements.
The financial statements are presented in Australian dollars ($), which is the Group’s functional and presentation currency. All values are rounded to the nearest thousand dollars ($’000) unless otherwise stated.
Date of authorisation for issue
The financial statements were authorised for issue by the Senate members of The University of Western Australia on 9 March 2017.
Critical accounting estimates and judgements
In preparation of the financial statements, management is required to exercise its judgement when applying the accounting policies. When there is a higher degree of judgement or complexity or areas where assumptions and estimates are significant to the financial statements, these are disclosed separately. The areas involving a higher degree of judgement or complexity, or areas where assumptions and estimates are significant to the financial statements are disclosed below:
Property, plant and equipment
Property, plant and equipment and intangible assets are depreciated/amortised over their useful lives taking into account any residual values where appropriate. The useful lives of the assets and residual values (where appropriate) are assessed annually and may vary depending on a number of factors. In assessing asset lives, factors such as technological innovation, wear and tear and maintenance programs are taken into account. An increase (decrease) in asset lives would result in a lower (higher) future period charge recognised in the income statement. Impairment
Assets are assessed annually for impairment. If the assessment indicates that an asset is impaired, then an assessment
of that asset’s recoverable amount is estimated to determine whether an impairment loss should be recognised. Valuation of investment properties
The Group carried its investment properties at fair value with changes in the fair values recognised in the income statement. It obtains independent valuations at least annually. At the end of the reporting period the Group updates its assessment of the fair value of each property, taking into account the most recent valuations.
Notes to the financial statements for the year ended 31 December 2016
84 The University of Western Australia
NOTES TO THE FINANCIAL STATEMENTS for the year ended 31 December 2016
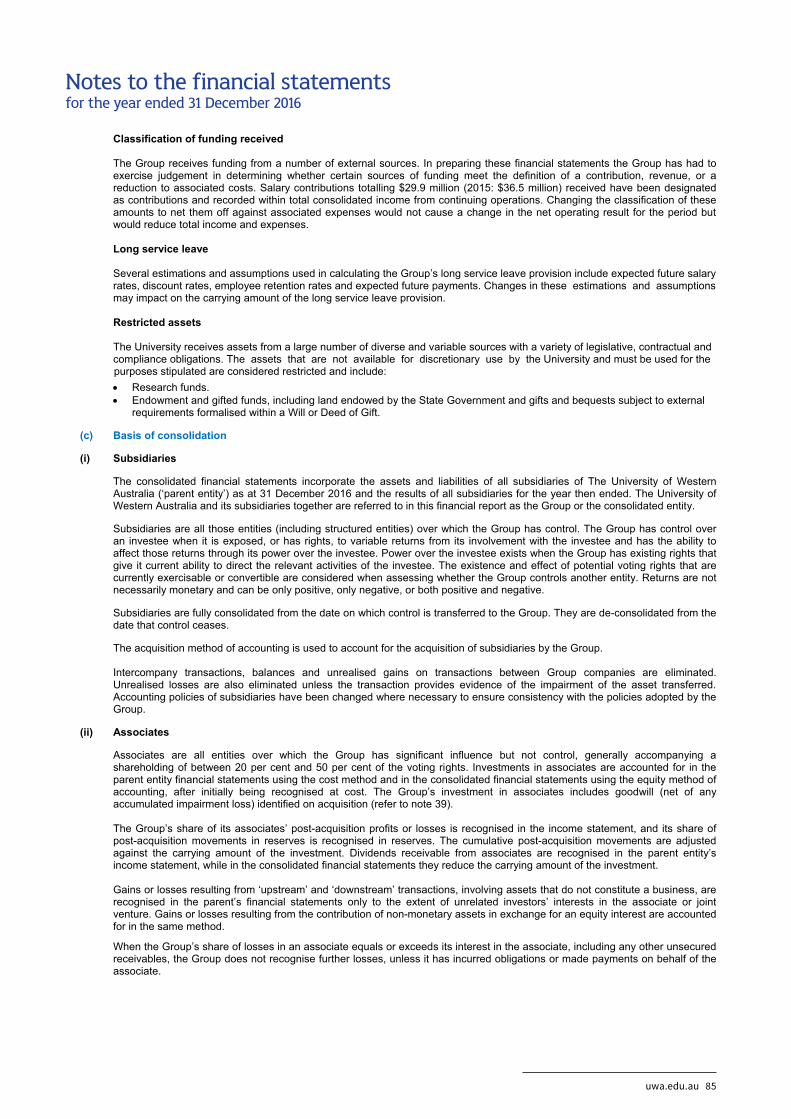
Classification of funding received
The Group receives funding from a number of external sources. In preparing these financial statements the Group has had to exercise judgement in determining whether certain sources of funding meet the definition of a contribution, revenue, or a reduction to associated costs. Salary contributions totalling $29.9 million (2015: $36.5 million) received have been designated as contributions and recorded within total consolidated income from continuing operations. Changing the classification of these amounts to net them off against associated expenses would not cause a change in the net operating result for the period but would reduce total income and expenses.
Long service leave
Several estimations and assumptions used in calculating the Group’s long service leave provision include expected future salary rates, discount rates, employee retention rates and expected future payments. Changes in these estimations and assumptions may impact on the carrying amount of the long service leave provision. Restricted assets
The University receives assets from a large number of diverse and variable sources with a variety of legislative, contractual and compliance obligations. The assets that are not available for discretionary use by the University and must be used for the purposes stipulated are considered restricted and include:
Research funds. Endowment and gifted funds, including land endowed by the State Government and gifts and bequests subject to external
requirements formalised within a Will or Deed of Gift.
(c) Basis of consolidation
(i) Subsidiaries
The consolidated financial statements incorporate the assets and liabilities of all subsidiaries of The University of Western Australia (‘parent entity’) as at 31 December 2016 and the results of all subsidiaries for the year then ended. The University of Western Australia and its subsidiaries together are referred to in this financial report as the Group or the consolidated entity.
Subsidiaries are all those entities (including structured entities) over which the Group has control. The Group has control over an investee when it is exposed, or has rights, to variable returns from its involvement with the investee and has the ability to affect those returns through its power over the investee. Power over the investee exists when the Group has existing rights that give it current ability to direct the relevant activities of the investee. The existence and effect of potential voting rights that are currently exercisable or convertible are considered when assessing whether the Group controls another entity. Returns are not necessarily monetary and can be only positive, only negative, or both positive and negative.
Subsidiaries are fully consolidated from the date on which control is transferred to the Group. They are de-consolidated from the date that control ceases.
The acquisition method of accounting is used to account for the acquisition of subsidiaries by the Group.
Intercompany transactions, balances and unrealised gains on transactions between Group companies are eliminated. Unrealised losses are also eliminated unless the transaction provides evidence of the impairment of the asset transferred. Accounting policies of subsidiaries have been changed where necessary to ensure consistency with the policies adopted by the Group.
(ii) Associates
Associates are all entities over which the Group has significant influence but not control, generally accompanying a shareholding of between 20 per cent and 50 per cent of the voting rights. Investments in associates are accounted for in the parent entity financial statements using the cost method and in the consolidated financial statements using the equity method of accounting, after initially being recognised at cost. The Group’s investment in associates includes goodwill (net of any accumulated impairment loss) identified on acquisition (refer to note 39).
The Group’s share of its associates’ post-acquisition profits or losses is recognised in the income statement, and its share of
post-acquisition movements in reserves is recognised in reserves. The cumulative post-acquisition movements are adjusted against the carrying amount of the investment. Dividends receivable from associates are recognised in the parent entity’s income statement, while in the consolidated financial statements they reduce the carrying amount of the investment.
Gains or losses resulting from ‘upstream’ and ‘downstream’ transactions, involving assets that do not constitute a business, are recognised in the parent’s financial statements only to the extent of unrelated investors’ interests in the associate or joint venture. Gains or losses resulting from the contribution of non-monetary assets in exchange for an equity interest are accounted for in the same method.
When the Group’s share of losses in an associate equals or exceeds its interest in the associate, including any other unsecured receivables, the Group does not recognise further losses, unless it has incurred obligations or made payments on behalf of the associate.
Notes to the financial statements for the year ended 31 December 2016
uwa.edu.au 85
NOTES TO THE FINANCIAL STATEMENTS for the year ended 31 December 2016
(iii) Joint arrangements
Joint operations
The Group’s share of assets, liabilities, revenue and expenses of a joint operation have been incorporated in the financial statements under the appropriate headings.
Joint ventures
The interest in a joint venture entity is accounted for in the consolidated financial statements using the equity method and is
carried at cost by the parent entity. Under the equity method, the share of the profits or losses of the entity is recognised in the income statement, and the share of movements in reserves is recognised in reserves in the statement of comprehensive income and the statement of changes in equity.
(d) Revenue Revenue is recognised at the fair value of the consideration received or receivable. Amounts disclosed as revenue are recognised net of returns, allowances and taxes paid and amounts collected on behalf of third parties.
The Group recognises revenue when the amount of revenue can be reliably measured, it is probable that the future economic benefits will flow to the Group and specific criteria have been met for each of the Group’s activities as described below.
Revenue is recognised as follows for major activities:
Sale of goods:
Revenue on the sale of goods is recognised by the Group when the goods have been despatched and the associated risk of ownership has passed to the customer.
Rendering of services:
Revenue is recognised in accordance with the percentage of completion method unless the outcome of the contract cannot be reliably measured. The stage of completion is determined by reference to expenditure incurred to date as a proportion of the total expenditure. If the outcome cannot be reliably measured, where it is probable that the costs will be recovered, revenue is recognised to the extent of costs incurred.
Government grants:
Grants from governments are recognised at their fair value where the Group obtains control of the right to receive the grant, it is probable that economic benefits will flow to the Group and it can be reliably measured.
Student fees and charges:
Fees and charges are recognised as income in the year of receipt, except to the extent that fees and charges relate to courses to be held in future periods. Such receipts are treated as income in advance. Conversely, fees and charges relating to debtors are recognised as revenue in the year to which the prescribed course relates.
Non-government grants and contributions:
Contributions are non-reciprocal transfers and are recognised as revenue at fair value when the Group obtains control of the contributions and it is probable that future economic benefits will flow to the Group.
(e) Cash and cash equivalents
Cash and cash equivalents includes cash on hand, bank accounts and deposits and other short-term, highly liquid money market investments that are readily convertible to known amounts of cash, and which are subject to an insignificant risk of changes in value.
(f) Trade and other receivables
Receivables are initially recognised at fair value plus direct and incremental transaction costs and are subsequently recognised at amortised cost, using the effective interest method, less provision for impaired receivables.
Collectability is reviewed on an ongoing basis and those receivables individually determined to be uncollectible are written off. The amount of any impairment is calculated by comparing the asset’s carrying amount with the present value of the estimated future cash flows, discounted at the effective interest rate. If impaired, the carrying value is adjusted and the difference charged to the income statement. A collective provision is determined for groups of assets that have similar risk characteristics and a provision is raised using a methodology based on existing risk conditions or events that have a strong correlation with a tendency to default.
Notes to the financial statements for the year ended 31 December 2016
86 The University of Western Australia
NOTES TO THE FINANCIAL STATEMENTS for the year ended 31 December 2016
(g) Inventories
Inventories are valued at the lower of cost and net realisable value. Cost comprises direct materials, direct labour and an appropriate proportion of variable and fixed overhead expenditure, the latter being allocated on the basis of normal operating capacity. Cost is assigned on a first-in, first-out basis. Net realisable value is the estimated selling price in the ordinary course of business less the estimated costs of completion and the estimated costs necessary to make the sale.
(h) Non-current assets classified as held for sale
Non-current assets are classified as assets held for sale if their carrying amount will be recovered principally through a sale transaction rather than through continuing use. Non-current assets held for sale are recognised at the lower of carrying amount and fair value less costs of disposal. An impairment loss is recognised for any initial or subsequent write-down of the asset to fair value less costs of disposal. A gain is recognised for any subsequent increases in fair value less costs to sell of an asset, but not in excess of any cumulative impairment loss previously recognised. A gain or loss not previously recognised by the date of the sale of the non-current asset is recognised at the date of derecognition. Non-current assets are not depreciated or amortised while they are classified as held for sale. Interest and other expenses attributable to the liabilities of a disposal group classified as held for sale continue to be recognised.
(i) Investments and other financial assets
The Group has classified its financial assets into the following categories: financial assets at fair value through profit or loss; loans and receivables; and available for sale financial assets. The classification depends on the purpose for which the assets are acquired. Financial assets at fair value through profit or loss
An instrument is classified as a financial asset at fair value through profit or loss - as designated upon initial recognition - if the Group manages such investments directly or through professional fund managers and makes decisions based on their fair value, in accordance with the Group’s documented investment strategy and risk management. Assets within this category are recorded at fair value and changes in fair value recognised in the income statement. Fair value is based on market price where there is an active market. The Group does not hold any financial assets at fair value – held for trading.
Loans and receivables
Loans and receivables are non-derivative financial assets with fixed or determinable payments that are not quoted in an active market. They typically arise when the Group provides money, goods or services directly to a debtor with no intention of trading the receivable. Assets within this category are initially recorded at fair value plus direct and incremental transaction costs and are subsequently measured at amortised cost using the effective interest method. A loan or receivable that is not based upon market terms is initially recognised at fair value plus attributable transaction costs. Fair value is estimated as the present value of all future cash receipts discounted using the prevailing market rate(s) of interest for a similar instrument (similar as to currency, term, type of interest rate, and other factors) with a similar credit rating. Any additional amount lent is an expense or a reduction of income unless it qualifies for recognition as some other type of asset.
Available-for-sale financial assets
Available-for-sale financial assets are non-derivative financial assets that are designated as available-for-sale and that are not classified in any of the previous categories. The equity instruments are measured at fair value or cost where the fair value cannot be reliably measured (not traded in an active market). Dividends are only recognised when declared and no dividend accrual is recognised.
Impairment The Group assesses at each balance sheet date whether there is objective evidence that a financial asset or group of financial assets is impaired.
(i) Available-for-sale financial assets
If there is objective evidence of impairment for available-for-sale financial assets, the impairment loss is measured as the difference between the carrying amount of the financial asset and the market value or present value of estimated future cash flows discounted at the current market rate of return for a similar financial asset. The carrying amount of the asset is reduced and the amount of the loss is recognised in the income statement.
(ii) Assets carried at amortised cost
For loans and receivables, the amount of the loss is measured as the difference between the asset’s carrying amount and the present value of estimated future cash flows (excluding future credit losses that have not been incurred) discounted at the financial asset’s original effective interest rate. The carrying amount of the asset is reduced and the amount of the loss is recognised in the income statement.
Notes to the financial statements for the year ended 31 December 2016
uwa.edu.au 87
NOTES TO THE FINANCIAL STATEMENTS for the year ended 31 December 2016
If, in a subsequent period, the amount of the impairment loss decreases and the decrease can be related objectively to an event occurring after the impairment was recognised (such as an improvement in the debtor’s credit rating), the reversal of the previously recognised impairment loss is recognised in the income statement.
(j) Fair value measurement
The fair value of assets and liabilities must be measured for recognition and disclosure purposes. The Group measures financial instruments and investment properties at fair value at each balance sheet date.
The Group classifies fair value measurements using a fair value hierarchy that reflects the significance of the inputs used in making the measurements.
The fair value of assets or liabilities traded in active markets is based on quoted market prices for identical assets or liabilities at the balance sheet date (level 1). The quoted market price used for assets held by the Group is the most representative of fair value in the circumstances within the bid-ask spread. The fair value of assets or liabilities that are not traded in an active market is determined using valuation techniques. The Group uses a variety of methods and makes assumptions that are based on market conditions existing at each balance date. Quoted market prices or dealer quotes for similar instruments (level 2) are used for long-term debt instruments held. Other techniques that are not based on observable market data (level 3) are used to determine fair value for the remaining assets and liabilities. The level in the fair value hierarchy is determined on the basis of the lowest level input that is significant to the fair value measurement in its entirety. Fair value measurement of non-financial assets is based on the highest and best use of the asset. The Group considers market participants’ use of, or purchase price of the asset, to use it in a manner that would be highest and best use. The carrying value less impairment provision of trade receivables and payables are assumed to approximate their fair values due to their short-term nature. The fair value of financial liabilities for disclosure purposes is estimated by discounting the future contractual cash flows at the current market interest rate that is available to the Group for similar financial instruments.
(k) Investment properties
Initially, investment properties are measured at cost including transaction costs. Subsequent to initial recognition, investment properties are stated at fair value determined annually by an external valuer. Any gains or losses arising from changes in the fair values of investment properties are included in the income statement in the year in which they arise.
(l) Property, plant and equipment
Property, plant and equipment is measured at cost less accumulated depreciation less accumulated impairment losses. Where an asset is acquired at no cost or for a nominal cost, the cost recorded is the fair value of the asset at the acquisition date. Cultural assets where the fair value or economic benefit cannot be reliably measured are not ascribed a value. Subsequent costs are included in the assets carrying value or recognised as a separate asset, where appropriate, when it is probable that future economic benefits associated with the asset will flow to the Group. All other repairs and maintenance are charged to the income statement when incurred. The depreciation rate policy is as follows:
Asset class Depreciation rate Depreciation method
Leasehold land Not depreciated Not depreciated Freehold land Not depreciated Not depreciated Buildings Structure/shell/building fabric Fixtures, fittings and central plant Leasehold improvements
2% 5% Over the life of the lease
Reducing balance Straight line Straight line
Plant and equipment Computer hardware and audio visual General plant and equipment Motor vehicles
25% 12.5% 17.4%
Straight line Straight line Straight line
Artworks Not depreciated Not depreciated Library books 10% Straight line Special collections Not depreciated Not depreciated
Land, artworks and special collections controlled by the University are classified as non-current assets. They are anticipated to have indefinite useful lives since their service potential is not, in any material sense, consumed. As such, no amount for depreciation is recognised. Work in progress assets are not depreciated until construction has been completed and the asset is available for use. Assets’ residual values and useful lives are reviewed at each balance sheet date. Gains and losses on disposal are recorded in the income statement for the year. Impairment testing is performed when an indicator of impairment is identified.
Notes to the financial statements for the year ended 31 December 2016
88 The University of Western Australia
NOTES TO THE FINANCIAL STATEMENTS for the year ended 31 December 2016
The carrying amount of an asset is derecognised when disposed of or when no future economic benefits are expected from its use or disposal. Where the cost of a replacement part of an item is recognised as part of an asset (or as a separate asset), the Group derecognises the carrying amount of the replaced part regardless of whether it had been depreciated separately. Where it is not practicable for the Group to determine the carrying amount of the replaced part, the cost of the replacement is used as an indication of what the cost of the replaced part was at the time of acquisition or construction.
(m) Impairment of assets
Assets that have an indefinite useful life are tested annually for impairment. Assets with a finite life are tested for impairment when events or changes in circumstances indicate the carrying value may not be recoverable. An impairment loss is recognised for the amount by which the asset’s carrying value exceeds the recoverable amount. The recoverable amount is the higher of its fair value less costs of disposal and its value in use. As the Group is a not-for-profit entity, if the future economic benefits of the asset are not primarily dependent on its ability to generate net cash flows, unless the asset has been identified as surplus, the value in use is its depreciated replacement cost.
(n) Intangible assets
Intangible assets are capitalised at cost and from a business combination are capitalised at fair value as at the date of acquisition. Following initial recognition, the cost model is applied to the class of intangible assets. Expenditure on research activities is recognised as an expense in the income statement when incurred. Expenditure on development activities is expensed unless the outcome is technically and commercially feasible, resources are available to complete the development and there is a commitment to complete the project.
Electronic library resources can be categorised into perpetual access and annual subscriptions. Perpetual access based resources are capitalised and amortised 10 per cent annually over 10 years. Annual subscriptions are expensed as incurred.
Asset class Amortisation rate Amortisation method
Software 20% Straight line Electronic library resources 10% Straight line
Impairment testing is performed when an indicator of impairment is identified.
(o) Leases
Leases where the lessee has substantially all the risks and rewards of ownership are classified as finance leases. Finance leases are capitalised at the lower of fair value and the present value of the minimum lease payments and the corresponding obligation is recorded in payables. Each lease payment is allocated between the finance charge and reducing the liability. Leases are classified as operating leases when the lessor retains substantially all the risks and rewards of ownership. Payments or income received under operating leases are recognised in the income statement on a straight line basis over the lease term. Where the Group is the lessor, the asset subject to an operating lease is recognised in the statement of financial position according to the nature of the asset.
(p) Business combinations
The acquisition method shall be applied to account for each business combination; this does not include a combination of entities or businesses under common control, the formation of a joint venture, or the acquisition of an asset or a group of assets. The acquisition method requires identification of the acquirer, determining the acquisition date and recognising and measuring the identifiable assets acquired, liabilities assumed, any goodwill or gain from a bargain purchase and any non-controlling interest in the acquiree that are present ownership interests and entitle their holders to a proportionate share of the entity’s net assets in the event of liquidation. Identifiable assets acquired, liabilities assumed and any non-controlling interest in the acquiree shall be recognised separately from goodwill as of the acquisition date.
Intangible assets acquired in a business combination are recognised separately from goodwill if they are separable, but only together with a related contract, identifiable asset or liability. Acquisition related costs are expensed in the periods in which they are incurred with the exception of costs to issue debt or equity securities, which are recognised in accordance with AASB132 and AASB139.
Identifiable assets acquired and liabilities and contingent liabilities assumed in a business combination are measured initially at their fair values at the acquisition date. Measurement of any non-controlling interest in the acquiree is at fair value or the present ownership instruments’ proportionate share in the recognised amounts of the acquiree’s identifiable net assets. All other components of non-controlling interests shall be measured at their acquisition-date fair values, unless another measurement basis is required by Australian Accounting Standards. Contingent liabilities assumed are recognised as part of the acquisition if there is a present obligation arising from past events and the fair value can be reliably measured. The excess at the acquisition date of the aggregate of the consideration transferred, the amount of any non-controlling interest and any previously held equity interest in the acquiree, over the net amounts of identifiable assets acquired and liabilities assumed is recognised as goodwill. If the cost of acquisition is less than the fair value of the identifiable net assets of the subsidiary acquired, the difference is recognised directly in the income statement of the acquirer, but only after a reassessment of the identification and measurement of the net assets acquired.
Notes to the financial statements for the year ended 31 December 2016
uwa.edu.au 89
NOTES TO THE FINANCIAL STATEMENTS for the year ended 31 December 2016
Consideration transferred in a business combination shall be measured at fair value. Where the business combination is achieved in stages, the acquirer shall remeasure previously held equity interest in the acquiree at its acquisition date fair value and recognise the resulting gain or loss in profit or loss.
(q) Trade and other payables
Payables represent liabilities for goods or services incurred on or before the reporting date. Trade payables are initially recorded at fair value and subsequently recorded at amortised cost. Due to the short duration and other terms of payment these amounts usually equate to cost.
(r) Provisions
Provisions are recognised where there is a present obligation as a result of a past event, it is probable that an outflow of economic benefit will be required to settle the obligation and a reliable estimate can be made of the amount. Provisions are measured at the present value of management’s best estimate of the expenditure required to settle the present obligation at the balance sheet date. The discount rate used to determine the present value reflects current market assessments of the time value of money and the risks specific to the liability. The increase in the provision due to the passage of time is recognised as a finance cost.
(s) Borrowings
Borrowings are recognised initially at fair value net of transaction costs that are directly attributable to its issue. After initial recognition, borrowings are subsequently measured at amortised cost using the Effective Interest Rate (EIR) method. Gains and losses are recognised in the income statement when the liabilities are derecognised as well as through the EIR amortisation process. Amortised cost is calculated by taking into account any discount or premium on acquisition and fees or costs that are an integral part of the EIR. The EIR amortisation is included in finance costs in the income statement. Borrowings are classified as current liabilities unless the Group has an unconditional right to defer settlement of the liability for at least 12 months after the balance sheet date and does not expect to settle the liability for at least 12 months after the balance sheet date.
(t) Borrowing costs
Borrowing costs incurred for the construction of any qualifying asset are capitalised during the period of time that is required to complete and prepare the asset for its intended use or sale. Other borrowing costs are expensed.
(u) Employee benefits (i) Wages and salaries Wages and salaries due to be settled within 12 months after the end of the period are measured at the amount expected to be
paid when the liability is settled. (ii) Annual leave Annual leave is not expected to be settled wholly within 12 months after the end of the reporting period and therefore
considered to be other long-term employee benefits. The annual leave liability is recognised and measured at the present value of amounts expected to be paid when the liabilities are settled using the remuneration rate expected to apply at the time of settlement. Regardless of the expected timing of settlements, provisions made in respect of employee benefits are classified as a current liability, unless there is an unconditional right to defer the settlement of the liability for at least 12 months after the reporting date, in which case it would be classified as a non-current liability.
(iii) Long service leave The liability for long service leave is recognised in the provision for employee benefits and measured at the present value of
expected future payments to be made in respect of services provided by employees up to the reporting date using the projected unit credit method. Consideration is given to expected future wage and salary levels, experience of employee departures and periods of service. Expected future payments are discounted using market yields at the reporting date on national government bonds with terms to maturity and currency that match, as closely as possible, the estimated future cash outflows.
(iv) Superannuation The Group contributes to a number of employee funds that exist to provide benefits for employees and their dependants on
retirement, disability or death. Three of these funds are defined benefit pension schemes.
(v) Termination benefits Termination benefits are payable when employment is terminated before the normal retirement date, or when an employee
accepts voluntary redundancy in exchange for these benefits. The Group recognises termination benefits when it is demonstrably committed to either terminating the employment of current employees according to a detailed formal plan without possibility of withdrawal or providing termination benefits as a result of an offer made to encourage voluntary redundancy.
Notes to the financial statements for the year ended 31 December 2016
90 The University of Western Australia
NOTES TO THE FINANCIAL STATEMENTS for the year ended 31 December 2016
(vi) Retirement benefit obligation
The Group meets the benefits of the schemes as they fall due and consequently there are no plan assets within the scheme. The present value of the defined benefit obligation is based on expected future payments which arise from membership of the fund to the reporting date, calculated annually by independent actuaries using the projected unit credit method. Expected future payments are discounted using market yields at the reporting date on national government bonds with terms to maturity and currency that match, as closely as possible, the estimated future cash outflows. Actuarial gains and losses arising from experience adjustments and changes in actuarial assumptions are recognised in the period in which they occur in other comprehensive income. Past service costs are recognised immediately in income, unless the changes to the superannuation fund are conditional on the employees remaining in service for a specified period of time (the vesting period). In this case, the past service costs are amortised on a straight-line basis over the vesting period. The Group recognises amounts payable to defined contributions schemes as an expense in the income statement in the period that the service has been rendered by the employee.
(vii) Other employee benefits
All other benefits are recognised when the benefit is received by the employee and measured at the rates paid or payable.
(v) Income tax
The Group is exempt from income tax in Australia.
The Group is subject to foreign income tax for overseas operations. Deferred tax assets are only recognised where it is probable that future taxable amounts will be available to utilise those temporary differences and unused tax losses.
(w) Foreign currency transactions
The functional currency of the Group and its subsidiaries is the Australian dollar. Foreign currency transactions are initially translated into Australian currency at the rate of exchange at the date of the transaction. At the reporting date, amounts payable and receivable in foreign currencies are translated to Australian currency at rates of exchange at that date. Non-monetary items held at the reporting date are measured using the exchange rate at the date of the initial transaction. Resulting exchange differences are recognised in the income statement.
(x) Goods and Services Tax (GST)
Revenues, expenses and assets are recognised net of the amount of associated GST, unless the GST incurred is not recoverable from the taxation authority. In this case, it is recognised as part of the acquisition cost of the asset or as part of the expense.
Receivables and payables are stated inclusive of the amount of GST receivable or payable. The net amount of GST recoverable from, or payable to, the taxation authority is included with other receivables or payables in the statement of financial position.
Cash flows are presented on a gross basis. The GST components of cash flows arising from investing or financing activities which are recoverable from, or payable to the taxation authority, are presented as operating cash flows.
(y) Disclosure of changes in accounting policy and estimates
(i) Initial application of Australian Accounting Standards The Group has not applied any new or revised Australian Accounting Standards and Australian Accounting Interpretations for annual reporting periods beginning on or after 1 January 2016 as they have no financial impact on the Group.
(ii) Future impact of Australian Accounting Standards not yet operative Certain new Accounting Standards and Interpretations have been published that are not mandatory for 31 December 2016 reporting periods. The following Australian Accounting Standards and amendments have been issued but not yet applied by the Group: AASB 9 Financial Instruments. This Standard supersedes AASB 139, Financial Instruments: Recognition and Measurement, introducing a number of changes to accounting treatments. The mandatory application date of this Standard was amended to 1 January 2018 by AASB 2014-1. The Group has not yet determined the application or the potential impact of the Standard.
AASB 15 Revenue from Contracts with Customers. This Standard establishes the principles that the Group shall apply to report useful information to users of financial statements about the nature, amount, timing and uncertainty of revenue and cash flows arising from a contract with a customer. The mandatory application date of this standard was amended to 1 January 2019 for Not-for-Profit entities. The Group has not yet determined the application or the potential impact of the Standard.
Notes to the financial statements for the year ended 31 December 2016
uwa.edu.au 91
NOTES TO THE FINANCIAL STATEMENTS for the year ended 31 December 2016
AASB 16 Leases. This Standard introduces a single lessee accounting model and requires a lessee to recognise assets and liabilities for all leases with a term of more than 12 months, unless the underlying asset is of low value, and is mandatory on or after 1 January 2019. The Group has not yet determined the application or the potential impact of the Standard. AASB 1058 Income for Not-for-Profit Entities. This standard aligns income recognition for Not-For-Profit entities to align more closely to reflect economic reality. Revenue from grants and donations will be recognised when any associated performance obligation to provide goods and services is satisfied, and not immediately upon receipt as usually occurs with current standard. The requirements will be effective from 1 January 2019. The Group has not yet determined the application or the potential impact of the Standard. A number of other new or revised standards, amendments to standards and interpretations applicable to future reporting periods have been issued, none of which are expected to have a material impact on the Group’s future financial reports.
Notes to the financial statements for the year ended 31 December 2016
92 The University of Western Australia
for the year ended 31 December 2016
Consolidated University2016 2015 2016 2015
Notes $'000 $'000 $'000 $'000
2 Australian Government financial assistance includingHECS-HELP and other Australian Government loan programs
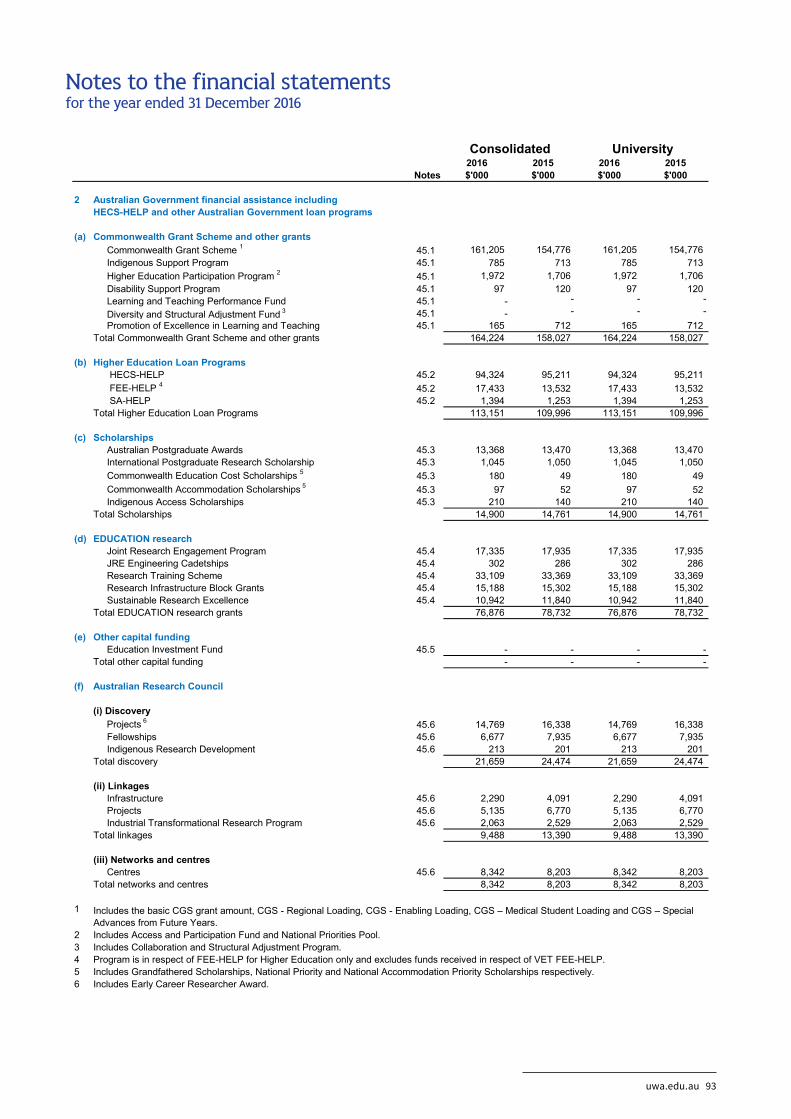
(a) Commonwealth Grant Scheme and other grants Commonwealth Grant Scheme 1 45.1 161,205 154,776 161,205 154,776 Indigenous Support Program 45.1 785 713 785 713 Higher Education Participation Program 2 45.1 1,972 1,706 1,972 1,706 Disability Support Program 45.1 97 120 97 120 Learning and Teaching Performance Fund 45.1 - - - - Diversity and Structural Adjustment Fund 3 45.1 - - - - Promotion of Excellence in Learning and Teaching 45.1 165 712 165 712Total Commonwealth Grant Scheme and other grants 164,224 158,027 164,224 158,027
(b) Higher Education Loan Programs HECS-HELP 45.2 94,324 95,211 94,324 95,211 FEE-HELP 4 45.2 17,433 13,532 17,433 13,532 SA-HELP 45.2 1,394 1,253 1,394 1,253Total Higher Education Loan Programs 113,151 109,996 113,151 109,996
(c) Scholarships Australian Postgraduate Awards 45.3 13,368 13,470 13,368 13,470 International Postgraduate Research Scholarship 45.3 1,045 1,050 1,045 1,050 Commonwealth Education Cost Scholarships 5 45.3 180 49 180 49 Commonwealth Accommodation Scholarships 5 45.3 97 52 97 52 Indigenous Access Scholarships 45.3 210 140 210 140Total Scholarships 14,900 14,761 14,900 14,761
(d) EDUCATION research Joint Research Engagement Program 45.4 17,335 17,935 17,335 17,935 JRE Engineering Cadetships 45.4 302 286 302 286 Research Training Scheme 45.4 33,109 33,369 33,109 33,369 Research Infrastructure Block Grants 45.4 15,188 15,302 15,188 15,302 Sustainable Research Excellence 45.4 10,942 11,840 10,942 11,840Total EDUCATION research grants 76,876 78,732 76,876 78,732
(e) Other capital funding Education Investment Fund 45.5 - - - -Total other capital funding - - - -
(f) Australian Research Council
(i) Discovery Projects 6 45.6 14,769 16,338 14,769 16,338 Fellowships 45.6 6,677 7,935 6,677 7,935 Indigenous Research Development 45.6 213 201 213 201Total discovery 21,659 24,474 21,659 24,474
(ii) Linkages Infrastructure 45.6 2,290 4,091 2,290 4,091 Projects 45.6 5,135 6,770 5,135 6,770 Industrial Transformational Research Program 45.6 2,063 2,529 2,063 2,529Total linkages 9,488 13,390 9,488 13,390
(iii) Networks and centres Centres 45.6 8,342 8,203 8,342 8,203Total networks and centres 8,342 8,203 8,342 8,203
1
2 Includes Access and Participation Fund and National Priorities Pool.3 Includes Collaboration and Structural Adjustment Program.4 Program is in respect of FEE-HELP for Higher Education only and excludes funds received in respect of VET FEE-HELP.5 Includes Grandfathered Scholarships, National Priority and National Accommodation Priority Scholarships respectively.6 Includes Early Career Researcher Award.
Includes the basic CGS grant amount, CGS - Regional Loading, CGS - Enabling Loading, CGS – Medical Student Loading and CGS – Special Advances from Future Years.
NOTES TO THE FINANCIAL STATEMENTSNotes to the financial statements for the year ended 31 December 2016
uwa.edu.au 93
for the year ended 31 December 2016
Consolidated University2016 2015 2016 2015
Notes $'000 $'000 $'000 $'000
NOTES TO THE FINANCIAL STATEMENTS
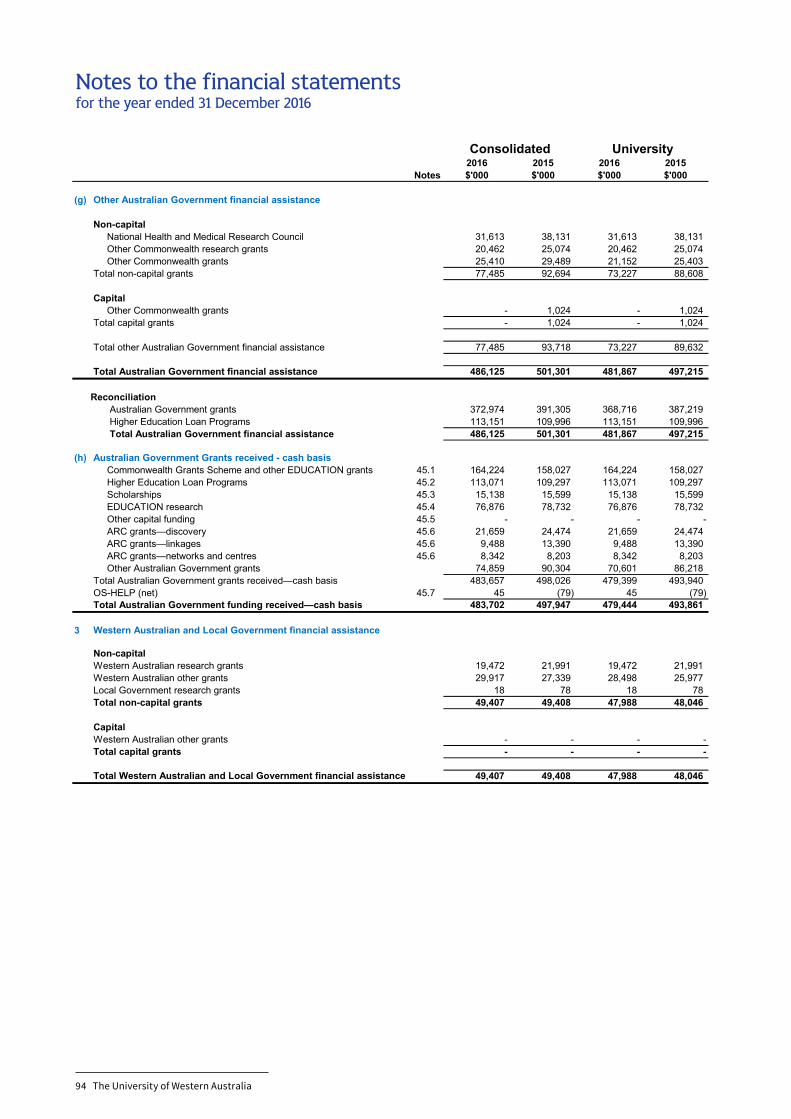
(g) Other Australian Government financial assistance
Non-capital National Health and Medical Research Council 31,613 38,131 31,613 38,131 Other Commonwealth research grants 20,462 25,074 20,462 25,074 Other Commonwealth grants 25,410 29,489 21,152 25,403Total non-capital grants 77,485 92,694 73,227 88,608
Capital Other Commonwealth grants - 1,024 - 1,024Total capital grants - 1,024 - 1,024
Total other Australian Government financial assistance 77,485 93,718 73,227 89,632
Total Australian Government financial assistance 486,125 501,301 481,867 497,215
Reconciliation Australian Government grants 372,974 391,305 368,716 387,219 Higher Education Loan Programs 113,151 109,996 113,151 109,996 Total Australian Government financial assistance 486,125 501,301 481,867 497,215
(h) Australian Government Grants received - cash basis Commonwealth Grants Scheme and other EDUCATION grants 45.1 164,224 158,027 164,224 158,027 Higher Education Loan Programs 45.2 113,071 109,297 113,071 109,297 Scholarships 45.3 15,138 15,599 15,138 15,599 EDUCATION research 45.4 76,876 78,732 76,876 78,732 Other capital funding 45.5 - - - - ARC grants—discovery 45.6 21,659 24,474 21,659 24,474 ARC grants—linkages 45.6 9,488 13,390 9,488 13,390 ARC grants—networks and centres 45.6 8,342 8,203 8,342 8,203 Other Australian Government grants 74,859 90,304 70,601 86,218Total Australian Government grants received—cash basis 483,657 498,026 479,399 493,940OS-HELP (net) 45.7 45 (79) 45 (79)Total Australian Government funding received—cash basis 483,702 497,947 479,444 493,861
3 Western Australian and Local Government financial assistance
Non-capitalWestern Australian research grants 19,472 21,991 19,472 21,991Western Australian other grants 29,917 27,339 28,498 25,977Local Government research grants 18 78 18 78Total non-capital grants 49,407 49,408 47,988 48,046
CapitalWestern Australian other grants - - - -Total capital grants - - - -
49,407 49,408 47,988 48,046Total Western Australian and Local Government financial assistance
Notes to the financial statements for the year ended 31 December 2016
94 The University of Western Australia
for the year ended 31 December 2016
Consolidated University2016 2015 2016 2015
Notes $'000 $'000 $'000 $'000
NOTES TO THE FINANCIAL STATEMENTS
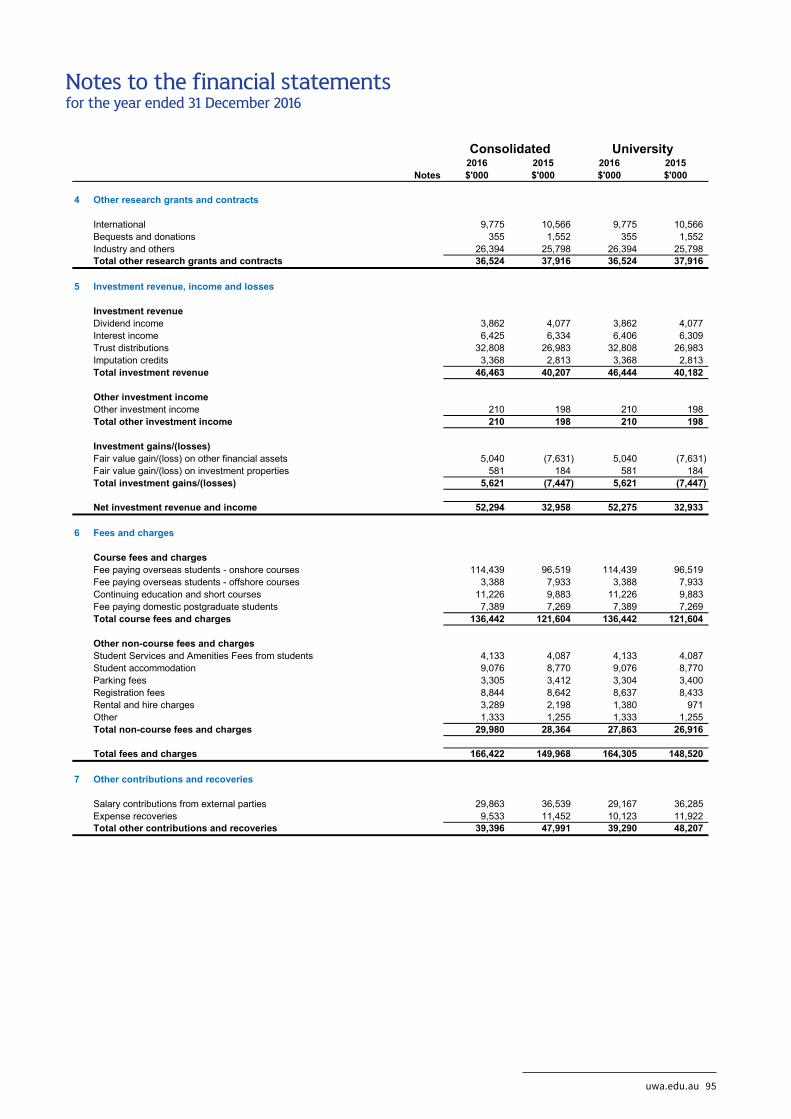
4 Other research grants and contracts
International 9,775 10,566 9,775 10,566Bequests and donations 355 1,552 355 1,552Industry and others 26,394 25,798 26,394 25,798Total other research grants and contracts 36,524 37,916 36,524 37,916
5 Investment revenue, income and losses
Investment revenueDividend income 3,862 4,077 3,862 4,077Interest income 6,425 6,334 6,406 6,309Trust distributions 32,808 26,983 32,808 26,983Imputation credits 3,368 2,813 3,368 2,813Total investment revenue 46,463 40,207 46,444 40,182
Other investment incomeOther investment income 210 198 210 198Total other investment income 210 198 210 198
Investment gains/(losses)Fair value gain/(loss) on other financial assets 5,040 (7,631) 5,040 (7,631)Fair value gain/(loss) on investment properties 581 184 581 184Total investment gains/(losses) 5,621 (7,447) 5,621 (7,447)
Net investment revenue and income 52,294 32,958 52,275 32,933
6 Fees and charges
Course fees and chargesFee paying overseas students - onshore courses 114,439 96,519 114,439 96,519Fee paying overseas students - offshore courses 3,388 7,933 3,388 7,933Continuing education and short courses 11,226 9,883 11,226 9,883Fee paying domestic postgraduate students 7,389 7,269 7,389 7,269Total course fees and charges 136,442 121,604 136,442 121,604
Other non-course fees and chargesStudent Services and Amenities Fees from students 4,133 4,087 4,133 4,087Student accommodation 9,076 8,770 9,076 8,770Parking fees 3,305 3,412 3,304 3,400Registration fees 8,844 8,642 8,637 8,433Rental and hire charges 3,289 2,198 1,380 971Other 1,333 1,255 1,333 1,255Total non-course fees and charges 29,980 28,364 27,863 26,916
Total fees and charges 166,422 149,968 164,305 148,520
7 Other contributions and recoveries
Salary contributions from external parties 29,863 36,539 29,167 36,285Expense recoveries 9,533 11,452 10,123 11,922Total other contributions and recoveries 39,396 47,991 39,290 48,207
Notes to the financial statements for the year ended 31 December 2016
uwa.edu.au 95
for the year ended 31 December 2016
Consolidated University2016 2015 2016 2015
Notes $'000 $'000 $'000 $'000
NOTES TO THE FINANCIAL STATEMENTS
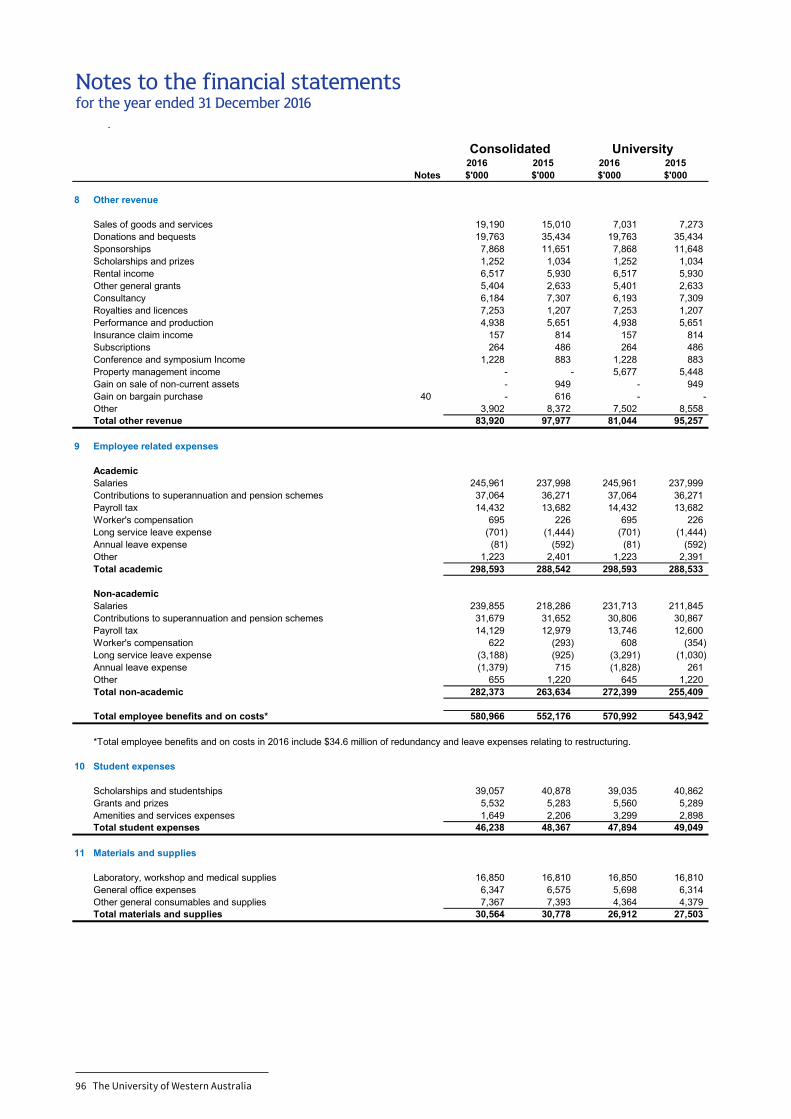
8 Other revenue
Sales of goods and services 19,190 15,010 7,031 7,273Donations and bequests 19,763 35,434 19,763 35,434Sponsorships 7,868 11,651 7,868 11,648Scholarships and prizes 1,252 1,034 1,252 1,034Rental income 6,517 5,930 6,517 5,930Other general grants 5,404 2,633 5,401 2,633Consultancy 6,184 7,307 6,193 7,309Royalties and licences 7,253 1,207 7,253 1,207Performance and production 4,938 5,651 4,938 5,651Insurance claim income 157 814 157 814Subscriptions 264 486 264 486Conference and symposium Income 1,228 883 1,228 883Property management income - - 5,677 5,448Gain on sale of non-current assets - 949 - 949Gain on bargain purchase 40 - 616 - -Other 3,902 8,372 7,502 8,558Total other revenue 83,920 97,977 81,044 95,257
9 Employee related expenses
AcademicSalaries 245,961 237,998 245,961 237,999Contributions to superannuation and pension schemes 37,064 36,271 37,064 36,271Payroll tax 14,432 13,682 14,432 13,682Worker's compensation 695 226 695 226Long service leave expense (701) (1,444) (701) (1,444)Annual leave expense (81) (592) (81) (592)Other 1,223 2,401 1,223 2,391Total academic 298,593 288,542 298,593 288,533
Non-academicSalaries 239,855 218,286 231,713 211,845Contributions to superannuation and pension schemes 31,679 31,652 30,806 30,867Payroll tax 14,129 12,979 13,746 12,600Worker's compensation 622 (293) 608 (354)Long service leave expense (3,188) (925) (3,291) (1,030)Annual leave expense (1,379) 715 (1,828) 261Other 655 1,220 645 1,220Total non-academic 282,373 263,634 272,399 255,409
Total employee benefits and on costs* 580,966 552,176 570,992 543,942
*Total employee benefits and on costs in 2016 include $34.6 million of redundancy and leave expenses relating to restructuring.
10 Student expenses
Scholarships and studentships 39,057 40,878 39,035 40,862Grants and prizes 5,532 5,283 5,560 5,289Amenities and services expenses 1,649 2,206 3,299 2,898Total student expenses 46,238 48,367 47,894 49,049
11 Materials and supplies
Laboratory, workshop and medical supplies 16,850 16,810 16,850 16,810General office expenses 6,347 6,575 5,698 6,314Other general consumables and supplies 7,367 7,393 4,364 4,379Total materials and supplies 30,564 30,778 26,912 27,503
Notes to the financial statements for the year ended 31 December 2016
96 The University of Western Australia
for the year ended 31 December 2016
Consolidated University2016 2015 2016 2015
Notes $'000 $'000 $'000 $'000
NOTES TO THE FINANCIAL STATEMENTS
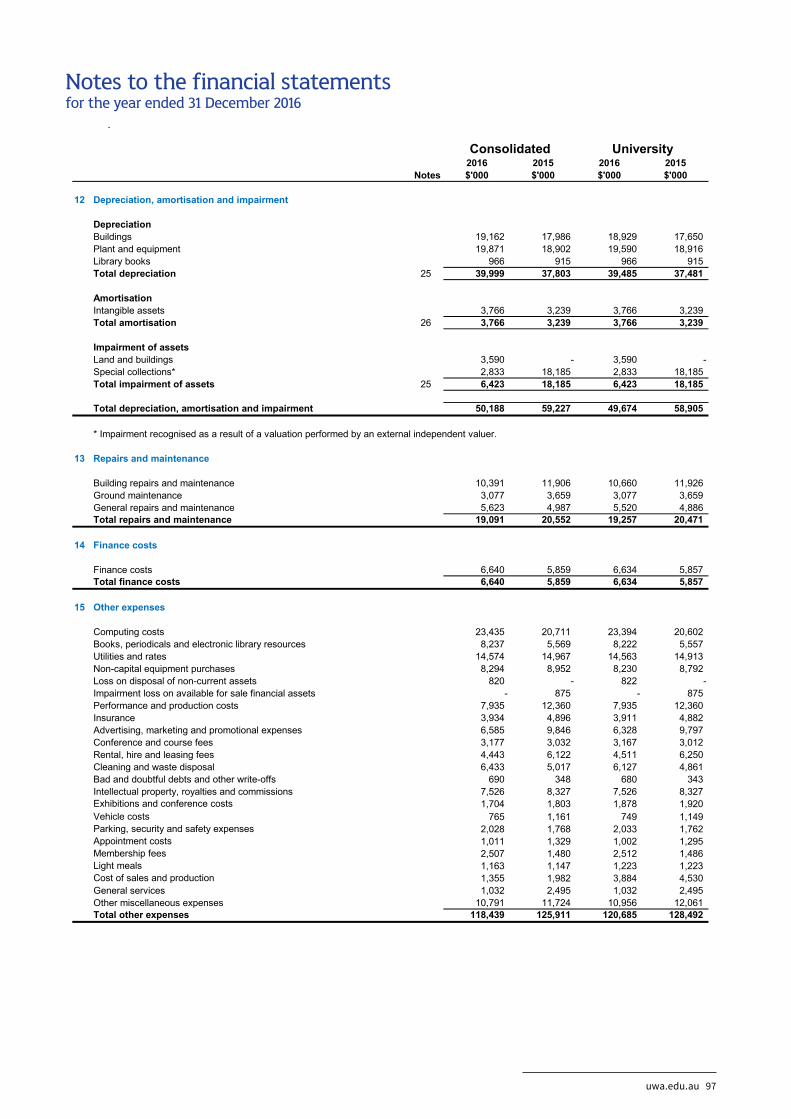
12 Depreciation, amortisation and impairment
DepreciationBuildings 19,162 17,986 18,929 17,650Plant and equipment 19,871 18,902 19,590 18,916Library books 966 915 966 915Total depreciation 25 39,999 37,803 39,485 37,481
AmortisationIntangible assets 3,766 3,239 3,766 3,239Total amortisation 26 3,766 3,239 3,766 3,239
Impairment of assetsLand and buildings 3,590 - 3,590 -Special collections* 2,833 18,185 2,833 18,185Total impairment of assets 25 6,423 18,185 6,423 18,185
Total depreciation, amortisation and impairment 50,188 59,227 49,674 58,905
* Impairment recognised as a result of a valuation performed by an external independent valuer.
13 Repairs and maintenance
Building repairs and maintenance 10,391 11,906 10,660 11,926Ground maintenance 3,077 3,659 3,077 3,659General repairs and maintenance 5,623 4,987 5,520 4,886Total repairs and maintenance 19,091 20,552 19,257 20,471
14 Finance costs
Finance costs 6,640 5,859 6,634 5,857Total finance costs 6,640 5,859 6,634 5,857
15 Other expenses
Computing costs 23,435 20,711 23,394 20,602Books, periodicals and electronic library resources 8,237 5,569 8,222 5,557Utilities and rates 14,574 14,967 14,563 14,913Non-capital equipment purchases 8,294 8,952 8,230 8,792Loss on disposal of non-current assets 820 - 822 -Impairment loss on available for sale financial assets - 875 - 875
Performance and production costs 7,935 12,360 7,935 12,360Insurance 3,934 4,896 3,911 4,882Advertising, marketing and promotional expenses 6,585 9,846 6,328 9,797Conference and course fees 3,177 3,032 3,167 3,012Rental, hire and leasing fees 4,443 6,122 4,511 6,250Cleaning and waste disposal 6,433 5,017 6,127 4,861Bad and doubtful debts and other write-offs 690 348 680 343Intellectual property, royalties and commissions 7,526 8,327 7,526 8,327Exhibitions and conference costs 1,704 1,803 1,878 1,920Vehicle costs 765 1,161 749 1,149Parking, security and safety expenses 2,028 1,768 2,033 1,762Appointment costs 1,011 1,329 1,002 1,295Membership fees 2,507 1,480 2,512 1,486Light meals 1,163 1,147 1,223 1,223Cost of sales and production 1,355 1,982 3,884 4,530General services 1,032 2,495 1,032 2,495Other miscellaneous expenses 10,791 11,724 10,956 12,061Total other expenses 118,439 125,911 120,685 128,492
Notes to the financial statements for the year ended 31 December 2016
uwa.edu.au 97
for the year ended 31 December 2016
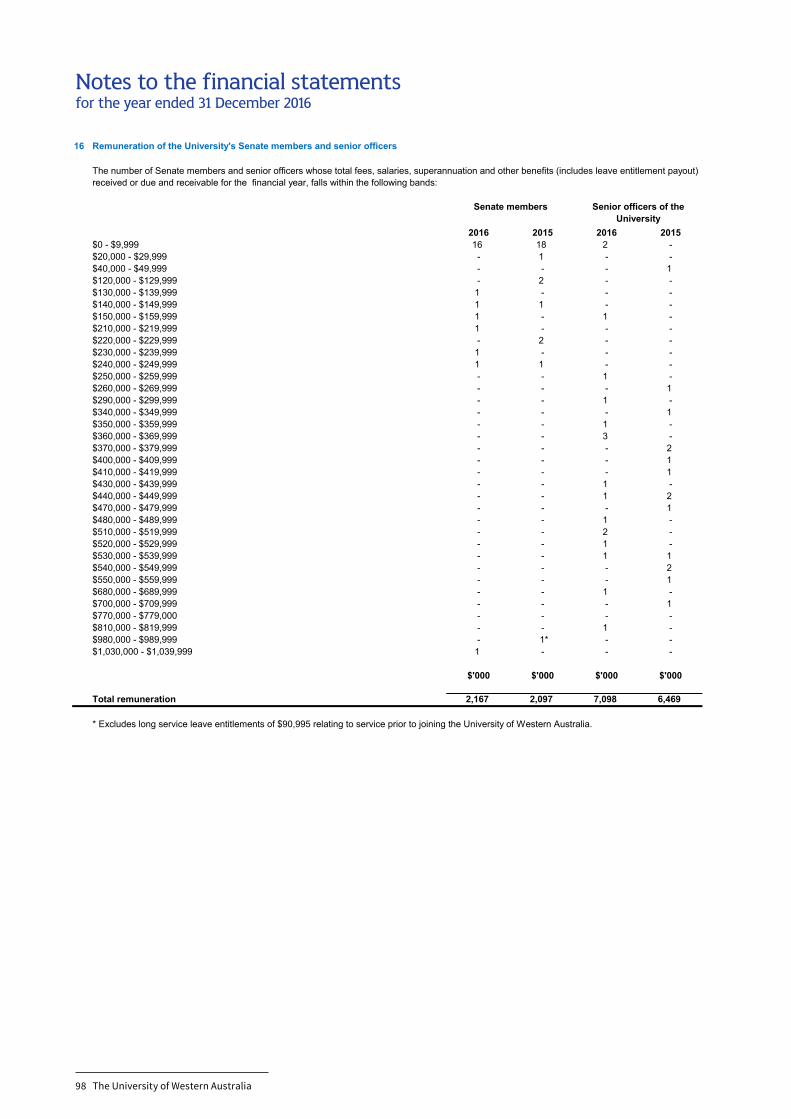
16 Remuneration of the University's Senate members and senior officers
2016 2015 2016 2015$0 - $9,999 16 18 2 -$20,000 - $29,999 - 1 - -$40,000 - $49,999 - - - 1$120,000 - $129,999 - 2 - -$130,000 - $139,999 1 - - -$140,000 - $149,999 1 1 - -$150,000 - $159,999 1 - 1 -$210,000 - $219,999 1 - - -$220,000 - $229,999 - 2 - -$230,000 - $239,999 1 - - -$240,000 - $249,999 1 1 - -$250,000 - $259,999 - - 1 -$260,000 - $269,999 - - - 1$290,000 - $299,999 - - 1 -$340,000 - $349,999 - - - 1$350,000 - $359,999 - - 1 -$360,000 - $369,999 - - 3 -$370,000 - $379,999 - - - 2$400,000 - $409,999 - - - 1$410,000 - $419,999 - - - 1$430,000 - $439,999 - - 1 -$440,000 - $449,999 - - 1 2$470,000 - $479,999 - - - 1$480,000 - $489,999 - - 1 -$510,000 - $519,999 - - 2 -$520,000 - $529,999 - - 1 -$530,000 - $539,999 - - 1 1$540,000 - $549,999 - - - 2$550,000 - $559,999 - - - 1$680,000 - $689,999 - - 1 -$700,000 - $709,999 - - - 1$770,000 - $779,000 - - - -$810,000 - $819,999 - - 1 -$980,000 - $989,999 - 1* - -$1,030,000 - $1,039,999 1 - - -
$'000 $'000 $'000 $'000
Total remuneration 2,167 2,097 7,098 6,469
* Excludes long service leave entitlements of $90,995 relating to service prior to joining the University of Western Australia.
NOTES TO THE FINANCIAL STATEMENTS
The number of Senate members and senior officers whose total fees, salaries, superannuation and other benefits (includes leave entitlement payout) received or due and receivable for the financial year, falls within the following bands:
Senate members Senior officers of the University
Notes to the financial statements for the year ended 31 December 2016
98 The University of Western Australia
for the year ended 31 December 2016NOTES TO THE FINANCIAL STATEMENTS
Consolidated University2016 2015 2016 2015$'000 $'000 $'000 $'000
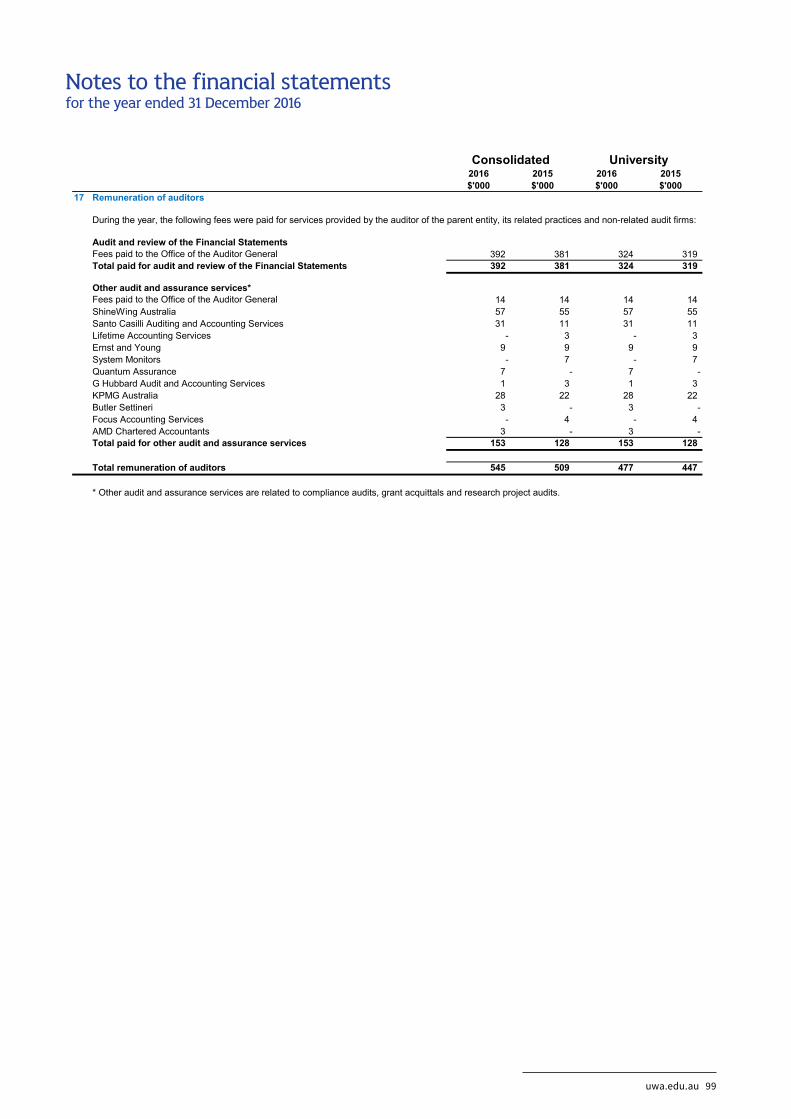
17 Remuneration of auditors
Audit and review of the Financial StatementsFees paid to the Office of the Auditor General 392 381 324 319Total paid for audit and review of the Financial Statements 392 381 324 319
Other audit and assurance services*Fees paid to the Office of the Auditor General 14 14 14 14ShineWing Australia 57 55 57 55Santo Casilli Auditing and Accounting Services 31 11 31 11Lifetime Accounting Services - 3 - 3Ernst and Young 9 9 9 9System Monitors - 7 - 7Quantum Assurance 7 - 7 -G Hubbard Audit and Accounting Services 1 3 1 3KPMG Australia 28 22 28 22Butler Settineri 3 - 3 -Focus Accounting Services - 4 - 4AMD Chartered Accountants 3 - 3 -Total paid for other audit and assurance services 153 128 153 128
Total remuneration of auditors 545 509 477 447
* Other audit and assurance services are related to compliance audits, grant acquittals and research project audits.
During the year, the following fees were paid for services provided by the auditor of the parent entity, its related practices and non-related audit firms:
Notes to the financial statements for the year ended 31 December 2016
uwa.edu.au 99
University2016 2015 2016 2015$'000 $'000 $'000 $'000
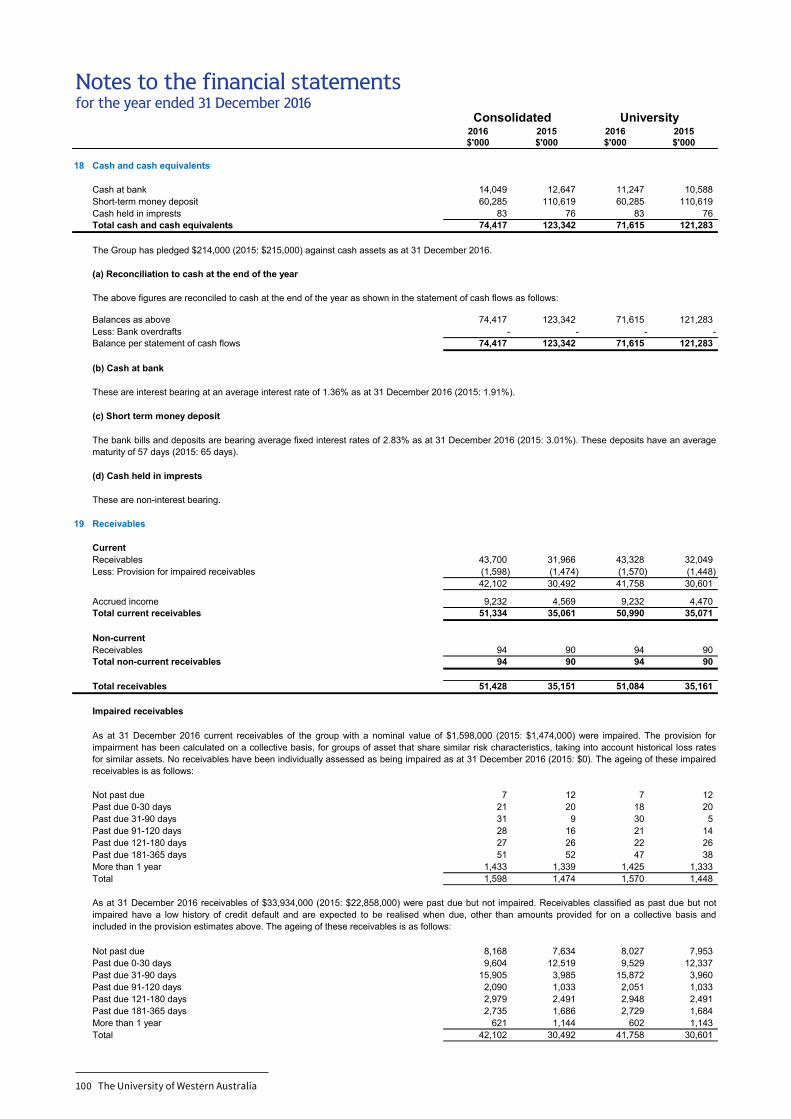
18 Cash and cash equivalents
Cash at bank 14,049 12,647 11,247 10,588Short-term money deposit 60,285 110,619 60,285 110,619Cash held in imprests 83 76 83 76Total cash and cash equivalents 74,417 123,342 71,615 121,283
The Group has pledged $214,000 (2015: $215,000) against cash assets as at 31 December 2016.
(a) Reconciliation to cash at the end of the year
Balances as above 74,417 123,342 71,615 121,283Less: Bank overdrafts - - - -Balance per statement of cash flows 74,417 123,342 71,615 121,283
(b) Cash at bank
These are interest bearing at an average interest rate of 1.36% as at 31 December 2016 (2015: 1.91%).
(c) Short term money deposit
(d) Cash held in imprests
These are non-interest bearing.
19 Receivables
CurrentReceivables 43,700 31,966 43,328 32,049Less: Provision for impaired receivables (1,598) (1,474) (1,570) (1,448)
42,102 30,492 41,758 30,601
Accrued income 9,232 4,569 9,232 4,470Total current receivables 51,334 35,061 50,990 35,071
Non-currentReceivables 94 90 94 90Total non-current receivables 94 90 94 90
Total receivables 51,428 35,151 51,084 35,161
Impaired receivables
Not past due 7 12 7 12Past due 0-30 days 21 20 18 20Past due 31-90 days 31 9 30 5Past due 91-120 days 28 16 21 14Past due 121-180 days 27 26 22 26Past due 181-365 days 51 52 47 38More than 1 year 1,433 1,339 1,425 1,333Total 1,598 1,474 1,570 1,448
Not past due 8,168 7,634 8,027 7,953Past due 0-30 days 9,604 12,519 9,529 12,337Past due 31-90 days 15,905 3,985 15,872 3,960Past due 91-120 days 2,090 1,033 2,051 1,033Past due 121-180 days 2,979 2,491 2,948 2,491Past due 181-365 days 2,735 1,686 2,729 1,684More than 1 year 621 1,144 602 1,143Total 42,102 30,492 41,758 30,601
The above figures are reconciled to cash at the end of the year as shown in the statement of cash flows as follows:
The bank bills and deposits are bearing average fixed interest rates of 2.83% as at 31 December 2016 (2015: 3.01%). These deposits have an averagematurity of 57 days (2015: 65 days).
As at 31 December 2016 receivables of $33,934,000 (2015: $22,858,000) were past due but not impaired. Receivables classified as past due but notimpaired have a low history of credit default and are expected to be realised when due, other than amounts provided for on a collective basis andincluded in the provision estimates above. The ageing of these receivables is as follows:
for the year ended 31 December 2016NOTES TO THE FINANCIAL STATEMENTS
Consolidated
As at 31 December 2016 current receivables of the group with a nominal value of $1,598,000 (2015: $1,474,000) were impaired. The provision forimpairment has been calculated on a collective basis, for groups of asset that share similar risk characteristics, taking into account historical loss ratesfor similar assets. No receivables have been individually assessed as being impaired as at 31 December 2016 (2015: $0). The ageing of these impairedreceivables is as follows:
Notes to the financial statements for the year ended 31 December 2016
100 The University of Western Australia
University2016 2015 2016 2015$'000 $'000 $'000 $'000
for the year ended 31 December 2016NOTES TO THE FINANCIAL STATEMENTS
Consolidated
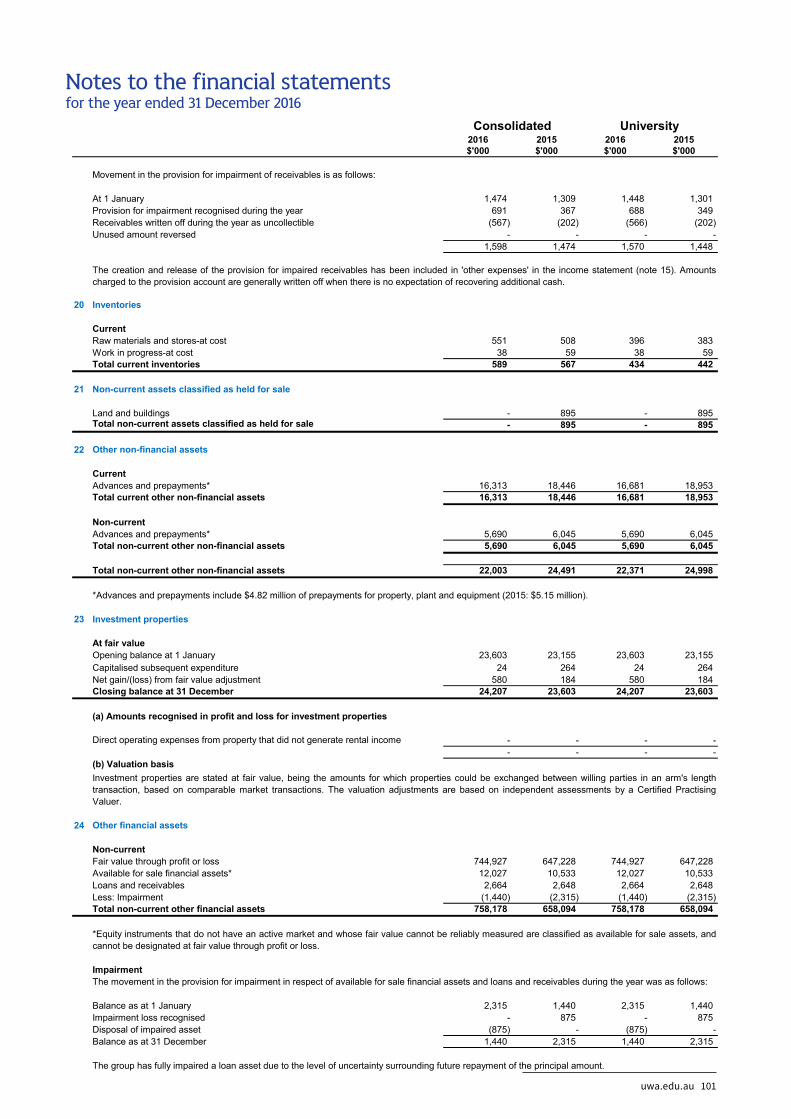
Movement in the provision for impairment of receivables is as follows:
At 1 January 1,474 1,309 1,448 1,301Provision for impairment recognised during the year 691 367 688 349Receivables written off during the year as uncollectible (567) (202) (566) (202)Unused amount reversed - - - -
1,598 1,474 1,570 1,448
20 Inventories
CurrentRaw materials and stores-at cost 551 508 396 383Work in progress-at cost 38 59 38 59Total current inventories 589 567 434 442
21 Non-current assets classified as held for sale
Land and buildings - 895 - 895Total non-current assets classified as held for sale - 895 - 895
22 Other non-financial assets
CurrentAdvances and prepayments* 16,313 18,446 16,681 18,953Total current other non-financial assets 16,313 18,446 16,681 18,953
Non-currentAdvances and prepayments* 5,690 6,045 5,690 6,045Total non-current other non-financial assets 5,690 6,045 5,690 6,045
Total non-current other non-financial assets 22,003 24,491 22,371 24,998
23 Investment properties
At fair valueOpening balance at 1 January 23,603 23,155 23,603 23,155Capitalised subsequent expenditure 24 264 24 264Net gain/(loss) from fair value adjustment 580 184 580 184Closing balance at 31 December 24,207 23,603 24,207 23,603
(a) Amounts recognised in profit and loss for investment properties
Direct operating expenses from property that did not generate rental income - - - -- - - -
(b) Valuation basis
24 Other financial assets
Non-currentFair value through profit or loss 744,927 647,228 744,927 647,228Available for sale financial assets* 12,027 10,533 12,027 10,533Loans and receivables 2,664 2,648 2,664 2,648Less: Impairment (1,440) (2,315) (1,440) (2,315)Total non-current other financial assets 758,178 658,094 758,178 658,094
Impairment
Balance as at 1 January 2,315 1,440 2,315 1,440Impairment loss recognised - 875 - 875Disposal of impaired asset (875) - (875) -Balance as at 31 December 1,440 2,315 1,440 2,315
*Equity instruments that do not have an active market and whose fair value cannot be reliably measured are classified as available for sale assets, andcannot be designated at fair value through profit or loss.
The creation and release of the provision for impaired receivables has been included in 'other expenses' in the income statement (note 15). Amountscharged to the provision account are generally written off when there is no expectation of recovering additional cash.
*Advances and prepayments include $4.82 million of prepayments for property, plant and equipment (2015: $5.15 million).
The movement in the provision for impairment in respect of available for sale financial assets and loans and receivables during the year was as follows:
Investment properties are stated at fair value, being the amounts for which properties could be exchanged between willing parties in an arm's lengthtransaction, based on comparable market transactions. The valuation adjustments are based on independent assessments by a Certified PractisingValuer.
The group has fully impaired a loan asset due to the level of uncertainty surrounding future repayment of the principal amount.
Notes to the financial statements for the year ended 31 December 2016
uwa.edu.au 101
25Pr
oper
ty, p
lant
and
equ
ipm
ent
Free
hold
Le
aseh
old
Bui
ldin
gsW
ork
inPl
ant a
nd
Art
wor
ksLi
brar
ySp
ecia
l TO
TAL
land
land
prog
ress
equi
pmen
tbo
oks
colle
ctio
nsN
otes
$'00
0$'
000
$'00
0$'
000
$'00
0$'
000
$'00
0$'
000
$'00
0
2016
Con
solid
ated
At 1
Jan
uary
201
6C
ost
188,
492
80,0
0094
7,78
045
,108
245,
681
27,7
829,
453
64,8
091,
609,
105
Acc
umul
ated
dep
reci
atio
n-
-(1
50,5
37)
-(1
66,2
34)
-(3
,663
)-
(320
,434
)A
ccum
ulat
ed im
pairm
ent
--
(53)
-(1
47)
--
(18,
185)
(18,
385)
Net
boo
k va
lue
188,
492
80,0
0079
7,19
045
,108
79,3
0027
,782
5,79
046
,624
1,27
0,28
6
Year
end
ed 3
1 D
ecem
ber 2
016
Ope
ning
net
boo
k va
lue
188,
492
80,0
0079
7,19
045
,108
79,3
0027
,782
5,79
046
,624
1,27
0,28
6A
dditi
ons
51-
1,82
842
,344
11,0
6262
644
452
56,4
07D
ispo
sals
--
(12)
-(1
,068
)-
-(3
2)(1
,112
)D
epre
ciat
ion
12-
-(1
9,16
2)-
(19,
871)
-(9
66)
-(3
9,99
9)Im
pairm
ent
(674
)-
(2,9
16)
--
--
(2,8
33)
(6,4
23)
Tran
sfer
--
75,1
16(7
5,17
6)60
--
--
Clo
sing
net
boo
k va
lue
187,
869
80,0
0085
2,04
412
,276
69,4
8328
,408
5,26
843
,811
1,27
9,15
9
At 3
1 D
ecem
ber 2
016
Cos
t18
8,54
380
,000
1,02
4,71
612
,276
245,
392
28,4
089,
896
64,8
291,
654,
060
Acc
umul
ated
dep
reci
atio
n-
-(1
69,7
03)
-(1
75,9
09)
-(4
,628
)-
(350
,240
)A
ccum
ulat
ed im
pairm
ent
(674
)-
(2,9
69)
--
--
(21,
018)
(24,
661)
Net
boo
k va
lue
187,
869
80,0
0085
2,04
412
,276
69,4
8328
,408
5,26
843
,811
1,27
9,15
9
NO
TES
TO
TH
E F
INA
NC
IAL
STA
TEM
EN
TSfo
r the
yea
r end
ed 3
1 D
ecem
ber 2
016
Not
es t
o t
he
fin
anci
al s
tate
men
ts
for
the
year
en
ded
31
Dec
emb
er 2
016
102 The University of Western Australia
25Pr
oper
ty, p
lant
and
equ
ipm
ent
Free
hold
Le
aseh
old
Bui
ldin
gsW
ork
inPl
ant a
nd
Art
wor
ksLi
brar
ySp
ecia
l TO
TAL
land
land
prog
ress
equi
pmen
tbo
oks
colle
ctio
nsN
otes
$'00
0$'
000
$'00
0$'
000
$'00
0$'
000
$'00
0$'
000
$'00
0
2016
Con
solid
ated
At 1
Jan
uary
201
6C
ost
188,
492
80,0
0094
7,78
045
,108
245,
681
27,7
829,
453
64,8
091,
609,
105
Acc
umul
ated
dep
reci
atio
n-
-(1
50,5
37)
-(1
66,2
34)
-(3
,663
)-
(320
,434
)A
ccum
ulat
ed im
pairm
ent
--
(53)
-(1
47)
--
(18,
185)
(18,
385)
Net
boo
k va
lue
188,
492
80,0
0079
7,19
045
,108
79,3
0027
,782
5,79
046
,624
1,27
0,28
6
Year
end
ed 3
1 D
ecem
ber 2
016
Ope
ning
net
boo
k va
lue
188,
492
80,0
0079
7,19
045
,108
79,3
0027
,782
5,79
046
,624
1,27
0,28
6A
dditi
ons
51-
1,82
842
,344
11,0
6262
644
452
56,4
07D
ispo
sals
--
(12)
-(1
,068
)-
-(3
2)(1
,112
)D
epre
ciat
ion
12-
-(1
9,16
2)-
(19,
871)
-(9
66)
-(3
9,99
9)Im
pairm
ent
(674
)-
(2,9
16)
--
--
(2,8
33)
(6,4
23)
Tran
sfer
--
75,1
16(7
5,17
6)60
--
--
Clo
sing
net
boo
k va
lue
187,
869
80,0
0085
2,04
412
,276
69,4
8328
,408
5,26
843
,811
1,27
9,15
9
At 3
1 D
ecem
ber 2
016
Cos
t18
8,54
380
,000
1,02
4,71
612
,276
245,
392
28,4
089,
896
64,8
291,
654,
060
Acc
umul
ated
dep
reci
atio
n-
-(1
69,7
03)
-(1
75,9
09)
-(4
,628
)-
(350
,240
)A
ccum
ulat
ed im
pairm
ent
(674
)-
(2,9
69)
--
--
(21,
018)
(24,
661)
Net
boo
k va
lue
187,
869
80,0
0085
2,04
412
,276
69,4
8328
,408
5,26
843
,811
1,27
9,15
9
NO
TES
TO
TH
E F
INA
NC
IAL
STA
TEM
EN
TSfo
r the
yea
r end
ed 3
1 D
ecem
ber 2
016
25Pr
oper
ty, p
lant
and
equ
ipm
ent
Free
hold
Le
aseh
old
Bui
ldin
gsW
ork
inPl
ant a
nd
Art
wor
ksLi
brar
ySp
ecia
l TO
TAL
land
land
prog
ress
equi
pmen
tbo
oks
colle
ctio
nsN
otes
$'00
0$'
000
$'00
0$'
000
$'00
0$'
000
$'00
0$'
000
$'00
0
NO
TES
TO
TH
E F
INA
NC
IAL
STA
TEM
EN
TSfo
r the
yea
r end
ed 3
1 D
ecem
ber 2
016
2016
Uni
vers
ity
At 1
Jan
uary
201
6C
ost
188,
492
80,0
0094
5,90
945
,099
244,
327
27,7
829,
453
64,8
091,
605,
871
Acc
umul
ated
dep
reci
atio
n-
-(1
49,9
63)
-(1
65,8
44)
-(3
,663
)-
(319
,470
)A
ccum
ulat
ed im
pairm
ent
--
(53)
-(1
47)
--
(18,
185)
(18,
385)
Net
boo
k va
lue
188,
492
80,0
0079
5,89
345
,099
78,3
3627
,782
5,79
046
,624
1,26
8,01
6
Year
end
ed 3
1 D
ecem
ber 2
016
Ope
ning
net
boo
k va
lue
188,
492
80,0
0079
5,89
345
,099
78,3
3627
,782
5,79
046
,624
1,26
8,01
6A
dditi
ons
51-
1,81
942
,106
10,3
3762
644
452
55,4
35D
ispo
sals
--
--
(660
)-
-(3
2)(6
92)
Dep
reci
atio
n12
--
(18,
929)
-(1
9,59
0)-
(966
)-
(39,
485)
Impa
irmen
t(6
74)
-(2
,916
)-
--
-(2
,833
)(6
,423
)Tr
ansf
er-
-75
,092
(75,
092)
--
--
-C
losi
ng n
et b
ook
valu
e18
7,86
980
,000
850,
959
12,1
1368
,423
28,4
085,
268
43,8
111,
276,
851
At 3
1 D
ecem
ber 2
016
Cos
t18
8,54
380
,000
1,02
2,82
112
,113
243,
677
28,4
089,
897
64,8
291,
650,
288
Acc
umul
ated
dep
reci
atio
n-
-(1
68,8
93)
-(1
75,2
54)
-(4
,629
)-
(348
,776
)A
ccum
ulat
ed im
pairm
ent
(674
)-
(2,9
69)
--
--
(21,
018)
(24,
661)
Net
boo
k va
lue
187,
869
80,0
0085
0,95
912
,113
68,4
2328
,408
5,26
843
,811
1,27
6,85
1
Not
es t
o t
he
fin
anci
al s
tate
men
ts
for
the
year
en
ded
31
Dec
emb
er 2
016
uwa.edu.au 103
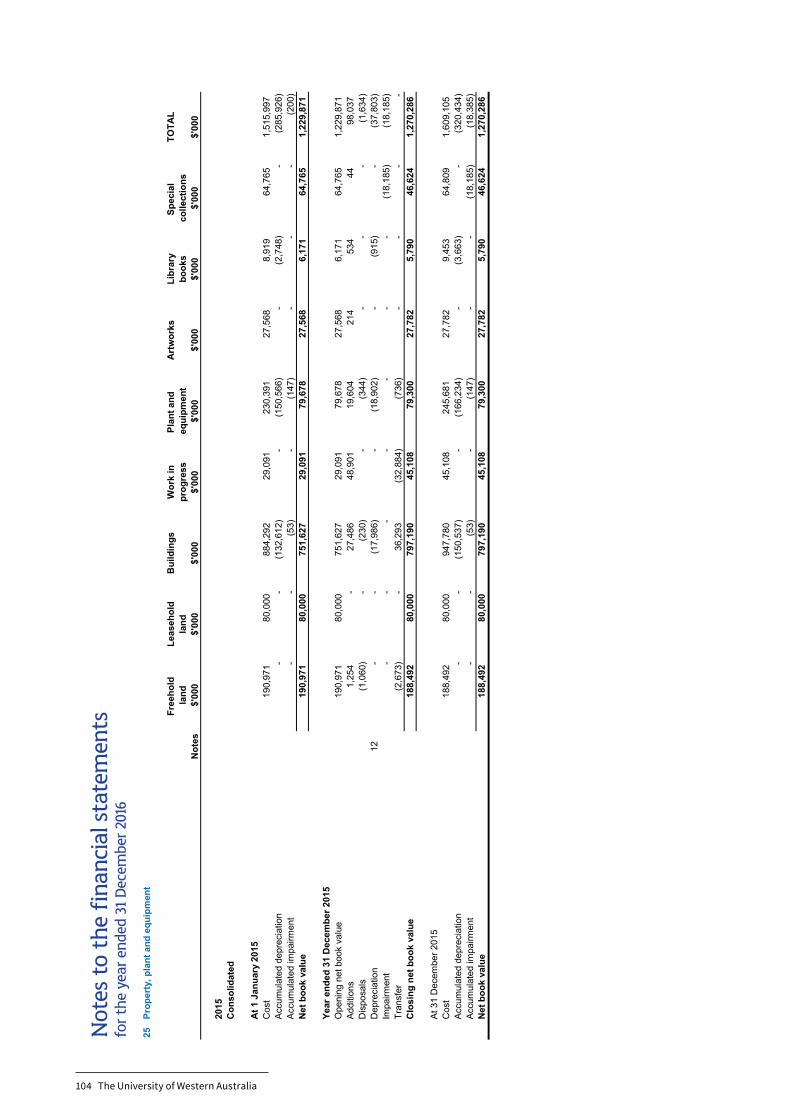
25Pr
oper
ty, p
lant
and
equ
ipm
ent
Free
hold
Le
aseh
old
Bui
ldin
gsW
ork
inPl
ant a
nd
Art
wor
ksLi
brar
ySp
ecia
l TO
TAL
land
land
prog
ress
equi
pmen
tbo
oks
colle
ctio
nsN
otes
$'00
0$'
000
$'00
0$'
000
$'00
0$'
000
$'00
0$'
000
$'00
0
NO
TES
TO
TH
E F
INA
NC
IAL
STA
TEM
EN
TSfo
r the
yea
r end
ed 3
1 D
ecem
ber 2
016
2015
Con
solid
ated
At 1
Jan
uary
201
5C
ost
190,
971
80,0
0088
4,29
229
,091
230,
391
27,5
688,
919
64,7
651,
515,
997
Acc
umul
ated
dep
reci
atio
n-
-(1
32,6
12)
-(1
50,5
66)
-(2
,748
)-
(285
,926
)A
ccum
ulat
ed im
pairm
ent
--
(53)
-(1
47)
--
-(2
00)
Net
boo
k va
lue
190,
971
80,0
0075
1,62
729
,091
79,6
7827
,568
6,17
164
,765
1,22
9,87
1
Year
end
ed 3
1 D
ecem
ber 2
015
Ope
ning
net
boo
k va
lue
190,
971
80,0
0075
1,62
729
,091
79,6
7827
,568
6,17
164
,765
1,22
9,87
1A
dditi
ons
1,25
4-
27,4
8648
,901
19,6
0421
453
444
98,0
37D
ispo
sals
(1,0
60)
-(2
30)
-(3
44)
--
-(1
,634
)D
epre
ciat
ion
12-
-(1
7,98
6)-
(18,
902)
-(9
15)
-(3
7,80
3)Im
pairm
ent
--
--
--
-(1
8,18
5)(1
8,18
5)Tr
ansf
er(2
,673
)-
36,2
93(3
2,88
4)(7
36)
--
--
Clo
sing
net
boo
k va
lue
188,
492
80,0
0079
7,19
045
,108
79,3
0027
,782
5,79
046
,624
1,27
0,28
6
At 3
1 D
ecem
ber 2
015
Cos
t18
8,49
280
,000
947,
780
45,1
0824
5,68
127
,782
9,45
364
,809
1,60
9,10
5A
ccum
ulat
ed d
epre
ciat
ion
--
(150
,537
)-
(166
,234
)-
(3,6
63)
-(3
20,4
34)
Acc
umul
ated
impa
irmen
t-
-(5
3)-
(147
)-
-(1
8,18
5)(1
8,38
5)N
et b
ook
valu
e18
8,49
280
,000
797,
190
45,1
0879
,300
27,7
825,
790
46,6
241,
270,
286
Not
es t
o t
he
fin
anci
al s
tate
men
ts
for
the
year
en
ded
31
Dec
emb
er 2
016
104 The University of Western Australia
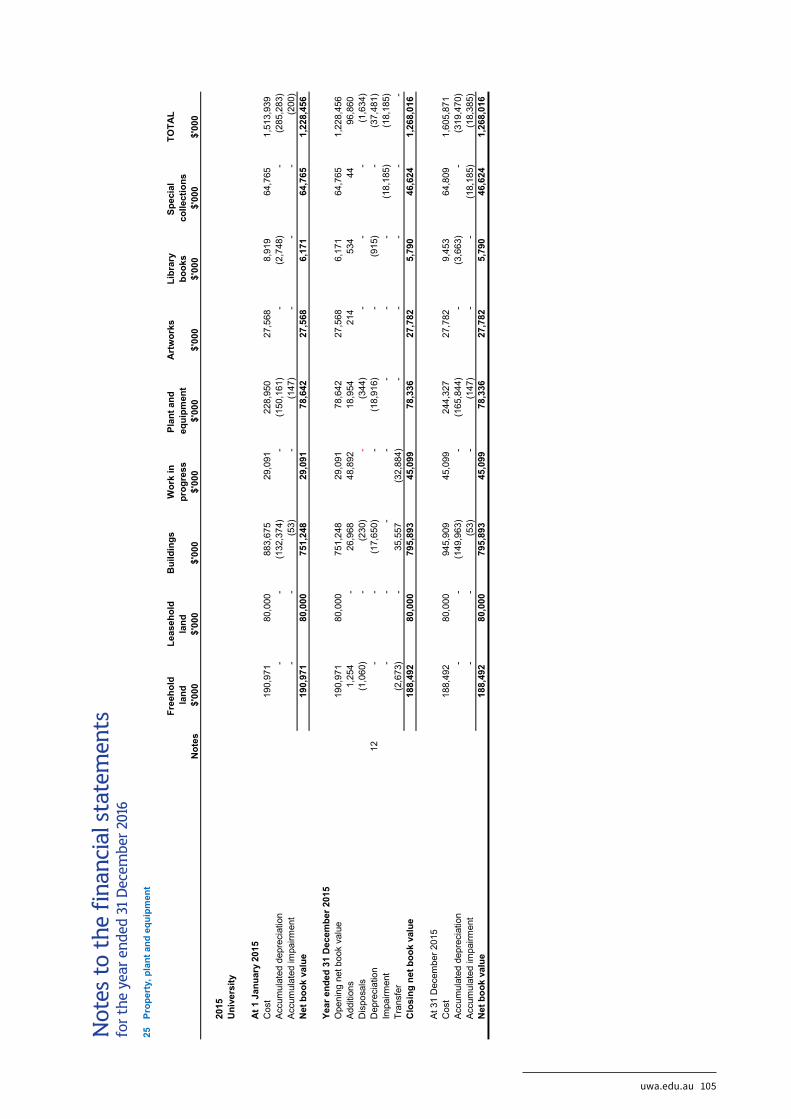
25Pr
oper
ty, p
lant
and
equ
ipm
ent
Free
hold
Le
aseh
old
Bui
ldin
gsW
ork
inPl
ant a
nd
Art
wor
ksLi
brar
ySp
ecia
l TO
TAL
land
land
prog
ress
equi
pmen
tbo
oks
colle
ctio
nsN
otes
$'00
0$'
000
$'00
0$'
000
$'00
0$'
000
$'00
0$'
000
$'00
0
NO
TES
TO
TH
E F
INA
NC
IAL
STA
TEM
EN
TSfo
r the
yea
r end
ed 3
1 D
ecem
ber 2
016
2015
Uni
vers
ity
At 1
Jan
uary
201
5C
ost
190,
971
80,0
0088
3,67
529
,091
228,
950
27,5
688,
919
64,7
651,
513,
939
Acc
umul
ated
dep
reci
atio
n-
-(1
32,3
74)
-(1
50,1
61)
-(2
,748
)-
(285
,283
)A
ccum
ulat
ed im
pairm
ent
--
(53)
-(1
47)
--
-(2
00)
Net
boo
k va
lue
190,
971
80,0
0075
1,24
829
,091
78,6
4227
,568
6,17
164
,765
1,22
8,45
6
Year
end
ed 3
1 D
ecem
ber 2
015
Ope
ning
net
boo
k va
lue
190,
971
80,0
0075
1,24
829
,091
78,6
4227
,568
6,17
164
,765
1,22
8,45
6A
dditi
ons
1,25
4-
26,9
6848
,892
18,9
5421
453
444
96,8
60D
ispo
sals
(1,0
60)
-(2
30)
-(3
44)
--
-(1
,634
)D
epre
ciat
ion
12-
-(1
7,65
0)-
(18,
916)
-(9
15)
-(3
7,48
1)Im
pairm
ent
--
--
--
-(1
8,18
5)(1
8,18
5)Tr
ansf
er(2
,673
)-
35,5
57(3
2,88
4)-
--
--
Clo
sing
net
boo
k va
lue
188,
492
80,0
0079
5,89
345
,099
78,3
3627
,782
5,79
046
,624
1,26
8,01
6
At 3
1 D
ecem
ber 2
015
Cos
t18
8,49
280
,000
945,
909
45,0
9924
4,32
727
,782
9,45
364
,809
1,60
5,87
1A
ccum
ulat
ed d
epre
ciat
ion
--
(149
,963
)-
(165
,844
)-
(3,6
63)
-(3
19,4
70)
Acc
umul
ated
impa
irmen
t-
-(5
3)-
(147
)-
-(1
8,18
5)(1
8,38
5)N
et b
ook
valu
e18
8,49
280
,000
795,
893
45,0
9978
,336
27,7
825,
790
46,6
241,
268,
016
Not
es t
o t
he
fin
anci
al s
tate
men
ts
for
the
year
en
ded
31
Dec
emb
er 2
016
uwa.edu.au 105
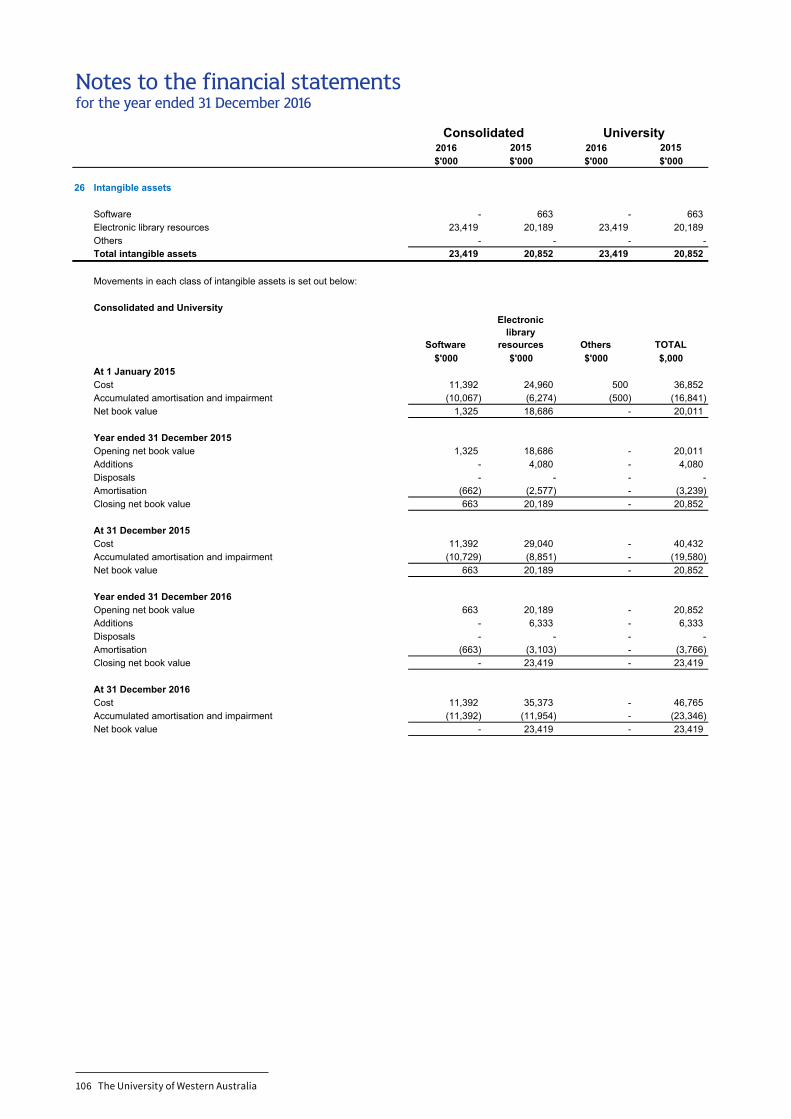
2016 2015 2016 2015$'000 $'000 $'000 $'000
26 Intangible assets
Software - 663 - 663Electronic library resources 23,419 20,189 23,419 20,189Others - - - -Total intangible assets 23,419 20,852 23,419 20,852
Movements in each class of intangible assets is set out below:
Consolidated and University
Software
Electroniclibrary
resources Others TOTAL$'000 $'000 $'000 $,000
At 1 January 2015Cost 11,392 24,960 500 36,852Accumulated amortisation and impairment (10,067) (6,274) (500) (16,841)Net book value 1,325 18,686 - 20,011
Year ended 31 December 2015Opening net book value 1,325 18,686 - 20,011Additions - 4,080 - 4,080Disposals - - - -Amortisation (662) (2,577) - (3,239)Closing net book value 663 20,189 - 20,852
At 31 December 2015Cost 11,392 29,040 - 40,432Accumulated amortisation and impairment (10,729) (8,851) - (19,580)Net book value 663 20,189 - 20,852
Year ended 31 December 2016Opening net book value 663 20,189 - 20,852Additions - 6,333 - 6,333Disposals - - - -Amortisation (663) (3,103) - (3,766)Closing net book value - 23,419 - 23,419
At 31 December 2016Cost 11,392 35,373 - 46,765Accumulated amortisation and impairment (11,392) (11,954) - (23,346)Net book value - 23,419 - 23,419
NOTES TO THE FINANCIAL STATEMENTSfor the year ended 31 December 2016
Consolidated University
Notes to the financial statements for the year ended 31 December 2016
106 The University of Western Australia
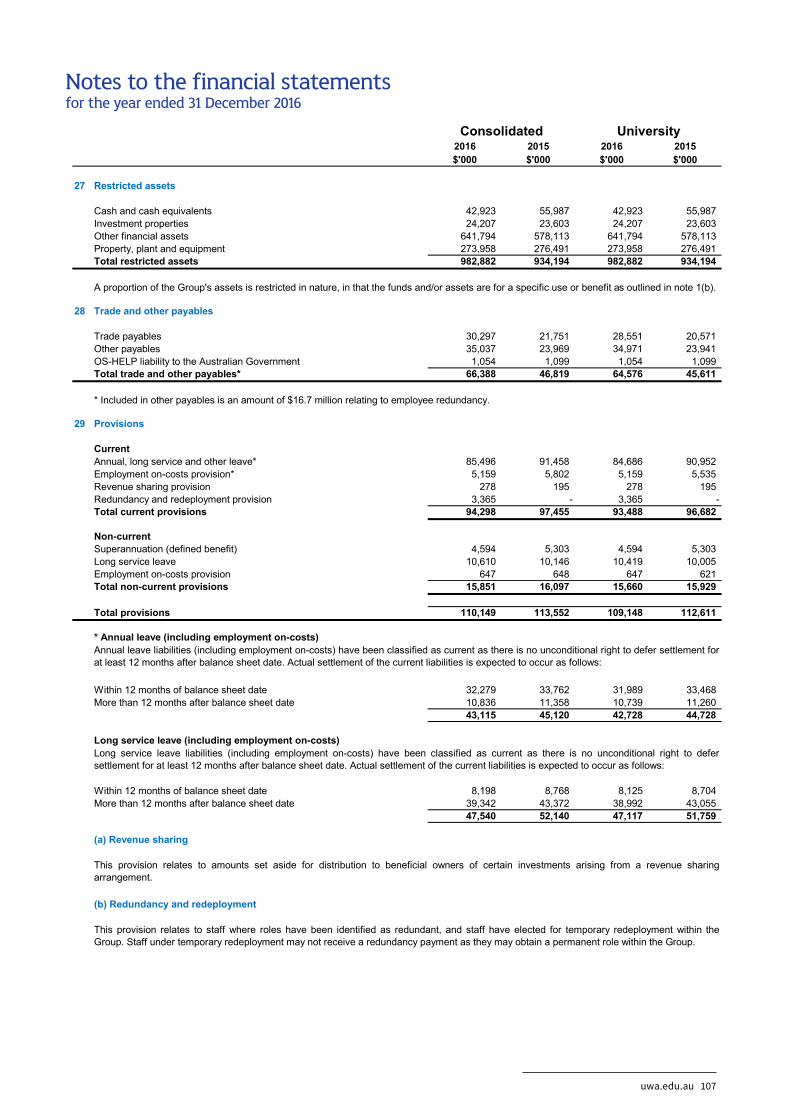
Consolidated University2016 2015 2016 2015$'000 $'000 $'000 $'000
27 Restricted assets
Cash and cash equivalents 42,923 55,987 42,923 55,987Investment properties 24,207 23,603 24,207 23,603Other financial assets 641,794 578,113 641,794 578,113Property, plant and equipment 273,958 276,491 273,958 276,491Total restricted assets 982,882 934,194 982,882 934,194
28 Trade and other payables
Trade payables 30,297 21,751 28,551 20,571Other payables 35,037 23,969 34,971 23,941OS-HELP liability to the Australian Government 1,054 1,099 1,054 1,099Total trade and other payables* 66,388 46,819 64,576 45,611
* Included in other payables is an amount of $16.7 million relating to employee redundancy.
29 Provisions
CurrentAnnual, long service and other leave* 85,496 91,458 84,686 90,952Employment on-costs provision* 5,159 5,802 5,159 5,535Revenue sharing provision 278 195 278 195Redundancy and redeployment provision 3,365 - 3,365 -Total current provisions 94,298 97,455 93,488 96,682
Non-current Superannuation (defined benefit) 4,594 5,303 4,594 5,303Long service leave 10,610 10,146 10,419 10,005Employment on-costs provision 647 648 647 621Total non-current provisions 15,851 16,097 15,660 15,929
Total provisions 110,149 113,552 109,148 112,611
* Annual leave (including employment on-costs)
Within 12 months of balance sheet date 32,279 33,762 31,989 33,468More than 12 months after balance sheet date 10,836 11,358 10,739 11,260
43,115 45,120 42,728 44,728
Long service leave (including employment on-costs)
Within 12 months of balance sheet date 8,198 8,768 8,125 8,704More than 12 months after balance sheet date 39,342 43,372 38,992 43,055
47,540 52,140 47,117 51,759
(a) Revenue sharing
(b) Redundancy and redeployment
for the year ended 31 December 2016NOTES TO THE FINANCIAL STATEMENTS
A proportion of the Group's assets is restricted in nature, in that the funds and/or assets are for a specific use or benefit as outlined in note 1(b).
This provision relates to amounts set aside for distribution to beneficial owners of certain investments arising from a revenue sharingarrangement.
Annual leave liabilities (including employment on-costs) have been classified as current as there is no unconditional right to defer settlement forat least 12 months after balance sheet date. Actual settlement of the current liabilities is expected to occur as follows:
This provision relates to staff where roles have been identified as redundant, and staff have elected for temporary redeployment within theGroup. Staff under temporary redeployment may not receive a redundancy payment as they may obtain a permanent role within the Group.
Long service leave liabilities (including employment on-costs) have been classified as current as there is no unconditional right to defersettlement for at least 12 months after balance sheet date. Actual settlement of the current liabilities is expected to occur as follows:
Notes to the financial statements for the year ended 31 December 2016
uwa.edu.au 107
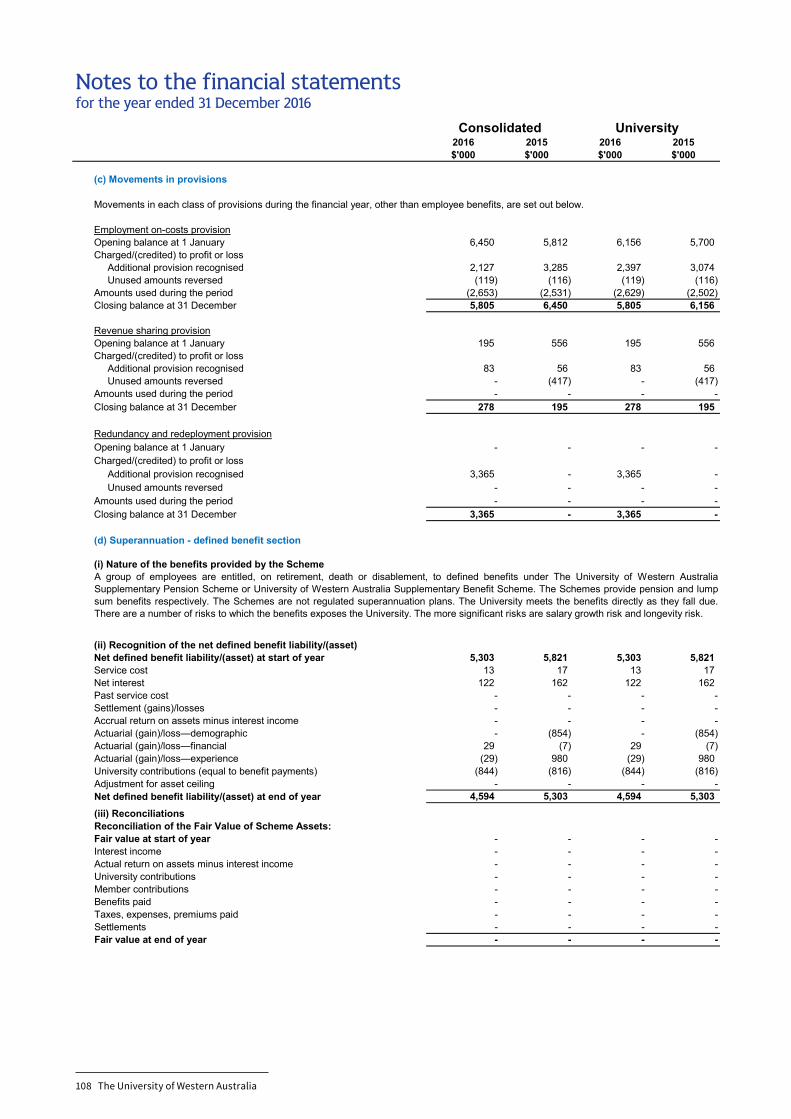
for the year ended 31 December 2016NOTES TO THE FINANCIAL STATEMENTS
Consolidated University2016 2015 2016 2015$'000 $'000 $'000 $'000
(c) Movements in provisions
Movements in each class of provisions during the financial year, other than employee benefits, are set out below.
Employment on-costs provisionOpening balance at 1 January 6,450 5,812 6,156 5,700Charged/(credited) to profit or loss Additional provision recognised 2,127 3,285 2,397 3,074 Unused amounts reversed (119) (116) (119) (116)Amounts used during the period (2,653) (2,531) (2,629) (2,502)Closing balance at 31 December 5,805 6,450 5,805 6,156
Revenue sharing provisionOpening balance at 1 January 195 556 195 556Charged/(credited) to profit or loss Additional provision recognised 83 56 83 56 Unused amounts reversed - (417) - (417)Amounts used during the period - - - -Closing balance at 31 December 278 195 278 195
Redundancy and redeployment provisionOpening balance at 1 January - - - -Charged/(credited) to profit or loss Additional provision recognised 3,365 - 3,365 - Unused amounts reversed - - - -Amounts used during the period - - - -Closing balance at 31 December 3,365 - 3,365 -
(d) Superannuation - defined benefit section
(i) Nature of the benefits provided by the Scheme
(ii) Recognition of the net defined benefit liability/(asset)Net defined benefit liability/(asset) at start of year 5,303 5,821 5,303 5,821Service cost 13 17 13 17Net interest 122 162 122 162Past service cost - - - -Settlement (gains)/losses - - - -Accrual return on assets minus interest income - - - -Actuarial (gain)/loss—demographic - (854) - (854)Actuarial (gain)/loss—financial 29 (7) 29 (7)Actuarial (gain)/loss—experience (29) 980 (29) 980University contributions (equal to benefit payments) (844) (816) (844) (816)Adjustment for asset ceiling - - - -Net defined benefit liability/(asset) at end of year 4,594 5,303 4,594 5,303(iii) ReconciliationsReconciliation of the Fair Value of Scheme Assets:Fair value at start of year - - - -Interest income - - - -Actual return on assets minus interest income - - - -University contributions - - - -Member contributions - - - -Benefits paid - - - -Taxes, expenses, premiums paid - - - -Settlements - - - -Fair value at end of year - - - -
A group of employees are entitled, on retirement, death or disablement, to defined benefits under The University of Western AustraliaSupplementary Pension Scheme or University of Western Australia Supplementary Benefit Scheme. The Schemes provide pension and lumpsum benefits respectively. The Schemes are not regulated superannuation plans. The University meets the benefits directly as they fall due.There are a number of risks to which the benefits exposes the University. The more significant risks are salary growth risk and longevity risk.
Notes to the financial statements for the year ended 31 December 2016
108 The University of Western Australia
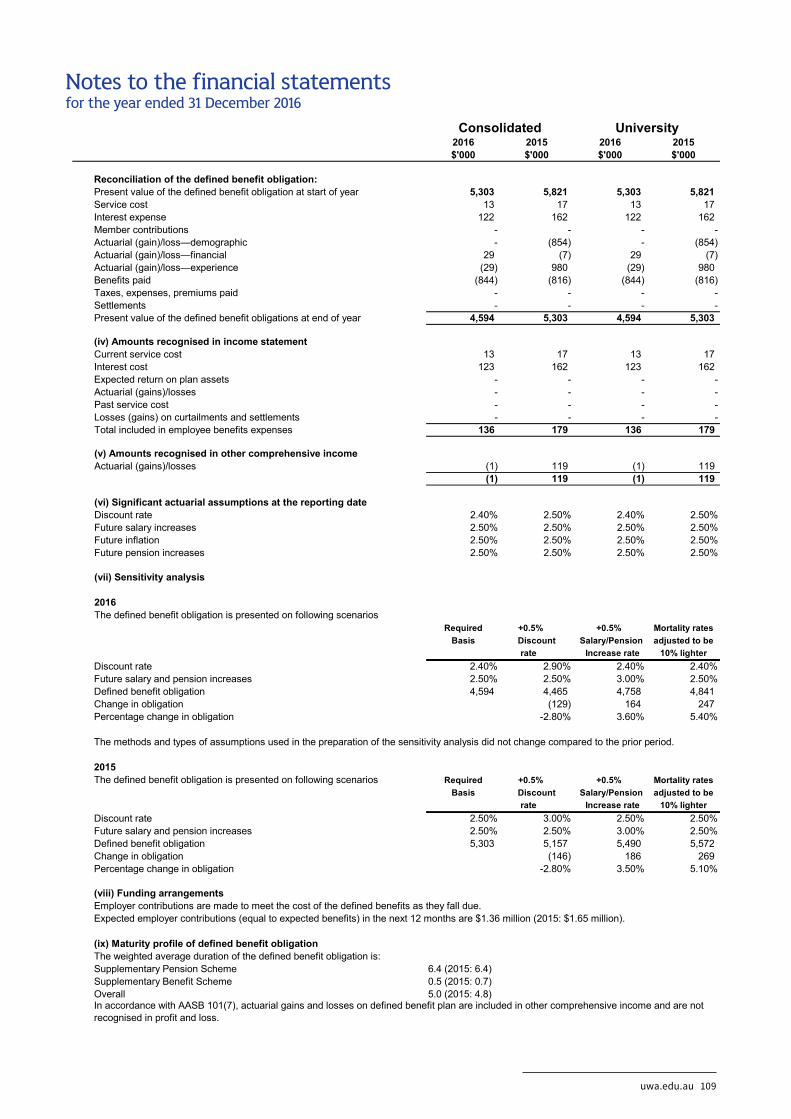
for the year ended 31 December 2016NOTES TO THE FINANCIAL STATEMENTS
Consolidated University2016 2015 2016 2015$'000 $'000 $'000 $'000
Reconciliation of the defined benefit obligation:Present value of the defined benefit obligation at start of year 5,303 5,821 5,303 5,821Service cost 13 17 13 17Interest expense 122 162 122 162Member contributions - - - -Actuarial (gain)/loss—demographic - (854) - (854)Actuarial (gain)/loss—financial 29 (7) 29 (7)Actuarial (gain)/loss—experience (29) 980 (29) 980Benefits paid (844) (816) (844) (816)Taxes, expenses, premiums paid - - - -Settlements - - - -Present value of the defined benefit obligations at end of year 4,594 5,303 4,594 5,303
(iv) Amounts recognised in income statementCurrent service cost 13 17 13 17Interest cost 123 162 123 162Expected return on plan assets - - - -Actuarial (gains)/losses - - - -Past service cost - - - -Losses (gains) on curtailments and settlements - - - -Total included in employee benefits expenses 136 179 136 179
(v) Amounts recognised in other comprehensive incomeActuarial (gains)/losses (1) 119 (1) 119
(1) 119 (1) 119
(vi) Significant actuarial assumptions at the reporting dateDiscount rate 2.40% 2.50% 2.40% 2.50%Future salary increases 2.50% 2.50% 2.50% 2.50%Future inflation 2.50% 2.50% 2.50% 2.50%Future pension increases 2.50% 2.50% 2.50% 2.50%
(vii) Sensitivity analysis
2016The defined benefit obligation is presented on following scenarios
Required +0.5% +0.5% Mortality ratesBasis Discount Salary/Pension adjusted to be
rate Increase rate 10% lighterDiscount rate 2.40% 2.90% 2.40% 2.40%Future salary and pension increases 2.50% 2.50% 3.00% 2.50%Defined benefit obligation 4,594 4,465 4,758 4,841Change in obligation (129) 164 247Percentage change in obligation -2.80% 3.60% 5.40%
The methods and types of assumptions used in the preparation of the sensitivity analysis did not change compared to the prior period.
2015The defined benefit obligation is presented on following scenarios Required +0.5% +0.5% Mortality rates
Basis Discount Salary/Pension adjusted to be rate Increase rate 10% lighter
Discount rate 2.50% 3.00% 2.50% 2.50%Future salary and pension increases 2.50% 2.50% 3.00% 2.50%Defined benefit obligation 5,303 5,157 5,490 5,572Change in obligation (146) 186 269Percentage change in obligation -2.80% 3.50% 5.10%
(viii) Funding arrangementsEmployer contributions are made to meet the cost of the defined benefits as they fall due.Expected employer contributions (equal to expected benefits) in the next 12 months are $1.36 million (2015: $1.65 million).
(ix) Maturity profile of defined benefit obligationThe weighted average duration of the defined benefit obligation is:Supplementary Pension Scheme 6.4 (2015: 6.4)Supplementary Benefit Scheme 0.5 (2015: 0.7)Overall 5.0 (2015: 4.8)In accordance with AASB 101(7), actuarial gains and losses on defined benefit plan are included in other comprehensive income and are not recognised in profit and loss.
Notes to the financial statements for the year ended 31 December 2016
uwa.edu.au 109
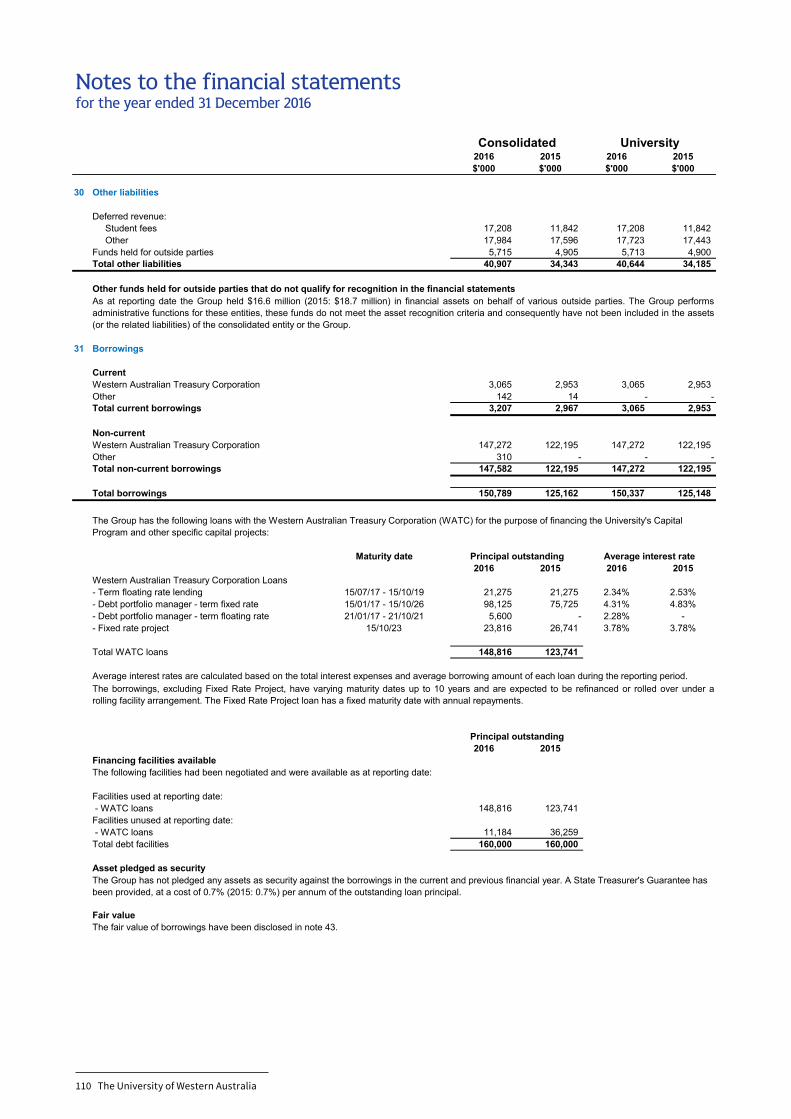
2016 2015 2016 2015$'000 $'000 $'000 $'000
30 Other liabilities
Deferred revenue: Student fees 17,208 11,842 17,208 11,842 Other 17,984 17,596 17,723 17,443Funds held for outside parties 5,715 4,905 5,713 4,900Total other liabilities 40,907 34,343 40,644 34,185
Other funds held for outside parties that do not qualify for recognition in the financial statements
31 Borrowings
CurrentWestern Australian Treasury Corporation 3,065 2,953 3,065 2,953Other 142 14 - -Total current borrowings 3,207 2,967 3,065 2,953
Non-currentWestern Australian Treasury Corporation 147,272 122,195 147,272 122,195Other 310 - - -Total non-current borrowings 147,582 122,195 147,272 122,195
Total borrowings 150,789 125,162 150,337 125,148
2016 2015 2016 2015Western Australian Treasury Corporation Loans- Term floating rate lending 21,275 21,275 2.34% 2.53%- Debt portfolio manager - term fixed rate 98,125 75,725 4.31% 4.83%- Debt portfolio manager - term floating rate 5,600 - 2.28% -- Fixed rate project 23,816 26,741 3.78% 3.78%
Total WATC loans 148,816 123,741
2016 2015Financing facilities availableThe following facilities had been negotiated and were available as at reporting date:
Facilities used at reporting date: - WATC loans 148,816 123,741Facilities unused at reporting date: - WATC loans 11,184 36,259Total debt facilities 160,000 160,000
Asset pledged as security
Fair value
NOTES TO THE FINANCIAL STATEMENTSfor the year ended 31 December 2016
UniversityConsolidated
Maturity date
15/07/17 - 15/10/19
As at reporting date the Group held $16.6 million (2015: $18.7 million) in financial assets on behalf of various outside parties. The Group performsadministrative functions for these entities, these funds do not meet the asset recognition criteria and consequently have not been included in the assets(or the related liabilities) of the consolidated entity or the Group.
The Group has the following loans with the Western Australian Treasury Corporation (WATC) for the purpose of financing the University's Capital Program and other specific capital projects:
Principal outstanding Average interest rate
15/10/23
15/01/17 - 15/10/2621/01/17 - 21/10/21
Principal outstanding
Average interest rates are calculated based on the total interest expenses and average borrowing amount of each loan during the reporting period.The borrowings, excluding Fixed Rate Project, have varying maturity dates up to 10 years and are expected to be refinanced or rolled over under arolling facility arrangement. The Fixed Rate Project loan has a fixed maturity date with annual repayments.
The Group has not pledged any assets as security against the borrowings in the current and previous financial year. A State Treasurer's Guarantee has been provided, at a cost of 0.7% (2015: 0.7%) per annum of the outstanding loan principal.
The fair value of borrowings have been disclosed in note 43.
Notes to the financial statements for the year ended 31 December 2016
110 The University of Western Australia
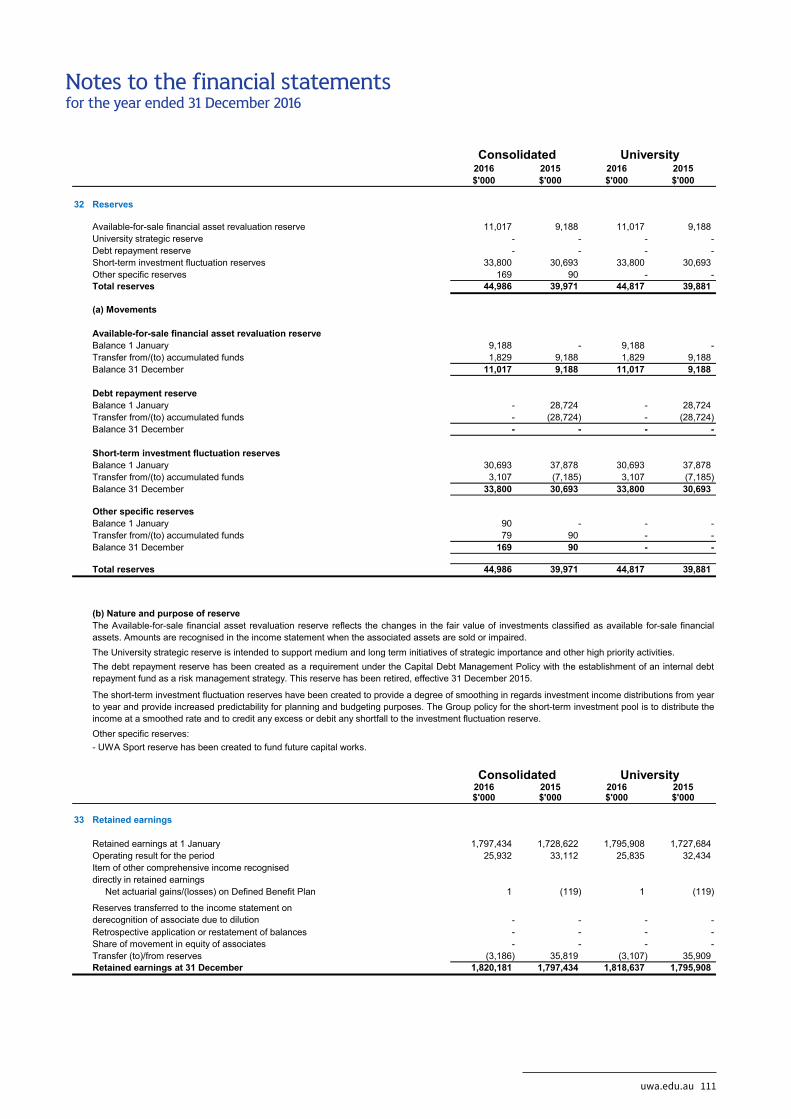
NOTES TO THE FINANCIAL STATEMENTSfor the year ended 31 December 2016
Consolidated University2016 2015 2016 2015$'000 $'000 $'000 $'000
32 Reserves
Available-for-sale financial asset revaluation reserve 11,017 9,188 11,017 9,188University strategic reserve - - - -Debt repayment reserve - - - -Short-term investment fluctuation reserves 33,800 30,693 33,800 30,693Other specific reserves 169 90 - -Total reserves 44,986 39,971 44,817 39,881
(a) Movements
Available-for-sale financial asset revaluation reserveBalance 1 January 9,188 - 9,188 -Transfer from/(to) accumulated funds 1,829 9,188 1,829 9,188Balance 31 December 11,017 9,188 11,017 9,188
Debt repayment reserveBalance 1 January - 28,724 - 28,724Transfer from/(to) accumulated funds - (28,724) - (28,724)Balance 31 December - - - -
Short-term investment fluctuation reservesBalance 1 January 30,693 37,878 30,693 37,878Transfer from/(to) accumulated funds 3,107 (7,185) 3,107 (7,185)Balance 31 December 33,800 30,693 33,800 30,693
Other specific reservesBalance 1 January 90 - - -Transfer from/(to) accumulated funds 79 90 - -Balance 31 December 169 90 - -
Total reserves 44,986 39,971 44,817 39,881
(b) Nature and purpose of reserve
2016 2015 2016 2015$'000 $'000 $'000 $'000
33 Retained earnings
Retained earnings at 1 January 1,797,434 1,728,622 1,795,908 1,727,684Operating result for the period 25,932 33,112 25,835 32,434Item of other comprehensive income recogniseddirectly in retained earnings Net actuarial gains/(losses) on Defined Benefit Plan 1 (119) 1 (119)
Reserves transferred to the income statement on derecognition of associate due to dilution - - - -Retrospective application or restatement of balances - - - -Share of movement in equity of associates - - - -Transfer (to)/from reserves (3,186) 35,819 (3,107) 35,909Retained earnings at 31 December 1,820,181 1,797,434 1,818,637 1,795,908
UniversityConsolidated
Other specific reserves:- UWA Sport reserve has been created to fund future capital works.
The Available-for-sale financial asset revaluation reserve reflects the changes in the fair value of investments classified as available for-sale financialassets. Amounts are recognised in the income statement when the associated assets are sold or impaired.The University strategic reserve is intended to support medium and long term initiatives of strategic importance and other high priority activities.The debt repayment reserve has been created as a requirement under the Capital Debt Management Policy with the establishment of an internal debtrepayment fund as a risk management strategy. This reserve has been retired, effective 31 December 2015.
The short-term investment fluctuation reserves have been created to provide a degree of smoothing in regards investment income distributions from year to year and provide increased predictability for planning and budgeting purposes. The Group policy for the short-term investment pool is to distribute theincome at a smoothed rate and to credit any excess or debit any shortfall to the investment fluctuation reserve.
Notes to the financial statements for the year ended 31 December 2016
uwa.edu.au 111
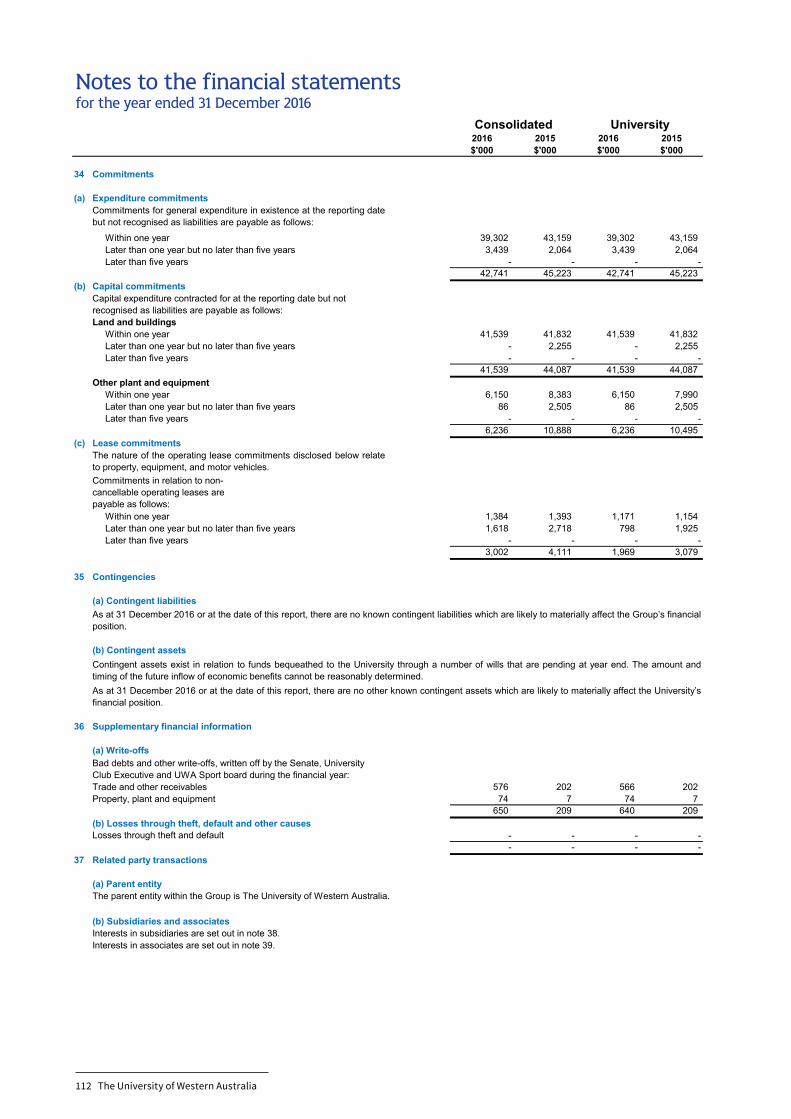
for the year ended 31 December 2016
Consolidated University2016 2015 2016 2015$'000 $'000 $'000 $'000
34 Commitments
(a) Expenditure commitments
Within one year 39,302 43,159 39,302 43,159 Later than one year but no later than five years 3,439 2,064 3,439 2,064 Later than five years - - - -
42,741 45,223 42,741 45,223(b) Capital commitments
Land and buildings Within one year 41,539 41,832 41,539 41,832 Later than one year but no later than five years - 2,255 - 2,255 Later than five years - - - -
41,539 44,087 41,539 44,087Other plant and equipment Within one year 6,150 8,383 6,150 7,990 Later than one year but no later than five years 86 2,505 86 2,505 Later than five years - - - -
6,236 10,888 6,236 10,495(c) Lease commitments
Commitments in relation to non-cancellable operating leases are payable as follows: Within one year 1,384 1,393 1,171 1,154 Later than one year but no later than five years 1,618 2,718 798 1,925 Later than five years - - - -
3,002 4,111 1,969 3,079
35 Contingencies
(a) Contingent liabilities
(b) Contingent assets
36 Supplementary financial information
(a) Write-offs
Trade and other receivables 576 202 566 202Property, plant and equipment 74 7 74 7
650 209 640 209(b) Losses through theft, default and other causesLosses through theft and default - - - -
- - - -37 Related party transactions
(a) Parent entityThe parent entity within the Group is The University of Western Australia.
(b) Subsidiaries and associatesInterests in subsidiaries are set out in note 38.Interests in associates are set out in note 39.
Commitments for general expenditure in existence at the reporting datebut not recognised as liabilities are payable as follows:
The nature of the operating lease commitments disclosed below relateto property, equipment, and motor vehicles.
NOTES TO THE FINANCIAL STATEMENTS
As at 31 December 2016 or at the date of this report, there are no other known contingent assets which are likely to materially affect the University’sfinancial position.
Capital expenditure contracted for at the reporting date but not recognised as liabilities are payable as follows:
Bad debts and other write-offs, written off by the Senate, University Club Executive and UWA Sport board during the financial year:
Contingent assets exist in relation to funds bequeathed to the University through a number of wills that are pending at year end. The amount andtiming of the future inflow of economic benefits cannot be reasonably determined.
As at 31 December 2016 or at the date of this report, there are no known contingent liabilities which are likely to materially affect the Group’s financialposition.
Notes to the financial statements for the year ended 31 December 2016
112 The University of Western Australia
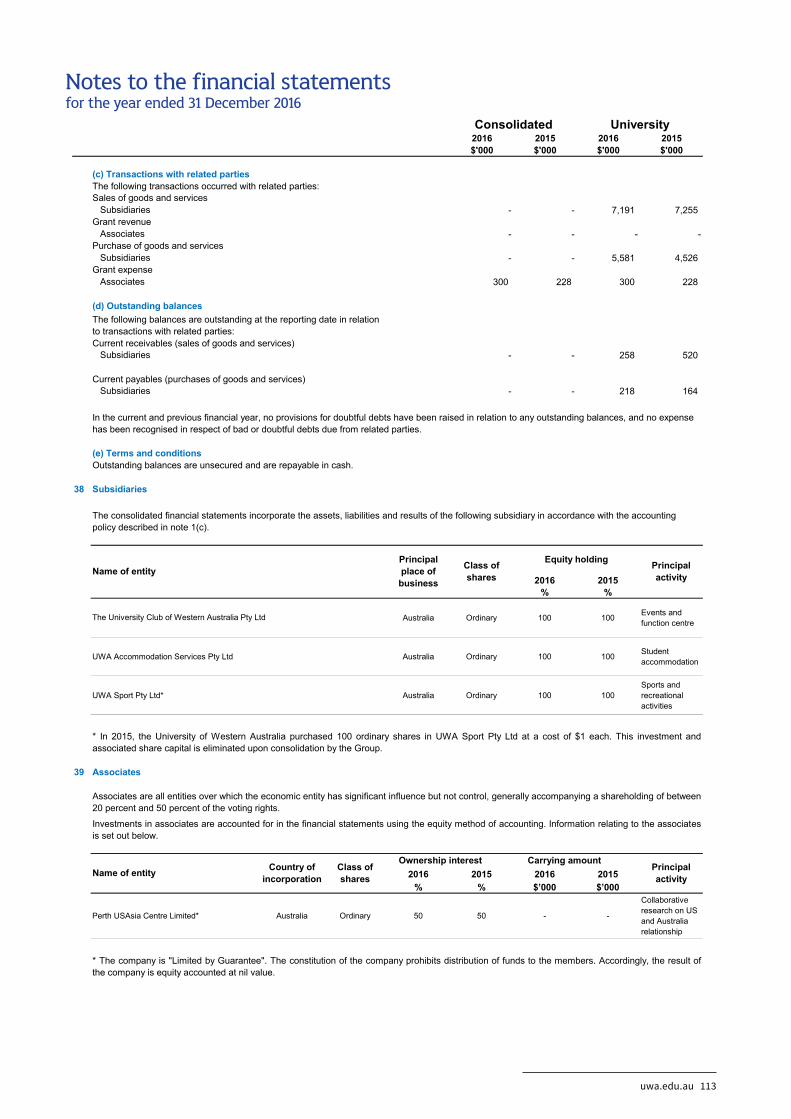
for the year ended 31 December 2016
Consolidated University2016 2015 2016 2015$'000 $'000 $'000 $'000
NOTES TO THE FINANCIAL STATEMENTS
(c) Transactions with related partiesThe following transactions occurred with related parties:Sales of goods and services Subsidiaries - - 7,191 7,255Grant revenue Associates - - - -Purchase of goods and services Subsidiaries - - 5,581 4,526Grant expense Associates 300 228 300 228
(d) Outstanding balances
Subsidiaries - - 258 520
Subsidiaries - - 218 164
(e) Terms and conditions
38 Subsidiaries
2016 2015% %
Australia Ordinary 100 100 Events and function centre
UWA Accommodation Services Pty Ltd Australia Ordinary 100 100 Student accommodation
UWA Sport Pty Ltd* Australia Ordinary 100 100Sports and recreational activities
39 Associates
Ownership interest Carrying amount2016 2015 2016 2015
% % $’000 $’000
Perth USAsia Centre Limited* Australia Ordinary 50 50 - -
Collaborative research on US and Australia relationship
Class of shares
The University Club of Western Australia Pty Ltd
Investments in associates are accounted for in the financial statements using the equity method of accounting. Information relating to the associatesis set out below.
Name of entity Country of incorporation
Name of entity
In the current and previous financial year, no provisions for doubtful debts have been raised in relation to any outstanding balances, and no expense has been recognised in respect of bad or doubtful debts due from related parties.
Outstanding balances are unsecured and are repayable in cash.
Current payables (purchases of goods and services)
Principal activity
The consolidated financial statements incorporate the assets, liabilities and results of the following subsidiary in accordance with the accounting policy described in note 1(c).
The following balances are outstanding at the reporting date in relation to transactions with related parties:Current receivables (sales of goods and services)
Class of shares
Associates are all entities over which the economic entity has significant influence but not control, generally accompanying a shareholding of between20 percent and 50 percent of the voting rights.
Equity holding
* In 2015, the University of Western Australia purchased 100 ordinary shares in UWA Sport Pty Ltd at a cost of $1 each. This investment andassociated share capital is eliminated upon consolidation by the Group.
Principal activity
* The company is "Limited by Guarantee". The constitution of the company prohibits distribution of funds to the members. Accordingly, the result ofthe company is equity accounted at nil value.
Principal place of business
Notes to the financial statements for the year ended 31 December 2016
uwa.edu.au 113
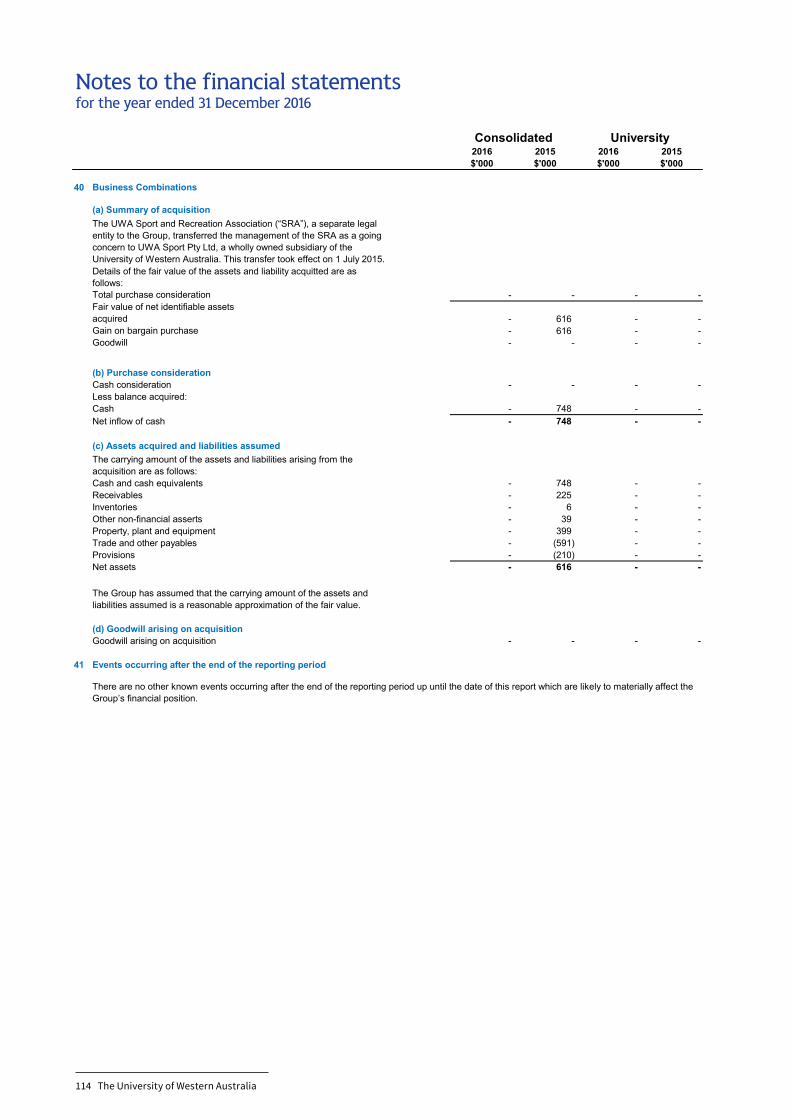
for the year ended 31 December 2016
Consolidated University2016 2015 2016 2015$'000 $'000 $'000 $'000
NOTES TO THE FINANCIAL STATEMENTS
40 Business Combinations
(a) Summary of acquisition
Total purchase consideration - - - -Fair value of net identifiable assets acquired - 616 - -Gain on bargain purchase - 616 - -Goodwill - - - -
(b) Purchase considerationCash consideration - - - -Less balance acquired:Cash - 748 - -
- 748 - -
(c) Assets acquired and liabilities assumed
Cash and cash equivalents - 748 - -Receivables - 225 - -Inventories - 6 - -Other non-financial asserts - 39 - -Property, plant and equipment - 399 - -Trade and other payables - (591) - -Provisions - (210) - -Net assets - 616 - -
(d) Goodwill arising on acquisitionGoodwill arising on acquisition - - - -
41 Events occurring after the end of the reporting period
The carrying amount of the assets and liabilities arising from the acquisition are as follows:
The UWA Sport and Recreation Association (“SRA”), a separate legal entity to the Group, transferred the management of the SRA as a going concern to UWA Sport Pty Ltd, a wholly owned subsidiary of the University of Western Australia. This transfer took effect on 1 July 2015.
The Group has assumed that the carrying amount of the assets and liabilities assumed is a reasonable approximation of the fair value.
Details of the fair value of the assets and liability acquitted are as follows:
There are no other known events occurring after the end of the reporting period up until the date of this report which are likely to materially affect the Group’s financial position.
Net inflow of cash
Notes to the financial statements for the year ended 31 December 2016
114 The University of Western Australia
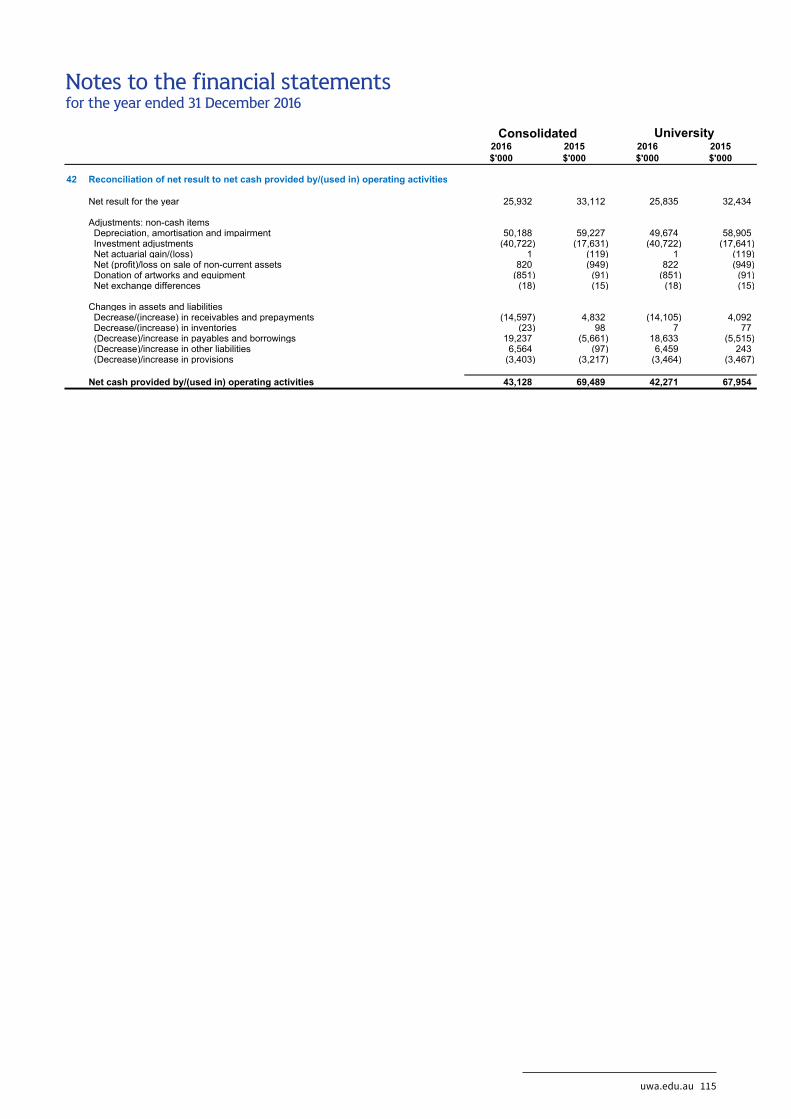
NOTES TO THE FINANCIAL STATEMENTSfor the year ended 31 December 2016
Consolidated2016 2015 2016 2015$'000 $'000 $'000 $'000
42 Reconciliation of net result to net cash provided by/(used in) operating activities
Net result for the year 25,932 33,112 25,835 32,434
Adjustments: non-cash items Depreciation, amortisation and impairment 50,188 59,227 49,674 58,905 Investment adjustments (40,722) (17,631) (40,722) (17,641) Net actuarial gain/(loss) 1 (119) 1 (119) Net (profit)/loss on sale of non-current assets 820 (949) 822 (949) Donation of artworks and equipment (851) (91) (851) (91) Net exchange differences (18) (15) (18) (15)
Changes in assets and liabilities Decrease/(increase) in receivables and prepayments (14,597) 4,832 (14,105) 4,092 Decrease/(increase) in inventories (23) 98 7 77 (Decrease)/increase in payables and borrowings 19,237 (5,661) 18,633 (5,515) (Decrease)/increase in other liabilities 6,564 (97) 6,459 243 (Decrease)/increase in provisions (3,403) (3,217) (3,464) (3,467)
Net cash provided by/(used in) operating activities 43,128 69,489 42,271 67,954
University
Notes to the financial statements for the year ended 31 December 2016
uwa.edu.au 115
43
The University's Governing Body, the Senate, has overall responsibility for risk management. To assist in fulfilling this aspect of its role, the Senatehas established two standing committees—the Strategic Resources Committee and the Audit and Risk Committee, both of which report directly tothe Senate. The Strategic Resources Committee has, as part of its role, responsibility for monitoring the financial welfare of the University, and,within the limits of agreed delegations, making decisions, or recommendations to Senate, on investments, debt and the capital structure within aframework of strategy approved by Senate. The Audit and Risk Committee has, as part of its role, responsibility to satisfy that the University hassound policies and arrangements in place for corporate governance and for controlling the institution's exposure to risk. The Audit and RiskCommittee also oversees how the University’s management monitors compliance with the risk management policies and reviews the adequacy ofthe risk management framework in relation to the financial risks faced by the University.
In accordance with the University’s Investment Policy, credit risk is minimised by appropriate diversification of investments gained through assetallocation, investment styles, manager and portfolio construction.
(c) Liquidity risk
Liquidity risk is the risk that the University will not be able to meet its financial obligations as they fall due. The University's approach to managingliquidity is to ensure, as far as possible, that it will always have sufficient liquidity to meet its liabilities when due, under both normal and stressedconditions, without incurring unacceptable losses or other related costs. Under normal conditions, the University aims to achieve the optimum levelof cash holding, so that it minimises liquidity risk to an acceptable level, while at the same time maximising return from investment, for an agreedlevel of risk.
To manage these conflicting objectives, and achieve a workable solution, the University prepares daily rolling liquidity forecasts, so that pro-active,informed decisions may be made in relation to liquidity management. In addition, the University has the flexibility to liquidate a portion of its poolinvestments in a short time frame, if required.
The University has a lending agreement with the Western Australian Treasury Corporation. The maximum amount eligible for draw down under theagreement is $160.0 million (2015: $160.0 million). As at reporting date the outstanding balance owing by the group, including accrued interest andguarantee levy fees is $150.3 million (2015: $125.1 million). The borrowings provide liquidity to support the University’s capital program, and to fundthe student accommodation under the National Rental Affordability Scheme (NRAS).
The University has appointed an Implemented Consultant effective 23 December 2016 to manage the University’s investment portfolio. TheImplemented Consultant provides a fully implemented investment management solution via a manager of managers style approach to portfolioconstruction, strategy implementation, diversification, management and overarching risk management.
NOTES TO THE FINANCIAL STATEMENTSfor the year ended 31 December 2016
Financial instruments
(a) Financial risk management - overview
The Investment Policy Statement, which is managed by the Strategic Resources Committee and approved by Senate, sets out investment policy formatters such as performance objectives, investment restrictions, performance benchmarks and monitoring, and the strategic asset allocationbenchmark for each investment pool. The investment policy is formally reviewed every two years and an investment consultant is appointed toundertake an independent review every four years and at any time a material change to the policy is proposed.
The majority of the University's exposure to credit risk from loans and receivables is denominated in Australian dollars. The University's creditcontrol policy is designed to ensure that credit facilities are provided to customers with an appropriate credit history. Thereafter, the University hasan active credit management policy.
The University's cash and cash equivalent transactions are invested only through pre-approved authorised deposit taking institutions and inaccordance with the University Investment Policy, where maximum exposure limits are set for each institution according to their risk profile.
The University is committed to robust risk management practices as an integral part of good management. A risk report is provided on a quarterlybasis to the Senate and the Audit & Risk Committee, which highlights major emerging risks and provides updates on risks from the Strategic RiskRegister. The University’s Strategic Risk Register was refreshed in 2016 to improve the quality of reporting and enable a better fit with the newintegrated planning framework.
The revised Strategic Risk Register and a new Risk Appetite Statement for the University were approved by the Senate in October. Furtherimprovements to the University’s risk management systems are planned for 2017 as the new integrated planning framework is implemented.
A major component of the University's governance framework is the annual Cycle of Planning and Accountability. This cycle involves two keyprocesses, being the preparation of budgets and the review of actual performance against budget or other relevant benchmarks. Where necessary,the quarterly reporting process highlights significant financial issues and risks. The monitoring and review process is fulfilled by the UniversityManagement and Executive, Strategic Resources Committee and Senate.
The group has exposure to credit, market and liquidity risk.
(b) Credit risk
Credit risk arises principally from the University's investment securities, and to a limited extent from its loans and receivables. The carrying amountof the financial assets represents the maximum credit risk exposure at the reporting date.
Notes to the financial statements for the year ended 31 December 2016
116 The University of Western Australia
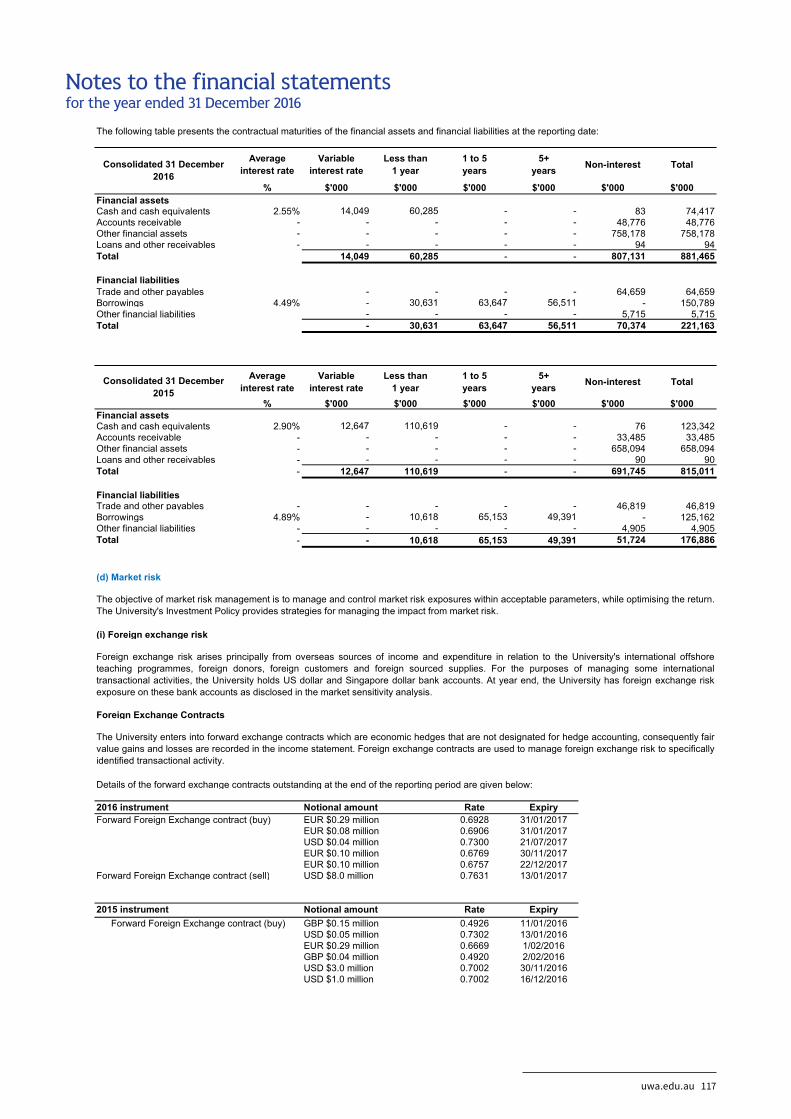
NOTES TO THE FINANCIAL STATEMENTSfor the year ended 31 December 2016
Average interest rate
Variable interest rate
Less than1 year
1 to 5years
5+years Non-interest Total
% $'000 $'000 $'000 $'000 $'000 $'000Financial assetsCash and cash equivalents 2.55% 14,049 60,285 - - 83 74,417 Accounts receivable - - - - - 48,776 48,776 Other financial assets - - - - - 758,178 758,178 Loans and other receivables - - - - - 94 94 Total 14,049 60,285 - - 807,131 881,465
Financial liabilitiesTrade and other payables - - - - 64,659 64,659 Borrowings 4.49% - 30,631 63,647 56,511 - 150,789 Other financial liabilities - - - - 5,715 5,715 Total - 30,631 63,647 56,511 70,374 221,163
Average interest rate
Variable interest rate
Less than1 year
1 to 5years
5+years Non-interest Total
% $'000 $'000 $'000 $'000 $'000 $'000Financial assetsCash and cash equivalents 2.90% 12,647 110,619 - - 76 123,342 Accounts receivable - - - - - 33,485 33,485 Other financial assets - - - - - 658,094 658,094 Loans and other receivables - - - - - 90 90 Total - 12,647 110,619 - - 691,745 815,011
Financial liabilitiesTrade and other payables - - - - - 46,819 46,819 Borrowings 4.89% - 10,618 65,153 49,391 - 125,162 Other financial liabilities - - - - - 4,905 4,905 Total - - 10,618 65,153 49,391 51,724 176,886
Foreign Exchange Contracts
Rate Expiry0.6928 31/01/20170.6906 31/01/20170.7300 21/07/20170.6769 30/11/20170.6757 22/12/20170.7631 13/01/2017
Rate Expiry0.4926 11/01/20160.7302 13/01/20160.6669 1/02/20160.4920 2/02/20160.7002 30/11/20160.7002 16/12/2016
2015 instrument
Details of the forward exchange contracts outstanding at the end of the reporting period are given below:
2016 instrument Notional amountForward Foreign Exchange contract (buy) EUR $0.29 million
USD $0.04 millionEUR $0.10 millionEUR $0.10 million
EUR $0.08 million
Notional amount
Forward Foreign Exchange contract (sell) USD $8.0 million
(d) Market risk
The objective of market risk management is to manage and control market risk exposures within acceptable parameters, while optimising the return.The University's Investment Policy provides strategies for managing the impact from market risk.
(i) Foreign exchange risk
Consolidated 31 December 2016
The following table presents the contractual maturities of the financial assets and financial liabilities at the reporting date:
Consolidated 31 December 2015
Foreign exchange risk arises principally from overseas sources of income and expenditure in relation to the University's international offshoreteaching programmes, foreign donors, foreign customers and foreign sourced supplies. For the purposes of managing some internationaltransactional activities, the University holds US dollar and Singapore dollar bank accounts. At year end, the University has foreign exchange riskexposure on these bank accounts as disclosed in the market sensitivity analysis.
The University enters into forward exchange contracts which are economic hedges that are not designated for hedge accounting, consequently fairvalue gains and losses are recorded in the income statement. Foreign exchange contracts are used to manage foreign exchange risk to specificallyidentified transactional activity.
Forward Foreign Exchange contract (buy)
USD $3.0 millionUSD $1.0 million
GBP $0.15 millionUSD $0.05 millionEUR $0.29 millionGBP $0.04 million
Notes to the financial statements for the year ended 31 December 2016
uwa.edu.au 117
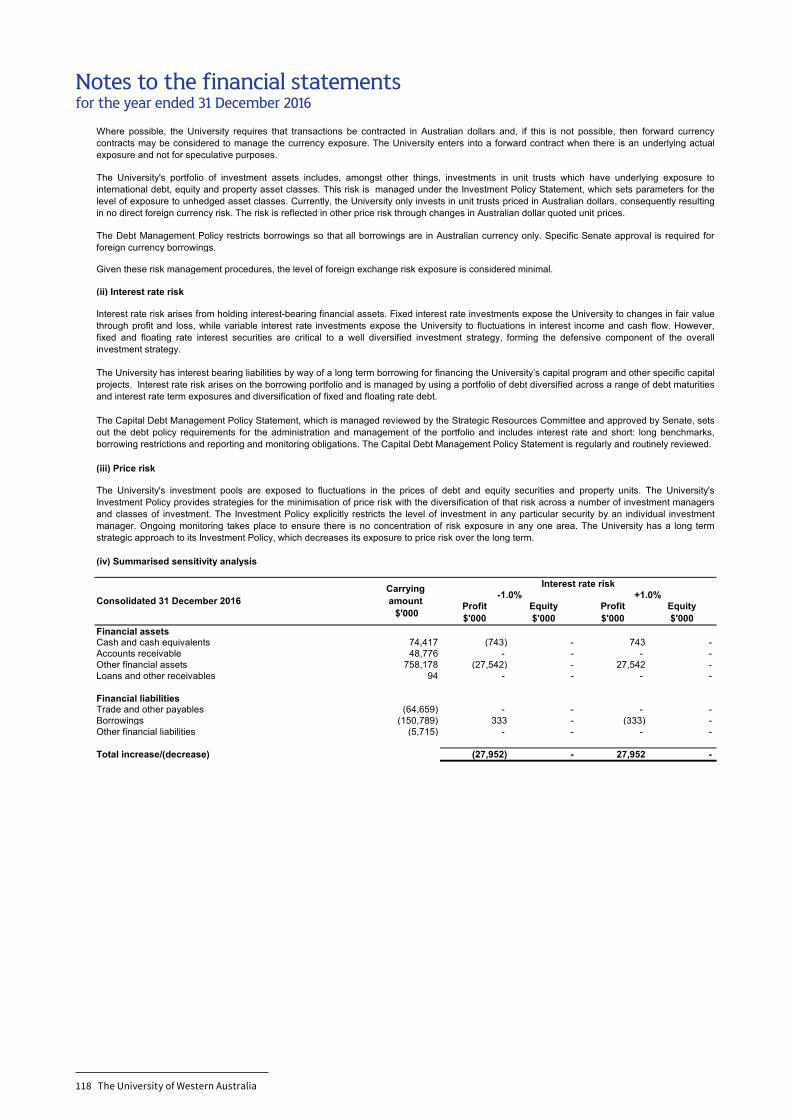
NOTES TO THE FINANCIAL STATEMENTSfor the year ended 31 December 2016
Profit $'000
Equity $'000
Profit $'000
Equity $'000
Financial assetsCash and cash equivalents 74,417 (743) - 743 - Accounts receivable 48,776 - - - - Other financial assets 758,178 (27,542) - 27,542 - Loans and other receivables 94 - - - -
Financial liabilitiesTrade and other payables (64,659) - - - - Borrowings (150,789) 333 - (333) - Other financial liabilities (5,715) - - - -
Total increase/(decrease) (27,952) - 27,952 -
(iv) Summarised sensitivity analysis
Interest rate risk-1.0%
The Capital Debt Management Policy Statement, which is managed reviewed by the Strategic Resources Committee and approved by Senate, setsout the debt policy requirements for the administration and management of the portfolio and includes interest rate and short: long benchmarks,borrowing restrictions and reporting and monitoring obligations. The Capital Debt Management Policy Statement is regularly and routinely reviewed.
(iii) Price risk
The University's investment pools are exposed to fluctuations in the prices of debt and equity securities and property units. The University'sInvestment Policy provides strategies for the minimisation of price risk with the diversification of that risk across a number of investment managersand classes of investment. The Investment Policy explicitly restricts the level of investment in any particular security by an individual investmentmanager. Ongoing monitoring takes place to ensure there is no concentration of risk exposure in any one area. The University has a long termstrategic approach to its Investment Policy, which decreases its exposure to price risk over the long term.
(ii) Interest rate risk
The University has interest bearing liabilities by way of a long term borrowing for financing the University’s capital program and other specific capitalprojects. Interest rate risk arises on the borrowing portfolio and is managed by using a portfolio of debt diversified across a range of debt maturitiesand interest rate term exposures and diversification of fixed and floating rate debt.
Interest rate risk arises from holding interest-bearing financial assets. Fixed interest rate investments expose the University to changes in fair valuethrough profit and loss, while variable interest rate investments expose the University to fluctuations in interest income and cash flow. However,fixed and floating rate interest securities are critical to a well diversified investment strategy, forming the defensive component of the overallinvestment strategy.
The University's portfolio of investment assets includes, amongst other things, investments in unit trusts which have underlying exposure tointernational debt, equity and property asset classes. This risk is managed under the Investment Policy Statement, which sets parameters for thelevel of exposure to unhedged asset classes. Currently, the University only invests in unit trusts priced in Australian dollars, consequently resultingin no direct foreign currency risk. The risk is reflected in other price risk through changes in Australian dollar quoted unit prices.
The Debt Management Policy restricts borrowings so that all borrowings are in Australian currency only. Specific Senate approval is required forforeign currency borrowings.
Given these risk management procedures, the level of foreign exchange risk exposure is considered minimal.
Where possible, the University requires that transactions be contracted in Australian dollars and, if this is not possible, then forward currencycontracts may be considered to manage the currency exposure. The University enters into a forward contract when there is an underlying actualexposure and not for speculative purposes.
Consolidated 31 December 2016Carrying amount $'000
+1.0%
Notes to the financial statements for the year ended 31 December 2016
118 The University of Western Australia
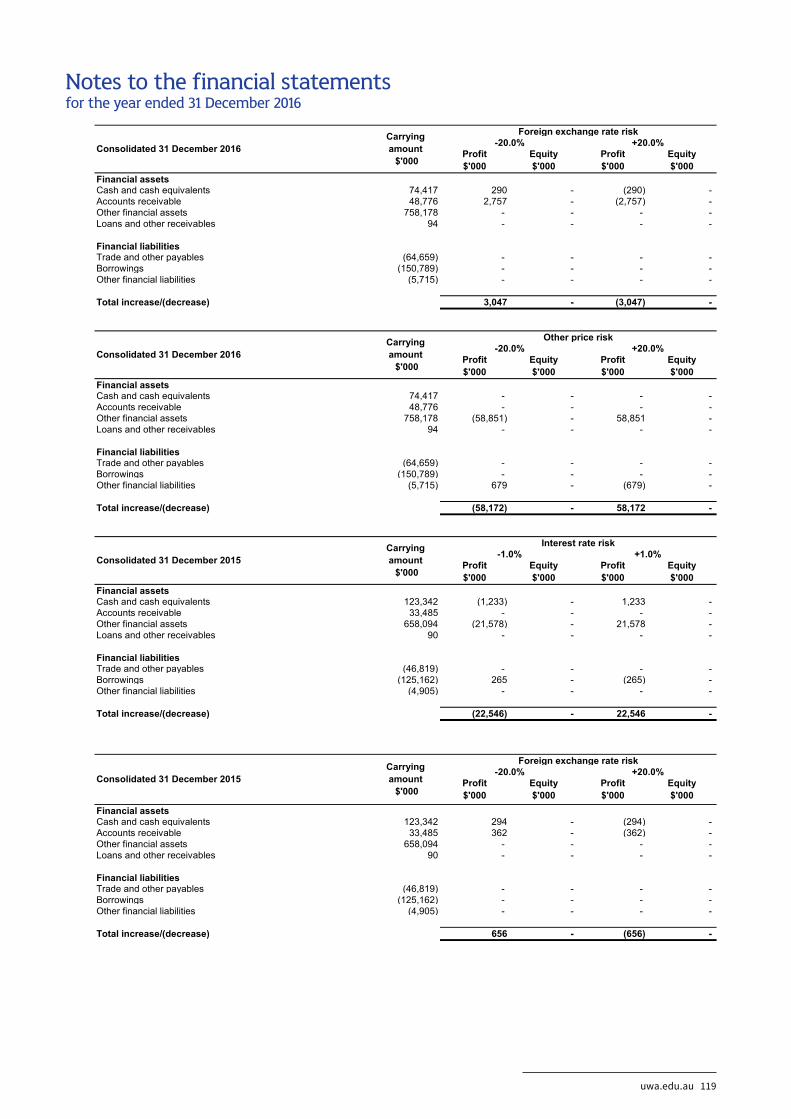
NOTES TO THE FINANCIAL STATEMENTSfor the year ended 31 December 2016
Profit $'000
Equity $'000
Profit $'000
Equity $'000
Financial assetsCash and cash equivalents 74,417 290 - (290) - Accounts receivable 48,776 2,757 - (2,757) - Other financial assets 758,178 - - - - Loans and other receivables 94 - - - -
Financial liabilitiesTrade and other payables (64,659) - - - - Borrowings (150,789) - - - - Other financial liabilities (5,715) - - - -
Total increase/(decrease) 3,047 - (3,047) -
Profit $'000
Equity $'000
Profit $'000
Equity $'000
Financial assetsCash and cash equivalents 74,417 - - - - Accounts receivable 48,776 - - - - Other financial assets 758,178 (58,851) - 58,851 - Loans and other receivables 94 - - - -
Financial liabilitiesTrade and other payables (64,659) - - - - Borrowings (150,789) - - - - Other financial liabilities (5,715) 679 - (679) -
Total increase/(decrease) (58,172) - 58,172 -
Profit $'000
Equity $'000
Profit $'000
Equity $'000
Financial assetsCash and cash equivalents 123,342 (1,233) - 1,233 - Accounts receivable 33,485 - - - - Other financial assets 658,094 (21,578) - 21,578 - Loans and other receivables 90 - - - -
Financial liabilitiesTrade and other payables (46,819) - - - - Borrowings (125,162) 265 - (265) - Other financial liabilities (4,905) - - - -
Total increase/(decrease) (22,546) - 22,546 -
Profit $'000
Equity $'000
Profit $'000
Equity $'000
Financial assetsCash and cash equivalents 123,342 294 - (294) - Accounts receivable 33,485 362 - (362) - Other financial assets 658,094 - - - - Loans and other receivables 90 - - - -
Financial liabilitiesTrade and other payables (46,819) - - - - Borrowings (125,162) - - - - Other financial liabilities (4,905) - - - -
Total increase/(decrease) 656 - (656) -
Other price risk
Consolidated 31 December 2015Carrying amount $'000
Foreign exchange rate risk-20.0% +20.0%
-20.0% +20.0%
Interest rate risk-1.0%
Consolidated 31 December 2016
+1.0%
Carrying amount $'000
Consolidated 31 December 2015Carrying amount $'000
Foreign exchange rate risk-20.0% +20.0%
Consolidated 31 December 2016Carrying amount $'000
Notes to the financial statements for the year ended 31 December 2016
uwa.edu.au 119
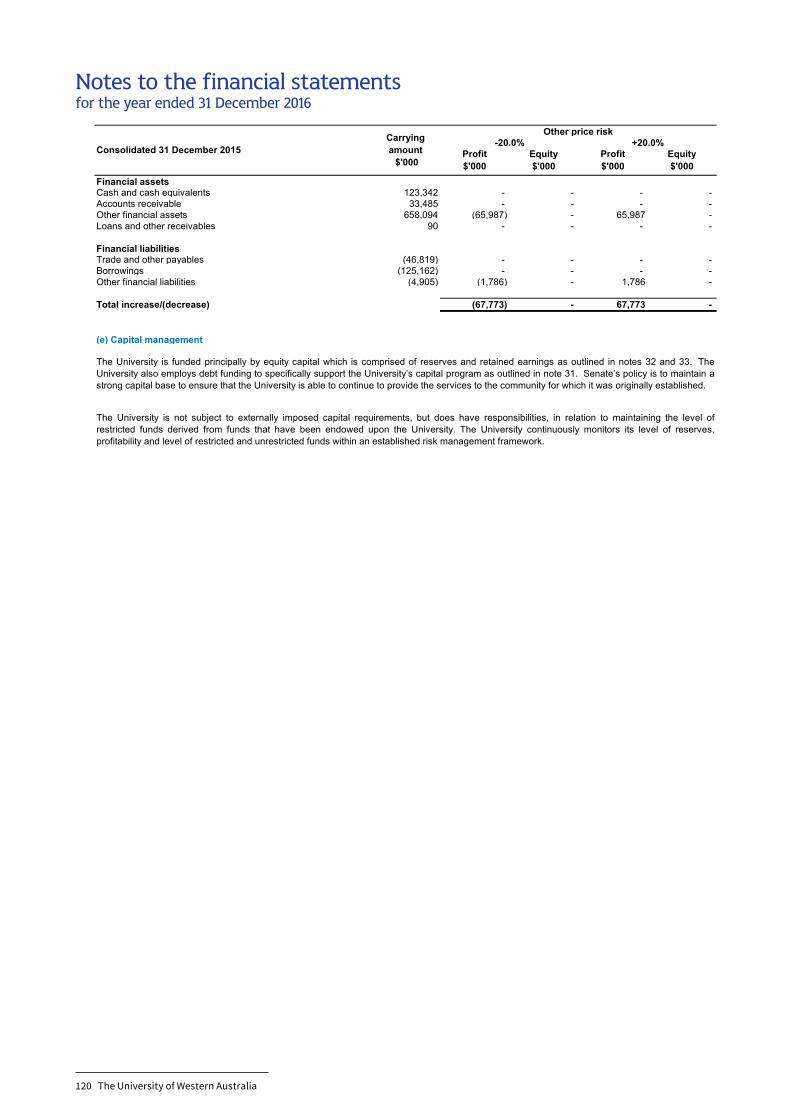
NOTES TO THE FINANCIAL STATEMENTSfor the year ended 31 December 2016
Profit $'000
Equity $'000
Profit $'000
Equity $'000
Financial assetsCash and cash equivalents 123,342 - - - - Accounts receivable 33,485 - - - - Other financial assets 658,094 (65,987) - 65,987 - Loans and other receivables 90 - - - -
Financial liabilitiesTrade and other payables (46,819) - - - - Borrowings (125,162) - - - - Other financial liabilities (4,905) (1,786) - 1,786 -
Total increase/(decrease) (67,773) - 67,773 -
The University is not subject to externally imposed capital requirements, but does have responsibilities, in relation to maintaining the level ofrestricted funds derived from funds that have been endowed upon the University. The University continuously monitors its level of reserves,profitability and level of restricted and unrestricted funds within an established risk management framework.
The University is funded principally by equity capital which is comprised of reserves and retained earnings as outlined in notes 32 and 33. TheUniversity also employs debt funding to specifically support the University’s capital program as outlined in note 31. Senate’s policy is to maintain astrong capital base to ensure that the University is able to continue to provide the services to the community for which it was originally established.
(e) Capital management
-20.0% +20.0%Consolidated 31 December 2015
Carrying amount $'000
Other price risk
Notes to the financial statements for the year ended 31 December 2016
120 The University of Western Australia
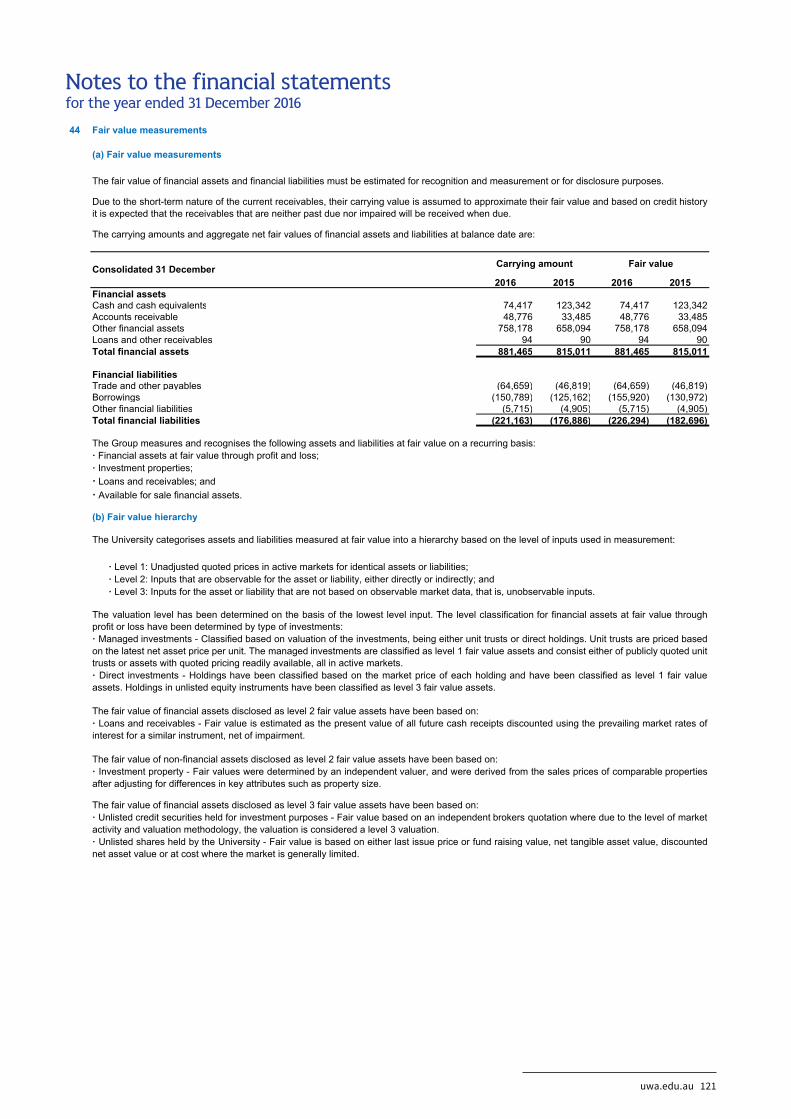
44
2016 2015 2016 2015Financial assetsCash and cash equivalents 74,417 123,342 74,417 123,342Accounts receivable 48,776 33,485 48,776 33,485Other financial assets 758,178 658,094 758,178 658,094Loans and other receivables 94 90 94 90Total financial assets 881,465 815,011 881,465 815,011
Financial liabilitiesTrade and other payables (64,659) (46,819) (64,659) (46,819)Borrowings (150,789) (125,162) (155,920) (130,972)Other financial liabilities (5,715) (4,905) (5,715) (4,905)Total financial liabilities (221,163) (176,886) (226,294) (182,696)
Due to the short-term nature of the current receivables, their carrying value is assumed to approximate their fair value and based on credit historyit is expected that the receivables that are neither past due nor impaired will be received when due.
The carrying amounts and aggregate net fair values of financial assets and liabilities at balance date are:
Consolidated 31 December Carrying amount Fair value
NOTES TO THE FINANCIAL STATEMENTSfor the year ended 31 December 2016
Fair value measurements
(a) Fair value measurements
The fair value of financial assets and financial liabilities must be estimated for recognition and measurement or for disclosure purposes.
The fair value of financial assets disclosed as level 2 fair value assets have been based on:· Loans and receivables - Fair value is estimated as the present value of all future cash receipts discounted using the prevailing market rates ofinterest for a similar instrument, net of impairment.
The fair value of non-financial assets disclosed as level 2 fair value assets have been based on:· Investment property - Fair values were determined by an independent valuer, and were derived from the sales prices of comparable propertiesafter adjusting for differences in key attributes such as property size.
The Group measures and recognises the following assets and liabilities at fair value on a recurring basis:· Financial assets at fair value through profit and loss;· Investment properties;· Loans and receivables; and· Available for sale financial assets.
The fair value of financial assets disclosed as level 3 fair value assets have been based on:· Unlisted credit securities held for investment purposes - Fair value based on an independent brokers quotation where due to the level of marketactivity and valuation methodology, the valuation is considered a level 3 valuation.· Unlisted shares held by the University - Fair value is based on either last issue price or fund raising value, net tangible asset value, discountednet asset value or at cost where the market is generally limited.
(b) Fair value hierarchy
The University categorises assets and liabilities measured at fair value into a hierarchy based on the level of inputs used in measurement:
· Level 1: Unadjusted quoted prices in active markets for identical assets or liabilities; · Level 2: Inputs that are observable for the asset or liability, either directly or indirectly; and · Level 3: Inputs for the asset or liability that are not based on observable market data, that is, unobservable inputs.
The valuation level has been determined on the basis of the lowest level input. The level classification for financial assets at fair value throughprofit or loss have been determined by type of investments:· Managed investments - Classified based on valuation of the investments, being either unit trusts or direct holdings. Unit trusts are priced basedon the latest net asset price per unit. The managed investments are classified as level 1 fair value assets and consist either of publicly quoted unittrusts or assets with quoted pricing readily available, all in active markets.· Direct investments - Holdings have been classified based on the market price of each holding and have been classified as level 1 fair valueassets. Holdings in unlisted equity instruments have been classified as level 3 fair value assets.
Notes to the financial statements for the year ended 31 December 2016
uwa.edu.au 121
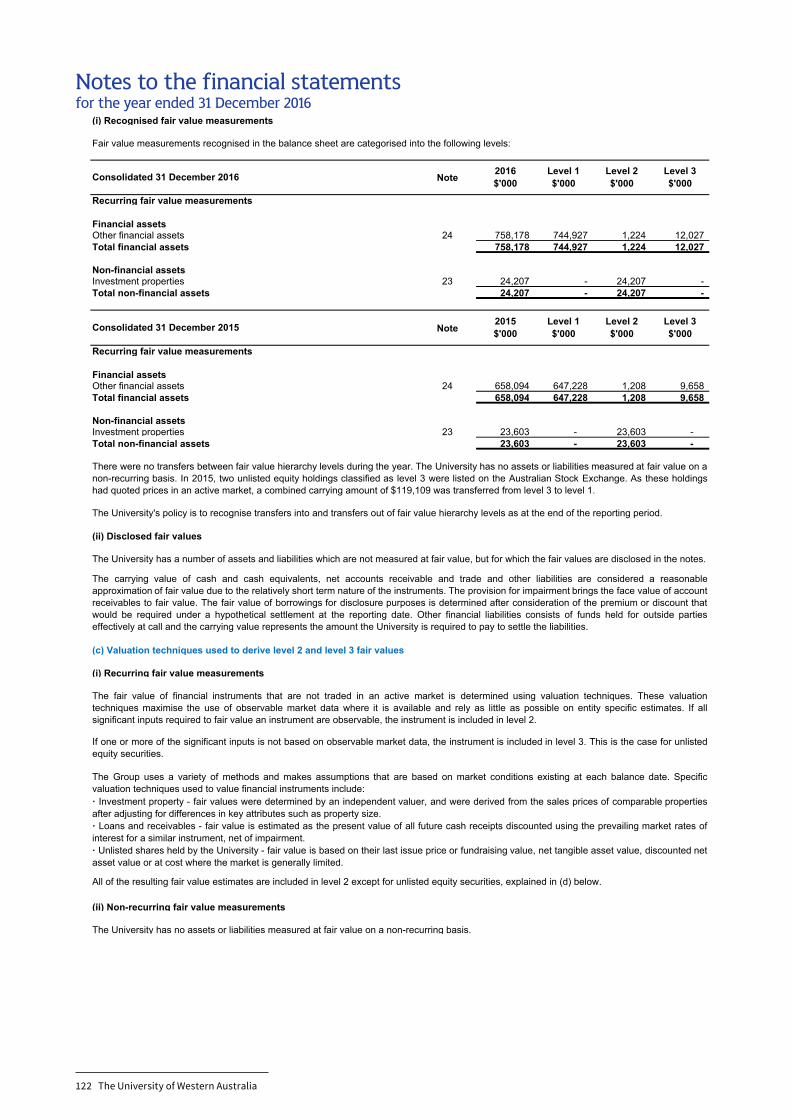
(i) Recognised fair value measurements
Note
Recurring fair value measurements
Financial assetsOther financial assets 24 758,178 744,927 1,224 12,027 Total financial assets 758,178 744,927 1,224 12,027
Non-financial assetsInvestment properties 23 24,207 - 24,207 -Total non-financial assets 24,207 - 24,207 -
Note
Recurring fair value measurements
Financial assetsOther financial assets 24 658,094 647,228 1,208 9,658 Total financial assets 658,094 647,228 1,208 9,658
Non-financial assetsInvestment properties 23 23,603 - 23,603 - Total non-financial assets 23,603 - 23,603 -
(ii) Disclosed fair values
(i) Recurring fair value measurements
(ii) Non-recurring fair value measurements
The University has no assets or liabilities measured at fair value on a non-recurring basis.
NOTES TO THE FINANCIAL STATEMENTSfor the year ended 31 December 2016
Consolidated 31 December 2015 2015$'000
Level 1$'000
Level 2$'000
Level 3$'000
Fair value measurements recognised in the balance sheet are categorised into the following levels:
Consolidated 31 December 2016 2016$'000
Level 1$'000
Level 2$'000
Level 3$'000
There were no transfers between fair value hierarchy levels during the year. The University has no assets or liabilities measured at fair value on anon-recurring basis. In 2015, two unlisted equity holdings classified as level 3 were listed on the Australian Stock Exchange. As these holdingshad quoted prices in an active market, a combined carrying amount of $119,109 was transferred from level 3 to level 1.
The University's policy is to recognise transfers into and transfers out of fair value hierarchy levels as at the end of the reporting period.
The Group uses a variety of methods and makes assumptions that are based on market conditions existing at each balance date. Specificvaluation techniques used to value financial instruments include:· Investment property - fair values were determined by an independent valuer, and were derived from the sales prices of comparable propertiesafter adjusting for differences in key attributes such as property size.· Loans and receivables - fair value is estimated as the present value of all future cash receipts discounted using the prevailing market rates ofinterest for a similar instrument, net of impairment.· Unlisted shares held by the University - fair value is based on their last issue price or fundraising value, net tangible asset value, discounted netasset value or at cost where the market is generally limited.
All of the resulting fair value estimates are included in level 2 except for unlisted equity securities, explained in (d) below.
The University has a number of assets and liabilities which are not measured at fair value, but for which the fair values are disclosed in the notes.
The carrying value of cash and cash equivalents, net accounts receivable and trade and other liabilities are considered a reasonableapproximation of fair value due to the relatively short term nature of the instruments. The provision for impairment brings the face value of accountreceivables to fair value. The fair value of borrowings for disclosure purposes is determined after consideration of the premium or discount thatwould be required under a hypothetical settlement at the reporting date. Other financial liabilities consists of funds held for outside partieseffectively at call and the carrying value represents the amount the University is required to pay to settle the liabilities.
(c) Valuation techniques used to derive level 2 and level 3 fair values
The fair value of financial instruments that are not traded in an active market is determined using valuation techniques. These valuationtechniques maximise the use of observable market data where it is available and rely as little as possible on entity specific estimates. If allsignificant inputs required to fair value an instrument are observable, the instrument is included in level 2.
If one or more of the significant inputs is not based on observable market data, the instrument is included in level 3. This is the case for unlistedequity securities.
Notes to the financial statements for the year ended 31 December 2016
122 The University of Western Australia
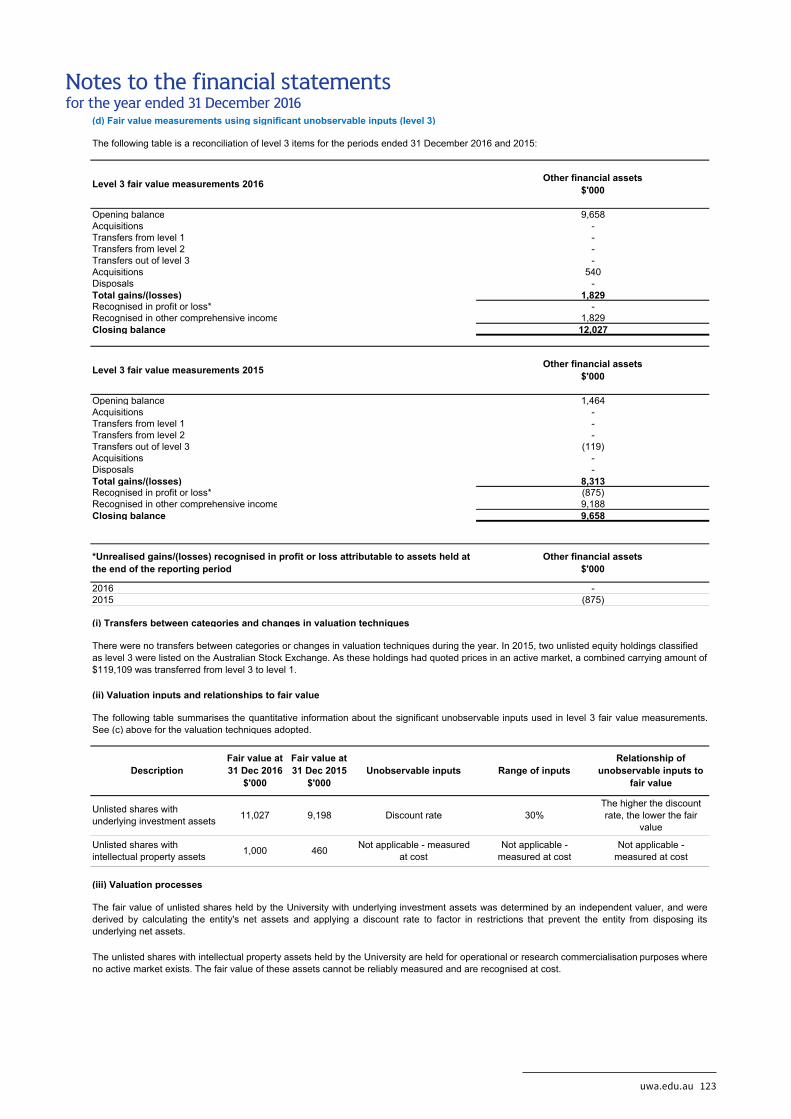
Opening balanceAcquisitionsTransfers from level 1Transfers from level 2Transfers out of level 3AcquisitionsDisposalsTotal gains/(losses)Recognised in profit or loss*Recognised in other comprehensive incomeClosing balance
Opening balanceAcquisitionsTransfers from level 1Transfers from level 2Transfers out of level 3AcquisitionsDisposalsTotal gains/(losses)Recognised in profit or loss*Recognised in other comprehensive incomeClosing balance
20162015
(i) Transfers between categories and changes in valuation techniques
(ii) Valuation inputs and relationships to fair value
(iii) Valuation processes
(d) Fair value measurements using significant unobservable inputs (level 3)
The following table is a reconciliation of level 3 items for the periods ended 31 December 2016 and 2015:
Level 3 fair value measurements 2016
Level 3 fair value measurements 2015
for the year ended 31 December 2016NOTES TO THE FINANCIAL STATEMENTS
*Unrealised gains/(losses) recognised in profit or loss attributable to assets held at the end of the reporting period
Other financial assets$'000
9,658----
12,0271,829
-1,829
-540
Other financial assets$'000
1,464-
The unlisted shares with intellectual property assets held by the University are held for operational or research commercialisation purposes whereno active market exists. The fair value of these assets cannot be reliably measured and are recognised at cost.
The following table summarises the quantitative information about the significant unobservable inputs used in level 3 fair value measurements.See (c) above for the valuation techniques adopted.
DescriptionFair value at 31 Dec 2015
$'000Unobservable inputs Range of inputs
Relationship of unobservable inputs to
fair value
Unlisted shares with intellectual property assets 460 Not applicable - measured
at costNot applicable -
measured at costNot applicable -
measured at cost
The fair value of unlisted shares held by the University with underlying investment assets was determined by an independent valuer, and werederived by calculating the entity's net assets and applying a discount rate to factor in restrictions that prevent the entity from disposing itsunderlying net assets.
Unlisted shares with underlying investment assets
The higher the discount rate, the lower the fair
value30%
--
(119)--
8,313(875)9,1889,658
Other financial assets$'000
There were no transfers between categories or changes in valuation techniques during the year. In 2015, two unlisted equity holdings classified as level 3 were listed on the Australian Stock Exchange. As these holdings had quoted prices in an active market, a combined carrying amount of $119,109 was transferred from level 3 to level 1.
Fair value at 31 Dec 2016
$'000
11,027
1,000
-(875)
9,198 Discount rate
Notes to the financial statements for the year ended 31 December 2016
uwa.edu.au 123
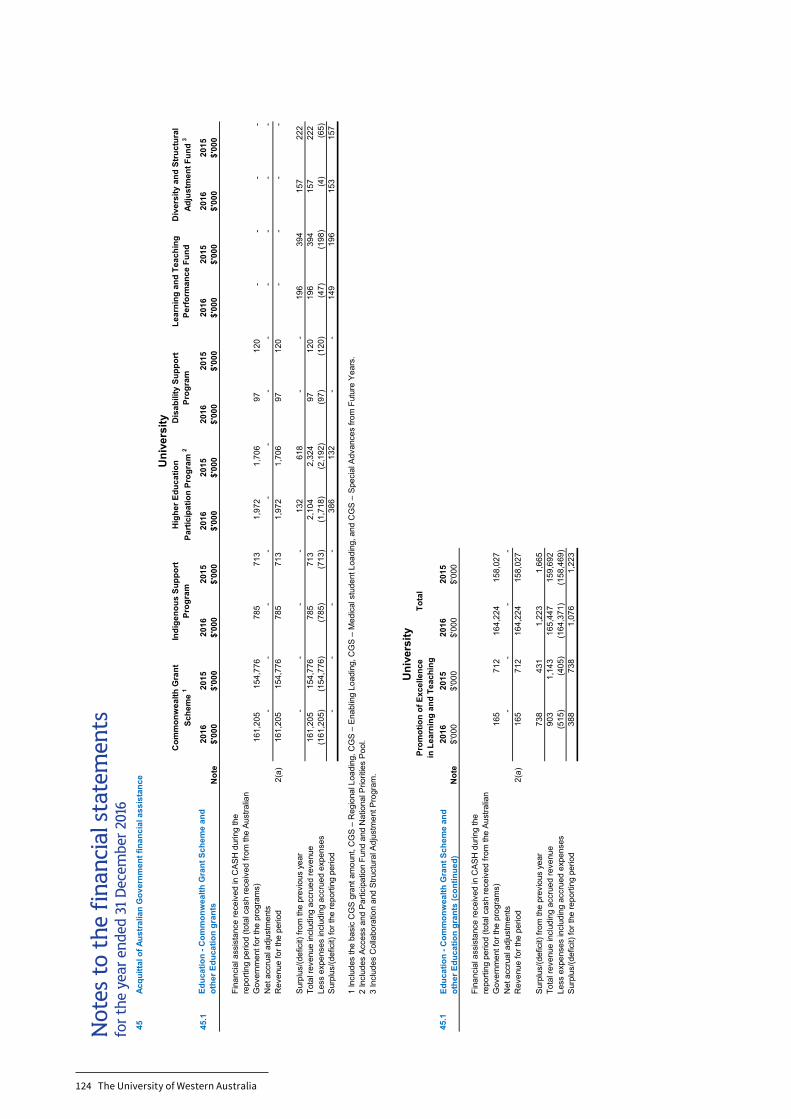
45Ac
quitt
al o
f Aus
tral
ian
Gov
ernm
ent f
inan
cial
ass
ista
nce
45.1
2016
2015
2016
2015
2016
2015
2016
2015
2016
2015
2016
2015
Not
e$'
000
$'00
0$'
000
$'00
0$'
000
$'00
0$'
000
$'00
0$'
000
$'00
0$'
000
$'00
0
Fina
ncia
l ass
ista
nce
rece
ived
in C
AS
H d
urin
g th
e re
porti
ng p
erio
d (to
tal c
ash
rece
ived
from
the
Aus
tralia
n G
over
nmen
t for
the
prog
ram
s)16
1,20
515
4,77
678
571
31,
972
1,70
697
120
--
--
Net
acc
rual
adj
ustm
ents
--
--
--
--
--
--
Rev
enue
for t
he p
erio
d2(
a)16
1,20
515
4,77
678
571
31,
972
1,70
697
120
--
--
Sur
plus
/(def
icit)
from
the
prev
ious
yea
r-
--
-13
261
8-
-19
639
415
722
2To
tal r
even
ue in
clud
ing
accr
ued
reve
nue
161,
205
154,
776
785
713
2,10
42,
324
9712
019
639
415
722
2Le
ss e
xpen
ses
incl
udin
g ac
crue
d ex
pens
es(1
61,2
05)
(154
,776
)(7
85)
(713
)(1
,718
)(2
,192
)(9
7)(1
20)
(47)
(198
)(4
)(6
5)S
urpl
us/(d
efic
it) fo
r the
repo
rting
per
iod
--
--
386
132
--
149
196
153
157
1 In
clud
es th
e ba
sic
CG
S g
rant
am
ount
, CG
S –
Reg
iona
l Loa
ding
, CG
S –
Ena
blin
g Lo
adin
g, C
GS
– M
edic
al s
tude
nt L
oadi
ng, a
nd C
GS
– S
peci
al A
dvan
ces
from
Fut
ure
Yea
rs.
2 In
clud
es A
cces
s an
d P
artic
ipat
ion
Fund
and
Nat
iona
l Prio
ritie
s P
ool.
3 In
clud
es C
olla
bora
tion
and
Stru
ctur
al A
djus
tmen
t Pro
gram
.
45.1
2016
2015
2016
2015
Not
e$'
000
$'00
0$'
000
$'00
0
Fina
ncia
l ass
ista
nce
rece
ived
in C
AS
H d
urin
g th
e re
porti
ng p
erio
d (to
tal c
ash
rece
ived
from
the
Aus
tralia
n G
over
nmen
t for
the
prog
ram
s)16
571
216
4,22
415
8,02
7N
et a
ccru
al a
djus
tmen
ts-
--
-R
even
ue fo
r the
per
iod
2(a)
165
712
164,
224
158,
027
Sur
plus
/(def
icit)
from
the
prev
ious
yea
r73
843
11,
223
1,66
5To
tal r
even
ue in
clud
ing
accr
ued
reve
nue
903
1,14
316
5,44
715
9,69
2Le
ss e
xpen
ses
incl
udin
g ac
crue
d ex
pens
es(5
15)
(405
)(1
64,3
71)
(158
,469
)S
urpl
us/(d
efic
it) fo
r the
repo
rting
per
iod
388
738
1,07
61,
223
Educ
atio
n - C
omm
onw
ealth
Gra
nt S
chem
e an
d ot
her E
duca
tion
gran
ts (c
ontin
ued)
NO
TES
TO T
HE
FIN
ANC
IAL
STAT
EMEN
TSfo
r the
yea
r end
ed 3
1 D
ecem
ber 2
016
Uni
vers
ityC
omm
onw
ealth
Gra
nt
Sche
me
1In
dige
nous
Sup
port
Pr
ogra
mLe
arni
ng a
nd T
each
ing
Perf
orm
ance
Fun
dD
iver
sity
and
Str
uctu
ral
Adju
stm
ent F
und
3
Prom
otio
n of
Exc
elle
nce
in L
earn
ing
and
Teac
hing
Tota
l
Hig
her E
duca
tion
Part
icip
atio
n Pr
ogra
m 2
Dis
abili
ty S
uppo
rt
Prog
ram
Educ
atio
n - C
omm
onw
ealth
Gra
nt S
chem
e an
d ot
her E
duca
tion
gran
ts
Uni
vers
ity
Not
es t
o t
he
fin
anci
al s
tate
men
ts
for
the
year
en
ded
31
Dec
emb
er 2
016
124 The University of Western Australia
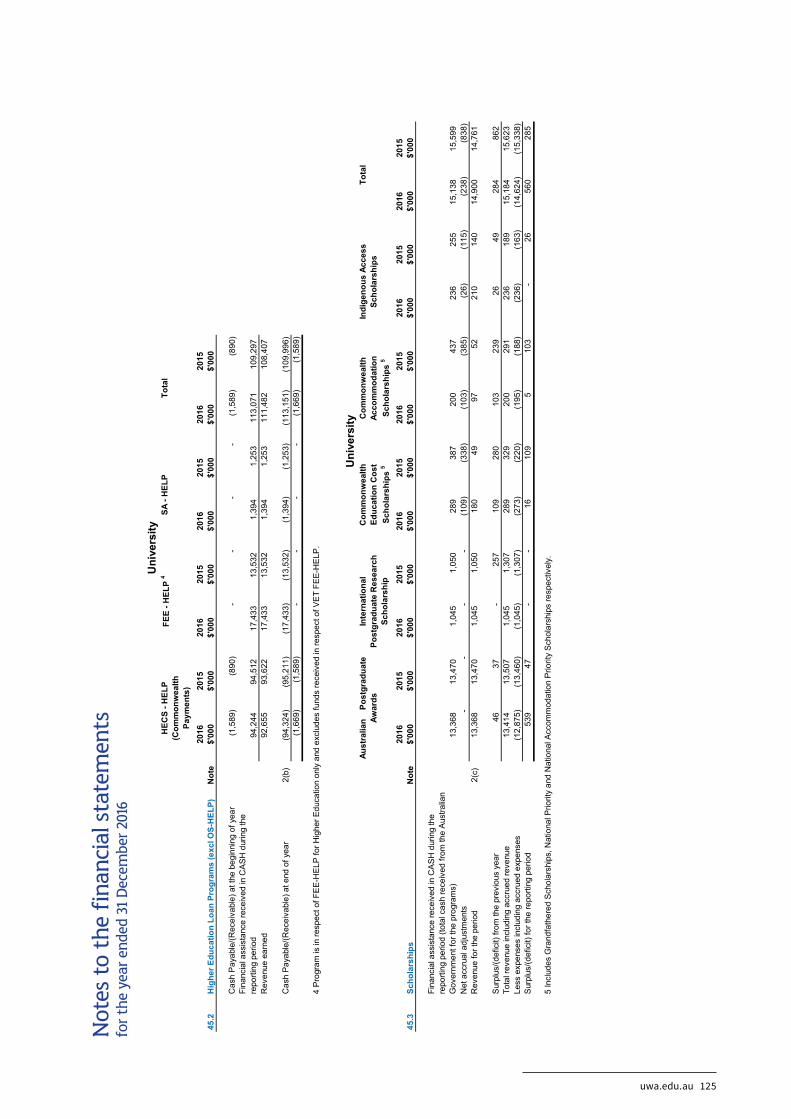
NO
TES
TO T
HE
FIN
ANC
IAL
STAT
EMEN
TSfo
r the
yea
r end
ed 3
1 D
ecem
ber 2
016
2016
2015
2016
2015
2016
2015
2016
2015
45.2
Hig
her E
duca
tion
Loan
Pro
gram
s (e
xcl O
S-H
ELP)
Not
e$'
000
$'00
0$'
000
$'00
0$'
000
$'00
0$'
000
$'00
0
Cas
h P
ayab
le/(R
ecei
vabl
e) a
t the
beg
inni
ng o
f yea
r(1
,589
)(8
90)
--
--
(1,5
89)
(890
)Fi
nanc
ial a
ssis
tanc
e re
ceiv
ed in
CA
SH
dur
ing
the
repo
rting
per
iod
94,2
4494
,512
17,4
3313
,532
1,39
41,
253
113,
071
109,
297
Rev
enue
ear
ned
92,6
5593
,622
17,4
3313
,532
1,39
41,
253
111,
482
108,
407
Cas
h P
ayab
le/(R
ecei
vabl
e) a
t end
of y
ear
2(b)
(94,
324)
(95,
211)
(17,
433)
(13,
532)
(1,3
94)
(1,2
53)
(113
,151
)(1
09,9
96)
(1,6
69)
(1,5
89)
--
--
(1,6
69)
(1,5
89)
4 P
rogr
am is
in re
spec
t of F
EE
-HE
LP fo
r Hig
her E
duca
tion
only
and
exc
lude
s fu
nds
rece
ived
in re
spec
t of V
ET
FEE
-HE
LP.
2016
2015
2016
2015
2016
2015
2016
2015
2016
2015
2016
2015
45.3
Scho
lars
hips
Not
e$'
000
$'00
0$'
000
$'00
0$'
000
$'00
0$'
000
$'00
0$'
000
$'00
0$'
000
$'00
0
Fina
ncia
l ass
ista
nce
rece
ived
in C
AS
H d
urin
g th
e re
porti
ng p
erio
d (to
tal c
ash
rece
ived
from
the
Aus
tralia
n G
over
nmen
t for
the
prog
ram
s)13
,368
13,4
701,
045
1,05
028
938
720
043
723
625
515
,138
15,5
99N
et a
ccru
al a
djus
tmen
ts-
--
-(1
09)
(338
)(1
03)
(385
)(2
6)(1
15)
(238
)(8
38)
Rev
enue
for t
he p
erio
d2(
c)13
,368
13,4
701,
045
1,05
018
049
9752
210
140
14,9
0014
,761
Sur
plus
/(def
icit)
from
the
prev
ious
yea
r46
37-
257
109
280
103
239
2649
284
862
Tota
l rev
enue
incl
udin
g ac
crue
d re
venu
e13
,414
13,5
071,
045
1,30
728
932
920
029
123
618
915
,184
15,6
23Le
ss e
xpen
ses
incl
udin
g ac
crue
d ex
pens
es(1
2,87
5)(1
3,46
0)(1
,045
)(1
,307
)(2
73)
(220
)(1
95)
(188
)(2
36)
(163
)(1
4,62
4)(1
5,33
8)S
urpl
us/(d
efic
it) fo
r the
repo
rting
per
iod
539
47-
-16
109
510
3-
2656
028
5
5 In
clud
es G
rand
fath
ered
Sch
olar
ship
s, N
atio
nal P
riorit
y an
d N
atio
nal A
ccom
mod
atio
n P
riorit
y S
chol
arsh
ips
resp
ectiv
ely.
Indi
geno
us A
cces
s Sc
hola
rshi
psTo
tal
HEC
S - H
ELP
(Com
mon
wea
lth
Paym
ents
)
FEE
- HEL
P 4
SA -
HEL
PTo
tal
Uni
vers
ity
Uni
vers
ityAu
stra
lian
Po
stgr
adua
te
Awar
ds
Inte
rnat
iona
l Po
stgr
adua
te R
esea
rch
Scho
lars
hip
Com
mon
wea
lth
Educ
atio
n C
ost
Scho
lars
hips
5
Com
mon
wea
lth
Acco
mm
odat
ion
Scho
lars
hips
5
Not
es t
o t
he
fin
anci
al s
tate
men
ts
for
the
year
en
ded
31
Dec
emb
er 2
016
uwa.edu.au 125
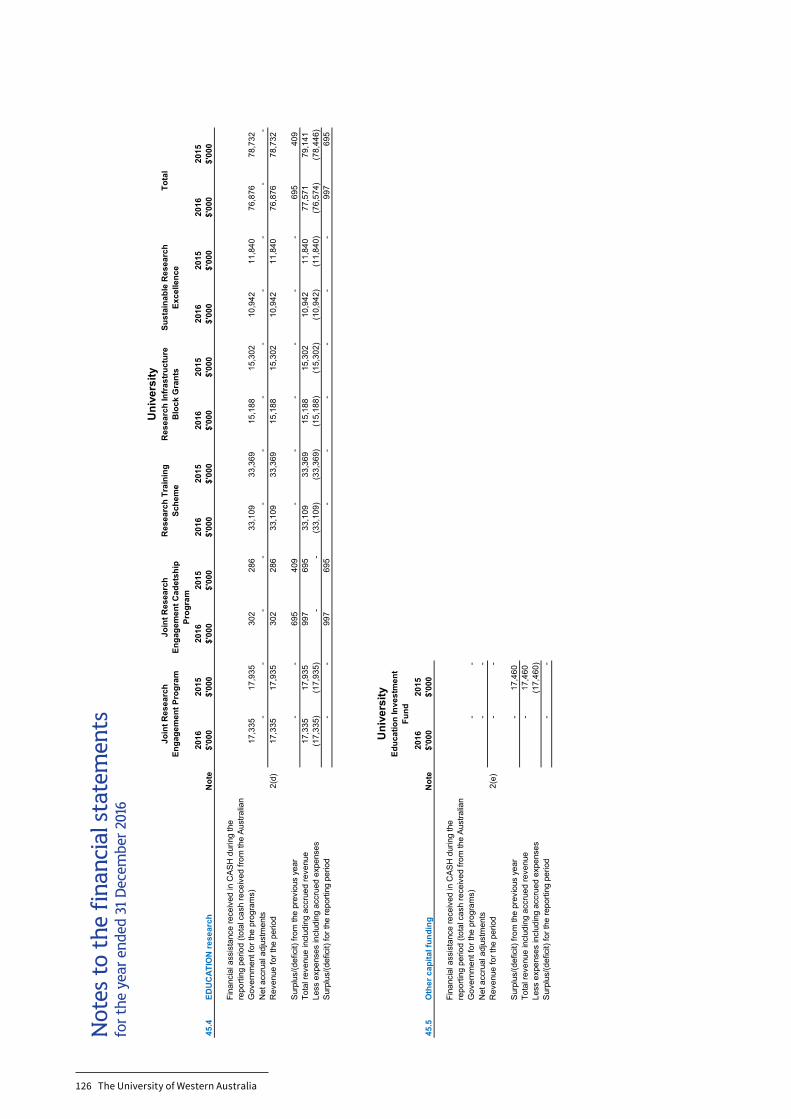
NO
TES
TO T
HE
FIN
ANC
IAL
STAT
EMEN
TSfo
r the
yea
r end
ed 3
1 D
ecem
ber 2
016
2016
2015
2016
2015
2016
2015
2016
2015
2016
2015
2016
2015
45.4
EDU
CAT
ION
rese
arch
Not
e$'
000
$'00
0$'
000
$'00
0$'
000
$'00
0$'
000
$'00
0$'
000
$'00
0$'
000
$'00
0
Fina
ncia
l ass
ista
nce
rece
ived
in C
AS
H d
urin
g th
e re
porti
ng p
erio
d (to
tal c
ash
rece
ived
from
the
Aus
tralia
n G
over
nmen
t for
the
prog
ram
s)17
,335
17,9
3530
228
633
,109
33,3
6915
,188
15,3
0210
,942
11,8
4076
,876
78,7
32N
et a
ccru
al a
djus
tmen
ts-
--
--
--
--
--
-R
even
ue fo
r the
per
iod
2(d)
17,3
3517
,935
302
286
33,1
0933
,369
15,1
8815
,302
10,9
4211
,840
76,8
7678
,732
Sur
plus
/(def
icit)
from
the
prev
ious
yea
r-
-69
540
9-
--
--
-69
540
9To
tal r
even
ue in
clud
ing
accr
ued
reve
nue
17,3
3517
,935
997
695
33,1
0933
,369
15,1
8815
,302
10,9
4211
,840
77,5
7179
,141
Less
exp
ense
s in
clud
ing
accr
ued
expe
nses
(17,
335)
(17,
935)
--
(33,
109)
(33,
369)
(15,
188)
(15,
302)
(10,
942)
(11,
840)
(76,
574)
(78,
446)
Sur
plus
/(def
icit)
for t
he re
porti
ng p
erio
d-
-99
769
5-
--
--
-99
769
5
2016
2015
45.5
Oth
er c
apita
l fun
ding
Not
e$'
000
$'00
0
Fina
ncia
l ass
ista
nce
rece
ived
in C
AS
H d
urin
g th
e re
porti
ng p
erio
d (to
tal c
ash
rece
ived
from
the
Aus
tralia
n G
over
nmen
t for
the
prog
ram
s)-
-N
et a
ccru
al a
djus
tmen
ts-
-R
even
ue fo
r the
per
iod
2(e)
--
Sur
plus
/(def
icit)
from
the
prev
ious
yea
r-
17,4
60To
tal r
even
ue in
clud
ing
accr
ued
reve
nue
-17
,460
Less
exp
ense
s in
clud
ing
accr
ued
expe
nses
(17,
460)
Sur
plus
/(def
icit)
for t
he re
porti
ng p
erio
d-
-
Uni
vers
ity
Sust
aina
ble
Res
earc
h Ex
celle
nce
Tota
lR
esea
rch
Infr
astr
uctu
re
Blo
ck G
rant
s
Educ
atio
n In
vest
men
t Fu
nd
Uni
vers
ityJo
int R
esea
rch
Enga
gem
ent P
rogr
am
Join
t Res
earc
h En
gage
men
t Cad
etsh
ip
Prog
ram
Res
earc
h Tr
aini
ng
Sche
me
Not
es t
o t
he
fin
anci
al s
tate
men
ts
for
the
year
en
ded
31
Dec
emb
er 2
016
126 The University of Western Australia
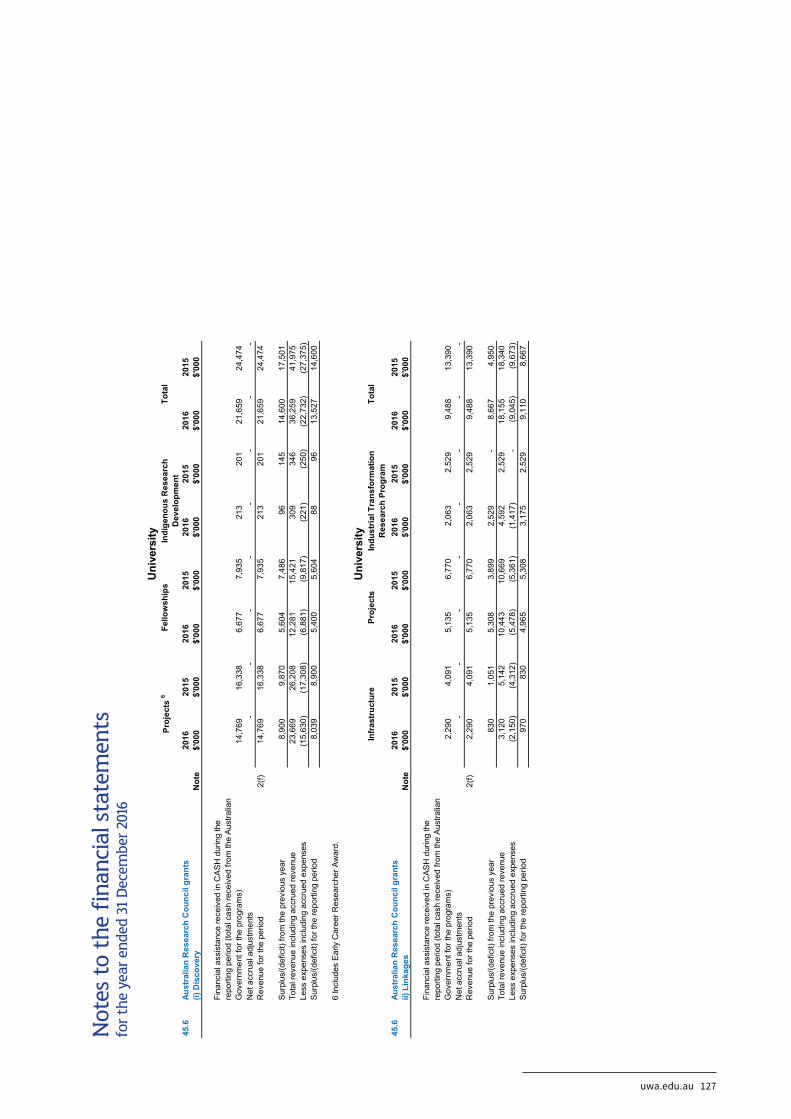
NO
TES
TO T
HE
FIN
ANC
IAL
STAT
EMEN
TSfo
r the
yea
r end
ed 3
1 D
ecem
ber 2
016
45.6
Aust
ralia
n R
esea
rch
Cou
ncil
gran
ts20
1620
1520
1620
1520
1620
1520
1620
15(i)
Dis
cove
ryN
ote
$'00
0$'
000
$'00
0$'
000
$'00
0$'
000
$'00
0$'
000
Fina
ncia
l ass
ista
nce
rece
ived
in C
AS
H d
urin
g th
e re
porti
ng p
erio
d (to
tal c
ash
rece
ived
from
the
Aus
tralia
n G
over
nmen
t for
the
prog
ram
s)14
,769
16,3
386,
677
7,93
521
320
121
,659
24,4
74N
et a
ccru
al a
djus
tmen
ts-
--
--
--
-R
even
ue fo
r the
per
iod
2(f)
14,7
6916
,338
6,67
77,
935
213
201
21,6
5924
,474
Sur
plus
/(def
icit)
from
the
prev
ious
yea
r8,
900
9,87
05,
604
7,48
696
145
14,6
0017
,501
Tota
l rev
enue
incl
udin
g ac
crue
d re
venu
e23
,669
26,2
0812
,281
15,4
2130
934
636
,259
41,9
75Le
ss e
xpen
ses
incl
udin
g ac
crue
d ex
pens
es(1
5,63
0)(1
7,30
8)(6
,881
)(9
,817
)(2
21)
(250
)(2
2,73
2)(2
7,37
5)S
urpl
us/(d
efic
it) fo
r the
repo
rting
per
iod
8,03
98,
900
5,40
05,
604
8896
13,5
2714
,600
6 In
clud
es E
arly
Car
eer R
esea
rche
r Aw
ard.
45.6
Aust
ralia
n R
esea
rch
Cou
ncil
gran
ts20
1620
1520
1620
1520
1620
1520
1620
15ii)
Lin
kage
sN
ote
$'00
0$'
000
$'00
0$'
000
$'00
0$'
000
$'00
0$'
000
Fina
ncia
l ass
ista
nce
rece
ived
in C
AS
H d
urin
g th
e re
porti
ng p
erio
d (to
tal c
ash
rece
ived
from
the
Aus
tralia
n G
over
nmen
t for
the
prog
ram
s)2,
290
4,09
15,
135
6,77
02,
063
2,52
99,
488
13,3
90N
et a
ccru
al a
djus
tmen
ts-
--
--
--
-R
even
ue fo
r the
per
iod
2(f)
2,29
04,
091
5,13
56,
770
2,06
32,
529
9,48
813
,390
Sur
plus
/(def
icit)
from
the
prev
ious
yea
r83
01,
051
5,30
83,
899
2,52
9-
8,66
74,
950
Tota
l rev
enue
incl
udin
g ac
crue
d re
venu
e3,
120
5,14
210
,443
10,6
694,
592
2,52
918
,155
18,3
40Le
ss e
xpen
ses
incl
udin
g ac
crue
d ex
pens
es(2
,150
)(4
,312
)(5
,478
)(5
,361
)(1
,417
)-
(9,0
45)
(9,6
73)
Sur
plus
/(def
icit)
for t
he re
porti
ng p
erio
d97
083
04,
965
5,30
83,
175
2,52
99,
110
8,66
7
Indi
geno
us R
esea
rch
Dev
elop
men
tTo
tal
Uni
vers
ityIn
dust
rial T
rans
form
atio
n R
esea
rch
Prog
ram
Uni
vers
ityPr
ojec
ts 6
Fello
wsh
ips
Infr
astr
uctu
rePr
ojec
tsTo
tal
Not
es t
o t
he
fin
anci
al s
tate
men
ts
for
the
year
en
ded
31
Dec
emb
er 2
016
uwa.edu.au 127
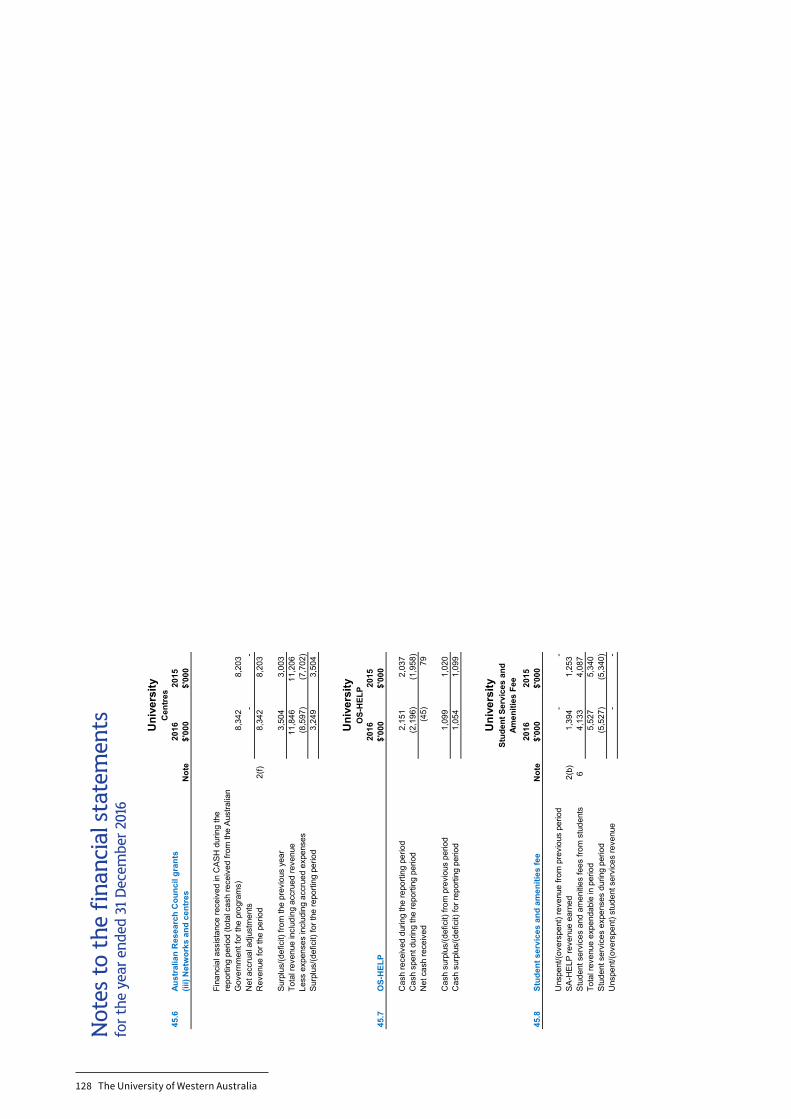
NO
TES
TO T
HE
FIN
ANC
IAL
STAT
EMEN
TSfo
r the
yea
r end
ed 3
1 D
ecem
ber 2
016
45.6
Aust
ralia
n R
esea
rch
Cou
ncil
gran
ts20
1620
15(ii
i) N
etw
orks
and
cen
tres
Not
e$'
000
$'00
0
Fina
ncia
l ass
ista
nce
rece
ived
in C
AS
H d
urin
g th
e re
porti
ng p
erio
d (to
tal c
ash
rece
ived
from
the
Aus
tralia
n G
over
nmen
t for
the
prog
ram
s)8,
342
8,20
3N
et a
ccru
al a
djus
tmen
ts-
-R
even
ue fo
r the
per
iod
2(f)
8,34
28,
203
Sur
plus
/(def
icit)
from
the
prev
ious
yea
r3,
504
3,00
3To
tal r
even
ue in
clud
ing
accr
ued
reve
nue
11,8
4611
,206
Less
exp
ense
s in
clud
ing
accr
ued
expe
nses
(8,5
97)
(7,7
02)
Sur
plus
/(def
icit)
for t
he re
porti
ng p
erio
d3,
249
3,50
4
2016
2015
45.7
OS-
HEL
P$'
000
$'00
0
Cas
h re
ceiv
ed d
urin
g th
e re
porti
ng p
erio
d2,
151
2,03
7C
ash
spen
t dur
ing
the
repo
rting
per
iod
(2,1
96)
(1,9
58)
Net
cas
h re
ceiv
ed(4
5)79
Cas
h su
rplu
s/(d
efic
it) fr
om p
revi
ous
perio
d1,
099
1,02
0C
ash
surp
lus/
(def
icit)
for r
epor
ting
perio
d1,
054
1,09
9
2016
2015
45.8
Stud
ent s
ervi
ces
and
amen
ities
fee
Not
e$'
000
$'00
0
Uns
pent
/(ove
rspe
nt) r
even
ue fr
om p
revi
ous
perio
d-
-S
A-H
ELP
reve
nue
earn
ed2(
b)1,
394
1,25
3S
tude
nt s
ervi
ces
and
amen
ities
fees
from
stu
dent
s6
4,13
34,
087
Tota
l rev
enue
exp
enda
ble
in p
erio
d5,
527
5,34
0S
tude
nt s
ervi
ces
expe
nses
dur
ing
perio
d(5
,527
)(5
,340
)U
nspe
nt/(o
vers
pent
) stu
dent
ser
vice
s re
venu
e-
-
Uni
vers
ity
Uni
vers
ity
Uni
vers
itySt
uden
t Ser
vice
s an
d Am
eniti
es F
ee
OS-
HEL
P
Cen
tres
Not
es t
o t
he
fin
anci
al s
tate
men
ts
for
the
year
en
ded
31
Dec
emb
er 2
016
128 The University of Western Australia