Embed Size (px)
DESCRIPTION
Financial Statement Analysis
Citation preview

6-1
Chapter 6
Financial Statement Analysis
Financial Statement Analysis
© Pearson Education Limited 2004Fundamentals of Financial Management, 12/e
Created by: Gregory A. Kuhlemeyer, Ph.D.Carroll College, Waukesha, WI

6-2
After studying Chapter 6, you should be able to:
Understand the purpose of basic financial statements and their contents.
Explain why financial statement analysis is important to the firm and to outside suppliers of capital.
Define, calculate, and categorize (according to liquidity, financial leverage, coverage, activity, and profitability) the major financial ratios and understand what they can tell us about the firm.
Define, calculate, and discuss a firm’s operating cycle and cash cycle.
Use ratios to analyze a firm's health and then recommend reasonable alternative courses of action to improve the health of the firm.
Analyze a firm’s return on investment (i.e., “earning power”) and return on equity using a DuPont approach.
Understand the limitations of financial ratio analysis. Use trend analysis, common-size analysis, and index analysis to
gain additional insights into a firm's performance.
6-3
Financial Statement AnalysisFinancial Statement Analysis
Financial Statements A Possible Framework for Analysis Balance Sheet Ratios Income Statement and Income
Statement/Balance Sheet Ratios Trend Analysis Common-Size and Index Analysis
Financial Statements A Possible Framework for Analysis Balance Sheet Ratios Income Statement and Income
Statement/Balance Sheet Ratios Trend Analysis Common-Size and Index Analysis

6-4
Examples of External Uses of Statement AnalysisExamples of External Uses of Statement Analysis
Trade Creditors -- Focus on the liquidity of the firm.
Bondholders -- Focus on the long-term cash flow of the firm.
Shareholders -- Focus on the profitability and long-term health of the firm.
Trade Creditors -- Focus on the liquidity of the firm.
Bondholders -- Focus on the long-term cash flow of the firm.
Shareholders -- Focus on the profitability and long-term health of the firm.
6-5
Examples of Internal Uses of Statement AnalysisExamples of Internal Uses of Statement Analysis
Plan -- Focus on assessing the current financial position and evaluating potential firm opportunities.
Control -- Focus on return on investment for various assets and asset efficiency.
Understand -- Focus on understanding how suppliers of funds analyze the firm.
Plan -- Focus on assessing the current financial position and evaluating potential firm opportunities.
Control -- Focus on return on investment for various assets and asset efficiency.
Understand -- Focus on understanding how suppliers of funds analyze the firm.

6-6
Primary Types of Financial StatementsPrimary Types of Financial Statements
Income Statement A summary of a firm’s revenues and
expenses over a specified period, ending with net income or loss for the period.
Income Statement A summary of a firm’s revenues and
expenses over a specified period, ending with net income or loss for the period.
Balance Sheet A summary of a firm’s financial position on
a given date that shows total assets = total liabilities + owners’ equity.
Balance Sheet A summary of a firm’s financial position on
a given date that shows total assets = total liabilities + owners’ equity.
6-7
Basket Wonders’ Balance Sheet (Asset Side)Basket Wonders’ Balance Sheet (Asset Side)
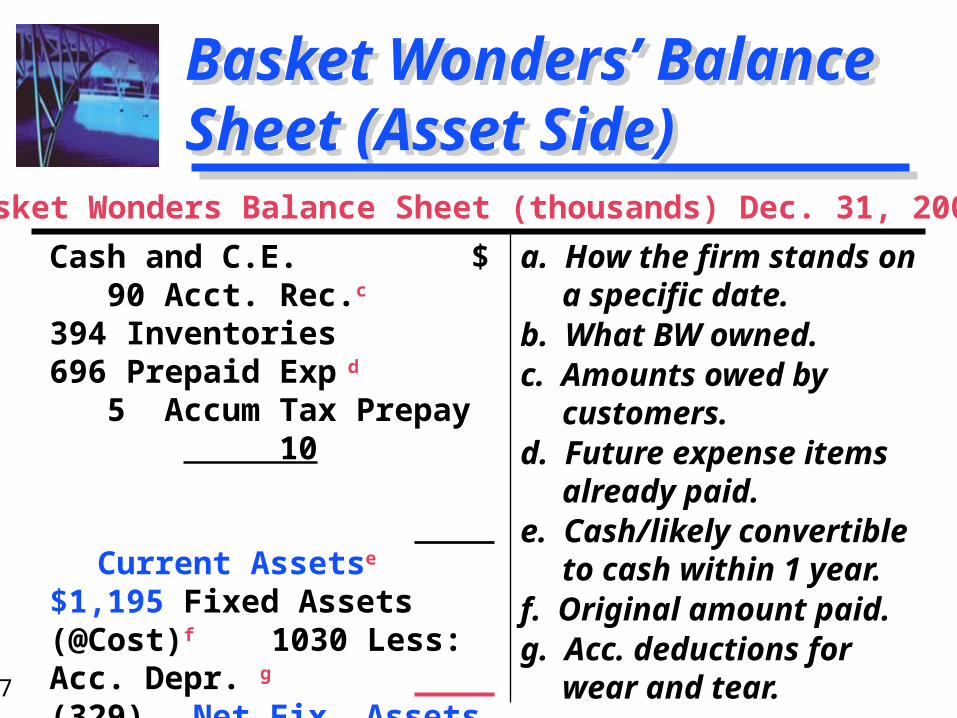
a. How the firm stands on a specific date.
b. What BW owned.c. Amounts owed by
customers.d. Future expense items
already paid.e. Cash/likely convertible
to cash within 1 year.f. Original amount paid.g. Acc. deductions for
wear and tear.
a. How the firm stands on a specific date.
b. What BW owned.c. Amounts owed by
customers.d. Future expense items
already paid.e. Cash/likely convertible
to cash within 1 year.f. Original amount paid.g. Acc. deductions for
wear and tear.
Cash and C.E. $ 90 Acct. Rec.c 394 Inventories 696 Prepaid Exp d 5 Accum Tax Prepay 10 Current Assetse $1,195 Fixed Assets (@Cost)f 1030 Less: Acc. Depr. g (329)
Net Fix. Assets $ 701 Investment, LT 50 Other Assets, LT 223
Total Assets b $2,169
Basket Wonders Balance Sheet (thousands) Dec. 31, 2007a

6-8
Basket Wonders’ Balance Sheet (Liability Side)Basket Wonders’ Balance Sheet (Liability Side)
a. Note, Assets = Liabilities + Equity.
b. What BW owed and ownership position.
c. Owed to suppliers for goods and services.
d. Unpaid wages, salaries, etc.
e. Debts payable < 1 year.f. Debts payable > 1 year.g. Original investment. h. Earnings reinvested.
a. Note, Assets = Liabilities + Equity.
b. What BW owed and ownership position.
c. Owed to suppliers for goods and services.
d. Unpaid wages, salaries, etc.
e. Debts payable < 1 year.f. Debts payable > 1 year.g. Original investment. h. Earnings reinvested.
Notes Payable $ 290 Acct. Payablec 94 Accrued Taxes d 16 Other Accrued Liab. d 100 Current Liab. e $ 500 Long-Term Debt f
530 Shareholders’ Equity Com. Stock ($1 par) g 200 Add Pd in Capital g
729 Retained Earnings h 210 Total Equity $1,139 Total Liab/Equitya,b $2,169
Basket Wonders Balance Sheet (thousands) Dec. 31, 2007

6-9
Basket Wonders’ Income StatementBasket Wonders’ Income Statement
a. Measures profitability over a time period.
b. Received, or receivable, from customers.
c. Sales comm., adv., officers’ salaries, etc.
d. Operating income.e. Cost of borrowed funds.f. Taxable income.g. Amount earned for
shareholders.
a. Measures profitability over a time period.
b. Received, or receivable, from customers.
c. Sales comm., adv., officers’ salaries, etc.
d. Operating income.e. Cost of borrowed funds.f. Taxable income.g. Amount earned for
shareholders.
Net Sales $ 2,211 Cost of Goods Sold b 1,599
Gross Profit $ 612 SG&A Expenses c 402 EBITd $ 210 Interest Expensee 59 EBT f $ 151 Income Taxes 60 EATg $ 91 Cash Dividends 38 Increase in RE $ 53
Basket Wonders Statement of Earnings (in thousands) for Year Ending December 31, 2007a

6-10
Use of Financial RatiosUse of Financial Ratios
Types of Comparisons
Internal Comparisons
External Comparisons
Types of Comparisons
Internal Comparisons
External Comparisons
A Financial Ratio is an index that relates
two accounting numbers and is
obtained by dividing one number by the
other.

6-11
External Comparisons and Sources of Industry RatiosExternal Comparisons and Sources of Industry Ratios
This involves comparing the ratios of one firm with those of similar firms or with
industry averages.
Similarity is important as one should compare “apples to apples.”

6-12
Liquidity RatiosLiquidity Ratios
Current
Current AssetsCurrent Liabilities
For Basket Wonders
December 31, 2007
Current
Current AssetsCurrent Liabilities
For Basket Wonders
December 31, 2007
Shows a firm’s ability to cover its current liabilities with its current
assets.
Balance Sheet Ratios
Liquidity Ratios
$1,195$500
= 2.39

6-13
Liquidity Ratio ComparisonsLiquidity Ratio Comparisons
BW Industry
2.39 2.15
2.26 2.09
1.91 2.01
BW Industry
2.39 2.15
2.26 2.09
1.91 2.01
Year
2007
2006
2005
Current Ratio
Ratio is stronger than the industry average.

6-14
Liquidity RatiosLiquidity Ratios
Acid-Test (Quick)
Cash + AR + MSCurrent Liabilities
For Basket Wonders
December 31, 2007
Acid-Test (Quick)
Cash + AR + MSCurrent Liabilities
For Basket Wonders
December 31, 2007
Shows a firm’s ability to meet
current liabilities with its most liquid
assets.
Balance Sheet Ratios
Liquidity Ratios
$485$500
= 0.968
6-15
Liquidity Ratio ComparisonsLiquidity Ratio Comparisons
BW Industry
0.97 1.25
1.04 1.23
1.11 1.25
BW Industry
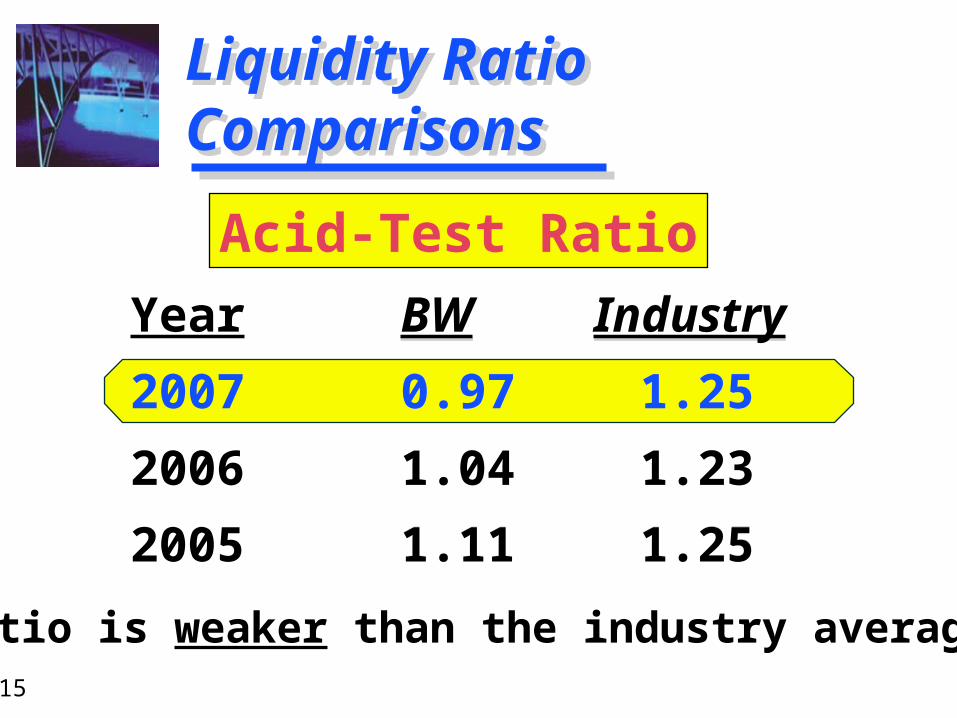
0.97 1.25
1.04 1.23
1.11 1.25
Year
2007
2006
2005
Acid-Test Ratio
Ratio is weaker than the industry average.

6-16
Summary of the Liquidity Ratio ComparisonsSummary of the Liquidity Ratio Comparisons
Strong current ratio and weak acid-test ratio indicates a potential problem in the inventories account.
Note that this industry has a relatively high level of inventories.
Strong current ratio and weak acid-test ratio indicates a potential problem in the inventories account.
Note that this industry has a relatively high level of inventories.
Ratio BW Industry
Current 2.39 2.15
Acid-Test1.00 1.25

6-17
Current Ratio -- Trend Analysis ComparisonCurrent Ratio -- Trend Analysis Comparison
Trend Analysis of Current Ratio
1.5
1.7
1.9
2.1
2.3
2.5
2005 2006 2007
Analysis Year
Rat
io V
alu
e
BW
Industry

6-18
Acid-Test Ratio -- Trend Analysis ComparisonAcid-Test Ratio -- Trend Analysis Comparison
Trend Analysis of Acid-Test Ratio
0.5
0.8
1.0
1.3
1.5
2005 2006 2007
Analysis Year
Rat
io V
alu
e
BW
Industry

6-19
Summary of the Liquidity Trend AnalysesSummary of the Liquidity Trend Analyses
The current ratio for the industry has been rising slowly at the same time the acid-test ratio has been relatively stable.
This indicates that inventories are a significant problem for BW.
The current ratio for the industry has been rising slowly at the same time the acid-test ratio has been relatively stable.
This indicates that inventories are a significant problem for BW.
The current ratio for BW has been rising at the same time the acid-test ratio has been declining.
The current ratio for BW has been rising at the same time the acid-test ratio has been declining.

6-20
Financial Leverage RatiosFinancial Leverage Ratios
Debt-to-Equity
Total DebtShareholders’
Equity
For Basket Wonders
December 31, 2007
Debt-to-Equity
Total DebtShareholders’
Equity
For Basket Wonders
December 31, 2007
Shows the extent to which the firm is financed by debt.
Balance Sheet Ratios
Financial LeverageRatios
$1,030$1,139
= .90

6-21
Financial Leverage Ratio ComparisonsFinancial Leverage Ratio Comparisons
BW Industry
.90 .90
.88 .90
.81 .89
BW Industry
.90 .90
.88 .90
.81 .89
Year
2007
2006
2005
Debt-to-Equity Ratio
BW has average debt utilizationrelative to the industry average.

6-22
Financial Leverage RatiosFinancial Leverage Ratios
Debt-to-Total-Assets
Total DebtTotal Assets
For Basket Wonders
December 31, 2007
Debt-to-Total-Assets
Total DebtTotal Assets
For Basket Wonders
December 31, 2007
Shows the percentage of the firm’s assets
that are supported by debt financing.
Balance Sheet Ratios
Financial LeverageRatios
$1,030$2,169
= .47
6-23
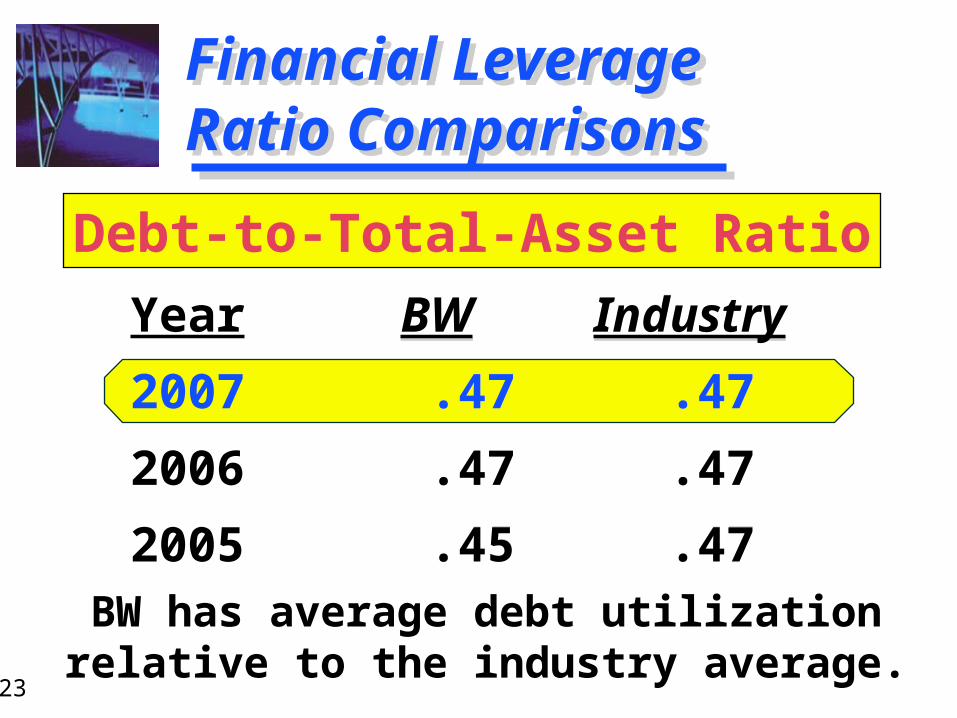
Financial Leverage Ratio ComparisonsFinancial Leverage Ratio Comparisons
BW Industry
.47 .47
.47 .47
.45 .47
BW Industry
.47 .47
.47 .47
.45 .47
Year
2007
2006
2005
Debt-to-Total-Asset Ratio
BW has average debt utilizationrelative to the industry average.

6-24
Financial Leverage RatiosFinancial Leverage Ratios
Total Capitalization
Long-term DebtTotal Capitalization
For Basket Wonders
December 31, 2007
Total Capitalization
Long-term DebtTotal Capitalization
For Basket Wonders
December 31, 2007
Shows the relative importance of long-
term debt to the long-term financing
of the firm.
Balance Sheet Ratios
Financial LeverageRatios
$530$1,669
= .32
(i.e., LT-Debt + Equity)

6-25
Financial Leverage Ratio ComparisonsFinancial Leverage Ratio Comparisons
BW Industry
.32 .30
.32 .31
.37 .32
BW Industry
.32 .30
.32 .31
.37 .32
Year
2007
2006
2005
Total Capitalization Ratio
BW has average long-term debt utilizationrelative to the industry average.

6-26
Coverage RatiosCoverage Ratios
Interest Coverage
EBITInterest Charges
For Basket Wonders
December 31, 2007
Interest Coverage
EBITInterest Charges
For Basket Wonders
December 31, 2007
Indicates a firm’s ability to cover
interest charges.
Income StatementRatios
Coverage Ratios
$210$59
= 3.56

6-27
CoverageRatio ComparisonsCoverageRatio Comparisons
BW Industry
3.56 5.19
4.35 5.02
10.30 4.66
BW Industry
3.56 5.19
4.35 5.02
10.30 4.66
Year
2007
2006
2005
Interest Coverage Ratio
BW has below average interest coveragerelative to the industry average.

6-28
Coverage Ratio -- Trend Analysis ComparisonCoverage Ratio -- Trend Analysis Comparison
Trend Analysis of Interest Coverage Ratio
3.0
5.0
7.0
9.0
11.0
2005 2006 2007
Analysis Year
Rat
io V
alu
e
BW
Industry
6-29
Summary of the Coverage Trend AnalysisSummary of the Coverage Trend Analysis
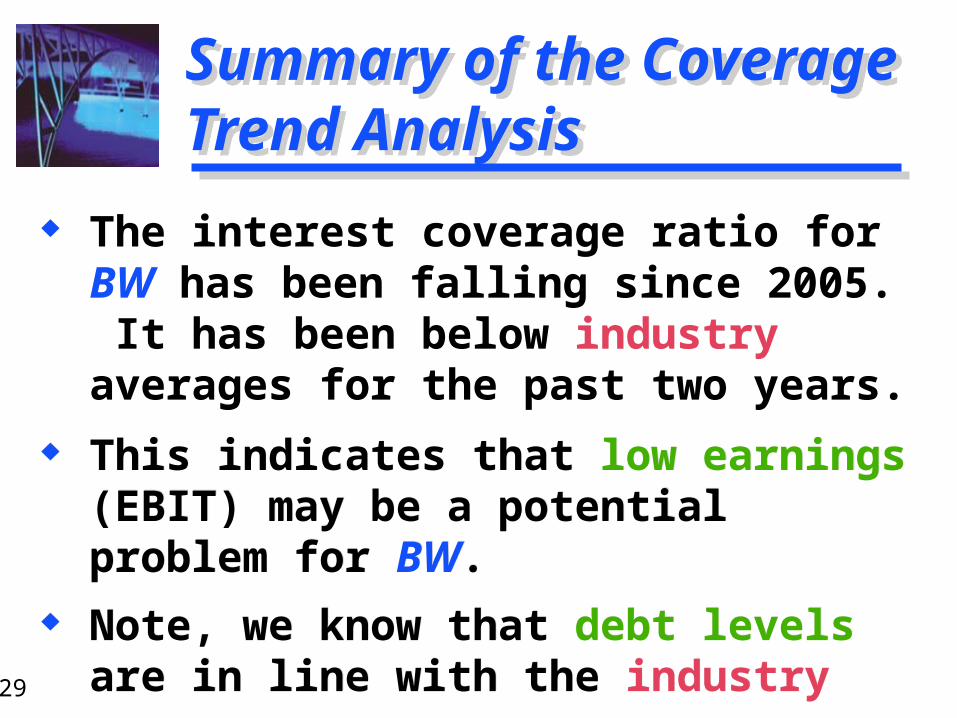
This indicates that low earnings (EBIT) may be a potential problem for BW.
Note, we know that debt levels are in line with the industry averages.
This indicates that low earnings (EBIT) may be a potential problem for BW.
Note, we know that debt levels are in line with the industry averages.
The interest coverage ratio for BW has been falling since 2005. It has been below industry averages for the past two years.
The interest coverage ratio for BW has been falling since 2005. It has been below industry averages for the past two years.

6-30
Activity RatiosActivity Ratios
Receivable Turnover
Annual Net Credit Sales
Receivables
For Basket Wonders
December 31, 2007
Receivable Turnover
Annual Net Credit Sales
Receivables
For Basket Wonders
December 31, 2007
Indicates quality of receivables and how successful the firm is in its
collections.
Income Statement /Balance Sheet
Ratios
Activity Ratios
$2,211$394
= 5.61
(Assume all sales are credit sales.)

6-31
Activity RatiosActivity Ratios
Avg Collection Period
Days in the YearReceivable Turnover
For Basket Wonders December 31, 2007
Avg Collection Period
Days in the YearReceivable Turnover
For Basket Wonders December 31, 2007Average number of
days that receivables are
outstanding.(or RT in days)
Income Statement /Balance Sheet
Ratios
Activity Ratios
3655.61
= 65 days

6-32
ActivityRatio ComparisonsActivityRatio Comparisons
BW Industry
65.0 65.7
71.1 66.3
83.6 69.2
BW Industry
65.0 65.7
71.1 66.3
83.6 69.2
Year
2007
2006
2005
Average Collection Period
BW has improved the average collection period to that of the industry average.

6-33
Activity RatiosActivity Ratios
Payable Turnover (PT)
Annual Credit Purchases
Accounts Payable
For Basket Wonders December
31, 2007
Payable Turnover (PT)
Annual Credit Purchases
Accounts Payable
For Basket Wonders December
31, 2007
Indicates the promptness of
payment to suppliers by the
firm.
Income Statement /Balance Sheet
Ratios
Activity Ratios
$1551$94 = 16.5
(Assume annual credit purchases = $1,551.)

6-34
Activity RatiosActivity Ratios
PT in Days
Days in the YearPayable Turnover
For Basket Wonders December 31, 2007
PT in Days
Days in the YearPayable Turnover
For Basket Wonders December 31, 2007
Average number of days that payables are outstanding.
Income Statement /Balance Sheet
Ratios
Activity Ratios
36516.5
= 22.1 days

6-35
ActivityRatio ComparisonsActivityRatio Comparisons
BW Industry
22.1 46.7
25.4 51.1
43.5 48.5
BW Industry
22.1 46.7
25.4 51.1
43.5 48.5
Year
2007
2006
2005
Payable Turnover in Days
BW has improved the PT in Days.Is this good?

6-36
Activity RatiosActivity Ratios
Inventory Turnover
Cost of Goods SoldInventory
For Basket Wonders December 31, 2007
Inventory Turnover
Cost of Goods SoldInventory
For Basket Wonders December 31, 2007
Indicates the effectiveness of
the inventory management
practices of the firm.
Income Statement /Balance Sheet
Ratios
Activity Ratios
$1,599$696
= 2.30
6-37
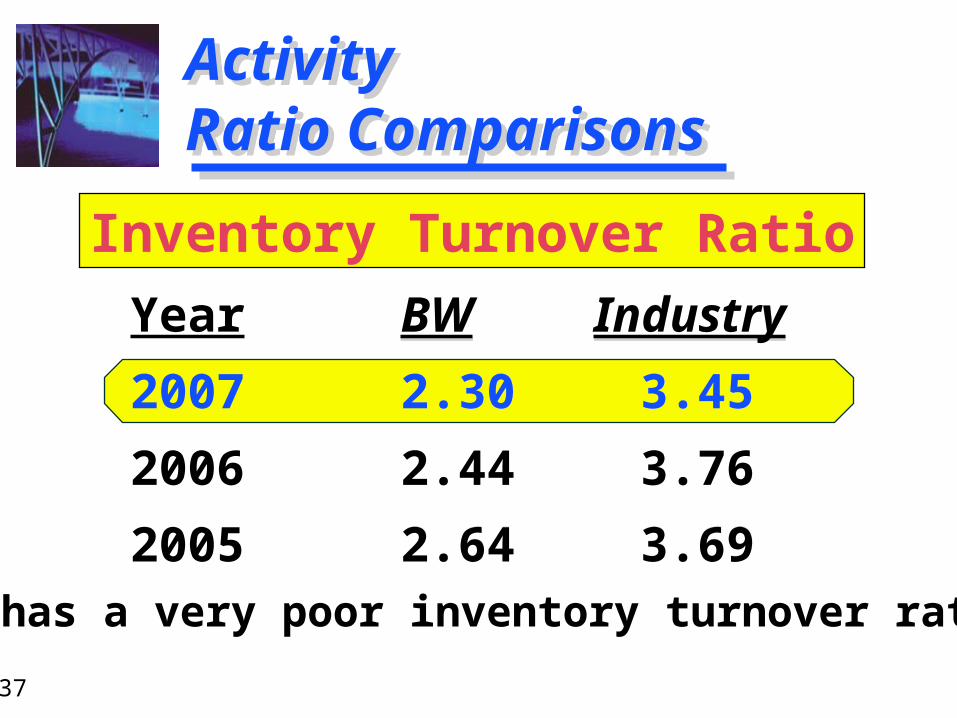
ActivityRatio ComparisonsActivityRatio Comparisons
BW Industry
2.30 3.45
2.44 3.76
2.64 3.69
BW Industry
2.30 3.45
2.44 3.76
2.64 3.69
Year
2007
2006
2005
Inventory Turnover Ratio
BW has a very poor inventory turnover ratio.

6-38
Inventory Turnover Ratio --Trend Analysis ComparisonInventory Turnover Ratio --Trend Analysis Comparison
Trend Analysis of Inventory Turnover Ratio
2.0
2.5
3.0
3.5
4.0
2005 2006 2007
Analysis Year
Rat
io V
alu
e
BW
Industry

6-39
Activity RatiosActivity Ratios
Total Asset Turnover
Net SalesTotal Assets
For Basket Wonders December 31, 2007
Total Asset Turnover
Net SalesTotal Assets
For Basket Wonders December 31, 2007
Indicates the overall
effectiveness of the firm in utilizing
its assets to generate sales.
Income Statement /Balance Sheet
Ratios
Activity Ratios
$2,211$2,169
= 1.02

6-40
ActivityRatio ComparisonsActivityRatio Comparisons
BW Industry
1.02 1.17
1.03 1.14
1.01 1.13
BW Industry
1.02 1.17
1.03 1.14
1.01 1.13
Year
2007
2006
2005
Total Asset Turnover Ratio
BW has a weak total asset turnover ratio.Why is this ratio considered weak?

6-41
Profitability RatiosProfitability Ratios
Gross Profit Margin
Gross ProfitNet Sales
For Basket Wonders December 31, 2007
Gross Profit Margin
Gross ProfitNet Sales
For Basket Wonders December 31, 2007
Indicates the efficiency of
operations and firm pricing
policies.
Income Statement /Balance Sheet
Ratios
Profitability Ratios
$612$2,211
= .277

6-42
ProfitabilityRatio ComparisonsProfitabilityRatio Comparisons
BW Industry
27.7% 31.1%
28.7 30.8
31.3 27.6
BW Industry
27.7% 31.1%
28.7 30.8
31.3 27.6
Year
2007
2006
2005
Gross Profit Margin
BW has a weak Gross Profit Margin.

6-43
Gross Profit Margin --Trend Analysis ComparisonGross Profit Margin --Trend Analysis Comparison
Trend Analysis of Gross Profit Margin
25.0
27.5
30.0
32.5
35.0
2005 2006 2007
Analysis Year
Rat
io V
alu
e (%
)
BW
Industry

6-44
Profitability RatiosProfitability Ratios
Net Profit Margin
Net Profit after Taxes
Net Sales
For Basket Wonders December 31, 2007
Net Profit Margin
Net Profit after Taxes
Net Sales
For Basket Wonders December 31, 2007
Indicates the firm’s profitability after taking account of all expenses and
income taxes.
Income Statement /Balance Sheet
Ratios
Profitability Ratios
$91$2,211
= .041

6-45
Profitability Ratio ComparisonsProfitability Ratio Comparisons
BW Industry
4.1% 8.2%
4.9 8.1
9.0 7.6
BW Industry
4.1% 8.2%
4.9 8.1
9.0 7.6
Year
2007
2006
2005
Net Profit Margin
BW has a poor Net Profit Margin.

6-46
Net Profit Margin --Trend Analysis ComparisonNet Profit Margin --Trend Analysis Comparison
Trend Analysis of Net Profit Margin
4
5
6
7
8
9
10
2005 2006 2007
Analysis Year
Rat
io V
alu
e (%
)
BW
Industry

6-47
Profitability RatiosProfitability Ratios
Return on Investment
Net Profit after Taxes
Total Assets
For Basket Wonders December 31, 2007
Return on Investment
Net Profit after Taxes
Total Assets
For Basket Wonders December 31, 2007
Indicates the profitability on the assets of the firm (after all expenses
and taxes).
Income Statement /Balance Sheet
Ratios
Profitability Ratios
$91$2,160
= .042

6-48
Profitability Ratio ComparisonsProfitability Ratio Comparisons
BW Industry
4.2% 9.8%
5.0 9.1
9.1 10.8
BW Industry
4.2% 9.8%
5.0 9.1
9.1 10.8
Year
2007
2006
2005
Return on Investment
BW has a poor Return on Investment.

6-49
Return on Investment –Trend Analysis ComparisonReturn on Investment –Trend Analysis Comparison
Trend Analysis of Return on Investment
4
6
8
10
12
2005 2006 2007
Analysis Year
Rat
io V
alu
e (%
)
BW
Industry

6-50
Profitability RatiosProfitability Ratios
Return on Equity
Net Profit after Taxes
Shareholders’ Equity
For Basket Wonders December 31, 2007
Return on Equity
Net Profit after Taxes
Shareholders’ Equity
For Basket Wonders December 31, 2007
Indicates the profitability to the shareholders of the firm (after all
expenses and taxes).
Income Statement /Balance Sheet
Ratios
Profitability Ratios
$91$1,139
= .08

6-51
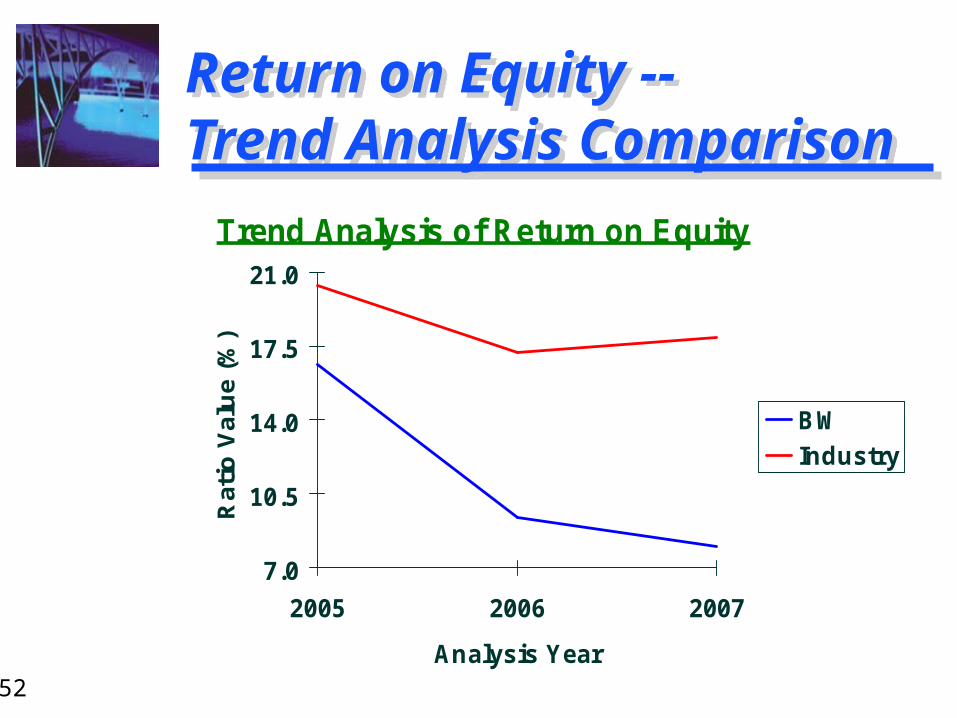
Profitability Ratio ComparisonsProfitability Ratio Comparisons
BW Industry
8.0% 17.9%
9.4 17.2
16.6 20.4
BW Industry
8.0% 17.9%
9.4 17.2
16.6 20.4
Year
2007
2006
2005
Return on Equity
BW has a poor Return on Equity.
6-52
Return on Equity --Trend Analysis ComparisonReturn on Equity --Trend Analysis Comparison
Trend Analysis of Return on Equity
7.0
10.5
14.0
17.5
21.0
2005 2006 2007
Analysis Year
Rat
io V
alu
e (%
)
BW
Industry

6-53
Return on Investment and the Du Pont ApproachReturn on Investment and the Du Pont Approach
ROI2007 = .041 x 1.02 = .042 or 4.2%
ROIIndustry = .082 x 1.17 = .098 or 9.8%
ROI2007 = .041 x 1.02 = .042 or 4.2%
ROIIndustry = .082 x 1.17 = .098 or 9.8%
ROI = Net profit margin X Total asset turnover
Earning Power = Sales profitability X Asset efficiency

6-54
Return on Equity and the Du Pont ApproachReturn on Equity and the Du Pont Approach
ROE2007 = .041 x 1.02 x 1.90 = .080
ROEIndustry = .082 x 1.17 x 1.88 = .179
ROE2007 = .041 x 1.02 x 1.90 = .080
ROEIndustry = .082 x 1.17 x 1.88 = .179
Return On Equity = Net profit margin X Total asset turnover X
Equity Multiplier
Equity Multiplier = Total Assets
Shareholders’ Equity
6-55
Summary of the Profitability Trend AnalysesSummary of the Profitability Trend Analyses
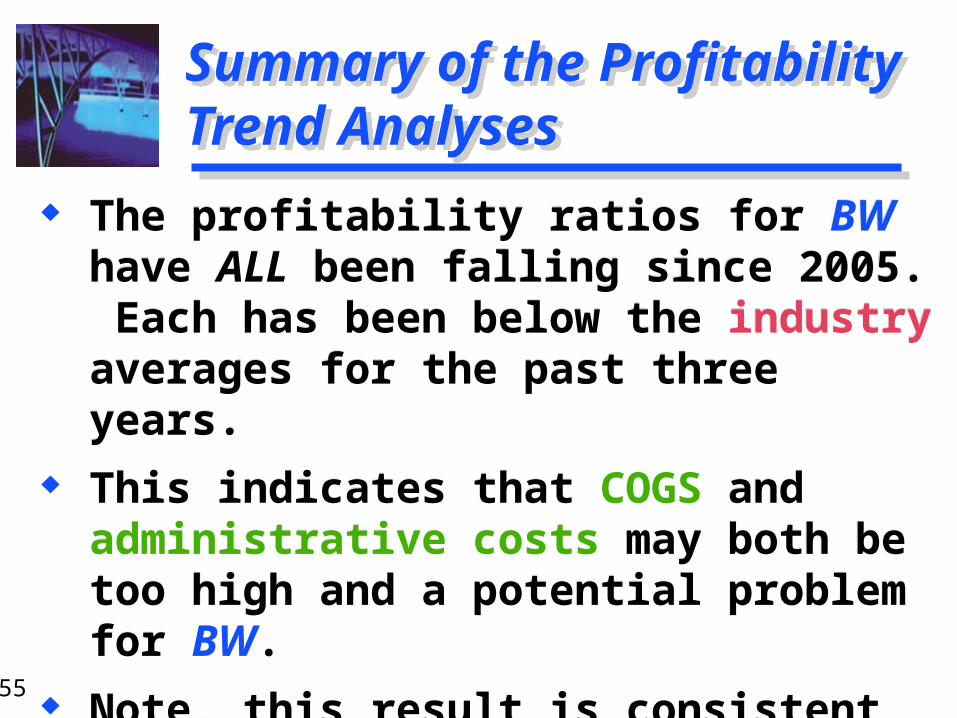
The profitability ratios for BW have ALL been falling since 2005. Each has been below the industry averages for the past three years.
This indicates that COGS and administrative costs may both be too high and a potential problem for BW.
Note, this result is consistent with the low interest coverage ratio.

6-56
Summary of Ratio AnalysesSummary of Ratio Analyses
Inventories are too high. May be paying off creditors
(accounts payable) too soon. COGS may be too high. Selling, general, and
administrative costs may be too high.
Inventories are too high. May be paying off creditors
(accounts payable) too soon. COGS may be too high. Selling, general, and
administrative costs may be too high.

6-57
Common-size AnalysisCommon-size Analysis
An analysis of percentage financial statements where all
balance sheet items are divided by total assets and all income statement items are divided by
net sales or revenues.
An analysis of percentage financial statements where all
balance sheet items are divided by total assets and all income statement items are divided by
net sales or revenues.

6-58
Basket Wonders’ Common Size Balance SheetsBasket Wonders’ Common Size Balance Sheets
Regular (thousands of $) Common-Size (%)
Assets 2005 2006 2007 2005 2006 2007
Cash 148 100 90 12.10 4.89 4.15
AR 283 410 394 23.14 20.06 18.17
Inv 322 616 696 26.33 30.14 32.09
Other CA 10 14 15 0.82 0.68 0.69
Tot CA 763 1,140 1,195 62.39 55.77 55.09
Net FA 349 631 701 28.54 30.87 32.32
LT Inv 0 50 50 0.00 2.45 2.31
Other LT 111 223 223 9.08 10.91 10.28
Tot Assets 1,223 2,044 2,169 100.0 100.0 100.0

6-59
Basket Wonders’ Common Size Balance SheetsBasket Wonders’ Common Size Balance Sheets
Regular (thousands of $) Common-Size (%)
Liab+Equity 2005 2006 2007 2005 2006 2007
Note Pay 290 295 290 23.71 14.43 13.37
Acct Pay 81 94 94 6.62 4.60 4.33
Accr Tax 13 16 16 1.06 0.78 0.74
Other Accr 15 100 100 1.23 4.89 4.61
Tot CL 399 505 500 32.62 24.71 23.05
LT Debt 150 453 530 12.26 22.16 24.44
Equity 674 1,086 1,139 55.11 53.13 52.51
Tot L+E 1,223 2,044 2,169 100.0 100.0 100.0
6-60
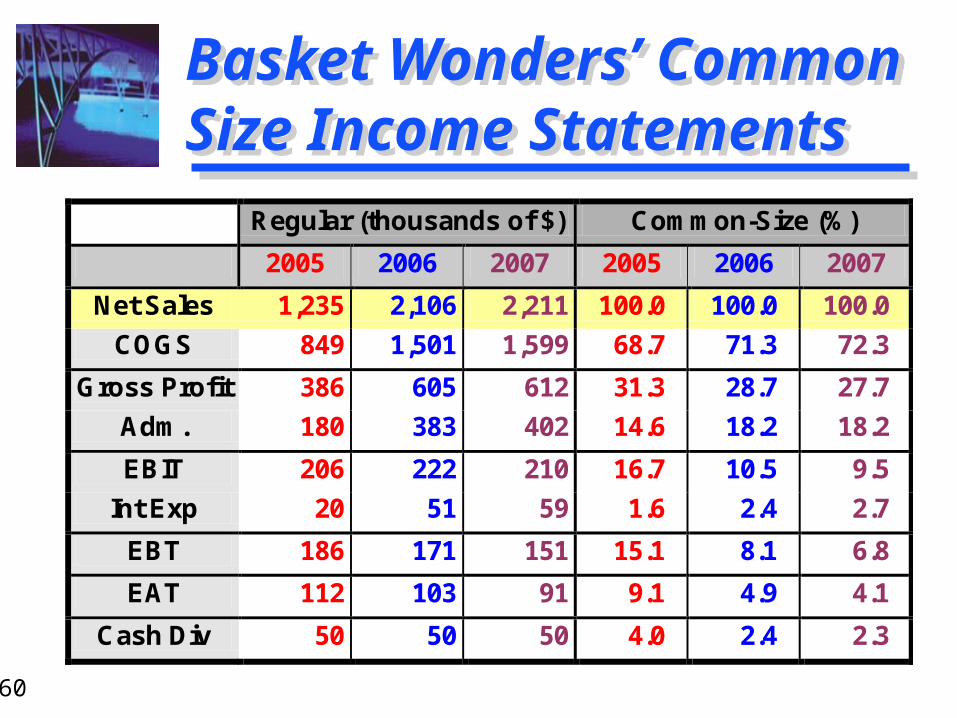
Basket Wonders’ Common Size Income StatementsBasket Wonders’ Common Size Income Statements
Regular (thousands of $) Common-Size (%)
2005 2006 2007 2005 2006 2007
Net Sales 1,235 2,106 2,211 100.0 100.0 100.0
COGS 849 1,501 1,599 68.7 71.3 72.3
Gross Profit 386 605 612 31.3 28.7 27.7
Adm. 180 383 402 14.6 18.2 18.2
EBIT 206 222 210 16.7 10.5 9.5
Int Exp 20 51 59 1.6 2.4 2.7
EBT 186 171 151 15.1 8.1 6.8
EAT 112 103 91 9.1 4.9 4.1
Cash Div 50 50 50 4.0 2.4 2.3

6-61
Index AnalysesIndex Analyses
An analysis of percentage financial statements where all balance sheet or income statement figures for a
base year equal 100.0 (percent) and subsequent financial statement
items are expressed as percentages of their values in the base year.
An analysis of percentage financial statements where all balance sheet or income statement figures for a
base year equal 100.0 (percent) and subsequent financial statement
items are expressed as percentages of their values in the base year.

6-62
Basket Wonders’ Indexed Balance SheetsBasket Wonders’ Indexed Balance Sheets
Regular (thousands of $) Indexed (%)
Assets 2005 2006 2007 2005 2006 2007
Cash 148 100 90 100.0 67.6 60.8
AR 283 410 394 100.0 144.9 139.2
Inv 322 616 696 100.0 191.3 216.1
Other CA 10 14 15 100.0 140.0 150.0
Tot CA 763 1,140 1,195 100.0 149.4 156.6
Net FA 349 631 701 100.0 180.8 200.9
LT Inv 0 50 50 100.0 inf. inf.
Other LT 111 223 223 100.0 200.9 200.9
Tot Assets 1,223 2,044 2,169 100.0 167.1 177.4

6-63
Basket Wonders’ Indexed Balance SheetsBasket Wonders’ Indexed Balance Sheets
Regular (thousands of $) Indexed (%)
Liab+Equity 2005 2006 2007 2005 2006 2007
Note Pay 290 295 290 100.0 101.7 100.0
Acct Pay 81 94 94 100.0 116.0 116.0
Accr Tax 13 16 16 100.0 123.1 123.1
Other Accr 15 100 100 100.0 666.7 666.7
Tot CL 399 505 500 100.0 126.6 125.3
LT Debt 150 453 530 100.0 302.0 353.3
Equity 674 1,086 1,139 100.0 161.1 169.0
Tot L+E 1,223 2,044 2,169 100.0 167.1 177.4

6-64
Basket Wonders’ Indexed Income StatementsBasket Wonders’ Indexed Income Statements
Regular (thousands of $) Indexed (%)
2005 2006 2007 2005 2006 2007
Net Sales 1,235 2,106 2,211 100.0 170.5 179.0
COGS 849 1,501 1,599 100.0 176.8 188.3
Gross Profit 386 605 612 100.0 156.7 158.5
Adm. 180 383 402 100.0 212.8 223.3
EBIT 206 222 210 100.0 107.8 101.9
Int Exp 20 51 59 100.0 255.0 295.0
EBT 186 171 151 100.0 91.9 81.2
EAT 112 103 91 100.0 92.0 81.3
Cash Div 50 50 50 100.0 100.0 100.0