Embed Size (px)
Citation preview
i
FINANCIAL STATEMENTS ANALYSIS AND FINANCIAL
PERFORMANCE FOR BANKS LISTED ON RWANDA STOCK OF
EXCHANGE: A COMPARATIVE STUDY FOR BANK OF KIGALI
PRE-POST LISTING
HIGANIRO MAJOGI INNOCENT
MBA/78611/14
A Research Project Submitted in Partial Fulfilment for the Award of
the Degree of Master of Business Administration (Accounting &Finance
option) of Mount Kenya University
MAY 2017

ii
DECLARATION
This research proposal is my original work and has not been presented to any other
Institution. No part of this research proposal should be reproduced without the authors‟
consent or that of Mount Kenya University.
Students Name: Higaniro Majogi Innocent
Reg: MBA/78611/14
Sign ____________________ Date _____________
This research has been submitted with my approval as The Mount. Kenya University
Supervisor.
Name: Dr. Rusibana Claude, PhD
Sign ____________________ Date _____________

iii
DEDICATION
To my beloved spouse Consolatrice Murekatete, my daughters and sons Sylvie Teta,
Trebor Shema, Theillah Shima, Doxa Touvia, and my loved late son Tracy Shami.
I deeply express my grateful thanks to my parents, Majogi Ignace and Mukasarasi
Madalina and Mukamurigo Budensiana my mother in law.

iv
ACKNOWLEDGEMENT
My gratitude to Almighty God, for the gift of life, love and blessings, perseverance to
perform this work far way.
I hereby acknowledge the Government of Rwanda, Mount Kenya University which have
ensured our Education improvement. I am grateful to the lecturers who provided their
knowledge to me during my study.
I am very thankful to Dr. Rusibana Claude, my supervisor during this work; his
availability, simplicity, and especially his scientific rigor have been of great importance
for this work to be completed.
My special thanks to my beloved spouse and children, relatives and friends for both
spiritual and material support, encouragement during my stay at Mount Kenya University.
v
ABSTRACT
Banks and other financial institutions are a unique set of business firms whose assets and
liabilities, regulatory restrictions, economic functions and operation make them an
important subject of research. Bank Performance monitoring, analysis and control deserve
special attention in respect to their operation and performance results from the viewpoint
of different stakeholders, such as investors/owners, regulators, customers, and
management.In today‟s financial world, financial performance is a mundane amongst the
perspective of various stakeholders, be it in the management, lenders, owners and
investors‟ perspective. And this is out of analysis of financial statements. Financial
performance is crucial for taking financial decisions related to planning and control.
Hence, it forms the basis as one of the paramount importance for taking financial
decisions effectively. The aim of this study is to analyse and compare the pre and post
listing impact on financial performance of Bank of Kigali; the study has covered 2008 to
2014 and was focused on profitability ratio using ROA as dependent variable and five
independent variables such Liquidity (LQR), Credit facilities (NCA), Deposit to Assets
Ratio (DTA), Capital Adequacy Ratio (CAR), Spread Ratio (SP), (AU and NPM) using
modified DuPont analysis. Listing a company on a stock exchange opens a lot of
opportunities for the business especially for financing for businesses in emerging markets.
But does listing on a stock exchange in Rwanda impact financial performance? This study
would benefit to Commercial Banks managers as it will provide them a better
understanding for the impact to list on Stock exchange; thus be able to focus on
improving these factors to ensure that their financial performance keeps
improving.Multicollinearity test was used to test the correlation between independent
variables and selected the relevant variables. For the purpose of comparison Cross-section
design was used to identify relations between dependents and potential explanatory
variables was presented. Econometric model are given to select the relevant variables for
the model. Finally the econometric specification was tested using Hausman tests. E-view
was used to run the model. The result prove that there was a positive significance between
dependent variables and dependent variable pre-post listing except liquidity ration with
negative significance and spread ratio which has proved no significance on ROA and
result for this study show that β1=0.337 and P= 0.000<5% in pre-listing,β1=-1.061 with
P=0.021<5%, β2=-0.001 with P= 0.779 >5% pre-listing and β2= 0.104 with P=0.004<5%
and prove the impact for loans and advance in post and not in pre.β3=-0.063 with P=
0.168 >5% β3= 4.486 with P=0.000<5% and this demonstrate that the deposit impacted
positively on profitability in post-period better as it had no significance in pre-listing
period. β4= 0.017 with P= 0.050 <5% pre and β4=0.427 with P=0.016<5% post-listing
prove effects of total equity for Bank of Kigali profitability strong significance post
listing better than in pre.β5=0.051 with P=0.011 pre and β5= 0.423 with P=0.351>5%prove
that there was a significance effect pre but not in post-listing period. The financial
performance of BK improved significantly from the listing period on Rwanda stock
exchange and the researcher recommend to BK to improve their Cash and cash equivalent
policy to avoid its negative effect on ROA and try to minimize the cost of borrowing and
recommend for further research using other indicators.
vi
TABLE OF CONTENTS
DECLARATION................................................................................................................ ii
DEDICATION...................................................................................................................iii
ACKNOWLEDGEMENT ................................................................................................ iv
ABSTRACT ........................................................................................................................ v
TABLE OF CONTENTS ................................................................................................. vi
LIST OF TABLES ............................................................................................................ ix
FIGURE .............................................................................................................................. x
LIST OF ACRONYMS AND ABBREVIATIONS ........................................................ xi
DEFINITION OF KEY TERMS .................................................................................... xii
CHAPTER ONE: INTRODUCTION .............................................................................. 1
1.0 Introduction .................................................................................................................... 1
1.1 Background of the Study ............................................................................................... 1
1.2 Statement of the Problem ............................................................................................... 4
1.3 Objectives of the study................................................................................................... 6
1.3.1 General Objective ....................................................................................................... 6
1.3.2 Specific objectives of the study .................................................................................. 6
1.4 Hypothesis...................................................................................................................... 6
1.5 Significance of the study ................................................................................................ 7
1.5.1 Bank Management ...................................................................................................... 7
1.5.2 Researchers and Academicians ................................................................................... 8
1.6 Limitation of the study ................................................................................................... 8
1.7 Scope of the study .......................................................................................................... 8
vii
1.7.1 Geographical Scope .................................................................................................... 8
1.7.2 Content Scope ............................................................................................................. 8
1.7.3 Time Scope ................................................................................................................. 9
1.8 Organization of the study ............................................................................................... 9
CHAPTER TWO: REVIEW OF THE RELATED LITERATURE .......................... 10
2.0 Introduction .................................................................................................................. 10
2.1 Theoretical Literature ................................................................................................... 10
2.1.1 Profit Measures and Determinants of Commercial Banks Profitability ................... 11
2.1.2 Return on Assets (ROA). .......................................................................................... 12
2.1.3 Deposits to total assets ratio (DETA) ....................................................................... 12
2.1.4 Liquidity ratio ........................................................................................................... 13
2.1.5 Capital and reserve to total assets ratio (CRTA) ...................................................... 13
2.1.6 Loans and advances to total assets ratio (LOTA) ..................................................... 13
2.1.7 Interest rate (Spread) ................................................................................................. 14
2.1.8 Limitations of Using Financial Ratios ...................................................................... 14
2.2 Empirical Literature ..................................................................................................... 16
2.3 Critical Review and Research Gap identification ........................................................ 28
2.4 Theoretical framework ................................................................................................. 29
2.5 Conceptual framework ................................................................................................. 33
CHAPTER THREE: RESEARCH METHODOLOGY .............................................. 37
3.0 Introduction .................................................................................................................. 37
3.1 Research Design........................................................................................................... 37
3.2 Target Population ......................................................................................................... 37
viii
3.3 Sample Design ............................................................................................................. 38
3.3.1 Sample Size ............................................................................................................... 38
3.4 Data Collection Methods ............................................................................................. 38
3.4.1 Data Collection Instruments ..................................................................................... 39
3.4.2 Administration of Data Collection Instruments ........................................................ 39
3.4.3 Reliability and validity .............................................................................................. 40
3.5 Data analysis Procedure ............................................................................................... 41
3.6 Econometric Model ...................................................................................................... 41
3.7 Ethical consideration .................................................................................................... 42
CHAPTER FOUR: RESEARCH FINDINGS AND DISCUSSION ........................... 43
4.0 Introduction .................................................................................................................. 43
4.2 Presentation of Findings Pre-post listing period .......................................................... 52
CHAPTER FIVE: SUMMARY, CONCLUSIONS AND RECOMMENDATIONS . 55
5.0 Introduction .................................................................................................................. 55
5.1 Summary of Findings ................................................................................................... 55
5.2 Conclusion ................................................................................................................... 57
5.3 Recommendation ......................................................................................................... 57
5.4 Suggestions for further study ....................................................................................... 58
REFFERENCES .............................................................................................................. 59
APPENDICES .................................................................................................................. 74
APPENDIX I: AUTHORIZATION LETTER .............................................................. 75
APPENDIX II: DATA COLLECTION ......................................................................... 76
ix
LIST OF TABLES
Table 2.1: Measurement of variables .................................................................................35
Table 4.1 Descriptive statistics of Independent Variables .................................................44
Table 4.2 Financial statements ratios, determinants of firm performance .........................46
Table 4.3 Correlation analysis of Variables .......................................................................47
Table 4.4 Regression analysis for independent variables on the ROA ..............................48
Table 4.5 Relationship between financial statements analysis and performance pre-listing
............................................................................................................................................49
Table 4.6 Relationship between financial statements analysis and performance post-listing
............................................................................................................................................51
Table 4.7 Hypothesis testing ..............................................................................................53

x
FIGURE
Figure 2.1: Conceptual Framework ................................................................................... 34

xi
LIST OF ACRONYMS AND ABBREVIATIONS
AU : Asset Utilization
BK : Bank of Kigali
CDR : Cash Deposit Ratio
CRTA : Capital and reserve to total assets ratio
DETA : Deposit to Total Asset Ratio
DTAR : Debt to Total Assets Ratio
DW : Durbin-Watson
EM : Equity Multiplier
IER : Income to expense Ratio
LAR : Loan and Advance to Asset Ratio
LQR : Liquidity Risk
NCA : Non Current Assets
NII : Non-Interest Income
NIM : Net Interest Margin
PER : Profit Expense Ratio
PM : Profit Margin
ROA : Return on Assets
ROD : Return on Deposit
ROE : Return on Equity
SPR : Spread Ratio
TEA : Total Equity to Assets

xii
DEFINITION OF KEY TERMS
Commercial banks are companies that take in money from individuals or companies and
use those funds to purchase financial assets such as deposits, loans, and securities as
opposed to tangible property. Commercial Banks are Depository firms and loans that pay
interest on deposits and then lend money in the form of interest-earning loans.
Financial statements analysis is the selection, evaluation, and interpretation of financial
data, along with other pertinent information, to assist in investment and financial
decision-making. The term “Financial Analysis,” also known as analysis and
interpretation of financial statements refer to the process of determining financial strength
and weaknesses of the firm by establishing strategic relationship between the items of the
balance sheet, income statement and other operative data.
Financial statements; financial statements refer to such statements, which contains
financial information about an enterprise. It is the final product of accounting work done
during the accounting period – quarterly/ half-yearly/annually. Financial statements are
prepared in monetary terms. Some refer to them as „Annual Accounts‟, when they are
prepared on a yearly basis. However, interim financial statements are prepared for a
shorter period, usually a quarter, and hence called „Quarterly Financial Statements‟.
Stock exchange; the word “Stock Exchange” is made from two words 'Stock' and
Exchange. Stock means part or fraction of the capital of a company, and Exchange means
a transferring the ownership; representing a market for purchasing and selling. Thus, we
can describe the stock exchange as a market or a place where different types of securities
are bought and sold. A stock exchange is a secondary market of securities because the
trading happens only for the securities that have already been issues to the public.
i
The financial statements are prepared by the board of directors for reporting to
shareholders in discharge of their stewardship function and hence corporate law enjoins
upon them the responsibility of laying down them before annual general meeting of the
shareholders so as to give a „true and fair view‟ of the affairs of the company.
The profit and loss account shall be annexed to the balance sheet and auditor‟s report
(including the auditor‟s separate, special, or supplementary report, if any) shall be
attached thereto. Financial statements consists the basic statement of accounts used to
convey the quantitative information of financial nature about a business to shareholders,
creditors and others interested in the reporting company‟s financial condition, result of
operation uses and sources of funds
.
1
CHAPTER ONE: INTRODUCTION
1.0 Introduction
This chapter begins by presenting a brief background of the study which is followed by
the statement of the problem, following the statements of the problem the general and
specific objectives of the study are presented. After that, the next section presents the
research hypothesis. Finally, significance of the study, scope and limitation of the study
including organization of the study are presented.
1.1 Background of the Study
Banking sector plays an important role in sustaining financial markets and has a
significant impact on the success of the economy. Sound financial health of a bank is the
guarantee not only to its depositors but is equally significant for the shareholders,
employees and whole economy as well. As a sequel to this maxim, efforts have been
made from time to time, to measure the financial position of each bank and manage it
efficiently and effectively Din Sangm, (2010). The Banking sector all over the world acts
as the life blood of modern trade and economic development and through being a major
source of finance to the economy Ongore and Kusa, (2013).
Assessing the health of an economy can be accomplished by studying the financial
performance of financial institutions, Haque and Sharma, (2011). The banking and
financial industry has become a reality in today's economy, as it is witnessing a growing
both in terms of the number of such institutions, or in terms of the amount of money
managed by or diversity activities. In spite of this progress and successes achieved by the
banking and financial institutions, it still have challenges which will require further
intensive efforts on the part of these institutions. Such to enhance the quality of its
2
products, services, diversity and to keep pace with the rapid developments taking place in
the world in this field.
Commercial banks have been attacked by the globalization, competition (from
nonbanking financial institutions) and volatile market dynamic pressures, Casu et al,
(2006). So banks attempt to find new method to improve their services. To understand the
superior performance and struggle for it, managers and policy makers stated the major
question is "What drives performance?" To address this question, researchers have
focused their efforts on the operational details Soteriou and Zenios, (1999).
In Developing countries like Rwanda, banks play a major role in financial development.
This is especially true since stock and corporate bond markets are usually underdeveloped.
Moreover, the development of the banking system and improving of its financial
performance is related to higher economic growth of a country. In Rwanda commercial
banks contribute to economic growth through their financial intermediation role. Better
performance of commercial banks is pro foundation for product innovation,
diversification and efficiency of the commercial banks Hempell, (2002).
The stability of commercial banks as whole in the economy depends on better financial
performance. Better financial performance level has tendency to absorb risks and shocks
that commercial banks can face.
Rwanda Commercial banks are faced with increasing competition and rising costs as a
result of regulatory requirements, financial and technological innovation, and entry of
large foreign banks in the retail banking environment. These changes had a dramatic
effect on the performance of the commercial banks in Rwanda.
3
Although an important and relevant information about bank's financial performance can
be provided by accounting and financial ratios, assessing the relationship among many
factors that are related to bank performance such as assets, revenue, profit, market value,
number of employees, investments, and customer satisfaction can assist in improving
bank productivity Seiford and Zhu, (1999).
The performance evaluation of a commercial banks is usually related to how well the
bank can use its assets, shareholders‟ equities and liabilities, revenues and expenses.
The evaluation of a firm‟s performance usually employs the financial ratio method,
because it provides a simple description about the firm‟s financial performance in
comparison with previous periods and helps to improve its performance of management
(Lin et al., 2005).
The financial environment of any economy consists of typically five components namely:
money, financial instruments, financial institutions, rules and regulations and financial
markets. Among the various financial institutions, banks are a fundamental component
and the most active players in the financial system Dhanabhakyam&Kavitha, (2012).
Initially studies on banks performance analysis used different financial ratios, such as
return on assets, return on investment, return on equity, equity to assets, internal growth
of equity, etc.
Though these ratios are still used in the financial industry, it has been recognized that
these ratios can be called partial productivity indicators, and holistic total factor
productivity can be measured by considering various financial indicators simultaneously
Tapas, (1998).
4
By the scope of its functions, banks are the key to economic growth of any economy
(Rashid, 2010). Further, banks are a fundamental component of the financial system, and
are also active players in financial markets Guisse, (2012).
The essential role of a bank is to connect those who have capital (such as investors or
depositors), with those who seek capital (such as individuals wanting a loan, or
businesses wanting to grow). Banks have control over a large part of the supply of money
in circulation.
Through their influence over the volume of bank money, they can influence in nature and
character of production in any country Brigham & Houston, (2011).
In consistent with Kumbirai, & Webb (2010), a single bank is highly connected with
other banks for payment system and other functions of bank such that the failure of a
single bank not only affects its shareholders and depositors rather it affects rest other
banks and even all rest other business. The failure of a single bank creates an economic
turmoil situation and is regarded as a disaster for the economy.
1.2 Statement of the Problem
Commercial Banks play vital role in the economic development of the countries, they
allocate resource and channel funds from savers to investors continuously Okoth et al.
(2013). They do so, if they get necessary earnings to cover their operational cost they
incur. Moreover for sustainable intermediation function, banks need to be gainful.
Beyond the intermediation function, the financial performance of banks has critical
implications for economic growth of countries. Good financial performance rewards the
shareholders for their investment. This in turn, gives confidence for additional investment
and brings about economic growth. On the other hand, poor management may lead to
banking failure which have negative consequence on the economic growth
Okothetal.(2013).
5
Banking efficiency is important at both macro and micro levels and in order to allocate
resources effectively, banks should be sound and efficient Hussein (2000).
Allocative efficiency is the extent to which resources are being allocated to the use with
the highest expected value. A firm is technically efficient if it produces a given set of
outputs using the smallest possible amount of inputs Falkena et al, (2004). Financial
performance or profitability can be defined as factors that are influenced by a bank‟s
management decisions. The management of enterprise is depending on accounting
information for taking various strategic decisions and financial statements provide such
information. This information is made useful by analysing and interpretation of financial
statements with help of financial analysis techniques among which the common technique
to use is financial ratios also known as accounting ratios. Accounting ratios are important
tools in the management for decision making. R.K. Sharma, Shashi K. Gupta, (2001),
financial statements are prepared primarily for decision making, but the information
provided in financial statements is not an end in itself and no meaningful conclusion can
be drawn from these statements alone. Ratio analysis helps in making decisions from the
information provided in these financial statements. Thus, the proper use of accounting
ratios assists management in communicating information which is pertinent and
purposeful for decision makers to ensure the effectiveness of management in the
enterprise.The objective of financial statements is to provide information about the
financial position, performance and changes in financial position of an enterprise that is
useful to a wide range of users in making economic decisions.
Difference between financial performances for the two different period and advice for
management decision.
6
1.3 Objectives of the study
1.3.1 General Objective
The main objective of this research was to analyze, evaluate and compare financial
statements for Bank of Kigali to determine the impact on its financial performance Pre-
Post listing on Rwanda stock Exchange.
1.3.2 Specific objectives of the study
The objectives of this study are summarized as follows:
i. To evaluate and compare the impact of Liquid assets to assets ratio for Bank of
Kigali Profitability pre and post listing to Rwanda Stock Exchange .
ii. To investigate and compare the effect of Loans and Advance to total assets ratio
for Bank of Kigali profitability pre and post listing to Rwanda Stock Exchange.
iii. To compare the impact of deposit to total assets ratio for Bank of Kigali
profitability pre and post listing to Rwanda Stock Exchange.
iv. To compare the effects of total equity to assets ratio for Bank of Kigali
profitability pre and post listing to Rwanda Stock Exchange.
v. To compare the effect of Spread ratio for Bank of Kigali profitability pre and post
listing to Rwanda Stock Exchange.
1.4 Hypothesis
The study will be based on the following hypothesis which will be developed and tested
Ho1: There is no significant relationship between Liquid assets to assets ratio and
Profitability for BK pre and post listing, to Rwanda Stock Exchange.
Ho2: There is no significant relationship for net credit facilities to total assets ratio and
Profitability for BK pre and post listing, to Rwanda Stock Exchange.
7
Ho3: There is no significance relationship between total Deposit to total assets ratio and
Profitability for BK pre and post listing, to Rwanda Stock Exchange.
Ho4: There is no significant relationship betweentotal equity to assets ratio and
Profitability for BK pre and post listing, to Rwanda Stock Exchange.
Ho5: There is no significant relationship between Spread ratio and Profitability for BK
pre and post listing, to Rwanda Stock Exchange.
1.5 Significance of the study
Rwanda has a vision 2020 agenda and one of its aims is to be a middle income economy
by the year 2020.
This can be achieved if the level of economic investment increases in the country.
It would also be crucial that equity market is developed to provide access to finance for
investors and the study will show the effect for listing on Rwanda stock Exchange (RSE),
compare the period before and after listing.
The study was motivated by the fact that, the measurement of financial performance of
the banking sector was important for several reasons.
1.5.1 Bank Management
This study will be beneficial to Commercial Banks managers as it will help them better
understand the determinant factors of their financial performance and the impact to list on
Stock exchange; thus be able to focus on improving these factors to ensure that their
financial performance keeps improving.
Financial performance is a vital factor for financial institutions wishing to carry out their
business successfully, given the increasing competition in the financial markets
Financial performance measures are critical aspects of banking sector that enable us to
distinguish banks that has the capability to survive and prosper from those that may have
8
problems with competitiveness. Additionally, financial ratios enable us to identify unique
bank strengths and weaknesses, which in itself inform bank profitability, liquidity and
credit quality.
1.5.2 Researchers and Academicians
Researchers and academicians in the field of finance, economics and banking will find
this study a useful guide for carrying out further studies in the area.
1.6 Limitation of the study
The following are the limitation of the present study:-
This study was limited to the comparative study of financial performance of two period.
This study was based on secondary data and was to analyze and evaluate data from the
latest six years period i.e. since 2008-2010 and 2012-2014 (i.e. 6 years historical data)
and the transitional year was not concerned in the study, only selected financial ratios and
statistical tools and techniques were used.
1.7 Scope of the study
1.7.1 Geographical Scope
The study was carried out in Rwanda and covered Bank of Kigali operations.
1.7.2 Content Scope
In pursuance of objective of the study attention was made and focused on the effect of
Financial Statements analysis for Bank of Kigali (BK) in order to conduct an empirical
investigation as to whether there is a relationship for Financial Performance between the
two periods under study. In view of the impossibility of covering every type of financial
statement, this study was therefore restricted to the analysis of the income statement and
the Balance Sheet for BK, by means of financial ratios and trend analysis for profitability
(ROA).
9
1.7.3 Time Scope
The study will cover the period from 2008 to 2014, three years pre and three years post
listing on Rwanda Stock Exchange (RSE). And the transition (2011) year was not
concerned by the study.
1.8 Organization of the study
This study was organized into the following three chapters: Chapter one of this study;
Introduction to the study, background of the study, statement of the problems,
significance of the study, objectives of the study, Hypothesis, Scope and limitations of the
study and Organization of the study. Chapter Two; Review of Related Literature, This
includes reviews of related literature, empirical literature, Critical Review and Research
Gap identification, theoretical framework and Conceptual framework. Chapter Three;
Research Methodology: Introduction, Research Design, Sample Design, Target
Population, Sample Design, Sample Size, Sampling Technique, Data Collection Methods,
Data Collection Instruments, Administration of Data Collection Instruments, Reliability
and validity , Data analysis Procedure, Ethical Consideration. Chapter Four: Research
Findings and Discussion: Introduction, Findings Discussion and Interpretation. Chapter
Five; Summary, Conclusions and Recommendations; Introduction, Summary and
Recommendations.
10
CHAPTER TWO: REVIEW OF THE RELATED LITERATURE
2.0 Introduction
This chapter is composed of five major parts: the related literature, empirical studies,
Critical Review, Research Gap identification, conceptual framework and the theoretical
framework.
2.1 Theoretical Literature
With regards to the discussions and analysis of the various theories and issues involve in
this part of the study. The study has chosen to expound on the various theories in books,
articles and working papers to be able layout or explore the factors characterizing the
profitability of Commercial Banks from Financial statements analysis to draw the
financial performance and profitability, this part of the thesis was focused on theories
which include profit measurement theories and various profit determinants and financial
performance theories of commercial banks. According to Pandey (1997) has defined as
the finance statement provides a summarized view of the financial operation of the firm.
Therefore, something can be learnt about a firm and careful examination of the financial
statements as invaluable documents or performance reports. Thus, the analysis of
financial statement is an important aid to financial analysis or ratio analysis is main tool
of financial statement analysis.
Beginning with Beaver's (1966) expressed that standard financial ratios can predict the
financial performance of firms, many subsequent studies have attempted to demonstrate
the predictive value of various techniques for estimating actual business performance.
According to Meigs and Meigs (2003), the purpose of financial statement analysis is to
provide information about a business unit for decision making purpose and such
11
information need not to be limited to accounting data. While ratios and other relationships
based on past performance may be helpful in predicting the future earnings performance
and financial health of a company, we must be aware of the inherent limitations of such
data.
According to Baisi (2005) and Foster (1986) ratio analysis is importance to provides the
framework for the decision making; used by analyst to judge the performance of the
company; used in credit analysis to make judgment with regard to provide loans or not, it
is frequently used by the banks.
2.1.1 Profit Measures and Determinants of Commercial Banks Profitability
With regards to the main focus of this study, the elaboration of the various profit
measures and determinants theories which has been considered in other related studies is
very significant to the realization of the factors to be investigated in this study. According
to Devinaga Rasiah (2010) documented that most researchers who focused their studies in
this area are for instance, divide the determinants of commercial banks performance and
profitability into two categories thus, the Internal and the External factors. According to
Husni (2011) the internal determinants of banks profitability are normally consisting of
factors that are within the control of commercial banks. They are the factors which affect
the revenue and the cost of the banks. Some studies classified them into two categories
namely the financial statement variables and non-financial variables. The financial
statement variables include factors that are directly related to the bank‟s balance sheet and
income statement. Whiles, the non-financial statement variables include factors like the
number of branches of a particular bank, location and size of the bank; Haron, Sudin
(2004).According to Anthony Karkrah and Ameyaw (2010) many researchers have
presented ROA as an appropriate measure of bank profitability.
12
2.1.2 Return on Assets (ROA).
This study was considered Return on Assets as profitability measures. According to
Rasiah (2010) presented that banks generate income mostly on their assets and the assets
could be termed as income and non-income generating. With regards to commercial
banks income Rasiah (2010) classified it into two, namely interest and non-interest
income. The interest income consist of rates charge on loans, overdraft and trade finance
which the banks offers to customers. Whereas, the non-interest income is consisting of
fees, commissions, brokerage charges and returns on investments in subsidiaries and
securities. According to Vong et al (2009), the major source of banks revenue is interest
income. It contributes the major income of commercial banks earnings. The other source
of banks revenue includes dividends and gains from dealing in the securities market.
There could be also some minor sources of income for instance earnings from trust
activities and service charges on deposit accounts; Vong et al (2009).
The return on total assets of the bank: Base on the argument made by Rivard and Thomas
(1997) that bank profitability is best measured by ROA because ROA cannot be distorted
by high equity multiplier. This study will choose to use (ROA) thus returns on total assets
to measure performance of the banks. ROA in actual sense signifies managerial efficiency,
in other words it depicts how effective and efficient the management of banks has been as
they seek to transform assets into earnings. The ROA is defined as net income divided by
total assets.
2.1.3 Deposits to total assets ratio (DETA)
The effect of fund source (DETA) on profitability is captured by the deposits/total assets
ratio. It is believed to be the major and the cheapest source of funding for banks,
empirical evidence provided by Husni Ali Khrawish (2011) prove that customer deposits
13
impact banking performance positively as long as there is a sufficient demand for loans in
the market.
2.1.4 Liquidity ratio
According to Devinaga Rasiah (2010) commercial banks are required by regulators to
hold a certain level of liquidity assets. And the reason behind this regulation is to make
sure that the commercial banks always possess enough liquidity in order to be able to deal
with bank runs. He further argue that a bank assume the status of highly liquid only if it
has been able to accumulate enough cash and have in possession other liquid assets as
well as having the ability to raise funds quickly from other sources to be able to meet its
payment obligation and other financial commitments on time.
2.1.5 Capital and reserve to total assets ratio (CRTA)
This is defined as total equity over total assets; this is expected to uncover the capital
adequacy of the banks and capture the general average safety and soundness of the banks.
According to Molyneux (1993) banks with high level of equity can reduce their cost of
capital and that could impact positively on profitability.
2.1.6 Loans and advances to total assets ratio (LOTA)
This reveals the asset composition which is estimated by total loans and advances divided
by total asset. Loans provide major means of earnings for commercial banks and it is
often believed that the more banks offer loans the more it does generate revenue and more
profit; Abreu and Mendes (2000). Base on this loans are expected to have a positive
relationship with bank performance.
14
2.1.7 Interest rate (Spread)
Devinaga Rasiah (2010) advocates that interest rate have been captured in most studies as
profitability determinant of commercial banks because net interest income which results
from the deference between interest income and interest expenses has enormous impact
on banks profitability. He stated that most research papers on banks‟ profit determinants
present the interest rate as external variable because changes in interest rates is mostly
cause by government economic policies and supply and demand market conditions.
Moreover, He mentioned that the impact of interest rate changes on the commercial banks
profitability depend on the extent and speed at which the change have on short and long
term period of banks portfolio. And also the speed and flexibility with which the bank can
amend its revenue sources and cost of funds to match up to the change. In addition, it is
also about the proportionality of the bank‟s assets and liabilities that are long period
rather than short period. further stated that the interest rate fluctuations does affect the
long term maturity assets of the commercial banks as well hence profitability with a view
that whenever the general market interest rates falls the market value of longer assets with
fixed contractual terms will increase.
2.1.8 Limitations of Using Financial Ratios
Financial ratios have certain limitations in their use and are not meant to be applied as
definitive answers. They are usually used to provide additional details in the
determination of the results of financial and managerial decisions. They can provide clues
to the company‟s performance or financial situation.
However, on their own, they cannot explain whether performance is good or bad. As for
the external financial analysis, ratios also play a role of basic indicators, showing just an
overview of studying business entity. Ratios have to be interpreted carefully. Some of the
limitations about using ratios in financial analysis are Girmachew(2010).
15
Ratios with large deviations from the norm only indicate symptoms of a problem. It is
essential always to carry out additional analysis based on internal data to isolate the
causes of the problem. Ratio analysis just directs attention to potential weak spots. It does
not provide conclusive evidence and only shows the existence of a problem; there is
considerable subjectivity involved, as there is no “correct” number for the various ratios.
Further, it is hard to reach a definite conclusion when some of the ratios are favorable and
some are unfavorable;
Ratios may not be strictly comparable for different firms due to a variety of factors such
as different accounting practices or different fiscal year periods. Furthermore, if a firm is
engaged in diverse product lines, it may be difficult to identify the industry category to
which the firm belongs. Also, just because a specific ratio is better than the average does
not necessarily mean that the company is doing well; it is quite possible rest of the
industry is doing very poorly;
Ratios are based on financial statements that reflect the past and not the future. Unless the
ratios are stable, it may be difficult to make reasonable projections about future trends.
Furthermore, financial statements such as the balance sheet indicate the picture at “one
point” in time, and thus may not be representative of longer periods;
Financial statements provide an assessment of the costs and not value. For example, fixed
assets are usually shown on the balance sheet as the cost of the assets less their
accumulated depreciation, which may not reflect the actual current market value of those
assets;
16
Financial statements do not include all items. For example, it is hard to put a value on
human capital (such as management expertise). And recent accounting scandals have
brought light to the extent of financing that may occur off the balance sheet;
Results can be distorted by inflation, which can cause the book values of inventory and
depreciable assets to differ greatly from their true (replacement) values. Additionally,
inventory costs and depreciation write-offs can differ from their true values, thereby
distorting profits. Without adjustment, inflation tends to cause older firms (older assets) to
appear more efficient and profitable than newer firms (newer assets); « Difficulty to
decide the proper basis of comparison. The problem of standards of comparison is usually
an important case. It is also impossible to compile an industry wide averages or ratios that
serve as a useful standard to measure all firms; « The standard of comparison do not
consider the different technological, social, market, etc. , conditions of a company;
2.2 Empirical Literature
Summary of previous Empirical studies on financial performance analysis in the context
of different countries. This section gives a brief review of the previous studies made on
the determinants of bank financial performance from both developed and developing
countries.
The study in US by Bordeleau E., et al. (2010) presented The effect of liquid asset
holdings on U.S. and Canadian banks and the Results proposed that profitability is
improved for banks that hold some liquid assets, however, there is a place at which
holding further liquid assets minimize a banks‟ profitability, all else equal.
The Study in Australia by Olagunju, David and Samuel (2012) found out that there is a
positive significant relationship between liquidity and profitability. They concluded that
17
there is a bi-directional relationship between liquidity and profitability where the
profitability in commercial banks is significantly influenced by liquidity and vice-versa
The study in Swiss by Liu et al. (2010) stated that there is empirical evidence that
liquidity, measured by total loans to total assets, positively affects bank profitability.
Abreu and Mendes (2002) stated that liquidity is negatively affects bank profitability
measured by ROA, ROE and NIM Another determinant of profitability is the level of
operational efficiency.
The study in China by Heffernan and Fu (2010) seek to see the performance banks
between 1999 and 2006 and examine the determinants that affect the performance. The
findings show that NIM and Economic Value Added do better than Return on Average
Assets and Return on Average Equity. They also find that the type of bank is an
influential factor of bank profitability while bank size is not an influential factor. They do
not find any effect from the bank listing and the percentage of foreign ownership to
profitability.
The Study in India by Narang et al (2011), Chaudhry (2012), and Uppal et al (2012).
Have examined Indian banking system in terms of their performance and profitability.
And found that some banks achieved excellent performance with regard to index of
interest earned to total assets ratio.
The study in India by Chaudhary (2012) made an analysis of the performance of selected
public and private banks on the basis of parameters recommended in the CAMEL Model.
Researchers have taken various parameters to evaluate banks' performance such as
The Study in Australia by Olagunju, David and Samuel (2012) found out that there is a
positive significant relationship between liquidity and profitability. They concluded that
18
there is a bi-directional relationship between liquidity and profitability where the
profitability in commercial banks is significantly influenced by liquidity and vice-versa
The study in Swiss by Liu et al. (2010) stated that there is empirical evidence that
liquidity, measured by total loans to total assets, positively affects bank profitability.
Abreu and Mendes (2002) stated that liquidity is negatively affects bank profitability
measured by ROA, ROE and NIM Another determinant of profitability is the level of
operational efficiency.
The study in China by Heffernan and Fu (2010) seek to see the performance banks
between 1999 and 2006 and examine the determinants that affect the performance. The
findings show that NIM and Economic Value Added do better than Return on Average
Assets and Return on Average Equity. They also find that the type of bank is an
influential factor of bank profitability while bank size is not an influential factor. They do
not find any effect from the bank listing and the percentage of foreign ownership to
profitability.
The Study in India by Narang et al (2011), Chaudhry (2012), and Uppal et al (2012).
Have examined Indian banking system in terms of their performance and profitability.
And found that some banks achieved excellent performance with regard to index of
interest earned to total assets ratio.
The study in India by Chaudhary (2012) made an analysis of the performance of selected
public and private banks on the basis of parameters recommended in the CAMEL Model.
Researchers have taken various parameters to evaluate banks' performance such as
business per employee, profit per employee, total deposits, total advances, total
19
investment, total assets, total income, total expenditure and net profits. They suggested
that suitable and stringent efficient management information system should be developed.
The study in India by Uppal (2010) and Ramaratnam et al (2011) examined certain key
parameters to evaluate the performance of the Indian banks during the global financial
turmoil. Chaudhary et al (2011) made a comparative study of public and private sector
banks to evaluate their performance. They suggested that suitable and stringent efficient
management information system should be developed.
The studies in Pakistan by Khizer et al (2011), about banks‟ profitability, stated a
significant relation between asset management ratios, capital and economic growth and
with ROA, the operating efficiency, asset management and economic growth are
significant with the ROE. On the other hand, domestic banks are determined to have a
lesser capital adequacy ratio than foreign banks.
The study in Pakistan by SairaJavaid et.al (2011). examined the profitability of top 10 the
commercial banks for the period of 2004-2008.Pooled ordinary least square has been used
to check the impact of internal factors includes assets, loan, equity and deposits on the
profitability of banks on dependant variable called return on asset (ROA).The study found
that internal factors stated above effect the bank‟s profitability. Bank size or total assets
does not lead any profitability of commercial.
The study in Pakistan by Gul et al. (2011).Examined the relationship between bank
specific and macro-economic characteristics of bank profitability by using data of top
fifteen commercial banks over the period 2005-2009. They used the pooled Ordinary
Least Square (POLS) method to investigate the impact of assets, loans, equity, deposits,
economic growth, inflation and market capitalization on major profitability indicators i.e.,
20
return on asset (ROA), return on equity (ROE), return on capital employed (ROCE) and
net interest margin (NIM) separately. Stated that the empirical results have found strong
evidence that both internal and external factors have a strong influence on the profitability.
The study in Pakistan by Ali et al. (2011) conducted a comprehensive study about banks‟
profitability where they found significant relation between asset management ratio,
capital and economic growth and with ROA.
The study in Indonesia by Syafri (2012). Checked the profitability of the commercial
banks listed in the stock exchange for the period of 2002 to 2011 using pooling data from
commercial banks. He applied the pooling data regression model in which return on
assets is dependent variable and internal and external determinants have been used as
independent variables. He has said in his research that loan to total assets, total equity to
total assets have positive effect on profitability while on the other hand bank size and cost
to income ratio have negative effect and economic growth and non-interest income to
total assets have no effect.
The study in Iran by Yadollahzadehetal. (2013).Examine the effective factors on the
performance of commercial banks in for nine commercial banks during 2006- 2010 using
panel data regression method. They considered Return on asset and return on equity as
dependent variables which are separately examined by explanatory variables including
bank's size, gearing ratio, nonperforming loans, asset management, operating efficiency
and capital adequacy ratio. Their research results show that the variables of bank's size,
management efficiency and capital adequacy ratio have a positive effect on the
performance of commercial banks while the variables of operating efficiency, gearing
ratio and non-performing loans have a negative effect on the performance.
21
The study Iran by Shahchera M. (2012)presented the influence of liquid asset holdings on
Iranian banks profitability by using the Generalized Method of Moment (GMM), this
study analysed the profitability of listed banks using unbalanced panel data for the period
2002-2009, and used the liquidity asset and liquidity asset- square for estimating liquid
asset and profitability relationship. The estimated relationship between liquid assets and
bank profitability is as predictable. Coefficients for the liquid assets ratio, its square,
business cycle, regulation and its product of interaction business cycle and regulation are
all statistically significant. The study found evidence of a non‐linear relationship between
profitability and liquid asset holdings. A substantial result of this study is that the
business cycles significantly influence bank profits. The coefficient of regulation is
negative and significant.
The study in Saudi Arabia by Almumani (2014). The purpose of his study was to analyse
and compare the performance of Saudi banks that listed in stocks market for the period
2007-2011. The study was an evaluator in nature, drawing sources of information from
secondary data. The financial performance of banks is studied on the basis of financial
ratios and variables. Financial performance was measured by two approaches; trend
analysis and inter-firm analysis. It was found that increasing of assets, operating expenses,
and cost to income causes a decrease in Saudi bank‟s profitability, while increasing of
operating income causes an increase in the profitability of Saudi Banks. Analysis show
that all the variables of study have a positive mean value and all banks are generating
income. Saudi joint venture banks proved to be more proficient in generating profits,
absorbing loan losses and dominating in ROE, while, Saudi established banks have more
capacity of absorbing asset losses and dominating in ROA.
22
The study in Jordan by Abdelkarim Almumani (2013).Analysed the internal factors that
impact on the profitability of the commercial banks listed in Amman Stock Exchange for
the duration of 2005-2011.The study constitutes that the cost-income ratio has a
significant collide with the profitability of commercial banks.
The study in Jordan by Almazari (2011). attempted basically to measure the financial
performance of seven Jordanian commercial banks for the period 2005-2009, by using
simple regression in order to estimate the impact of independent variable represented by;
the bank size, asset management, and operational efficiency on dependent variable
financial performance represented by; return on assets and interest income size. It was
found that a bank with higher total deposits, credits, assets, and shareholders‟ equity does
not always mean that has better profitability performance. Also found that there exists a
positive correlation between financial performance and asset size, asset utilization and
operational efficiency, which was also confirmed with regression analysis that financial
performance is greatly influenced by these independent factors.
The study in Malaysia by Masood and Ashraf (2012). Conducted a study on determinants
of Islamic banks on panel countries data. The results of study signified that larger assets
size banks lead to higher profitability and management efficiency can work for better
return on assets (ROA). The efficiency of management for effective running of operating
expenses effect bank profitability significantly and positively.
The study in Palestinian by Alkhatib (2012). empirically examined the financial
performance of five commercial banks listed on Palestine securities exchange(PEX).to
assess the financial performance of Palestinian commercial banks, Alkhatib(2012)
developed 3 models; each consists of one dependent variable and 4 identical independent
23
variables. He used ROA as an internal financial performance indicator the Tobin‟s Q
model (price/book) as a market financial performance indicator and finally the economic
value added as an economic financial performance indicator. Bank size, credit risk,
operational efficiency and asset management were used as independent variables. The
study employed the correlation and multiple regression analysis of annual time series data
from 2005-2010.the result of the research reveal that, bank size and asset management
were positively related with ROA but credit risk and operational efficiency were
negatively correlated with ROA under the first model. Under the second model both bank
size and asset management were positively correlated whereas credit risk and operational
efficiency is negatively correlated with the market performance of banks measured by
Tobin‟s Q. under the third model that is the model which use economic performance of
banks measured by EVA, except operational efficiency, bank size, credit risk and asset
management ratio were positively correlated with EVA.
The study in Malaysia by Asma et al., (2011). Reviewed the profitability determinants of
Islamic banks in Malaysia. The bank-specific determinants such as bank size, liquidity,
capital adequacy, expense management and credit risk effect were went through and
found that the only bank size statistically affects the Islamic banks profitability in
Malaysia.
The study in Malaysian by Lamarana (2012).Examined the performance of the local
banks and foreign banks and compares their profitability in the financial sector. This
comparative study aims to investigate the factors influencing bank profitability in for the
period 2005-2011 covering 16 major commercial banks (8 locally owned and 8 foreign
owned).he use ROA and ROE as a dependent variable. On the other hand, capital
24
adequacy, asset quality, management efficiency, liquidity and bank size are the
independent variables. The researcher use regression analysis to the panel data. The
comparison between the two categories of ownership indicates that foreign banks are
more profitable than domestic banks.
The Study in South Africa by Kumbirai, and Webb (2010) investigated the performance
of South Africa‟s commercial banking sector for the period 2005- 2009. Financial ratios
are employed to measure the profitability, liquidity and credit quality performance of five
large South African based commercial banks. The study found that overall bank
performance increased considerably in the first two years of the analysis. A significant
change in trend is noticed at the onset of the global financial crisis in 2007, reaching its
peak during 2008-2009. This resulted in falling profitability, low liquidity and
deteriorating credit quality in the South African Banking sector.
The study in Nigeria by Uremadu S. (2012), presented the effect of bank capital structure
and liquidity on profitability using Nigerian data during the period from1980 to 2006
studied is the data were analysed using descriptive statistics and the auto-regressive
distributed lag (ADL) model. The study practised data on an OLS methodology that
incorporated unit root tests for stationary and co- integration. The study found a positive
impact of cash reserve ratio, liquidity ratio and a negative effect of bank credits to the
domestic economy, savings deposit rate, gross national savings (proxy for deposits with
the central bank), balances with the central bank, inflation rate and foreign private
investments, on banking system profits. They equally noticed that liquidity ratio drive
banks‟ profits in Nigeria, closely followed by balances with the central bank and then,
gross national savings and foreign private investments, followed case in that order.
25
The study in Nigeria by Adebayo O. et al. (2011) stated that the point to which effective
liquidity management impacts profitability in commercial banks and how commercial
banks can stimulate their liquidity and profitability situation by using quantitative
methods of research. Many findings were reaching through the analysis of both the
structured and unstructured questionnaire on the management of banks and the financial
reports of the tested banks. The data obtained from the Primary and Secondary sources
were analysed through collection, sorting and grouping of the data in tables of
percentages and frequency distribution. The hypothesis was statistically tested through
Pearson correlation data analysis. Findings indicated that there is significant relationship
between liquidity and profitability. That means profitability in commercial banks is
significantly influenced by liquidity and vice versa. The study concluded that for the
prosperity of operations and survival, commercial banks should not expose efficient and
effective liquidity management and that both illiquidity and excess liquidity are "financial
diseases" that can simply wear out the profit rule of a bank as they affect banks in order to
arrive high profitability level.
The study in Nigeria by Saleem Q., et al. (2011). Presented the relationship between
liquidity and profitability and results revealed that there is a significant impact of only
liquid ratio on ROA.
The study in Ghana by Lartey V., et al. (2013) stated the relationship between the
liquidity and the profitability of banks listed on Ghana Stock Exchange is presented.
Seven out of the nine listed banks were involved in the study. The study was descriptive
in nature. It used the longitudinal time dimension, specifically, the panel method.
26
Document analysis was the main research procedure used to collect secondary data for
the study. The financial reports of the seven listed banks were studied and relevant
liquidity and profitability ratios were computed. The trend in liquidity and profitability
were determined by the use of time series analysis. The main liquidity ratio was regressed
on the profitability ratio. It was revealed that for the period 2005-2010, both the liquidity
and the profitability were dropping. It was also revealed that there was a very weak
positive relationship between the liquidity and the profitability of the listed banks in
Ghana.
The study in Ghana by Karkrah and Ameyaw (2010) on profitability determinants of
commercial banks revealed that the equity ratio which is the measure of the capital
strength of the banks posted a positive relation with the banks ROA. They documented
that their finding is in line with the findings of Suffian et al (2008) which reveals positive
relation between Philippines banks level of capitalization and profitability. The result was
also consistent with the finding of Berger (1995), Demirguc-Kunt and Huizinga (1999),
Pasiouras and Kosmidou (2007). Capital ratio was presented in Devinaga Rasiah (2010)
study as (CTRA) Capital and reserve as a percentage of total assets.
The study in Ghana by Devinaga Rasiah (2010) asserted that the lower returns on liquid
assets and excessive fund which has not been invested may also negatively affect the
profitability of banks. And because of this, liquidity management serves as an important
determinant of commercial bank profitability. It may not be prudent for commercial
banks to hold huge amount of an idle funds because it deprive the banks of income and
profitability. This is because the more the banks turn funds into loans or invest them the
27
more its accumulate income and profit. This has been confirmed by the study of
Eichengreen& Gibson (2001) which documented that the fewer the amount of funds tied
up in liquid investment and the liquid assets the higher the profitability.
The study in Ghana by Karkrah and Ameyaw (2010) supported by the empirical findings
which revealed that non-interest income is an important driver of commercial banks
profitability and there is a positive relationship existing between non-interest income and
profitability in the Ghanaian banking sector. However P. I. Vong et al (2009) cited in
their study that the findings of Gischer and Juttner (2001) prove that non-interest income
generating services impact negatively on commercial banks‟ profitability. According to
them, Gischer and Juttner (2001) claim that the negative relationship exhibited by their
observation is attributed to the fact that the non-income generating services are more
prone to intense competition than the traditional income activities of the banks.
The study in Ghana by Karkrah and Ameyaw (2010) on profitability determinants of
commercial banks revealed that the equity ratio which is the measure of the capital
strength of the banks posted a positive relationship with the banks ROA which was in line
with the study of Suffian et al (2008) which as well revealed positive relation existing
between Philippines banks level of capitalization and profitability.
Study in Ghana by Karkrah and Ameyaw (2010) revealed that non-interest income is an
important driver of commercial banks profitability and there is a positive relationship
existing between non-interest income and profitability in the Ghanaian banking sector.
The study in Kenya by Okothetal. (2013) studies the Determinants of Financial
Performance of Commercial Banks. The authors used linear multiple regression model
28
and Generalized Least Square on panel data to estimate the parameters. Stated that bank
specific factors significantly affect the performance of commercial banks in Kenya,
except for liquidity variable.
The study in Tanzania by Srinivas, Madishetti et.al (2013). analysed the profitability
determinants of commercial banks for the period of 2006-2012.Internal determinants use
the variables like liquidity risk, credit risk, operating efficiency, business assets and
capital adequacy. All of these variables are independent. The study found that internal
variables determine the bank‟s profitability commercial banks.
The study of Frederic (2014) examined the factors responsible for determining the
performance of domestic commercial banks in Uganda. The study used linear multiple
regression analysis over the period 2000-2011 to analyse the data of all licensed domestic
and foreign commercial banks. The study found that, management efficiency; asset
quality; interest income; capital adequacy and inflation influence on the bank‟s
performance in Uganda.
2.3 Critical Review and Research Gap identification
The analysis of financial performance, particular in commercial banks is well researched
and they received increased attention. From the above review of empirical works, it is
clear that different authors have approached financial performance of banks in different
ways in varying levels of analysis. These different approaches helped in the emergence of
more and more literature on the subject over time. It gives an idea on extensive and
diverse works on financial performance of banks. It has been noticed that the studies
financial performance of banks in various aspects provide divergent results relating to the
study period overlap or coincide. The main reason for divergence in the results is use of
different method for the measurement of financial performance of banks and its
29
determinants. All the studies aimed to analyze the financial performance of listed
Financial Institutions in Rwanda with number of elements from Financial Statements and
Management Efficiency.
To the best of my knowledge the relationship between financial statements and financial
performance analysis pre-post listing banks in Rwanda has not yet been studied.
Therefore, this research will bridge the existing literature by showing the relationship
between financial statement and financial performance and compare the period before and
after listing on Rwanda Stock Exchange (RSE) and provide the information, knowledge
and identify the gap that the researcher left out in the area of research which will help to
determine the impact of listing to the financial performance for Rwanda Commercial
banks. In this study, the major area is to disclose the financial performance related to BK
before and after listing on Rwanda Stock Exchange (RSE). Therefore, this topic may be
new as well as the researches efforts may be appreciable.
2.4 Theoretical framework
The theoretical framework gives the meaning of a word in terms of the theories on
financial statement such as proprietary, theory, entity theory, DuPont mean- variance of
portfolio investment theory and the modern portfolio theory. It assumes both knowledge
and acceptance of the theories that this research work depends upon.
Proprietary theory
In the proprietary view, the assets are considered the proprietors‟ assets, and the liabilities
are the proprietors‟ liabilities. According to Newlove and Garner (1951) under proprietary
theory “liabilities are negative assets-negative properties, which must be sharply defined
and separated in the accounting process. Revenues are increases in proprietorship and
expenses are decreases. Net profits, the excess of revenues over expenses, accrues
30
directly to the owners; it represents an increase in the wealth of the proprietors.
(Hendriksen and Van Breda, 1992) Staubus (1959) narrowed the concept of owners to
common stockholders and considered preference shareholders as liability holders and
stressed the importance to investors of the estimation of future cash receipts.
The proprietary approach represents an agency view of the company where the main
responsibility of management is to manage the firm in the best interests of the owners. As
the assets and liabilities are considered the owners‟ assets and liabilities, the
maximization of profits equals maximization of the increase in the shareholders‟ net
assets. For this reason, the asset/liability approach to income determination, where
income is the by-product of the valuation of assets and liabilities, is the most direct way
of quantifying the increase in net assets. Under both the proprietary theory and the
asset/liability approach to income determination, it is imperative that shareholders‟
interests are sharply distinguished from the interests of the providers of debt capital in
order to be able to measure the increase in net assets by Hendriksen (1965).
Entity theory and enterprise or social theory
Under the entity view, transactions are analysed as to their effect on the accounting entity.
Financial statements are prepared from the viewpoint of the entity. The income statement
is meant to calculate income for distribution and analyse the company‟s performance over
a period, whereas the balance sheet serves to indicate the security or riskiness of the
company‟s financial position.
Entity theory views the entity as “having a separate existence – an arm‟s length
relationship with its owners. The relation to the owners is regarded as not particularly
different from that to the long-term creditors. Lorig, (1964). Suojanen (1954)‟s enterprise
31
or social theory sees the large listed corporation as an institution with social
responsibilities. Companies‟ actions affect many different stakeholders such as
stockholders, creditors, customers, employees, the government as a taxing and regulatory
authority and the public at large. Hendriksen and Van Breda, (1992); Kam, (1990);
Suojanen, (1954) .traces this institutionalization of the large enterprise to the separation of
management and ownership leading to increasingly large proportions of income being
retained within the company to reduce the corporation‟s dependence on external
financing. Large corporations may decide to pay only „conventionally adequate dividends‟
because this ties in with their survival and growth objectives. Suojanen, (1958).
Financial reports according to the enterprise theory are to be prepared from the
perspective of the enterprise as a social institution. Income generated by the enterprise is
analysed to measure the contribution of the enterprise to society using the concepts
developed in national income analysis. Therefore, ultimately, the balance sheet is
secondary to output, income and value added considerations. The balance sheet equation
expressing the enterprise theory according to Meyer (1973).
Suojanen,(1958).Proposes that large companies prepare a value added statement in
addition to the balance sheet and income statement. “If the enterprise is considered to be
an institution, its operations should be assessed in terms of its contribution to the flow of
output of the community. Suojanen, (1954) “Although stockholders have legal rights as
owners, from the point of view of the enterprise their rights are subsidiary to the
organization and its survival.” Kam, (1990).
Financial ratios analysis using the modified DuPont model
Measuring and analysing the ratios that provide a clear picture of a banks‟ financial
position is becoming more and more important, most notably when efforts to preserve
financial stability are at the fore. Furthermore, a preliminary analysis of the financial
32
indicators gives a picture of the banking sector and can highlight weaknesses which could
reveal themselves in the future.
Cole (1972) was the first that adapted and applied the DuPont model for banks. The
banking system operates like any other industry in a regulated, supervised and
competitive market. It has its own products and services that distinguish it from other
industries. The financial statements of the banking sector also differ from those of other
sectors, with regard to the peculiarities that characterize banking activity. As a
consequence, the financial or economic ratios of efficiency and performance of banking
operations take on another meaning when they are calculated for this sector.
Cole (1972) deemed that there are other more realistic ways for banks to measure
performance than just net income growth or net income per share.
ROA is decomposed into two further elements (PM and AU)
Cole (1972) suggests breaking down the numerator of the ratio into income and expenses
components and expressing it as a proportion of total operating income, in order to
identify which of those items contributes more to profit margin. While the second element,
namely the asset utilization ratio (AU), shows the connection between total operating
income and total (average) assets, it creates an indicator of gross return on average assets.
In this paper, the research will use detailed analysis of the return on assets by using a
combination of two models, i.e. the one suggested by Koch and MacDonald (2002), and
the other suggested by Venselet al. (2004). Both models can be considered extensions and
modifications of the DuPont model. More indicators than those included in the DuPont
model can now be assessed, presenting thus a more comprehensive framework for the
analysis of the factors that affect the banking system‟s profitability.
33
Initially, Koch and MacDonald (2002) formulate ROE indicator as a combination of ROA
and EM. Afterwards, they break it down into two indicators, one for the bank‟s ability to
generate income and the other for the ability to control expenses.
2.5 Conceptual framework
The basis of financial planning analysis and decision making is the financial information.
Financial information is needed to predict, compare and evaluate a firm‟s earning ability.
It is also required to aid in economic decision making investment and financing decision
making. The financial information of an enterprise is contained in the financial statements.
Financial statements according to Gavtan (2005) is defined as financial information
which is the information relating to financial position of any firm in a capsule form.
Financial statement according to Ohison (1999) was defined as a written report that
summarizes the financial status of an organization for a stated period of time. It includes
an income statement and balance sheet or statement of the financial position describing
the flow of resources, profit and loss and the distribution or retention of profit. Financial
statement according to Academic of organization Dictionary is a document which sets out
the assets, income, expenses and debts of a company to allow a third person to assess that
company‟s health.
This section helps the researcher to identify the variables under the study and how they
relate to each other, this will be achieved by examining how financial statement analysis
was done on banks listed on Rwanda Stock exchange (RSE), particular Bank of Kigali by
exploring different financial ratios used to determine financial performance and
comparison between financial performances for two different period pre-post listing.
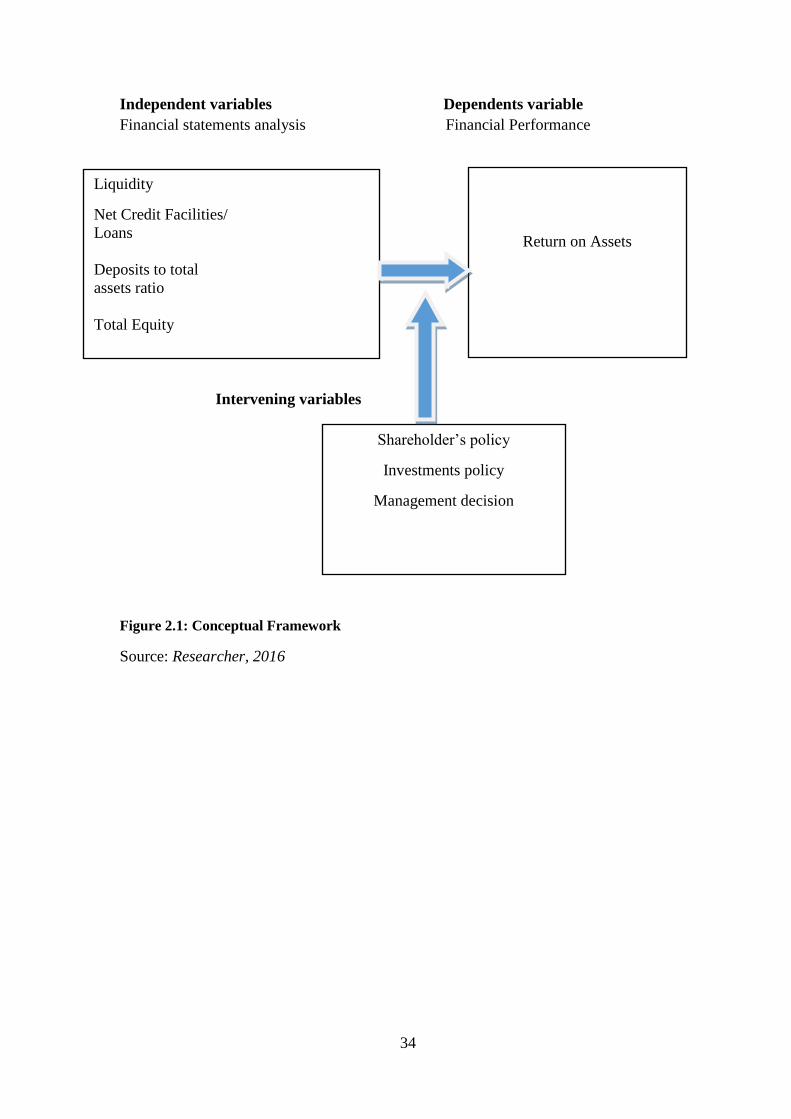
34
Independent variables Dependents variable
Financial statements analysis Financial Performance
Intervening variables
Figure 2.1: Conceptual Framework
Source: Researcher, 2016
Liquidity
Net Credit Facilities/
Loans
Deposits to total
assets ratio
Total Equity
Interest
spread
Return on Assets
Shareholder‟s policy
Investments policy
Management decision
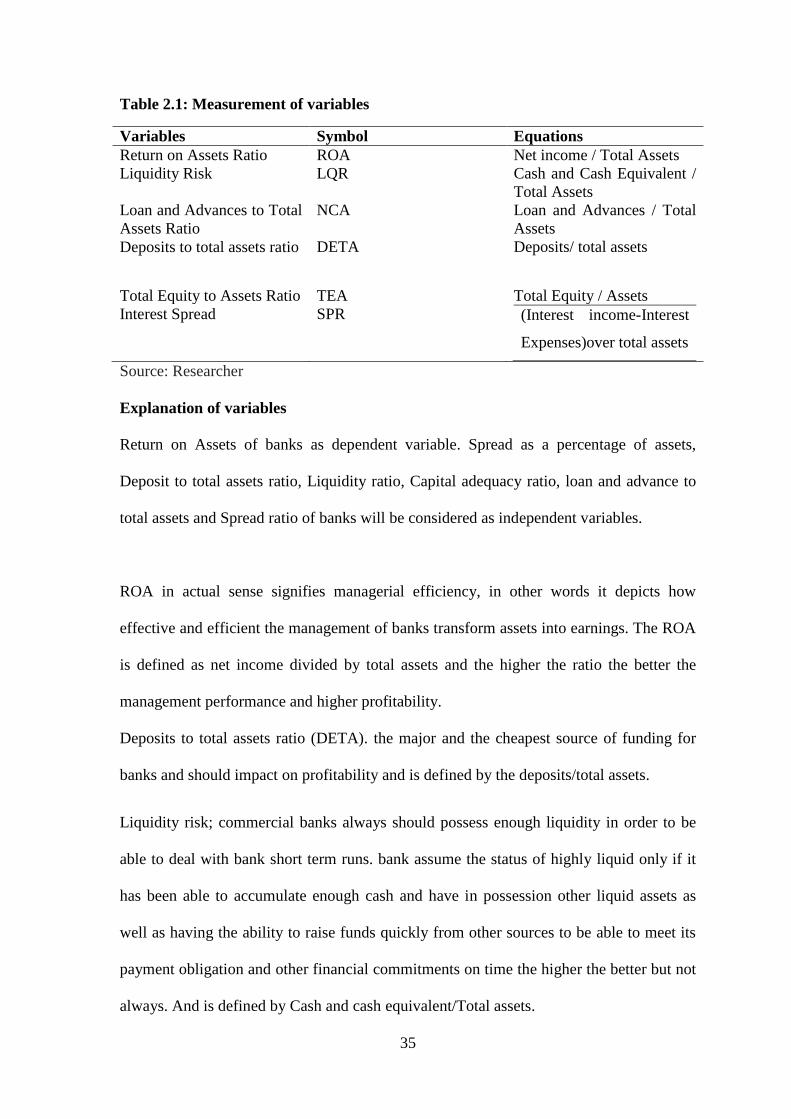
35
Table 2.1: Measurement of variables
Variables Symbol Equations
Return on Assets Ratio ROA Net income / Total Assets
Liquidity Risk LQR Cash and Cash Equivalent /
Total Assets
Loan and Advances to Total
Assets Ratio
NCA Loan and Advances / Total
Assets
Deposits to total assets ratio DETA Deposits/ total assets
Total Equity to Assets Ratio TEA Total Equity / Assets
Interest Spread SPR (Interest income-Interest
Expenses)over total assets
Source: Researcher
Explanation of variables
Return on Assets of banks as dependent variable. Spread as a percentage of assets,
Deposit to total assets ratio, Liquidity ratio, Capital adequacy ratio, loan and advance to
total assets and Spread ratio of banks will be considered as independent variables.
ROA in actual sense signifies managerial efficiency, in other words it depicts how
effective and efficient the management of banks transform assets into earnings. The ROA
is defined as net income divided by total assets and the higher the ratio the better the
management performance and higher profitability.
Deposits to total assets ratio (DETA). the major and the cheapest source of funding for
banks and should impact on profitability and is defined by the deposits/total assets.
Liquidity risk; commercial banks always should possess enough liquidity in order to be
able to deal with bank short term runs. bank assume the status of highly liquid only if it
has been able to accumulate enough cash and have in possession other liquid assets as
well as having the ability to raise funds quickly from other sources to be able to meet its
payment obligation and other financial commitments on time the higher the better but not
always. And is defined by Cash and cash equivalent/Total assets.
36
Capital and reserve to total assets ratio (CRTA); this capture the general average safety
and soundness of the banks. As it shows the capacity of the bank to meet its obligation
with own resources, the higher the ratio the better depositor are secured. And is defined as
equity over total assets.
Loans and advances to total assets ratio (LOTA) ;This is the major means of earnings for
commercial banks and it is often believed that the more banks offer loans the more it does
generate revenue and more profit and is define by loans and advances over total assets.
Spread Ratio (SPR).This the difference between interests earned and interest paid. The
ratio is calculated as a percentage spread to total assets. The higher the ratio, the more
will be the profitability.
37
CHAPTER THREE: RESEARCH METHODOLOGY
3.0 Introduction
This chapter present the framework for data collection of the study. It covers the design
study, target Population, sample design; sample size, Sampling techniques, data collection
methods, data collection instruments study population, sample size, sources of data,
research instruments, Administration of Data Collection Instruments, Reliability and
validity, Data analysis procedure and Ethical consideration.
3.1 Research Design
Research design refers to the way the study is designed and the method used to carry out
the research (Kothari, 2004). With regards to time horizons, the research may either be
longitudinal or cross sectional studies. By conducting longitudinal studies, the researcher
observes change and development over time (Saunders, et al., 2009). A study is cross-
sectional if a phenomenon is researched at a particular time. This study was focused on
the financial performance analysis of Bank of Kigali and compares the differences in the
phenomenon before and after the listing. Thus the study used a cross-sectional
comparative study research design.
3.2 Target Population
Polit and Hungler (1999) refer to the population as an aggregate or totality of all the
objects, subjects or members that conform to a set of specifications. Population here
refers to the totality of targeted individuals that form the focus of this study. The
objectives of the data collection process was to draw conclusions about the population. It
is therefore imperative to have a clear picture of what constitutes the research population.
The population for this study comprises Bank of Kigali pre-post listed period on Rwanda

38
Stock Exchange (RSE) performing the function of commercial bank under rules,
regulations and directives of BNR and RSE.
3.3 Sample Design
The sample design comprises pre-post listed period on RSE and the financial statements
for (2008-2010 and 2012-2014).
3.3.1 Sample Size
According to Egbu(1998), sampling involves the selection of a number of study units
from a defined study population. A sample is therefore, a small representatives of a large
population. In drawing a small sample for the study, the researcher considered how many
people that are needed in the sample and their category first to be selected,
Exploratory research is conducted when little is known in the specific area of interest
(McMurray 2007). This is consistent with the notion of Cavana, DelahayeandSekaran
(2001, p. 108) that „exploratory studies are undertaken to better comprehend the nature of
the problem that has been the subject of very few studies‟. Rudimentary knowledge and
understanding about a phenomenon is offered and might be expanded by subsequent
researchers. In other words, „exploratory research may be the first stage in a sequence of
studies‟ Neuman(2006).
The sample consists of secondary data for two period judgmentally selected bank pre-post
listing on RSE. The two financial performance are comparable to each other with help of
ratio analysis from 2008-2010 and 2014-2014.
3.4 Data Collection Methods
Secondary data was used for this study by reviewing both empirical and theoretical data
from Published financial statements, books, journals, dissertations, magazines and the
internet. Financial statements for the banks from the year 2008 to 2014 was used to
39
compute the various ratios fundamental for this study and transitional year was not
concerned. The period was chosen to facilitate usage of the model used in this study and
it was also guided by the availability of data due to the fact that the RSE is newly stated.
3.4.1 Data Collection Instruments
To analyze the data acquire from the secondary sources “Ratio Analysis “The scope of
the study was defined in terms of concepts adopted and period under focus. First the study
of Ratio Analysis was confined only to the Bank of Kigali. Secondly the study was based
on the annual reports of the company for a period of 6 years from 2008-2010 to 2012-
2014 the reason for restricting the study to this period was due to data constraint.
A research instrument is any device constructed for recording of measuring data. It is the
means for generating pertinent information to be used for solving the research problems
Olakunori(1997) therefore, in order to obtain valuable data for analysis, interpretations
and appreciation of problems aforementioned, a set of Hypothesis was designed and
administered by the researcher. The choice of hypothesis as research instrument for this
study was based on the fact that, it permits the coverage of objectivity of the source of
data and their relationship using linear regression model.
3.4.2 Administration of Data Collection Instruments
Data obtained from the, various sources cannot be directly used in their original form
further they so obtained need to be checked, rechecked edited and tabulated for
computation. According to the nature of data, was inserted in meaningful tables, which
was shown in annexes. Homogenous data was sorted in one table and various tables was
prepared in understandable manner. Using financial and statistical tools data was
analyzed and interpreted.
40
3.4.3 Reliability and validity
Validity is a tool used to measure the effectiveness of a research method Chisnall, (1977).
In this study the researcher applied quantitative method to analyse the audited financial
statement of the Bank of Kigali. Towards the end of the study one can easily see the
success of the research methods in getting the objective of the research. As stated by
Gummesson (2000), the validity of a research is the success achieved by the researcher in
choosing the method and hence achieving the objective of the research problem. As the
researcher used multicollinearity to test the correlation between independents variables
and use Hausman test and econometrics model be able to achieve the objective of the
study, which was to analyse the financial statement the result was valid.
According to Joppe (2000), reliability is the combination of consistency of the result over
the time, representation of the study population and possibility of the reproduction of the
result using the same methodology. To ensure the reliability, the research used audited
financial statements obtained from the various banks for the period of study.
Mistake while calculating the ratios, computing trend analysis can easily happen.
Similarly, mistakes while copying the data to excel from financial statements or from
excel to word can easily happen, in spite of double-triple checking. In spite of those
possible mistakes the objective of the thesis, which is to be able to analyse the financial
statements was achieved, so the research succeeded well in this sense and concluded as
reliable. On the other hand the reliability of the data might have some question marks but
the procedure itself was reliable as it has been adopted by several researchers.
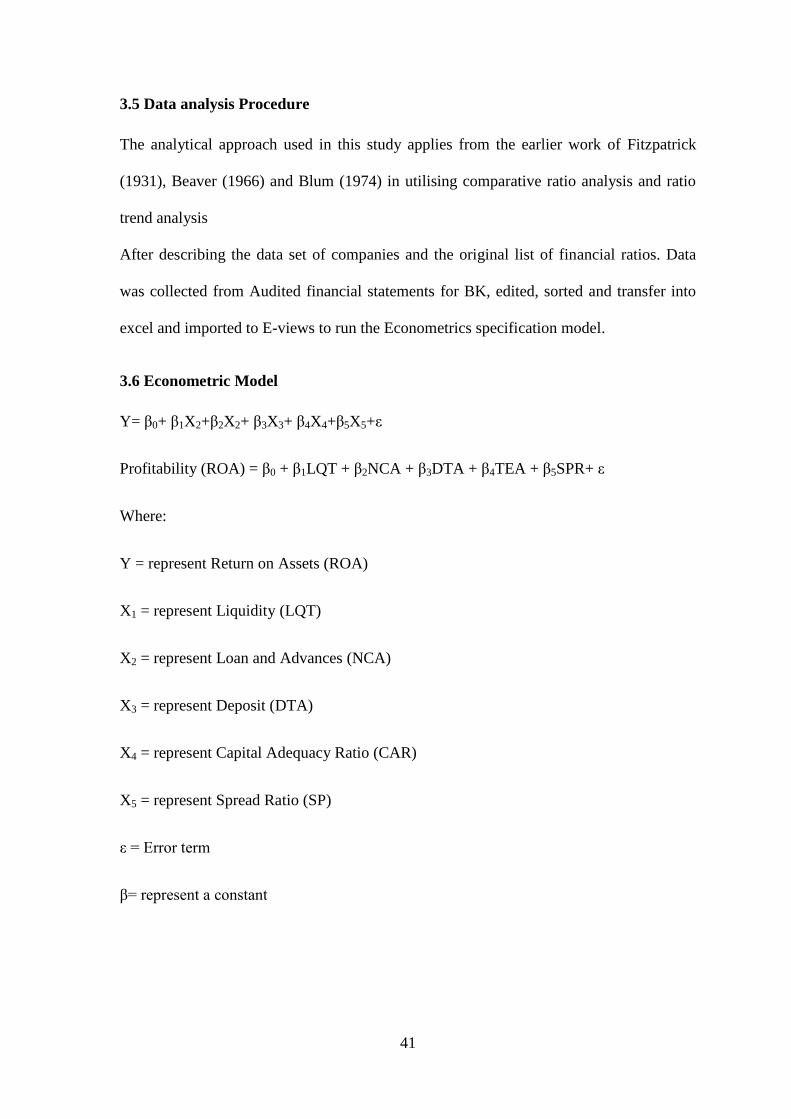
41
3.5 Data analysis Procedure
The analytical approach used in this study applies from the earlier work of Fitzpatrick
(1931), Beaver (1966) and Blum (1974) in utilising comparative ratio analysis and ratio
trend analysis
After describing the data set of companies and the original list of financial ratios. Data
was collected from Audited financial statements for BK, edited, sorted and transfer into
excel and imported to E-views to run the Econometrics specification model.
3.6 Econometric Model
Y= β0+ β1X2+β2X2+ β3X3+ β4X4+β5X5+ε
Profitability (ROA) = β0 + β1LQT + β2NCA + β3DTA + β4TEA + β5SPR+ ε
Where:
Y = represent Return on Assets (ROA)
X1 = represent Liquidity (LQT)
X2 = represent Loan and Advances (NCA)
X3 = represent Deposit (DTA)
X4 = represent Capital Adequacy Ratio (CAR)
X5 = represent Spread Ratio (SP)
ε = Error term
β= represent a constant

42
3.7 Ethical consideration
The following ethical guidelines were put into place for research period; honesty and
general care and precision in activities(research recording, presentation and evaluation
will be taken care of; protection of the privacy of the subject was adhered to and all
subjects will remain anonymous unless they give permission for identities to be disclosed
43
CHAPTER FOUR: RESEARCH FINDINGS AND DISCUSSION
4.0 Introduction
The data for this study is obtained from financial statements of Bank of Kigali annual
publication; the sample covers the period between2008-2010 and 2012-2014. The pre-
listing sample covers 3 years and the post-listing period sample consists of 3years. All the
findings and results of the study are discussed and interpreted using statistical tools such
as. Descriptive statistics of Independent Variables Financial statements ratios, Correlation
analysis of Variables, Regression analysis for independent variables on the ROA,
Relationship between financial statements analysis and performance pre-post listing.
Hypotheses of the study have been tested using t-test to check the significant difference
for each ratio and paired sample F-Test also used to analyze the statistical significant
difference for overall Pre and Post listing financial performance. Taking average of pre
and post listing financial performance t-Test measure the significant difference at 5%
significant level between pre and post listing of each ratio collectively for the two period
under study which are taken as a sample for the study. For each pre and post listing
financial ratio P-value (two-tail) is taken to check the significant impact. If the P-value is
less than 0.05, it means there is a significant in the financial ratios between pre and post
listing. In other case if the P-value is greater than 0.05, there will be insignificant
difference between the financial ratios for pre and post listing.
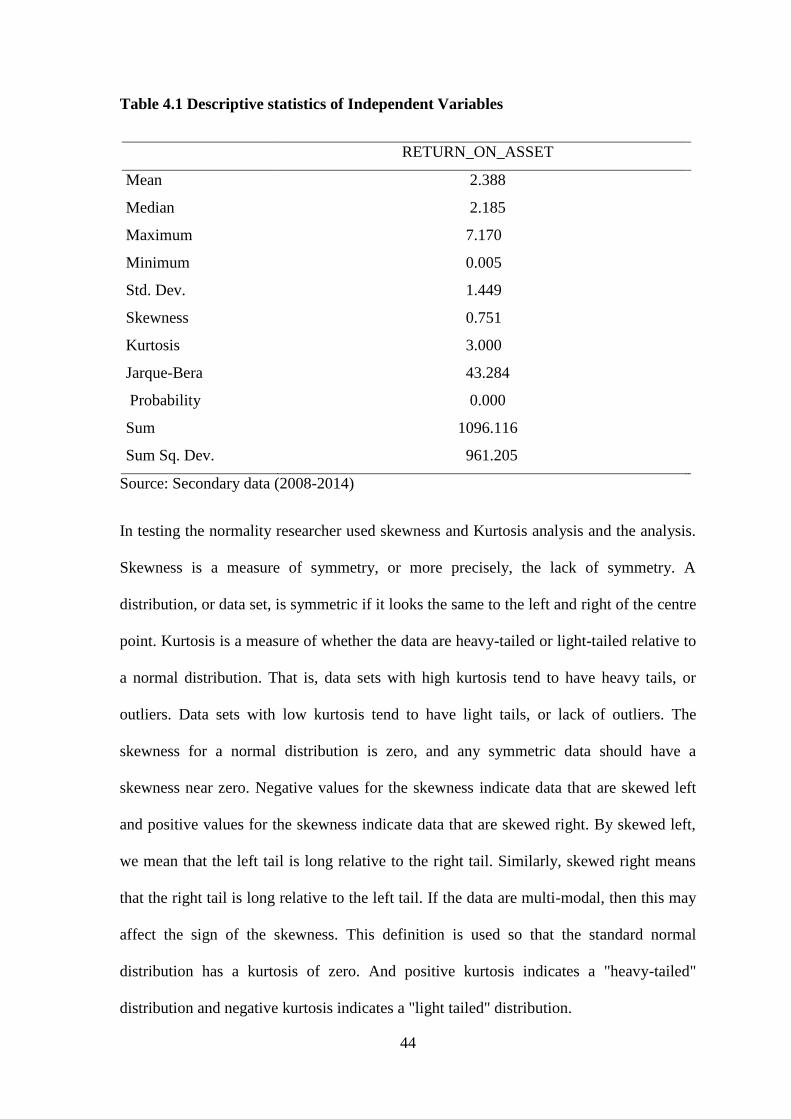
44
Table 4.1 Descriptive statistics of Independent Variables
RETURN_ON_ASSET
Mean 2.388
Median 2.185
Maximum 7.170
Minimum 0.005
Std. Dev. 1.449
Skewness 0.751
Kurtosis 3.000
Jarque-Bera 43.284
Probability 0.000
Sum 1096.116
Sum Sq. Dev. 961.205
Source: Secondary data (2008-2014)
In testing the normality researcher used skewness and Kurtosis analysis and the analysis.
Skewness is a measure of symmetry, or more precisely, the lack of symmetry. A
distribution, or data set, is symmetric if it looks the same to the left and right of the centre
point. Kurtosis is a measure of whether the data are heavy-tailed or light-tailed relative to
a normal distribution. That is, data sets with high kurtosis tend to have heavy tails, or
outliers. Data sets with low kurtosis tend to have light tails, or lack of outliers. The
skewness for a normal distribution is zero, and any symmetric data should have a
skewness near zero. Negative values for the skewness indicate data that are skewed left
and positive values for the skewness indicate data that are skewed right. By skewed left,
we mean that the left tail is long relative to the right tail. Similarly, skewed right means
that the right tail is long relative to the left tail. If the data are multi-modal, then this may
affect the sign of the skewness. This definition is used so that the standard normal
distribution has a kurtosis of zero. And positive kurtosis indicates a "heavy-tailed"
distribution and negative kurtosis indicates a "light tailed" distribution.
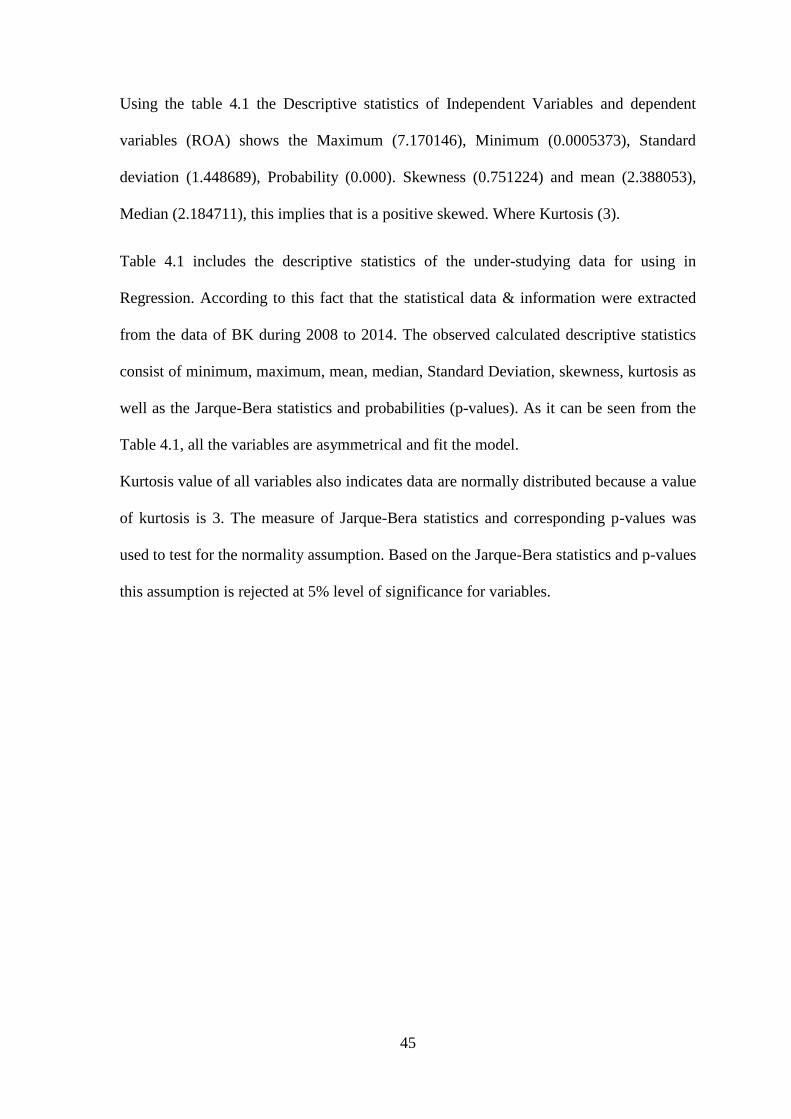
45
Using the table 4.1 the Descriptive statistics of Independent Variables and dependent
variables (ROA) shows the Maximum (7.170146), Minimum (0.0005373), Standard
deviation (1.448689), Probability (0.000). Skewness (0.751224) and mean (2.388053),
Median (2.184711), this implies that is a positive skewed. Where Kurtosis (3).
Table 4.1 includes the descriptive statistics of the under-studying data for using in
Regression. According to this fact that the statistical data & information were extracted
from the data of BK during 2008 to 2014. The observed calculated descriptive statistics
consist of minimum, maximum, mean, median, Standard Deviation, skewness, kurtosis as
well as the Jarque-Bera statistics and probabilities (p-values). As it can be seen from the
Table 4.1, all the variables are asymmetrical and fit the model.
Kurtosis value of all variables also indicates data are normally distributed because a value
of kurtosis is 3. The measure of Jarque-Bera statistics and corresponding p-values was
used to test for the normality assumption. Based on the Jarque-Bera statistics and p-values
this assumption is rejected at 5% level of significance for variables.
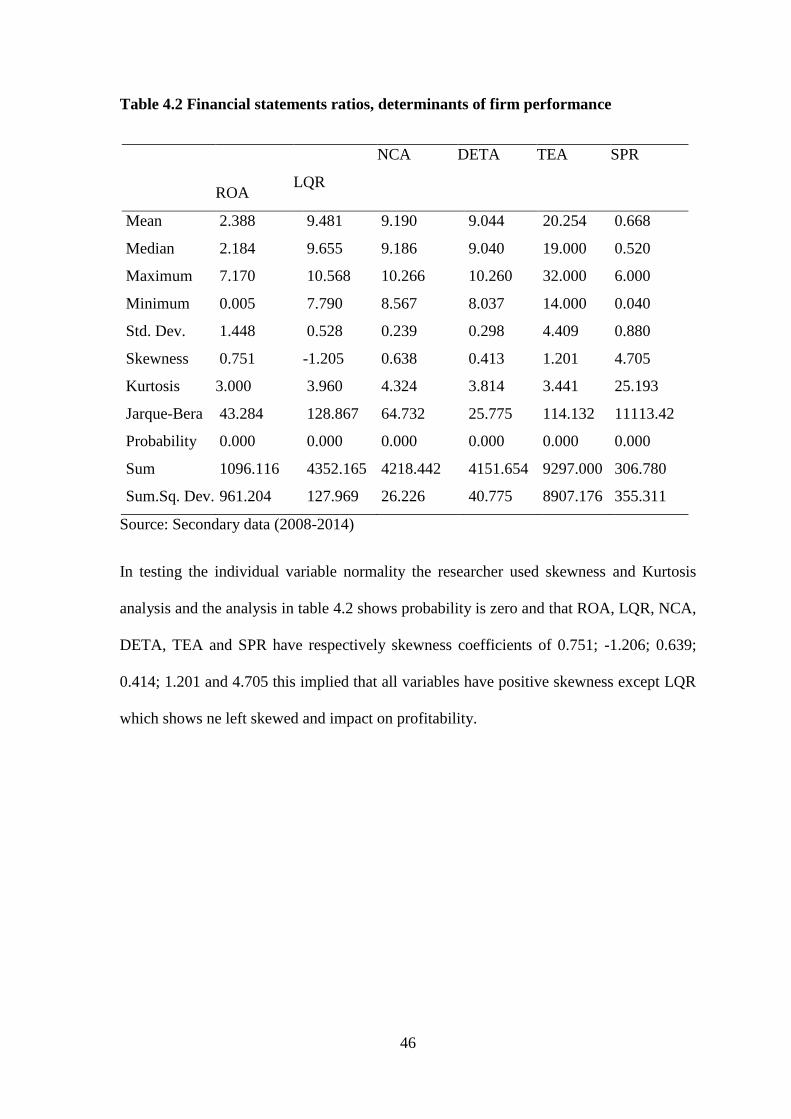
46
Table 4.2 Financial statements ratios, determinants of firm performance
ROA LQR
NCA
DETA
TEA
SPR
Mean 2.388 9.481 9.190 9.044 20.254 0.668
Median 2.184 9.655 9.186 9.040 19.000 0.520
Maximum 7.170 10.568 10.266 10.260 32.000 6.000
Minimum 0.005 7.790 8.567 8.037 14.000 0.040
Std. Dev. 1.448 0.528 0.239 0.298 4.409 0.880
Skewness 0.751 -1.205 0.638 0.413 1.201 4.705
Kurtosis 3.000 3.960 4.324 3.814 3.441 25.193
Jarque-Bera 43.284 128.867 64.732 25.775 114.132 11113.42
Probability 0.000 0.000 0.000 0.000 0.000 0.000
Sum 1096.116 4352.165 4218.442 4151.654 9297.000 306.780
Sum.Sq. Dev. 961.204 127.969 26.226 40.775 8907.176 355.311
Source: Secondary data (2008-2014)
In testing the individual variable normality the researcher used skewness and Kurtosis
analysis and the analysis in table 4.2 shows probability is zero and that ROA, LQR, NCA,
DETA, TEA and SPR have respectively skewness coefficients of 0.751; -1.206; 0.639;
0.414; 1.201 and 4.705 this implied that all variables have positive skewness except LQR
which shows ne left skewed and impact on profitability.
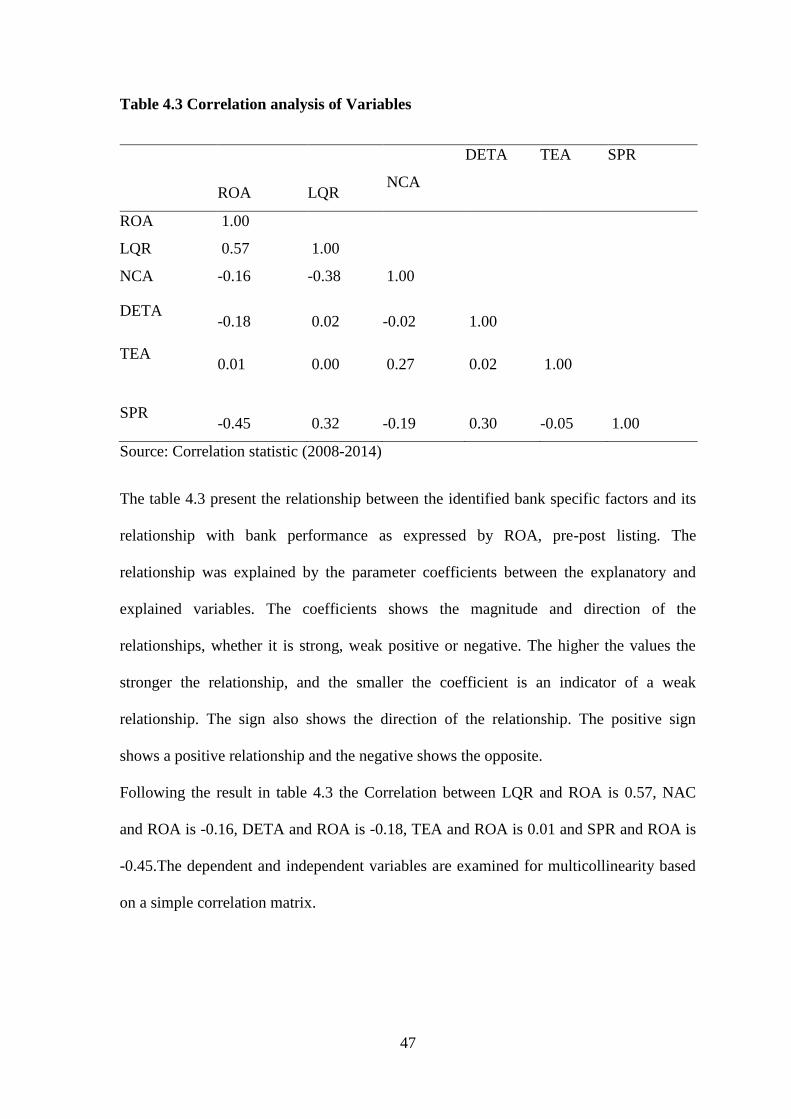
47
Table 4.3 Correlation analysis of Variables
Source: Correlation statistic (2008-2014)
The table 4.3 present the relationship between the identified bank specific factors and its
relationship with bank performance as expressed by ROA, pre-post listing. The
relationship was explained by the parameter coefficients between the explanatory and
explained variables. The coefficients shows the magnitude and direction of the
relationships, whether it is strong, weak positive or negative. The higher the values the
stronger the relationship, and the smaller the coefficient is an indicator of a weak
relationship. The sign also shows the direction of the relationship. The positive sign
shows a positive relationship and the negative shows the opposite.
Following the result in table 4.3 the Correlation between LQR and ROA is 0.57, NAC
and ROA is -0.16, DETA and ROA is -0.18, TEA and ROA is 0.01 and SPR and ROA is
-0.45.The dependent and independent variables are examined for multicollinearity based
on a simple correlation matrix.
ROA LQR NCA
DETA
TEA
SPR
ROA 1.00
LQR 0.57 1.00
NCA -0.16 -0.38 1.00
DETA -0.18 0.02 -0.02 1.00
TEA 0.01 0.00 0.27 0.02 1.00
SPR -0.45 0.32 -0.19 0.30 -0.05 1.00
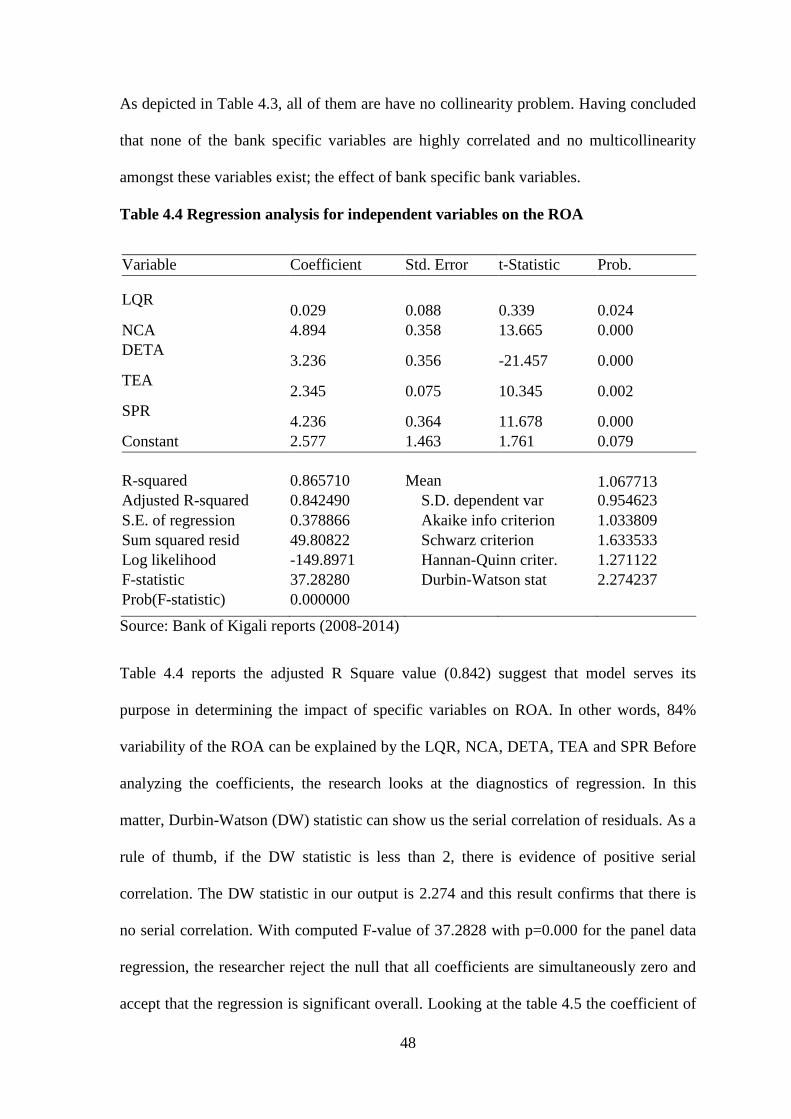
48
As depicted in Table 4.3, all of them are have no collinearity problem. Having concluded
that none of the bank specific variables are highly correlated and no multicollinearity
amongst these variables exist; the effect of bank specific bank variables.
Table 4.4 Regression analysis for independent variables on the ROA
Variable Coefficient Std. Error t-Statistic Prob.
LQR
0.029 0.088 0.339 0.024
NCA 4.894 0.358 13.665 0.000
DETA 3.236 0.356 -21.457 0.000
TEA 2.345 0.075 10.345 0.002
SPR 4.236 0.364 11.678 0.000
Constant 2.577 1.463 1.761 0.079
R-squared 0.865710 Mean
1.067713
Adjusted R-squared 0.842490 S.D. dependent var 0.954623
S.E. of regression 0.378866 Akaike info criterion 1.033809
Sum squared resid 49.80822 Schwarz criterion 1.633533
Log likelihood -149.8971 Hannan-Quinn criter. 1.271122
F-statistic 37.28280 Durbin-Watson stat 2.274237
Prob(F-statistic) 0.000000
Source: Bank of Kigali reports (2008-2014)
Table 4.4 reports the adjusted R Square value (0.842) suggest that model serves its
purpose in determining the impact of specific variables on ROA. In other words, 84%
variability of the ROA can be explained by the LQR, NCA, DETA, TEA and SPR Before
analyzing the coefficients, the research looks at the diagnostics of regression. In this
matter, Durbin-Watson (DW) statistic can show us the serial correlation of residuals. As a
rule of thumb, if the DW statistic is less than 2, there is evidence of positive serial
correlation. The DW statistic in our output is 2.274 and this result confirms that there is
no serial correlation. With computed F-value of 37.2828 with p=0.000 for the panel data
regression, the researcher reject the null that all coefficients are simultaneously zero and
accept that the regression is significant overall. Looking at the table 4.5 the coefficient of
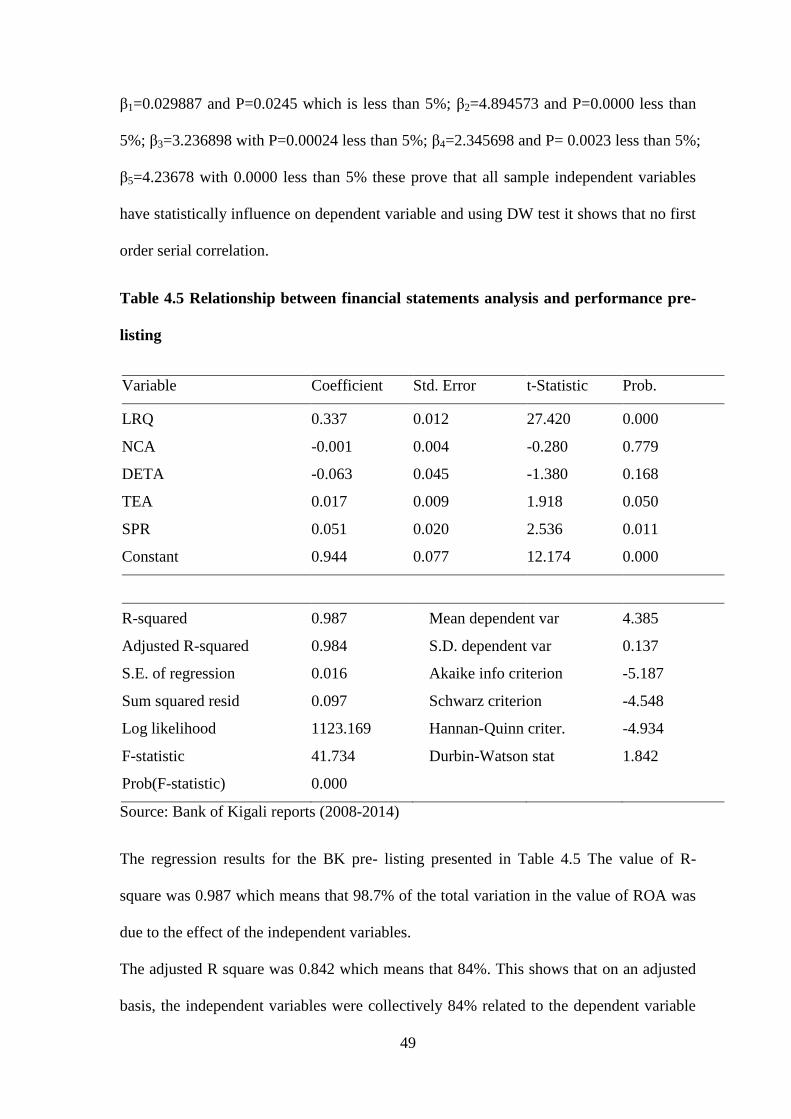
49
β1=0.029887 and P=0.0245 which is less than 5%; β2=4.894573 and P=0.0000 less than
5%; β3=3.236898 with P=0.00024 less than 5%; β4=2.345698 and P= 0.0023 less than 5%;
β5=4.23678 with 0.0000 less than 5% these prove that all sample independent variables
have statistically influence on dependent variable and using DW test it shows that no first
order serial correlation.
Table 4.5 Relationship between financial statements analysis and performance pre-
listing
Variable Coefficient Std. Error t-Statistic Prob.
LRQ 0.337 0.012 27.420 0.000
NCA -0.001 0.004 -0.280 0.779
DETA -0.063 0.045 -1.380 0.168
TEA 0.017 0.009 1.918 0.050
SPR 0.051 0.020 2.536 0.011
Constant 0.944 0.077 12.174 0.000
R-squared 0.987 Mean dependent var 4.385
Adjusted R-squared 0.984 S.D. dependent var 0.137
S.E. of regression 0.016 Akaike info criterion -5.187
Sum squared resid 0.097 Schwarz criterion -4.548
Log likelihood 1123.169 Hannan-Quinn criter. -4.934
F-statistic 41.734 Durbin-Watson stat 1.842
Prob(F-statistic) 0.000
Source: Bank of Kigali reports (2008-2014)
The regression results for the BK pre- listing presented in Table 4.5 The value of R-
square was 0.987 which means that 98.7% of the total variation in the value of ROA was
due to the effect of the independent variables.
The adjusted R square was 0.842 which means that 84%. This shows that on an adjusted
basis, the independent variables were collectively 84% related to the dependent variable
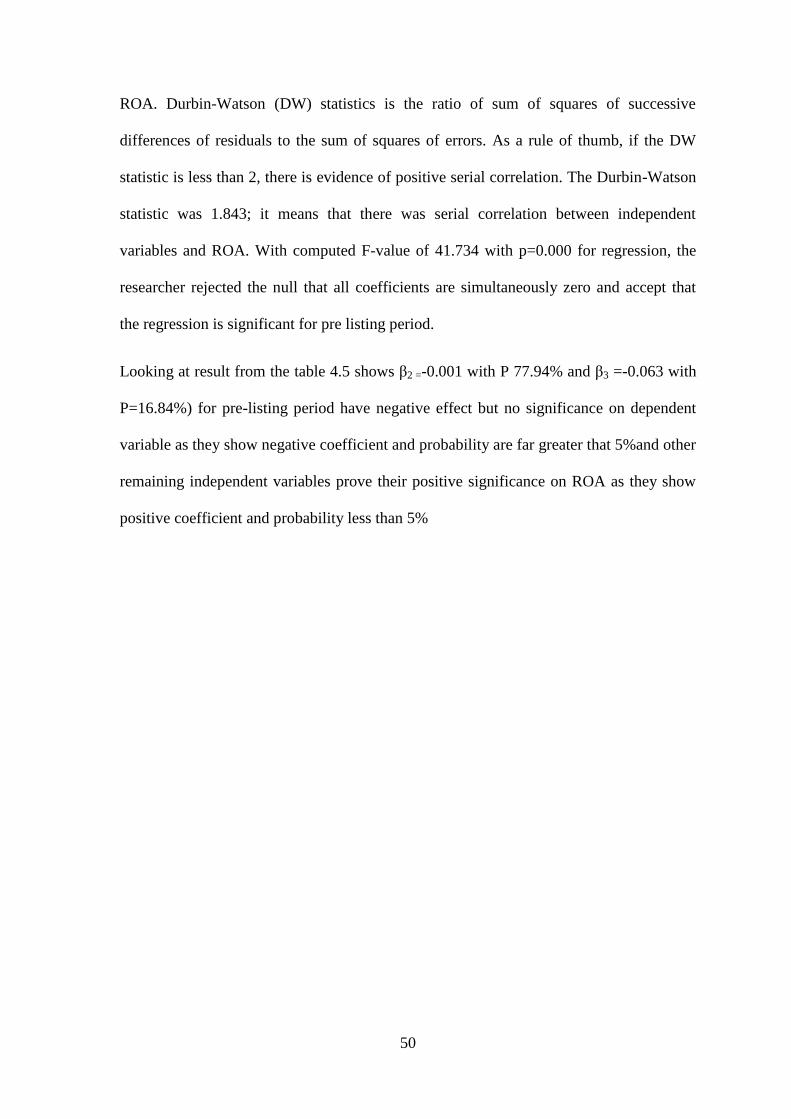
50
ROA. Durbin-Watson (DW) statistics is the ratio of sum of squares of successive
differences of residuals to the sum of squares of errors. As a rule of thumb, if the DW
statistic is less than 2, there is evidence of positive serial correlation. The Durbin-Watson
statistic was 1.843; it means that there was serial correlation between independent
variables and ROA. With computed F-value of 41.734 with p=0.000 for regression, the
researcher rejected the null that all coefficients are simultaneously zero and accept that
the regression is significant for pre listing period.
Looking at result from the table 4.5 shows β2 =-0.001 with P 77.94% and β3 =-0.063 with
P=16.84%) for pre-listing period have negative effect but no significance on dependent
variable as they show negative coefficient and probability are far greater that 5%and other
remaining independent variables prove their positive significance on ROA as they show
positive coefficient and probability less than 5%
51
Table 4.6 Relationship between financial statements analysis and performance post-
listing
Variable Coefficient Std. Error t-Statistic Prob.
LRQ -1.061 1.068 -0.993 0.021
NCA 0.104 0.117 0.890 0.004
DETA 4.486 0.888 5.048 0.000
TEA 0.427 0.525 0.813 0.016
SPR 0.423 0.675 0.626 0.351
Constant 2.985 2.547 1.171 0.002
R-squared 0.844 Mean dependent var 0.710
Adjusted R-squared 0.810 S.D. dependent var 0.926
S.E. of regression 0.403 Akaike info criterion 1.189
Sum squared resid 47.469 Schwarz criterion 1.906
Log likelihood -146.409 Hannan-Quinn criter. 1.475
F-statistic 24.352 Durbin-Watson stat 2.706
Prob(F-statistic) 0.000
Source: Bank of Kigali reports (2008-2014)
The regression results for the BK post- listing presented in Table 4.6 The value of R-
square was 0.845 which means that 84.5% of the total variation in the value of ROA was
due to the effect of the independent variables.
The adjusted R square was 0.81 which means that 81%. This shows that on an adjusted
basis, the independent variables were collectively 81% related to the dependent variable
ROA. Durbin-Watson (DW) statistics is the ratio of sum of squares of successive
differences of residuals to the sum of squares of errors. As a rule of thumb, if the DW
statistic is less than 2, there is evidence of positive serial correlation. The Durbin-Watson
statistic was 2.71; it means that there was no serial correlation between independent
variables and ROA. With computed F-value of 24.35203 (p=0.000) for regression, the
52
researcher rejected the null that all coefficients are simultaneously zero and accept that
the regression is significant for post-listing period
Looking at result from the table 6; β1 has a negative significance on dependent variable as
they show negative coefficient (-1.061718) and p (0.0213) which is less than 5%, B5 is
(0.423070) and P (0.3514) is positively affecting the ROA but with no significance and
all remaining independent variables prove their positive significance on ROA as it show
positive coefficient and probability are less than 5%.
4.2 Presentation of Findings Pre-post listing period
With the use of E-views software results of which are generated as regression output, and
taking a look at the result of the Hausman test, the analysis only focused on the values
estimate made available by random effect model.
The values of F Statistic and the respective values of significance imply that the used
model fit significantly for Bank of Kigali (BK) pre-post listing. Again, here the table 4.5
and 4.6 showed that Adjusted R Square for Bank of Kigali pre-post listing is 0.984955
and 0.810020 respectively. The result indicates 98.4955% variation in the financial
performance of BK pre-listing and 81.0020% of BK post-listing that can be explained by
the independent variables - LRQ, NCA, DETA, SPR and TEA.
Looking at the p- values so far the pre-listing with regards to ROA, NCA and DETA are
not statistically significant in explaining the changes in ROA. While LQR, the TEA and
SPR which are less than 5%. They indicate that they have significant influence on the
dependent variable ROA.
For the post listing of Bank of Kigali ROA shows that the model is best fitted by 0.0000
which is less than 5% and only SPR where p= 35.14% has no significant effect on the
model, and cannot explain the changes in the model, the rest have effect on the dependent
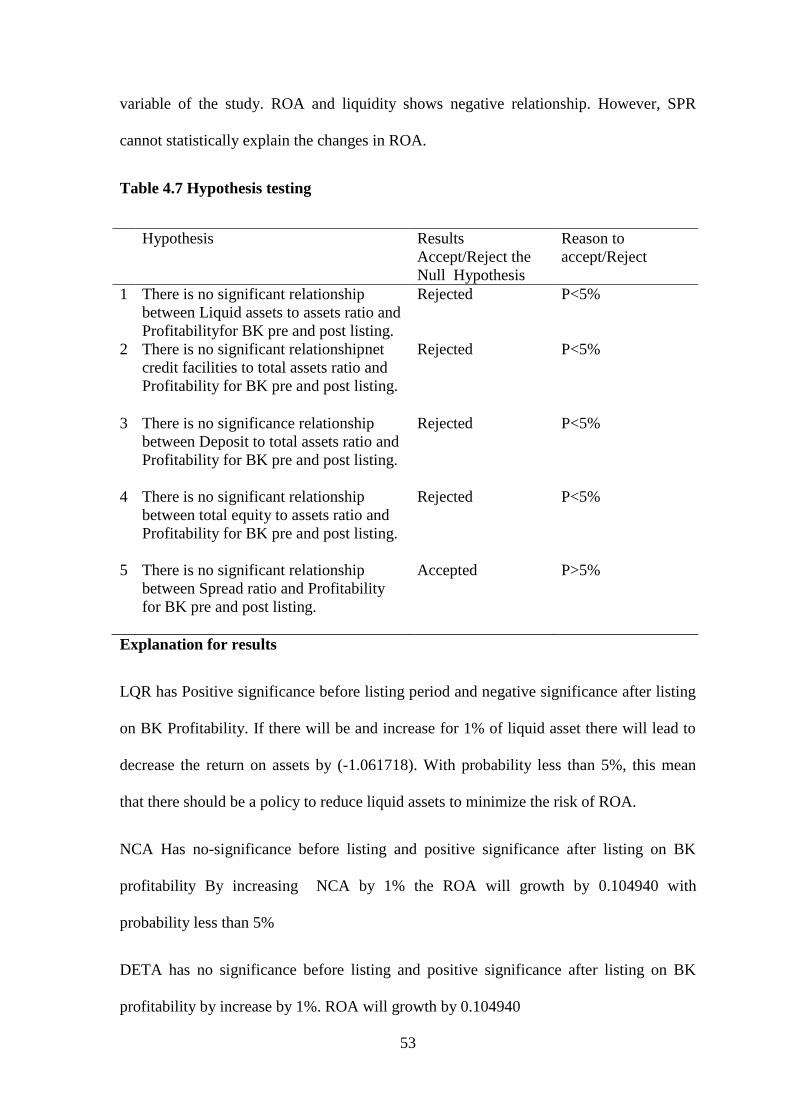
53
variable of the study. ROA and liquidity shows negative relationship. However, SPR
cannot statistically explain the changes in ROA.
Table 4.7 Hypothesis testing
Hypothesis Results
Accept/Reject the
Null Hypothesis
Reason to
accept/Reject
1 There is no significant relationship
between Liquid assets to assets ratio and
Profitabilityfor BK pre and post listing.
Rejected P<5%
2 There is no significant relationshipnet
credit facilities to total assets ratio and
Profitability for BK pre and post listing.
Rejected P<5%
3 There is no significance relationship
between Deposit to total assets ratio and
Profitability for BK pre and post listing.
Rejected P<5%
4 There is no significant relationship
between total equity to assets ratio and
Profitability for BK pre and post listing.
Rejected P<5%
5 There is no significant relationship
between Spread ratio and Profitability
for BK pre and post listing.
Accepted P>5%
Explanation for results
LQR has Positive significance before listing period and negative significance after listing
on BK Profitability. If there will be and increase for 1% of liquid asset there will lead to
decrease the return on assets by (-1.061718). With probability less than 5%, this mean
that there should be a policy to reduce liquid assets to minimize the risk of ROA.
NCA Has no-significance before listing and positive significance after listing on BK
profitability By increasing NCA by 1% the ROA will growth by 0.104940 with
probability less than 5%
DETA has no significance before listing and positive significance after listing on BK
profitability by increase by 1%. ROA will growth by 0.104940

54
TEA has positive significant before listing and positive significant after listing on BK
Profitability. By increasing TEA by 1% the ROA will growth by 0.427125 with
probability less than 5%.
SPR has Positive significance before listing and no significant after listing on BK
Profitability with probability greater than 5%.
55
CHAPTER FIVE: SUMMARY, CONCLUSIONS AND
RECOMMENDATIONS
5.0 Introduction
With regard to the discussion of the result of the estimated model for pre –post listing
period the researcher has chosen to concentrate on the variables which have been
indicated by the result both significant and no insignificant. The results shown that four
variables namely NCA, DETA and TEA are positively significant to be considered as
drivers of the banks‟ profitability before and after listing period.LQR was considered as
negatively significant on profitability post-listing period and positively significant before
listing period. SPR proved positive significance in pre-listing period and insignificance in
post-listing period.
5.1 Summary of Findings
The result has shown that the measure of bank's LQR cash and cash equivalent in pre-
listing period has a positive impact on profitability and statistically significant in the
estimated model. This is in line with the a priori expectation and since it is significant in
the model therefore it is considered as a major driver of the commercial banks
profitability before listing but it prove negative effect in the period after listing which
require management to improve their policy. . If there will be and increase for 1% of
liquid asset there will lead to decrease the return on assets by (-1.061718). With
probability less than 5%, this mean that there should be a policy to reduce liquid assets to
minimize the risk of ROA.
56
Objective one was to evaluate and compare the impact of Liquid assets to assets
ratio for Bank of Kigali Profitability pre and post listing.
Based on results from table 4.5 and 4.6 prove that β1=0.337and P = 0.000<5%in pre-
listing period and β1=-1.061 with P=0.021<5% in post-listing period which prove that
liquidity had positively impacted on profitability of BK pre-listing and negatively
impacted in post-listing period with a strong significance.
Objective two was to investigate and compare the effect of loans and advances to
total assets ratio for Bank of Kigali profitability pre and post listing.
Table 4.5 and 4.6 show that β2=-0.001with P= 0.779 >5% pre-listing and β2= 0.104 with
P=0.004<5% and prove that loan and advances improved significantly in post-listing
period better compare to pre-listing.
Objective three was to compare the impact of deposit to total assets ratio for Bank of
Kigali profitability pre and post listing.
Looking at table 4.5 and 4.6 results demonstrate that β3=-0.063 with P= 0.168 >5%
β3=4.486 with P=0.000<5% and this demonstrate that the deposit impacted positively and
on profitability in post-period better as it had no significance in pre-listing period
Objective four was to compare the effects of total equity to assets ratio for Bank of
Kigali profitability pre and post listing.
Table 4.5 and 4.6 prove the strong positive effect on profitability more in post than in pre-
listing period with respectively β4= 0.017 with P= 0.050 <5% pre and β4= 0.427
P=0.016<5% post-listing.
Objective five was to compare the effect of Spread ratio for Bank of Kigali
profitability pre and post listing.
According to the result β5=0.051 with P=0.011 pre and β5= 0.423 with P=0.351>5% prove
that there was a significance effect pre but not in post-listing period.
57
However, the findings of this study concerning the relation between financial statement
analysis and the banks‟ profitability on BK pre-post listing period shown significant
impact on profitability except SP in post-listing period which shown insignificance on
profitability. The result implies that BK improved its profitability in post-listing period
except from liquidity and spread. Furthermore, the result for the estimated model of the
pre-post listing period shown that all of variables in the model can be considered as driver
of the banks‟ profitability of BK during the pre-post listing period .
5.2 Conclusion
This study has analyzed the financial statements of BK. The sample period was divided
into two sub-periods: pre-listing period (2008-2010) and post-listing period (2012-2014).
The paper specified bank financial performance, namely return on assets as a function of
bank specific determinants, namely liquidity, net Credit, deposits, equity and spread.
In the pre-listing period liquidity of the BK in general has a deteriorating significantly
effect on the return on assets. Spread had no significance on ROA. Net Credit/ loans,
deposits and equity were also found as significant in explaining the bank performance.
Overall, there was differences in the determinants of the performance between pre-listing
and post-listing periods. The differences between two time periods could be explained by
the differences in the legal, financial and transparency. And also banking supervision,
corporate governance and auditing procedures are the most important issues that policy
makers should focus on in order to develop a sound financial system.
5.3 Recommendation
This study suggests that there has been an improved financial performance for BK post-
listing period. However, it is important BK to improve the policy on Cash and cash
58
equivalent to avoid high liquidity and invest them in another way and to focus on to
minimize the interest expenses to avoid to increase the cost of borrowing
5.4 Suggestions for further study
The findings of this research work was subject to several limitations. First, this study
doesn‟t incorporate other commercial banks operating in Rwanda. Second, this study
covers only the quantitative variables. These parameters alone are not sufficient to make
an overall assessment of financial system‟s performance. The assessment of financial
performance may also depend on a broad range of qualitative elements. In particular,
financial performance may also be affected by prevailing economic and political
conditions. Hence, future research may be conducted in the same contest by incorporating
other commercial banks, specialized banks and banks that have started their journey
currently. Again, future studies can be done by taking into other quantitative factors like
leverage, Non-performing loans ratio and so on. Moreover, different points of time can be
accounted to make inter-company and intra-company comparative analysis. Finally,
qualitative variables can be taken into consideration to increase the confidence on the
performance of banking sector.
59
REFFERENCES
Abreu M. and V. Mendes. 2002. “Commercial bank interest margins and profitability:
evidence from E.U countries”, Porto Working paper series.
Adebayo O., David A., Samuel O., (2011), “Liquidity Management and Commercial
Banks‟ Profitability in Nigeria.” Research Journal of Finance and Accounting,
2222-1697 (Paper), ISSN 2222-2847 (Online), Vol. 2,2011. www.iiste.org ISSN
Akram Alkhatib, “Financial Performance of Palestinian Commercial Banks”,
International Journal of Business and Social Science, 3:3, 2012
Alkhatib, A 2012, „Financial Performance of Palestinian Commercial Banks‟,
International Journal of Business and Social Science, Vol. 3 No. 3
Almumani, Mohammad Abdelkarim (2014) A Comparison of Financial Performance of
Saudi Banks (2007-2011). Asian Journal of Research in Banking and Finance,
Vol. 4, No. 2, February 2014, pp 200-213.
ArzuTektas, and GokhanGunay, (2005),” Asset and liability management in financial
crisis”, The Journal of Risk Finance, Vol. 6, No.2, pp.135-149.
Asma Idris, FadliAsari, and Noor Taufik, (2011), “Determinant of Islamic Banking
Institutions „profitability in Malaysia”, Word Applied Sciences Journal 12: 01-
07-2011, ISSN 1818-4952.
Athanasoglou, P, Brissimis, S and Delis, M, 2006, „Bank-specific, Industry-specific and
Macroeconomic Determinants of Bank Profitability‟, Bank of Greece Working
Paper, Greece.
Athanasoglou, P.P., Brissimis,S.N. & Delis, M.D. 2008, "Bank-specific industry-specific
and macroeconomics determinants of bank profitability”, Journal of
International Financial Markets, Institutions and Money, vol. 18,no. 2, pp. 121-
136
60
Avkiran, N. K. (1999). 'The evidence on efficiency gains: the role of mergers and the
benefits to the public.' Journal of Banking and Finance 23(7): 991-1013.
Baisi, D. (2005). Corporate Financial Management. Financial Times/Prentice Hall.
Bashir, A. (2000), “Determinants of profitability and rates of return margins in Islamic
banks: some evidence from the Middle East” Grambling State University Mimeo.
BASHIR, A. (2003). Determinants of Profitability in Islamic Banks: some Evidence from
the Middle, Islamic Economic Studies,Vol. 11, No. 1, pp.31-57.
Bashir, A. 1999. “Risk and Profitability Measures in Islamic Banks: The Case of Two
Sudanese Banks.” Islamic Economic Studies, Vol. 6, No. 2: 1-24.
Bashir, A.H.M. (2001). Assessing the Performance of Islamic Banks: Some Evidence
from the Middle East. Topics in Middle Eastern and North African Economies.
Unpublished paper. Proceedings of the Middle East Economic Association.
Retrieved from: http://gsb.luc.edu/depts/economics/meea/volume3
Berger, A. N., and L.J. Mester, “Beyond the Black Box: What Explains Differences in the
Efficiencies of Financial institutions?” Journal of Banking and Finance, 21,
Brigham, F. E & Houston, J.F. (2011). Essential of financial Management, (2nd
Edition,
cengage learning, united states of America.
Casu B., Girardone C. and Molyneux P. (2006), Introduction to Banking, Pearson
Education Ltd., England.
Casu, B., Molyneux, P. And Girardone, C. (2006). Introduction to Banking, Prentice Hall/
Financial Times, London.
Charles T. Horngren, Walter T.Harrison, Jr & Linda Smith Bamber. 1999. Accounting.
4th Edition. Prentice Hall International.
61
Chaudhry, S. (2012). Performance Appraisal of Indian Sector: A Comparative Study of
Selected Public and Private Sector Banks. International Journal of Research in
Commerce and Management, 3(6), 155- 164.
Chiaku, C.N. (2006). Stock market returns analysis, day-of-the-week effect, and volatility
of returns: Evidence from European Financial markets 1997-2004. International
Research Journal of Finance and Economics, 1,112-24
Cole, David W. (1972), “Return on Equity Model for Banks”, the Bankers Magazine, Vol.
155.
Cole, David W. (1972), “Return on Equity Model for Banks”, TheBankers Magazine, Vol.
155.Credit and Financial Management Review 10(1) pp 33-40.
Determinants of Bank‟s Profitability in Ghana, Anthony Kofi Krakah& Aaron Ameyaw
(2010); working paper: BlekingeTekniskaHögskola; available at:
http://www.camessays.com/upload/doc/Thesis%20bank.pdf date visited (13-07-
2012).
Determinants of Commercial Banks Performance Evidence from Jordan written by Husni
Ali Khrawish(2011), published in International Research Journal of Finance and
Economics, pp. 149-158
Determinants of Islamic Banking Profitability; SudinHaron (2004); Published by: Global
Journal of Finance and Economics; Vol 1, No 1; available at:
Devinaga, R, (2010); Theoretical Framework of Profitability as Applied to Commercial
Banks in Malaysia; European Journal of Economics, Finance and Administrative
Sciences.
62
Dhanabhakyam M. &Kavitha, M. (2012). Financial Performance of selected Public sector
banks in India. International Journal of Multidisciplinary Research, 2(1), pp 255-
269.
Dietrich, A. and Wanzenried, G. 2011. Determinants of bank profitability before and
during the crisis: Evidence from Switzerland. Journal International Financial
Markets Institutions and Money 21. 307-327.
Duru A. N. (2012). Elements of Financial Accounting Made Easy, Enugu Joglas
production works ltd, No. 46, Okafor Road, Enugu,
Edwin J.E., & Martin J.G. (1997). Modern portfolio theory, 1950 to date. J. Bank.Fin., 21:
1743-1759.
Elizabeth D., Greg Elliot (2004),” Efficiency, customer service and financial performance
among Australian financial institutions”, International Journal of Bank
marketing, Vol.22, No.5, pp. 319-342.
Falkena H, Davel G, Hawkins P, Llewellyn D, Luus C, Masilela E, Parr G, forthcoming
(1997).
Frederic, N. K. (2014). Factors affecting performance of commercial banks in Uganda: A
case for domestic commercial banks. Proceedings of 25-th International Business
Research Conference13-14 January, 2014, South Africa, 1-19.
G.G. Judge, Introduction to Theory and Practice of Econometrics, John Willy and Sons,
New York, 1988.
G.R. Pasha, and M.A. Shah, Application of Ridge Regression to Multicollinearity Data,
J.res.Sci. 15(2004), 97-106.
Gibson, Charles H. (2013) Financial Statement Analysis. 13th Edition, South-Western
Cengage Learning.
63
Gilbert, R. Alton and David C.Wheelock (2007) Measuring Commercial Bank
Profitability: Proceed with Caution. Federal Reserve Bank of St. Louis Review,
Vol. 89(6) pp: 515-532
Girmachew, k. (2010),” Financial performance analysis”, A Case Study of
MesfinIndustrial Engineering, Unpublished masters‟ project.
MekelleUniversity,Ethiopia.
Golin, J. (2001). The Bank Credit Analysis Handbook: A Guide for Analysts, Bankers and
Investors. John Wiley & Sons (Asia) Pre Ltd.
Group Report for The National Treasury & the South African Reserve Bank, April 2004
European Journal of Accounting Auditing and Finance Research Vol.2, No.6, pp.
162-177, August 2014 Published by European Centre for Research Training and
Development UK (www.ea-journals.org)
Guisse, M.L. (2012, June). Financial performance of Malaysian Banking
industru:domestic Vs foreign banks. International Journal of Business and
managements, 7(2), 157-169
Gul S, Irshad F, Zaman K (2011). Factors Affecting Bank Profitability in Pakistan,
Romanian Econ. J. 14(39):61-87.
Gul S, Irshad F, Zaman K (2011). Factors Affecting Bank Profitability in Pakistan,
Romanian Econ. J. 14(39):61-87.
Gul, S,Irshad, F,Zaman,K 2011, „Factors Affecting Bank profitability in Pakistan‟, The
Romanian Economic Journal.
Habtamu, N 2012, „Determinants of Bank Profitability‟, An Empirical Study on Ethiopian
Private Commercial Banks, Msc thesis, School of Business and Public
Administration, Addis Ababa university,
64
Hampel F.R., Ronchetti E.M., Rousseeuw P.J., Stahel W.A., (1986): Robust Statistics.
The Approach Based on Influence Functions, Wiley, New York.
Haque, MD Imdadul and Raj Bahadur Sharman (2011) Benchmarking Financial
Performance of Saudi Banks Using Regression. IJBEMR Vol. 2, Issue 1, pp: 78-
84.
Harry M.M. (1991). Autobiography, the Nobel Prizes 1990, Editor Tore Frangsmyr,
[Nobel Foundation], Stockholm, pp. 56-70.
Haslem, J. (1968). A statistical analysis of the relative profitability of commercial banks.
Journal of Finance 23: 167-176.
Haslem, J. (1969). A statistical estimation of commercial bank profitability. Journal of
Business 42: 22-35.
Hassan, M. K. (2006). 'The x-efficiency in Islamic banks.' Islamic Economic Studies
12(2): 49-78.
Hassan, M. K. and A.-H. M. Bashir (2005). 'Determinants of Islamic banking
profitability'. Islamic Perspectives on Wealth Creation.
Hassan, Z. (2005). Islamic Banking at the Crossroads: Theory versus Practice. In: M.
Iqbal M. and R. Wilson, Islamic Perspectives on Wealth Creation. Edinburgh
University Press, UK, 3-20.
Heffernan and Fu, 2010 .Heffernan, S.A., Fu, X., 2010. Determinants of financial
performance in Chinese banking. Applied Financial Economics 20, 1585-1600.
Heffernan, S. and Fu,X.(2010). Determinants of financial performance of Chinese banks.
Applied Financial Economics, 20, 1585-1600.
Hempel, G., Coleman, A., Smon, D. (1986) Bank Management Text and Cases, Wiley,
New York.
65
Hempel, G., Simonson, D., and Coleman, A. (1994). Bank Management: Text and Cases.
4th Edition, John Wiley & Sons, Inc.
Hempell, H.S. 2002: Testing for competition among German banks. Economic Research
centre of the Deutsche. Bundes bank Discussion paper n 04/02.
Hendriksen, E., 1965. Accounting Theory. Richard D. Irwin, Inc., Homewood, IL.
Hendriksen, E.S. and Van Breda, M.F. (1992) Accounting Theory, Fifth Edition.
Homewood and Boston: Richard D. Irwin, Inc.
Husband, G.R. (1938).The Corporate-Entity Fiction and Accounting Theory‟ The
Accounting Review, 13(3), pp. 241-253.
Husni, B, (2011), House Prices and Mortgage Credit Availability: Is the Relationship
Reinforcing? Job Market Paper.
IASB (2007b). The Framework for the Preparation and Presentation of Financial
Statements. International Accounting Standards Board.
ICAN (2013). Financial Statement. Retrieved from http://www.ican.org
IQBAL, S.T. and BAILEY, B.P. 2005. Investigating the Effectiveness of Mental
Workload as a Predictor of Opportune Moments for Interruption. In Proceedings
of the ACM Conference on Human Factors in Computing Systems, Portland,
Oregon, USA, 1489-1492.
Iyiola Omisore Munirat Yusuf &Nwufo Christopher .I. (2012). The modern portfolio
theory as an investment decision, Journal of Accounting and Taxation Vol. 4(2),
http://www.academicjournals.org/JAT IASB (2007a). Presentation of Financial
Statement. Standard IAS 1, International Accounting Standards Board.
James C. Van Horne and John M. Wachowicz (2005), Fundamentals of Financial
Management, 11th
edition, Prentice-Hall of India Private limited, New Delhi.
66
Javaid, S., Anwar, J., Zaman, K and Gaffor, A. (2011). Determinants of Bank
Profitability in Pakistan: Internal Factor Analysis, Mediterranean Journal of
Social Sciences, 2(1): 59-78.
Kam, Vernon (1990) Accounting Theory, New York: John Wiley & Sons.
Khizer Ali. (2011), “Bank-Specific and Macroeconomic Indicators of Profitability
Empirical Evidence from the Commercial Banks of Pakistan” International
Journal of Business and Social Science, Vol. 2 No. 6, pp.235-42
Koch, Timothy W. and MacDonald, Scott S., (2002). “Bank Management” 5-th edition.
Konstantinos Kantzos, Financial Statement Analysis, 2002, Interbooks ed. (in Greek)
Papas A., Introduction to Financial Accounting, vol. A & B, 2005 & 2007, Benos
ed. (in Greek)
Kumbirai, M. & Webb, R. (2010). A financial ratio analysis of commercial performance
in South Africa. African Review of Economics and Finance, 2(1), 30-53.
Kumbirai, M. & Webb, R. (2010). A financial ratio analysis of commercial performance
in South Africa. African Review of Economics and Finance, 2(1), 30-53
Kumbirai, Mabwe and Robert Webb (2010) A financial Ratio Analysis of Commercial
Bank Performance in South Africa. African Review of Economics and Finance,
Vol. 2, No. 1, pp: 30-53.
Lamarana, M 2012, „Financial Performance of the Malaysian Banking Industry‟
Domestic vs Foreign Banks, Eastern Mediterranean University.
Lartey V., Antwi1 S., Boadi E. (2013), “The Relationship between Liquidity and
Profitability of Listed Banks inGhana.”International Journal of Business and
Social Science, Vol. 4 No. 3; March 2013.
67
Lermarck, H., 2003, Steps to Basic Company Financial Analysis. Philadelphia University
R.L Gupta &Radhasamy, “Advanced Accounting”, Vol – I, S.Chand& Company,
New Delhi
Liu, H. and Wilson, J.O. 2010. The profitability of banks in Japan. Applied Financial
Economics 20(24). 1851–1866.
Liu, H. and Wilson, J.O. 2010. The profitability of banks in Japan. Applied Financial
Economics 20(24). 1851–1866.
MacDonald, S. S., & Koch, T. W. (2006). Management of banking. Mason: Thomson.
Macroeconomic Determinants of African Islamic Banks‟ Profitability.
International Journal of Business and Management Science, 3(1): 38 – 58.
Madishetti, S. And Rwechungura, A. K (2013). Determinants of bank profitability in a
developing economy: Empirical Evidence from Tanzania. Asian Journal of
Research in Banking and Finance, 3(110, (pp. 48-52).
Meigs W. &Meigs R., Accounting. The basis for Business Decisions, 1988, Papazissis ed.
(in Greek)
Meigs, R. F., Meigs, W.B. (1993). Accounting: The Basis for Business Decisions (9
edition). New York: McGraw Hill, Inc.
Mester, L. J., “Measuring Efficiency at U.S. Banks: Accounting for Heterogeneity is
Important” European Journal of Operational Research, this issue (1997).
Mohite, V. (2005). A Research based Approach in evolving the functional relationship
between accounting variables: A study of selected nationalized banks in India.
Management & Accounting Research, 7(3 and 4), 90-99.
Moreau, L. (2005). Stability of multiagent systems with time-dependent communication
links. IEEE Transactions on Automatic Control 50(2), 169–182.
68
Naceur, S. B. (2003), „The Determinants of the Tunisian Banking Industry Profitability:
Panel Evidence,‟ UniversiteLibre de Tunis Working Papers.
Naceur, S.B. &Omran, M. (2011).The effects of bank regulations, competition, and
financial reforms on banks' performance. Emerging Markets Review, 12, 1–20.
Narang, Bhawna; Prabhakar, Niti (2011). Profitability: A Study of Indian Public Sector
Banks, SS International Journal of Business and Management Research, Vol. 1,
pp. 188 20
NDIC, (2011). General Commercial Bank Test Report, Annual Report Publication.
www.ndic.org.ng
Needham, D. and Dransfield R. (1991). Business studies. UK: McGraw publication.
Newlove, George Hillis and Paul S. Garner (1951). Advanced Accounting, Volume I:
Corporate Capital and Income, Boston: D.C. Heath and Company.
Northcott, C., 2004. Competition in banking: A review of the literature. Bank of Canada,
Working Paper 2004-24.Okoth, V and Gemechu, B 2013, „Determinants of
Financial Performance of Commercial Banks in Kenya‟, International Journal of
Economics and Financial, Issues Vol. 3, No. 1
Ohlson, J. A. (1995), “Earnings, books values and dividends in security valuation,
Contemporary Accounting Research, Vol. 11, 661-687.
Olagunju, A., David, A. O., & Samuel, O. O. (2012). Liquidity Management and
Commercial Banks' Profitability inNigeria. Research Journal of Finance and
Accounting, 2(7-8), 24-38.
Ongore, V.O. (2011) the relationship between ownership structure and firm performance:
An empirical analysis of listed companies in Kenya. African Journal of Business
Management, 5(6), 2120-2128.
69
Pandey, I. M. (2005). Financial Management. 9th edition. India; vikas Irish Publication
Ltd.
Peters, D, Raad, E., &Sinkey F. J. (2004). The performance of banks in post-war Lebanon.
International Journal of Business, 9(3), 259-286.
Pienaar, J & Shaw H, (2004): Competition in South African Banking, Task
Pienaar, J & Shaw H, (2004): Competition in South African Banking, Task Group Report
for The National Treasury & the South African Reserve Bank, April 2004.
Polit, df&Hungler, bp. 1999. Nursing research: principles and methods. 6th edition.
philadelphia: lippincott.
Ramaratnam, M. S.; Jayaraman, R.; Srinivasan, B. Balaji(2011). A Study on Measuring
the Performance of Indian Banking Sector in the Event of Recent Global
SairaJavaid. (2011), “Determinants of Bank Profitability in Pakistan: Internal Factor
Analysis”, Mediterranean Journal of Social Sciences, Vol. 2, No. 1, pp.59-78.
Saleem Q., Rehman R. (2011). “Impacts of liquidity ratios on profitability (Case of oil
and gas companies ofPakistan).” Interdisciplinary Journal of Research in
Business, Vol. 1, Issue. 7, July 2011(pp.95-98)
Samad, A. (2004). Bahrain Commercial Bank‟s Performance during 1994-2001.
Samad, A. and M.K. Hassan, 2000. Performance of Islamic Bank during 1984-1997: An
exploratory study. Thought on Economics 10 (1) 7-26.
Sangmi, M. (2002). Profitability Management in Commercial Banks: An Exploratory
Study. The Business Review- Journal of the Faculty of Commerce and
Management Studies- The University of Kashmir, Srinagar, 8(1 and 2), 36-49.
Sangmi, M., Tabassum, N. (2010). Analyzing Financial Performance of Commercial
Banks in India: Application of CAMEL Model. Pakistan Journal Commercial
Social Sciences.
70
Seiford LM, Zhu J. An investigation of returns to scale under Data Envelopment Analysis.
Omega. 1999; 27:1–11.
Shahchera, M. (2012). The impact of liquidity assets on Iranian bank profitability.
http://psrcentre.org
Soteriou, A. and S. A. Zenios (1999). 'Operations, quality, and profitability in the
provision of banking services.' Management Science 45(9): 1221-1238.
Speidell, L. S. and J. Graves (2003). Ch 7: “Are Growth and Value Dead? A New
Framework for Equity Investment Styles.” In: T. D. Coggin and F. J. Fabozzi
eds., Handbook of Equity Style Management. Hoboken, John Wiley & Sons Inc.
171-193.
Staubus, G. J. (1952). Payments for the Use of Capital and the Matching Process‟ the
Accounting Review, 27(1), pp. 104-113.
Staubus, G. J. (1959).The Residual Equity Point of View in Accounting‟ The Accounting
Review, 34(1), pp. 3-13.
Sufian, F. (2009) Assessing the Impact of Mergers and Acquisitions on Bank Profit
Efficiency: Empirical Evidence from Malaysia, International Journal Decision
Sciences, Risk and Management 1: 258-285.
Sufian, F. (2011). Profitability of the Korean Banking Sector: Panel Evidence on Bank-
Specific and Macroeconomic Determinants, Journal of Economics and
Management, 7(1):43-72.
Sufian, F. and Chong, R.R. (2008) Determinants of Bank Profitability in A Developing
Economy: Empirical Evidence from the Philippines, Asian Academy of
Management Journal of Accounting and Finance 4: 91-112.
Suojanen, W. W. (1954). Accounting Theory and the Large Corporation‟ the Accounting
Review, 29(3), pp. 391-398.
71
Suojanen, W. W. (1958) „Enterprise Theory and Corporate Balance Sheets‟ the
Accounting Review, 33(1), pp. 56-65.
Suojanen, W. W. (1958). Enterprise Theory and Corporate Balance Sheets‟ the
Accounting Review, 33(1), pp. 56-65.
Syafri (2012). Factors Affecting Bank Profitability in Indonesia, The 2012 International
Conference on Business and Management 6 – 7 September 2012, Phuket –
Thailand.
Syafri (2012). Factors Affecting Bank Profitability in Indonesia, The 2012 International
Conference on Business and Management 6 – 7 September 2012, Phuket –
Thailand.
Tarawneh, M (2006). A comparison of financial performance in the banking sector: some
evidence from Omani Commercial banks. International journal of Finance and
Economics, issue 3 (2006)
Thygerson, K., J. (1995). Management of financial Institutions, HarperCollins College
Publishers.
Timothy W Koch and S Scott MacDonald (2015) Bank Management, Eighth edition,
Boston, MA USA: Cengage Learning.
Turati, G (2003): Cost Efficiency and Profitability in European Commercial Banks:
Implications for Antitrust Analysis, last accessed 15 September, 2005 from
http:/www.web.econ.unito.it/prato/papers/qr69.pdf
Uppal, R. K. (2010).Indian Banks in the Era of Global Financial Crisis--Emerging
Challenges and Opportunities, International Journal of Research in Commerce
and Management, May 2010, Vol. 1, Issue. 1, pp. 72-88Uppal,R. K.; June ja,
Amit (2012). Increasing Competitiveness in Indian Financial System-A Modern
72
Day Trend,SS International Journal of Business and Management Research, Vol.
2, Issue. 4, pp. 38-59
Uremadu S. (2012), “Bank Capital Structure, Liquidity and Profitability Evidence from
the Nigerian BankingSystem.” International Journal of Academic Research in
Accounting, Finance and Management Sciences,Volume 2, Issue 1 (2012) ISSN:
2225-8329
Valla, N, Saes-Escorbiac, B. (2006) Bank liquidity and financial stability. Banque de
France Financial StabilityReview, 89-104.
Vensel V., Aarma, A., Vainu J., (2004). “Bank Performance Analysis: Methodology and
Empirical Evidence (Estonian Banking System, 1994-2002)”, Working Paper
Series.
Vensel V., Aarma, A., Vainu J., (2004). “Bank Performance Analysis: Methodology and
Empirical Evidence (Estonian Banking System, 1994-2002)”, Working Paper
Series.
Vong, J. and F. Nourzad. (2009). “Do Lower Mortgage Rates Mean Higher Housing
Prices?” Applied Economics, 36, 20-34.
W.H. Green, Econometric Analysis, Mac-Millan, New York, 1993. Charles H. Gibson &
Patricia A. Frishk off. 1983. 2´nd Edition. Kent Publishing Company. Boston,
Massachusetts, United States of America.
Walker John S., (2007), “Using the DuPont Equation to Improve Your Bank‟s
Performance”, Ambassador Financial Group Inc. Research, October 2007.
William N. Goetzmann (2011). Introduction to Investment Theory. Yale University of
School of Management, University Printing Press.World Bank (2004). Report on
the Observance of Standards and Codes (ROSC) Nigeria, Accounting and
Auditing. Retrieved May 1, 2007

73
Yadollahzadeh, N, Ahmadi, M and Soltan, M, 2013, „The Effective Factors on
profitability of Commercial Banks in Iran‟, World of Sciences Journal.

74
APPENDICES

75
APPENDIX I: AUTHORIZATION LETTER
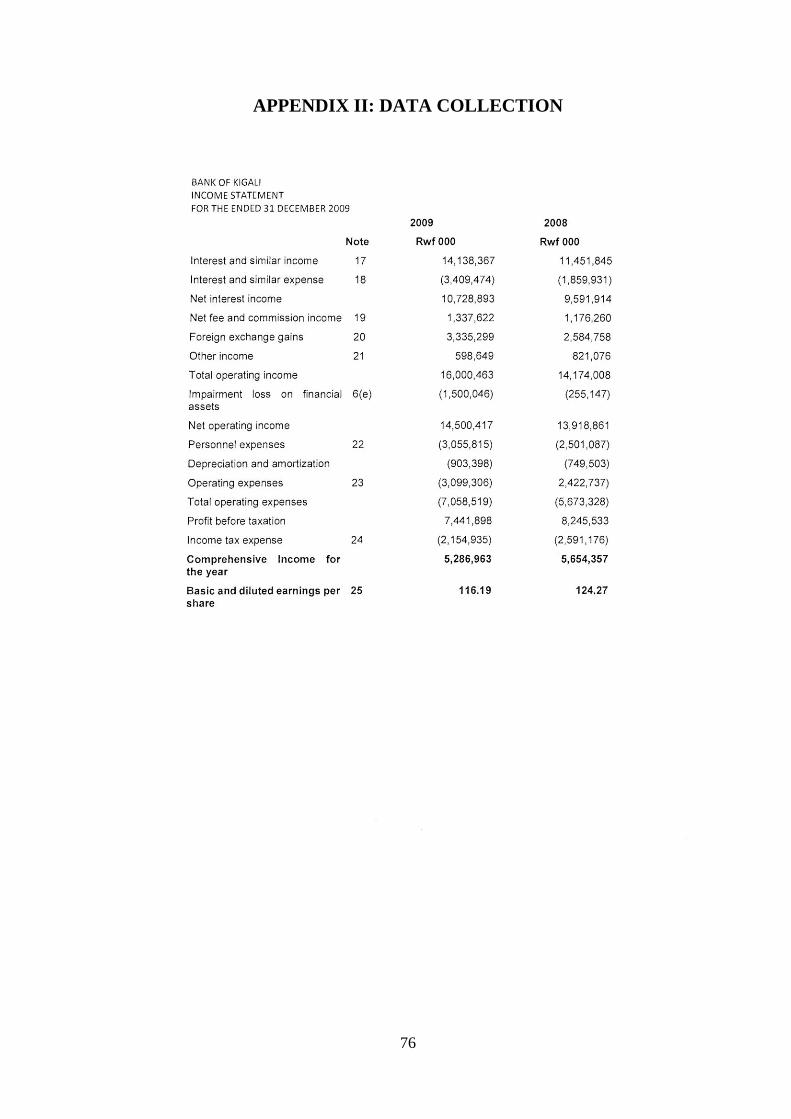
76
APPENDIX II: DATA COLLECTION
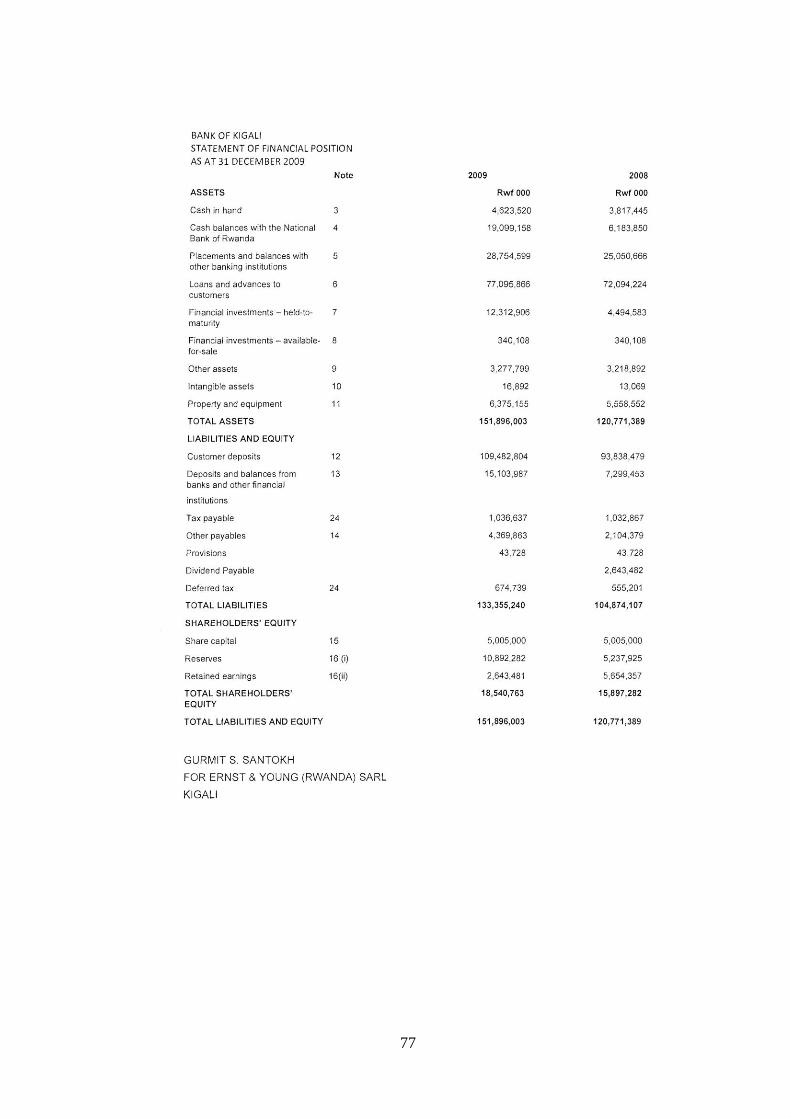
77

78
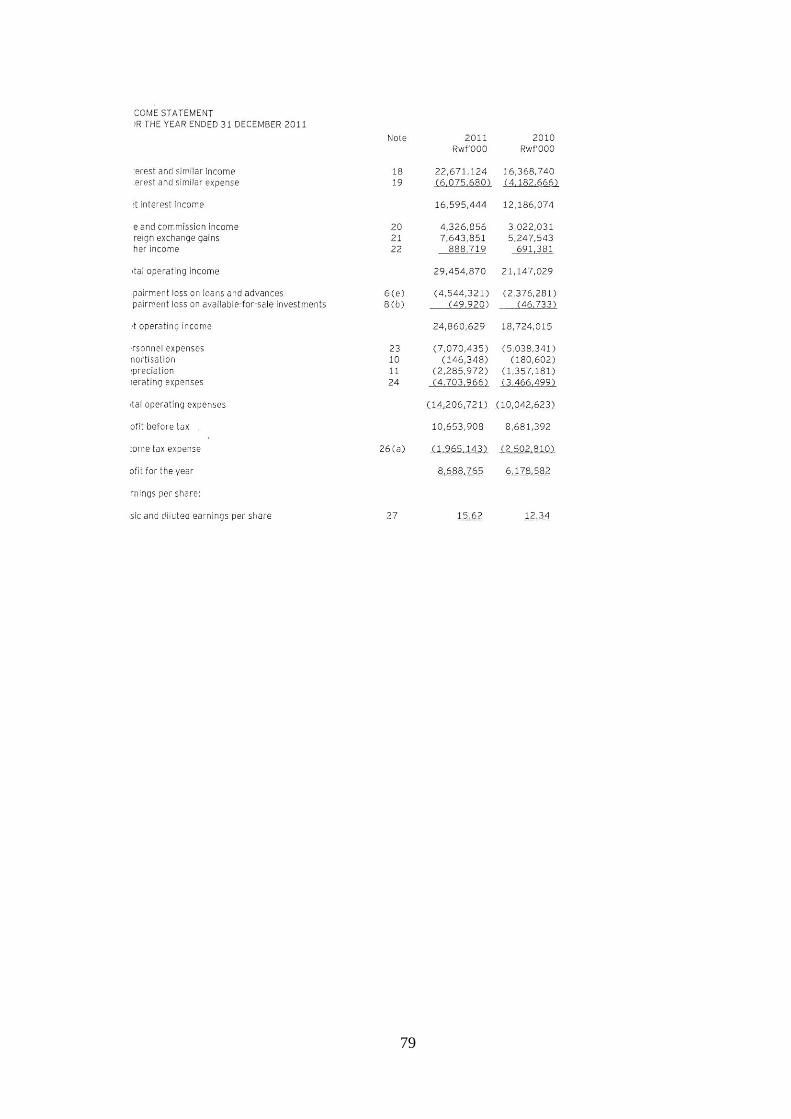
79
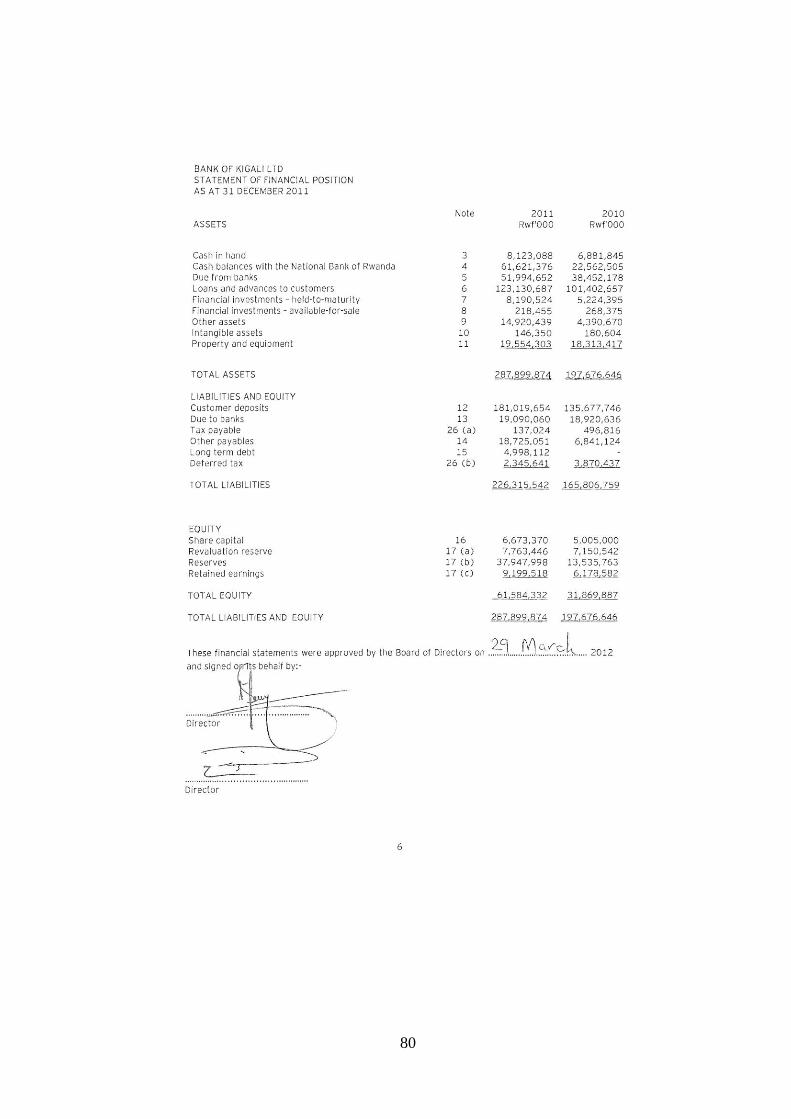
80
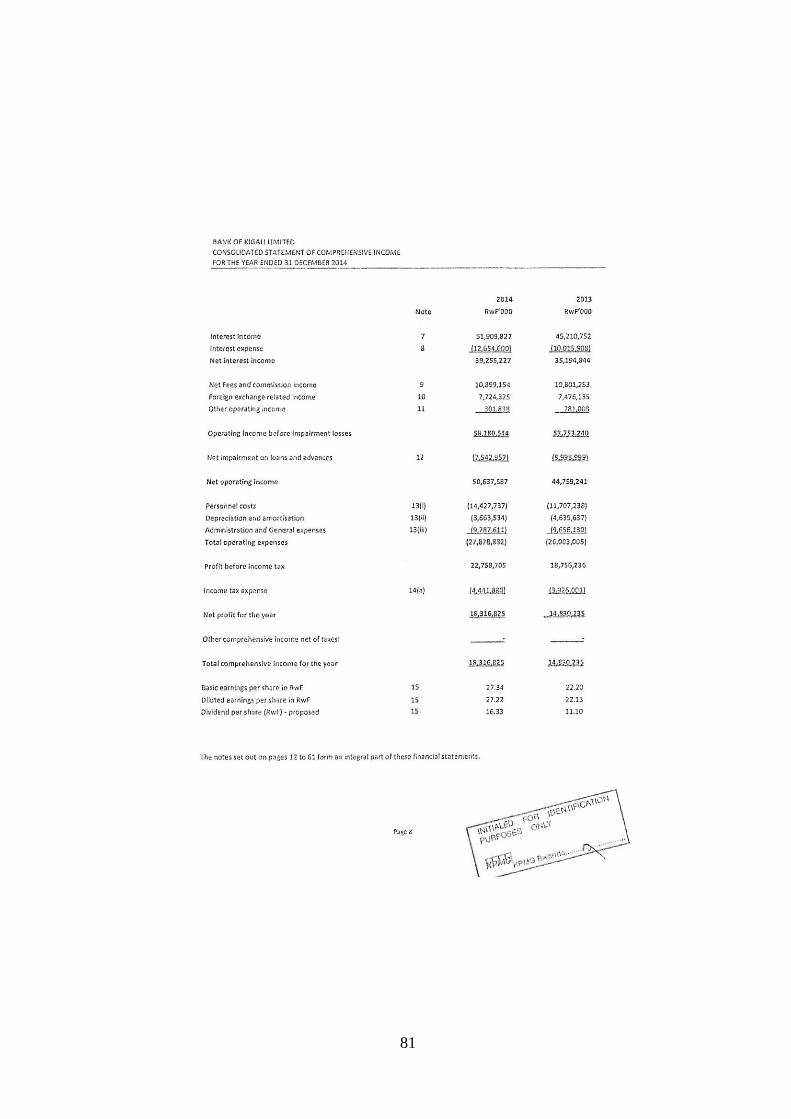
81
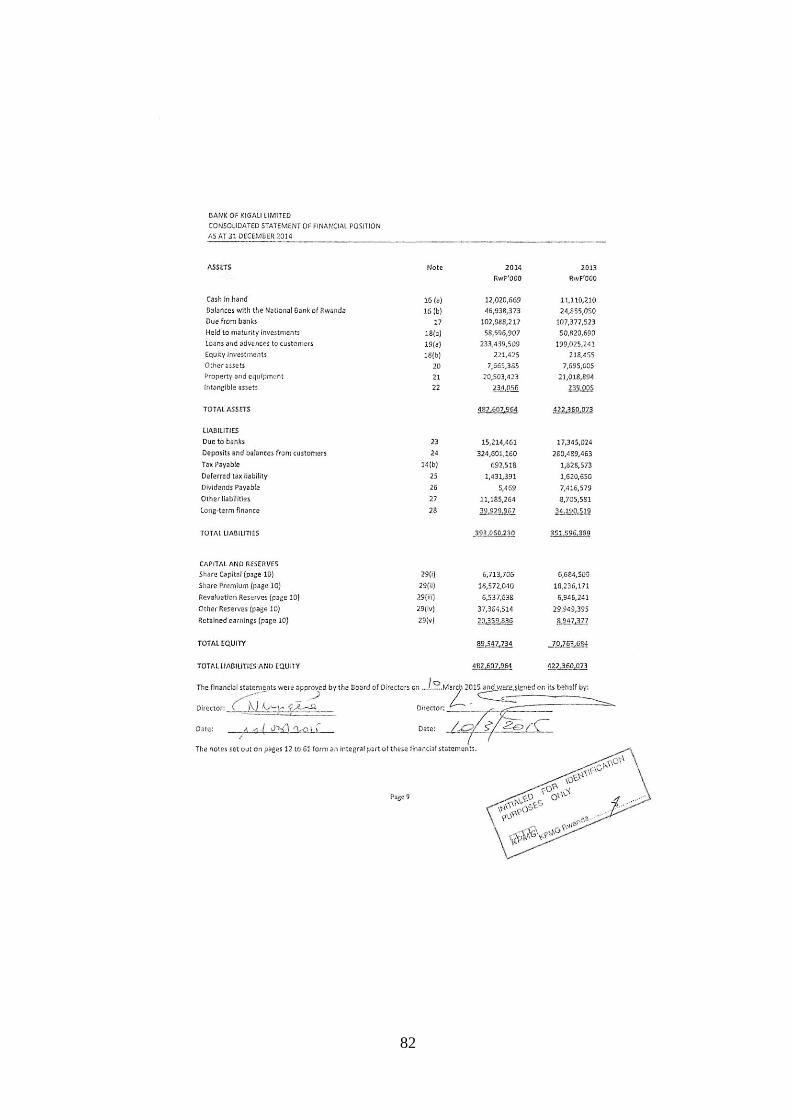
82
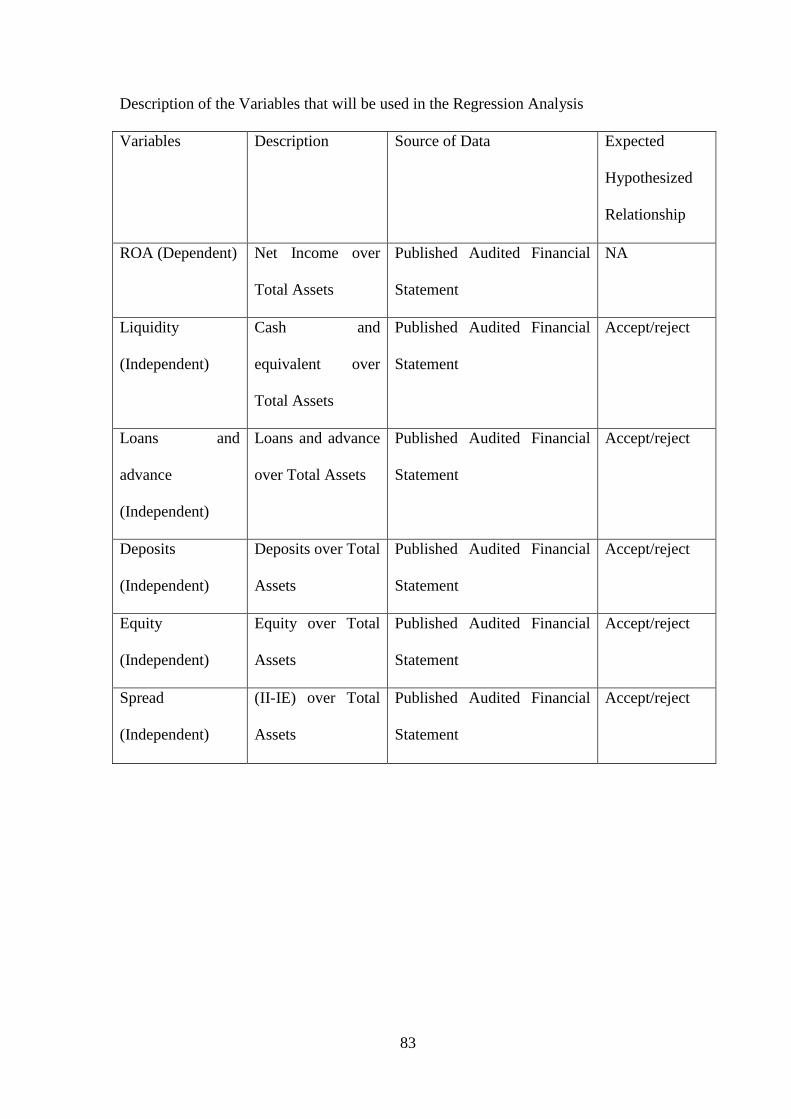
83
Description of the Variables that will be used in the Regression Analysis
Variables Description Source of Data Expected
Hypothesized
Relationship
ROA (Dependent) Net Income over
Total Assets
Published Audited Financial
Statement
NA
Liquidity
(Independent)
Cash and
equivalent over
Total Assets
Published Audited Financial
Statement
Accept/reject
Loans and
advance
(Independent)
Loans and advance
over Total Assets
Published Audited Financial
Statement
Accept/reject
Deposits
(Independent)
Deposits over Total
Assets
Published Audited Financial
Statement
Accept/reject
Equity
(Independent)
Equity over Total
Assets
Published Audited Financial
Statement
Accept/reject
Spread
(Independent)
(II-IE) over Total
Assets
Published Audited Financial
Statement
Accept/reject

84
Data Observation checklist
Task Activities Time/Days
1 Data Collection
1
2 Data Processing 2
3 Model Development 2
4 Data, Model Review 2
5 Final Model/Report 2
Data will be collected from BK Published Audited Report
Hypothesis will be used for relationship between pre-post listing
Number of Observation will use (3) Years Pre and (3) Years post listing
Multicollinearity will test the relevant independent variables and the level of significance
will be tested by Hausman test. And the test will determine to Accept or Reject the
hypothesis.