Embed Size (px)
Citation preview
Annual ReportFinancial Statements and Analysis
This ’Financial Statements and Analysis booklet’ and the separate booklet entitled‘Management Report’ together comprise the full Annual Report for the year 2003of Koninklijke Philips Electronics N.V. (‘Royal Philips Electronics’).For a full understanding of the results of the Philips Group and the state of affairs,both booklets should be consulted.
‘Safe Harbor’ Statement under the Private Securities Litigation Reform Act of1995This document contains certain forward-looking statements with respect to thefinancial condition, results of operations and business of Philips and certain of theplans and objectives of Philips with respect to these items, (including, but notlimited to, cost savings), in particular the outlook paragraph of the ‘Operating andFinancial Review and Prospects’ in this ‘Financial Statements and Analysis’ booklet.By their nature, forward-looking statements involve risk and uncertainty becausethey relate to events and depend on circumstances that will occur in the future.There are a number of factors that could cause actual results and developments todiffer materially from those expressed or implied by these forward-lookingstatements. These factors include, but are not limited to, levels of consumer andbusiness spending in major economies, changes in consumer tastes and preferences,changes in law, the performance of the financial markets, pension costs, the levels ofmarketing and promotional expenditures by Philips and its competitors, rawmaterials and employee costs, changes in exchange and interest rates (in particularchanges in the euro and the US dollar can materially affect results), changes in taxrates and future business combinations, acquisitions or dispositions and the rate oftechnological changes.
Market share estimates contained in this report are based on outside sources suchas specialized research institutes, industry and dealer panels, etc. in combinationwith management estimates. Rankings are based on sales unless otherwise stated.
Use of non-GAAP informationIn presenting and discussing the Philips Group’s financial position, operating resultsand cash flows, management uses certain non-GAAP financial measures. Thesenon-GAAP financial measures should not be viewed in isolation as alternatives tothe equivalent GAAP measure and should be used in conjunction with the mostdirectly comparable US GAAP measure(s). Unless otherwise indicated in thisdocument, a discussion of the non-GAAP measures included in this document anda reconciliation of such measures to the most directly comparable US GAAPmeasure(s) is contained in the ’Group Performance’ section of ’Operating andFinancial Review and Prospects’ in this ’Financial Statements and Analysis’ booklet.
1Philips Annual Report 2003
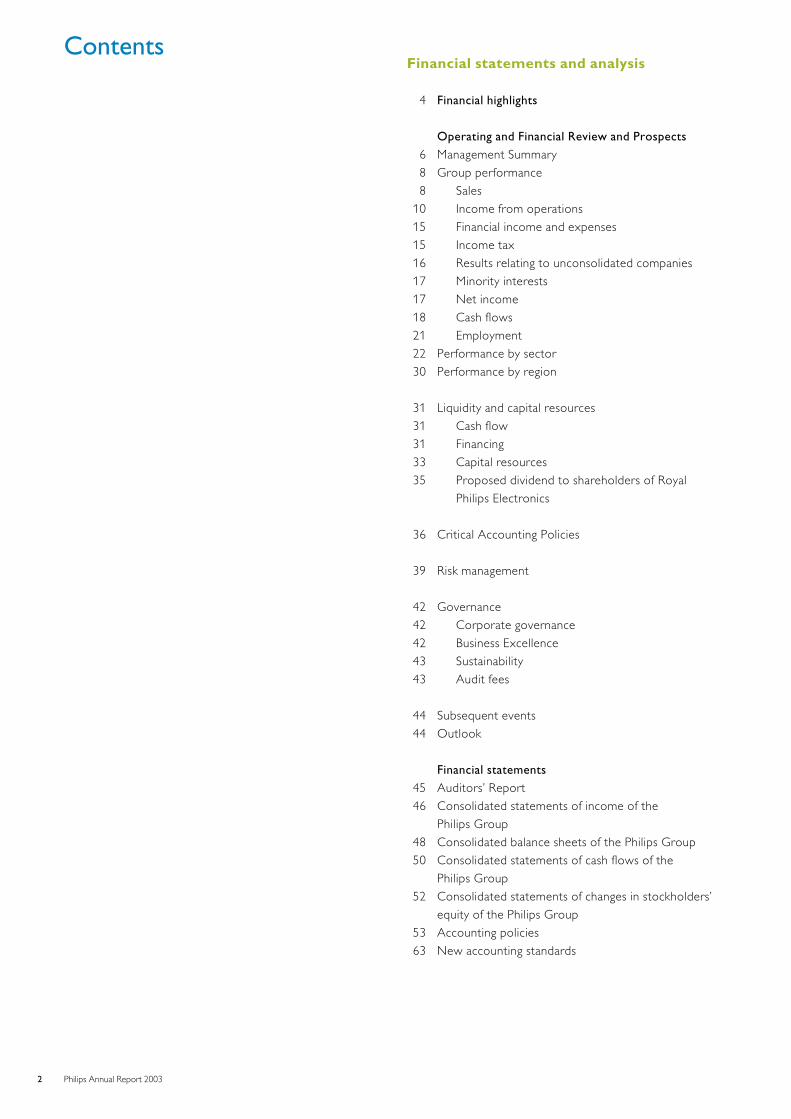
ContentsFinancial statements and analysis
4 Financial highlights
Operating and Financial Review and Prospects
6 Management Summary
8 Group performance
8 Sales
10 Income from operations
15 Financial income and expenses
15 Income tax
16 Results relating to unconsolidated companies
17 Minority interests
17 Net income
18 Cash flows
21 Employment
22 Performance by sector
30 Performance by region
31 Liquidity and capital resources
31 Cash flow
31 Financing
33 Capital resources
35 Proposed dividend to shareholders of Royal
Philips Electronics
36 Critical Accounting Policies
39 Risk management
42 Governance
42 Corporate governance
42 Business Excellence
43 Sustainability
43 Audit fees
44 Subsequent events
44 Outlook
Financial statements
45 Auditors’ Report
46 Consolidated statements of income of the
Philips Group
48 Consolidated balance sheets of the Philips Group
50 Consolidated statements of cash flows of the
Philips Group
52 Consolidated statements of changes in stockholders’
equity of the Philips Group
53 Accounting policies
63 New accounting standards
2 Philips Annual Report 2003
Contents (continued)
66 Notes to the consolidated financial statements of the
Philips Group
66 1 Acquisitions and divestments
71 2 Income from operations
79 3 Financial income and expenses
80 4 Income taxes
82 5 Investments in unconsolidated companies
86 6 Minority interest
86 7 Cumulative effect of a change in accounting
principles
87 8 Earnings per share
87 9 Receivables
88 10 Inventories
88 11 Other current assets
88 12 Other non-current financial assets
89 13 Non-current receivables
89 14 Other non-current assets
90 15 Property, plant and equipment
91 16 Intangible assets excluding goodwill
92 17 Goodwill
92 18 Accrued liabilities
93 19 Provisions
94 20 Pensions
98 21 Postretirement benefits other than pensions
99 22 Other current liabilities
100 23 Short-term debt
100 24 Long-term debt
102 25 Other non-current liabilities
102 26 Commitments and contingent liabilities
107 27 Stockholders’ equity
108 28 Cash from derivatives
108 29 Proceeds from other non-current financial
assets
108 30 Assets received in lieu of cash from the sale of
businesses
108 31 Related party transactions
109 32 Stock-based compensation
113 33 Information on remuneration of the individual
members of the Board of Management and the
Supervisory Board
117 34 Financial instruments and risks
123 35 Information relating to product sectors and
main countries
Dutch GAAP information
128 Accounting principles applied for Dutch GAAP
purposes
128 Presentation of financial statements
128 Dutch GAAP reconciliation
130 Consolidated statements of income of the
Philips Group
132 Consolidated balance sheets of the Philips Group
134 Consolidated statements of changes in stockholders’
equity of the Philips Group
135 Notes to the consolidated financial statements of the
Philips Group
135 36 Income from operations
135 37 Financial income and expenses
135 38 Income taxes
135 39 Unconsolidated companies
137 40 Other non-current assets
137 41 Goodwill – consolidated companies
137 42 Stockholders’ equity
138 Balance sheets and statements of income of Koninklijke
Philips Electronics N.V. (‘Royal Philips Electronics’)
139 Notes to the financial statements of Royal Philips
Electronics
139 A Receivables
139 B Investments in affiliated companies
140 C Other non-current financial assets
140 D Tangible fixed assets – net
140 E Intangible fixed assets – net
141 F Other liabilities
141 G Short-term debt
141 H Provisions
141 I Long-term debt
142 J Stockholders’ equity
142 K Net income
142 L Employees
143 M Obligations not appearing in the balance sheet
Other information145 Auditors’ Report
146 Proposed dividend to shareholders of Royal Philips
Electronics
146 Corporate governance of the Philips Group
162 The Philips Group in the last ten years
164 Shareholder services
3Philips Annual Report 2003
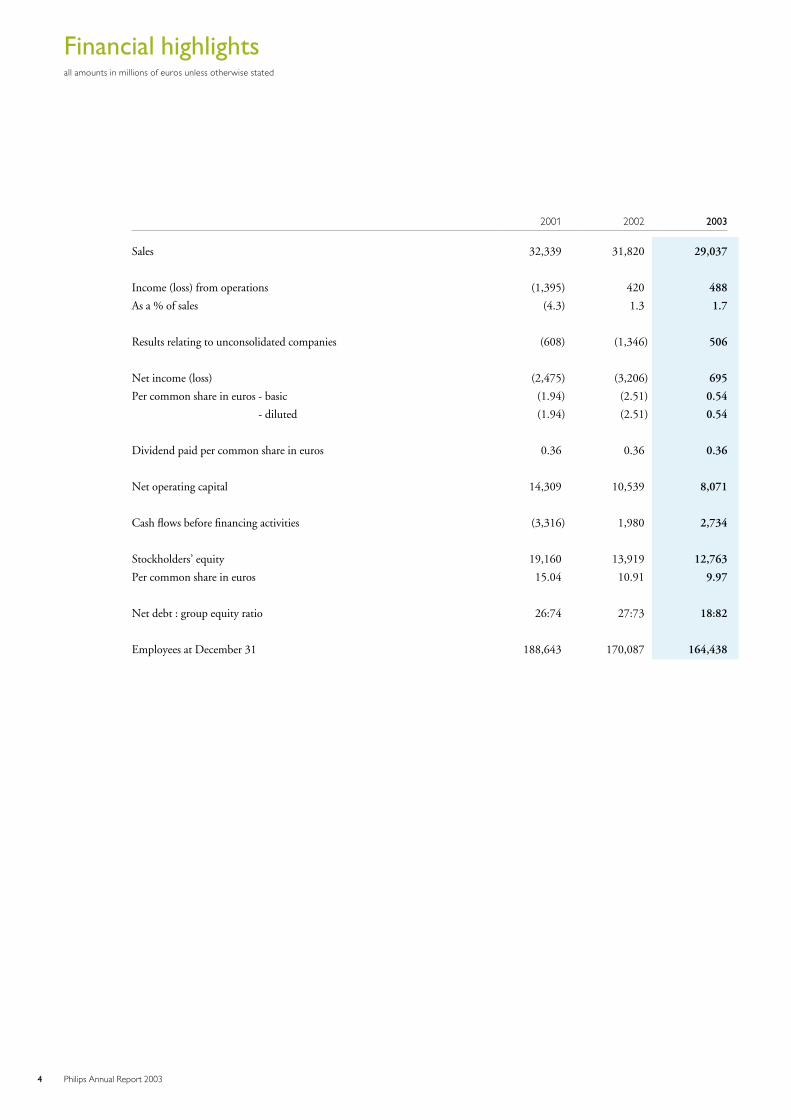
Financial highlightsall amounts in millions of euros unless otherwise stated
2001 2002 2003
Sales 32,339 31,820 29,037
Income (loss) from operations (1,395) 420 488
As a % of sales (4.3) 1.3 1.7
Results relating to unconsolidated companies (608) (1,346) 506
Net income (loss) (2,475) (3,206) 695
Per common share in euros - basic (1.94) (2.51) 0.54
- diluted (1.94) (2.51) 0.54
Dividend paid per common share in euros 0.36 0.36 0.36
Net operating capital 14,309 10,539 8,071
Cash flows before financing activities (3,316) 1,980 2,734
Stockholders’ equity 19,160 13,919 12,763
Per common share in euros 15.04 10.91 9.97
Net debt : group equity ratio 26:74 27:73 18:82
Employees at December 31 188,643 170,087 164,438
4 Philips Annual Report 2003
Operating and Financial Review and Prospectsall amounts are expressed in millions of euros unless otherwise stated
The following discussion is based on the consolidated financial statements and shouldbe read in conjunction with those statements and the other financial information.
Philips’ consolidated financial statements have been prepared in accordance withaccounting principles generally accepted in the United States (US GAAP). Theseaccounting principles differ in some respects from generally accepted accountingprinciples in the Netherlands (Dutch GAAP). In addition to the US GAAPconsolidated financial statements, Dutch GAAP financial statements on a consolidatedand single company basis are provided. A reconciliation of material differencesbetween the two is provided in the separate section entitled ‘Dutch GAAPinformation’ on page 128. For purposes of Dutch corporate law, the Company’sbalance sheet under Dutch GAAP is determinative of the amount available fordistribution to shareholders.Net income determined in accordance with Dutch GAAP amounted to a profit of 705 million in 2003, compared with a loss of 3,602 million in 2002. Theseaggregate amounts result in basic earnings per common share of a profit of 0.55in 2003 and a loss of 2.83 in 2002. Diluted earnings per common shareamounted to a profit of 0.55 in 2003 and a loss of 2.83 in 2002.
The Company believes that an understanding of sales performance is enhanced whenthe effects of currency movements and acquisitions and divestitures (changes inconsolidation) are excluded. Accordingly, in addition to presenting ‘nominal growth’,‘comparable growth’ is also provided.Comparable sales levels exclude currency and consolidation effects.As indicated in the Accounting Policies, sales and income are translated from foreigncurrencies into the reporting currency of the Company, the euro, at weighted averageexchange rates during the respective years. As a result of the significant currencyfluctuations during the years presented, the effects of translating foreign currencysales amounts into euros had a material impact that has been excluded in arriving atthe comparable sales level in euros. Currency effects have been calculated bytranslating previous years’ foreign currency sales amounts into euros at the currentyear’s exchange rates in comparison with the sales in euros as historically reported.The years 2001 through 2002 were characterized by a number of acquisitions anddivestments, as a result of which activities were consolidated or deconsolidated asdisclosed in note 1 to the consolidated Financial Statements of the Philips Group onpages 66 through 71 of the 2003 Annual Report – Financial Statements and Analysis.The effect of consolidation changes has also been excluded in arriving at thecomparable sales level.Philips discontinues consolidating companies (‘deconsolidation’) under the followingcircumstances. On sale of a controlling interest in a subsidiary to unrelated parties,the sold entity is excluded from the consolidated results prospectively from the dateof sale. On contribution of a previously consolidated subsidiary to a joint venture,consolidation is discontinued as of the formation of the joint venture.
5Philips Annual Report 2003
Special items, as presented in the Report on the performance of the Philips Group,relate to income and expenses resulting from normal business operations, which,because of their size or nature, are disclosed separately to give a better understanding ofthe underlying result for the period. Special items are items such as restructuring andimpairment charges, acquisition-related charges and significant gains and/or losses onthe disposal of businesses or participations and real estate.
As of January 1, 2003, the Components division was dissolved. Parts of the division’sactivities were moved to Semiconductors, Consumer Electronics and theMiscellaneous sector. Also as of January 1, 2003 the activities belonging to DigitalNetworks have been relocated within the Consumer Electronics sector and partly tothe Miscellaneous sector.As a consequence, segment reporting for Semiconductors, Consumer Electronics andMiscellaneous has been restated retroactively to 2002 and 2001.
Management Summary
Over the past year the Company has made considerable progress on its journey to createOne Philips – a single, focused and clearly identifiable company geared to sustainedprofitability. Strict financial discipline, focused execution of the management agenda andresolute pursuit of the strategy have guided us in this endeavor.In 2003 the change programs and the asset management and cost control measuresimplemented over the previous two years delivered significant benefits. Excluding theimpact of the weakening of the US dollar and related currencies (10%) and the impact ofvarious divestments (3%), comparable annual sales rose by 4%, reversing the downwardtrend of the last two years. Nominal sales in 2003 declined by 9% compared to 2002.Income from operations totaled 488 million (2002: 420 million), driven by animproved performance from Medical Systems, Consumer Electronics (including Licenses)and Semiconductors. Income from operations benefited from significant cost savingsresulting from the various cost-saving programs implemented over the last two years. Theimprovement in income was, however, negatively affected by restructuring andimpairment charges, as well as higher pension costs. Especially encouraging is the fact thatin the fourth quarter all five product divisions delivered healthy levels of profitability. Theunconsolidated companies, in particular TSMC and LG.Philips LCD, made strongcontributions. The other joint venture with LG – LG.Philips Displays – had a moredifficult year, forcing us to take a non-cash impairment charge. Group net income rosesharply to 695 million.Cash flow from operating activities totaled 2 billion, as a result of the Company’simproved operating performance combined with its undiminished focus on supply chainmanagement and tight capital management.
Delivering on commitments
A year ago, the Company committed to delivering on the following management agenda:G achieve cost savings of 1 billionG restore Semiconductors to profitability by the end of the yearG bring Consumer Electronics in the USA to full profitability from the fourth quarter
onwardG improve Medical Systems’ profitabilityG make Philips a truly market-driven company.
6 Philips Annual Report 2003
Financial Statements and Analysis
Achieve cost savings of EUR 1 billion
In 2003, the Company again made excellent progress with its two-year program to cutcosts, exceeding its ambitious target of 1 billion savings by the end of the year. Duringthe past year alone, the Company achieved consolidated savings of 486 million. Thesavings were realized through a reduction in overhead costs, post-merger integrationsavings at Medical Systems, and other initiatives designed to lower the cost base, e.g. inthe fields of non-product-related purchasing and R&D. However, this was more than acost-cutting exercise: it was an essential part of the program to create a simpler, moreresponsive organization.The Company anticipates that the continued implementation of shared services inFinance and HRM will deliver additional benefits in the future.
Restore Semiconductors to profitability
Semiconductors delivered on all points of their improvement plan, resulting in aprofitability level of 11% in the fourth quarter. Capacity was rationalized, primarily throughthe closure of the production facilities in San Antonio and Albuquerque. R&D efforts havebeen focused on connected consumer applications, structures simplified and throughputtimes reduced. Most importantly, sequential revenue in the fourth quarter increased 22%in terms, signaling good market acceptance of the system solutions based on theNexperia platform. This gives the Company confidence for the future.
Consumer Electronics in the USA
Consumer Electronics made progress in 2003, with its US operations reaching break-evenin the fourth quarter while taking additional measures to further lower the cost base for2004. On a global level, Consumer Electronics has in recent years continually lowered itsrisk exposure and reduced costs. As a result, the division has emerged a good deal leanerand fitter, and it expects to be able to achieve further annual savings of 400 millionwithin two years by executing the business renewal program. On the revenue side, thedivision is focusing on winning market share in key categories, with exciting, leading-edgeproducts such as our Flat TV and DVD+RW ranges.
Improved profitability for Medical Systems
Medical Systems progressed according to plan, realizing synergy benefits of almost 350
million. Income from operations (IFO) increased by 39% to 431 million and is ontrack for the EBITA objective of 14% in 2004 (equal to 12.2% IFO).Having completed the imaging portfolio with the recent acquisitions, and inspired by along-term vision of removing traditional healthcare boundaries, the focus over the comingyears will shift to expanding customer services and healthcare IT while developing newinitiatives in the areas of personal healthcare and molecular medicine.An important step in 2003 was the alliance with Epic Systems Corporation to provideenterprise software, medical imaging and monitoring IT solutions that integrate patientinformation enterprise-wide.
Making Philips a truly market-driven company
The objective of transforming Philips into a truly market-driven company involves anongoing effort to build strong customer intimacy across the entire organization, develop asuperior brand strategy and foster best-in-class marketing competencies to drive profitablegrowth. The Company made good progress on this front in 2003, strengthening the keyaccount management, identifying the core target group for the marketing message, anddeveloping a clear positioning for the Philips brand, which will be rolled out in 2004. TheCompany also consolidated to one advertising agency to enhance consistent delivery.
7Philips Annual Report 2003
Group performance
Sales
2002 versus2001
2003 versus2002
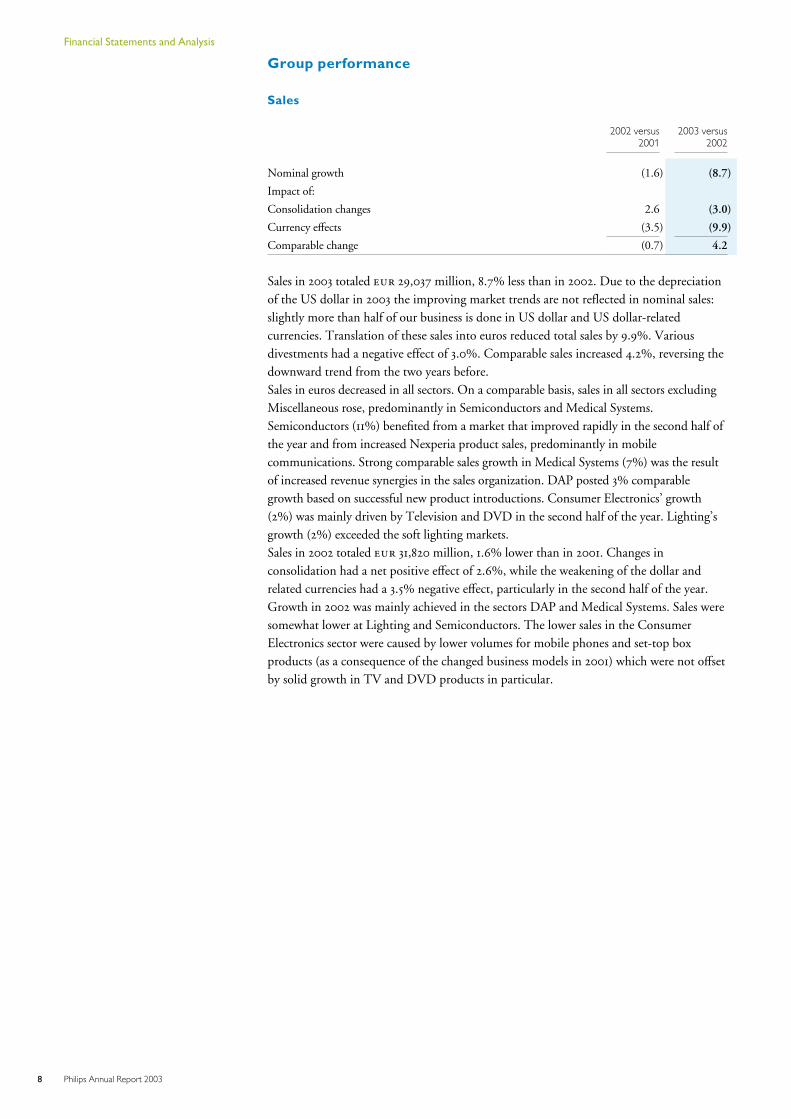
Nominal growth (1.6) (8.7)
Impact of:
Consolidation changes 2.6 (3.0)
Currency effects (3.5) (9.9)
Comparable change (0.7) 4.2
Sales in 2003 totaled 29,037 million, 8.7% less than in 2002. Due to the depreciationof the US dollar in 2003 the improving market trends are not reflected in nominal sales:slightly more than half of our business is done in US dollar and US dollar-relatedcurrencies. Translation of these sales into euros reduced total sales by 9.9%. Variousdivestments had a negative effect of 3.0%. Comparable sales increased 4.2%, reversing thedownward trend from the two years before.Sales in euros decreased in all sectors. On a comparable basis, sales in all sectors excludingMiscellaneous rose, predominantly in Semiconductors and Medical Systems.Semiconductors (11%) benefited from a market that improved rapidly in the second half ofthe year and from increased Nexperia product sales, predominantly in mobilecommunications. Strong comparable sales growth in Medical Systems (7%) was the resultof increased revenue synergies in the sales organization. DAP posted 3% comparablegrowth based on successful new product introductions. Consumer Electronics’ growth(2%) was mainly driven by Television and DVD in the second half of the year. Lighting’sgrowth (2%) exceeded the soft lighting markets.Sales in 2002 totaled 31,820 million, 1.6% lower than in 2001. Changes inconsolidation had a net positive effect of 2.6%, while the weakening of the dollar andrelated currencies had a 3.5% negative effect, particularly in the second half of the year.Growth in 2002 was mainly achieved in the sectors DAP and Medical Systems. Sales weresomewhat lower at Lighting and Semiconductors. The lower sales in the ConsumerElectronics sector were caused by lower volumes for mobile phones and set-top boxproducts (as a consequence of the changed business models in 2001) which were not offsetby solid growth in TV and DVD products in particular.
8 Philips Annual Report 2003
Financial Statements and Analysis
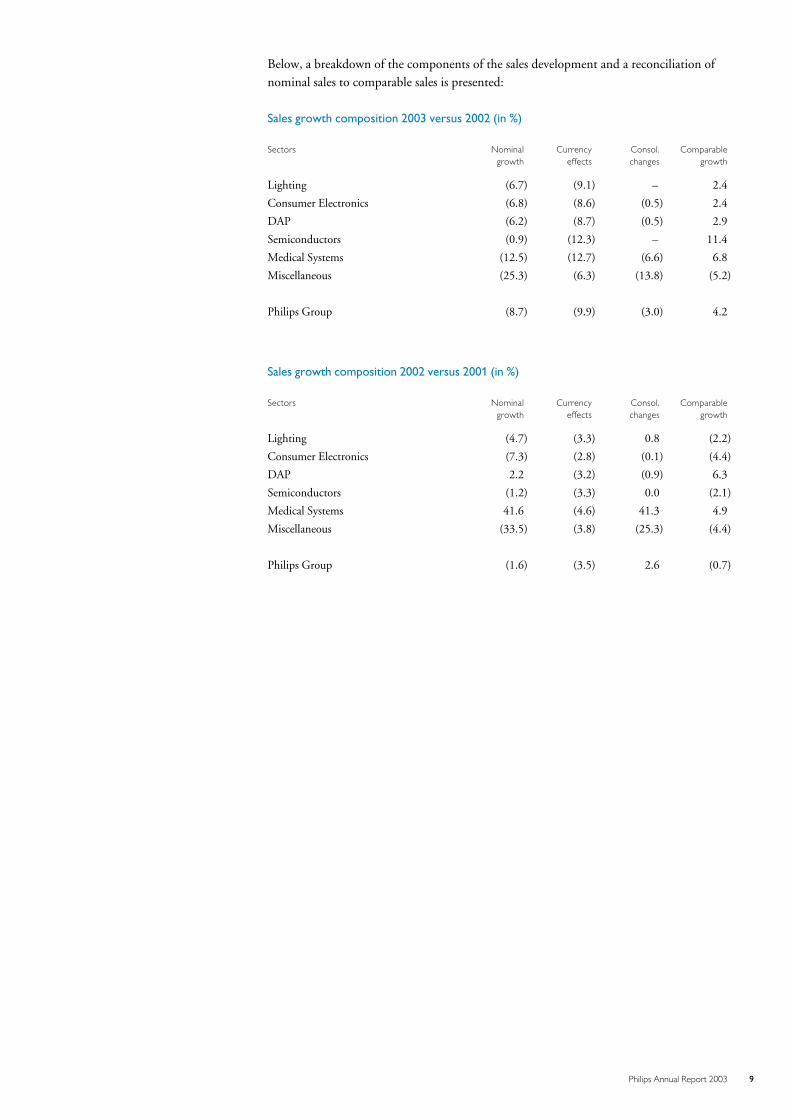
Below, a breakdown of the components of the sales development and a reconciliation ofnominal sales to comparable sales is presented:
Sales growth composition 2003 versus 2002 (in %)
Sectors Nominalgrowth
Currencyeffects
Consol.changes
Comparablegrowth
Lighting (6.7) (9.1) – 2.4
Consumer Electronics (6.8) (8.6) (0.5) 2.4
DAP (6.2) (8.7) (0.5) 2.9
Semiconductors (0.9) (12.3) – 11.4
Medical Systems (12.5) (12.7) (6.6) 6.8
Miscellaneous (25.3) (6.3) (13.8) (5.2)
Philips Group (8.7) (9.9) (3.0) 4.2
Sales growth composition 2002 versus 2001 (in %)
Sectors Nominalgrowth
Currencyeffects
Consol.changes
Comparablegrowth
Lighting (4.7) (3.3) 0.8 (2.2)
Consumer Electronics (7.3) (2.8) (0.1) (4.4)
DAP 2.2 (3.2) (0.9) 6.3
Semiconductors (1.2) (3.3) 0.0 (2.1)
Medical Systems 41.6 (4.6) 41.3 4.9
Miscellaneous (33.5) (3.8) (25.3) (4.4)
Philips Group (1.6) (3.5) 2.6 (0.7)
9Philips Annual Report 2003
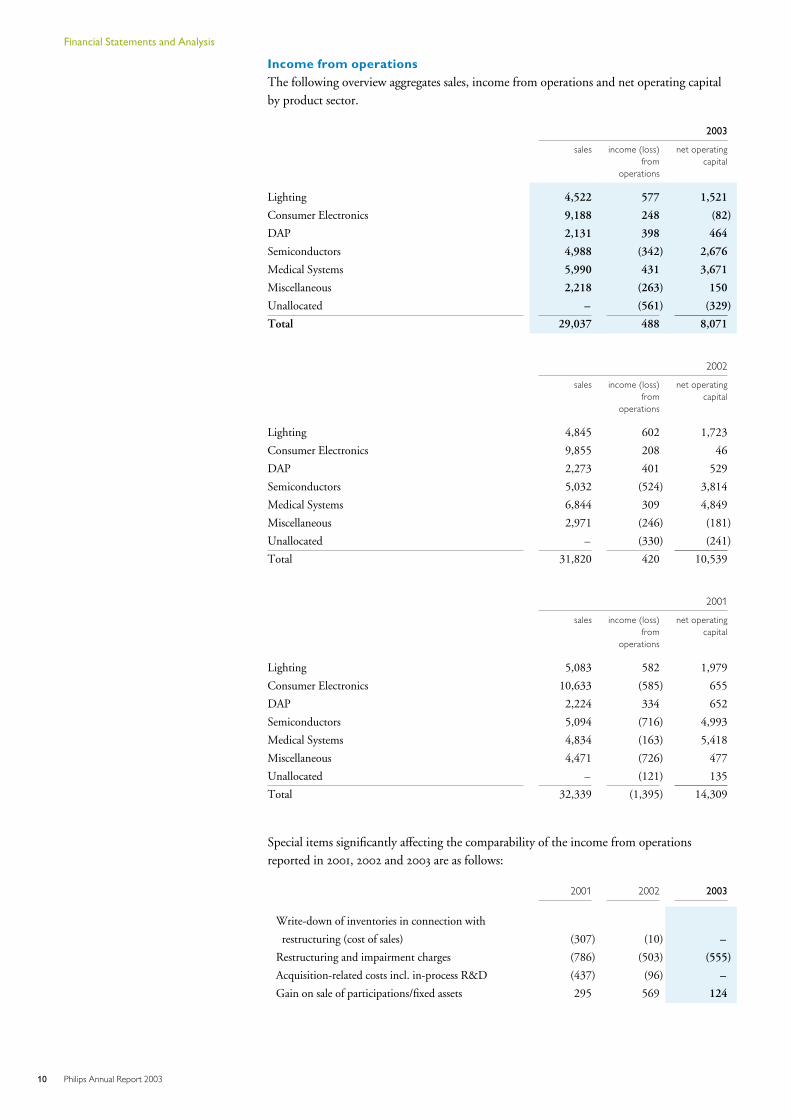
Income from operationsThe following overview aggregates sales, income from operations and net operating capitalby product sector.
2003
sales income (loss)from
operations
net operatingcapital
Lighting 4,522 577 1,521
Consumer Electronics 9,188 248 (82)
DAP 2,131 398 464
Semiconductors 4,988 (342) 2,676
Medical Systems 5,990 431 3,671
Miscellaneous 2,218 (263) 150
Unallocated – (561) (329)
Total 29,037 488 8,071
2002
sales income (loss)from
operations
net operatingcapital
Lighting 4,845 602 1,723
Consumer Electronics 9,855 208 46
DAP 2,273 401 529
Semiconductors 5,032 (524) 3,814
Medical Systems 6,844 309 4,849
Miscellaneous 2,971 (246) (181)
Unallocated – (330) (241)
Total 31,820 420 10,539
2001
sales income (loss)from
operations
net operatingcapital
Lighting 5,083 582 1,979
Consumer Electronics 10,633 (585) 655
DAP 2,224 334 652
Semiconductors 5,094 (716) 4,993
Medical Systems 4,834 (163) 5,418
Miscellaneous 4,471 (726) 477
Unallocated – (121) 135
Total 32,339 (1,395) 14,309
Special items significantly affecting the comparability of the income from operationsreported in 2001, 2002 and 2003 are as follows:
2001 2002 2003
Write-down of inventories in connection with
restructuring (cost of sales) (307) (10) –
Restructuring and impairment charges (786) (503) (555)
Acquisition-related costs incl. in-process R&D (437) (96) –
Gain on sale of participations/fixed assets 295 569 124
10 Philips Annual Report 2003
Financial Statements and Analysis
Income from operations totaled 488 million in 2003, an increase of 68 millioncompared to the previous year. Cost savings resulted in a significant increase in incomefrom operations. The improvement was partly offset by an increase in pension costsamounting to 312 million and special charges of 431 million, while in 2002 netcharges totaled 40 million.Over the last two years overhead cost reductions yielded savings of 425 million todate, while Medical Systems delivered savings of 342 million. Including savings inR&D and other projects, the overall cost reduction program surpassed the target of 1
billion savings by the end of 2003.
Medical Systems improved its income from operations by 122 million compared tothe previous year as cost and revenue synergies started to take effect. The divisionrecorded a goodwill impairment charge of 139 million for MedQuist in 2003.Despite difficult market conditions, Lighting and DAP were able to mirror the previousyear’s outstanding results. Product innovation, improved customer service and supplychain performance together with the continuing focus on cost management, drove themargin improvements.Semiconductors increased profitability during the year as a result of higher sales, lowerR&D expenditures and the benefits of the wafer-fab restructurings. Semiconductorsreduced capacity in order to be better aligned with market demand, which resulted inrestructuring and impairment charges of 290 million, compared to charges of 167 million the previous year. Benefits of the restructuring became visible in thefourth quarter, with the division posting a 166 million profit.Consumer Electronics’ income from operations increased by 40 million as a result ofhigher license income. The division suffered from increased competition and acceleratedproduct life cycles, but margins increased throughout the year, led by strong sales oftelevisions. The fourth quarter was clearly better than the previous year. During 2003
Consumer Electronics launched a renewal plan to further improve profitability.
The Company slowed down its divestment program in 2003 in response to difficultmarket conditions. Vocon/Telephony and the remaining part of Philips ContractManufacturing Systems were the only businesses that were divested in 2003, whichresulted in a gain of 35 million. Sale of real estate resulted in a gain of 88 million.
In 2002, the Company realized net gains of 569 million from the sale of certainbusinesses and fixed assets. However, the impact on income from operations was offset byrestructuring, impairment and acquisition-related charges of 609 million. In 2002 thedivestment program resulted in a gain of 311 million related to a number of disposals.The gain related to the sale of real estate in 2002 amounted to 65 million.
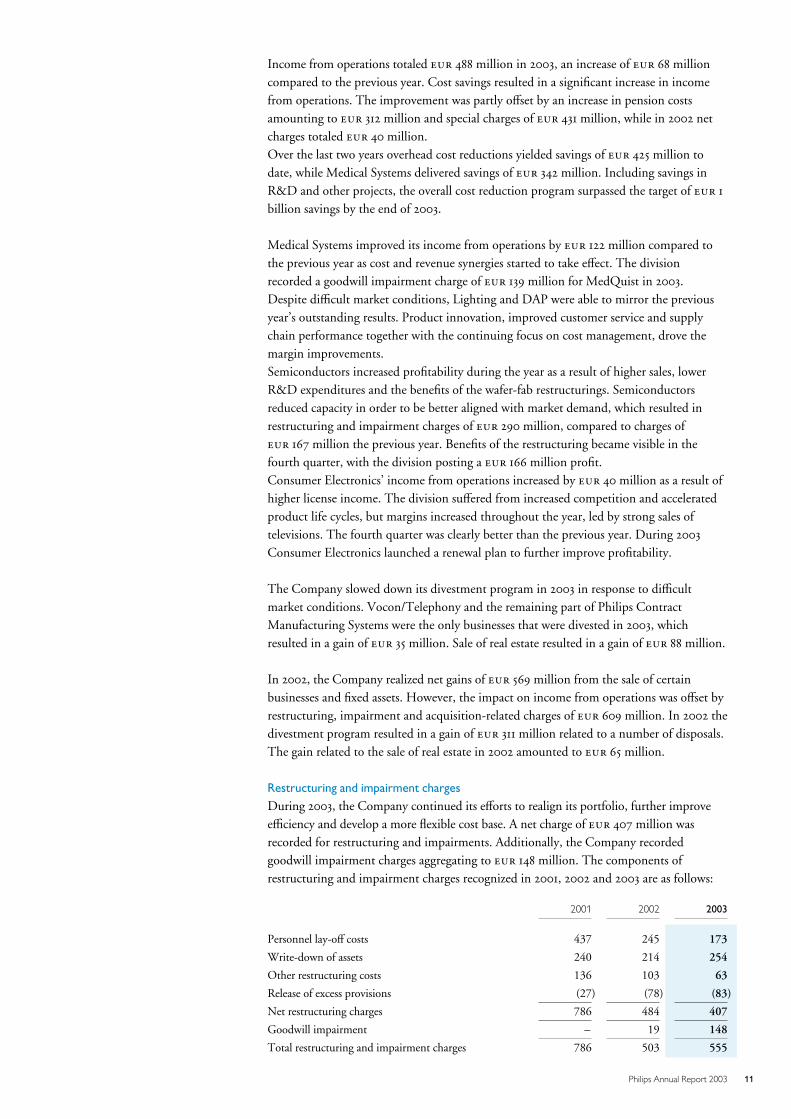
Restructuring and impairment charges
During 2003, the Company continued its efforts to realign its portfolio, further improveefficiency and develop a more flexible cost base. A net charge of 407 million wasrecorded for restructuring and impairments. Additionally, the Company recordedgoodwill impairment charges aggregating to 148 million. The components ofrestructuring and impairment charges recognized in 2001, 2002 and 2003 are as follows:
2001 2002 2003
Personnel lay-off costs 437 245 173
Write-down of assets 240 214 254
Other restructuring costs 136 103 63
Release of excess provisions (27) (78) (83)
Net restructuring charges 786 484 407
Goodwill impairment – 19 148
Total restructuring and impairment charges 786 503 555
11Philips Annual Report 2003
For a presentation of the December 31 balances and rollforwards of the activity during theyear with respect to the restructuring projects listed hereafter, refer to note 2 of theconsolidated financial statements.
The most significant new projects in 2003 were:
G In Semiconductors the market situation remained soft during the first half of 2003. Thisrequired a further reduction of excess capacity in the USA and of overhead and R&D costsin the Netherlands and France. Related restructuring costs recognized in the 2003 incomestatement amounted to 309 million and consisted of:
Lay-off costs 50 million related to 1,100 peopleAsset write-downs 209 millionOther costs 50 million (contract obligations)
Annual savings for the Philips Group are expected to total approximately 185 million.At year-end 2003 the outstanding accrual amounted to 44 million.
G In Consumer Electronics, the European television supply base was adapted to meet futuremarket demand, while the Monitor activities in Hungary and Taiwan were relocated toChina. Moreover overhead costs in the USA and Asia were further reduced. The charge forthese restructurings to the income statement amounted to 72 million and consistedof:
Lay-off costs 58 million related to 1,500 peopleAsset write-downs 10 millionOther costs 4 million
Annual savings for the Philips Group are expected to total approximately 50 million.At year-end 2003, the outstanding accrual amounted to 30 million.
G Within Lighting, further rationalization took place in Lamps and Luminaires through thedownsizing of capacity and through activity transfers to low-wage countries. Costs relatedto these actions recognized in the 2003 income statement amounted to 29 million andconsisted of:
Lay-off costs 20 million related to 1,000 peopleAsset write-downs 5 millionOther costs 4 million (contract obligations)
Annual savings for the Philips Group are expected to total approximately 25 million.At year-end 2003, the outstanding accrual amounted to 9 million.
G Within Miscellaneous, the Philips Business Communication activities were restructuredto change the business model from OEM (Original Equipment Manufacturer) to VAR(Value Added Reseller) in order to reduce the required R&D investment and to adjust itto the lower sales level. Additionally, the activities of Research in Redhill, UnitedKingdom, were further downsized. Also, an impairment charge for a building wasincurred. Total charges to the income statement for these and a number of smallerprojects came to 62 million and consisted of:
Lay-off costs 31 million related to 800 peopleAsset write-downs 30 millionOther costs 1 million (contract obligations)
12 Philips Annual Report 2003
Financial Statements and Analysis
Annual savings for the Philips Group are expected to total approximately 35 million.At year-end, the outstanding accrual amounted to 23 million.
G The remaining restructuring projects in 2003 for the Philips Group amounted to 18
million and covered a number of smaller projects.Restructuring projects started in 2003 will lead to a headcount reduction of approximately4,900 persons (total lay-offs in 2002 approximately 6,700 persons, and in 2001
approximately 10,800 persons).
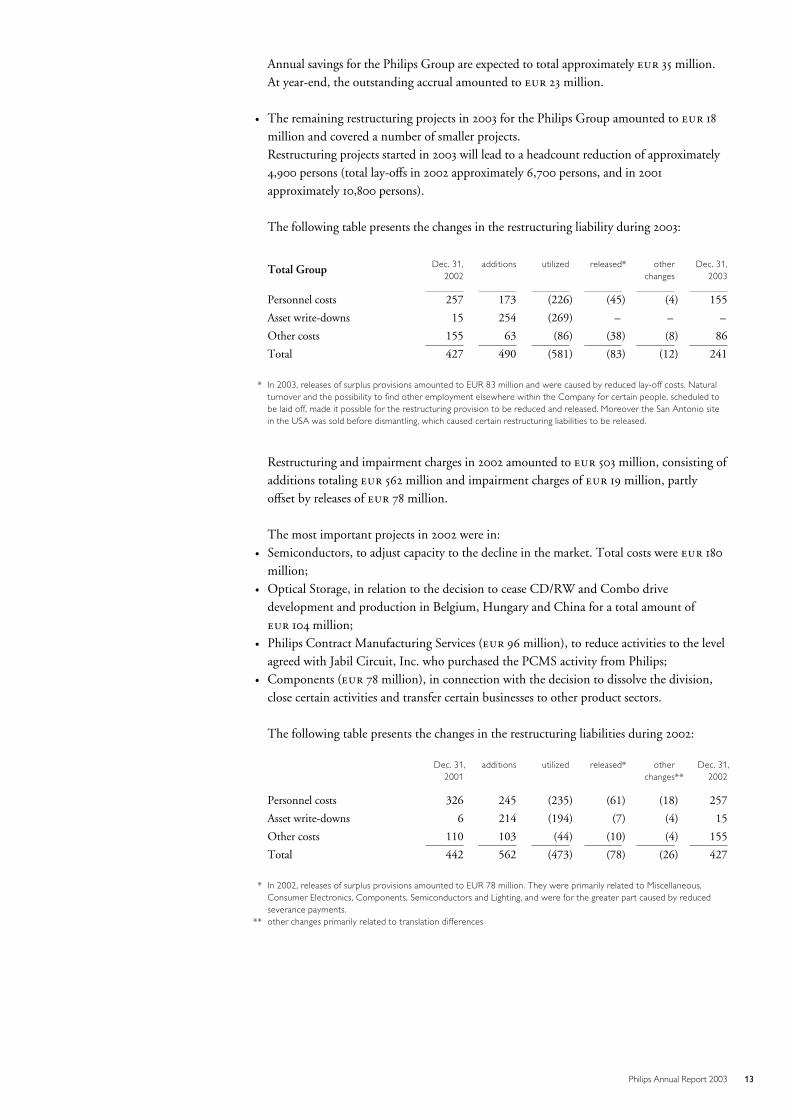
The following table presents the changes in the restructuring liability during 2003:
Total Group Dec. 31,2002
additions utilized released* otherchanges
Dec. 31,2003
Personnel costs 257 173 (226) (45) (4) 155
Asset write-downs 15 254 (269) – – –
Other costs 155 63 (86) (38) (8) 86
Total 427 490 (581) (83) (12) 241
* In 2003, releases of surplus provisions amounted to EUR 83 million and were caused by reduced lay-off costs. Naturalturnover and the possibility to find other employment elsewhere within the Company for certain people, scheduled tobe laid off, made it possible for the restructuring provision to be reduced and released. Moreover the San Antonio sitein the USA was sold before dismantling, which caused certain restructuring liabilities to be released.
Restructuring and impairment charges in 2002 amounted to 503 million, consisting ofadditions totaling 562 million and impairment charges of 19 million, partlyoffset by releases of 78 million.
The most important projects in 2002 were in:G Semiconductors, to adjust capacity to the decline in the market. Total costs were 180
million;G Optical Storage, in relation to the decision to cease CD/RW and Combo drive
development and production in Belgium, Hungary and China for a total amount of 104 million;
G Philips Contract Manufacturing Services ( 96 million), to reduce activities to the levelagreed with Jabil Circuit, Inc. who purchased the PCMS activity from Philips;
G Components ( 78 million), in connection with the decision to dissolve the division,close certain activities and transfer certain businesses to other product sectors.
The following table presents the changes in the restructuring liabilities during 2002:
Dec. 31, additions utilized released* other Dec. 31,2001 changes** 2002
Personnel costs 326 245 (235) (61) (18) 257
Asset write-downs 6 214 (194) (7) (4) 15
Other costs 110 103 (44) (10) (4) 155
Total 442 562 (473) (78) (26) 427
* In 2002, releases of surplus provisions amounted to EUR 78 million. They were primarily related to Miscellaneous,Consumer Electronics, Components, Semiconductors and Lighting, and were for the greater part caused by reducedseverance payments.
** other changes primarily related to translation differences
13Philips Annual Report 2003
Restructuring and impairment charges in 2001 amounted to 786 million. The mostsignificant projects were the outsourcing of mobile phone development andmanufacturing for 318 million and reduction of fab capacity to a lower marketdemand in Semiconductors ( 204 million) and Components ( 167 million).
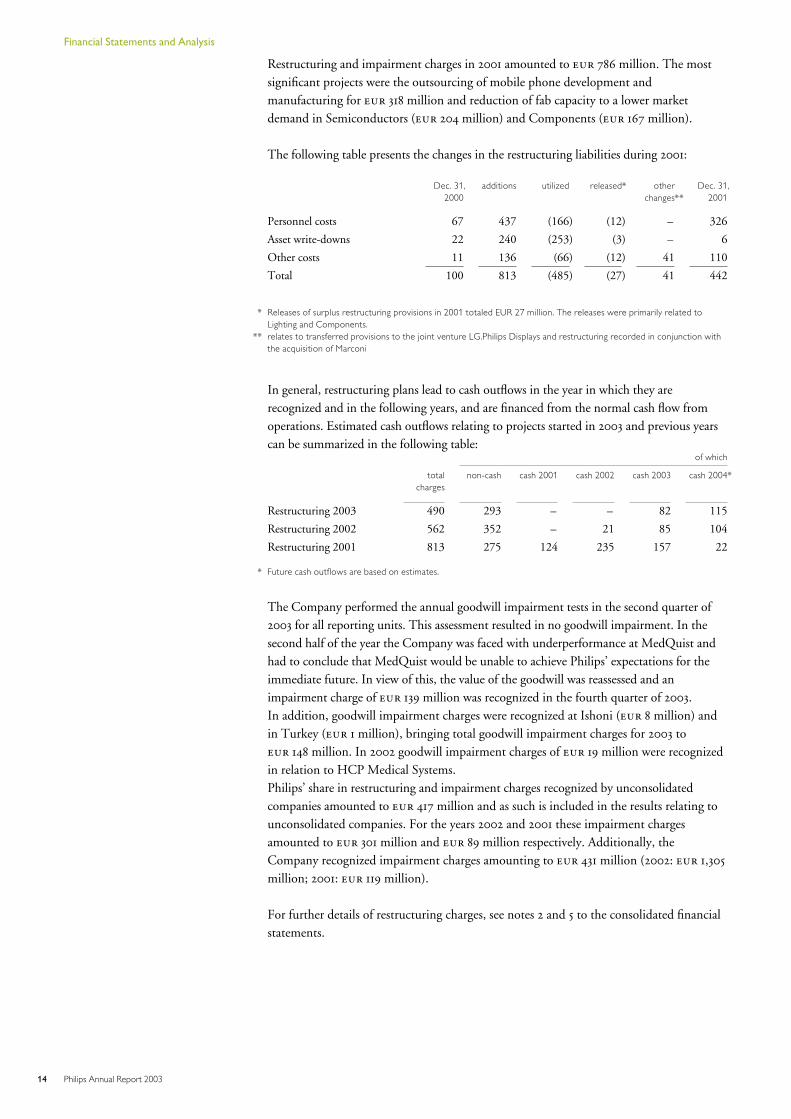
The following table presents the changes in the restructuring liabilities during 2001:
Dec. 31, additions utilized released* other Dec. 31,2000 changes** 2001
Personnel costs 67 437 (166) (12) – 326
Asset write-downs 22 240 (253) (3) – 6
Other costs 11 136 (66) (12) 41 110
Total 100 813 (485) (27) 41 442
* Releases of surplus restructuring provisions in 2001 totaled EUR 27 million. The releases were primarily related toLighting and Components.
** relates to transferred provisions to the joint venture LG.Philips Displays and restructuring recorded in conjunction withthe acquisition of Marconi
In general, restructuring plans lead to cash outflows in the year in which they arerecognized and in the following years, and are financed from the normal cash flow fromoperations. Estimated cash outflows relating to projects started in 2003 and previous yearscan be summarized in the following table:
of which
totalcharges
non-cash cash 2001 cash 2002 cash 2003 cash 2004*
Restructuring 2003 490 293 – – 82 115
Restructuring 2002 562 352 – 21 85 104
Restructuring 2001 813 275 124 235 157 22
* Future cash outflows are based on estimates.
The Company performed the annual goodwill impairment tests in the second quarter of2003 for all reporting units. This assessment resulted in no goodwill impairment. In thesecond half of the year the Company was faced with underperformance at MedQuist andhad to conclude that MedQuist would be unable to achieve Philips’ expectations for theimmediate future. In view of this, the value of the goodwill was reassessed and animpairment charge of 139 million was recognized in the fourth quarter of 2003.In addition, goodwill impairment charges were recognized at Ishoni ( 8 million) andin Turkey ( 1 million), bringing total goodwill impairment charges for 2003 to 148 million. In 2002 goodwill impairment charges of 19 million were recognizedin relation to HCP Medical Systems.Philips’ share in restructuring and impairment charges recognized by unconsolidatedcompanies amounted to 417 million and as such is included in the results relating tounconsolidated companies. For the years 2002 and 2001 these impairment chargesamounted to 301 million and 89 million respectively. Additionally, theCompany recognized impairment charges amounting to 431 million (2002: 1,305
million; 2001: 119 million).
For further details of restructuring charges, see notes 2 and 5 to the consolidated financialstatements.
14 Philips Annual Report 2003
Financial Statements and Analysis
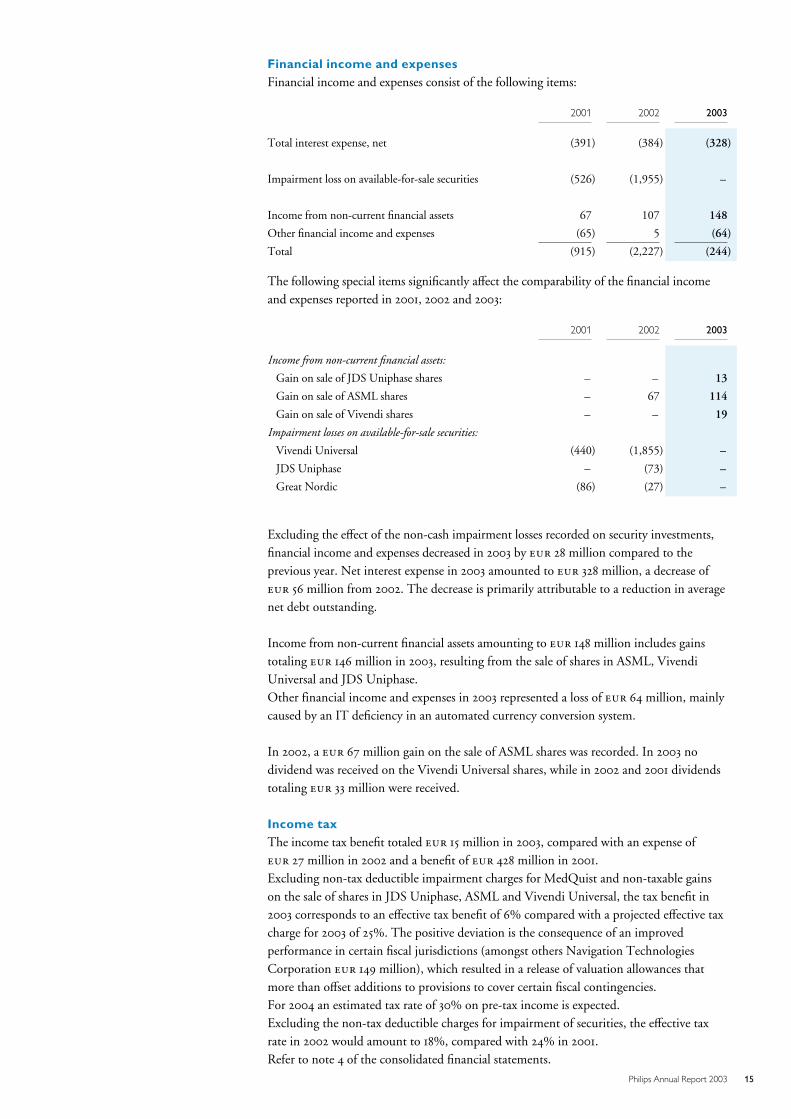
Financial income and expensesFinancial income and expenses consist of the following items:
2001 2002 2003
Total interest expense, net (391) (384) (328)
Impairment loss on available-for-sale securities (526) (1,955) –
Income from non-current financial assets 67 107 148
Other financial income and expenses (65) 5 (64)
Total (915) (2,227) (244)
The following special items significantly affect the comparability of the financial incomeand expenses reported in 2001, 2002 and 2003:
2001 2002 2003
Income from non-current financial assets:
Gain on sale of JDS Uniphase shares – – 13
Gain on sale of ASML shares – 67 114
Gain on sale of Vivendi shares – – 19
Impairment losses on available-for-sale securities:
Vivendi Universal (440) (1,855) –
JDS Uniphase – (73) –
Great Nordic (86) (27) –
Excluding the effect of the non-cash impairment losses recorded on security investments,financial income and expenses decreased in 2003 by 28 million compared to theprevious year. Net interest expense in 2003 amounted to 328 million, a decrease of 56 million from 2002. The decrease is primarily attributable to a reduction in averagenet debt outstanding.
Income from non-current financial assets amounting to 148 million includes gainstotaling 146 million in 2003, resulting from the sale of shares in ASML, VivendiUniversal and JDS Uniphase.Other financial income and expenses in 2003 represented a loss of 64 million, mainlycaused by an IT deficiency in an automated currency conversion system.
In 2002, a 67 million gain on the sale of ASML shares was recorded. In 2003 nodividend was received on the Vivendi Universal shares, while in 2002 and 2001 dividendstotaling 33 million were received.
Income taxThe income tax benefit totaled 15 million in 2003, compared with an expense of 27 million in 2002 and a benefit of 428 million in 2001.Excluding non-tax deductible impairment charges for MedQuist and non-taxable gainson the sale of shares in JDS Uniphase, ASML and Vivendi Universal, the tax benefit in2003 corresponds to an effective tax benefit of 6% compared with a projected effective taxcharge for 2003 of 25%. The positive deviation is the consequence of an improvedperformance in certain fiscal jurisdictions (amongst others Navigation TechnologiesCorporation 149 million), which resulted in a release of valuation allowances thatmore than offset additions to provisions to cover certain fiscal contingencies.For 2004 an estimated tax rate of 30% on pre-tax income is expected.Excluding the non-tax deductible charges for impairment of securities, the effective taxrate in 2002 would amount to 18%, compared with 24% in 2001.Refer to note 4 of the consolidated financial statements.
15Philips Annual Report 2003
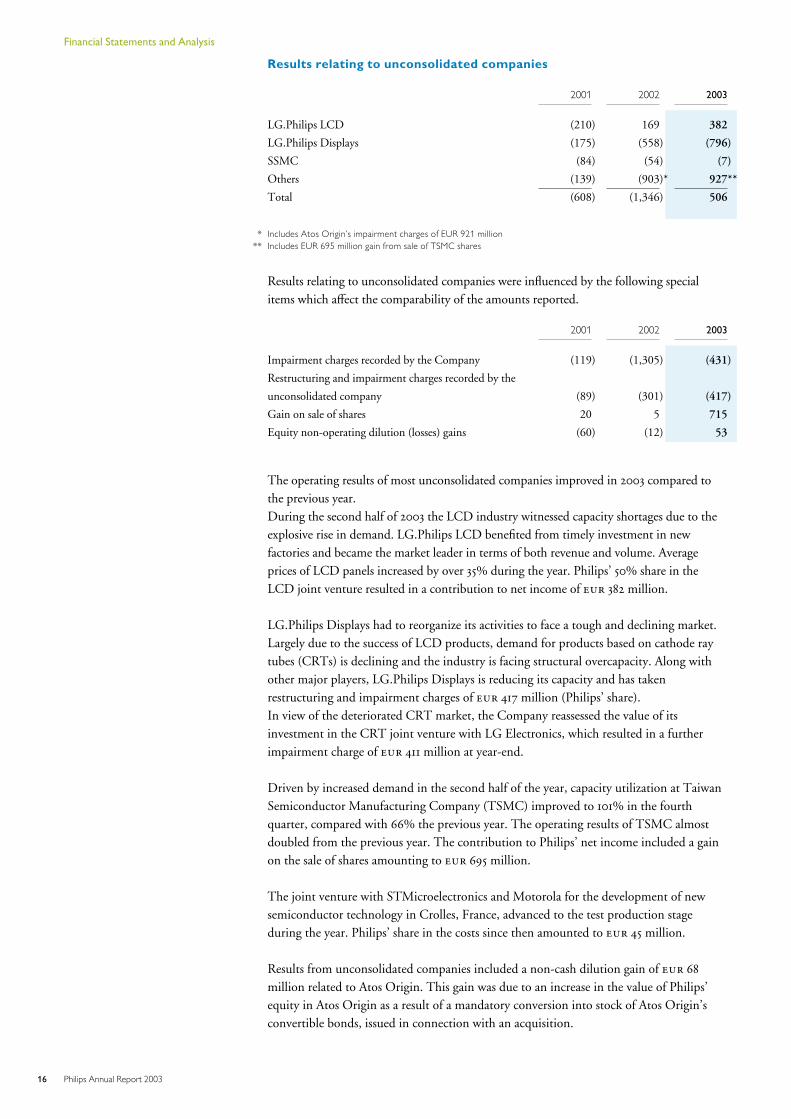
Results relating to unconsolidated companies
2001 2002 2003
LG.Philips LCD (210) 169 382
LG.Philips Displays (175) (558) (796)
SSMC (84) (54) (7)
Others (139) (903)* 927**
Total (608) (1,346) 506
* Includes Atos Origin’s impairment charges of EUR 921 million** Includes EUR 695 million gain from sale of TSMC shares
Results relating to unconsolidated companies were influenced by the following specialitems which affect the comparability of the amounts reported.
2001 2002 2003
Impairment charges recorded by the Company (119) (1,305) (431)
Restructuring and impairment charges recorded by the
unconsolidated company (89) (301) (417)
Gain on sale of shares 20 5 715
Equity non-operating dilution (losses) gains (60) (12) 53
The operating results of most unconsolidated companies improved in 2003 compared tothe previous year.During the second half of 2003 the LCD industry witnessed capacity shortages due to theexplosive rise in demand. LG.Philips LCD benefited from timely investment in newfactories and became the market leader in terms of both revenue and volume. Averageprices of LCD panels increased by over 35% during the year. Philips’ 50% share in theLCD joint venture resulted in a contribution to net income of 382 million.
LG.Philips Displays had to reorganize its activities to face a tough and declining market.Largely due to the success of LCD products, demand for products based on cathode raytubes (CRTs) is declining and the industry is facing structural overcapacity. Along withother major players, LG.Philips Displays is reducing its capacity and has takenrestructuring and impairment charges of 417 million (Philips’ share).In view of the deteriorated CRT market, the Company reassessed the value of itsinvestment in the CRT joint venture with LG Electronics, which resulted in a furtherimpairment charge of 411 million at year-end.
Driven by increased demand in the second half of the year, capacity utilization at TaiwanSemiconductor Manufacturing Company (TSMC) improved to 101% in the fourthquarter, compared with 66% the previous year. The operating results of TSMC almostdoubled from the previous year. The contribution to Philips’ net income included a gainon the sale of shares amounting to 695 million.
The joint venture with STMicroelectronics and Motorola for the development of newsemiconductor technology in Crolles, France, advanced to the test production stageduring the year. Philips’ share in the costs since then amounted to 45 million.
Results from unconsolidated companies included a non-cash dilution gain of 68
million related to Atos Origin. This gain was due to an increase in the value of Philips’equity in Atos Origin as a result of a mandatory conversion into stock of Atos Origin’sconvertible bonds, issued in connection with an acquisition.
16 Philips Annual Report 2003
Financial Statements and Analysis
In January 2003, the Company acquired 49.5% of InterTrust, which develops and licensesintellectual property relating to Digital Rights Management (DRM) and trustedcomputing. InterTrust performed in line with expectations.
In general, operational results at unconsolidated companies in 2002 improved comparedto 2001.
The operational performance of LG.Philips LCD improved due to a strong overall LCDmarket with significantly better price levels, particularly in the first half of 2002, andmuch higher volumes.
LG.Philips Displays’ income was negatively impacted by restructuring and assetimpairment charges of 301 million. These restructurings were carried out to transferoperations to lower cost regions.
The present value of the future net cash flows of LG.Philips Displays was not sufficient tocover the carrying value of Philips’ investment in the joint venture. An impairment chargeof 275 million was recognized in this respect.
Taiwan Semiconductor Manufacturing Company (TSMC) maintained profitabilitydespite suffering from declining markets in the second half of the year.
The investment in Atos Origin was written down by 921 million as a consequence ofan other-than-temporary decline of the Atos Origin share price. The results relating tounconsolidated companies included amortization of goodwill of 24 million that wasrelated to Atos Origin’s fourth quarter of 2001 due to the fact that its results are reportedon a three-month delay basis.
Minority interestsIn 2003, the share of minority interests in the income of group companies amounted to 56 million, compared with a share in the income of 26 million in 2002 and ashare in losses of 15 million in 2001. Minority interests in the income of the groupcompanies included 24 million in respect of improved results at NavTech, whichwere partly attributable to a tax benefit.
Net incomeIncome before the cumulative effect of a change in accounting principles amounted to aprofit of 709 million ( 0.55 per common share – basic), compared to a loss of 3,206 million in 2002 ( 2.51 per common share – basic) and income of 2,475
million ( 1.94 per common share – basic) in 2001.
There were no extraordinary items in the year under review or the previous two years.
Net income in 2003 amounted to a profit of 695 million ( 0.54 per commonshare – basic), compared to a loss of 3,206 million in 2002 ( 2.51 per commonshare – basic) and a loss of 2,475 million ( 1.94 per common share – basic) in2001.
17Philips Annual Report 2003
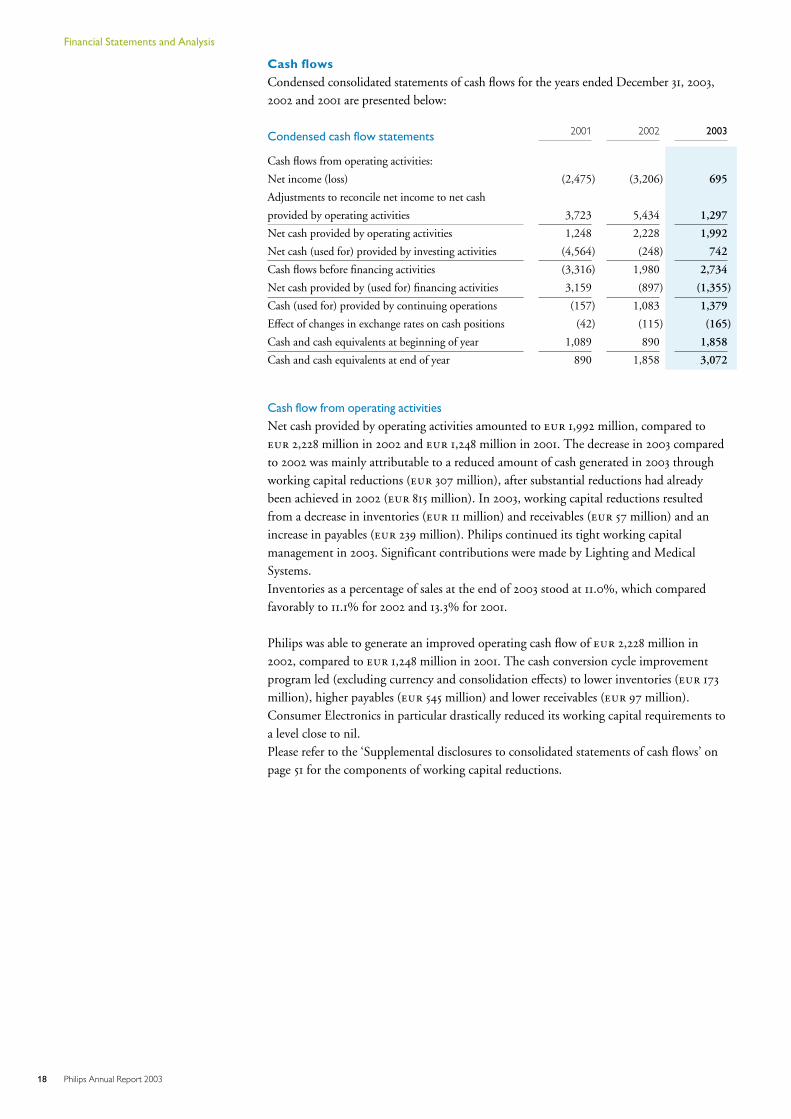
Cash flowsCondensed consolidated statements of cash flows for the years ended December 31, 2003,2002 and 2001 are presented below:
Condensed cash flow statements 2001 2002 2003
Cash flows from operating activities:
Net income (loss) (2,475) (3,206) 695
Adjustments to reconcile net income to net cash
provided by operating activities 3,723 5,434 1,297
Net cash provided by operating activities 1,248 2,228 1,992
Net cash (used for) provided by investing activities (4,564) (248) 742
Cash flows before financing activities (3,316) 1,980 2,734
Net cash provided by (used for) financing activities 3,159 (897) (1,355)
Cash (used for) provided by continuing operations (157) 1,083 1,379
Effect of changes in exchange rates on cash positions (42) (115) (165)
Cash and cash equivalents at beginning of year 1,089 890 1,858
Cash and cash equivalents at end of year 890 1,858 3,072
Cash flow from operating activities
Net cash provided by operating activities amounted to 1,992 million, compared to 2,228 million in 2002 and 1,248 million in 2001. The decrease in 2003 comparedto 2002 was mainly attributable to a reduced amount of cash generated in 2003 throughworking capital reductions ( 307 million), after substantial reductions had alreadybeen achieved in 2002 ( 815 million). In 2003, working capital reductions resultedfrom a decrease in inventories ( 11 million) and receivables ( 57 million) and anincrease in payables ( 239 million). Philips continued its tight working capitalmanagement in 2003. Significant contributions were made by Lighting and MedicalSystems.Inventories as a percentage of sales at the end of 2003 stood at 11.0%, which comparedfavorably to 11.1% for 2002 and 13.3% for 2001.
Philips was able to generate an improved operating cash flow of 2,228 million in2002, compared to 1,248 million in 2001. The cash conversion cycle improvementprogram led (excluding currency and consolidation effects) to lower inventories ( 173
million), higher payables ( 545 million) and lower receivables ( 97 million).Consumer Electronics in particular drastically reduced its working capital requirements toa level close to nil.Please refer to the ‘Supplemental disclosures to consolidated statements of cash flows’ onpage 51 for the components of working capital reductions.
18 Philips Annual Report 2003
Financial Statements and Analysis
Cash flow from investing activities
In 2003, net cash provided by investing activities amounted to 742 million. In 2002
and 2001, net cash required by investing activities amounted to 248 million and 4,564 million respectively. The improvement in 2003 compared to 2002 is mainlyattributable to increased proceeds from the sale of interests in businesses and higherproceeds from other non-current financial assets. In 2003, the Company received 908
million from the sale of 100 million American Depository Shares (ADS), eachrepresenting five common shares of TSMC and 357 million from the redemption ofpreference shares by TSMC. Additionally, proceeds from the sale of shares of VivendiUniversal, ASML and JDS Uniphase amounting to 272 million were received.Furthermore, 391 million was received due to the resetting of currency swaps.In 2003, gross capital expenditures were held to a low level, similar to 2002. The ratio ofgross investments to depreciation was 0.6 for 2003, which approximates to the level of 0.7in 2002 and is significantly lower than the ratio of 1.1 for 2001. For the longer term it isexpected that gross investments will be approximately equal to depreciation.During 2003, 470 million was used for investments in business interests, the mostsignificant of which were a 49.5% investment in InterTrust ( 202 million), anexpansion of the investment in Crolles 2 ( 99 million) and a loan to the Company’sLumileds joint venture ( 54 million).
During the year 2002, 626 million was used for the purchase of businesses andinvestments in unconsolidated companies. An amount of 250 million was used for asettlement associated with the establishment of the joint venture LG.Philips Displays,including a subsequent cash injection. Additionally, a final payment of 90 millionwas made to Agilent in respect of the 2001 acquisition of HSG. A capital injection of 69 million in Systems on Silicon Manufacturing Company (SSMC) was made andalso a number of smaller investments were made. These outflows were offset by proceedsfrom the sale of various businesses in 2002 totaling 813 million, primarily the sale ofPhilips Contract Manufacturing Services (PCMS), X-ray Analytical, Communications,Security and Imaging (CSI), the HCP group of Medical Systems, Philips BroadbandNetworks and TechnoFusion. Furthermore, the final instalment of 63 million on the2001 sale of Philips Broadcast was collected. In addition, 422 million was receivedfrom the resetting of currency swap transactions, while proceeds from the sale of shares (ofwhich ASML shares of 72 million) amounted to 98 million.
19Philips Annual Report 2003
During the year 2001, Philips invested 3,636 million in businesses operating instrategic areas to further strengthen its global market position. The investments includedthe purchase of the assets of the Healthcare Solutions Group of Agilent ( 1,943
million) and the acquisition of the medical systems activities of Marconi for 1,245
million. In 2001, LG Electronics redeemed its 7.5% redeemable preferred shares. Thisredemption resulted in a cash inflow of 486 million. In addition, 200 millionwas generated by the sale of a portion of the shares in FEI and the repayment by FEI ofloans from Philips. Furthermore, 295 million was generated by the sale of the Glassbusiness to LG.Philips Displays.
As a result of the items mentioned above, cash flows before financing activities were apositive 2,734 million in 2003, compared with a positive 1,980 million in 2002
and a negative 3,316 million in 2001.
Cash flow from financing activities
In 2003 net cash flow used for financing activities amounted to 1,355 million. Thisincluded a 944 million change of debt, primarily due to a one-year early redemptionof a 1 billion floating rate note and a 139 million repayment of maturing bonds.In 2003 Philips entered into a 151 million 7-year floating unsecured bullet loan fromthe EIB (European Investment Bank) and a 100 million syndicated loan in thePhilippines. Philips shareholders were paid a distribution in cash totaling 460
million. Sales of treasury stock led to a cash inflow of 49 million.
In 2002 net cash used for financing activities amounted to 897 million. This includedthe issuance of a 300 million eurobond in August, the proceeds of which were usedfor repayment of short-term debt. Philips shareholders were paid a distribution in cashtotaling 459 million. Treasury stock was purchased for an amount of 19 million.
In 2001 net cash flows provided by financing activities amounted to 3,159 million.This includes 4,250 million from the issuance of two tranches of two bonds each and 521 million from the issuance of commercial paper. Philips shareholders receiveddividends of 458 million. Treasury stock transactions totaled an outflow of 336
million.
20 Philips Annual Report 2003
Financial Statements and Analysis
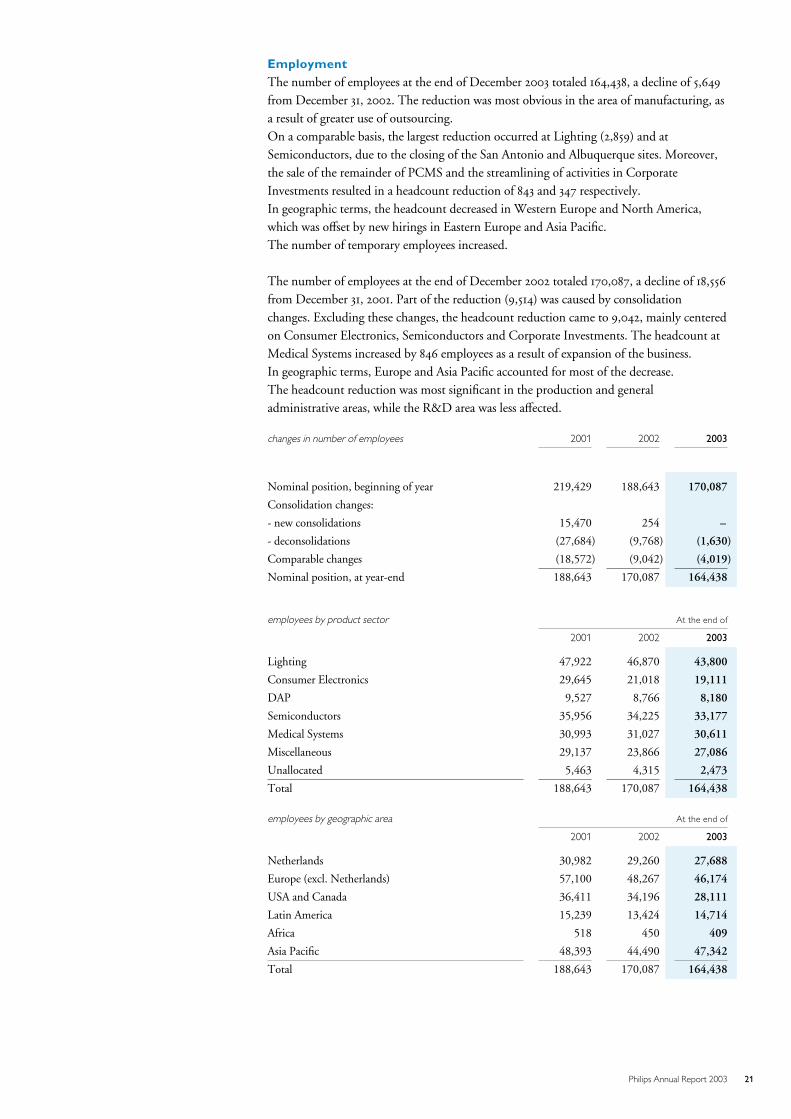
EmploymentThe number of employees at the end of December 2003 totaled 164,438, a decline of 5,649
from December 31, 2002. The reduction was most obvious in the area of manufacturing, asa result of greater use of outsourcing.On a comparable basis, the largest reduction occurred at Lighting (2,859) and atSemiconductors, due to the closing of the San Antonio and Albuquerque sites. Moreover,the sale of the remainder of PCMS and the streamlining of activities in CorporateInvestments resulted in a headcount reduction of 843 and 347 respectively.In geographic terms, the headcount decreased in Western Europe and North America,which was offset by new hirings in Eastern Europe and Asia Pacific.The number of temporary employees increased.
The number of employees at the end of December 2002 totaled 170,087, a decline of 18,556from December 31, 2001. Part of the reduction (9,514) was caused by consolidationchanges. Excluding these changes, the headcount reduction came to 9,042, mainly centeredon Consumer Electronics, Semiconductors and Corporate Investments. The headcount atMedical Systems increased by 846 employees as a result of expansion of the business.In geographic terms, Europe and Asia Pacific accounted for most of the decrease.The headcount reduction was most significant in the production and generaladministrative areas, while the R&D area was less affected.
changes in number of employees 2001 2002 2003
Nominal position, beginning of year 219,429 188,643 170,087
Consolidation changes:
- new consolidations 15,470 254 –
- deconsolidations (27,684) (9,768) (1,630)
Comparable changes (18,572) (9,042) (4,019)
Nominal position, at year-end 188,643 170,087 164,438
employees by product sector At the end of
2001 2002 2003
Lighting 47,922 46,870 43,800
Consumer Electronics 29,645 21,018 19,111
DAP 9,527 8,766 8,180
Semiconductors 35,956 34,225 33,177
Medical Systems 30,993 31,027 30,611
Miscellaneous 29,137 23,866 27,086
Unallocated 5,463 4,315 2,473
Total 188,643 170,087 164,438
employees by geographic area At the end of
2001 2002 2003
Netherlands 30,982 29,260 27,688
Europe (excl. Netherlands) 57,100 48,267 46,174
USA and Canada 36,411 34,196 28,111
Latin America 15,239 13,424 14,714
Africa 518 450 409
Asia Pacific 48,393 44,490 47,342
Total 188,643 170,087 164,438
21Philips Annual Report 2003
Performance by Sector
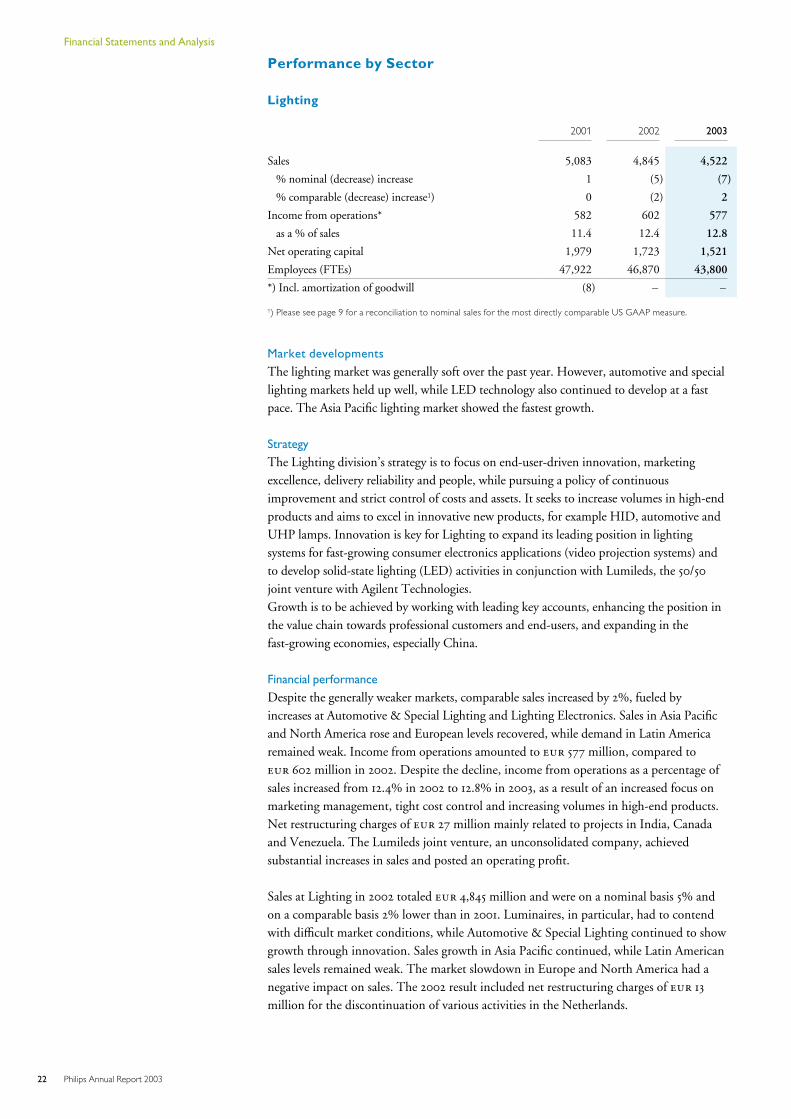
Lighting
2001 2002 2003
Sales 5,083 4,845 4,522
% nominal (decrease) increase 1 (5) (7)
% comparable (decrease) increase1) 0 (2) 2
Income from operations* 582 602 577
as a % of sales 11.4 12.4 12.8
Net operating capital 1,979 1,723 1,521
Employees (FTEs) 47,922 46,870 43,800
*) Incl. amortization of goodwill (8) – –
1) Please see page 9 for a reconciliation to nominal sales for the most directly comparable US GAAP measure.
Market developments
The lighting market was generally soft over the past year. However, automotive and speciallighting markets held up well, while LED technology also continued to develop at a fastpace. The Asia Pacific lighting market showed the fastest growth.
Strategy
The Lighting division’s strategy is to focus on end-user-driven innovation, marketingexcellence, delivery reliability and people, while pursuing a policy of continuousimprovement and strict control of costs and assets. It seeks to increase volumes in high-endproducts and aims to excel in innovative new products, for example HID, automotive andUHP lamps. Innovation is key for Lighting to expand its leading position in lightingsystems for fast-growing consumer electronics applications (video projection systems) andto develop solid-state lighting (LED) activities in conjunction with Lumileds, the 50/50joint venture with Agilent Technologies.Growth is to be achieved by working with leading key accounts, enhancing the position inthe value chain towards professional customers and end-users, and expanding in thefast-growing economies, especially China.
Financial performance
Despite the generally weaker markets, comparable sales increased by 2%, fueled byincreases at Automotive & Special Lighting and Lighting Electronics. Sales in Asia Pacificand North America rose and European levels recovered, while demand in Latin Americaremained weak. Income from operations amounted to 577 million, compared to 602 million in 2002. Despite the decline, income from operations as a percentage ofsales increased from 12.4% in 2002 to 12.8% in 2003, as a result of an increased focus onmarketing management, tight cost control and increasing volumes in high-end products.Net restructuring charges of 27 million mainly related to projects in India, Canadaand Venezuela. The Lumileds joint venture, an unconsolidated company, achievedsubstantial increases in sales and posted an operating profit.
Sales at Lighting in 2002 totaled 4,845 million and were on a nominal basis 5% andon a comparable basis 2% lower than in 2001. Luminaires, in particular, had to contendwith difficult market conditions, while Automotive & Special Lighting continued to showgrowth through innovation. Sales growth in Asia Pacific continued, while Latin Americansales levels remained weak. The market slowdown in Europe and North America had anegative impact on sales. The 2002 result included net restructuring charges of 13
million for the discontinuation of various activities in the Netherlands.
22 Philips Annual Report 2003
Financial Statements and Analysis
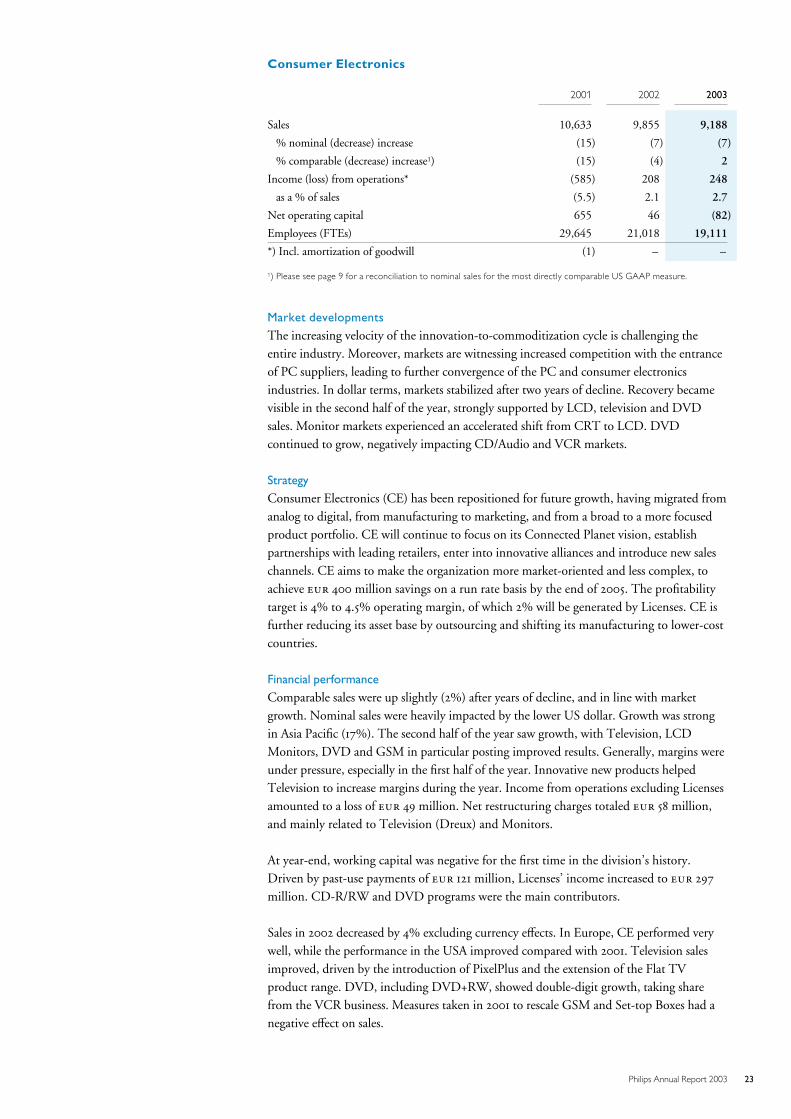
Consumer Electronics
2001 2002 2003
Sales 10,633 9,855 9,188
% nominal (decrease) increase (15) (7) (7)
% comparable (decrease) increase1) (15) (4) 2
Income (loss) from operations* (585) 208 248
as a % of sales (5.5) 2.1 2.7
Net operating capital 655 46 (82)
Employees (FTEs) 29,645 21,018 19,111
*) Incl. amortization of goodwill (1) – –
1) Please see page 9 for a reconciliation to nominal sales for the most directly comparable US GAAP measure.
Market developments
The increasing velocity of the innovation-to-commoditization cycle is challenging theentire industry. Moreover, markets are witnessing increased competition with the entranceof PC suppliers, leading to further convergence of the PC and consumer electronicsindustries. In dollar terms, markets stabilized after two years of decline. Recovery becamevisible in the second half of the year, strongly supported by LCD, television and DVDsales. Monitor markets experienced an accelerated shift from CRT to LCD. DVDcontinued to grow, negatively impacting CD/Audio and VCR markets.
Strategy
Consumer Electronics (CE) has been repositioned for future growth, having migrated fromanalog to digital, from manufacturing to marketing, and from a broad to a more focusedproduct portfolio. CE will continue to focus on its Connected Planet vision, establishpartnerships with leading retailers, enter into innovative alliances and introduce new saleschannels. CE aims to make the organization more market-oriented and less complex, toachieve 400 million savings on a run rate basis by the end of 2005. The profitabilitytarget is 4% to 4.5% operating margin, of which 2% will be generated by Licenses. CE isfurther reducing its asset base by outsourcing and shifting its manufacturing to lower-costcountries.
Financial performance
Comparable sales were up slightly (2%) after years of decline, and in line with marketgrowth. Nominal sales were heavily impacted by the lower US dollar. Growth was strongin Asia Pacific (17%). The second half of the year saw growth, with Television, LCDMonitors, DVD and GSM in particular posting improved results. Generally, margins wereunder pressure, especially in the first half of the year. Innovative new products helpedTelevision to increase margins during the year. Income from operations excluding Licensesamounted to a loss of 49 million. Net restructuring charges totaled 58 million,and mainly related to Television (Dreux) and Monitors.
At year-end, working capital was negative for the first time in the division’s history.Driven by past-use payments of 121 million, Licenses’ income increased to 297
million. CD-R/RW and DVD programs were the main contributors.
Sales in 2002 decreased by 4% excluding currency effects. In Europe, CE performed verywell, while the performance in the USA improved compared with 2001. Television salesimproved, driven by the introduction of PixelPlus and the extension of the Flat TVproduct range. DVD, including DVD+RW, showed double-digit growth, taking sharefrom the VCR business. Measures taken in 2001 to rescale GSM and Set-top Boxes had anegative effect on sales.
23Philips Annual Report 2003
Most of the improvement in income from operations came from Television, VCR andSet-top Boxes. Net restructuring charges, mainly relating to PCMS, amounted to 100 million. The sale of the PCMS activities resulted in a gain of 83 million.Licenses’ income in 2002 decreased to 188 million, a decline of 163 millioncompared to 2001. The 2001 figures included an amount of 82 million in respect ofpast-use payments. The decline was also attributable to the expiration of basic CD patentsin certain regions, which was only partly offset by increased income from the DVD andCD-R/RW licensing program.CE reduced its asset base through optimized supply chain management, an ODM(Original Design Manufacturing) business model philosophy and outsourcing. In 2002
this resulted in a net operating capital of virtually zero.
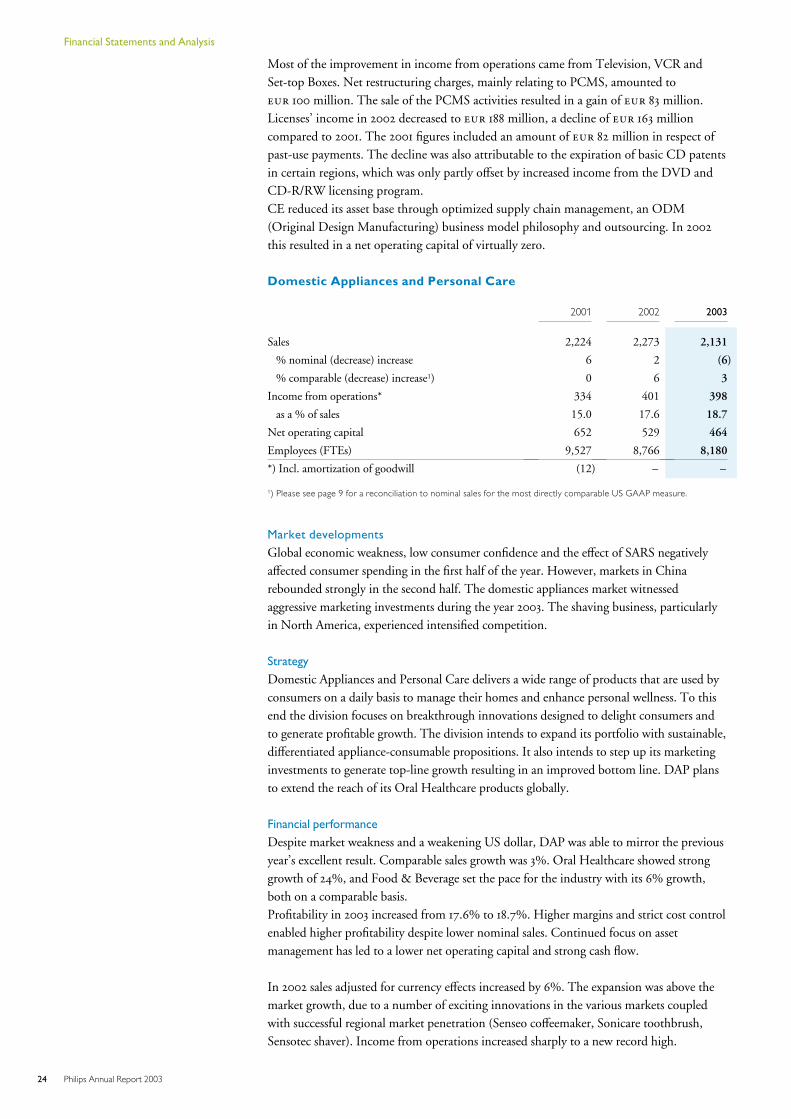
Domestic Appliances and Personal Care
2001 2002 2003
Sales 2,224 2,273 2,131
% nominal (decrease) increase 6 2 (6)
% comparable (decrease) increase1) 0 6 3
Income from operations* 334 401 398
as a % of sales 15.0 17.6 18.7
Net operating capital 652 529 464
Employees (FTEs) 9,527 8,766 8,180
*) Incl. amortization of goodwill (12) – –
1) Please see page 9 for a reconciliation to nominal sales for the most directly comparable US GAAP measure.
Market developments
Global economic weakness, low consumer confidence and the effect of SARS negativelyaffected consumer spending in the first half of the year. However, markets in Chinarebounded strongly in the second half. The domestic appliances market witnessedaggressive marketing investments during the year 2003. The shaving business, particularlyin North America, experienced intensified competition.
Strategy
Domestic Appliances and Personal Care delivers a wide range of products that are used byconsumers on a daily basis to manage their homes and enhance personal wellness. To thisend the division focuses on breakthrough innovations designed to delight consumers andto generate profitable growth. The division intends to expand its portfolio with sustainable,differentiated appliance-consumable propositions. It also intends to step up its marketinginvestments to generate top-line growth resulting in an improved bottom line. DAP plansto extend the reach of its Oral Healthcare products globally.
Financial performance
Despite market weakness and a weakening US dollar, DAP was able to mirror the previousyear’s excellent result. Comparable sales growth was 3%. Oral Healthcare showed stronggrowth of 24%, and Food & Beverage set the pace for the industry with its 6% growth,both on a comparable basis.Profitability in 2003 increased from 17.6% to 18.7%. Higher margins and strict cost controlenabled higher profitability despite lower nominal sales. Continued focus on assetmanagement has led to a lower net operating capital and strong cash flow.
In 2002 sales adjusted for currency effects increased by 6%. The expansion was above themarket growth, due to a number of exciting innovations in the various markets coupledwith successful regional market penetration (Senseo coffeemaker, Sonicare toothbrush,Sensotec shaver). Income from operations increased sharply to a new record high.
24 Philips Annual Report 2003
Financial Statements and Analysis
The improvement was driven by sales expansion, margin improvement and successfulcost-reduction programs and was particularly visible in the businesses Oral Healthcare andFood & Beverage. Restructuring charges amounted to 9 million.Strong focus on efficient utilization of capital in 2002 reduced working capital by 13%compared to 2001.
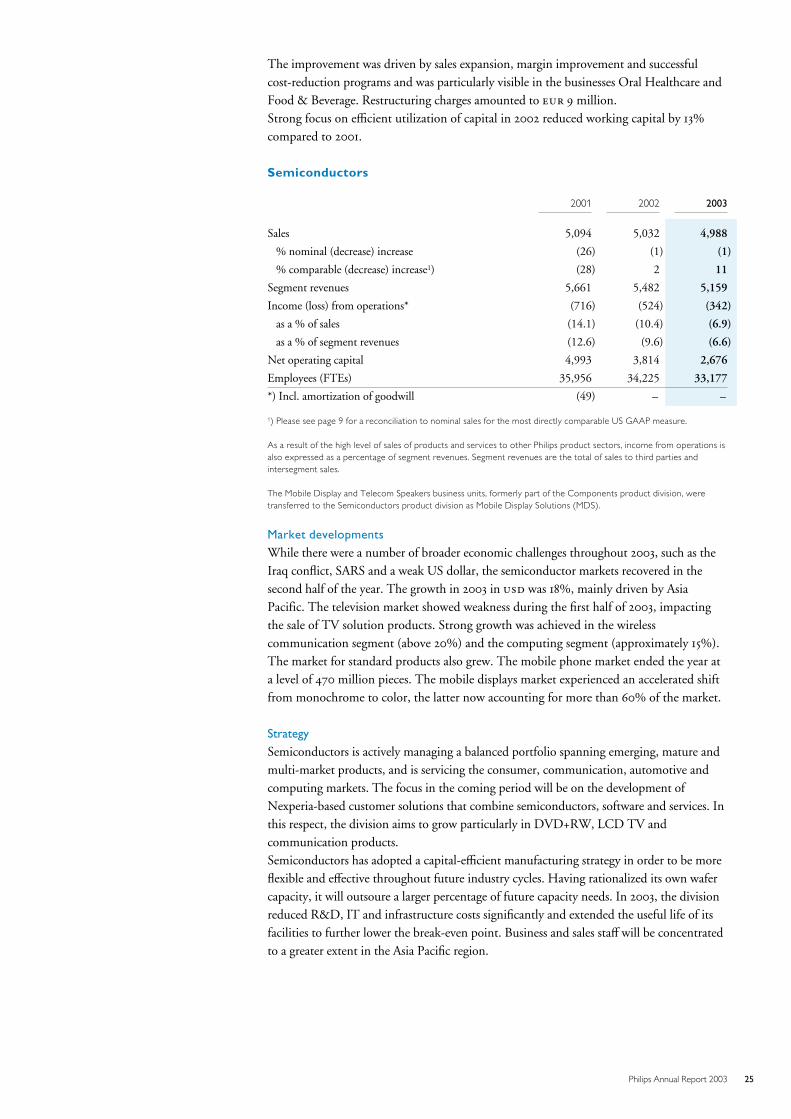
Semiconductors
2001 2002 2003
Sales 5,094 5,032 4,988
% nominal (decrease) increase (26) (1) (1)
% comparable (decrease) increase1) (28) 2 11
Segment revenues 5,661 5,482 5,159
Income (loss) from operations* (716) (524) (342)
as a % of sales (14.1) (10.4) (6.9)
as a % of segment revenues (12.6) (9.6) (6.6)
Net operating capital 4,993 3,814 2,676
Employees (FTEs) 35,956 34,225 33,177
*) Incl. amortization of goodwill (49) – –
1) Please see page 9 for a reconciliation to nominal sales for the most directly comparable US GAAP measure.
As a result of the high level of sales of products and services to other Philips product sectors, income from operations isalso expressed as a percentage of segment revenues. Segment revenues are the total of sales to third parties andintersegment sales.
The Mobile Display and Telecom Speakers business units, formerly part of the Components product division, weretransferred to the Semiconductors product division as Mobile Display Solutions (MDS).
Market developments
While there were a number of broader economic challenges throughout 2003, such as theIraq conflict, SARS and a weak US dollar, the semiconductor markets recovered in thesecond half of the year. The growth in 2003 in was 18%, mainly driven by AsiaPacific. The television market showed weakness during the first half of 2003, impactingthe sale of TV solution products. Strong growth was achieved in the wirelesscommunication segment (above 20%) and the computing segment (approximately 15%).The market for standard products also grew. The mobile phone market ended the year ata level of 470 million pieces. The mobile displays market experienced an accelerated shiftfrom monochrome to color, the latter now accounting for more than 60% of the market.
Strategy
Semiconductors is actively managing a balanced portfolio spanning emerging, mature andmulti-market products, and is servicing the consumer, communication, automotive andcomputing markets. The focus in the coming period will be on the development ofNexperia-based customer solutions that combine semiconductors, software and services. Inthis respect, the division aims to grow particularly in DVD+RW, LCD TV andcommunication products.Semiconductors has adopted a capital-efficient manufacturing strategy in order to be moreflexible and effective throughout future industry cycles. Having rationalized its own wafercapacity, it will outsoure a larger percentage of future capacity needs. In 2003, the divisionreduced R&D, IT and infrastructure costs significantly and extended the useful life of itsfacilities to further lower the break-even point. Business and sales staff will be concentratedto a greater extent in the Asia Pacific region.
25Philips Annual Report 2003
The division also partners with leading customers, content and service providers, the aimbeing to increase share of business from key customers from 55% (in 2001) to 70% by theend of 2006. It is already benefiting from a technology partnership withSTMicroelectronics and Motorola at Crolles. The division will continue to invest in moreadvanced capacity through SSMC, which will be consolidated in early 2004 following theapplication of new accounting standards.
Financial performance
Semiconductors’ share of the market it serves declined over the year from 5.3% to 4.6%.The loss of share occurred primarily in the first half of the year. However, based onsuccessful consumer and communication sales, the division managed to improve its marketshare from 4.5% in the third quarter to 5.0% in the fourth quarter. The utilization rateincreased continuously through the year to reach a level of 84% in the fourth quarter.Consumer and Mobile Communications posted strong growth. MDS sales increased by31%, mainly due to the accelerated adoption of color displays in new handsets. In volumeterms, MDS increased its market share by 4%.Income from operations in the fourth quarter totaled 166 million. The profit was theresult of increased sales, lower R&D spending and the benefits of the wafer-fabrestructuring. Net restructuring and impairment charges totaled 290 million for theyear.
Net operating capital continued to decrease. Net capital expenditures were maintained ata low level of 205 million. In addition, the cash flow used for investing activitiesrelated to Crolles 2 recorded by the Philips Group amounted to 99 million.
After experiencing the worst downturn in the history of the semiconductor industry in2001, markets more or less stabilized in 2002. A sales decline was noted among allbusinesses except MDS, which enjoyed sales growth of 34%. On a total available market(TAM) basis, market share declined by 0.1% to 3.1% (Source WSTS). Saturation in thePC and handset markets and a weak financial position of telecom operators and serviceproviders had an adverse effect on semiconductor industry growth. Semiconductorsmaintained its strong position in the profitable analog markets.In 2002 factory utilization was only 56%. As a result, significant losses were incurred.Morover, losses were incurred in growth areas such as digital consumer and networking asa result of continued R&D efforts. Special items amounted to 160 million. To reduceovercapacity, it was decided to close the fab in Albuquerque. R&D and overhead werefurther streamlined. The total cost of these measures in 2002 was 169 million.
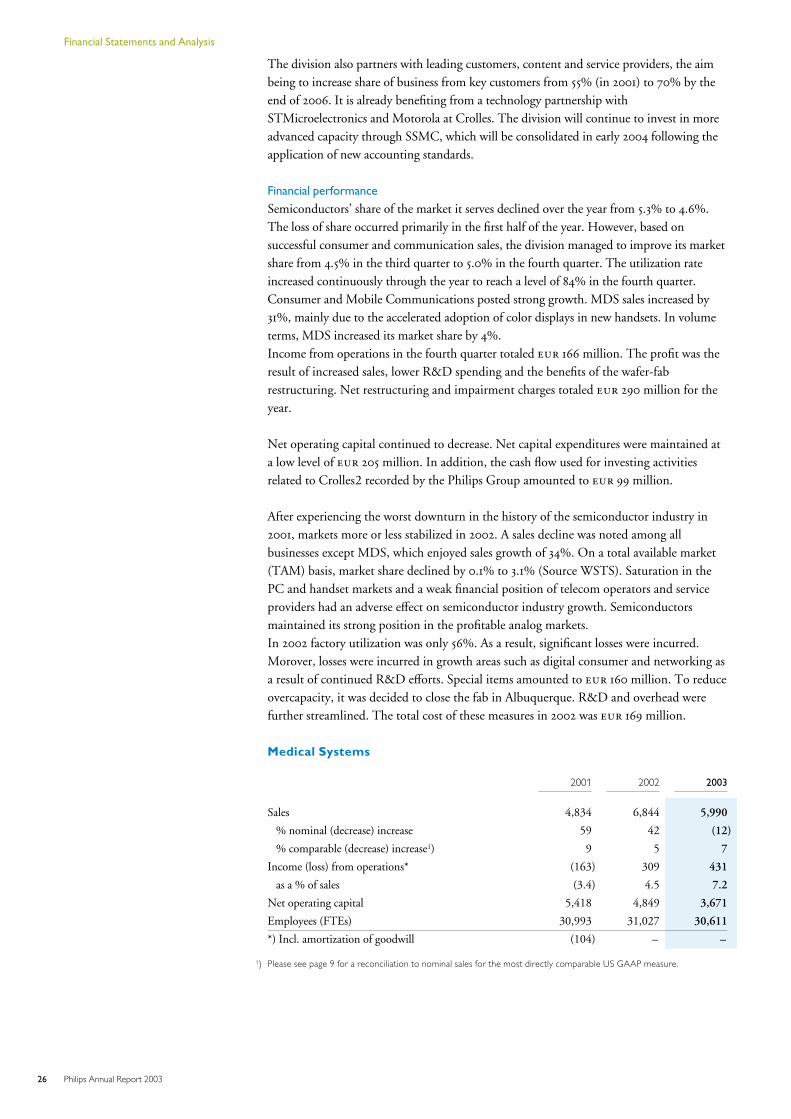
Medical Systems
2001 2002 2003
Sales 4,834 6,844 5,990
% nominal (decrease) increase 59 42 (12)
% comparable (decrease) increase1) 9 5 7
Income (loss) from operations* (163) 309 431
as a % of sales (3.4) 4.5 7.2
Net operating capital 5,418 4,849 3,671
Employees (FTEs) 30,993 31,027 30,611
*) Incl. amortization of goodwill (104) – –
1) Please see page 9 for a reconciliation to nominal sales for the most directly comparable US GAAP measure.
26 Philips Annual Report 2003
Financial Statements and Analysis
Market developments
Expressed in local currencies, all Medical Systems’ markets grew, except for Europe.Growth was fueled by new technologies for faster, earlier and more accurate diagnoses, aswell as for new diagnostic procedures (e.g. for heart disease and cancer). In the USA, newhospital construction is creating demand for larger, multi-year arrangements. Leadinghospitals are also seeking research partnerships to develop next-generation medicalprocedures. Large-scale genomic and proteomic research projects are being launched inorder to enhance the understanding of disease on a cellular level. This is expected to lead tonew procedures to detect and treat disease very early, thus reducing chronic disease,improving patients’ quality of life and reducing expensive treatments. It is expected thatthis will create a new dynamic in the market over the next several years.
Strategy
Medical Systems’ strategy is aimed at maintaining its leadership in many modalities and incardiology and critical care, while growing market share continuously in radiology andhealthcare IT. This will be achieved by an innovation program that focuses on clinicalexcellence and product rejuvenation. This is illustrated by the introduction of new familiesof high-speed, high-performance CT and MR scanners in 2003. Philips is also expandingits service offering in order to increase customer contracts. In IT, a strategic alliance withEpic, the highly respected North American healthcare IT company, was announced. Inresponse to the market demand for large multi-year partnerships, a dedicated group wasestablished, which concluded many significant deals with leading healthcare enterprises,such as the Cleveland Clinic. In molecular medicine, a number of strategic partnershipswith highly innovative start-ups were established to develop early-detectionmolecular-diagnostic procedures.In financial terms Medical Systems continued on its path of continuous improvementtowards its EBITA target of 14% of sales in 2004.
Financial performance
Sales increased by 7%, excluding the effect of the divestment of Health Care Products(HCP) in 2002 and currency movements. Sales were strong at Patient Monitoring, MedicalIT and Customer Services. All regions contributed to the comparable sales growth.Income from operations totaled 431 million, including an impairment charge of 139 million for MedQuist, and net restructuring charges of 7 million. Inaddition, a valuation adjustment of 35 million, related to the alignment of inventoryvaluations across the Medical Systems business, impacted income from operationsunfavorably. Cardiac and Monitoring Systems, Ultrasound and Healthcare IT were themain drivers of income improvements in 2003. Positive synergy effects yielded 342
million savings, close to the target of 350 million.Supply chain management resulted in a 248 million reduction in working capital,mainly in net inventories.In 2002 sales increased by 5%, excluding the effect of acquisitions and currencymovements. X-ray, Computed Tomography, Nuclear Medicine, Cardiac and MonitoringSystems and Customer Services drove the sales increase. From a regional perspective thegrowth was strongest in North America.Improved sales and performance at X-ray, Customer Services, Cardiac and MonitoringSystems all contributed to the increase in income from operations. Acquisition-relatedcharges amounted to 84 million. Impairment charges for HCP amounted to 47 million. There were a number of non-recurring charges amounting to 73 million, mainly following the Marconi and Agilent acquisitions, and charges takenfor the exposure related to Argentina. Positive synergy effects amounted to 173 million.Net operating capital was significantly lower due to the weaker dollar and the sale ofHCP.
27Philips Annual Report 2003
Miscellaneous
2001 2002 2003
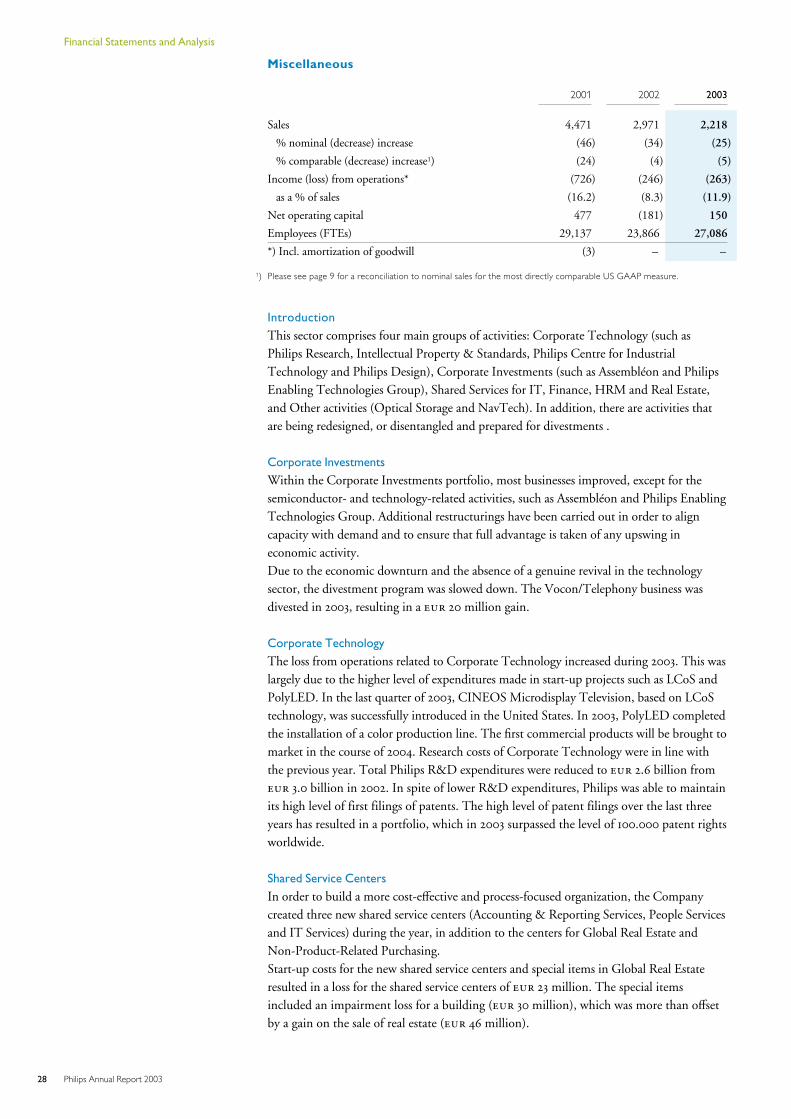
Sales 4,471 2,971 2,218
% nominal (decrease) increase (46) (34) (25)
% comparable (decrease) increase1) (24) (4) (5)
Income (loss) from operations* (726) (246) (263)
as a % of sales (16.2) (8.3) (11.9)
Net operating capital 477 (181) 150
Employees (FTEs) 29,137 23,866 27,086
*) Incl. amortization of goodwill (3) – –
1) Please see page 9 for a reconciliation to nominal sales for the most directly comparable US GAAP measure.
Introduction
This sector comprises four main groups of activities: Corporate Technology (such asPhilips Research, Intellectual Property & Standards, Philips Centre for IndustrialTechnology and Philips Design), Corporate Investments (such as Assembléon and PhilipsEnabling Technologies Group), Shared Services for IT, Finance, HRM and Real Estate,and Other activities (Optical Storage and NavTech). In addition, there are activities thatare being redesigned, or disentangled and prepared for divestments .
Corporate Investments
Within the Corporate Investments portfolio, most businesses improved, except for thesemiconductor- and technology-related activities, such as Assembléon and Philips EnablingTechnologies Group. Additional restructurings have been carried out in order to aligncapacity with demand and to ensure that full advantage is taken of any upswing ineconomic activity.Due to the economic downturn and the absence of a genuine revival in the technologysector, the divestment program was slowed down. The Vocon/Telephony business wasdivested in 2003, resulting in a 20 million gain.
Corporate Technology
The loss from operations related to Corporate Technology increased during 2003. This waslargely due to the higher level of expenditures made in start-up projects such as LCoS andPolyLED. In the last quarter of 2003, CINEOS Microdisplay Television, based on LCoStechnology, was successfully introduced in the United States. In 2003, PolyLED completedthe installation of a color production line. The first commercial products will be brought tomarket in the course of 2004. Research costs of Corporate Technology were in line withthe previous year. Total Philips R&D expenditures were reduced to 2.6 billion from 3.0 billion in 2002. In spite of lower R&D expenditures, Philips was able to maintainits high level of first filings of patents. The high level of patent filings over the last threeyears has resulted in a portfolio, which in 2003 surpassed the level of 100.000 patent rightsworldwide.
Shared Service Centers
In order to build a more cost-effective and process-focused organization, the Companycreated three new shared service centers (Accounting & Reporting Services, People Servicesand IT Services) during the year, in addition to the centers for Global Real Estate andNon-Product-Related Purchasing.Start-up costs for the new shared service centers and special items in Global Real Estateresulted in a loss for the shared service centers of 23 million. The special itemsincluded an impairment loss for a building ( 30 million), which was more than offsetby a gain on the sale of real estate ( 46 million).
28 Philips Annual Report 2003
Financial Statements and Analysis
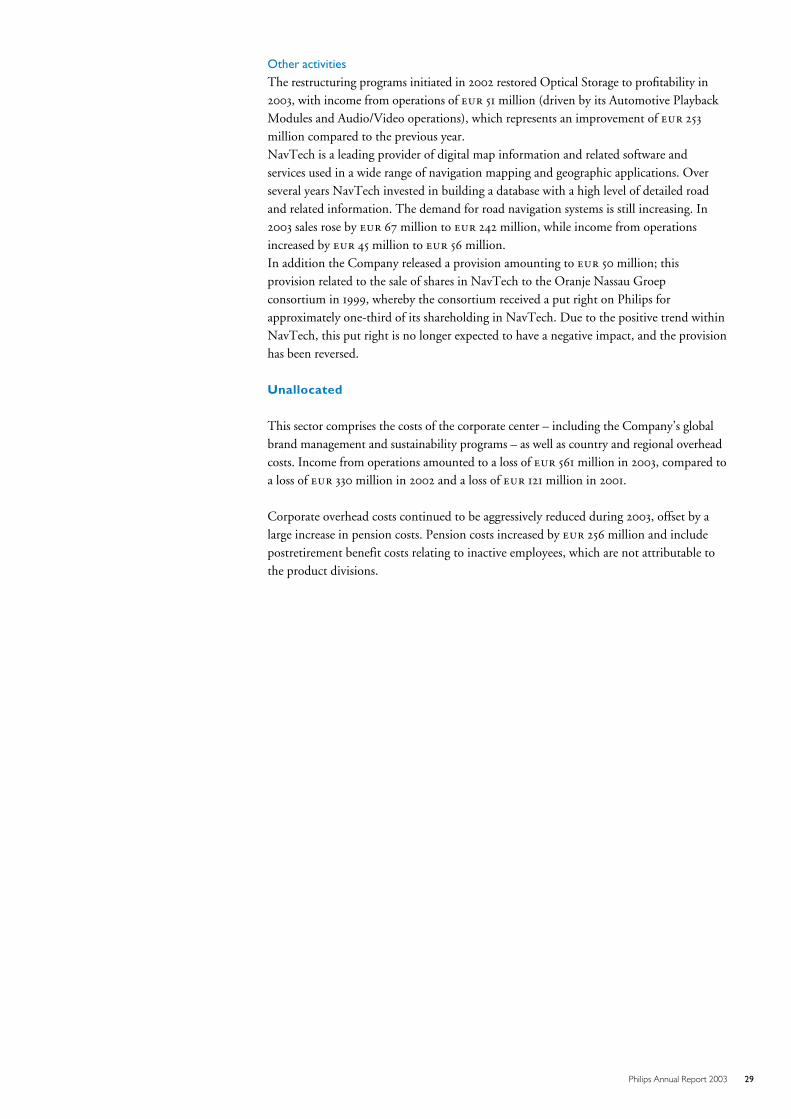
Other activities
The restructuring programs initiated in 2002 restored Optical Storage to profitability in2003, with income from operations of 51 million (driven by its Automotive PlaybackModules and Audio/Video operations), which represents an improvement of 253
million compared to the previous year.NavTech is a leading provider of digital map information and related software andservices used in a wide range of navigation mapping and geographic applications. Overseveral years NavTech invested in building a database with a high level of detailed roadand related information. The demand for road navigation systems is still increasing. In2003 sales rose by 67 million to 242 million, while income from operationsincreased by 45 million to 56 million.In addition the Company released a provision amounting to 50 million; thisprovision related to the sale of shares in NavTech to the Oranje Nassau Groepconsortium in 1999, whereby the consortium received a put right on Philips forapproximately one-third of its shareholding in NavTech. Due to the positive trend withinNavTech, this put right is no longer expected to have a negative impact, and the provisionhas been reversed.
Unallocated
This sector comprises the costs of the corporate center – including the Company’s globalbrand management and sustainability programs – as well as country and regional overheadcosts. Income from operations amounted to a loss of 561 million in 2003, compared toa loss of 330 million in 2002 and a loss of 121 million in 2001.
Corporate overhead costs continued to be aggressively reduced during 2003, offset by alarge increase in pension costs. Pension costs increased by 256 million and includepostretirement benefit costs relating to inactive employees, which are not attributable tothe product divisions.
29Philips Annual Report 2003
Performance by region
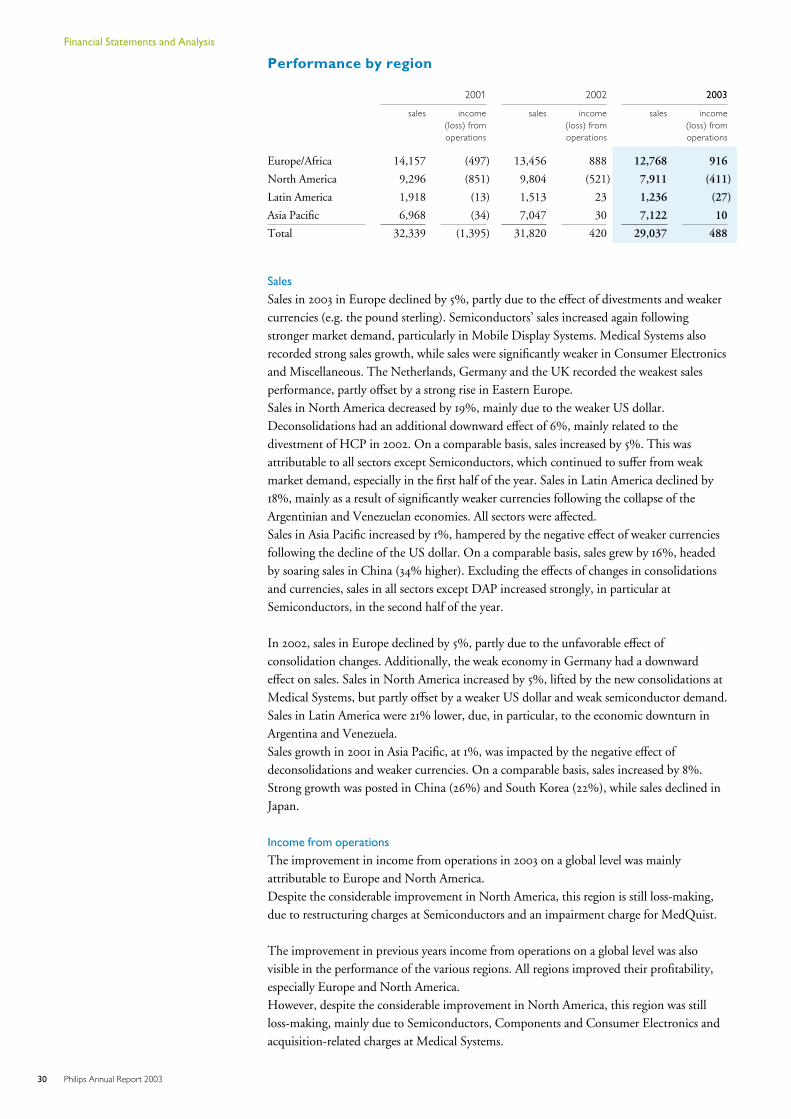
2001 2002 2003
sales income(loss) fromoperations
sales income(loss) fromoperations
sales income(loss) fromoperations
Europe/Africa 14,157 (497) 13,456 888 12,768 916
North America 9,296 (851) 9,804 (521) 7,911 (411)
Latin America 1,918 (13) 1,513 23 1,236 (27)
Asia Pacific 6,968 (34) 7,047 30 7,122 10
Total 32,339 (1,395) 31,820 420 29,037 488
Sales
Sales in 2003 in Europe declined by 5%, partly due to the effect of divestments and weakercurrencies (e.g. the pound sterling). Semiconductors’ sales increased again followingstronger market demand, particularly in Mobile Display Systems. Medical Systems alsorecorded strong sales growth, while sales were significantly weaker in Consumer Electronicsand Miscellaneous. The Netherlands, Germany and the UK recorded the weakest salesperformance, partly offset by a strong rise in Eastern Europe.Sales in North America decreased by 19%, mainly due to the weaker US dollar.Deconsolidations had an additional downward effect of 6%, mainly related to thedivestment of HCP in 2002. On a comparable basis, sales increased by 5%. This wasattributable to all sectors except Semiconductors, which continued to suffer from weakmarket demand, especially in the first half of the year. Sales in Latin America declined by18%, mainly as a result of significantly weaker currencies following the collapse of theArgentinian and Venezuelan economies. All sectors were affected.Sales in Asia Pacific increased by 1%, hampered by the negative effect of weaker currenciesfollowing the decline of the US dollar. On a comparable basis, sales grew by 16%, headedby soaring sales in China (34% higher). Excluding the effects of changes in consolidationsand currencies, sales in all sectors except DAP increased strongly, in particular atSemiconductors, in the second half of the year.
In 2002, sales in Europe declined by 5%, partly due to the unfavorable effect ofconsolidation changes. Additionally, the weak economy in Germany had a downwardeffect on sales. Sales in North America increased by 5%, lifted by the new consolidations atMedical Systems, but partly offset by a weaker US dollar and weak semiconductor demand.Sales in Latin America were 21% lower, due, in particular, to the economic downturn inArgentina and Venezuela.Sales growth in 2001 in Asia Pacific, at 1%, was impacted by the negative effect ofdeconsolidations and weaker currencies. On a comparable basis, sales increased by 8%.Strong growth was posted in China (26%) and South Korea (22%), while sales declined inJapan.
Income from operations
The improvement in income from operations in 2003 on a global level was mainlyattributable to Europe and North America.Despite the considerable improvement in North America, this region is still loss-making,due to restructuring charges at Semiconductors and an impairment charge for MedQuist.
The improvement in previous years income from operations on a global level was alsovisible in the performance of the various regions. All regions improved their profitability,especially Europe and North America.However, despite the considerable improvement in North America, this region was stillloss-making, mainly due to Semiconductors, Components and Consumer Electronics andacquisition-related charges at Medical Systems.
30 Philips Annual Report 2003
Financial Statements and Analysis
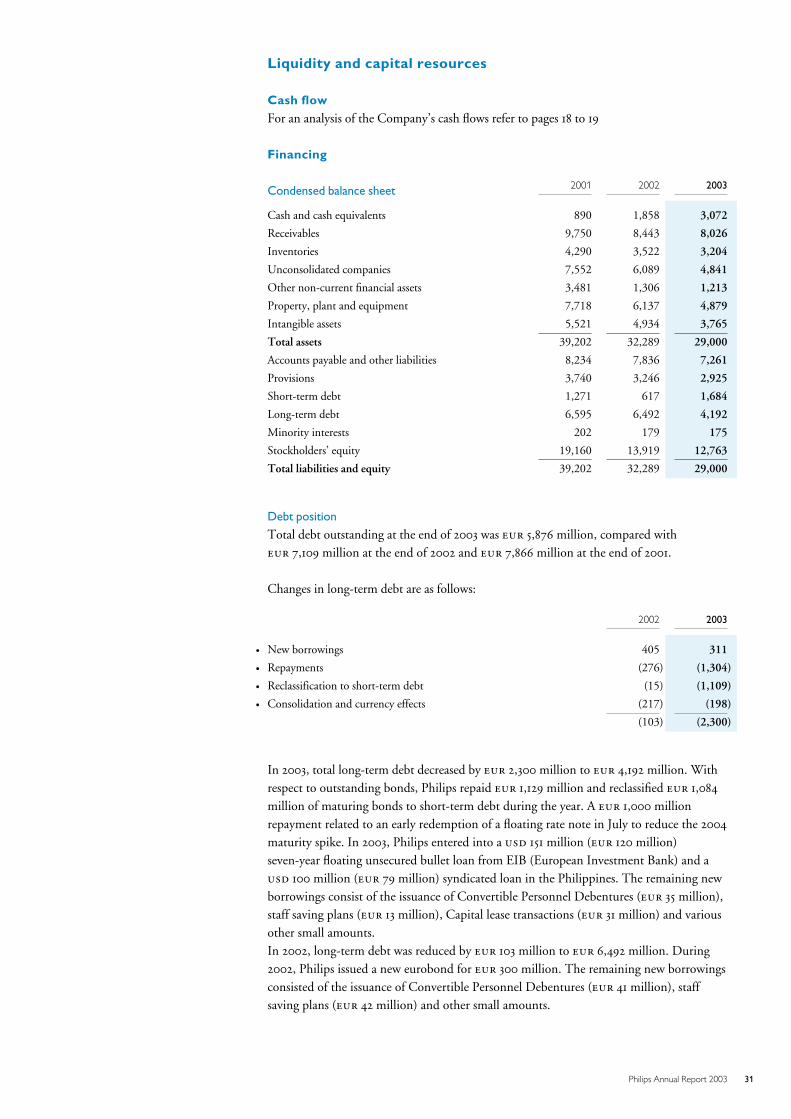
Liquidity and capital resources
Cash flowFor an analysis of the Company’s cash flows refer to pages 18 to 19
Financing
Condensed balance sheet 2001 2002 2003
Cash and cash equivalents 890 1,858 3,072
Receivables 9,750 8,443 8,026
Inventories 4,290 3,522 3,204
Unconsolidated companies 7,552 6,089 4,841
Other non-current financial assets 3,481 1,306 1,213
Property, plant and equipment 7,718 6,137 4,879
Intangible assets 5,521 4,934 3,765
Total assets 39,202 32,289 29,000
Accounts payable and other liabilities 8,234 7,836 7,261
Provisions 3,740 3,246 2,925
Short-term debt 1,271 617 1,684
Long-term debt 6,595 6,492 4,192
Minority interests 202 179 175
Stockholders’ equity 19,160 13,919 12,763
Total liabilities and equity 39,202 32,289 29,000
Debt position
Total debt outstanding at the end of 2003 was 5,876 million, compared with 7,109 million at the end of 2002 and 7,866 million at the end of 2001.
Changes in long-term debt are as follows:
2002 2003
G New borrowings 405 311
G Repayments (276) (1,304)
G Reclassification to short-term debt (15) (1,109)
G Consolidation and currency effects (217) (198)
(103) (2,300)
In 2003, total long-term debt decreased by 2,300 million to 4,192 million. Withrespect to outstanding bonds, Philips repaid 1,129 million and reclassified 1,084
million of maturing bonds to short-term debt during the year. A 1,000 millionrepayment related to an early redemption of a floating rate note in July to reduce the 2004
maturity spike. In 2003, Philips entered into a 151 million ( 120 million)seven-year floating unsecured bullet loan from EIB (European Investment Bank) and a 100 million ( 79 million) syndicated loan in the Philippines. The remaining newborrowings consist of the issuance of Convertible Personnel Debentures ( 35 million),staff saving plans ( 13 million), Capital lease transactions ( 31 million) and variousother small amounts.In 2002, long-term debt was reduced by 103 million to 6,492 million. During2002, Philips issued a new eurobond for 300 million. The remaining new borrowingsconsisted of the issuance of Convertible Personnel Debentures ( 41 million), staffsaving plans ( 42 million) and other small amounts.
31Philips Annual Report 2003
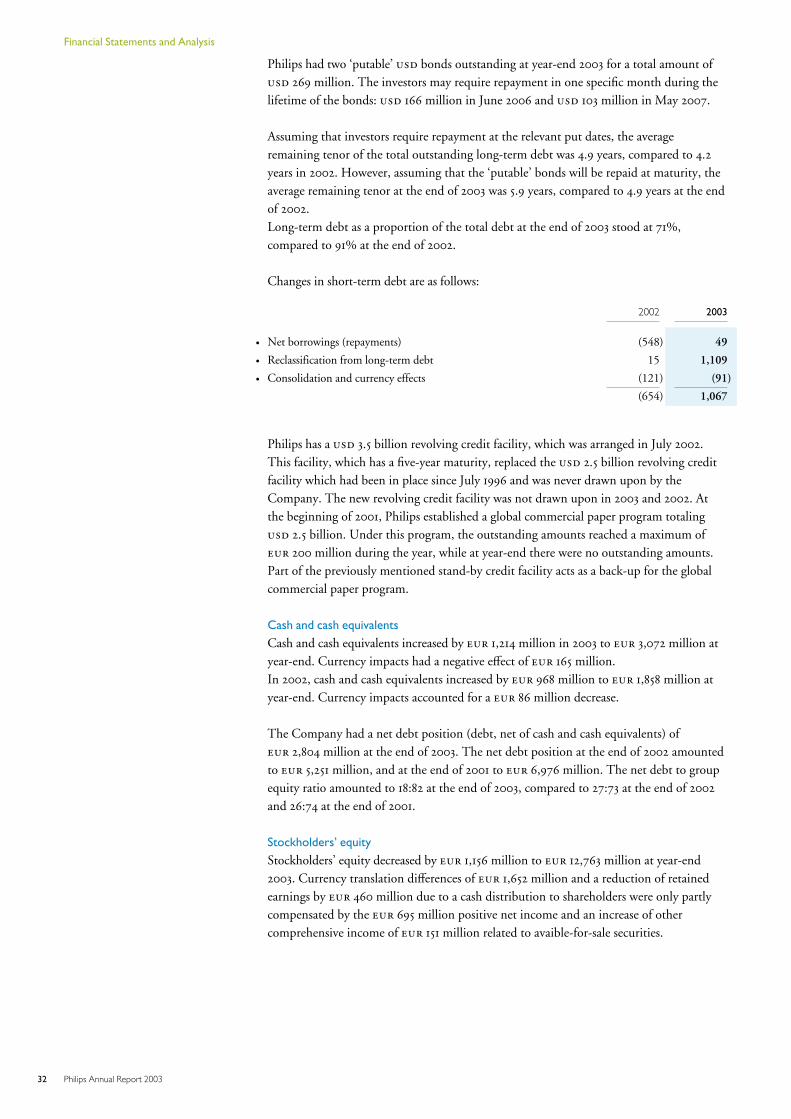
Philips had two ‘putable’ bonds outstanding at year-end 2003 for a total amount of 269 million. The investors may require repayment in one specific month during thelifetime of the bonds: 166 million in June 2006 and 103 million in May 2007.
Assuming that investors require repayment at the relevant put dates, the averageremaining tenor of the total outstanding long-term debt was 4.9 years, compared to 4.2years in 2002. However, assuming that the ‘putable’ bonds will be repaid at maturity, theaverage remaining tenor at the end of 2003 was 5.9 years, compared to 4.9 years at the endof 2002.Long-term debt as a proportion of the total debt at the end of 2003 stood at 71%,compared to 91% at the end of 2002.
Changes in short-term debt are as follows:
2002 2003
G Net borrowings (repayments) (548) 49
G Reclassification from long-term debt 15 1,109
G Consolidation and currency effects (121) (91)
(654) 1,067
Philips has a 3.5 billion revolving credit facility, which was arranged in July 2002.This facility, which has a five-year maturity, replaced the 2.5 billion revolving creditfacility which had been in place since July 1996 and was never drawn upon by theCompany. The new revolving credit facility was not drawn upon in 2003 and 2002. Atthe beginning of 2001, Philips established a global commercial paper program totaling 2.5 billion. Under this program, the outstanding amounts reached a maximum of 200 million during the year, while at year-end there were no outstanding amounts.Part of the previously mentioned stand-by credit facility acts as a back-up for the globalcommercial paper program.
Cash and cash equivalents
Cash and cash equivalents increased by 1,214 million in 2003 to 3,072 million atyear-end. Currency impacts had a negative effect of 165 million.In 2002, cash and cash equivalents increased by 968 million to 1,858 million atyear-end. Currency impacts accounted for a 86 million decrease.
The Company had a net debt position (debt, net of cash and cash equivalents) of 2,804 million at the end of 2003. The net debt position at the end of 2002 amountedto 5,251 million, and at the end of 2001 to 6,976 million. The net debt to groupequity ratio amounted to 18:82 at the end of 2003, compared to 27:73 at the end of 2002
and 26:74 at the end of 2001.
Stockholders’ equity
Stockholders’ equity decreased by 1,156 million to 12,763 million at year-end2003. Currency translation differences of 1,652 million and a reduction of retainedearnings by 460 million due to a cash distribution to shareholders were only partlycompensated by the 695 million positive net income and an increase of othercomprehensive income of 151 million related to avaible-for-sale securities.
32 Philips Annual Report 2003
Financial Statements and Analysis
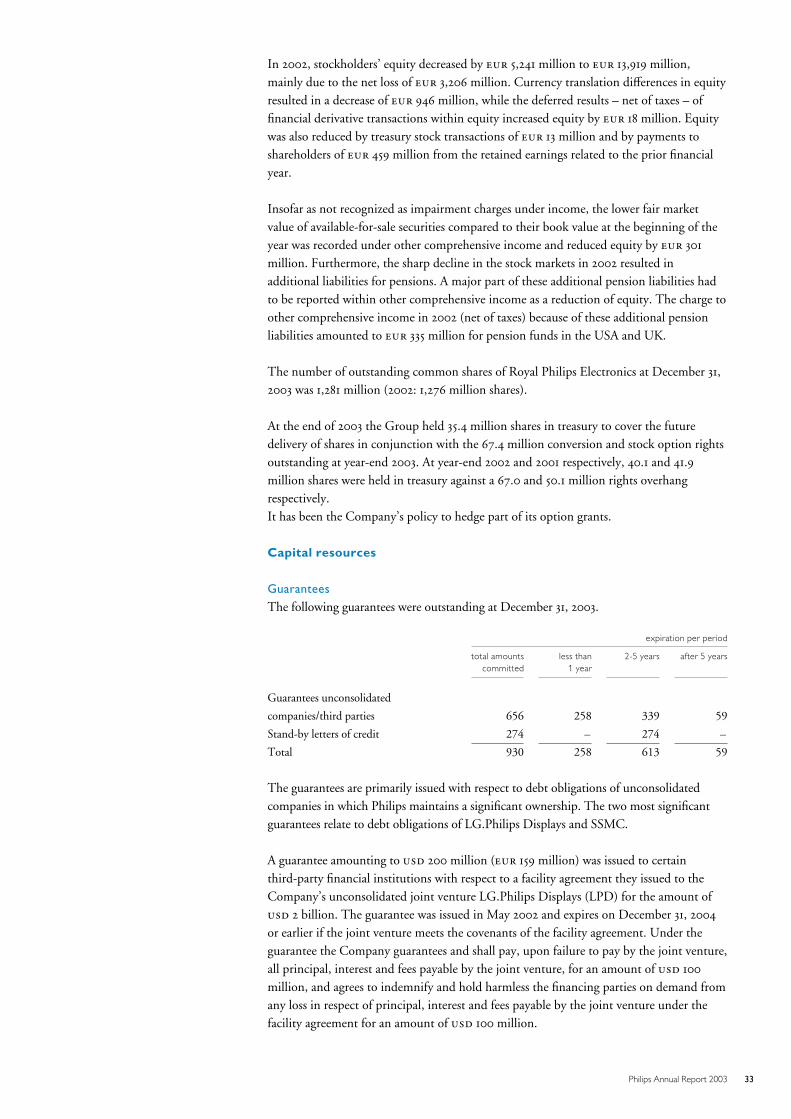
In 2002, stockholders’ equity decreased by 5,241 million to 13,919 million,mainly due to the net loss of 3,206 million. Currency translation differences in equityresulted in a decrease of 946 million, while the deferred results – net of taxes – offinancial derivative transactions within equity increased equity by 18 million. Equitywas also reduced by treasury stock transactions of 13 million and by payments toshareholders of 459 million from the retained earnings related to the prior financialyear.
Insofar as not recognized as impairment charges under income, the lower fair marketvalue of available-for-sale securities compared to their book value at the beginning of theyear was recorded under other comprehensive income and reduced equity by 301
million. Furthermore, the sharp decline in the stock markets in 2002 resulted inadditional liabilities for pensions. A major part of these additional pension liabilities hadto be reported within other comprehensive income as a reduction of equity. The charge toother comprehensive income in 2002 (net of taxes) because of these additional pensionliabilities amounted to 335 million for pension funds in the USA and UK.
The number of outstanding common shares of Royal Philips Electronics at December 31,2003 was 1,281 million (2002: 1,276 million shares).
At the end of 2003 the Group held 35.4 million shares in treasury to cover the futuredelivery of shares in conjunction with the 67.4 million conversion and stock option rightsoutstanding at year-end 2003. At year-end 2002 and 2001 respectively, 40.1 and 41.9million shares were held in treasury against a 67.0 and 50.1 million rights overhangrespectively.It has been the Company’s policy to hedge part of its option grants.
Capital resources
Guarantees
The following guarantees were outstanding at December 31, 2003.
expiration per period
total amountscommitted
less than1 year
2-5 years after 5 years
Guarantees unconsolidated
companies/third parties 656 258 339 59
Stand-by letters of credit 274 – 274 –
Total 930 258 613 59
The guarantees are primarily issued with respect to debt obligations of unconsolidatedcompanies in which Philips maintains a significant ownership. The two most significantguarantees relate to debt obligations of LG.Philips Displays and SSMC.
A guarantee amounting to 200 million ( 159 million) was issued to certainthird-party financial institutions with respect to a facility agreement they issued to theCompany’s unconsolidated joint venture LG.Philips Displays (LPD) for the amount of 2 billion. The guarantee was issued in May 2002 and expires on December 31, 2004
or earlier if the joint venture meets the covenants of the facility agreement. Under theguarantee the Company guarantees and shall pay, upon failure to pay by the joint venture,all principal, interest and fees payable by the joint venture, for an amount of 100
million, and agrees to indemnify and hold harmless the financing parties on demand fromany loss in respect of principal, interest and fees payable by the joint venture under thefacility agreement for an amount of 100 million.
33Philips Annual Report 2003
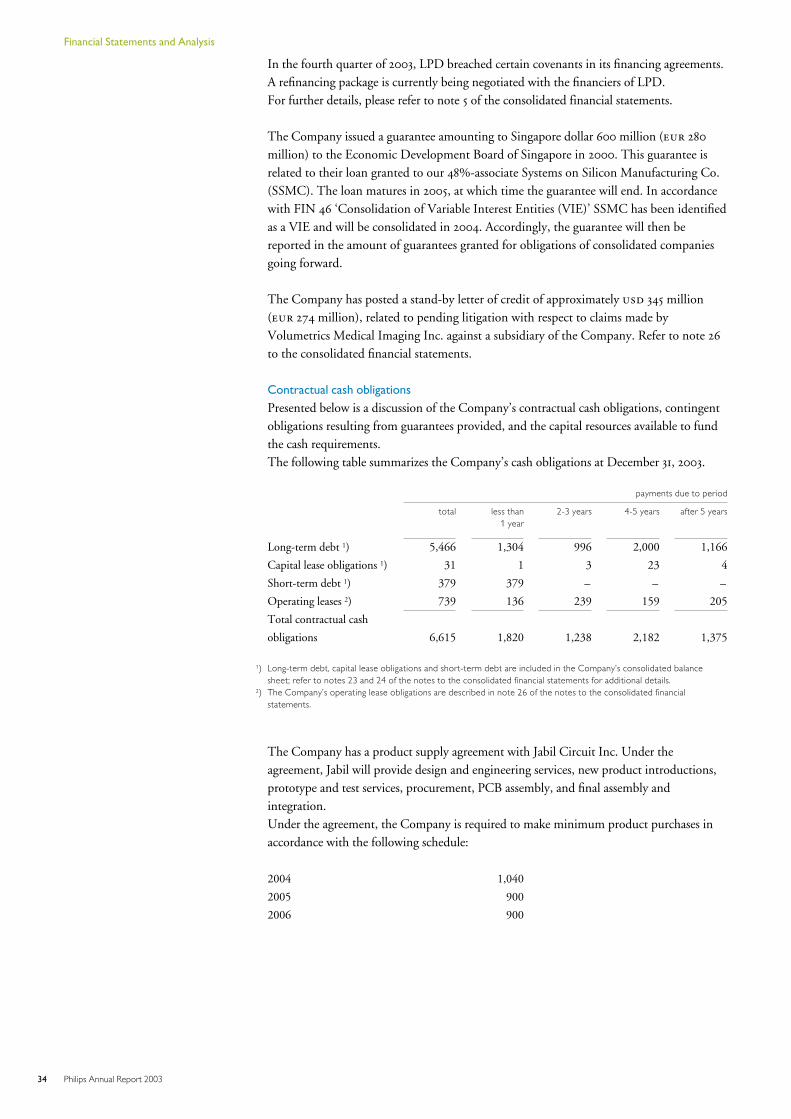
In the fourth quarter of 2003, LPD breached certain covenants in its financing agreements.A refinancing package is currently being negotiated with the financiers of LPD.For further details, please refer to note 5 of the consolidated financial statements.
The Company issued a guarantee amounting to Singapore dollar 600 million ( 280
million) to the Economic Development Board of Singapore in 2000. This guarantee isrelated to their loan granted to our 48%-associate Systems on Silicon Manufacturing Co.(SSMC). The loan matures in 2005, at which time the guarantee will end. In accordancewith FIN 46 ‘Consolidation of Variable Interest Entities (VIE)’ SSMC has been identifiedas a VIE and will be consolidated in 2004. Accordingly, the guarantee will then bereported in the amount of guarantees granted for obligations of consolidated companiesgoing forward.
The Company has posted a stand-by letter of credit of approximately 345 million( 274 million), related to pending litigation with respect to claims made byVolumetrics Medical Imaging Inc. against a subsidiary of the Company. Refer to note 26
to the consolidated financial statements.
Contractual cash obligations
Presented below is a discussion of the Company’s contractual cash obligations, contingentobligations resulting from guarantees provided, and the capital resources available to fundthe cash requirements.The following table summarizes the Company’s cash obligations at December 31, 2003.
payments due to period
total less than1 year
2-3 years 4-5 years after 5 years
Long-term debt 1) 5,466 1,304 996 2,000 1,166
Capital lease obligations 1) 31 1 3 23 4
Short-term debt 1) 379 379 – – –
Operating leases 2) 739 136 239 159 205
Total contractual cash
obligations 6,615 1,820 1,238 2,182 1,375
1) Long-term debt, capital lease obligations and short-term debt are included in the Company’s consolidated balancesheet; refer to notes 23 and 24 of the notes to the consolidated financial statements for additional details.
2) The Company’s operating lease obligations are described in note 26 of the notes to the consolidated financialstatements.
The Company has a product supply agreement with Jabil Circuit Inc. Under theagreement, Jabil will provide design and engineering services, new product introductions,prototype and test services, procurement, PCB assembly, and final assembly andintegration.Under the agreement, the Company is required to make minimum product purchases inaccordance with the following schedule:
2004 1,040
2005 900
2006 900
34 Philips Annual Report 2003
Financial Statements and Analysis
The agreement provides that certain penalties may be charged to the Company, if theCompany fails to satisfy the volume commitment.
The Company sponsors pension plans in many countries in accordance with legalrequirements, customs and the local situation in the countries involved. The majority ofemployees in Europe and North America are covered by defined-benefit plans.Contributions are made by the Company, as necessary, to provide assets sufficient to meetbenefits payable to plan participants. The Company expects considerable cash outflows inrelation to employee benefits which are estimated to amount to 465 million in 2004
(2003: 175 million) and comprise of 338 million employer contributions todefined benefit pension plans, 56 million employer contributions to definedcontribution plans and 71 million expected cash outflows in relation to book reservedpension plans. The expected amounts of cash outflows in 2004 and in subsequent yearsare uncertain and may change substantially as a consequence of changes in actual versusassumed discount rates (5.4%), estimations of compensation increases (2.5%) and returnson pension plan assets (6.2%).
Philips is of the opinion that it has adequate financial resources to finance working capitalneeds. Furthermore, the Company has no material commitments for capital expenditures.Philips has a 2.5 billion commercial paper (CP) program whereby it can issue CP upto 364 days in tenor, both in the USA and in Europe, in any currency. There is a panel ofbanks, six in Europe and five in the USA, that support the program. When Philips wantsto fund through the commercial paper program, it contacts the panel of banks. Theinterest is at market rates prevailing at the time of issuance of the CP. There are nolimitations on Philips’ use of the program, save for market considerations, e.g. that thecommercial paper market itself is not open. If this were to be the case, Philips’ 3.5billion committed revolving facility could act as backup for short-term financingrequirements that normally would be satisfied through the CP program. The syndicatedbank facility has no financial covenants and does not have credit-rating-relatedacceleration possibilities or any availability restrictions. There is no collateral requirementin the commercial paper program. As of December 31, 2003, Philips did not have any CPoutstanding.
In June 2002, Philips filed a Shelf Registration Statement (Form F-3) with the Securitiesand Exchange Commission. This filing gives Philips the flexibility to issue debt securitiesand/or to set up a US Medium Term Notes program for an amount up to 2.5 billion.The Company’s total debt as of year-end 2003 was 5,876 million, of which 1,684
million was short-term. With year-end cash balances of 3,072 million, net debt was 2,804 million. In view of the Company’s 8.3 billion shareholdings in publiclylisted companies and the 3.5 billion revolving facility mentioned above, theCompany’s liquidity position is strong.
Proposed dividend to shareholders of Royal Philips ElectronicsA proposal will be submitted to the General Meeting of Shareholders to declare a dividendof 0.36 per common share ( 461 million).Pursuant to article 35 of the Articles of Association, and with the approval of theSupervisory Board and the Meeting of Priority Shareholders, the remainder of the incomefor the financial year 2003 has been retained by way of reserve.In 2002, a distribution was made of 0.36 per common share from the other reserves.The balance sheet presented in this report, as part of the consolidated financial statementsfor the period ended December 31, 2003, is before dividend, which is subject toshareholder approval after year-end.
35Philips Annual Report 2003
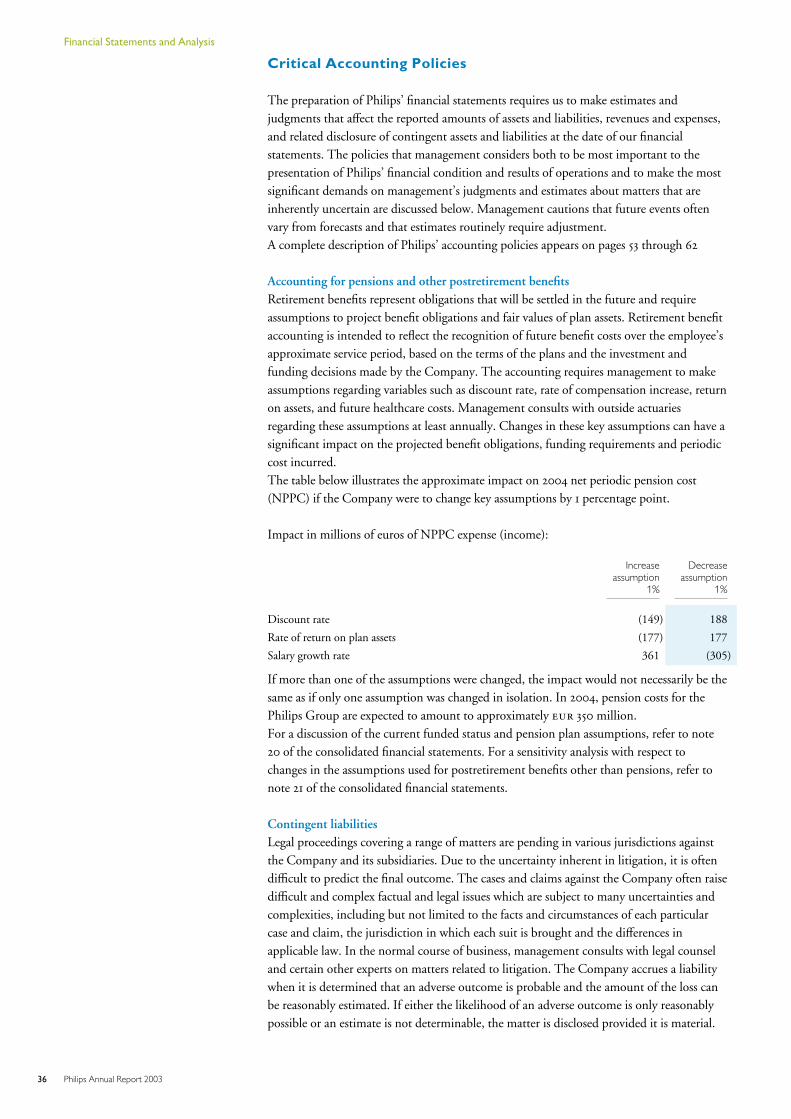
Critical Accounting Policies
The preparation of Philips’ financial statements requires us to make estimates andjudgments that affect the reported amounts of assets and liabilities, revenues and expenses,and related disclosure of contingent assets and liabilities at the date of our financialstatements. The policies that management considers both to be most important to thepresentation of Philips’ financial condition and results of operations and to make the mostsignificant demands on management’s judgments and estimates about matters that areinherently uncertain are discussed below. Management cautions that future events oftenvary from forecasts and that estimates routinely require adjustment.A complete description of Philips’ accounting policies appears on pages 53 through 62
Accounting for pensions and other postretirement benefitsRetirement benefits represent obligations that will be settled in the future and requireassumptions to project benefit obligations and fair values of plan assets. Retirement benefitaccounting is intended to reflect the recognition of future benefit costs over the employee’sapproximate service period, based on the terms of the plans and the investment andfunding decisions made by the Company. The accounting requires management to makeassumptions regarding variables such as discount rate, rate of compensation increase, returnon assets, and future healthcare costs. Management consults with outside actuariesregarding these assumptions at least annually. Changes in these key assumptions can have asignificant impact on the projected benefit obligations, funding requirements and periodiccost incurred.The table below illustrates the approximate impact on 2004 net periodic pension cost(NPPC) if the Company were to change key assumptions by 1 percentage point.
Impact in millions of euros of NPPC expense (income):
Increaseassumption
1%
Decreaseassumption
1%
Discount rate (149) 188
Rate of return on plan assets (177) 177
Salary growth rate 361 (305)
If more than one of the assumptions were changed, the impact would not necessarily be thesame as if only one assumption was changed in isolation. In 2004, pension costs for thePhilips Group are expected to amount to approximately 350 million.For a discussion of the current funded status and pension plan assumptions, refer to note20 of the consolidated financial statements. For a sensitivity analysis with respect tochanges in the assumptions used for postretirement benefits other than pensions, refer tonote 21 of the consolidated financial statements.
Contingent liabilitiesLegal proceedings covering a range of matters are pending in various jurisdictions againstthe Company and its subsidiaries. Due to the uncertainty inherent in litigation, it is oftendifficult to predict the final outcome. The cases and claims against the Company often raisedifficult and complex factual and legal issues which are subject to many uncertainties andcomplexities, including but not limited to the facts and circumstances of each particularcase and claim, the jurisdiction in which each suit is brought and the differences inapplicable law. In the normal course of business, management consults with legal counseland certain other experts on matters related to litigation. The Company accrues a liabilitywhen it is determined that an adverse outcome is probable and the amount of the loss canbe reasonably estimated. If either the likelihood of an adverse outcome is only reasonablypossible or an estimate is not determinable, the matter is disclosed provided it is material.
36 Philips Annual Report 2003
Financial Statements and Analysis
The Company and its subsidiaries are subject to environmental laws and regulations.Under these laws, the Company and its subsidiaries may be required to remediate theeffects of the release or disposal of certain chemicals on the environment.The methodology for determining the level of liability requires a significant amount ofjudgment regarding assumptions and estimates. In determining the accrual for lossesassociated with environmental remediation obligations, such significant judgments relate tothe extent and types of hazardous substances at a site, the various technologies that may beused for remediation, the standards of what constitutes acceptable remediation, the relativerisk of the environmental condition, the number and financial condition of otherpotentially responsible parties, and the extent of the Company’s and/or its subsidiaries’involvement. The Company utilizes experts in the estimation process. However, thesejudgments, by their nature, may result in variances between actual losses and estimates.Accruals for estimated losses from environmental remediation obligations are recognizedwhen information becomes available that allows a reasonable estimate of the liability, or acomponent (i.e. particular tasks) thereof. The accruals are adjusted as further informationbecomes available. Refer to note 26 to the Consolidated Financial Statements for adiscussion of contingent liabilities.
Accounting for income taxesAs part of the process of preparing consolidated financial statements, the Company isrequired to estimate income taxes in each of the jurisdictions. This process involvesestimating actual current tax expense and temporary differences between tax and financialreporting. Temporary differences result in deferred tax assets and liabilities, which areincluded in the consolidated balance sheet. The Company must assess the likelihood thatdeferred tax assets will be recovered from future taxable income. A valuation allowance isrecognized to reduce deferred tax assets if, and to the extent that, it is more likely than notthat all or some portion of the deferred tax assets will not be realized.
The Company has recorded a valuation allowance of 1,065 million as of December 31,2003, based on estimates of taxable income by jurisdiction in which the Companyoperates and the period over which deferred tax assets are recoverable. In the event thatactual results differ from these estimates in future periods, and depending on the taxstrategies that the Company may be able to implement, changes to the valuationallowance could be required, which could impact the Company’s financial position andnet income.In 2003 and 2002, there was a net decrease of the valuation allowance of 184 millionand 9 million, respectively while in 2001, there was a net increase of 293 million.Significant tax assets are recognized in the USA, realization of which is contingent onfuture profitability in the USA.
ImpairmentPhilips reviews long-lived assets for impairment when events or circumstances indicate thatcarrying amounts may not be recoverable. Assets subject to this review include equity andsecurity investments, intangible assets and tangible fixed assets.Impairment of equity and security investments results in a charge to income when a loss inthe value of an investment is deemed to be other than temporary. Management regularlyreviews each equity and security investment for impairment based on the extent to whichcost exceeds market value, the duration of decline in market value and the financialcondition of the issuer.
37Philips Annual Report 2003
In determining impairments of intangible assets, tangible fixed assets and goodwill,management must make significant judgments and estimates to determine whether thecash flows generated by those assets are less than their carrying value. Determining cashflows requires the use of judgments and estimates that have been included in theCompany’s strategic plans and long-range forecasts. The data necessary for the execution ofthe impairment tests are based on management estimates of future cash flows, whichrequire estimating revenue growth rates and profit margins.Assets other than goodwill are written down to their fair value when the undiscounted cashflows are less than the carrying value of the assets. The fair value of impaired assets isdetermined by taking into account these estimated cash flows and using a net present valuetechnique based on discounting these cash flows with the Business-specific WeightedAverage Cost of Capital (WACC), which ranged between 7.7% and 14.2% in 2003.Goodwill is written down to its implied fair value in case of impairment. Thedetermination of such implied fair value involves significant judgment and estimates frommanagement.Changes in assumptions and estimates included within the impairment reviews could resultin significantly different results than those recorded in the financial statements.
Valuation allowances for certain assetsThe Company records its inventories at cost and provides for the risk of obsolescence usingthe lower of cost or market principle. The expected future use of inventory is based onestimates about future demand and past experience with similar inventories and theirusage.The risk of uncollectibility of accounts receivable is primarily estimated based on priorexperience with, and the past due status of, doubtful debtors, while large accounts areassessed individually based on factors that include ability to pay, bankruptcy and paymenthistory. In addition, debtors in certain countries are subject to a higher collectibility riskthat is taken into account when assessing the overall risk of uncollectibility.Should the outcome differ from the assumptions and estimates, revisions to the estimatedvaluation allowances would be required.
Warranty costsThe Company provides for warranty costs based on historical trends in product returnrates and the expected material and labor costs to provide warranty services. If it were toexperience an increase in warranty claims compared with historical experience, or costs ofservicing warranty claims were greater than the expectations on which the accrual had beenbased, income could be adversely affected.
Intangible assets acquired in business combinationsOver the past few years the Company has acquired several other entities in businesscombinations that have been accounted for by the purchase method, resulting inrecognition of substantial amounts of in-process research and development, goodwill andother intangible assets. The amounts assigned to the acquired assets and liabilities are basedon assumptions and estimates about their fair values. In making these estimates,management typically consults independent qualified appraisers. A change in assumptionsand estimates would change the purchase price allocation, which could affect the amountor timing of charges to the income statement, such as write-offs of in-process research anddevelopment and amortization of intangible assets. In-process research and development iswritten off immediately upon acquisition, whereas intangible assets (and prior to 2002 alsogoodwill) are amortized over their economic lives. As a result of Philips’ adoption of SFAS142 ‘Goodwill and Other Intangible Assets’ as of January 1, 2002, goodwill ceased to beamortized as from that date but instead is tested for impairment at least annually.Changes in assumptions and estimates included in the purchase price allocation couldresult in significantly different results than those recorded in the financial statements.
38 Philips Annual Report 2003
Financial Statements and Analysis
Risk Management
Philips is a global company, which means that it is affected by economic developments inall regions of the world. In addition to the risks inherent to its operations, Philips isexposed to specific business risks. In the following paragraphs, a summary of Philips’approach towards risk management and business control is given, followed by a briefdescription of the nature and the extent of its exposure to risks. The risk overview providedis not exhaustive. Some risks not yet known to Philips or currently believed not to bematerial, could later turn out to have a major impact on Philips’ businesses, revenues,income, assets, liquidity or capital resources.
The risk factors should be considered in connection with any forward-looking statements.
Philips’ approach towards risk management and business control
Risk management forms an integral part of business management. The Company’s riskand control policy is designed to provide reasonable assurance that strategic objectives aremet by creating focus, by integrating management control over the Company’s operations,by ensuring compliance with legal requirements and by safeguarding the reliability of thefinancial reporting and its disclosures. It makes management responsible for identifying thecritical business risks and the implementation of fit-for-purpose risk responses. TheCompany’s risk management approach is embedded in the periodic business planning andreview cycle. The Company’s quality program (BEST) is used to evaluate the efficiency andeffectiveness of controls in the business processes. Structured self-assessments are usedcompany-wide to assess, review and monitor compliance with internal control standards toensure reliable financial reporting. Product division management systematically monitorsthe execution and outcome of the assessments. Each quarter product division managementissues a formal certification statement to confirm the adequacy of the design andeffectiveness of internal controls over financial reporting, which is subject to review by theBoard of Management.In addition, the quality of business controls is monitored by internal auditors throughrisk-based operational audits, inspections of the financial reporting controls andcompliance audits.Annually, as part of the Annual Report process, management accountability for businesscontrols is enforced through the formal issuance of a Statement on Business Controls and aLetter of Representation by each business unit, resulting, via a cascade process, in astatement by each product division. The Statements on Business Controls and Letters ofRepresentation are subject to review by the Board of Management.
Internal audit committees at product division, business and regional level meet on a regularbasis to address weaknesses in the business control infrastructure as reported by theauditors and to take corrective action where necessary. These audit committees are alsoinvolved in determining the desired internal audit coverage.The quality of the Company’s systems of business controls and the findings of internal andexternal audits are reported to and discussed in the Audit Committee of the SupervisoryBoard.
Standard norms and values for ‘doing business’ applicable to all our employees andbusiness partners are laid down in the Philips General Business Principles and enforced bya global system of compliance officers. In 2003, the Philips General Business Principleshave been extended to include a Financial Code of Ethics. A structured self-assessmentprocess has been introduced to assist organizations in monitoring compliance with thePhilips General Business Principles.
39Philips Annual Report 2003
Business Risks
As Philips’ business is global, its operations are exposed to political and military developments inthe countries in which it does business, which developments could adversely impact the revenuesand income of Philips. The business environment is influenced by numerous politicaluncertainties, which continue to affect the global economy (and the international capitalmarkets). Political and military developments could have a material adverse effect onPhilips’ results of operations.
Philips has defined-benefit pension plans in a number of countries. The cost of maintaining theseplans is influenced by fluctuating macro-economic and demographic developments, creatingvolatility in Philips’ results. The majority of employees in Europe and North America arecovered by these plans. The accounting for defined-benefit pension plans requiresmanagement to make assumptions regarding variables such as discount rate, rate ofcompensation increase and expected return on plan assets. Changes in these assumptionscan have a significant impact on the projected benefit obligations, funding requirementsand periodic pension cost. A negative performance of the capital market could have amaterial impact on pension expense and on the value of certain financial assets of theCompany.
If the expectations of an upturn in the (cyclical) market in which Semiconductors operates fail tomaterialize, Philips’ results of operations could be adversely affected. As part of an asset-lightstrategy (making more use of external foundry capacity), considerable reductions incapacity and a lower break-even point were achieved in 2003; this resulted in a return toprofitability in the fourth quarter. Although the asset-light strategy should mitigate theimpact of cyclical market movements, a reversal of the upward market trend couldnegatively impact the loading of the manufacturing base, leading to a fall in operationalresults.
If Philips is unable to remain effective in its supply chain management, the Company may beunable to sustain its competitive position in its markets, predominantly in the intenselycompetitive environment of Consumer Electronics. The Consumer Electronics businesses inwhich Philips is engaged are intensely competitive. Accordingly, Philips continually facescompetitive challenges such as rapid technological change, evolving standards, shorteningproduct life cycles and price erosion. Initiatives to reduce assets through outsourcing willrequire increased management focus with respect to the supply base. The realization of aworld-class performance in supply chain management is critical to success in the globalconsumer electronics industry, which now also faces penetration by PC manufacturers withtheir direct-selling models.
A world-class, integrated supply chain in terms of quality, costs and cycle time is one of thecritical success factors for Medical Systems to deliver its profitable growth strategy. During 2003
progress has been made in aligning business processes, systems, procedures and internalcontrols to harvest synergies. The implementation of a fully integrated, reliable andcost-effective supply chain and supporting information technology infrastructure operatingat world-class levels in a well controlled way is a prerequisite for meeting the growingdemand for faster delivery of top-quality products and services in an increasinglycompetitive environment.
Philips’ extensive use of joint ventures and other strategic alliances may result in conflicts ofinterest, loss of control over investments and loss of control over proprietary technologies. Philipsoperates in high-tech markets with rapid technological development, which require theCompany to make large financial investments. Philips continues to utilize partnerships inorder to share the risks associated with large investments. These partnerships take placethrough minority shareholdings, joint ventures and majority shareholdings.
40 Philips Annual Report 2003
Financial Statements and Analysis
Managing this growing number of strategic alliances, and in particular bridging theinternational, legal and cultural differences, is a growing risk in itself. In addition, Philipsmay face conflicts of interests, loss of control over cash flows and loss of proprietarytechnologies by participating in joint ventures.
Philips’ success is dependent on technological innovation and its ability to secure and retainintellectual property rights for its products. Philips’ longer-term success depends ontechnological innovation, global standards and its ability to obtain and retain licenses andother intellectual property rights covering its products and its design and manufacturingprocesses. The process of seeking intellectual property protection can be long andexpensive. Competitors and other third parties may also develop technologies that areprotected by patents and other intellectual property rights. These technologies maytherefore not be available to Philips or may be made available to Philips only onunfavorable terms and conditions. If Philips is not able to generate new licenses, Philipsmight lose a substantial part of its license revenue.
Philips is dependent on a decreasing number of business partners. Further globalization andconcentration of our customer and supply base makes Philips increasingly dependent on alimited number of business partners, posing challenges to existing management and controlstructures in many of our businesses.
Because Philips is dependent on its personnel for highly specialized technical and other skills, theloss of its ability to attract and retain such personnel would have an adverse affect on its business.A critical risk area that has management’s attention is human resources. The retention ofhighly specialized technical personnel, as well as talented employees in sales and marketing,research and development, finance and general management, is critical to the success of theCompany.
Philips’ global presence exposes the Company to regional and local regulatory rules, which mayinterfere with the realization of business opportunities and investments in the countries in whichthe Company operates. Being a global company, Philips has established subsidiaries in over60 countries. The subsidiaries are exposed to changes in governmental regulations andunfavorable political developments, which may limit the realization of businessopportunities or impair local Philips investment.
Philips is exposed to a variety of financial risks, including currency fluctuations, interest ratefluctuations, equity price risk and credit risk, which may impact Philips’ results. Currencyfluctuations may impact Philips’ financial results. Furthermore, Philips is exposed tointerest rate risk, commodity price risk, equity price risk and credit risk. Philips ownsavailable-for-sale securities and is a minority shareholder in a number of participations, ofwhich the market value currently exceeds the equity investment reported in the financialstatements. Sale of (part of) these assets would positively influence Philips’ net income.Decline of the market value of these investments could result in future impairments. Forqualitative and quantitative disclosure about financial risks, please refer to note 34 of theconsolidated financial statements.
41Philips Annual Report 2003
Governance
Corporate governancePhilips has pursued a consistent policy to enhance and improve its corporate governance inline with US, Dutch and international codes of best practises. A series of reorganizations ofits corporate and Board structure resulted in enhanced transparency of its management andoversight structure. Philips also aims for a fair disclosure practice in its investor relationspolicy.
As its shares are traded in the capital market, Philips adheres to the recent changesunder the US Sarbanes-Oxley Act. A new Dutch code on corporate governance waspublished on December 9, 2003, which is expected to be supported by a governmentaldecree requiring disclosure in the annual report of information regarding the applicationof the code’s rules, or an explanation if rules have not been applied. It is expected thatsuch disclosure will only be mandatory from the fiscal year 2004 onwards. Philipsaddresses the way it intends to further implement its overall corporate governancestructure on pages 146 through 159.
Business ExcellenceIn 2003 further progress was made in the implementation of the quality program BEST(Business Excellence through Speed and Teamwork). Most operations have successfullycompleted the transition to the new ISO 9000 standard. Supplemented with dedicatedsurveys of the key business processes, this provides a solid foundation for continuousquality improvement. Assessments of all our businesses by management teams and theirpeers using the EFQM model complete the approach to identify further improvementopportunities on the journey towards excellence.
Particular attention has been paid to focusing the improvement effort on the areas mostcrucial to the business. Together with an increased use of the Business Balanced Scorecard,the One Page Strategy document was deployed company-wide. This helped tocommunicate the businesses’ mission, vision and strategy to their employees, enhancingalignment with the common goals. Furthermore in a number of top-priority areas anapproach for breakthrough management was introduced to help managers create the rightconditions for successful improvement programs and accelerate performancebreakthroughs.
42 Philips Annual Report 2003
Financial Statements and Analysis
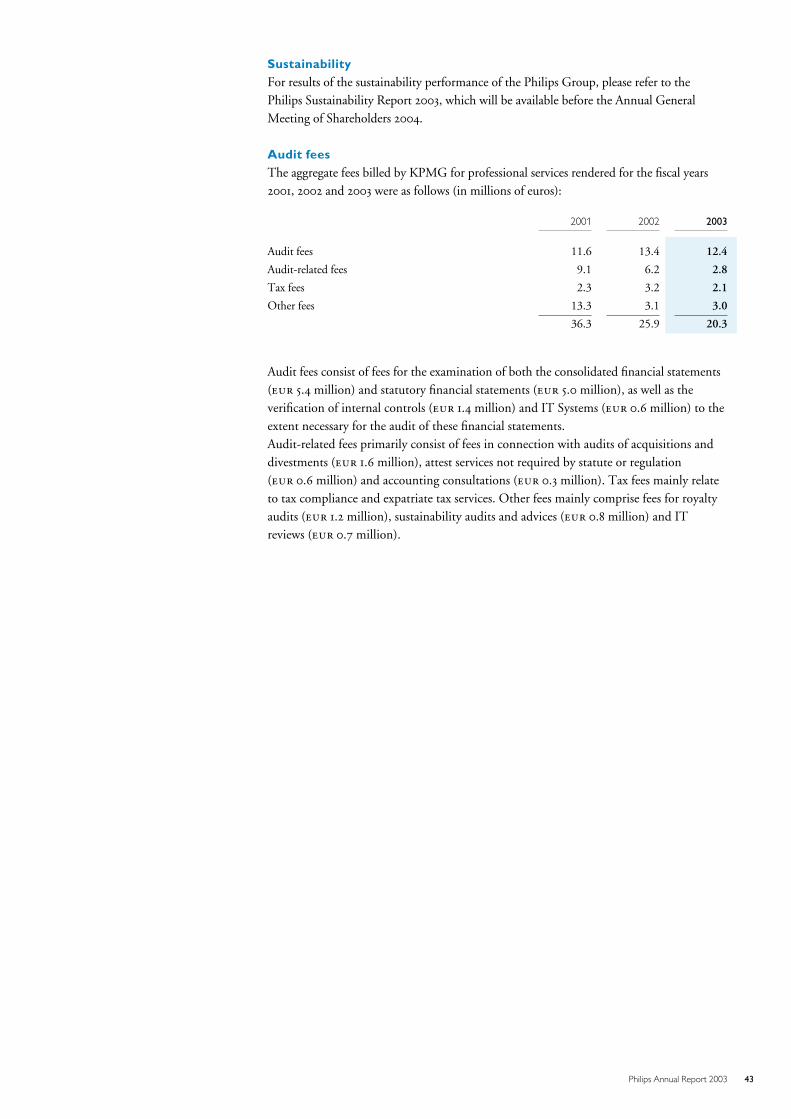
SustainabilityFor results of the sustainability performance of the Philips Group, please refer to thePhilips Sustainability Report 2003, which will be available before the Annual GeneralMeeting of Shareholders 2004.
Audit feesThe aggregate fees billed by KPMG for professional services rendered for the fiscal years2001, 2002 and 2003 were as follows (in millions of euros):
2001 2002 2003
Audit fees 11.6 13.4 12.4
Audit-related fees 9.1 6.2 2.8
Tax fees 2.3 3.2 2.1
Other fees 13.3 3.1 3.0
36.3 25.9 20.3
Audit fees consist of fees for the examination of both the consolidated financial statements( 5.4 million) and statutory financial statements ( 5.0 million), as well as theverification of internal controls ( 1.4 million) and IT Systems ( 0.6 million) to theextent necessary for the audit of these financial statements.Audit-related fees primarily consist of fees in connection with audits of acquisitions anddivestments ( 1.6 million), attest services not required by statute or regulation( 0.6 million) and accounting consultations ( 0.3 million). Tax fees mainly relateto tax compliance and expatriate tax services. Other fees mainly comprise fees for royaltyaudits ( 1.2 million), sustainability audits and advices ( 0.8 million) and ITreviews ( 0.7 million).
43Philips Annual Report 2003
Subsequent events
On September 22, 2003, Atos Origin announced that it had signed an agreement to acquirethe core IT services activities of Schlumberger Sema from Schlumberger. The transactionhas been approved by Atos Origin’s shareholders meeting in January 2004.As consideration for the purchase, Atos Origin will deliver 19.3 million shares toSchlumberger together with 400 million in cash. The transaction, based on thevolume-weighted average price of Atos Origin shares for the 20 days precedingSeptember 19, 2003 ( 45.90), values the purchase consideration at 1,287 million.As a result, Philips’ shareholding will be further diluted from 44.7% to 31.8%, resulting inan expected non-cash and non-operating dilution gain of approximately 120 million(based on Atos Origin’s September 2003 equity position), to be recorded in Philips’results for the first quarter of 2004.
On January 30, 2004 the Company reached an agreement in principle with the tradeunions in the Netherlands that will result in reduced pension obligations and a lower riskprofile for the Company’s pension exposure. The agreement still needs to be ratified bythe unions’ members. In view of the remaining uncertainties the final impact of theagreement on the pension obligations and future pension costs of the Company cannotyet be determined.
Outlook
Building on the achievements of 2003, we expect to sustain our improvement momentum.We will keep growing our Medical business, as we move toward achieving our 2004
profitability target of 14% EBITA.
Now that we have achieved break-even in CE in the US in the fourth quarter, one of ourtop priorities will be to achieve full profitability in this business in 2004, through our CEbusiness renewal program, which aims to trim an additional 400 million off of CE’scost structure by the end of 2005.With an emerging turnaround in the markets for our semiconductor products, we expectto benefit from additional design wins for our Nexperia solutions, and anticipate a solidperformance in this business this year.We will implement our growth plans for Asia, and in particular China, in the context ofour management agenda in 2004, as the Company explores avenues for meetingconsumers’ demands in these major developing markets.In Lighting and DAP we target additional markets for our innovative products whilefurther optimizing our operations.
Measures to make Philips a more truly market-driven company will continue, including agreater focus on the corporate brand.Further savings on indirect costs will be pursued as part of the One Philips program.During 2004 realizing our management agenda will bring us closer to our financial andstrategic objectives.
February 6, 2004
Board of Management
44 Philips Annual Report 2003
Financial Statements and Analysis
Auditors’ Report
We have audited the consolidated balance sheets of Koninklijke Philips Electronics N.V.and subsidiaries as of December 31, 2003 and 2002, and the related consolidated statementsof income, changes in stockholders’ equity, and cash flows for each of the years in thethree-year period ended December 31, 2003, appearing on pages 46 to 127. Theseconsolidated financial statements are the responsibility of the Company’s management.Our responsibility is to express an opinion on these consolidated financial statements basedon our audits.
We conducted our audits in accordance with auditing standards generally accepted in theUnited States of America and the Netherlands. Those standards require that we plan andperform the audit to obtain reasonable assurance about whether the consolidated financialstatements are free of material misstatement. An audit includes examining, on a test basis,evidence supporting the amounts and disclosures in the financial statements. An audit alsoincludes assessing the accounting principles used and significant estimates made bymanagement, as well as evaluating the overall financial statement presentation. We believethat our audits provide a reasonable basis for our opinion.
In our opinion, the consolidated financial statements referred to above present fairly, in allmaterial respects, the financial position of Koninklijke Philips Electronics N.V. andsubsidiaries as of December 31, 2003 and 2002, and the results of their operations and theircash flows for each of the years in the three-year period ended December 31, 2003, inaccordance with accounting principles generally accepted in the United States of America.
Eindhoven, February 6, 2004
KPMG Accountants N.V.
45Philips Annual Report 2003
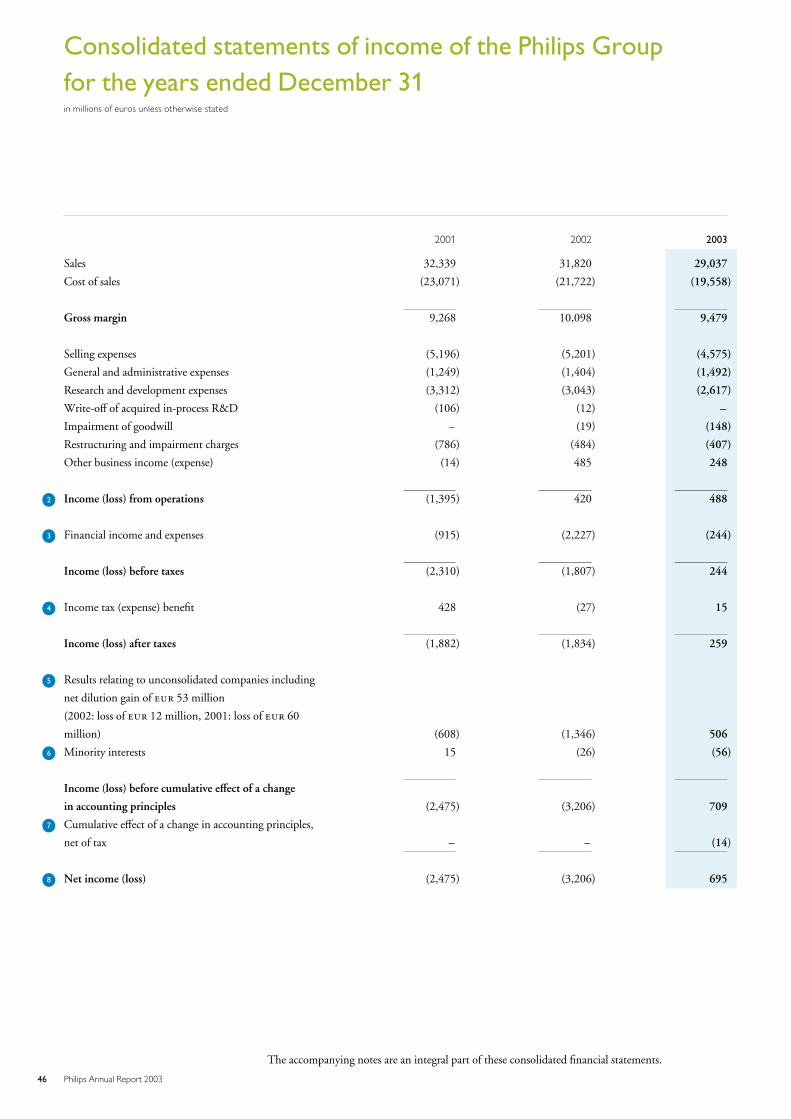
Consolidated statements of income of the Philips Groupfor the years ended December 31in millions of euros unless otherwise stated
2001 2002 2003
Sales 32,339 31,820 29,037
Cost of sales (23,071) (21,722) (19,558)
Gross margin 9,268 10,098 9,479
Selling expenses (5,196) (5,201) (4,575)
General and administrative expenses (1,249) (1,404) (1,492)
Research and development expenses (3,312) (3,043) (2,617)
Write-off of acquired in-process R&D (106) (12) –
Impairment of goodwill – (19) (148)
Restructuring and impairment charges (786) (484) (407)
Other business income (expense) (14) 485 248
L2 Income (loss) from operations (1,395) 420 488
L3 Financial income and expenses (915) (2,227) (244)
Income (loss) before taxes (2,310) (1,807) 244
L4 Income tax (expense) benefit 428 (27) 15
Income (loss) after taxes (1,882) (1,834) 259
L5 Results relating to unconsolidated companies including
net dilution gain of 53 million
(2002: loss of 12 million, 2001: loss of 60
million) (608) (1,346) 506
L6 Minority interests 15 (26) (56)
Income (loss) before cumulative effect of a change
in accounting principles (2,475) (3,206) 709
L7 Cumulative effect of a change in accounting principles,
net of tax – – (14)
L8 Net income (loss) (2,475) (3,206) 695
The accompanying notes are an integral part of these consolidated financial statements.
46 Philips Annual Report 2003
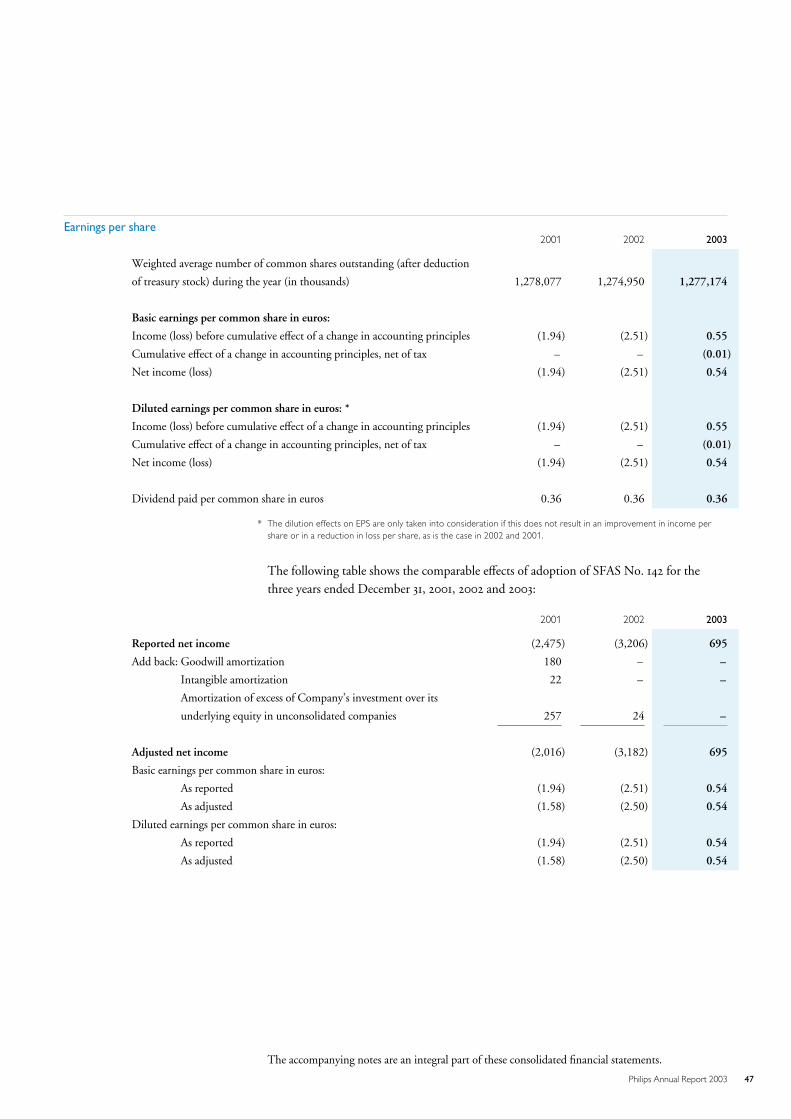
Earnings per share2001 2002 2003
Weighted average number of common shares outstanding (after deduction
of treasury stock) during the year (in thousands) 1,278,077 1,274,950 1,277,174
Basic earnings per common share in euros:
Income (loss) before cumulative effect of a change in accounting principles (1.94) (2.51) 0.55
Cumulative effect of a change in accounting principles, net of tax – – (0.01)
Net income (loss) (1.94) (2.51) 0.54
Diluted earnings per common share in euros: *
Income (loss) before cumulative effect of a change in accounting principles (1.94) (2.51) 0.55
Cumulative effect of a change in accounting principles, net of tax – – (0.01)
Net income (loss) (1.94) (2.51) 0.54
Dividend paid per common share in euros 0.36 0.36 0.36
* The dilution effects on EPS are only taken into consideration if this does not result in an improvement in income pershare or in a reduction in loss per share, as is the case in 2002 and 2001.
The following table shows the comparable effects of adoption of SFAS No. 142 for thethree years ended December 31, 2001, 2002 and 2003:
2001 2002 2003
Reported net income (2,475) (3,206) 695
Add back: Goodwill amortization 180 – –
Intangible amortization 22 – –
Amortization of excess of Company’s investment over its
underlying equity in unconsolidated companies 257 24 –
Adjusted net income (2,016) (3,182) 695
Basic earnings per common share in euros:
As reported (1.94) (2.51) 0.54
As adjusted (1.58) (2.50) 0.54
Diluted earnings per common share in euros:
As reported (1.94) (2.51) 0.54
As adjusted (1.58) (2.50) 0.54
The accompanying notes are an integral part of these consolidated financial statements.
47Philips Annual Report 2003
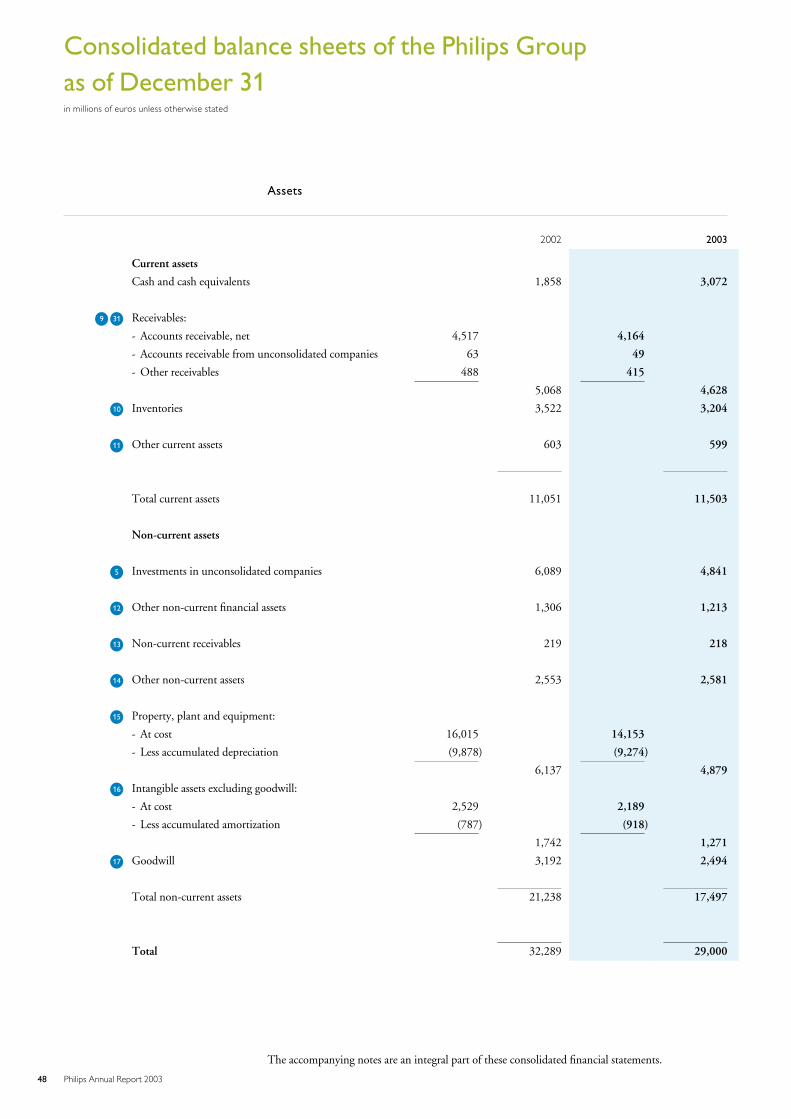
Consolidated balance sheets of the Philips Groupas of December 31in millions of euros unless otherwise stated
Assets
2002 2003
Current assets
Cash and cash equivalents 1,858 3,072
L9 L31 Receivables:
- Accounts receivable, net 4,517 4,164
- Accounts receivable from unconsolidated companies 63 49
- Other receivables 488 415
5,068 4,628
L10 Inventories 3,522 3,204
L11 Other current assets 603 599
Total current assets 11,051 11,503
Non-current assets
L5 Investments in unconsolidated companies 6,089 4,841
L12 Other non-current financial assets 1,306 1,213
L13 Non-current receivables 219 218
L14 Other non-current assets 2,553 2,581
L15 Property, plant and equipment:
- At cost 16,015 14,153
- Less accumulated depreciation (9,878) (9,274)
6,137 4,879
L16 Intangible assets excluding goodwill:
- At cost 2,529 2,189
- Less accumulated amortization (787) (918)
1,742 1,271
L17 Goodwill 3,192 2,494
Total non-current assets 21,238 17,497
Total 32,289 29,000
The accompanying notes are an integral part of these consolidated financial statements.
48 Philips Annual Report 2003
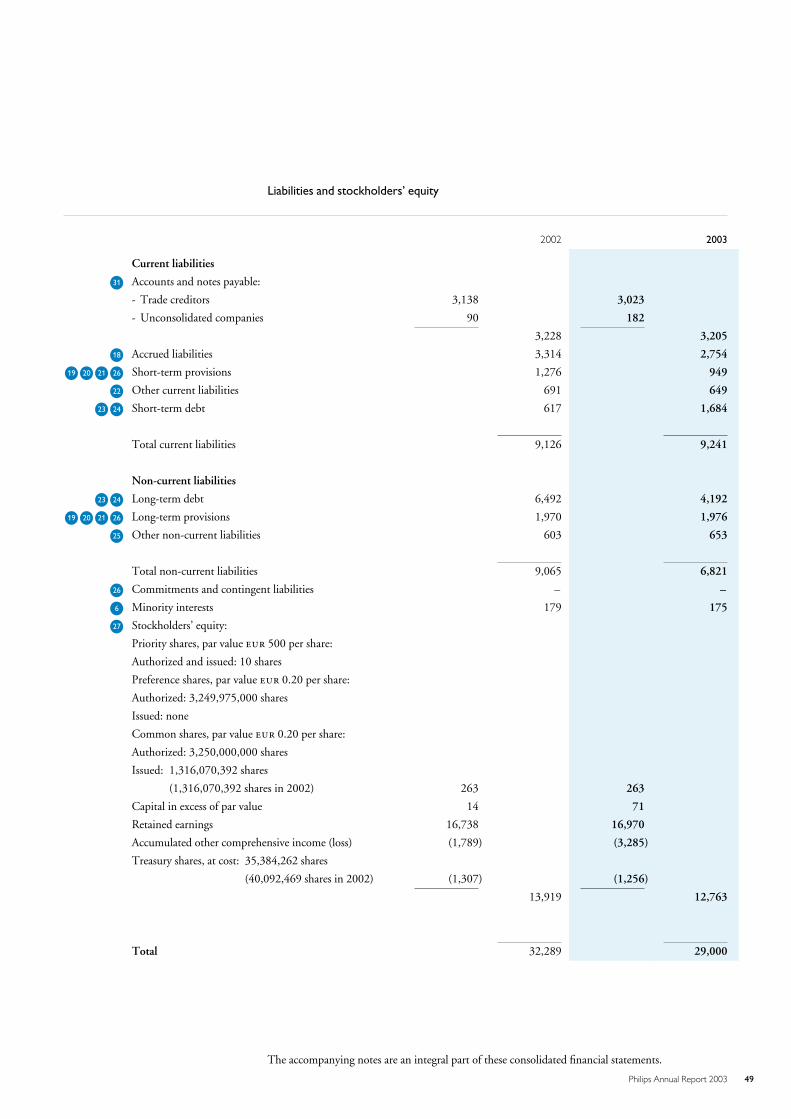
Liabilities and stockholders’ equity
2002 2003
Current liabilities
L31 Accounts and notes payable:
- Trade creditors 3,138 3,023
- Unconsolidated companies 90 182
3,228 3,205
L18 Accrued liabilities 3,314 2,754
L19 L20 L21 L26 Short-term provisions 1,276 949
L22 Other current liabilities 691 649
L23 L24 Short-term debt 617 1,684
Total current liabilities 9,126 9,241
Non-current liabilities
L23 L24 Long-term debt 6,492 4,192
L19 L20 L21 L26 Long-term provisions 1,970 1,976
L25 Other non-current liabilities 603 653
Total non-current liabilities 9,065 6,821
L26 Commitments and contingent liabilities – –
L6 Minority interests 179 175
L27 Stockholders’ equity:
Priority shares, par value 500 per share:
Authorized and issued: 10 shares
Preference shares, par value 0.20 per share:
Authorized: 3,249,975,000 shares
Issued: none
Common shares, par value 0.20 per share:
Authorized: 3,250,000,000 shares
Issued: 1,316,070,392 shares
(1,316,070,392 shares in 2002) 263 263
Capital in excess of par value 14 71
Retained earnings 16,738 16,970
Accumulated other comprehensive income (loss) (1,789) (3,285)
Treasury shares, at cost: 35,384,262 shares
(40,092,469 shares in 2002) (1,307) (1,256)
13,919 12,763
Total 32,289 29,000
The accompanying notes are an integral part of these consolidated financial statements.
49Philips Annual Report 2003
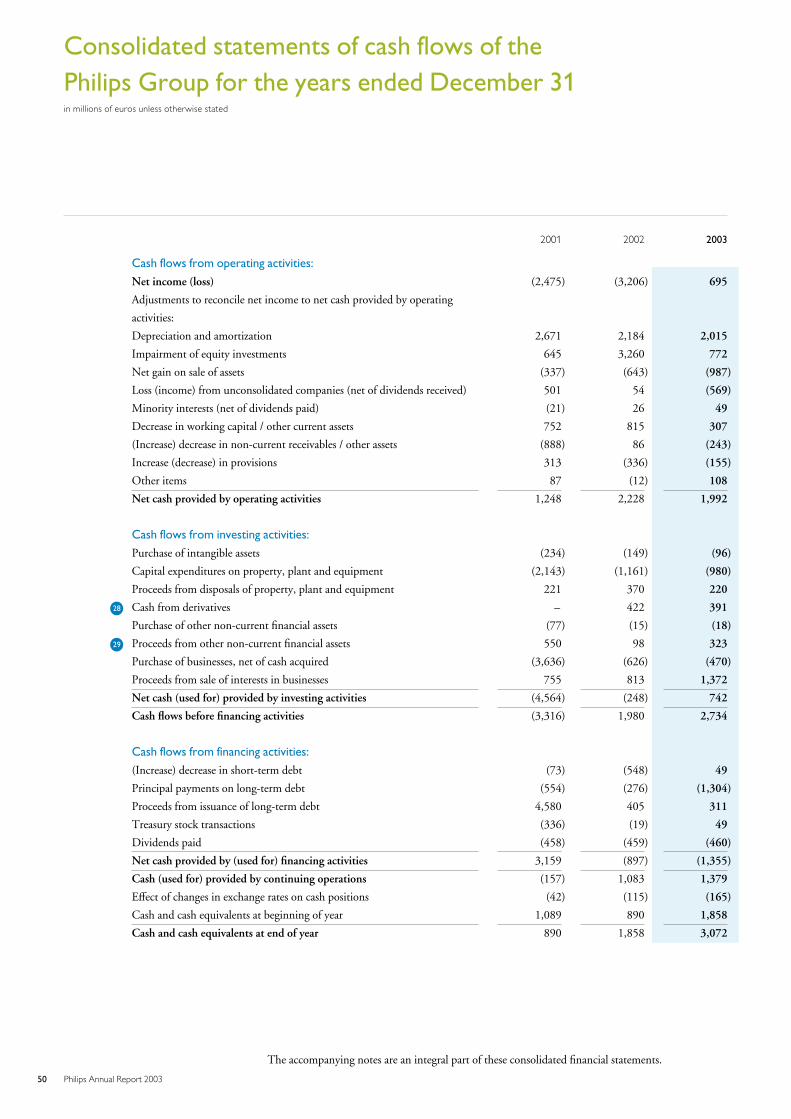
Consolidated statements of cash flows of thePhilips Group for the years ended December 31in millions of euros unless otherwise stated
2001 2002 2003
Cash flows from operating activities:
Net income (loss) (2,475) (3,206) 695
Adjustments to reconcile net income to net cash provided by operating
activities:
Depreciation and amortization 2,671 2,184 2,015
Impairment of equity investments 645 3,260 772
Net gain on sale of assets (337) (643) (987)
Loss (income) from unconsolidated companies (net of dividends received) 501 54 (569)
Minority interests (net of dividends paid) (21) 26 49
Decrease in working capital / other current assets 752 815 307
(Increase) decrease in non-current receivables / other assets (888) 86 (243)
Increase (decrease) in provisions 313 (336) (155)
Other items 87 (12) 108
Net cash provided by operating activities 1,248 2,228 1,992
Cash flows from investing activities:
Purchase of intangible assets (234) (149) (96)
Capital expenditures on property, plant and equipment (2,143) (1,161) (980)
Proceeds from disposals of property, plant and equipment 221 370 220
L28 Cash from derivatives – 422 391
Purchase of other non-current financial assets (77) (15) (18)
L29 Proceeds from other non-current financial assets 550 98 323
Purchase of businesses, net of cash acquired (3,636) (626) (470)
Proceeds from sale of interests in businesses 755 813 1,372
Net cash (used for) provided by investing activities (4,564) (248) 742
Cash flows before financing activities (3,316) 1,980 2,734
Cash flows from financing activities:
(Increase) decrease in short-term debt (73) (548) 49
Principal payments on long-term debt (554) (276) (1,304)
Proceeds from issuance of long-term debt 4,580 405 311
Treasury stock transactions (336) (19) 49
Dividends paid (458) (459) (460)
Net cash provided by (used for) financing activities 3,159 (897) (1,355)
Cash (used for) provided by continuing operations (157) 1,083 1,379
Effect of changes in exchange rates on cash positions (42) (115) (165)
Cash and cash equivalents at beginning of year 1,089 890 1,858
Cash and cash equivalents at end of year 890 1,858 3,072
The accompanying notes are an integral part of these consolidated financial statements.
50 Philips Annual Report 2003
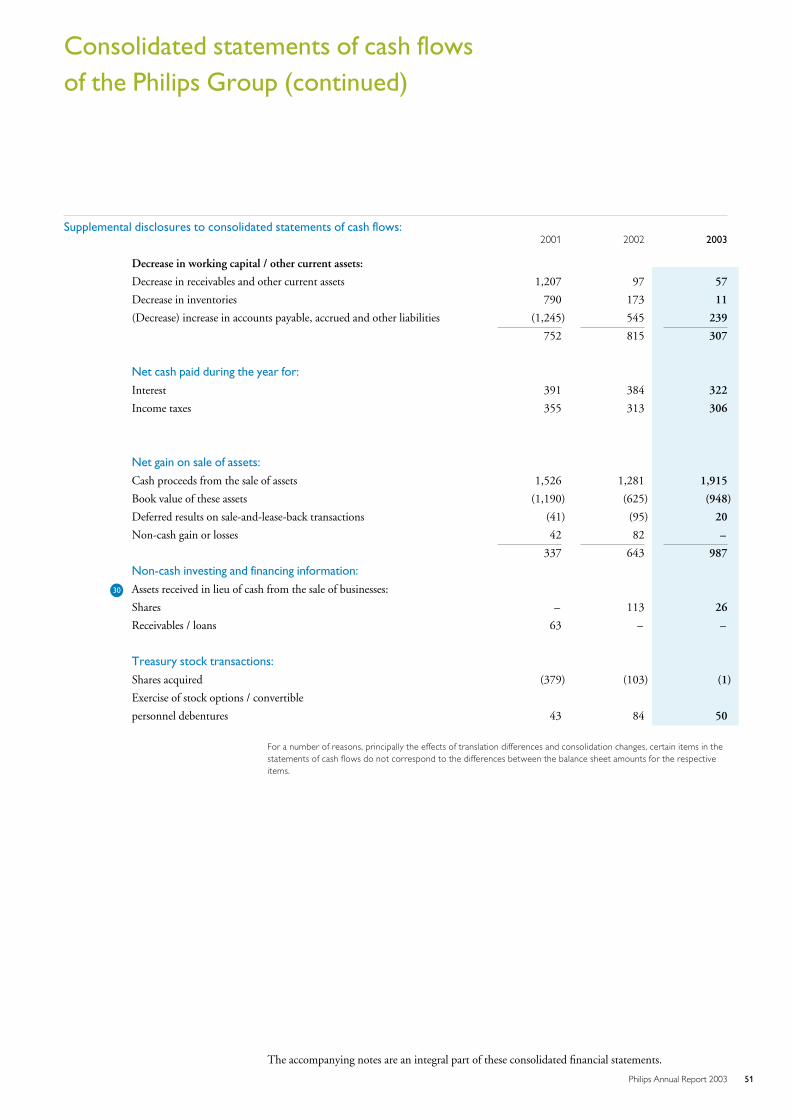
Consolidated statements of cash flowsof the Philips Group (continued)
Supplemental disclosures to consolidated statements of cash flows:2001 2002 2003
Decrease in working capital / other current assets:
Decrease in receivables and other current assets 1,207 97 57
Decrease in inventories 790 173 11
(Decrease) increase in accounts payable, accrued and other liabilities (1,245) 545 239
752 815 307
Net cash paid during the year for:
Interest 391 384 322
Income taxes 355 313 306
Net gain on sale of assets:
Cash proceeds from the sale of assets 1,526 1,281 1,915
Book value of these assets (1,190) (625) (948)
Deferred results on sale-and-lease-back transactions (41) (95) 20
Non-cash gain or losses 42 82 –
337 643 987
Non-cash investing and financing information:
L30 Assets received in lieu of cash from the sale of businesses:
Shares – 113 26
Receivables / loans 63 – –
Treasury stock transactions:
Shares acquired (379) (103) (1)
Exercise of stock options / convertible
personnel debentures 43 84 50
For a number of reasons, principally the effects of translation differences and consolidation changes, certain items in thestatements of cash flows do not correspond to the differences between the balance sheet amounts for the respectiveitems.
The accompanying notes are an integral part of these consolidated financial statements.
51Philips Annual Report 2003
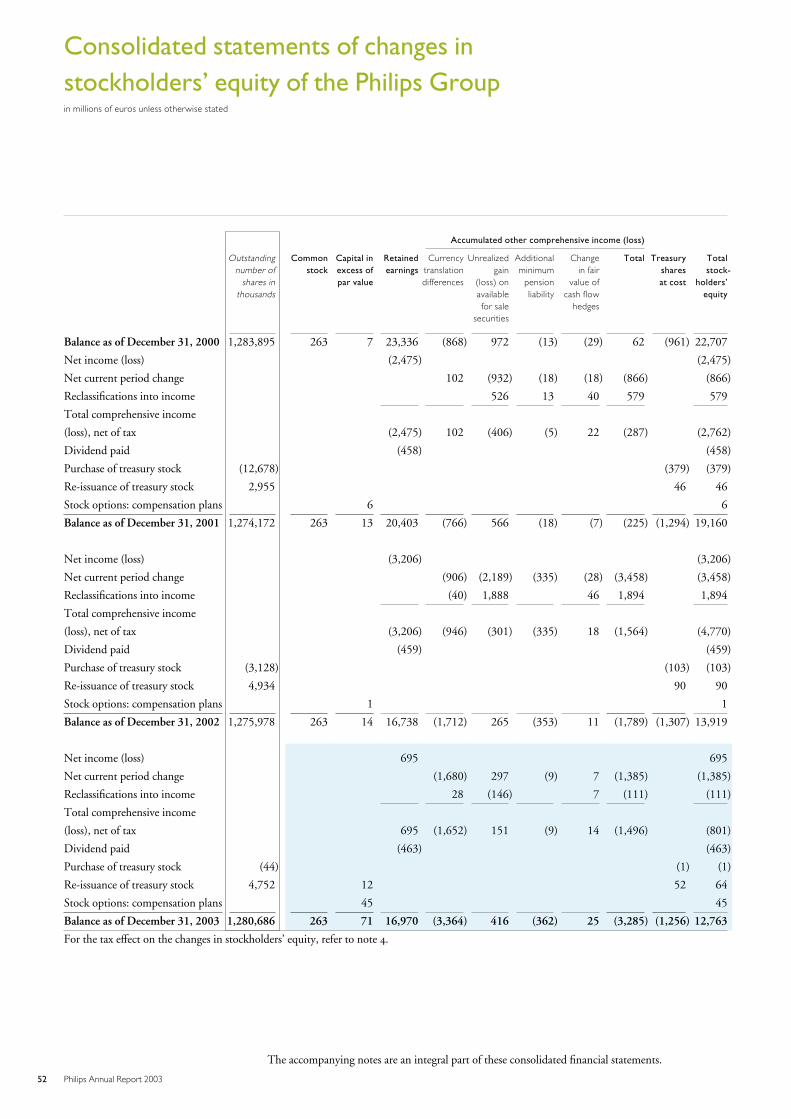
Consolidated statements of changes instockholders’ equity of the Philips Groupin millions of euros unless otherwise stated
Accumulated other comprehensive income (loss)
Outstandingnumber of
shares inthousands
Commonstock
Capital inexcess ofpar value
Retainedearnings
Currencytranslationdifferences
Unrealizedgain
(loss) onavailablefor sale
securities
Additionalminimum
pensionliability
Changein fair
value ofcash flow
hedges
Total Treasurysharesat cost
Totalstock-
holders’equity
Balance as of December 31, 2000 1,283,895 263 7 23,336 (868) 972 (13) (29) 62 (961) 22,707
Net income (loss) (2,475) (2,475)
Net current period change 102 (932) (18) (18) (866) (866)
Reclassifications into income 526 13 40 579 579
Total comprehensive income
(loss), net of tax (2,475) 102 (406) (5) 22 (287) (2,762)
Dividend paid (458) (458)
Purchase of treasury stock (12,678) (379) (379)
Re-issuance of treasury stock 2,955 46 46
Stock options: compensation plans 6 6
Balance as of December 31, 2001 1,274,172 263 13 20,403 (766) 566 (18) (7) (225) (1,294) 19,160
Net income (loss) (3,206) (3,206)
Net current period change (906) (2,189) (335) (28) (3,458) (3,458)
Reclassifications into income (40) 1,888 46 1,894 1,894
Total comprehensive income
(loss), net of tax (3,206) (946) (301) (335) 18 (1,564) (4,770)
Dividend paid (459) (459)
Purchase of treasury stock (3,128) (103) (103)
Re-issuance of treasury stock 4,934 90 90
Stock options: compensation plans 1 1
Balance as of December 31, 2002 1,275,978 263 14 16,738 (1,712) 265 (353) 11 (1,789) (1,307) 13,919
Net income (loss) 695 695
Net current period change (1,680) 297 (9) 7 (1,385) (1,385)
Reclassifications into income 28 (146) 7 (111) (111)
Total comprehensive income
(loss), net of tax 695 (1,652) 151 (9) 14 (1,496) (801)
Dividend paid (463) (463)
Purchase of treasury stock (44) (1) (1)
Re-issuance of treasury stock 4,752 12 52 64
Stock options: compensation plans 45 45
Balance as of December 31, 2003 1,280,686 263 71 16,970 (3,364) 416 (362) 25 (3,285) (1,256) 12,763
For the tax effect on the changes in stockholders’ equity, refer to note 4.
The accompanying notes are an integral part of these consolidated financial statements.
52 Philips Annual Report 2003
Accounting policies
The consolidated financial statements are prepared in accordance with generally acceptedaccounting principles in the United States of America (‘US GAAP’). The Companyadopted the application of US GAAP as of January 1, 2002. The 2001 statements wererestated for this effect, with recognition of the effect in stockholders’ equity as of thebeginning of the earliest period presented. Historical cost is used as the measurement basisunless otherwise indicated.
Consolidation principles
The consolidated financial statements include the accounts of Koninklijke PhilipsElectronics N.V. (‘Royal Philips Electronics’) and all entities in which a direct or indirectcontrolling interest exists through voting rights or qualifying variable interests in special-purpose entities. All intercompany balances and transactions have been eliminated inconsolidation. Net income is reduced by the portion of the earnings of subsidiariesapplicable to minority interests. The minority interests are disclosed separately in theconsolidated statements of income and in the consolidated balance sheets.
Investments in unconsolidated companies
Investments in companies in which Royal Philips Electronics does not have the ability todirectly or indirectly control the financial and operating decisions, but does possess theability to exert significant influence, are accounted for using the equity method. Generally,in the absence of demonstrable proof of significant influence, it can be presumed to exist ifat least 20% of the voting stock is owned. The Company’s share of the net income of thesecompanies is included in results relating to unconsolidated companies in the consolidatedstatements of income. The Company recognizes an impairment loss when another-than-temporary decline in the value of an investment occurs.
Accounting for capital transactions of a subsidiary or an unconsolidated company
The Company recognizes dilution gains or losses arising from the sale or issuance of stockby a consolidated subsidiary or an unconsolidated entity which the Company is accountingfor using the equity method of accounting in the income statement, unless the Companyor the subsidiary either has or plans to reacquire such shares. In such instances the result ofthe transaction will be recorded directly in stockholders’ equity.The dilution gains or losses are presented in the income statement in the caption otherbusiness income (expenses) if they relate to consolidated subsidiaries. Dilution gains andlosses related to unconsolidated companies are presented in the caption results relating tounconsolidated companies.
Foreign currencies
The financial statements of foreign entities are translated into euros. Assets and liabilitiesare translated using the exchange rates on the respective balance sheet dates. Income andexpense items are translated at weighted average exchange rates during the year. Theresulting translation adjustments are recorded as a separate component of othercomprehensive income (loss) within stockholders’ equity. Cumulative translationadjustments are recognized as income or expense upon disposal or liquidation of a foreignentity.
53Philips Annual Report 2003
The functional currency of foreign entities is generally the local currency, unless theprimary economic environment requires the use of another currency. When foreign entitiesconduct their business in economies considered to be highly inflationary, they recordtransactions in the Company’s reporting currency (the euro) instead of their local currency.Gains and losses arising from the translation or settlement of foreign-currency-denominated monetary assets and liabilities into the local currency are recognized inincome in the period in which they arise. However, currency differences on intercompanyloans that have the nature of a permanent investment are accounted for as translationdifferences as a separate component of other comprehensive income (loss) withinstockholders’ equity.
Derivative financial instruments
The Company uses derivative financial instruments principally in the management of itsforeign currency risks and to a more limited extent for interest rate and commodity pricerisks. Applying Statement of Financial Accounting Standards (SFAS) No. 133, ‘Accountingfor Derivative Instruments and Hedging Activities’, and SFAS No. 138, ‘Accounting forCertain Derivative Instruments and Certain Hedging Activities’, the Company measuresall derivative financial instruments based on fair values derived from market prices of theinstruments or from option pricing models, as appropriate. Gains or losses arising fromchanges in the fair value of the instruments are recognized in the income statement duringthe period in which they arise to the extent that the derivatives have been designated as ahedge of recognized assets or liabilities, or to the extent that the derivatives have nohedging designation or are ineffective. The gains and losses on the designated derivativessubstantially offset the changes in the values of the recognized hedged items, which are alsorecognized as gains and losses in the income statement.
Changes in the fair value of a derivative that is highly effective and that is designated andqualifies as a fair value hedge, along with the loss or gain on the hedged asset or liability orunrecognized firm commitment of the hedged item that is attributable to the hedged risk,are recorded in the income statement.
Changes in the fair value of a derivative that is highly effective and that is designated andqualifies as a cash flow hedge, are recorded in accumulated other comprehensive income,until earnings are affected by the variability in cash flows of the designated hedged item.Changes in the fair value of derivatives that are highly effective as hedges and that aredesignated and qualify as foreign currency hedges are recorded in either earnings oraccumulated other comprehensive income, depending on whether the hedge transaction isa fair value hedge or a cash flow hedge.
The Company formally assesses, both at the hedge’s inception and on an ongoing basis,whether the derivatives that are used in hedging transactions are highly effective inoffsetting changes in fair values or cash flows of hedged items. When it is established that aderivative is not highly effective as a hedge or that it has ceased to be a highly effectivehedge, the Company discontinues hedge accounting prospectively. When hedgeaccounting is discontinued because it has been established that the derivative no longerqualifies as an effective fair value hedge, the Company continues to carry the derivative onthe balance sheet at its fair value, and no longer adjusts the hedged asset or liability forchanges in fair value. When hedge accounting is discontinued because it is probable that aforecasted transaction will not occur within a period of two months from the originallyforecasted transaction date, the Company continues to carry the derivative on the balancesheet at its fair value, and gains and losses that were accumulated in other comprehensiveincome are recognized immediately in earnings. In all other situations in which hedgeaccounting is discontinued, the Company continues to carry the derivative at its fair valueon the balance sheet, and recognizes any changes in its fair value in earnings.
54 Philips Annual Report 2003
Financial Statements and Analysis
For interest rate swaps that are unwound, the gain or loss upon unwinding is released toincome over the remaining life of the underlying financial instruments, based on therecalculated effective yield.
Cash and cash equivalents
Cash and cash equivalents include all cash balances and short-term highly liquidinvestments with an original maturity of three months or less that are readily convertibleinto known amounts of cash. They are stated at face value.
Investments
The Company classifies its investments in equity securities that have readily determinablefair values as either available-for-sale or for trading purposes. Investments in debt securitiesare classified in one of three categories: trading, available-for-sale or held-to-maturity.Trading securities are bought and held principally for the purpose of selling them in theshort term. Held-to-maturity securities are those debt securities in which the Company hasthe ability and intent to hold the security until maturity. All securities not included intrading or held-to-maturity are classified as available-for-sale. Trading and available-for-salesecurities are recorded at fair value. Held-to-maturity debt securities are recorded atamortized cost, adjusted for the amortization or accretion of premiums or discounts usingthe effective interest method. Unrealized holding gains and losses, net of the related taxeffect, on available-for-sale securities are excluded from earnings and are reported as aseparate component of other comprehensive income within stockholders’ equity untilrealized. Realized gains and losses from the sale of available-for-sale securities are generallydetermined on a first-in, first-out basis.A decline in the market value of any available-for-sale security or held-to-maturity securitybelow cost that is deemed to be other than temporary results in a reduction in the carryingamount to fair value. The impairment is charged to earnings and a new cost basis for thesecurity is established. Dividend and interest income are recognized when earned. Gains orlosses, if any, are recorded in financial income and expenses.For available-for-sale securities hedged under a fair value hedge, the changes in the fairvalue that are attributable to the risk which is being hedged are recognized in earningsrather than in other comprehensive income.Investments in privately-held companies are carried at cost, or estimated fair value if another-than-temporary decline in value has occurred.
Receivables
Receivables are carried at face value, net of allowances for doubtful accounts anduncollectible amounts. As soon as trade accounts receivable can no longer be collected inthe normal way and are expected to result in a loss, they are designated as doubtful tradeaccounts receivable and valued at the expected collectible amounts. They are written off
when they are deemed to be uncollectible because of bankruptcy or other forms ofreceivership of the debtors.
Valuation adjustment for doubtful trade accounts receivable
The allowance for the risk of non-collection of trade accounts receivable is determined inthree stages. First, individual debtors that represent 3% or more of the debtor portfolio areassessed for creditworthiness based on external and internal sources of information;management decides upon an allowance based on that information and the specificcircumstances for that debtor which might require a value adjustment. In the second stage,for all other debtors the allowance is calculated based on a percentage of average historicallosses. Finally, if, owing to specific circumstances such as serious adverse economicconditions in a specific country or region, it is management’s judgment that the valuationof the receivables is inadequately represented by the valuation allowance in stage two, thepercentage of valuation allowance for the debtors in the related country or region may beincreased to cover the increased risk.
55Philips Annual Report 2003
Inventories
Inventories are stated at the lower of cost or market, less advance payments on work inprocess. The cost of inventories comprises all costs of purchase, costs of conversion andother costs incurred bringing the inventories to their present location and condition. Thecosts of conversion of inventories include direct labor and fixed and variable productionoverheads, taking into account the stage of completion. The cost of inventories isdetermined using the first-in, first-out (FIFO) method. An allowance is made for theestimated losses due to obsolescence. This allowance is determined for groups of productsbased on purchases in the recent past and/or expected future demand. Individual items ofinventory that have been identified as obsolete are typically disposed of within a period ofthree months either by sale or by scrapping.
Other non-current financial assets
Loans receivable are stated at amortized cost, less the related allowance for impaired loansreceivable. Management, considering current information and events regarding theborrowers’ ability to repay their obligations, considers a loan to be impaired when it isprobable that the Company will be unable to collect all amounts due according to thecontractual terms of the loan agreement. When a loan is considered to be impaired, theamount of the impairment is measured based on the present value of expected future cashflows discounted at the loan’s effective interest rate. Impairment losses are included in theallowance for doubtful accounts through a charge to bad debt expense. Cash receipts onimpaired loans receivable are applied to reduce the principal amount of such loans until theprincipal has been recovered and are recognized as interest income thereafter.
Property, plant and equipment
Property, plant and equipment are stated at cost, less accumulated depreciation. Assetsmanufactured by the Company include direct manufacturing costs, production overheadsand interest charges incurred during the construction period. Government grants arededucted from the cost of the related asset. Depreciation is calculated using thestraight-line method over the expected economic life of the asset. Depreciation of specialtooling is based on the straight-line method. Gains and losses on the sale of property, plantand equipment are included in other business income. Costs related to major maintenanceactivities are expensed in the period in which they are incurred. Plant and equipment undercapital leases are initially recorded at the present value of minimum lease payments. Theseassets and leasehold improvements are amortized using the straight-line method over theshorter of the lease term or estimated useful life of the asset.
Asset Retirement Obligations
In June 2001, the FASB issued SFAS No. 143, ‘Accounting for Asset RetirementObligations’. The Company adopted this Statement in 2003. Under the provisions of thisStatement the Company recognizes the fair value of an asset retirement obligation in theperiod in which it is incurred, while an equal amount is capitalized as part of the carryingamount of the long-lived asset and subsequently depreciated over the life of the asset.Upon initial application of the Statement the Company recognized a liability for existingasset retirement obligations adjusted for cumulative accretion to January 1, 2003.Additionally, the Company recorded the asset retirement cost as an increase to the carryingamounts of the associated long-lived assets and recognized the accumulated depreciationon such capitalized cost. The cumulative effect of the initial application of the Statementhas been recognized as a change in accounting principle and the net amount has beenreported as a cumulative-effect adjustment in the consolidated income statement for 2003.The pro forma disclosure of the amount of the asset retirement obligation that would havebeen reported if the Statement had been applied during all periods affected, has beenomitted because the amounts were not material.
56 Philips Annual Report 2003
Financial Statements and Analysis
Goodwill
The Company adopted the provisions of SFAS No. 141 as of July 1, 2001 and SFAS No. 142
as of January 1, 2002. Goodwill is not amortized but tested for impairment annually in thesecond quarter or whenever impairment indicators require so. Prior to adoption of SFASNo. 142, the Company applied the straight-line method for amortization of goodwill overthe period expected to benefit, not exceeding 20 years.Upon adoption of SFAS No. 142, the Company was required as of January 1, 2002 toevaluate its existing intangible assets and goodwill that were acquired in purchase businesscombinations, and to make any necessary reclassifications in order to conform with thenew classification criteria in SFAS No. 141 for recognition separate from goodwill. TheCompany re-assessed the useful lives and residual values of all intangible assets acquired.No amortization period adjustments were necessary. Also, in connection with SFAS No.142’s transitional goodwill impairment evaluation, the Company performed an assessmentof whether there was an indication that goodwill was impaired as of the date of adoption.To accomplish this, the Company was required to identify its reporting units anddetermine the carrying value of each reporting unit by assigning the assets and liabilities,including the existing goodwill and intangible assets, to those reporting units as of January1, 2002. Furthermore, the Company was required to determine the fair value of eachreporting unit and to compare it to the carrying amount of the reporting unit. To theextent that the carrying amount of a reporting unit exceeded the fair value of the reportingunit, the Company was required to perform the second step of the transitional impairmenttest. In the second step, the Company was required to compare the implied fair value of thereporting unit’s goodwill with the carrying amount of the reporting unit’s goodwill, bothof which would be measured as of the date of adoption. The implied fair value of goodwillis determined by allocating the fair value of the reporting unit to all of the assets(recognized and unrecognized) and liabilities of the reporting unit in a manner similar to apurchase price allocation upon a business combination in accordance with SFAS No. 141.The residual fair value after this allocation is the implied fair value of the reporting unit’sgoodwill.The Company identified its reporting units as one level below that of an operatingsegment, which is the level that constitutes a business and reports discrete financialinformation to segment management and the Board of Management, and performed thetransitional goodwill impairment test for each of those reporting units in the first quarter of2002. No impairment arose from these tests.In addition to the transitional goodwill impairment test, the Company performed andcompleted its annual impairment tests, using methodology similar to that used for thetransitional impairment test, in the second quarter of 2002 and 2003. Fair value of thereporting units was determined using expected discounted future cash flows.
Intangible assets
Intangible assets arising from acquisitions are amortized using the straight-line methodover their estimated economic lives, unless the revenues generated by these intangibles havea deviating pattern. In that case, the revenue pattern dictates the amortization schedule.Economic lives are evaluated every year. There are currently no intangible assets withindefinite lives.In-process Research and Development (R&D) with no alternative use is written off
immediately upon acquisition.Patents and trademarks acquired from third parties are capitalized and amortized over theirremaining lives.
Certain costs relating to the development and purchase of software for internal use arecapitalized and subsequently amortized over the estimated useful life of the software inconformity with Statement of Position (SOP) 98-1, ‘Accounting for the Costs of ComputerSoftware Developed or Obtained for Internal Use’.
57Philips Annual Report 2003
Impairment or disposal of intangible assets other than goodwill and tangible fixed assets
The Company accounts for intangible and tangible fixed assets in accordance with theprovisions of SFAS No. 144, ‘Accounting for the Impairment or Disposal of Long-LivedAssets’. This Statement requires that long-lived assets are reviewed for impairmentwhenever events or changes in circumstances indicate that the carrying amount of an assetmay not be recoverable. Recoverability of assets to be held and used is measured by acomparison of the carrying amount of an asset with future net cash flows expected to begenerated by the asset. If the carrying amount of an asset exceeds its estimated future cashflows, an impairment charge is recognized in the amount by which the carrying amount ofthe asset exceeds the fair value of the asset. Assets held for sale are reported at the lower ofthe carrying amount or fair value, less costs to sell.
Research and development
All costs of research and development are expensed in the period in which they areincurred, in conformity with SFAS No. 2, ‘Accounting for Research and DevelopmentCosts’.
Advertising
Advertising costs are expensed when incurred.
Provisions and accruals
The Company recognizes provisions for liabilities and probable losses that have beenincurred as of the balance sheet date and for which the amount is uncertain but can bereasonably estimated.
Provisions are stated at face value, with the exception of certain long-term provisions, suchas provisions for postretirement benefits (including pensions) and severance payments incertain countries where such payments are made in lieu of pension benefits; thoseprovisions are stated at the present value of the future obligations.
The Company applies the provisions of SOP 96-1, Environmental liabilities and SFASNo. 5, ‘Accounting for Contingencies’ and accrues for losses associated with environmentalobligations when such losses are probable and reasonably estimatable. Additionally, inaccordance with SOP 96-1, the Company accrues for certain costs such as compensationand benefits for employees directly involved in the remediation activities. Measurement ofliabilities is based on current legal requirements and existing technology. Liabilities andexpected insurance recoveries, if any, are recorded separately. The carrying amount ofliabilities is regularly reviewed and adjusted for new facts or changes in law or technology.
Restructurings
The provision for restructuring relates to the estimated costs of initiated reorganizationsthat have been approved by the Board of Management and publicly announced beforeyear-end, and which involve the realignment of certain parts of the industrial andcommercial organization. When such reorganizations require discontinuance and/orclosure of lines of activities, the anticipated costs of closure or discontinuance are includedin restructuring provisions.
In June 2002, the FASB issued SFAS No. 146, ’Accounting for Costs Associated with Exitor Disposal Activities’. This statement nullifies EITF Issue No. 94-3, ‘Liability Recognitionfor Certain Employee Termination Benefit and Other Costs to Exit an Activity (includingCertain Costs Incurred in a Restructuring)’. The principal difference between Statement146 and Issue 94-3 that affects the Company relates to the timing of the recognition of aliability for a cost associated with an exit or disposal activity, including restructurings.
58 Philips Annual Report 2003
Financial Statements and Analysis
Statement 146 requires that a liability be recognized for those costs only when the liabilityis incurred, i.e. when it meets the definition of a liability. In contrast, under Issue 94-3 theCompany recognized a liability for an exit cost or recorded a restructuring provision whenit committed to an exit plan. Statement 146 also establishes fair value as the objective forinitial measurement of the liability.Liabilities related to one-time employee termination benefits must be recognized ratablyover the future service period when those employees are required to render services to theCompany, if that period exceeds 60 days or a longer legal notification period. TheStatement is effective for exit or disposal activities that are initiated after December 31, 2002
and has been adopted by the Company as of January 1, 2003. The impact of the adoptionof Statement 146 on the income statement of 2003 due to application of its requirements incomparison with those of EITF 94-3 was not material.
Debt and other liabilities
Debt and liabilities other than provisions are stated at amortized cost. However, loans thatare hedged under a fair value hedge are remeasured for the changes in the fair value that areattributable to the risk that is being hedged.
Revenue recognition
The Company recognizes revenue when persuasive evidence of an arrangement exists,delivery has occurred, the sales price is fixed or determinable, and collectibility is reasonablyassured. For consumer-type products in the segments Lighting, DAP and ConsumerElectronics, as well as for certain products in the Semiconductors segment, these criteria aregenerally met at the time the product is shipped and delivered to the customer and,depending on the delivery conditions, title and risk have passed to the customer andacceptance of the product, when contractually required, has been obtained, or, in caseswhere such acceptance is not contractually required, when management has establishedthat all aforementioned conditions for revenue recognition have been met and no furtherpost-shipment obligations exist. Examples of the above-mentioned delivery conditions are‘Free on Board point of delivery’ and ‘Costs, Insurance Paid point of delivery’, where thepoint of delivery may be the shipping warehouse or any other point of destination as agreedin the contract with the customer.For products that require substantive installation activities by the Company, such as thoserelated to the equipment sales of the Medical Systems segment and parts of theMiscellaneous segment, revenue recognition occurs when the aforementioned criteria forrevenue recognition have been met, installation of the equipment has been finalized inaccordance with the contractually agreed specifications and therefore the product is readyto be used by the customer, and subsequently a signed acceptance protocol has beenobtained from the customer, or, in cases where such acceptance protocol is notcontractually required, when management has established on the basis of installation andworkflow protocols that the product has been installed and is ready to be used by thecustomer in the way contractually agreed. Typically, installation activities include, to acertain extent, assembly of the equipment on the spot. Any payments by the customer aretypically contingent upon the completion of the installation process in accordance with thecontractual requirements and therefore, in such instances, revenue recognition with respectto the equipment delivery is deferred until the installation process is completed.Revenues are recorded net of sales taxes, customer discounts, rebates and similar charges.For products for which a right of return exists during a defined period, revenue recognitionis determined based on the historical pattern of actual returns, or in cases where suchinformation is lacking, revenue recognition is postponed until the return period has lapsed.Return policies are typically in conformity with customary return arrangements in localmarkets.For products for which a residual value guarantee has been granted or a buy-backarrangement has been concluded, revenue recognition takes place in accordance with therequirements for lease accounting of SFAS No. 13 ‘Accounting for Leases’.
59Philips Annual Report 2003
Shipping and handling costs billed to customers are recognized as revenues. Expensesincurred for shipping and handling costs of internal movements of goods are recorded ascost of sales. Shipping and handling costs related to sales to third parties are reported asselling expenses and disclosed separately.Service revenue is recognized as services are rendered.A provision for product warranty is made at the time of revenue recognition and reflectsthe estimated costs of replacement and free-of-charge services that will be incurred by theCompany with respect to the sold products. In cases where the warranty period is extendedand the customer has the option to purchase such an extension, which is subsequentlybilled separately to the customer, revenue recognition occurs on a straight-line basis overthe contract period.Provision for estimated contract losses, if any, is made as soon as such losses are foreseen.Royalty income, which is generally earned based upon a percentage of sales or a fixedamount per product sold, is recognized on an accrual basis. Government grants, other thanthose relating to purchases of assets, are recognized as income as qualified expenditures aremade.
Income taxes
Income taxes are accounted for using the asset and liability method. Income tax isrecognized in the income statement except to the extent that it relates to an itemrecognized directly within stockholders’ equity, including other comprehensive income(loss), in which case the related tax effect is also recognized there. Current tax is theexpected tax payable on the taxable income for the year, using tax rates enacted at thebalance sheet date, and any adjustment to tax payable in respect of previous years. Deferredtax assets and liabilities are recognized for the expected tax consequences of temporarydifferences between the tax bases of assets and liabilities and their reported amounts.Measurement of deferred tax assets and liabilities is based upon the enacted tax ratesexpected to apply to taxable income in the years in which those temporary differences areexpected to be recovered or settled. Deferred tax assets, including assets arising from losscarryforwards, are recognized if it is more likely than not that the asset will be realized.Deferred tax assets and liabilities are not discounted.
Deferred tax liabilities for withholding taxes are recognized for subsidiaries in situationswhere the income is to be paid out as dividends in the foreseeable future, and forundistributed earnings of minority shareholdings.
Changes in tax rates are reflected in the period that includes the enactment date.
Benefit accounting
The Company accounts for the cost of pension plans and postretirement benefits otherthan pensions in accordance with SFAS No. 87, ‘Employers’ Accounting for Pensions’, andSFAS No. 106, ‘Postretirement Benefits other than Pensions’, respectively.Most of the Company’s defined-benefit plans are funded with plan assets that have beensegregated and restricted in a trust to provide for the pension benefits to which theCompany has committed itself.When plan assets have not been segregated the Company recognizes a provision for suchamounts.
Pension costs in respect of defined-benefit pension plans primarily represent the increase inthe actuarial present value of the obligation for pension benefits based on employee serviceduring the year and the interest on this obligation in respect of employee service inprevious years, net of the expected return on plan assets.
60 Philips Annual Report 2003
Financial Statements and Analysis
In the event that the accumulated benefit obligation, calculated as the present value of thebenefits attributed to employee service rendered and based on current and pastcompensation levels, exceeds the market value of the plan assets and existing accruedpension liabilities, this difference and the existing prepaid pension asset are recognized asan additional minimum pension liability.
Obligations for contributions to defined-contribution pension plans are recognized as anexpense in the income statement as incurred.
In certain countries, the Company also provides postretirement benefits other thanpensions. The cost relating to such plans consists primarily of the present value of thebenefits attributed on an equal basis to each year of service, interest cost on theaccumulated postretirement benefit obligation, which is a discounted amount, andamortization of the unrecognized transition obligation. This transition obligation is beingamortized through charges to earnings over a twenty-year period beginning in 1993 in theUSA and in 1995 for all other plans.
Unrecognized prior service costs related to pension plans and postretirement benefits otherthan pensions are being amortized by assigning a proportional amount to the incomestatements of a number of years, reflecting the average remaining service period of theactive employees.
Stock-based compensation
In 2003, the Company adopted the fair value recognition provisions of SFAS No. 123
‘Accounting for Stock-Based Compensation’, as amended by SFAS No. 148, ‘Accountingfor stock-based Compensation – Transition and Disclosure’, prospectively for all employeeawards granted, modified or settled after January 1, 2003. Under the provisions of SFASNo. 123, the Company recognizes the estimated fair value of equity instruments granted toemployees as compensation expense over the vesting period.For awards granted to employees prior to 2003, the Company continues to account forstock-based compensation using the intrinsic value method in accordance withUS Accounting Principles Board (APB) Opinion No. 25, ‘Accounting for Stock Issued toEmployees’.The following table illustrates the effect on net income and earnings per share as if theCompany had applied the fair value recognition provisions for all outstanding andunvested awards in each period:
2001 2002 2003
Net income (loss):
As reported (2,475) (3,206) 695
Add: Stock-based compensation expense included in
reported net income, net of related tax 5 (5) 27
Deduct: Stock-based compensation expense
determined using the fair value method,
net of related tax (96) (147) (134)
Pro forma (2,566) (3,358) 588
Basic earnings per common share in euros:
As reported (1.94) (2.51) 0.54
Pro forma (2.01) (2.63) 0.46
Diluted earnings per common share in euros:
As reported (1.94) (2.51) 0.54
Pro forma (2.01) (2.63) 0.46
61Philips Annual Report 2003
Discontinued operations
The Company has defined its businesses as components of an entity for the purpose ofassessing whether or not operations and cash flows can be clearly distinguished from therest of the Company, in order to qualify as a discontinued operation in the event ofdisposal of a business. Any gain or loss from disposal of a business, together with the resultsof these operations until the date of disposal, is reported separately as discontinuedoperations in accordance with SFAS No. 144. The financial information of a discontinuedbusiness is excluded from the respective captions in the consolidated financial statementsand related notes.
Cash flow statements
Cash flow statements have been prepared using the indirect method in accordance with therequirements of SFAS No. 95, ‘Statement of Cash flows’, as amended by SFAS No. 104.Cash flows in foreign currencies have been translated into euros using the weighted averagerates of exchange for the periods involved.Cash flows from derivative instruments that are accounted for as fair value hedges or cashflow hedges are classified in the same category as the cash flows from the hedged items.Cash flows from derivative instruments for which hedge accounting has been discontinuedare classified consistent with the nature of the instrument as from the date ofdiscontinuance.
Use of estimates
The preparation of financial statements requires management to make estimates andassumptions that affect amounts reported in the consolidated financial statements in orderto conform with generally accepted accounting principles. Actual results could differ fromthose estimates.
Reclassifications
Certain items previously reported under specific financial statement captions have beenreclassified to conform with the 2003 presentation.
62 Philips Annual Report 2003
Financial Statements and Analysis
New accounting standards
The FASB issued several pronouncements of which the following are applicable to theCompany.EITF Issue No. 00-21 ‘Revenue Arrangements with Multiple Deliverables’ became effectivein May 2003 and is applicable to revenue arrangements entered into from the third quarterof 2003 onwards. It requires the Company to divide such arrangements into separate unitsof accounting if certain criteria are met and prescribes that the arrangement considerationbe allocated to the separate units of accounting and that revenue be recognized inaccordance with the applicable revenue recognition criteria that are applicable to theseparate units of accounting. The criteria for separating the units of accounting are:a. the delivered item(s) has value to the customer on a stand-alone basis;b. there is objective and reliable evidence of the fair value of the undelivered item(s);c. if the arrangement includes a general right of return relative to the delivered item,
delivery or performance of the undelivered item(s) is considered probable andsubstantially in the vendor’s control.
Revenue arrangements with multiple deliverables occur in certain of the Company’sbusinesses. The Medical Systems businesses deliver equipment that requires subsequentinstallation activities in order to become operable for the customer. However, sincepayment for the equipment is typically contingent upon the completion of the installationprocess, revenue recognition is required to be deferred until the installation has beencompleted. This is consistent with the Company’s existing practice. The Company hasidentified only limited other instances in which multiple-deliverable arrangements exist.Consequently, this EITF Issue had no material impact on the 2003 financial statements.
In November 2002 the FASB issued FASB Interpretation No. 45 ‘Guarantor’s accountingand Disclosure Requirements for Guarantees, Including Indirect Guarantees ofIndebtedness of Others’. The Interpretation requires a guarantee to recognize, at theinception of a guarantee, a liability for the fair value of the obligation undertaken in issuingthe guarantee. This requirement applies to guarantees issued or modified after December31, 2002 that have any of the following characteristics:a. contracts that contingently require the Company to make payments to the guaranteed
party based on changes in an underlying variable that is related to an asset, a liability oran equity security of the guaranteed party;
b. contracts that contingently require the Company to make payments to the guaranteedparty based on another entity’s failure to perform under an obligating agreement(performance guarantees);
c. indemnification agreements that contingently require the Company to make paymentsto the indemnified party based on changes in an underlying variable that is related to anasset, a liability, or an equity security of that party;
d. indirect guarantees of the indebtedness of others.Certain types of guarantees including warranties, guarantees of a subsidiary debt andguarantees that represent contingent consideration in a business combination are exemptedfrom the initial recognitions and measurement provisions (recognition of the liability basedon the fair value of the guarantee obligation) of the Interpretation.The Interpretation also expands the disclosure requirements for all outstanding guarantees.The expanded disclosure requirements were implemented in the Annual Report 2002. TheCompany has recognized liabilities amounting to 19 million as of December 31, 2003
for guarantees that were issued or modified after December 31, 2002.
63Philips Annual Report 2003
In January 2003 the FASB issued FASB Interpretation No. 46 ‘Consolidation of VariableInterest Entities’ followed by a revised Interpretation in December 2003. ThisInterpretation of Accounting Research Bulletin No. 51 ‘Consolidated FinancialStatements’ addresses the consolidation of entities which have one or more of thefollowing characteristics:a. the equity investment at risk is not sufficient to permit the entity to finance its
activities without additional subordinated financial support from other parties, whichis provided through other interests that will absorb some or all of the expected losses ofthe entity;
b. the equity investors lack one or more of the following essential characteristics of acontrolling financial interest:1. the direct or indirect ability to make decisions about the entity’s activities through
voting or similar rights;2. the obligation to absorb the expected losses of the entity if they occur, which makes
it possible for the entity to finance its activities;3. the right to receive the expected residual returns of the entity if they occur, which is
the compensation for the risk of absorbing the expected losses.c. the equity investors have voting rights that are not proportionate to their economic
interests, and the activities of the entity involve or are conducted on behalf of aninvestor with a disproportionately small voting interest.
The Interpretation is applicable to variable-interest entities created or modified afterJanuary 31, 2003 and for special-purpose entities existing on December 31, 2003. For allother entities with variable interests, the Interpretation must be applied not later thanMarch 31, 2004.The Company substantially completed its review of its existing joint ventures and othernot wholly owned entities, to ascertain whether or not these would qualify forconsolidation as a variable-interest entity.Also, the identification of the existing special-purpose entities has been completed as atDecember 31, 2003.
Two special-purpose entities, created for the purpose of leasing real estate, were identified,one of which was unwound during 2003, while the other one has been consolidated. Therelated leased assets are currently included in the balance sheet. The impact onnon-current assets amounted to 124 million as at December 31, 2003.With regard to the identification of possible other variable interests the Companydetermined that its System on Silicon Manufacturing Co. joint venture meets thedefinition of a variable-interest entity and accordingly will be consolidated in 2004. Theestimated effects on the balance sheet are as follows:- non-current assets 490 million;- current assets 180 million;- liabilities 465 million.The Company’s investment in the equity of SSMC amounted to 100 million at theend of December 2003. If the consolidation of SSMC would have occurred in 2003, theCompany’s net debt: group equity ratio would have been 19:81.
Philips Medical Capital (PMC), a variable-interest entity created in 2002 to providefinancing for the purchase of diagnostic imaging equipment produced by Philips MedicalSystems and sold in the United States, is still under review. It has been determined thatthis joint venture, that was set up together with De Lage Landen International, a 100%subsidiary of the Rabobank meets the definition of a variable-interest entity. Whether theentity needs to be consolidated is contingent on the volume of possible future losses of theentity that need to be absorbed by the Company. This needs to be determined on March31, 2004 when the Company will have to apply the Interpretation for Philips MedicalCapital.
64 Philips Annual Report 2003
At December 31, 2003 Philips Medical Capital had the following assets and liabilities:- non-current assets 401 million;- current assets 49 million;- liabilities 404 million.The Company’s investment in the equity of PMC amounted to 18 million per the endof 2003.
The effect of possible consolidation of other variable-interest entities is expected not to bematerial.
In April 2003 the FASB issued SFAS No. 149 ‘Amendment of Statement 133 on DerivativeInstruments and Hedging Activities’. This Statement mainly amends Statement 133 inconnection with implementation issues raised in relation to the application of thedefinition of a derivative, in particular, the meaning of ‘an initial net investment that issmaller than would be required for other types of contracts that would be expected to havea similar response to changes in market factors’, the meaning of ‘underlying’, and thecharacteristics of a derivative that contains financing components.The application of this Statement had no effect on the Company’s financial statements.
In May 2003 the FASB issued SFAS No. 150 ‘Accounting for Certain FinancialInstruments with Characteristics of both Liabilities and Equity’.This Statement requires the Company to classify the following instruments as liabilities:a. a financial instrument issued by the Company in the form of shares that is mandatorily
redeemable and that embodies an unconditional obligation requiring the issuer toredeem it by transferring its assets at a specified or determinable date (or dates) or uponan event that is certain to occur;
b. a financial instrument issued by the Company, other than an outstanding share, that, atinception, embodies an obligation to repurchase the issuer’s equity shares, or is indexedto such an obligation, and that requires or may require the issuer to settle the obligationby transferring assets (for example, a forward purchase contract or written put optionon the issuer’s equity shares that is to be physically settled or net cash settled);
c. a financial instrument issued by the Company that embodies an unconditionalobligation, or a financial instrument other than an outstanding share that embodies aconditional obligation, that the issuer must or may settle by issuing a variable numberof its equity shares, if, at inception, the monetary value of the obligation is based solelyor predominantly on any of the following:1. a fixed monetary amount known at inception, for example a payable settleable with
a variable number of the issuer’s equity shares;2. variations in something other than the fair value of the issuer’s equity shares, for
example a financial instrument indexed to the S&P 500 and settleable with avariable number of the issuer’s equity shares;
3. variations inversely related to changes in the fair value of the issuer’s equity shares,for example a written put option that could be net share settled.
The Company has reviewed its issued financial instruments and has concluded that theaccounting for such financial instruments is not affected by Statement 150.In January 2004 FASB Staff Position 106-1 ‘Accounting and Disclosure RequirementsRelated to the Medicare Prescription Drug, Improvement and Modernization Act of 2003’was posted. The Company has opted for the one-time election to defer accounting for theeconomic effects of the new Medicare Act and accordingly discloses that the new MedicareAct was enacted in December 2003. The effects of this Act in as far as related to measuresof the accumulated postretirement benefit obligation or the net periodic postretirementbenefit cost do not reflect the effects of the Act. Specific authoritative guidance onaccounting for the federal subsidy is pending and that guidance, when issued, could requirethe Company to change previously reported information.
65Philips Annual Report 2003
Notes to the consolidated financial statementsof the Philips Groupall amounts in millions of euros unless otherwise stated
L1 Acquisitions and divestments
2003
During 2003 the Company completed several disposals of businesses. Also a number ofacquisitions and ventures have been completed. All business combinations have beenaccounted for using the purchase method of accounting. However, both individually andin the aggregate these business combinations were immaterial in respect of theSFAS No. 141 disclosure requirements.The total effect of these acquisitions and divestments is summarized in the table below:
cash inflow(outflow)
net assetsacquired(divested)
goodwill gain (loss)
Acquisitions (470) 415 55 –
Divestments 1,372 (620) – 752
Total 902 (205) 55 752
The most significant acquisitions, divestments and joint ventures are described in thesection below.
InterTrust Technology Corporationcash inflow
(outflow)net assetsacquired(divested)
otherintangible
assets
goodwill gain (loss)
(202) 35 156 11 –
In January the Company acquired 49.5% of the 99.3 million shares of InterTrustTechnology Corporation at a price of 4.25 per share. The investment is accounted forusing the equity method.InterTrust develops and licenses intellectual property for DRM (Digital RightsManagement) and trusted computing.
Speech Processing Telephony and Voice Control
In January the Company completed the sale of its Speech Processing Telephony and VoiceControl businesses to Scansoft Inc. of Peabody, Mass., United States, at a price of 34 million, resulting in a gain of 20 million.Sales and income from operations related to the activities divested in 2003 were notmaterial.
Philips BenQ Digital Storage
In March, the Company acquired 51% of the shares of Philips BenQ Digital Storage at aprice of 5 million. Philips consolidated the venture from March 2003 onwards. Theremaining shares are owned by BenQ.Philips and BenQ Corporation Taipei, Taiwan, established the company to cooperate inthe areas of new optical standards, research, and particularly in the definition of productroadmaps, product development, manufacturing of products, and customer support foroptical storage devices for data applications.
66 Philips Annual Report 2003
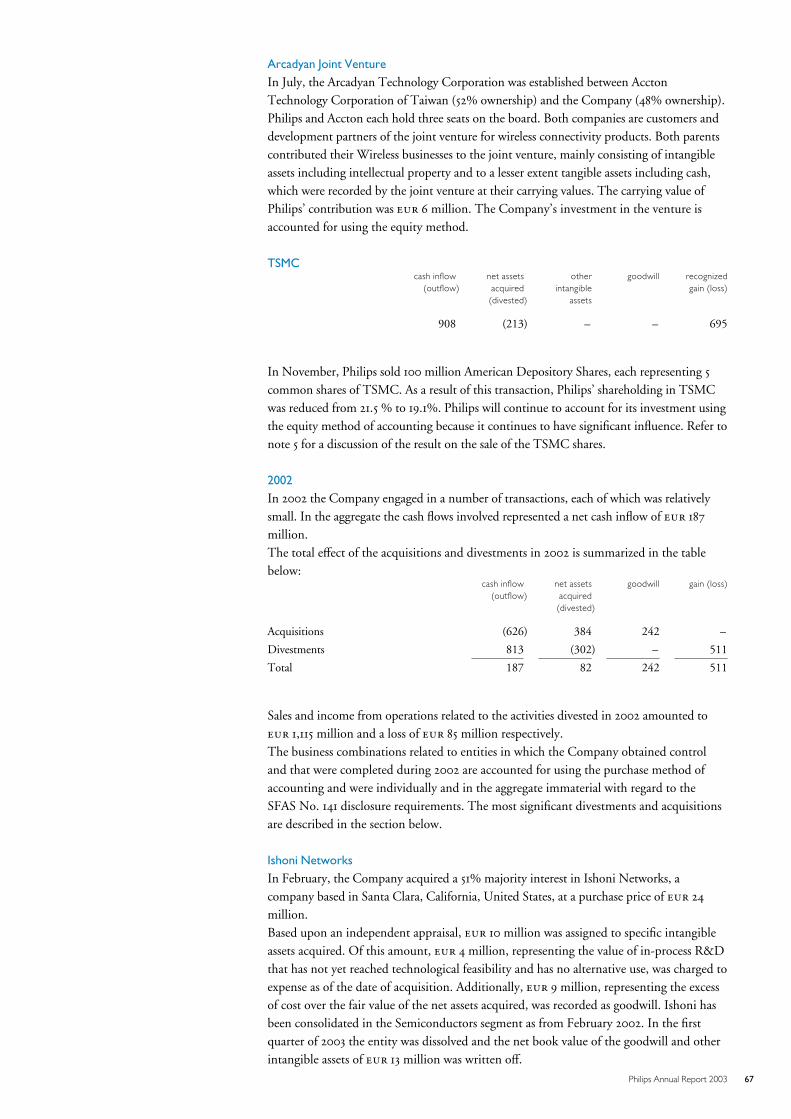
Arcadyan Joint Venture
In July, the Arcadyan Technology Corporation was established between AcctonTechnology Corporation of Taiwan (52% ownership) and the Company (48% ownership).Philips and Accton each hold three seats on the board. Both companies are customers anddevelopment partners of the joint venture for wireless connectivity products. Both parentscontributed their Wireless businesses to the joint venture, mainly consisting of intangibleassets including intellectual property and to a lesser extent tangible assets including cash,which were recorded by the joint venture at their carrying values. The carrying value ofPhilips’ contribution was 6 million. The Company’s investment in the venture isaccounted for using the equity method.
TSMCcash inflow
(outflow)net assetsacquired(divested)
otherintangible
assets
goodwill recognizedgain (loss)
908 (213) – – 695
In November, Philips sold 100 million American Depository Shares, each representing 5common shares of TSMC. As a result of this transaction, Philips’ shareholding in TSMCwas reduced from 21.5 % to 19.1%. Philips will continue to account for its investment usingthe equity method of accounting because it continues to have significant influence. Refer tonote 5 for a discussion of the result on the sale of the TSMC shares.
2002
In 2002 the Company engaged in a number of transactions, each of which was relativelysmall. In the aggregate the cash flows involved represented a net cash inflow of 187
million.The total effect of the acquisitions and divestments in 2002 is summarized in the tablebelow:
cash inflow(outflow)
net assetsacquired(divested)
goodwill gain (loss)
Acquisitions (626) 384 242 –
Divestments 813 (302) – 511
Total 187 82 242 511
Sales and income from operations related to the activities divested in 2002 amounted to 1,115 million and a loss of 85 million respectively.The business combinations related to entities in which the Company obtained controland that were completed during 2002 are accounted for using the purchase method ofaccounting and were individually and in the aggregate immaterial with regard to theSFAS No. 141 disclosure requirements. The most significant divestments and acquisitionsare described in the section below.
Ishoni Networks
In February, the Company acquired a 51% majority interest in Ishoni Networks, acompany based in Santa Clara, California, United States, at a purchase price of 24
million.Based upon an independent appraisal, 10 million was assigned to specific intangibleassets acquired. Of this amount, 4 million, representing the value of in-process R&Dthat has not yet reached technological feasibility and has no alternative use, was charged toexpense as of the date of acquisition. Additionally, 9 million, representing the excessof cost over the fair value of the net assets acquired, was recorded as goodwill. Ishoni hasbeen consolidated in the Semiconductors segment as from February 2002. In the firstquarter of 2003 the entity was dissolved and the net book value of the goodwill and otherintangible assets of 13 million was written off.
67Philips Annual Report 2003
Medical glassware business of Richardson Electronics
In February, the Company completed the acquisition of 100% of Richardson Electronics’medical glassware business. Under the terms of the agreement, Philips acquired the netassets and the employees of the business. The medical glassware business has beenconsolidated in the Medical Systems segment as from March 2002.
Fax business
In March, Philips sold its Fax business to Groupe SAGEM of France. The main activitiesof this business were located in Vienna.
TechnoFusion
In May, the Company completed the sale of TechnoFusion GmbH, a leadingmanufacturer power generation systems for automotive electronics, to InternationalRectifier (IR) for 60 million in cash.
SMATV
In May, the Company sold its business unit Satellite Master Antenna Television (SMATV)to Fracarro France.
Heat and Surface Treatment
The Company sold its Heat and Surface Treatment (H&ST) activities to AalbertsIndustries of the Netherlands in July.
X-ray Analytical
In September, the Company sold the major part of its X-ray Analytical business toSpectrics plc of Egham, United Kingdom, a precision instrumentation and controlscompany, for 150 million.
Philips Broadband Networks
In September, C-COR.net of State College, PA, United States, a global provider ofbroadband communications technology systems and services, acquired Philips BroadbandNetworks (PBN) for a cash payment of approximately 75 million.
Philips Medical Capital
Philips Medical Systems and Rabobank Group’s subsidiary De Lage Landen Internationalset up a venture to provide financing for the purchase of the full range of diagnosticimaging equipment, produced by Philips Medical Systems, throughout the United States.The new venture is called Philips Medical Capital and is based in Wayne, Pennsylvania(United States). De Lage Landen owns a majority stake (60%) in the venture and hasoperational control. The venture became operative in the fourth quarter of 2002 and isaccounted for using the equity method.
Payer shavers
At the end of October, the Company concluded the sale of Payer Elektroprodukte to HuiHolding Sdn. Bhd. of Malaysia. Payer Elektroprodukte is an Austria-based leading originalequipment manufacturer (OEM) of electric foil shavers and was part of Philips’ DomesticAppliances and Personal Care (DAP) division.
Communication, Security and Imaging business
In October, the Company and Robert Bosch GmbH concluded the sale of Philips’business unit Communication, Security and Imaging (CSI).
68 Philips Annual Report 2003
Financial Statements and Analysis
Philips Contract Manufacturing Services
In November, the Company and Jabil Circuit Inc., a global leader in ElectronicManufacturing Services (EMS), agreed on the sale of most of Philips ContractManufacturing Services (PCMS). In connection with this transaction, the Companyagreed to restructure four manufacturing operations. The transaction resulted in cashinflows in 2002 of 170 million, while in 2003 there were cash outflows of 53
million, related to restructuring costs provided for in 2002. A loss of 13 million,including a provision to restructure the above-mentioned operations was recorded on thistransaction in 2002.
Health Care Products Group
At the end of November, the sale of the Health Care Products Group to Platinum EquityHoldings was concluded. HCP, part of Philips Medical Systems, was acquired as part ofthe Marconi Medical Systems acquisition in 2001. With a customer base of over 20,000
healthcare providers in the United States, the company had annual revenues in excess of 600 million.
Systemonic
On December 31, 2002 the Company completed the acquisition of Systemonic, a leadingdeveloper of complete silicon system solutions. Systemonic has operations in the USA andGermany. Based on a valuation completed in 2003, goodwill of 28 million has beenrecognized. In-process R&D that had no alternative future use amounting to 8
million was charged to income in 2002.
Marantz
Marantz is a leading branded manufacturer of premium home theatre and Audio/Videoproducts in which the Company had a 49% stake. In May 2002, Marantz and DENON,Ltd. merged operations into D&M Holdings, Inc., maintaining the established Marantzand DENON brands. After the merger Philips’ share in D&M Holdings, Inc. is 14.7% andaccordingly is no longer accounted for under the equity method.
2001
The total effect of the acquisitions and divestments in 2001 is summarized in the tablebelow:
cash inflow(outflow)
net assetsacquired(divested)
goodwill (gain) loss
Acquisitions (3,636) 1,091 2,545 –
Divestments 755 (451) – (304)
Total (2,881) 640 2,545 (304)
Sales and income from operations related to activities divested in 2001 amounted to 997 million and a loss of 17 million, respectively.The most significant acquisitions and divestments are described in the section below.
Marconi
In October, Philips acquired all the shares of Marconi’s Medical Systems business, whichcomprised two businesses, the core Medical Imaging Equipment business, a globalparticipant in the medical diagnostic imaging equipment industry, and the MarconiHealth Care Products Group (HCP), one of the largest distributors of radiology imagingsupplies in the USA. Philips divested HCP in 2002. The acquisition price of MarconiMedical Systems was 1.2 billion in cash. The primary reasons for the acquisition wereto enhance Medical Systems’ computed tomography (CT) portfolio and to acquire anadditional CT installed base whose service and maintenance is the most profitable area ofthe diagnostic imaging industry. The cost of the acquisition has been allocated on thebasis of the fair value of the assets acquired and liabilities assumed. The 2001 preliminaryallocation was finalized in 2002.
69Philips Annual Report 2003
Lighting
In September, Philips acquired the fluorescent lighting ballast operation of Lumisistemas(Mexico) and all lighting ballast activities of Helfont (Brazil). The acquisition price was 72 million. As from the beginning of September 2001, Philips consolidated thesenewly acquired businesses; 53 million has been recorded as goodwill.
Agilent
In August, Philips completed the acquisition of the net assets of Agilent Technologies Inc.’sHealthcare Solutions Group (HSG) for a total purchase price of 2.0 billion in cash.HSG is active in the field of pervasive cardiology and monitoring solutions, and is aleading global provider of medical products and services to hospitals, healthcare clinics,physicians’ offices, airlines and others. The primary reason for the acquisition was toenhance the existing business and to provide Medical Systems with a strong position inthe cardiac sector. Additionally, the acquisition enables Medical Systems to enter certainnew, high-growth segments such as home care technology enabling remote diagnostics.The cost of the acquisition was allocated on the basis of the fair value of the assetsacquired and liabilities assumed. The 2001 preliminary allocation was finalized in 2002.
FEI
In May, Philips reduced its stake in FEI Company to 26% through a public offering of FEIshares and through the sale of approximately 6 million shares owned by Philips.The cash proceeds were 200 million, resulting in a gain of 185 million includedin other business income.Following the offering, Philips no longer consolidates the financial data of FEI, previouslyincluded in the product sector Miscellaneous. The remaining investment is accounted foras an equity investment from May 2001 onwards.
LG.Philips Displays
In June, Philips and LG Electronics (LGE) completed a definitive agreement throughwhich the two companies merged their respective cathode ray tube (CRT) businesses into anew joint venture company. LGE and Philips share equal control of the joint venture. Thejoint venture remitted 1.1 billion in cash to LGE and 0.3 billion to Philips toclose the difference in the valuation of the net assets contributed.The investment is accounted for using the equity method. The excess of the Company’sinvestment over its underlying equity in the recognized net assets has been recorded asgoodwill in the caption investments in unconsolidated companies.
Philips Consumer Communications
In October, Philips announced it had signed a definitive agreement with respect to atransfer of Philips’ mobile handset activities to China Electronics Corporation (CEC).Under the agreement, Philips contributed part of the research & development andmanufacturing activities of Philips Consumer Communications (PCC) into a partnershipwith CEC. Philips maintained a focused sales and marketing activity in mobile telephonyunder the Philips brand name.In December 2001, 65% of the shares in the manufacturing company in China weretransferred to the CEC group, bringing their ownership to 75%. Therefore this companywas deconsolidated at year-end 2001. The transfer of 100% of shares in the developmentcompany in France was completed in the first quarter of 2002.
Part of the Le Mans manufacturing operations that remained after the restructuring ofPCC was sold to European Telecom plc; the transaction was closed on December 31, 2001,therefore the operations were deconsolidated as of December 31, 2001.
70 Philips Annual Report 2003
Financial Statements and Analysis
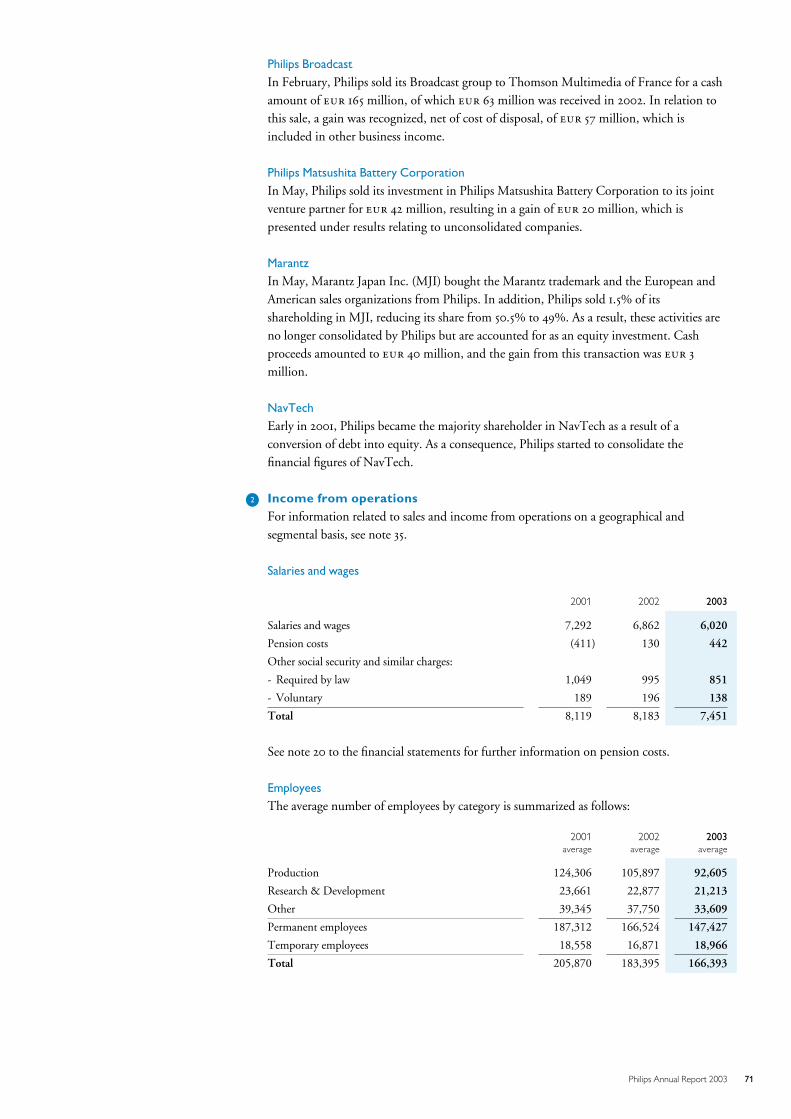
Philips Broadcast
In February, Philips sold its Broadcast group to Thomson Multimedia of France for a cashamount of 165 million, of which 63 million was received in 2002. In relation tothis sale, a gain was recognized, net of cost of disposal, of 57 million, which isincluded in other business income.
Philips Matsushita Battery Corporation
In May, Philips sold its investment in Philips Matsushita Battery Corporation to its jointventure partner for 42 million, resulting in a gain of 20 million, which ispresented under results relating to unconsolidated companies.
Marantz
In May, Marantz Japan Inc. (MJI) bought the Marantz trademark and the European andAmerican sales organizations from Philips. In addition, Philips sold 1.5% of itsshareholding in MJI, reducing its share from 50.5% to 49%. As a result, these activities areno longer consolidated by Philips but are accounted for as an equity investment. Cashproceeds amounted to 40 million, and the gain from this transaction was 3
million.
NavTech
Early in 2001, Philips became the majority shareholder in NavTech as a result of aconversion of debt into equity. As a consequence, Philips started to consolidate thefinancial figures of NavTech.
L2 Income from operationsFor information related to sales and income from operations on a geographical andsegmental basis, see note 35.
Salaries and wages
2001 2002 2003
Salaries and wages 7,292 6,862 6,020
Pension costs (411) 130 442
Other social security and similar charges:
- Required by law 1,049 995 851
- Voluntary 189 196 138
Total 8,119 8,183 7,451
See note 20 to the financial statements for further information on pension costs.
Employees
The average number of employees by category is summarized as follows:
2001 2002 2003average average average
Production 124,306 105,897 92,605
Research & Development 23,661 22,877 21,213
Other 39,345 37,750 33,609
Permanent employees 187,312 166,524 147,427
Temporary employees 18,558 16,871 18,966
Total 205,870 183,395 166,393
71Philips Annual Report 2003
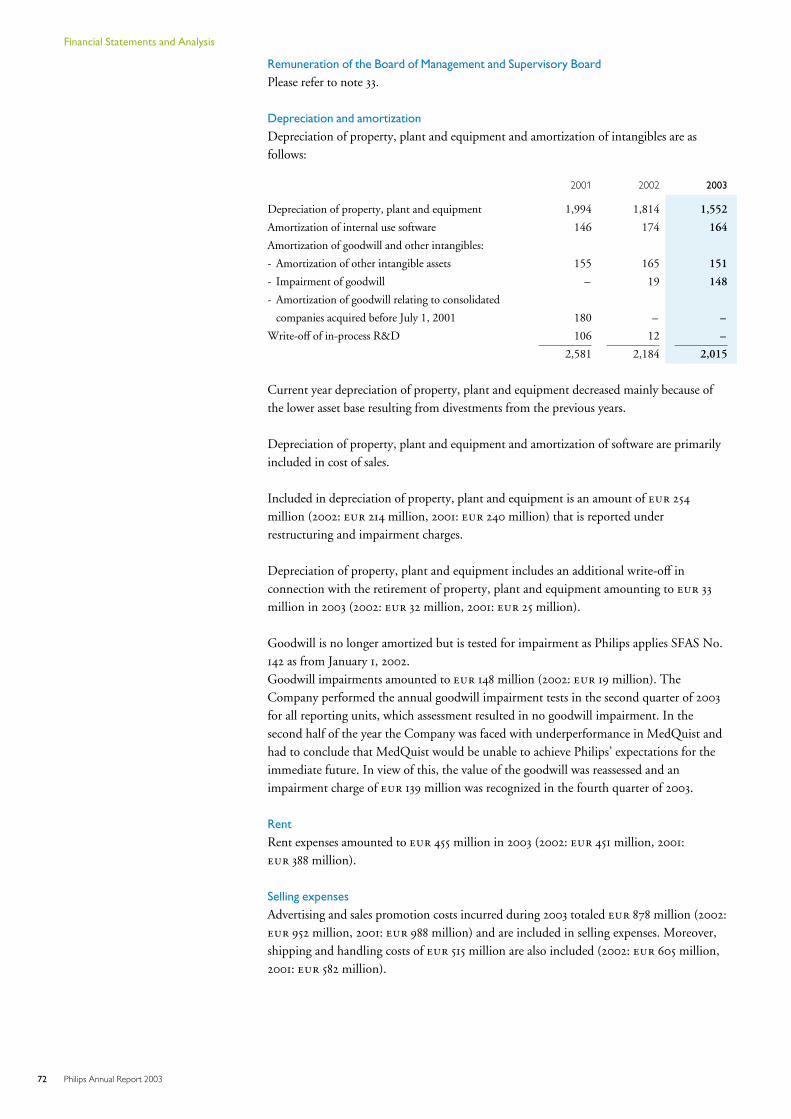
Remuneration of the Board of Management and Supervisory Board
Please refer to note 33.
Depreciation and amortization
Depreciation of property, plant and equipment and amortization of intangibles are asfollows:
2001 2002 2003
Depreciation of property, plant and equipment 1,994 1,814 1,552
Amortization of internal use software 146 174 164
Amortization of goodwill and other intangibles:
- Amortization of other intangible assets 155 165 151
- Impairment of goodwill – 19 148
- Amortization of goodwill relating to consolidated
companies acquired before July 1, 2001 180 – –
Write-off of in-process R&D 106 12 –
2,581 2,184 2,015
Current year depreciation of property, plant and equipment decreased mainly because ofthe lower asset base resulting from divestments from the previous years.
Depreciation of property, plant and equipment and amortization of software are primarilyincluded in cost of sales.
Included in depreciation of property, plant and equipment is an amount of 254
million (2002: 214 million, 2001: 240 million) that is reported underrestructuring and impairment charges.
Depreciation of property, plant and equipment includes an additional write-off inconnection with the retirement of property, plant and equipment amounting to 33
million in 2003 (2002: 32 million, 2001: 25 million).
Goodwill is no longer amortized but is tested for impairment as Philips applies SFAS No.142 as from January 1, 2002.Goodwill impairments amounted to 148 million (2002: 19 million). TheCompany performed the annual goodwill impairment tests in the second quarter of 2003
for all reporting units, which assessment resulted in no goodwill impairment. In thesecond half of the year the Company was faced with underperformance in MedQuist andhad to conclude that MedQuist would be unable to achieve Philips’ expectations for theimmediate future. In view of this, the value of the goodwill was reassessed and animpairment charge of 139 million was recognized in the fourth quarter of 2003.
Rent
Rent expenses amounted to 455 million in 2003 (2002: 451 million, 2001: 388 million).
Selling expenses
Advertising and sales promotion costs incurred during 2003 totaled 878 million (2002: 952 million, 2001: 988 million) and are included in selling expenses. Moreover,shipping and handling costs of 515 million are also included (2002: 605 million,2001: 582 million).
72 Philips Annual Report 2003
Financial Statements and Analysis
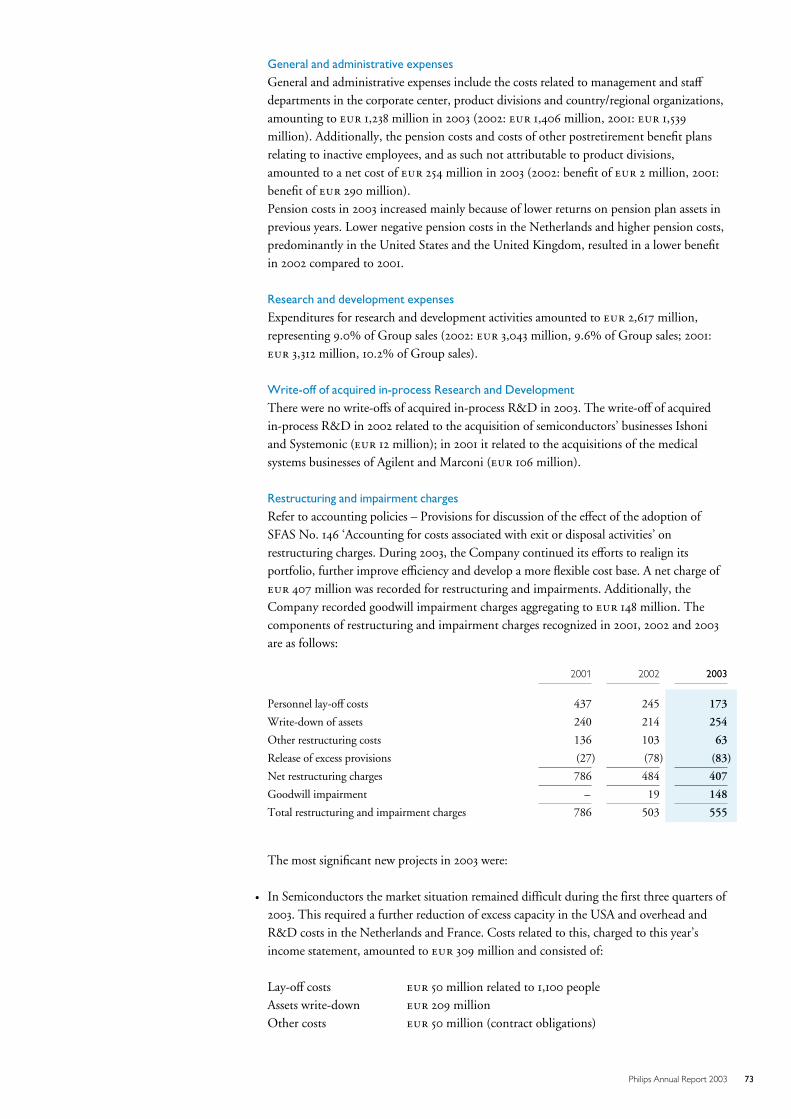
General and administrative expenses
General and administrative expenses include the costs related to management and staff
departments in the corporate center, product divisions and country/regional organizations,amounting to 1,238 million in 2003 (2002: 1,406 million, 2001: 1,539
million). Additionally, the pension costs and costs of other postretirement benefit plansrelating to inactive employees, and as such not attributable to product divisions,amounted to a net cost of 254 million in 2003 (2002: benefit of 2 million, 2001:benefit of 290 million).Pension costs in 2003 increased mainly because of lower returns on pension plan assets inprevious years. Lower negative pension costs in the Netherlands and higher pension costs,predominantly in the United States and the United Kingdom, resulted in a lower benefitin 2002 compared to 2001.
Research and development expenses
Expenditures for research and development activities amounted to 2,617 million,representing 9.0% of Group sales (2002: 3,043 million, 9.6% of Group sales; 2001: 3,312 million, 10.2% of Group sales).
Write-off of acquired in-process Research and Development
There were no write-offs of acquired in-process R&D in 2003. The write-off of acquiredin-process R&D in 2002 related to the acquisition of semiconductors’ businesses Ishoniand Systemonic ( 12 million); in 2001 it related to the acquisitions of the medicalsystems businesses of Agilent and Marconi ( 106 million).
Restructuring and impairment charges
Refer to accounting policies – Provisions for discussion of the effect of the adoption ofSFAS No. 146 ‘Accounting for costs associated with exit or disposal activities’ onrestructuring charges. During 2003, the Company continued its efforts to realign itsportfolio, further improve efficiency and develop a more flexible cost base. A net charge of 407 million was recorded for restructuring and impairments. Additionally, theCompany recorded goodwill impairment charges aggregating to 148 million. Thecomponents of restructuring and impairment charges recognized in 2001, 2002 and 2003
are as follows:
2001 2002 2003
Personnel lay-off costs 437 245 173
Write-down of assets 240 214 254
Other restructuring costs 136 103 63
Release of excess provisions (27) (78) (83)
Net restructuring charges 786 484 407
Goodwill impairment – 19 148
Total restructuring and impairment charges 786 503 555
The most significant new projects in 2003 were:
G In Semiconductors the market situation remained difficult during the first three quarters of2003. This required a further reduction of excess capacity in the USA and overhead andR&D costs in the Netherlands and France. Costs related to this, charged to this year’sincome statement, amounted to 309 million and consisted of:
Lay-off costs 50 million related to 1,100 peopleAssets write-down 209 millionOther costs 50 million (contract obligations)
73Philips Annual Report 2003
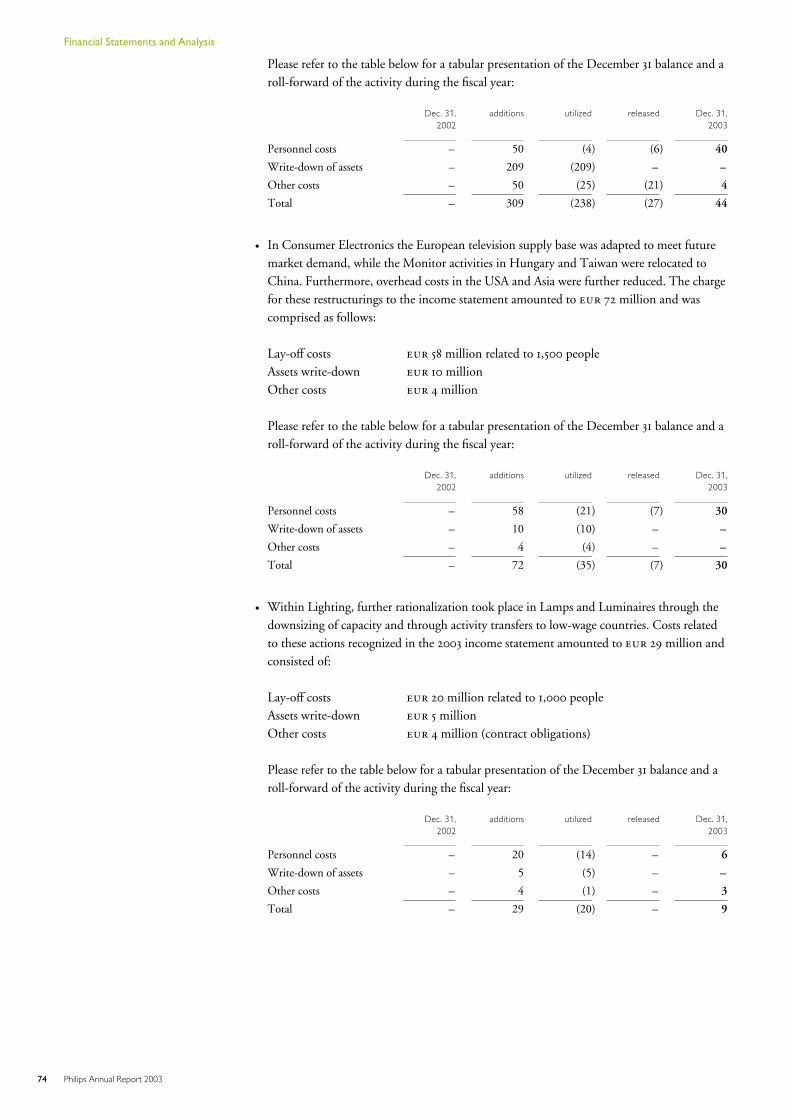
Please refer to the table below for a tabular presentation of the December 31 balance and aroll-forward of the activity during the fiscal year:
Dec. 31,2002
additions utilized released Dec. 31,2003
Personnel costs – 50 (4) (6) 40
Write-down of assets – 209 (209) – –
Other costs – 50 (25) (21) 4
Total – 309 (238) (27) 44
G In Consumer Electronics the European television supply base was adapted to meet futuremarket demand, while the Monitor activities in Hungary and Taiwan were relocated toChina. Furthermore, overhead costs in the USA and Asia were further reduced. The chargefor these restructurings to the income statement amounted to 72 million and wascomprised as follows:
Lay-off costs 58 million related to 1,500 peopleAssets write-down 10 millionOther costs 4 million
Please refer to the table below for a tabular presentation of the December 31 balance and aroll-forward of the activity during the fiscal year:
Dec. 31,2002
additions utilized released Dec. 31,2003
Personnel costs – 58 (21) (7) 30
Write-down of assets – 10 (10) – –
Other costs – 4 (4) – –
Total – 72 (35) (7) 30
G Within Lighting, further rationalization took place in Lamps and Luminaires through thedownsizing of capacity and through activity transfers to low-wage countries. Costs relatedto these actions recognized in the 2003 income statement amounted to 29 million andconsisted of:
Lay-off costs 20 million related to 1,000 peopleAssets write-down 5 millionOther costs 4 million (contract obligations)
Please refer to the table below for a tabular presentation of the December 31 balance and aroll-forward of the activity during the fiscal year:
Dec. 31,2002
additions utilized released Dec. 31,2003
Personnel costs – 20 (14) – 6
Write-down of assets – 5 (5) – –
Other costs – 4 (1) – 3
Total – 29 (20) – 9
74 Philips Annual Report 2003
Financial Statements and Analysis
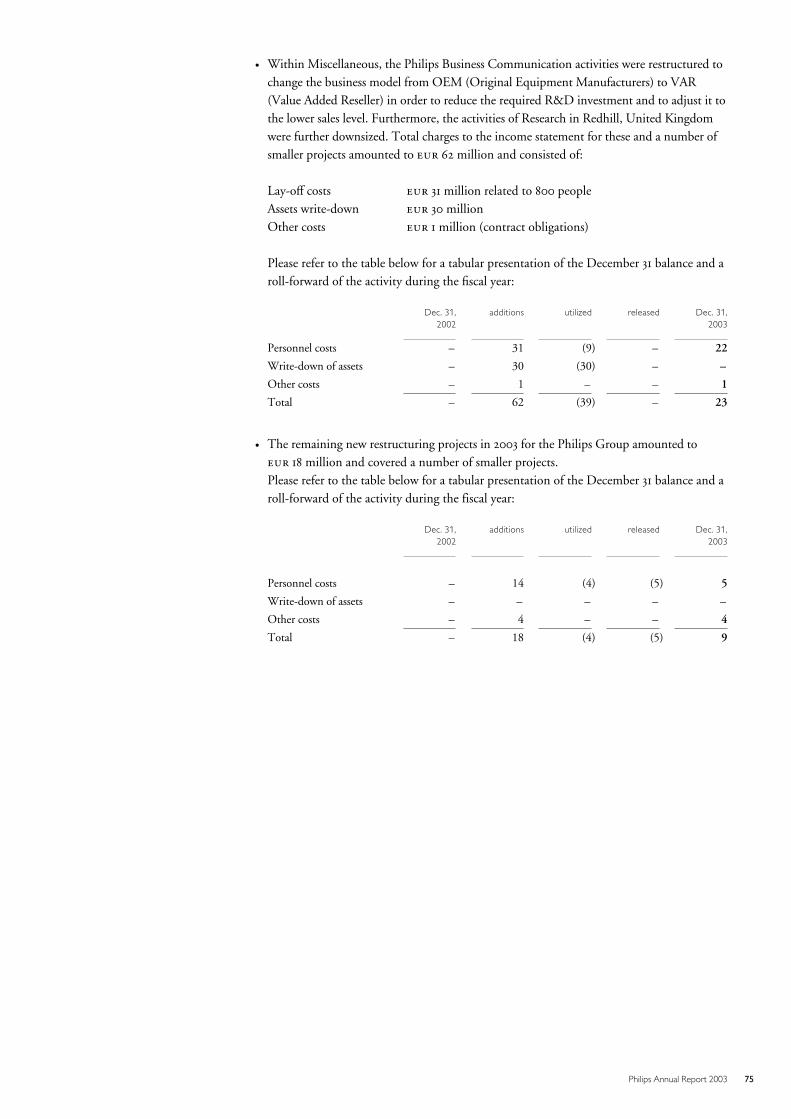
G Within Miscellaneous, the Philips Business Communication activities were restructured tochange the business model from OEM (Original Equipment Manufacturers) to VAR(Value Added Reseller) in order to reduce the required R&D investment and to adjust it tothe lower sales level. Furthermore, the activities of Research in Redhill, United Kingdomwere further downsized. Total charges to the income statement for these and a number ofsmaller projects amounted to 62 million and consisted of:
Lay-off costs 31 million related to 800 peopleAssets write-down 30 millionOther costs 1 million (contract obligations)
Please refer to the table below for a tabular presentation of the December 31 balance and aroll-forward of the activity during the fiscal year:
Dec. 31,2002
additions utilized released Dec. 31,2003
Personnel costs – 31 (9) – 22
Write-down of assets – 30 (30) – –
Other costs – 1 – – 1
Total – 62 (39) – 23
G The remaining new restructuring projects in 2003 for the Philips Group amounted to 18 million and covered a number of smaller projects.Please refer to the table below for a tabular presentation of the December 31 balance and aroll-forward of the activity during the fiscal year:
Dec. 31,2002
additions utilized released Dec. 31,2003
Personnel costs – 14 (4) (5) 5
Write-down of assets – – – – –
Other costs – 4 – – 4
Total – 18 (4) (5) 9
75Philips Annual Report 2003
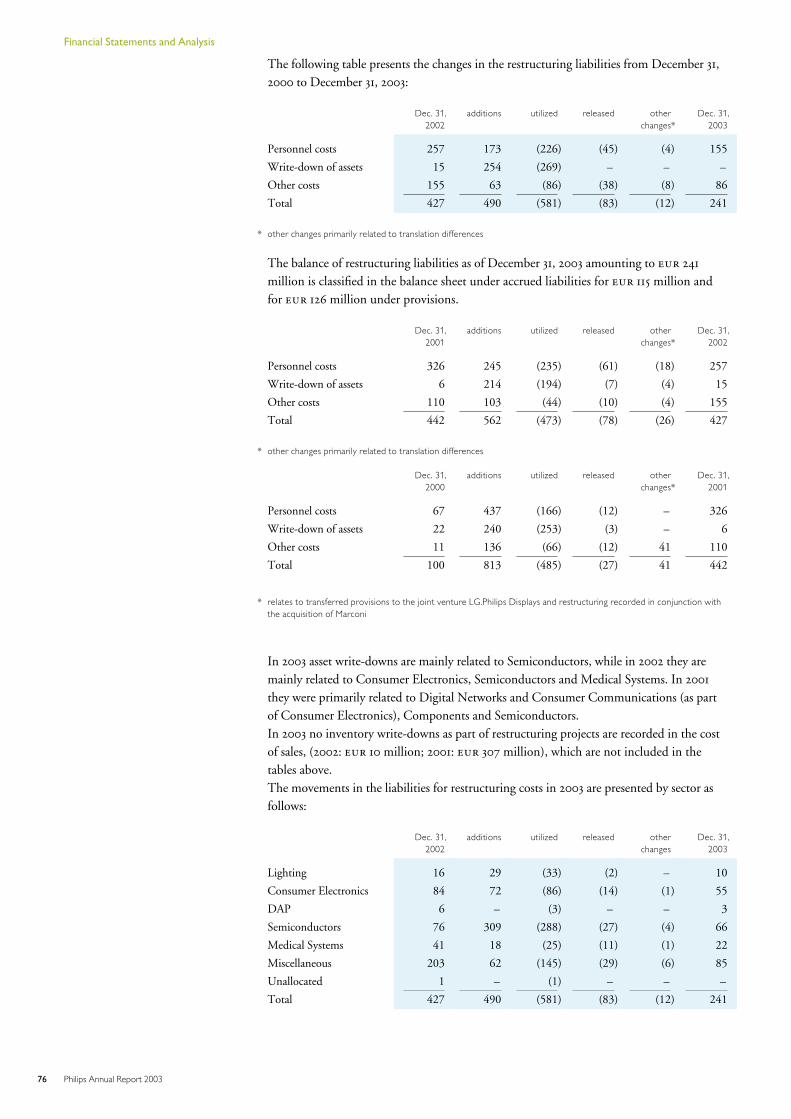
The following table presents the changes in the restructuring liabilities from December 31,2000 to December 31, 2003:
Dec. 31, additions utilized released other Dec. 31,2002 changes* 2003
Personnel costs 257 173 (226) (45) (4) 155
Write-down of assets 15 254 (269) – – –
Other costs 155 63 (86) (38) (8) 86
Total 427 490 (581) (83) (12) 241
* other changes primarily related to translation differences
The balance of restructuring liabilities as of December 31, 2003 amounting to 241
million is classified in the balance sheet under accrued liabilities for 115 million andfor 126 million under provisions.
Dec. 31, additions utilized released other Dec. 31,2001 changes* 2002
Personnel costs 326 245 (235) (61) (18) 257
Write-down of assets 6 214 (194) (7) (4) 15
Other costs 110 103 (44) (10) (4) 155
Total 442 562 (473) (78) (26) 427
* other changes primarily related to translation differences
Dec. 31, additions utilized released other Dec. 31,2000 changes* 2001
Personnel costs 67 437 (166) (12) – 326
Write-down of assets 22 240 (253) (3) – 6
Other costs 11 136 (66) (12) 41 110
Total 100 813 (485) (27) 41 442
* relates to transferred provisions to the joint venture LG.Philips Displays and restructuring recorded in conjunction withthe acquisition of Marconi
In 2003 asset write-downs are mainly related to Semiconductors, while in 2002 they aremainly related to Consumer Electronics, Semiconductors and Medical Systems. In 2001
they were primarily related to Digital Networks and Consumer Communications (as partof Consumer Electronics), Components and Semiconductors.In 2003 no inventory write-downs as part of restructuring projects are recorded in the costof sales, (2002: 10 million; 2001: 307 million), which are not included in thetables above.The movements in the liabilities for restructuring costs in 2003 are presented by sector asfollows:
Dec. 31, additions utilized released other Dec. 31,2002 changes 2003
Lighting 16 29 (33) (2) – 10
Consumer Electronics 84 72 (86) (14) (1) 55
DAP 6 – (3) – – 3
Semiconductors 76 309 (288) (27) (4) 66
Medical Systems 41 18 (25) (11) (1) 22
Miscellaneous 203 62 (145) (29) (6) 85
Unallocated 1 – (1) – – –
Total 427 490 (581) (83) (12) 241
76 Philips Annual Report 2003
Financial Statements and Analysis
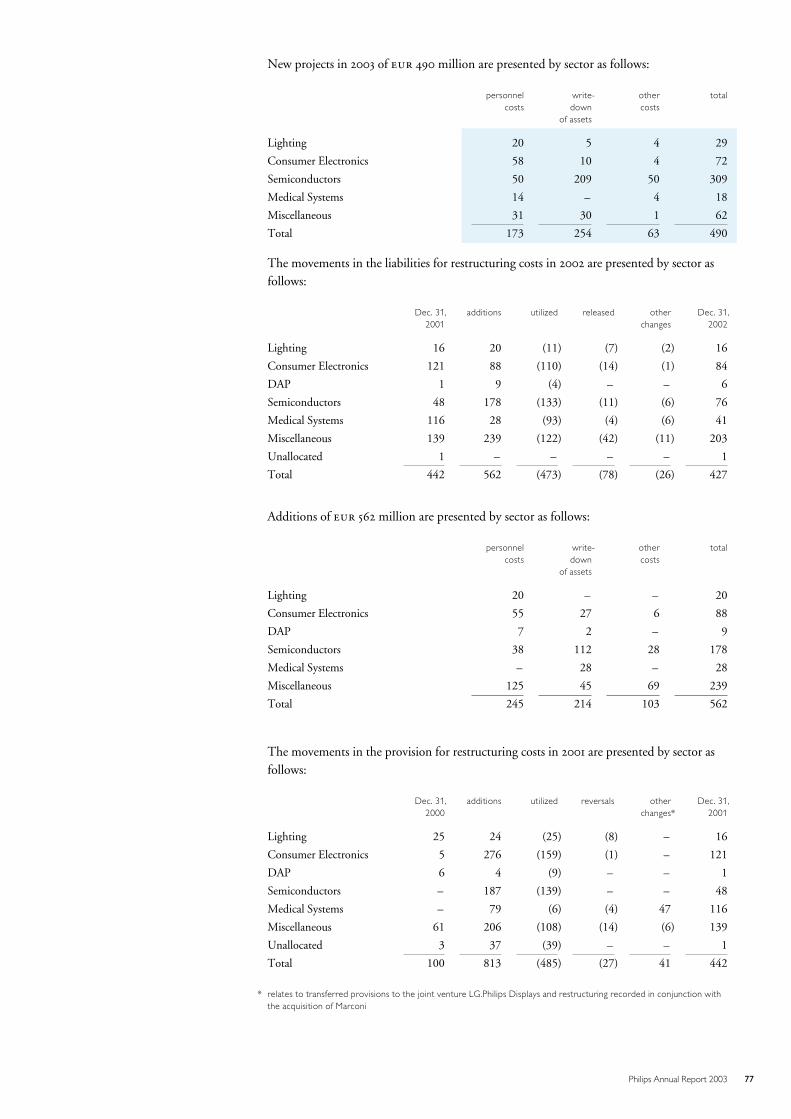
New projects in 2003 of 490 million are presented by sector as follows:
personnel write- other totalcosts down costs
of assets
Lighting 20 5 4 29
Consumer Electronics 58 10 4 72
Semiconductors 50 209 50 309
Medical Systems 14 – 4 18
Miscellaneous 31 30 1 62
Total 173 254 63 490
The movements in the liabilities for restructuring costs in 2002 are presented by sector asfollows:
Dec. 31, additions utilized released other Dec. 31,2001 changes 2002
Lighting 16 20 (11) (7) (2) 16
Consumer Electronics 121 88 (110) (14) (1) 84
DAP 1 9 (4) – – 6
Semiconductors 48 178 (133) (11) (6) 76
Medical Systems 116 28 (93) (4) (6) 41
Miscellaneous 139 239 (122) (42) (11) 203
Unallocated 1 – – – – 1
Total 442 562 (473) (78) (26) 427
Additions of 562 million are presented by sector as follows:
personnel write- other totalcosts down costs
of assets
Lighting 20 – – 20
Consumer Electronics 55 27 6 88
DAP 7 2 – 9
Semiconductors 38 112 28 178
Medical Systems – 28 – 28
Miscellaneous 125 45 69 239
Total 245 214 103 562
The movements in the provision for restructuring costs in 2001 are presented by sector asfollows:
Dec. 31, additions utilized reversals other Dec. 31,2000 changes* 2001
Lighting 25 24 (25) (8) – 16
Consumer Electronics 5 276 (159) (1) – 121
DAP 6 4 (9) – – 1
Semiconductors – 187 (139) – – 48
Medical Systems – 79 (6) (4) 47 116
Miscellaneous 61 206 (108) (14) (6) 139
Unallocated 3 37 (39) – – 1
Total 100 813 (485) (27) 41 442
* relates to transferred provisions to the joint venture LG.Philips Displays and restructuring recorded in conjunction withthe acquisition of Marconi
77Philips Annual Report 2003
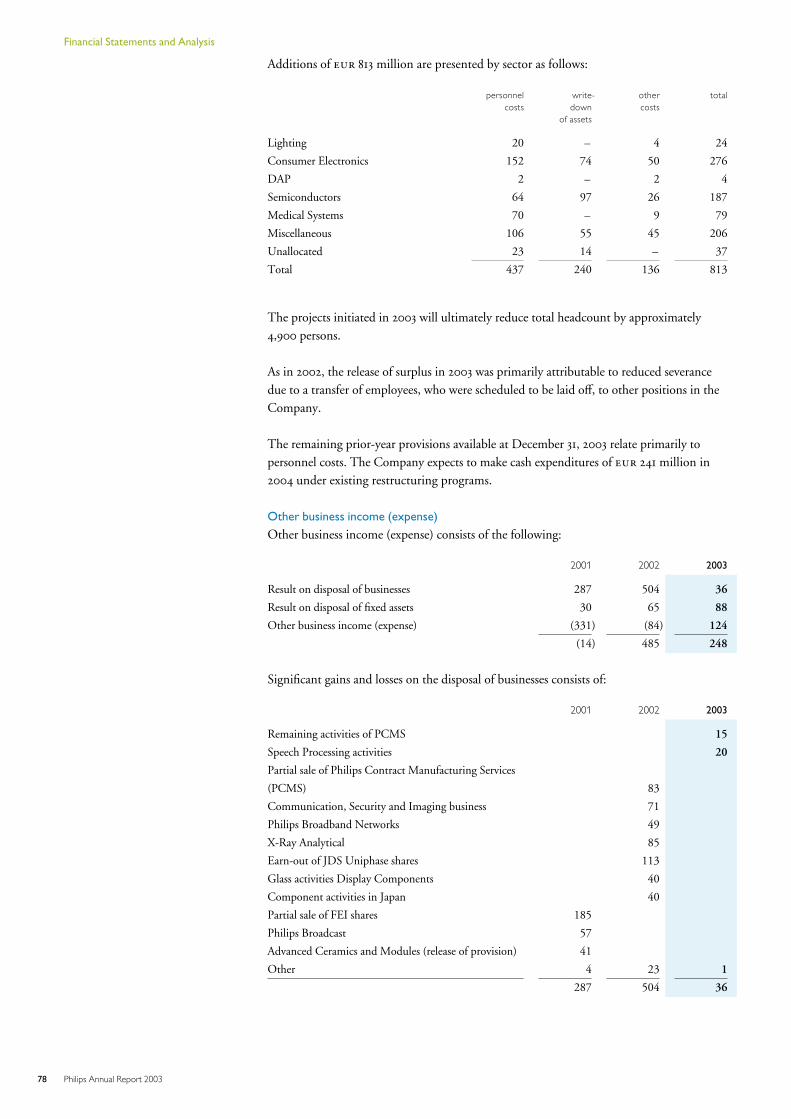
Additions of 813 million are presented by sector as follows:
personnel write- other totalcosts down costs
of assets
Lighting 20 – 4 24
Consumer Electronics 152 74 50 276
DAP 2 – 2 4
Semiconductors 64 97 26 187
Medical Systems 70 – 9 79
Miscellaneous 106 55 45 206
Unallocated 23 14 – 37
Total 437 240 136 813
The projects initiated in 2003 will ultimately reduce total headcount by approximately4,900 persons.
As in 2002, the release of surplus in 2003 was primarily attributable to reduced severancedue to a transfer of employees, who were scheduled to be laid off, to other positions in theCompany.
The remaining prior-year provisions available at December 31, 2003 relate primarily topersonnel costs. The Company expects to make cash expenditures of 241 million in2004 under existing restructuring programs.
Other business income (expense)
Other business income (expense) consists of the following:
2001 2002 2003
Result on disposal of businesses 287 504 36
Result on disposal of fixed assets 30 65 88
Other business income (expense) (331) (84) 124
(14) 485 248
Significant gains and losses on the disposal of businesses consists of:
2001 2002 2003
Remaining activities of PCMS 15
Speech Processing activities 20
Partial sale of Philips Contract Manufacturing Services
(PCMS) 83
Communication, Security and Imaging business 71
Philips Broadband Networks 49
X-Ray Analytical 85
Earn-out of JDS Uniphase shares 113
Glass activities Display Components 40
Component activities in Japan 40
Partial sale of FEI shares 185
Philips Broadcast 57
Advanced Ceramics and Modules (release of provision) 41
Other 4 23 1
287 504 36
78 Philips Annual Report 2003
Financial Statements and Analysis
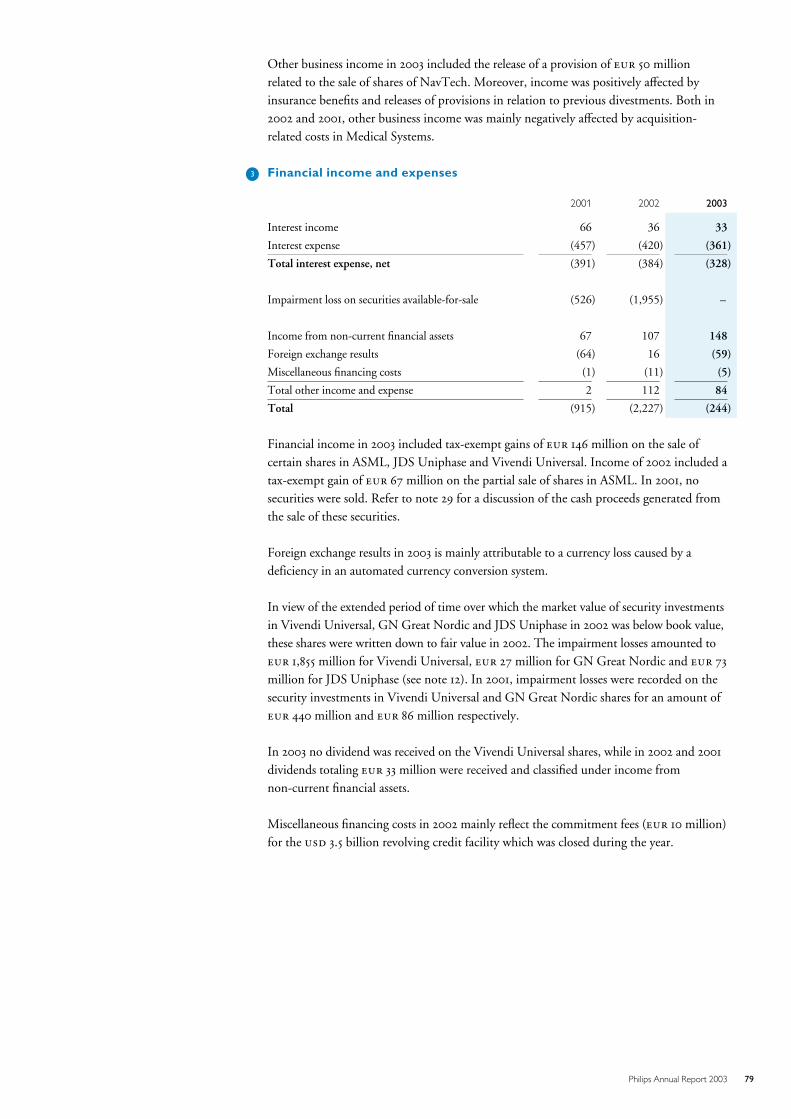
Other business income in 2003 included the release of a provision of 50 millionrelated to the sale of shares of NavTech. Moreover, income was positively affected byinsurance benefits and releases of provisions in relation to previous divestments. Both in2002 and 2001, other business income was mainly negatively affected by acquisition-related costs in Medical Systems.
L3 Financial income and expenses
2001 2002 2003
Interest income 66 36 33
Interest expense (457) (420) (361)
Total interest expense, net (391) (384) (328)
Impairment loss on securities available-for-sale (526) (1,955) –
Income from non-current financial assets 67 107 148
Foreign exchange results (64) 16 (59)
Miscellaneous financing costs (1) (11) (5)
Total other income and expense 2 112 84
Total (915) (2,227) (244)
Financial income in 2003 included tax-exempt gains of 146 million on the sale ofcertain shares in ASML, JDS Uniphase and Vivendi Universal. Income of 2002 included atax-exempt gain of 67 million on the partial sale of shares in ASML. In 2001, nosecurities were sold. Refer to note 29 for a discussion of the cash proceeds generated fromthe sale of these securities.
Foreign exchange results in 2003 is mainly attributable to a currency loss caused by adeficiency in an automated currency conversion system.
In view of the extended period of time over which the market value of security investmentsin Vivendi Universal, GN Great Nordic and JDS Uniphase in 2002 was below book value,these shares were written down to fair value in 2002. The impairment losses amounted to 1,855 million for Vivendi Universal, 27 million for GN Great Nordic and 73
million for JDS Uniphase (see note 12). In 2001, impairment losses were recorded on thesecurity investments in Vivendi Universal and GN Great Nordic shares for an amount of 440 million and 86 million respectively.
In 2003 no dividend was received on the Vivendi Universal shares, while in 2002 and 2001
dividends totaling 33 million were received and classified under income fromnon-current financial assets.
Miscellaneous financing costs in 2002 mainly reflect the commitment fees ( 10 million)for the 3.5 billion revolving credit facility which was closed during the year.
79Philips Annual Report 2003
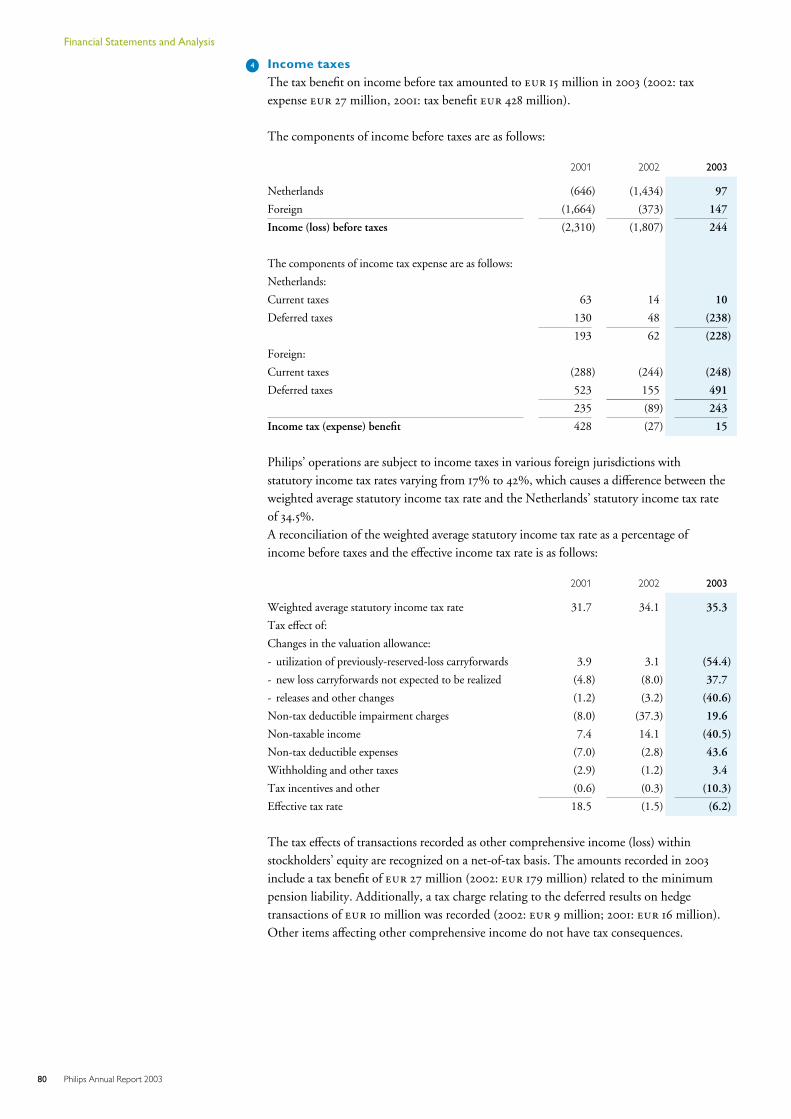
L4 Income taxesThe tax benefit on income before tax amounted to 15 million in 2003 (2002: taxexpense 27 million, 2001: tax benefit 428 million).
The components of income before taxes are as follows:
2001 2002 2003
Netherlands (646) (1,434) 97
Foreign (1,664) (373) 147
Income (loss) before taxes (2,310) (1,807) 244
The components of income tax expense are as follows:
Netherlands:
Current taxes 63 14 10
Deferred taxes 130 48 (238)
193 62 (228)
Foreign:
Current taxes (288) (244) (248)
Deferred taxes 523 155 491
235 (89) 243
Income tax (expense) benefit 428 (27) 15
Philips’ operations are subject to income taxes in various foreign jurisdictions withstatutory income tax rates varying from 17% to 42%, which causes a difference between theweighted average statutory income tax rate and the Netherlands’ statutory income tax rateof 34.5%.A reconciliation of the weighted average statutory income tax rate as a percentage ofincome before taxes and the effective income tax rate is as follows:
2001 2002 2003
Weighted average statutory income tax rate 31.7 34.1 35.3
Tax effect of:
Changes in the valuation allowance:
- utilization of previously-reserved-loss carryforwards 3.9 3.1 (54.4)
- new loss carryforwards not expected to be realized (4.8) (8.0) 37.7
- releases and other changes (1.2) (3.2) (40.6)
Non-tax deductible impairment charges (8.0) (37.3) 19.6
Non-taxable income 7.4 14.1 (40.5)
Non-tax deductible expenses (7.0) (2.8) 43.6
Withholding and other taxes (2.9) (1.2) 3.4
Tax incentives and other (0.6) (0.3) (10.3)
Effective tax rate 18.5 (1.5) (6.2)
The tax effects of transactions recorded as other comprehensive income (loss) withinstockholders’ equity are recognized on a net-of-tax basis. The amounts recorded in 2003
include a tax benefit of 27 million (2002: 179 million) related to the minimumpension liability. Additionally, a tax charge relating to the deferred results on hedgetransactions of 10 million was recorded (2002: 9 million; 2001: 16 million).Other items affecting other comprehensive income do not have tax consequences.
80 Philips Annual Report 2003
Financial Statements and Analysis
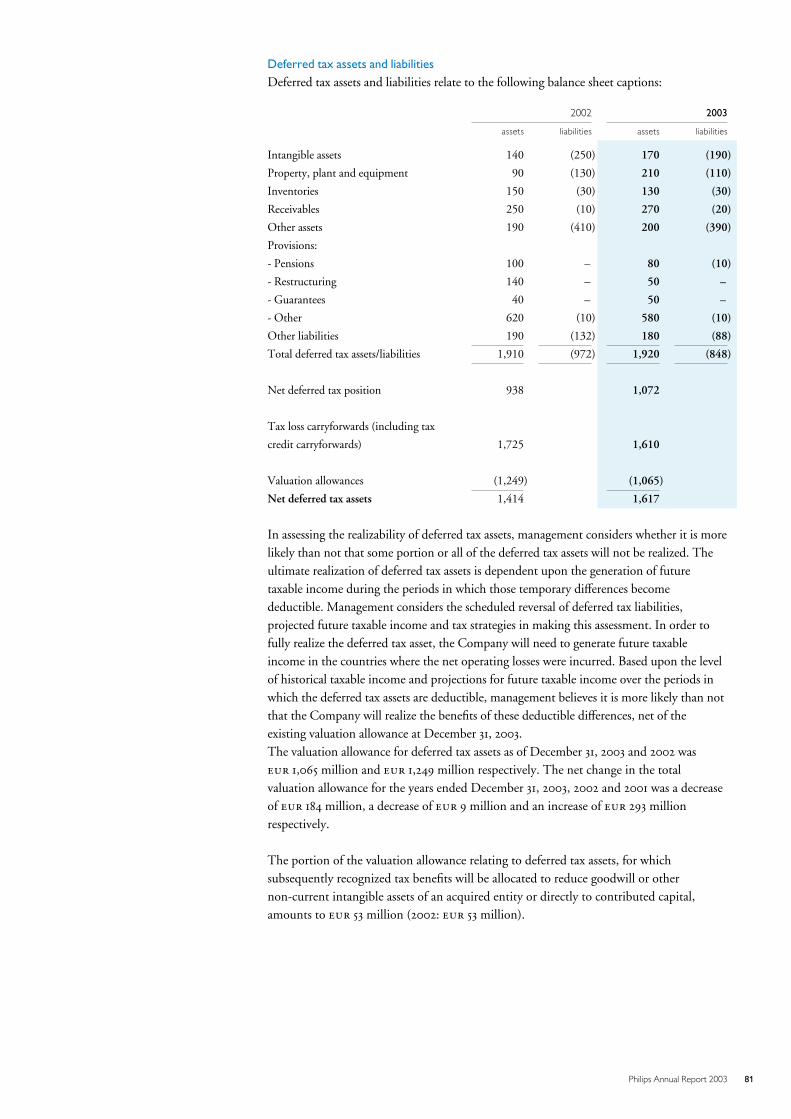
Deferred tax assets and liabilities
Deferred tax assets and liabilities relate to the following balance sheet captions:
2002 2003
assets liabilities assets liabilities
Intangible assets 140 (250) 170 (190)
Property, plant and equipment 90 (130) 210 (110)
Inventories 150 (30) 130 (30)
Receivables 250 (10) 270 (20)
Other assets 190 (410) 200 (390)
Provisions:
- Pensions 100 – 80 (10)
- Restructuring 140 – 50 –
- Guarantees 40 – 50 –
- Other 620 (10) 580 (10)
Other liabilities 190 (132) 180 (88)
Total deferred tax assets/liabilities 1,910 (972) 1,920 (848)
Net deferred tax position 938 1,072
Tax loss carryforwards (including tax
credit carryforwards) 1,725 1,610
Valuation allowances (1,249) (1,065)
Net deferred tax assets 1,414 1,617
In assessing the realizability of deferred tax assets, management considers whether it is morelikely than not that some portion or all of the deferred tax assets will not be realized. Theultimate realization of deferred tax assets is dependent upon the generation of futuretaxable income during the periods in which those temporary differences becomedeductible. Management considers the scheduled reversal of deferred tax liabilities,projected future taxable income and tax strategies in making this assessment. In order tofully realize the deferred tax asset, the Company will need to generate future taxableincome in the countries where the net operating losses were incurred. Based upon the levelof historical taxable income and projections for future taxable income over the periods inwhich the deferred tax assets are deductible, management believes it is more likely than notthat the Company will realize the benefits of these deductible differences, net of theexisting valuation allowance at December 31, 2003.The valuation allowance for deferred tax assets as of December 31, 2003 and 2002 was 1,065 million and 1,249 million respectively. The net change in the totalvaluation allowance for the years ended December 31, 2003, 2002 and 2001 was a decreaseof 184 million, a decrease of 9 million and an increase of 293 millionrespectively.
The portion of the valuation allowance relating to deferred tax assets, for whichsubsequently recognized tax benefits will be allocated to reduce goodwill or othernon-current intangible assets of an acquired entity or directly to contributed capital,amounts to 53 million (2002: 53 million).
81Philips Annual Report 2003
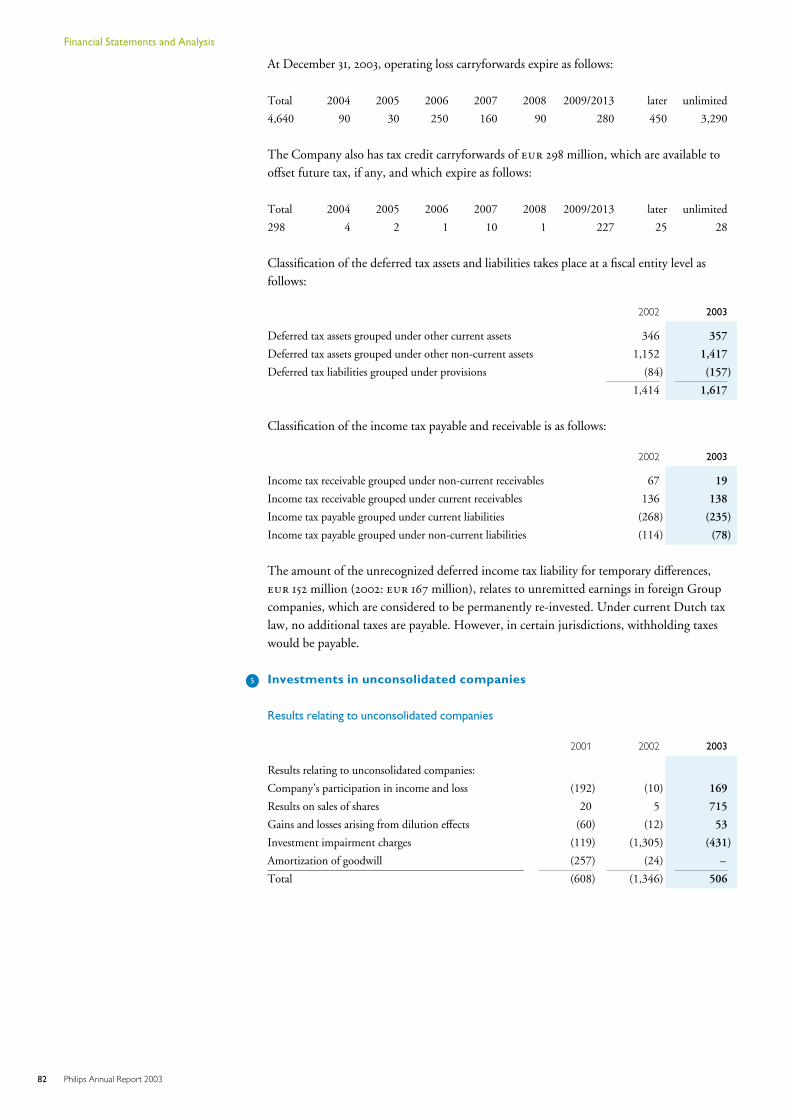
At December 31, 2003, operating loss carryforwards expire as follows:
Total 2004 2005 2006 2007 2008 2009/2013 later unlimited
4,640 90 30 250 160 90 280 450 3,290
The Company also has tax credit carryforwards of 298 million, which are available tooffset future tax, if any, and which expire as follows:
Total 2004 2005 2006 2007 2008 2009/2013 later unlimited
298 4 2 1 10 1 227 25 28
Classification of the deferred tax assets and liabilities takes place at a fiscal entity level asfollows:
2002 2003
Deferred tax assets grouped under other current assets 346 357
Deferred tax assets grouped under other non-current assets 1,152 1,417
Deferred tax liabilities grouped under provisions (84) (157)
1,414 1,617
Classification of the income tax payable and receivable is as follows:
2002 2003
Income tax receivable grouped under non-current receivables 67 19
Income tax receivable grouped under current receivables 136 138
Income tax payable grouped under current liabilities (268) (235)
Income tax payable grouped under non-current liabilities (114) (78)
The amount of the unrecognized deferred income tax liability for temporary differences, 152 million (2002: 167 million), relates to unremitted earnings in foreign Groupcompanies, which are considered to be permanently re-invested. Under current Dutch taxlaw, no additional taxes are payable. However, in certain jurisdictions, withholding taxeswould be payable.
L5 Investments in unconsolidated companies
Results relating to unconsolidated companies
2001 2002 2003
Results relating to unconsolidated companies:
Company’s participation in income and loss (192) (10) 169
Results on sales of shares 20 5 715
Gains and losses arising from dilution effects (60) (12) 53
Investment impairment charges (119) (1,305) (431)
Amortization of goodwill (257) (24) –
Total (608) (1,346) 506
82 Philips Annual Report 2003
Financial Statements and Analysis
The Company’s participation in the results of unconsolidated companies for 2003 includedincome of 382 million for LG.Philips LCD. The 2003 results relating tounconsolidated companies also included the Company’s share in the loss of LG.PhilipsDisplays, which amounted to 385 million. LG.Philips Displays’ loss was primarilyattributable to impairment charges recorded in conjunction with a write-down of itsassets. Various other unconsolidated companies (primarily TSMC and Atos Origin)contributed a net profit of 172 million.
In 2003 LG.Philips Displays (LPD) was impacted by worsening market conditions andincreased price erosion, mainly caused by the rapid penetration of the Liquid CrystalDisplay (LCD) panels for application in TV and monitors. Therefore LPD has reviewedits business plan and worked out a program to adjust its capacity and maintain its costleadership. Execution of this program will strengthen LPD’s competitiveness and shouldsecure continued positive cash flow. For LPD the revised market outlook resulted in anon-cash asset impairment charge of 771 million and in restructuring charges ofapproximately 171 million in 2003. As a consequence of those charges the equity ofthe company became negative and LPD breached some covenants in its financingagreements.A refinancing package is currently being negotiated with the financiers of LPD. In thecontext of these negotiations, both parents have indicated their willingness to contributecash to increase the equity of the company by 250 million by each parent. As part ofthe negotiations, both parents have required that the guarantees that were issued in May2002 for an amount of 200 million by each parent as security for all principal,interest and fees payable by LPD under its 2 billion facility agreement will be releasedand replaced by a guarantee of 50 million by each parent for the payment obligationsof LPD in relation to its bank restructured debt under the LPD refinancing plan.Additional financial support of 50 million has been provided by each parent inJanuary 2004 which is also part of the negotiations. This will result in a permanent 100 million reduction in working capital financing needs for LPD during the life ofthe restructured bank debt. The financial restructuring of LPD is subject to agreement byPhilips and all other parties involved.The Company recorded an impairment charge of 411 million related to thewrite-down of its investment in LPD.
The results relating to unconsolidated companies for 2003 were affected by several otheritems. Results on the sale of shares includes a gain of 695 million resulting from thesale of 100 million American Depository Shares each representing 5 common shares ofTSMC. Following the aforementioned sale of TSMC shares, Philips’ shareholding inTSMC was reduced to 19.1% at December 31, 2003. The Company continues to applyequity accounting for TSMC as the exercise of significant influence continues to bedemonstrated by representation on the board of directors and by participation in thepolicy making processes of TSMC. Also, numerous business and contractual relationshipsand arrangements that are maintained for the sake of profit, prove ownership of a residualinterest in the equity of TSMC.
According to TSMC’s Articles of Incorporation, yearly bonuses to employees have beengranted partially in shares. Generally also stock dividends will be paid. During the thirdquarter of 2003, new shares were issued in grants to employees and as a stock dividend.Because Philips only participates in the stock dividend distribution, its shareholding inTSMC was diluted as a result of shares issued to employees. Accordingly, Philips recordeda dilution loss of 15 million. This dilution loss decreased the book value of Philips inTSMC and is charged to income under results related to unconsolidated companies.
83Philips Annual Report 2003
On August 16, 2002, Atos Origin purchased all of the common stock of KPMGConsulting in the UK and the Netherlands. The consideration for the acquisitionconsisted of the issue of 3,657,000 bonds redeemable in shares (ORA bonds) with stocksubscription warrants attached at a price of 64.20 each, representing a total amountof 235 million, and a cash payment of 417 million.The bonds and warrant bonds were redeemed in shares on August 16, 2003. As aconsequence, Philips’ shareholding was diluted from 48.4% to 44.7%, resulting in adilution gain of 68 million. This dilution gain increased the book value of Philips’investment in Atos Origin and was credited to income under results related tounconsolidated companies.
Philips’ share in the 2002 net income of LG.Philips LCD amounted to a profit of 169
million. Various other unconsolidated companies (primarily TSMC, SSMC and AtosOrigin) contributed on balance a profit of 94 million. The Company’s share in the2002 loss of LG.Philips Displays totaled 273 million. The loss was attributable to animpairment charge recorded by them in conjunction with a structural reduction of fixedcosts.The Company recognized impairment charges of 1,305 million in 2002. Thesecharges related to the investment in LG.Philips Displays ( 275 million), a write-downof the investment in Atos Origin ( 921 million) to its lower market value, andwrite-downs of several smaller investments ( 109 million).The dilution effect of Philips’ shareholding in TSMC amounted to a loss of 12
million, reducing Philips’ shareholding by 0.12%.
Included in amortization of goodwill in 2002 is 24 million relating to the fourthquarter of 2001 of Atos Origin, as the latter’s results are reported on a three-month delaybasis.
Results in 2001 relating to unconsolidated companies included the amortization of theexcess of the Company’s investment over its underlying equity in the net assets ofunconsolidated companies ( 90 million) and the Company’s share of amortizationrecorded by the unconsolidated companies ( 167 million). As from January 1, 2002
(from June 30, 2001 for goodwill on business combinations after that date), goodwillrecorded by the unconsolidated companies is no longer amortized but instead tested forimpairment at least annually. Also, the amortization of the excess of the Company’sinvestment over its underlying equity in the net assets of unconsolidated companiesceased as from January 1, 2002. Instead the Company has tested its investments forimpairment whenever there are indications of impairment, which resulted in theabove-mentioned impairment charges in 2002.
In 2001, Philips sold its ownership in Philips Matsushita Battery Corporation, resulting ina gain of 20 million. The results of LG.Philips Displays include a restructuringcharge of 89 million. The employee stock option program of TSMC had a dilutioneffect on Philips’ shareholding in the company, amounting to a loss of 60 million.Additionally, results of TSMC included a special charge of 82 million for impairmentat a TSMC subsidiary, partly offset by a gain of 41 million related to a reduction inthe provision for withholding tax.
84 Philips Annual Report 2003
Financial Statements and Analysis
Investments in, and loans to, unconsolidated companies
The changes during 2003 are as follows:
total investments loans
Balance of equity method investments as of January 1,
2003 5,968 5,573 395
Changes:
Reclassification from property, plant and equipment 190 190 –
Acquisitions/additions 336 281 55
Sales/repayments (570) (218) (352)
Impairments (754) (754) –
Share in income/value adjustments 606 610 (4)
Dividends received (1) (1) –
Translation and exchange rate differences (1,013) (978) (35)
Balance of equity method investments as of December
31, 2003 4,762 4,703 59
Cost method investments 79 79 –
Balance as of December 31, 2003 4,841 4,782 59
Included in investments is 967 million (2002: 1,761 million) representing theexcess of the Company’s investment over its underlying equity in the net assets of theunconsolidated companies. The principal amounts are 906 million (2002: 1,059
million) for LG.Philips LCD, and 38 million (2002: 685 million) for LG.PhilipsDisplays.
During 2003 redeemable preferred shares of TSMC in the amount of 357 millionwere repaid.The total carrying value of investments in, and loans to, unconsolidated companies issummarized as follows:
2002 2003
shareholding % amount
Philips’ joint ventures with LGE (Korea) 2,918 50 1,906
Taiwan Semiconductor Manufacturing Co. (Taiwan) 2,228 19 1,595
Atos Origin (France) 495 45 560
Other equity method investments 327 701
5,968 4,762
Total cost method investments 121 79
Total 6,089 4,841
The fair values of Philips’ shareholdings in TSMC and Atos Origin, based on quotedmarket prices at December 31, 2003, were 5,748 million and 1,081 millionrespectively.
85Philips Annual Report 2003
Summarized financial information for the Company’s equity investments in unconsolidated
companies on a combined basis is presented below:January-December
2001 2002 2003
Net sales 12,697 16,742 17,439
Income before taxes (911) 667 1,176
Income taxes 38 (274) (118)
Income after taxes (873) 393 1,058
Net income (1,091) 140 1,034
Total share in net income of unconsolidated companies
recognized in the consolidated statements of income (192) (10) 169
December 31,
2002 2003
Current assets 7,714 8,523
Non-current assets 18,546 14,378
26,260 22,901
Current liabilities (5,671) (6,874)
Non-current liabilities (5,406) (3,389)
Net asset value 15,183 12,638
Investment in and loans to unconsolidated companies, excl. goodwill 4,207 3,795
Goodwill related to unconsolidated companies 1,761 967
Investments in and loans to unconsolidated companies included in the
consolidated balance sheet 5,968 4,762
L6 Minority interestsThe share of minority interests in the income of Group companies in 2003 amounted to 56 million, compared with their share in the 2002 income of 26 million andtheir share in the loss of 15 million in 2001.
Minority interests in consolidated companies, totaling 175 million (2002: 179
million), are based on the third-party shareholding in the underlying net assets.
L7 Cumulative effect of a change in accounting principlesIn 2003, the Company adopted SFAS No. 143 ‘Accounting for Asset RetirementObligations’. The cumulative effect of this change in accounting principle related to prioryears was a one-time, non-cash charge to income of 14 million (net of taxes).
86 Philips Annual Report 2003
Financial Statements and Analysis
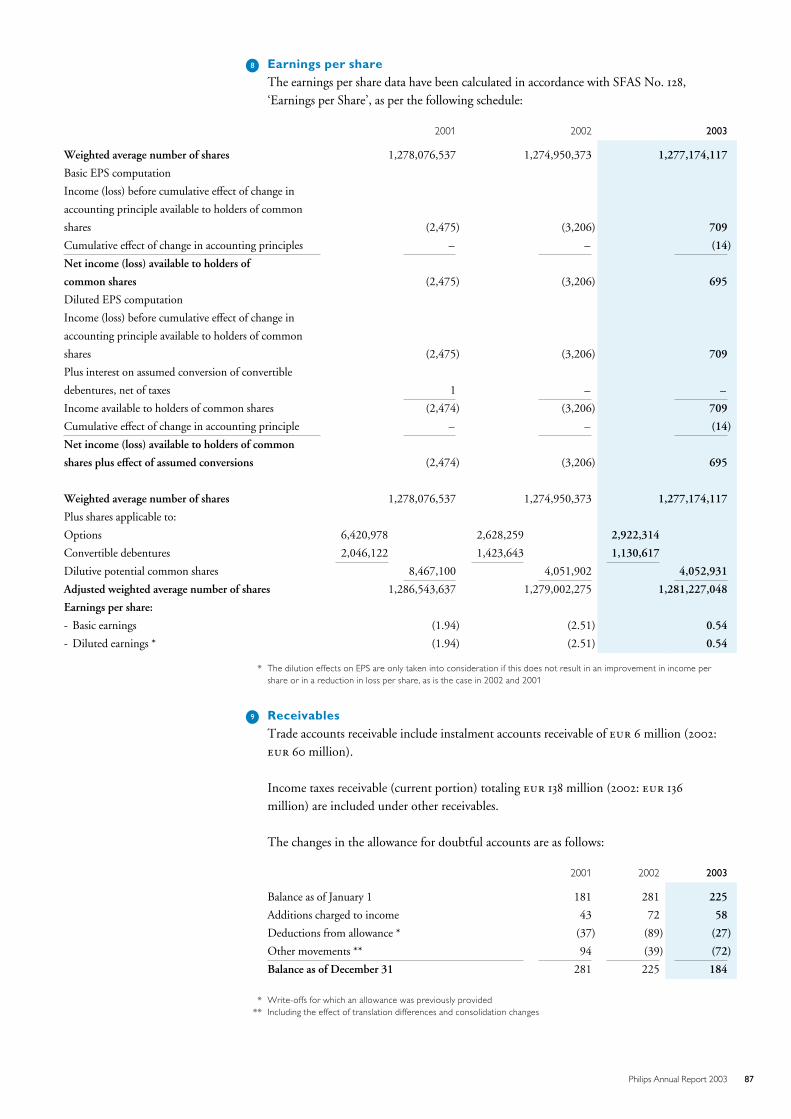
L8 Earnings per shareThe earnings per share data have been calculated in accordance with SFAS No. 128,‘Earnings per Share’, as per the following schedule:
2001 2002 2003
Weighted average number of shares 1,278,076,537 1,274,950,373 1,277,174,117
Basic EPS computation
Income (loss) before cumulative effect of change in
accounting principle available to holders of common
shares (2,475) (3,206) 709
Cumulative effect of change in accounting principles – – (14)
Net income (loss) available to holders of
common shares (2,475) (3,206) 695
Diluted EPS computation
Income (loss) before cumulative effect of change in
accounting principle available to holders of common
shares (2,475) (3,206) 709
Plus interest on assumed conversion of convertible
debentures, net of taxes 1 – –
Income available to holders of common shares (2,474) (3,206) 709
Cumulative effect of change in accounting principle – – (14)
Net income (loss) available to holders of common
shares plus effect of assumed conversions (2,474) (3,206) 695
Weighted average number of shares 1,278,076,537 1,274,950,373 1,277,174,117
Plus shares applicable to:
Options 6,420,978 2,628,259 2,922,314
Convertible debentures 2,046,122 1,423,643 1,130,617
Dilutive potential common shares 8,467,100 4,051,902 4,052,931
Adjusted weighted average number of shares 1,286,543,637 1,279,002,275 1,281,227,048
Earnings per share:
- Basic earnings (1.94) (2.51) 0.54
- Diluted earnings * (1.94) (2.51) 0.54
* The dilution effects on EPS are only taken into consideration if this does not result in an improvement in income pershare or in a reduction in loss per share, as is the case in 2002 and 2001
L9 ReceivablesTrade accounts receivable include instalment accounts receivable of 6 million (2002: 60 million).
Income taxes receivable (current portion) totaling 138 million (2002: 136
million) are included under other receivables.
The changes in the allowance for doubtful accounts are as follows:
2001 2002 2003
Balance as of January 1 181 281 225
Additions charged to income 43 72 58
Deductions from allowance * (37) (89) (27)
Other movements ** 94 (39) (72)
Balance as of December 31 281 225 184
* Write-offs for which an allowance was previously provided** Including the effect of translation differences and consolidation changes
87Philips Annual Report 2003
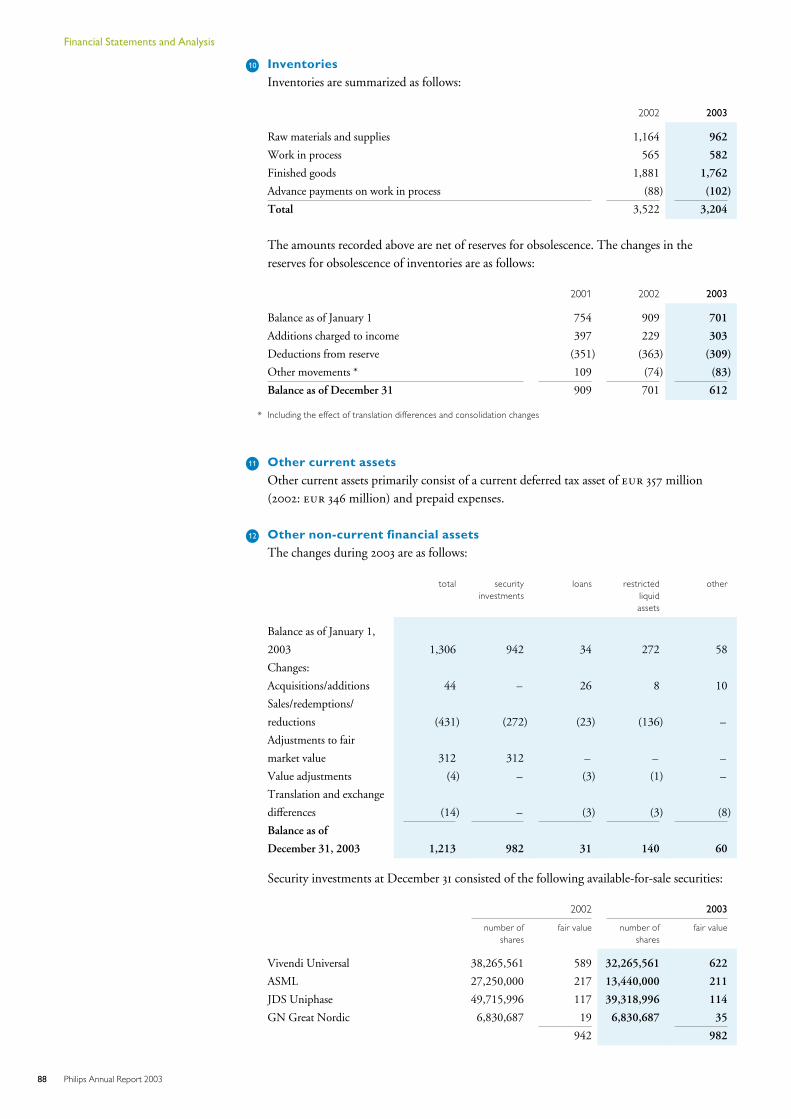
L10 InventoriesInventories are summarized as follows:
2002 2003
Raw materials and supplies 1,164 962
Work in process 565 582
Finished goods 1,881 1,762
Advance payments on work in process (88) (102)
Total 3,522 3,204
The amounts recorded above are net of reserves for obsolescence. The changes in thereserves for obsolescence of inventories are as follows:
2001 2002 2003
Balance as of January 1 754 909 701
Additions charged to income 397 229 303
Deductions from reserve (351) (363) (309)
Other movements * 109 (74) (83)
Balance as of December 31 909 701 612
* Including the effect of translation differences and consolidation changes
L11 Other current assetsOther current assets primarily consist of a current deferred tax asset of 357 million(2002: 346 million) and prepaid expenses.
L12 Other non-current financial assetsThe changes during 2003 are as follows:
total securityinvestments
loans restrictedliquidassets
other
Balance as of January 1,
2003 1,306 942 34 272 58
Changes:
Acquisitions/additions 44 – 26 8 10
Sales/redemptions/
reductions (431) (272) (23) (136) –
Adjustments to fair
market value 312 312 – – –
Value adjustments (4) – (3) (1) –
Translation and exchange
differences (14) – (3) (3) (8)
Balance as of
December 31, 2003 1,213 982 31 140 60
Security investments at December 31 consisted of the following available-for-sale securities:
2002 2003
number ofshares
fair value number ofshares
fair value
Vivendi Universal 38,265,561 589 32,265,561 622
ASML 27,250,000 217 13,440,000 211
JDS Uniphase 49,715,996 117 39,318,996 114
GN Great Nordic 6,830,687 19 6,830,687 35
942 982
88 Philips Annual Report 2003
Financial Statements and Analysis
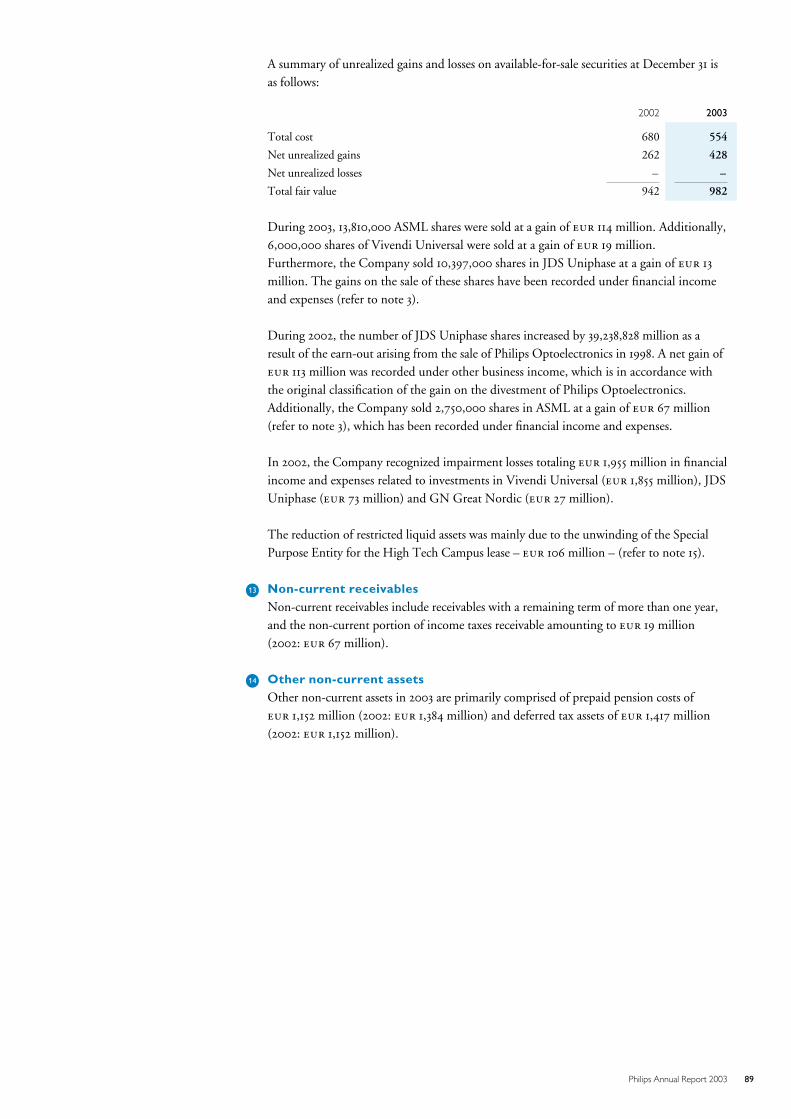
A summary of unrealized gains and losses on available-for-sale securities at December 31 isas follows:
2002 2003
Total cost 680 554
Net unrealized gains 262 428
Net unrealized losses – –
Total fair value 942 982
During 2003, 13,810,000 ASML shares were sold at a gain of 114 million. Additionally,6,000,000 shares of Vivendi Universal were sold at a gain of 19 million.Furthermore, the Company sold 10,397,000 shares in JDS Uniphase at a gain of 13
million. The gains on the sale of these shares have been recorded under financial incomeand expenses (refer to note 3).
During 2002, the number of JDS Uniphase shares increased by 39,238,828 million as aresult of the earn-out arising from the sale of Philips Optoelectronics in 1998. A net gain of 113 million was recorded under other business income, which is in accordance withthe original classification of the gain on the divestment of Philips Optoelectronics.Additionally, the Company sold 2,750,000 shares in ASML at a gain of 67 million(refer to note 3), which has been recorded under financial income and expenses.
In 2002, the Company recognized impairment losses totaling 1,955 million in financialincome and expenses related to investments in Vivendi Universal ( 1,855 million), JDSUniphase ( 73 million) and GN Great Nordic ( 27 million).
The reduction of restricted liquid assets was mainly due to the unwinding of the SpecialPurpose Entity for the High Tech Campus lease – 106 million – (refer to note 15).
L13 Non-current receivablesNon-current receivables include receivables with a remaining term of more than one year,and the non-current portion of income taxes receivable amounting to 19 million(2002: 67 million).
L14 Other non-current assetsOther non-current assets in 2003 are primarily comprised of prepaid pension costs of 1,152 million (2002: 1,384 million) and deferred tax assets of 1,417 million(2002: 1,152 million).
89Philips Annual Report 2003
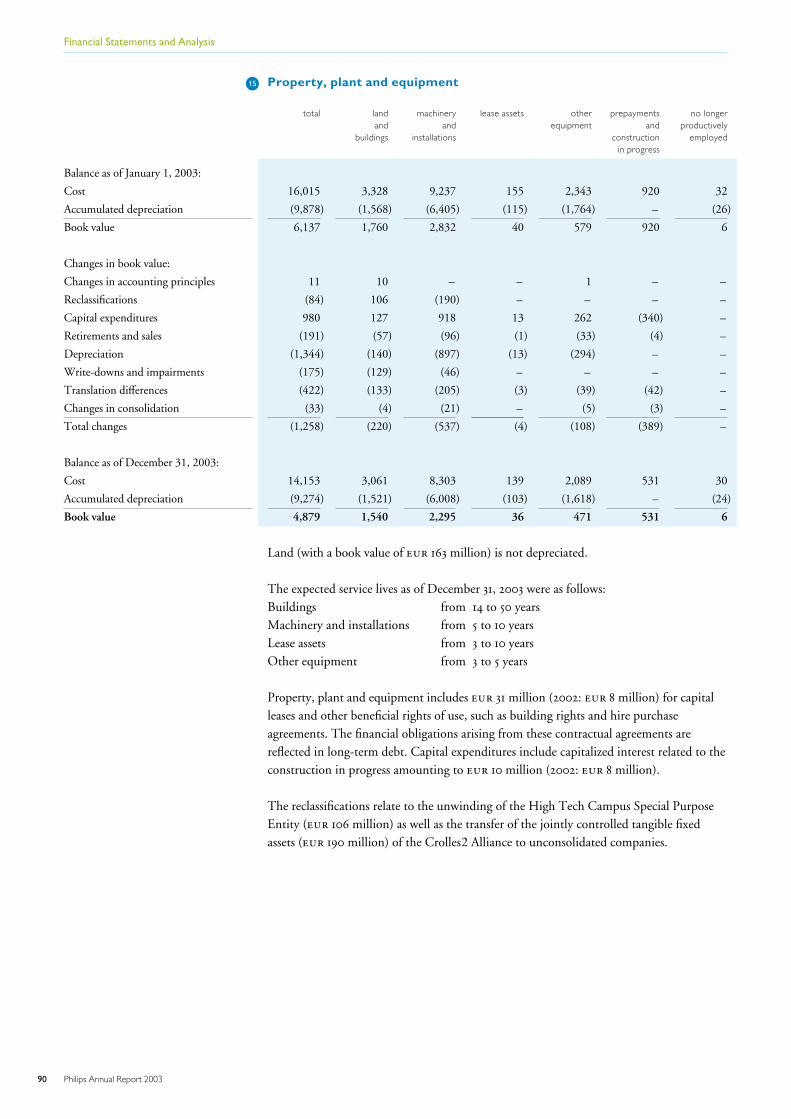
L15 Property, plant and equipment
total landand
buildings
machineryand
installations
lease assets otherequipment
prepaymentsand
constructionin progress
no longerproductively
employed
Balance as of January 1, 2003:
Cost 16,015 3,328 9,237 155 2,343 920 32
Accumulated depreciation (9,878) (1,568) (6,405) (115) (1,764) – (26)
Book value 6,137 1,760 2,832 40 579 920 6
Changes in book value:
Changes in accounting principles 11 10 – – 1 – –
Reclassifications (84) 106 (190) – – – –
Capital expenditures 980 127 918 13 262 (340) –
Retirements and sales (191) (57) (96) (1) (33) (4) –
Depreciation (1,344) (140) (897) (13) (294) – –
Write-downs and impairments (175) (129) (46) – – – –
Translation differences (422) (133) (205) (3) (39) (42) –
Changes in consolidation (33) (4) (21) – (5) (3) –
Total changes (1,258) (220) (537) (4) (108) (389) –
Balance as of December 31, 2003:
Cost 14,153 3,061 8,303 139 2,089 531 30
Accumulated depreciation (9,274) (1,521) (6,008) (103) (1,618) – (24)
Book value 4,879 1,540 2,295 36 471 531 6
Land (with a book value of 163 million) is not depreciated.
The expected service lives as of December 31, 2003 were as follows:Buildings from 14 to 50 yearsMachinery and installations from 5 to 10 yearsLease assets from 3 to 10 yearsOther equipment from 3 to 5 years
Property, plant and equipment includes 31 million (2002: 8 million) for capitalleases and other beneficial rights of use, such as building rights and hire purchaseagreements. The financial obligations arising from these contractual agreements arereflected in long-term debt. Capital expenditures include capitalized interest related to theconstruction in progress amounting to 10 million (2002: 8 million).
The reclassifications relate to the unwinding of the High Tech Campus Special PurposeEntity ( 106 million) as well as the transfer of the jointly controlled tangible fixedassets ( 190 million) of the Crolles 2 Alliance to unconsolidated companies.
90 Philips Annual Report 2003
Financial Statements and Analysis
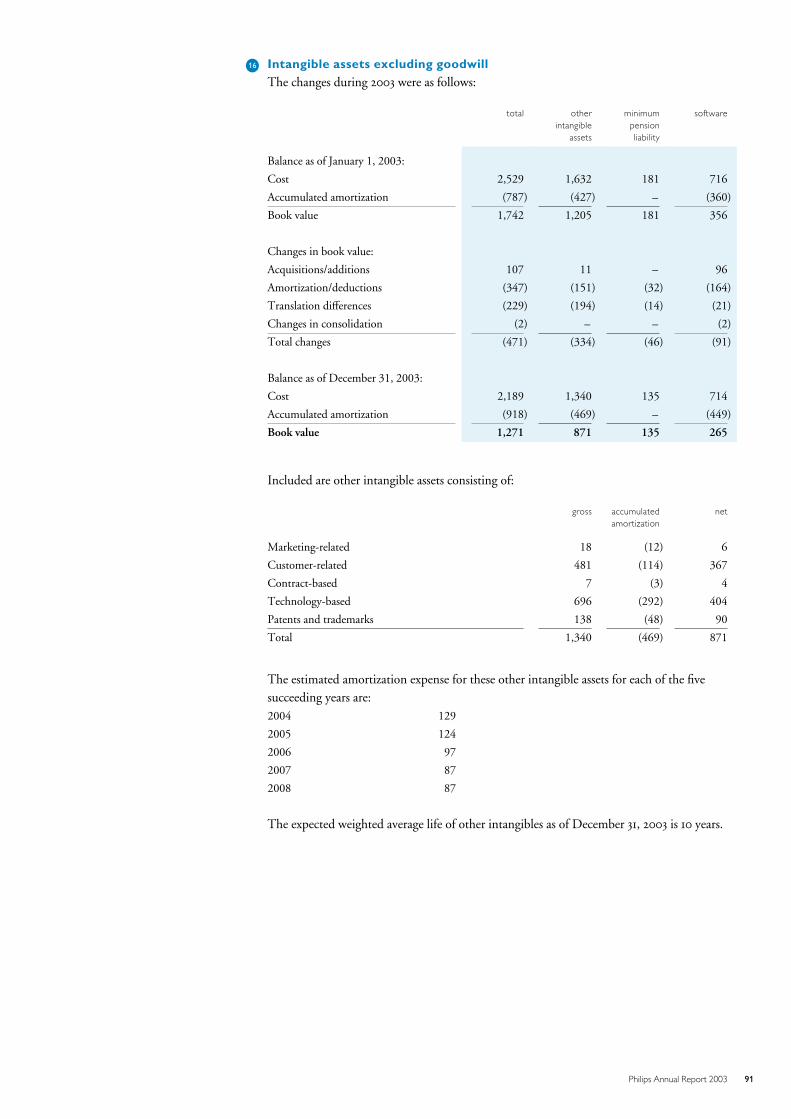
L16 Intangible assets excluding goodwillThe changes during 2003 were as follows:
total other minimum softwareintangible pension
assets liability
Balance as of January 1, 2003:
Cost 2,529 1,632 181 716
Accumulated amortization (787) (427) – (360)
Book value 1,742 1,205 181 356
Changes in book value:
Acquisitions/additions 107 11 – 96
Amortization/deductions (347) (151) (32) (164)
Translation differences (229) (194) (14) (21)
Changes in consolidation (2) – – (2)
Total changes (471) (334) (46) (91)
Balance as of December 31, 2003:
Cost 2,189 1,340 135 714
Accumulated amortization (918) (469) – (449)
Book value 1,271 871 135 265
Included are other intangible assets consisting of:
gross accumulatedamortization
net
Marketing-related 18 (12) 6
Customer-related 481 (114) 367
Contract-based 7 (3) 4
Technology-based 696 (292) 404
Patents and trademarks 138 (48) 90
Total 1,340 (469) 871
The estimated amortization expense for these other intangible assets for each of the fivesucceeding years are:2004 129
2005 124
2006 97
2007 87
2008 87
The expected weighted average life of other intangibles as of December 31, 2003 is 10 years.
91Philips Annual Report 2003
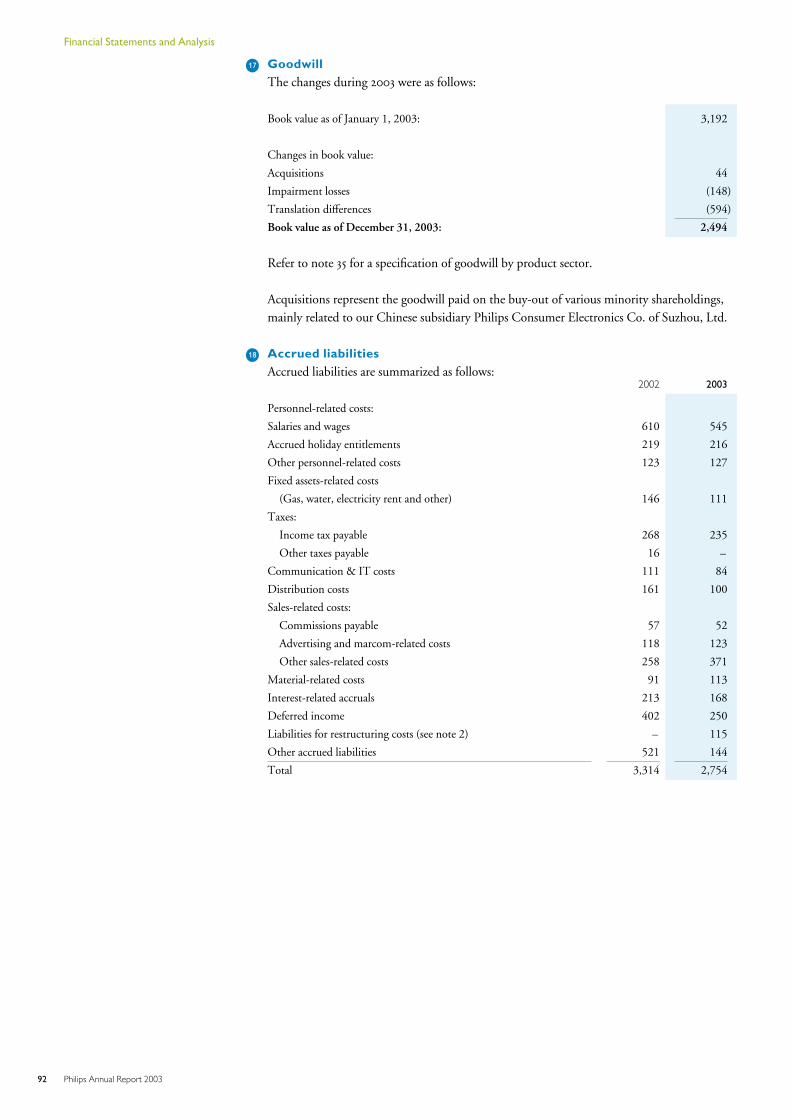
L17 GoodwillThe changes during 2003 were as follows:
Book value as of January 1, 2003: 3,192
Changes in book value:
Acquisitions 44
Impairment losses (148)
Translation differences (594)
Book value as of December 31, 2003: 2,494
Refer to note 35 for a specification of goodwill by product sector.
Acquisitions represent the goodwill paid on the buy-out of various minority shareholdings,mainly related to our Chinese subsidiary Philips Consumer Electronics Co. of Suzhou, Ltd.
L18 Accrued liabilitiesAccrued liabilities are summarized as follows:
2002 2003
Personnel-related costs:
Salaries and wages 610 545
Accrued holiday entitlements 219 216
Other personnel-related costs 123 127
Fixed assets-related costs
(Gas, water, electricity rent and other) 146 111
Taxes:
Income tax payable 268 235
Other taxes payable 16 –
Communication & IT costs 111 84
Distribution costs 161 100
Sales-related costs:
Commissions payable 57 52
Advertising and marcom-related costs 118 123
Other sales-related costs 258 371
Material-related costs 91 113
Interest-related accruals 213 168
Deferred income 402 250
Liabilities for restructuring costs (see note 2) – 115
Other accrued liabilities 521 144
Total 3,314 2,754
92 Philips Annual Report 2003
Financial Statements and Analysis
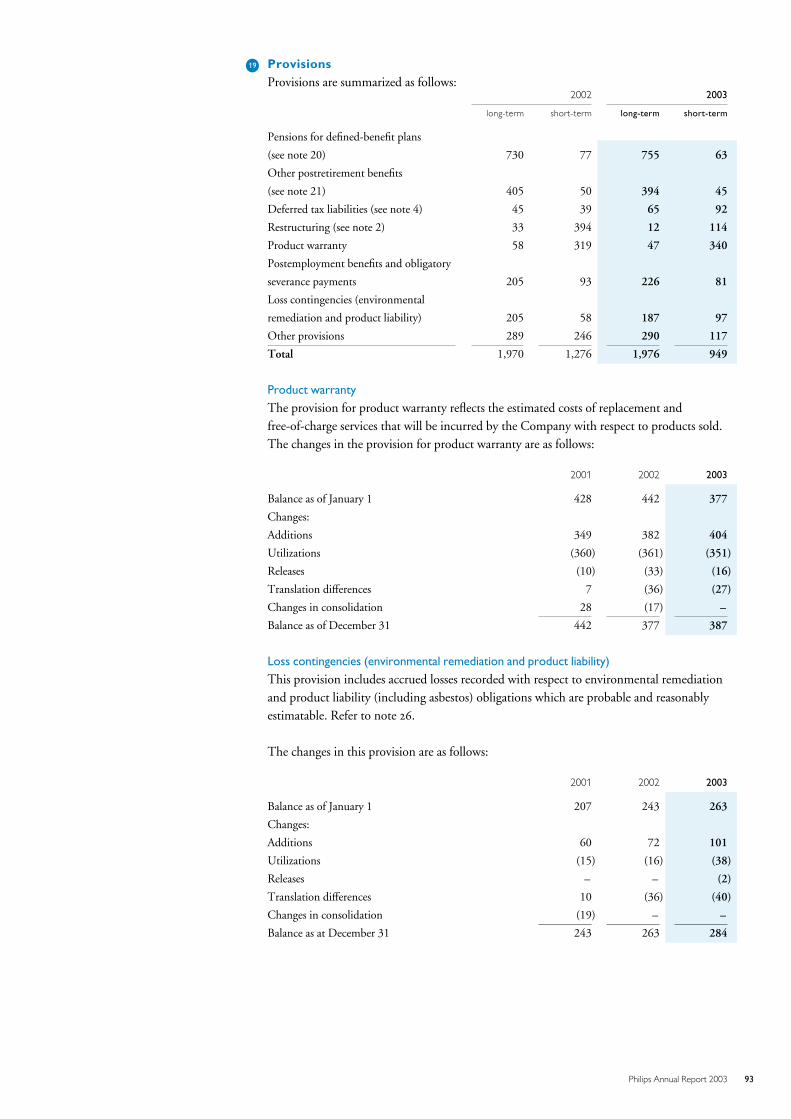
L19 ProvisionsProvisions are summarized as follows:
2002 2003
long-term short-term long-term short-term
Pensions for defined-benefit plans
(see note 20) 730 77 755 63
Other postretirement benefits
(see note 21) 405 50 394 45
Deferred tax liabilities (see note 4) 45 39 65 92
Restructuring (see note 2) 33 394 12 114
Product warranty 58 319 47 340
Postemployment benefits and obligatory
severance payments 205 93 226 81
Loss contingencies (environmental
remediation and product liability) 205 58 187 97
Other provisions 289 246 290 117
Total 1,970 1,276 1,976 949
Product warranty
The provision for product warranty reflects the estimated costs of replacement andfree-of-charge services that will be incurred by the Company with respect to products sold.The changes in the provision for product warranty are as follows:
2001 2002 2003
Balance as of January 1 428 442 377
Changes:
Additions 349 382 404
Utilizations (360) (361) (351)
Releases (10) (33) (16)
Translation differences 7 (36) (27)
Changes in consolidation 28 (17) –
Balance as of December 31 442 377 387
Loss contingencies (environmental remediation and product liability)
This provision includes accrued losses recorded with respect to environmental remediationand product liability (including asbestos) obligations which are probable and reasonablyestimatable. Refer to note 26.
The changes in this provision are as follows:
2001 2002 2003
Balance as of January 1 207 243 263
Changes:
Additions 60 72 101
Utilizations (15) (16) (38)
Releases – – (2)
Translation differences 10 (36) (40)
Changes in consolidation (19) – –
Balance as at December 31 243 263 284
93Philips Annual Report 2003
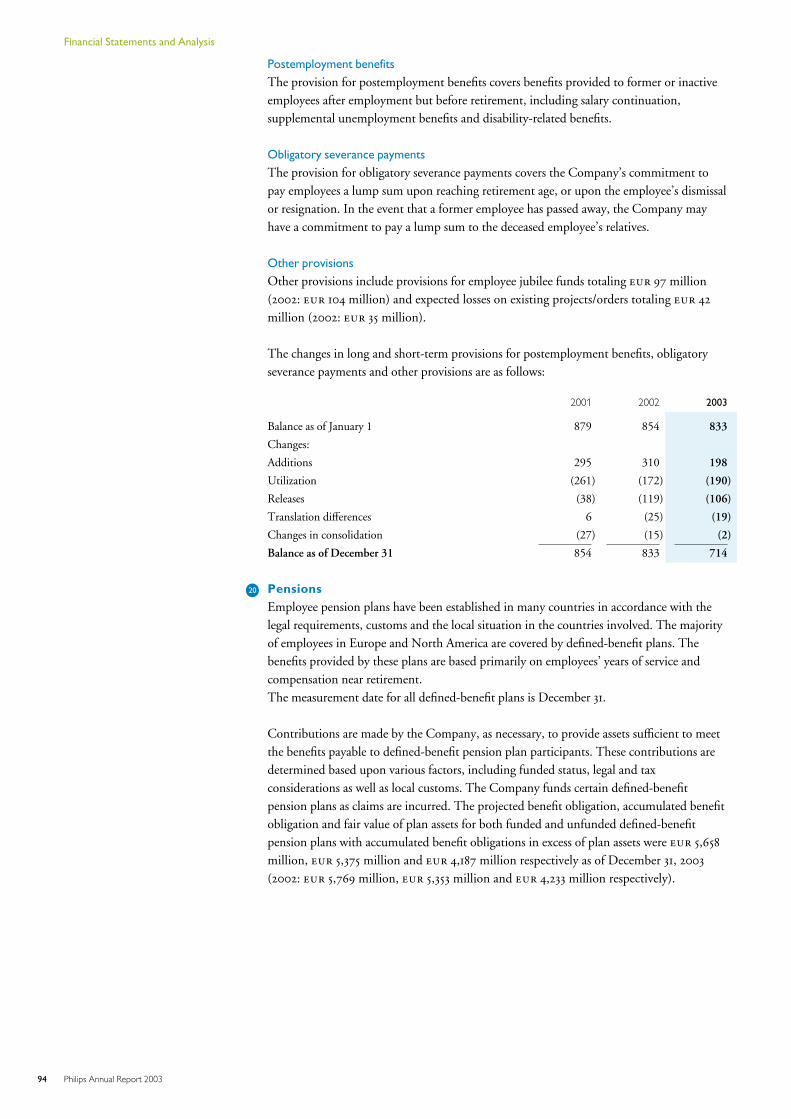
Postemployment benefits
The provision for postemployment benefits covers benefits provided to former or inactiveemployees after employment but before retirement, including salary continuation,supplemental unemployment benefits and disability-related benefits.
Obligatory severance payments
The provision for obligatory severance payments covers the Company’s commitment topay employees a lump sum upon reaching retirement age, or upon the employee’s dismissalor resignation. In the event that a former employee has passed away, the Company mayhave a commitment to pay a lump sum to the deceased employee’s relatives.
Other provisions
Other provisions include provisions for employee jubilee funds totaling 97 million(2002: 104 million) and expected losses on existing projects/orders totaling 42
million (2002: 35 million).
The changes in long and short-term provisions for postemployment benefits, obligatoryseverance payments and other provisions are as follows:
2001 2002 2003
Balance as of January 1 879 854 833
Changes:
Additions 295 310 198
Utilization (261) (172) (190)
Releases (38) (119) (106)
Translation differences 6 (25) (19)
Changes in consolidation (27) (15) (2)
Balance as of December 31 854 833 714
L20 PensionsEmployee pension plans have been established in many countries in accordance with thelegal requirements, customs and the local situation in the countries involved. The majorityof employees in Europe and North America are covered by defined-benefit plans. Thebenefits provided by these plans are based primarily on employees’ years of service andcompensation near retirement.The measurement date for all defined-benefit plans is December 31.
Contributions are made by the Company, as necessary, to provide assets sufficient to meetthe benefits payable to defined-benefit pension plan participants. These contributions aredetermined based upon various factors, including funded status, legal and taxconsiderations as well as local customs. The Company funds certain defined-benefitpension plans as claims are incurred. The projected benefit obligation, accumulated benefitobligation and fair value of plan assets for both funded and unfunded defined-benefitpension plans with accumulated benefit obligations in excess of plan assets were 5,658
million, 5,375 million and 4,187 million respectively as of December 31, 2003
(2002: 5,769 million, 5,353 million and 4,233 million respectively).
94 Philips Annual Report 2003
Financial Statements and Analysis
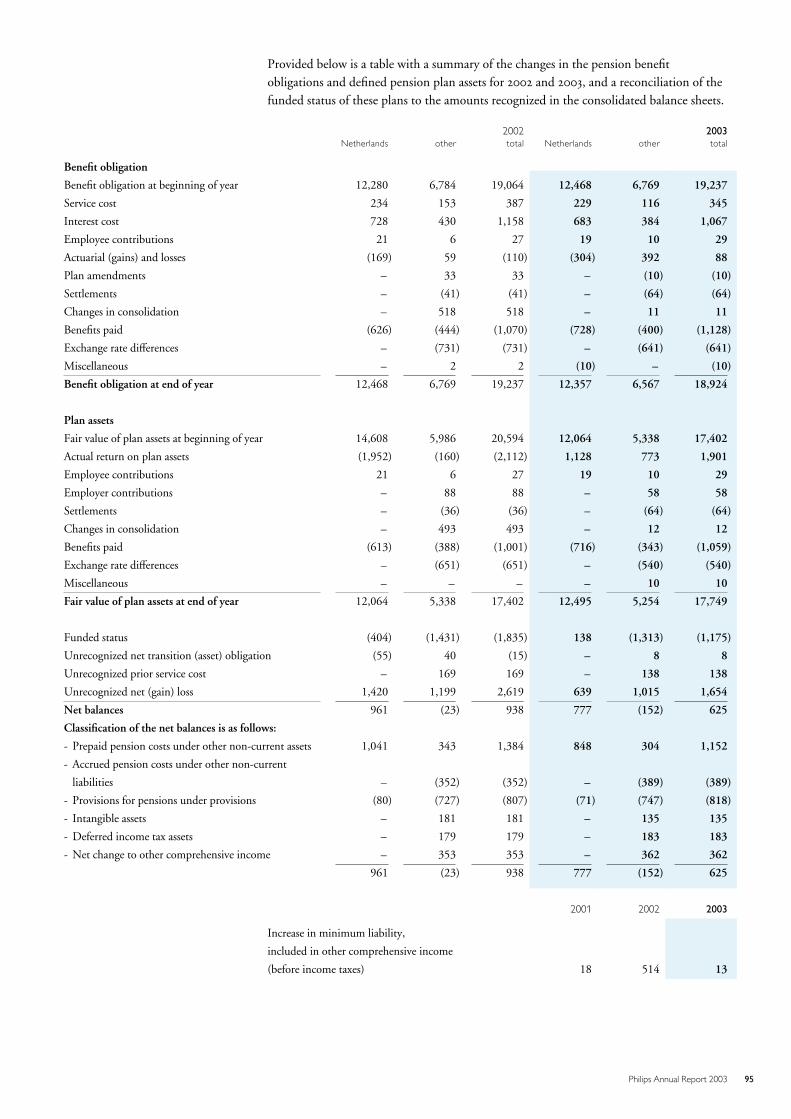
Provided below is a table with a summary of the changes in the pension benefitobligations and defined pension plan assets for 2002 and 2003, and a reconciliation of thefunded status of these plans to the amounts recognized in the consolidated balance sheets.
2002 2003Netherlands other total Netherlands other total
Benefit obligation
Benefit obligation at beginning of year 12,280 6,784 19,064 12,468 6,769 19,237
Service cost 234 153 387 229 116 345
Interest cost 728 430 1,158 683 384 1,067
Employee contributions 21 6 27 19 10 29
Actuarial (gains) and losses (169) 59 (110) (304) 392 88
Plan amendments – 33 33 – (10) (10)
Settlements – (41) (41) – (64) (64)
Changes in consolidation – 518 518 – 11 11
Benefits paid (626) (444) (1,070) (728) (400) (1,128)
Exchange rate differences – (731) (731) – (641) (641)
Miscellaneous – 2 2 (10) – (10)
Benefit obligation at end of year 12,468 6,769 19,237 12,357 6,567 18,924
Plan assets
Fair value of plan assets at beginning of year 14,608 5,986 20,594 12,064 5,338 17,402
Actual return on plan assets (1,952) (160) (2,112) 1,128 773 1,901
Employee contributions 21 6 27 19 10 29
Employer contributions – 88 88 – 58 58
Settlements – (36) (36) – (64) (64)
Changes in consolidation – 493 493 – 12 12
Benefits paid (613) (388) (1,001) (716) (343) (1,059)
Exchange rate differences – (651) (651) – (540) (540)
Miscellaneous – – – – 10 10
Fair value of plan assets at end of year 12,064 5,338 17,402 12,495 5,254 17,749
Funded status (404) (1,431) (1,835) 138 (1,313) (1,175)
Unrecognized net transition (asset) obligation (55) 40 (15) – 8 8
Unrecognized prior service cost – 169 169 – 138 138
Unrecognized net (gain) loss 1,420 1,199 2,619 639 1,015 1,654
Net balances 961 (23) 938 777 (152) 625
Classification of the net balances is as follows:
- Prepaid pension costs under other non-current assets 1,041 343 1,384 848 304 1,152
- Accrued pension costs under other non-current
liabilities – (352) (352) – (389) (389)
- Provisions for pensions under provisions (80) (727) (807) (71) (747) (818)
- Intangible assets – 181 181 – 135 135
- Deferred income tax assets – 179 179 – 183 183
- Net change to other comprehensive income – 353 353 – 362 362
961 (23) 938 777 (152) 625
2001 2002 2003
Increase in minimum liability,
included in other comprehensive income
(before income taxes) 18 514 13
95Philips Annual Report 2003
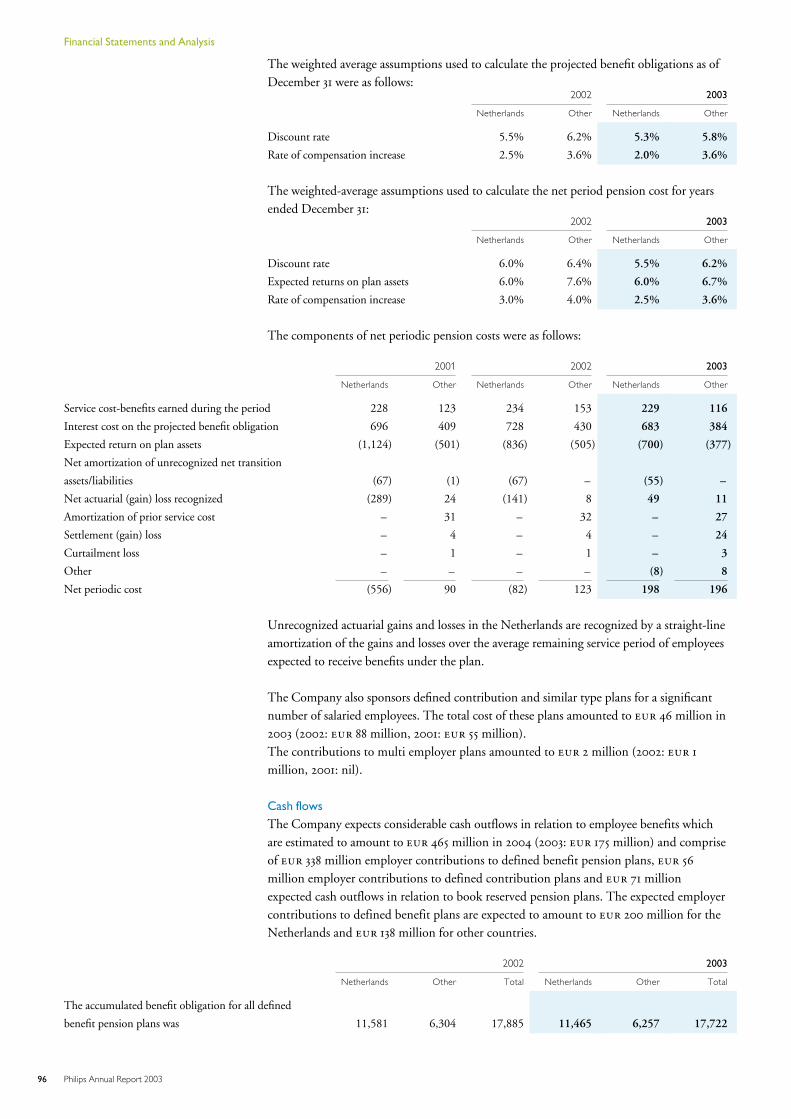
The weighted average assumptions used to calculate the projected benefit obligations as ofDecember 31 were as follows:
2002 2003
Netherlands Other Netherlands Other
Discount rate 5.5% 6.2% 5.3% 5.8%
Rate of compensation increase 2.5% 3.6% 2.0% 3.6%
The weighted-average assumptions used to calculate the net period pension cost for yearsended December 31:
2002 2003
Netherlands Other Netherlands Other
Discount rate 6.0% 6.4% 5.5% 6.2%
Expected returns on plan assets 6.0% 7.6% 6.0% 6.7%
Rate of compensation increase 3.0% 4.0% 2.5% 3.6%
The components of net periodic pension costs were as follows:
2001 2002 2003
Netherlands Other Netherlands Other Netherlands Other
Service cost-benefits earned during the period 228 123 234 153 229 116
Interest cost on the projected benefit obligation 696 409 728 430 683 384
Expected return on plan assets (1,124) (501) (836) (505) (700) (377)
Net amortization of unrecognized net transition
assets/liabilities (67) (1) (67) – (55) –
Net actuarial (gain) loss recognized (289) 24 (141) 8 49 11
Amortization of prior service cost – 31 – 32 – 27
Settlement (gain) loss – 4 – 4 – 24
Curtailment loss – 1 – 1 – 3
Other – – – – (8) 8
Net periodic cost (556) 90 (82) 123 198 196
Unrecognized actuarial gains and losses in the Netherlands are recognized by a straight-lineamortization of the gains and losses over the average remaining service period of employeesexpected to receive benefits under the plan.
The Company also sponsors defined contribution and similar type plans for a significantnumber of salaried employees. The total cost of these plans amounted to 46 million in2003 (2002: 88 million, 2001: 55 million).The contributions to multi employer plans amounted to 2 million (2002: 1
million, 2001: nil).
Cash flows
The Company expects considerable cash outflows in relation to employee benefits whichare estimated to amount to 465 million in 2004 (2003: 175 million) and compriseof 338 million employer contributions to defined benefit pension plans, 56
million employer contributions to defined contribution plans and 71 millionexpected cash outflows in relation to book reserved pension plans. The expected employercontributions to defined benefit plans are expected to amount to 200 million for theNetherlands and 138 million for other countries.
2002 2003
Netherlands Other Total Netherlands Other Total
The accumulated benefit obligation for all defined
benefit pension plans was 11,581 6,304 17,885 11,465 6,257 17,722
96 Philips Annual Report 2003
Financial Statements and Analysis
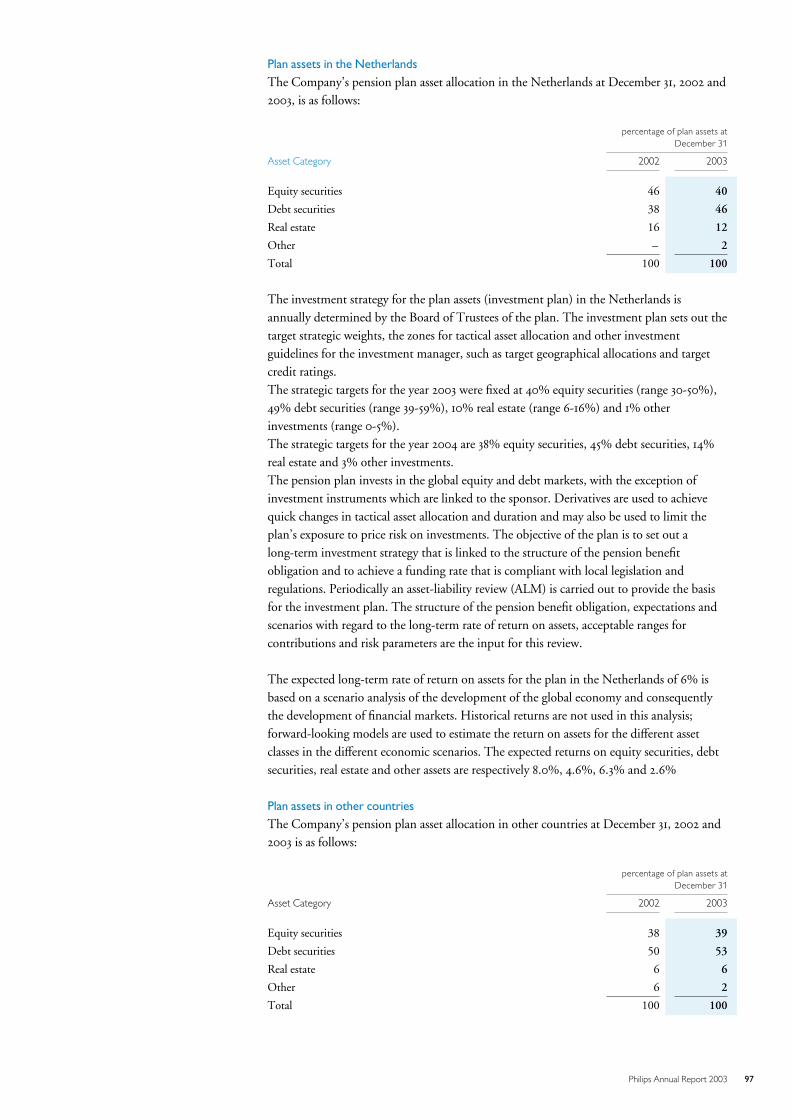
Plan assets in the Netherlands
The Company’s pension plan asset allocation in the Netherlands at December 31, 2002 and2003, is as follows:
percentage of plan assets atDecember 31
Asset Category 2002 2003
Equity securities 46 40
Debt securities 38 46
Real estate 16 12
Other – 2
Total 100 100
The investment strategy for the plan assets (investment plan) in the Netherlands isannually determined by the Board of Trustees of the plan. The investment plan sets out thetarget strategic weights, the zones for tactical asset allocation and other investmentguidelines for the investment manager, such as target geographical allocations and targetcredit ratings.The strategic targets for the year 2003 were fixed at 40% equity securities (range 30-50%),49% debt securities (range 39-59%), 10% real estate (range 6-16%) and 1% otherinvestments (range 0-5%).The strategic targets for the year 2004 are 38% equity securities, 45% debt securities, 14%real estate and 3% other investments.The pension plan invests in the global equity and debt markets, with the exception ofinvestment instruments which are linked to the sponsor. Derivatives are used to achievequick changes in tactical asset allocation and duration and may also be used to limit theplan’s exposure to price risk on investments. The objective of the plan is to set out along-term investment strategy that is linked to the structure of the pension benefitobligation and to achieve a funding rate that is compliant with local legislation andregulations. Periodically an asset-liability review (ALM) is carried out to provide the basisfor the investment plan. The structure of the pension benefit obligation, expectations andscenarios with regard to the long-term rate of return on assets, acceptable ranges forcontributions and risk parameters are the input for this review.
The expected long-term rate of return on assets for the plan in the Netherlands of 6% isbased on a scenario analysis of the development of the global economy and consequentlythe development of financial markets. Historical returns are not used in this analysis;forward-looking models are used to estimate the return on assets for the different assetclasses in the different economic scenarios. The expected returns on equity securities, debtsecurities, real estate and other assets are respectively 8.0%, 4.6%, 6.3% and 2.6%
Plan assets in other countries
The Company’s pension plan asset allocation in other countries at December 31, 2002 and2003 is as follows:
percentage of plan assets atDecember 31
Asset Category 2002 2003
Equity securities 38 39
Debt securities 50 53
Real estate 6 6
Other 6 2
Total 100 100
97Philips Annual Report 2003
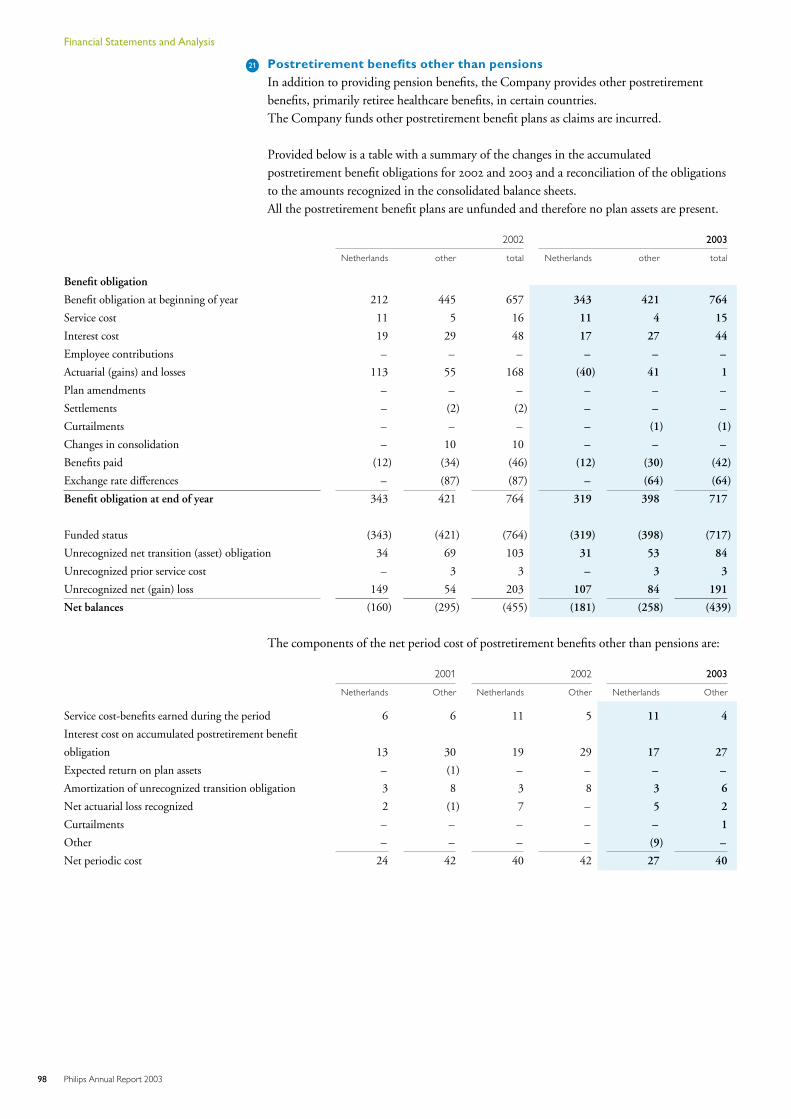
L21 Postretirement benefits other than pensionsIn addition to providing pension benefits, the Company provides other postretirementbenefits, primarily retiree healthcare benefits, in certain countries.The Company funds other postretirement benefit plans as claims are incurred.
Provided below is a table with a summary of the changes in the accumulatedpostretirement benefit obligations for 2002 and 2003 and a reconciliation of the obligationsto the amounts recognized in the consolidated balance sheets.All the postretirement benefit plans are unfunded and therefore no plan assets are present.
2002 2003
Netherlands other total Netherlands other total
Benefit obligation
Benefit obligation at beginning of year 212 445 657 343 421 764
Service cost 11 5 16 11 4 15
Interest cost 19 29 48 17 27 44
Employee contributions – – – – – –
Actuarial (gains) and losses 113 55 168 (40) 41 1
Plan amendments – – – – – –
Settlements – (2) (2) – – –
Curtailments – – – – (1) (1)
Changes in consolidation – 10 10 – – –
Benefits paid (12) (34) (46) (12) (30) (42)
Exchange rate differences – (87) (87) – (64) (64)
Benefit obligation at end of year 343 421 764 319 398 717
Funded status (343) (421) (764) (319) (398) (717)
Unrecognized net transition (asset) obligation 34 69 103 31 53 84
Unrecognized prior service cost – 3 3 – 3 3
Unrecognized net (gain) loss 149 54 203 107 84 191
Net balances (160) (295) (455) (181) (258) (439)
The components of the net period cost of postretirement benefits other than pensions are:
2001 2002 2003
Netherlands Other Netherlands Other Netherlands Other
Service cost-benefits earned during the period 6 6 11 5 11 4
Interest cost on accumulated postretirement benefit
obligation 13 30 19 29 17 27
Expected return on plan assets – (1) – – – –
Amortization of unrecognized transition obligation 3 8 3 8 3 6
Net actuarial loss recognized 2 (1) 7 – 5 2
Curtailments – – – – – 1
Other – – – – (9) –
Net periodic cost 24 42 40 42 27 40
98 Philips Annual Report 2003
Financial Statements and Analysis
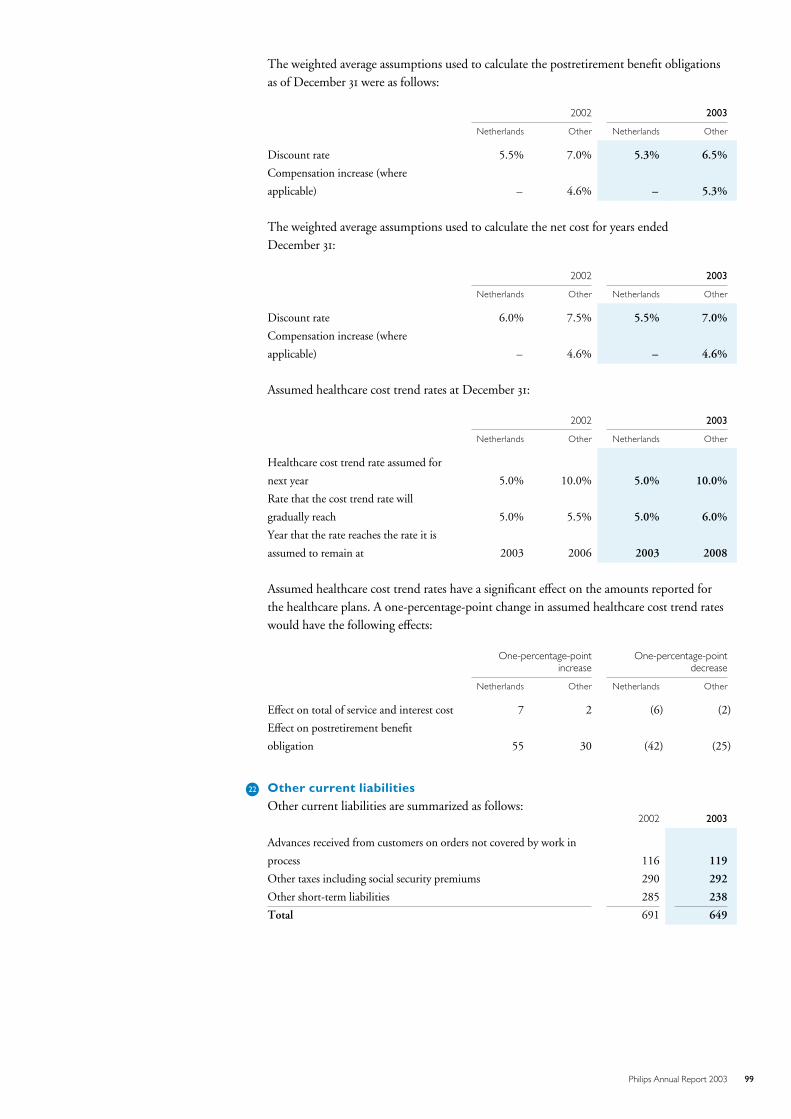
The weighted average assumptions used to calculate the postretirement benefit obligationsas of December 31 were as follows:
2002 2003
Netherlands Other Netherlands Other
Discount rate 5.5% 7.0% 5.3% 6.5%
Compensation increase (where
applicable) – 4.6% – 5.3%
The weighted average assumptions used to calculate the net cost for years endedDecember 31:
2002 2003
Netherlands Other Netherlands Other
Discount rate 6.0% 7.5% 5.5% 7.0%
Compensation increase (where
applicable) – 4.6% – 4.6%
Assumed healthcare cost trend rates at December 31:
2002 2003
Netherlands Other Netherlands Other
Healthcare cost trend rate assumed for
next year 5.0% 10.0% 5.0% 10.0%
Rate that the cost trend rate will
gradually reach 5.0% 5.5% 5.0% 6.0%
Year that the rate reaches the rate it is
assumed to remain at 2003 2006 2003 2008
Assumed healthcare cost trend rates have a significant effect on the amounts reported forthe healthcare plans. A one-percentage-point change in assumed healthcare cost trend rateswould have the following effects:
One-percentage-pointincrease
One-percentage-pointdecrease
Netherlands Other Netherlands Other
Effect on total of service and interest cost 7 2 (6) (2)
Effect on postretirement benefit
obligation 55 30 (42) (25)
L22 Other current liabilitiesOther current liabilities are summarized as follows:
2002 2003
Advances received from customers on orders not covered by work in
process 116 119
Other taxes including social security premiums 290 292
Other short-term liabilities 285 238
Total 691 649
99Philips Annual Report 2003
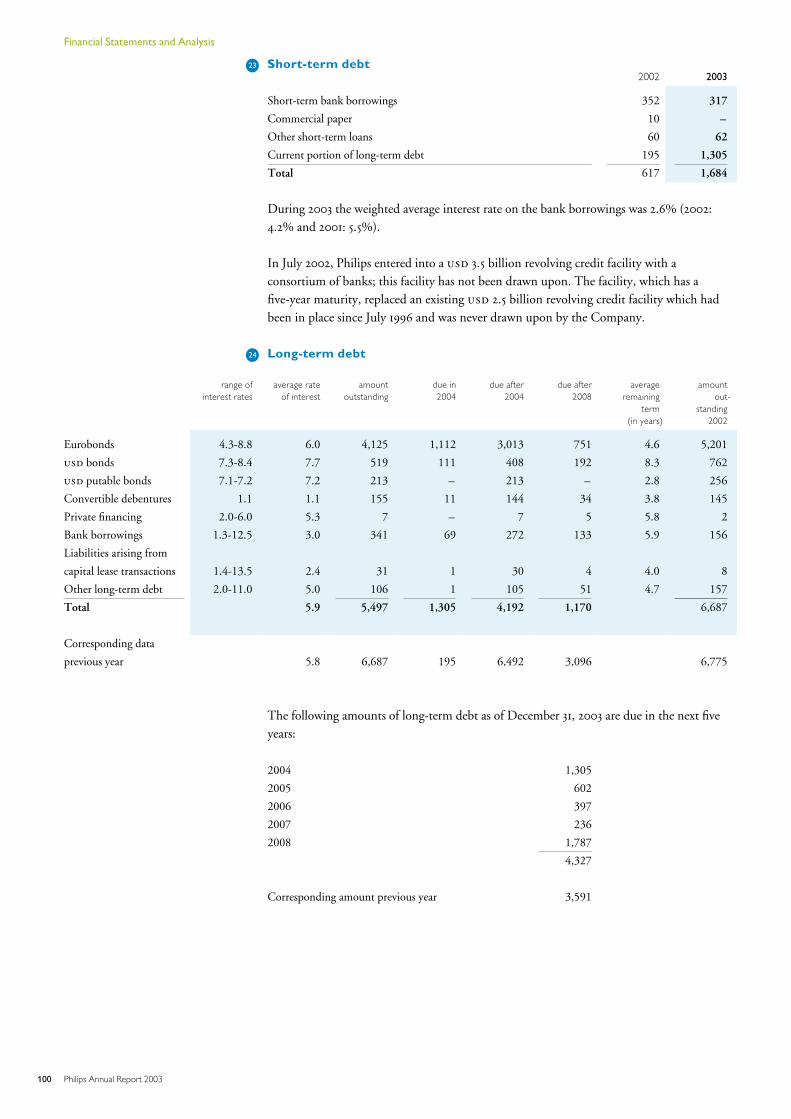
L23 Short-term debt2002 2003
Short-term bank borrowings 352 317
Commercial paper 10 –
Other short-term loans 60 62
Current portion of long-term debt 195 1,305
Total 617 1,684
During 2003 the weighted average interest rate on the bank borrowings was 2.6% (2002:4.2% and 2001: 5.5%).
In July 2002, Philips entered into a 3.5 billion revolving credit facility with aconsortium of banks; this facility has not been drawn upon. The facility, which has afive-year maturity, replaced an existing 2.5 billion revolving credit facility which hadbeen in place since July 1996 and was never drawn upon by the Company.
L24 Long-term debt
range ofinterest rates
average rateof interest
amountoutstanding
due in2004
due after2004
due after2008
averageremaining
term(in years)
amountout-
standing2002
Eurobonds 4.3-8.8 6.0 4,125 1,112 3,013 751 4.6 5,201
bonds 7.3-8.4 7.7 519 111 408 192 8.3 762
putable bonds 7.1-7.2 7.2 213 – 213 – 2.8 256
Convertible debentures 1.1 1.1 155 11 144 34 3.8 145
Private financing 2.0-6.0 5.3 7 – 7 5 5.8 2
Bank borrowings 1.3-12.5 3.0 341 69 272 133 5.9 156
Liabilities arising from
capital lease transactions 1.4-13.5 2.4 31 1 30 4 4.0 8
Other long-term debt 2.0-11.0 5.0 106 1 105 51 4.7 157
Total 5.9 5,497 1,305 4,192 1,170 6,687
Corresponding data
previous year 5.8 6,687 195 6,492 3,096 6,775
The following amounts of long-term debt as of December 31, 2003 are due in the next fiveyears:
2004 1,305
2005 602
2006 397
2007 236
2008 1,787
4,327
Corresponding amount previous year 3,591
100 Philips Annual Report 2003
Financial Statements and Analysis
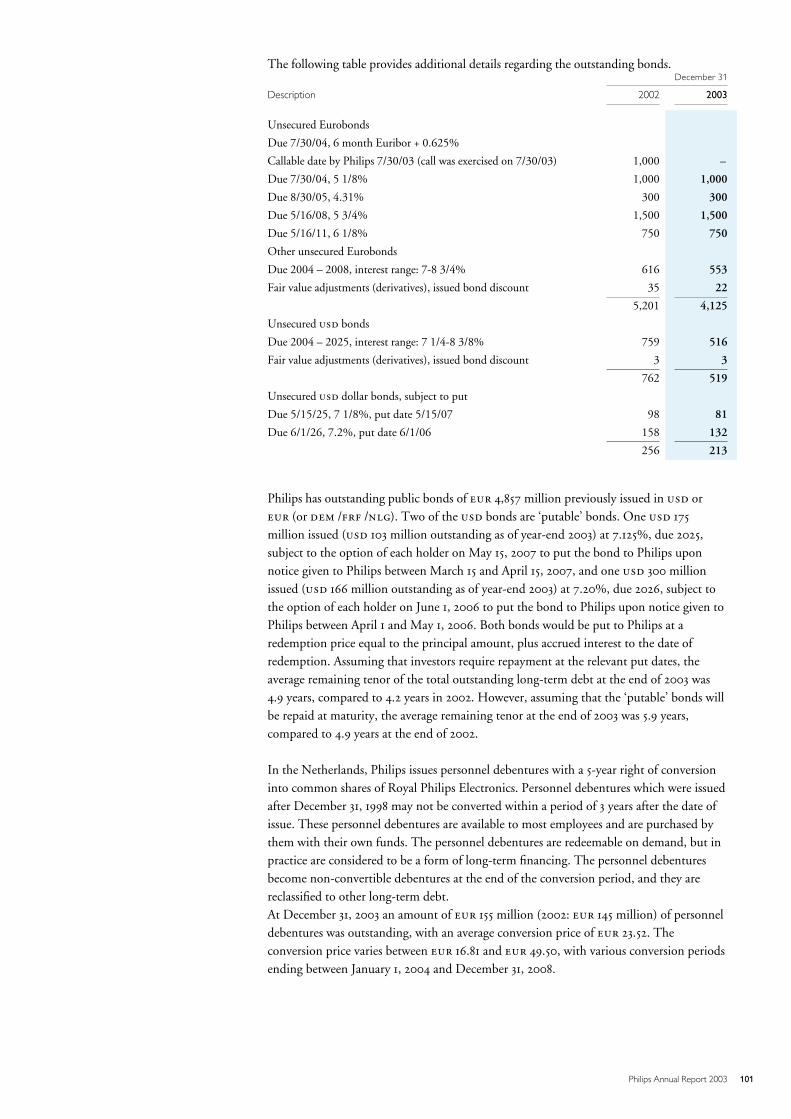
The following table provides additional details regarding the outstanding bonds.December 31
Description 2002 2003
Unsecured Eurobonds
Due 7/30/04, 6 month Euribor + 0.625%
Callable date by Philips 7/30/03 (call was exercised on 7/30/03) 1,000 –
Due 7/30/04, 5 1/8% 1,000 1,000
Due 8/30/05, 4.31% 300 300
Due 5/16/08, 5 3/4% 1,500 1,500
Due 5/16/11, 6 1/8% 750 750
Other unsecured Eurobonds
Due 2004 – 2008, interest range: 7-8 3/4% 616 553
Fair value adjustments (derivatives), issued bond discount 35 22
5,201 4,125
Unsecured bonds
Due 2004 – 2025, interest range: 7 1/4-8 3/8% 759 516
Fair value adjustments (derivatives), issued bond discount 3 3
762 519
Unsecured dollar bonds, subject to put
Due 5/15/25, 7 1/8%, put date 5/15/07 98 81
Due 6/1/26, 7.2%, put date 6/1/06 158 132
256 213
Philips has outstanding public bonds of 4,857 million previously issued in or (or / /). Two of the bonds are ‘putable’ bonds. One 175
million issued ( 103 million outstanding as of year-end 2003) at 7.125%, due 2025,subject to the option of each holder on May 15, 2007 to put the bond to Philips uponnotice given to Philips between March 15 and April 15, 2007, and one 300 millionissued ( 166 million outstanding as of year-end 2003) at 7.20%, due 2026, subject tothe option of each holder on June 1, 2006 to put the bond to Philips upon notice given toPhilips between April 1 and May 1, 2006. Both bonds would be put to Philips at aredemption price equal to the principal amount, plus accrued interest to the date ofredemption. Assuming that investors require repayment at the relevant put dates, theaverage remaining tenor of the total outstanding long-term debt at the end of 2003 was4.9 years, compared to 4.2 years in 2002. However, assuming that the ‘putable’ bonds willbe repaid at maturity, the average remaining tenor at the end of 2003 was 5.9 years,compared to 4.9 years at the end of 2002.
In the Netherlands, Philips issues personnel debentures with a 5-year right of conversioninto common shares of Royal Philips Electronics. Personnel debentures which were issuedafter December 31, 1998 may not be converted within a period of 3 years after the date ofissue. These personnel debentures are available to most employees and are purchased bythem with their own funds. The personnel debentures are redeemable on demand, but inpractice are considered to be a form of long-term financing. The personnel debenturesbecome non-convertible debentures at the end of the conversion period, and they arereclassified to other long-term debt.At December 31, 2003 an amount of 155 million (2002: 145 million) of personneldebentures was outstanding, with an average conversion price of 23.52. Theconversion price varies between 16.81 and 49.50, with various conversion periodsending between January 1, 2004 and December 31, 2008.
101Philips Annual Report 2003
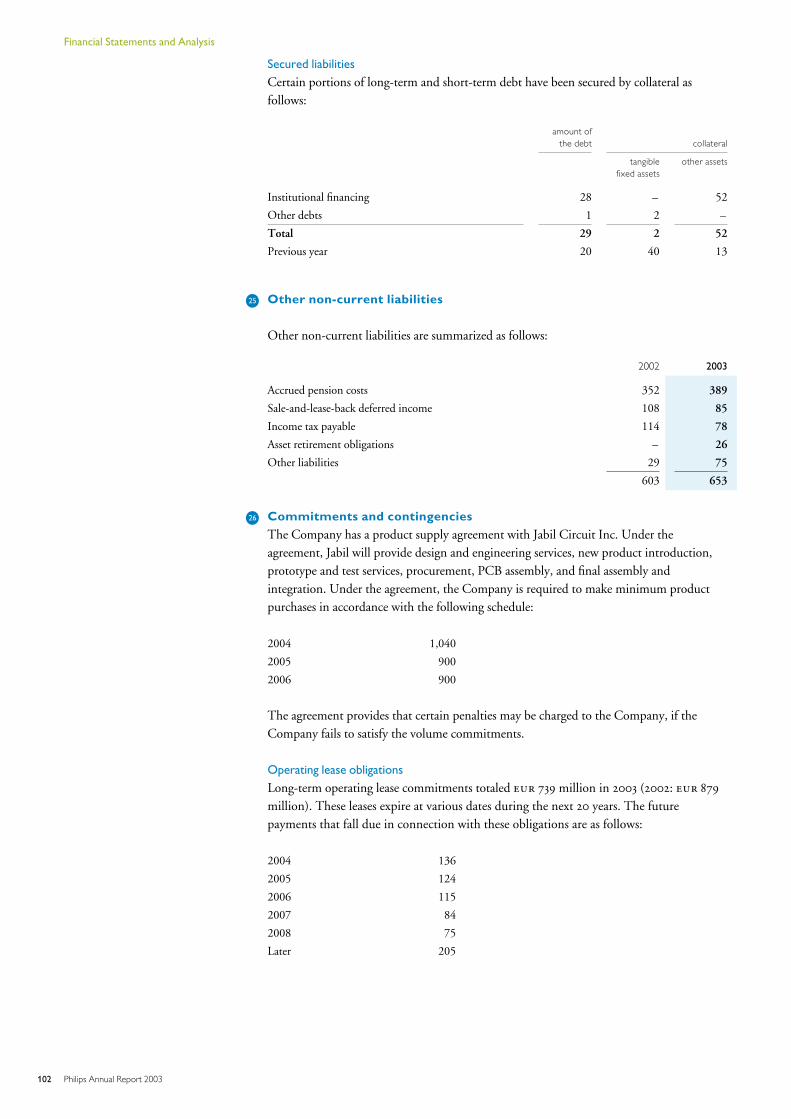
Secured liabilities
Certain portions of long-term and short-term debt have been secured by collateral asfollows:
amount ofthe debt collateral
tangible other assetsfixed assets
Institutional financing 28 – 52
Other debts 1 2 –
Total 29 2 52
Previous year 20 40 13
L25 Other non-current liabilities
Other non-current liabilities are summarized as follows:
2002 2003
Accrued pension costs 352 389
Sale-and-lease-back deferred income 108 85
Income tax payable 114 78
Asset retirement obligations – 26
Other liabilities 29 75
603 653
L26 Commitments and contingenciesThe Company has a product supply agreement with Jabil Circuit Inc. Under theagreement, Jabil will provide design and engineering services, new product introduction,prototype and test services, procurement, PCB assembly, and final assembly andintegration. Under the agreement, the Company is required to make minimum productpurchases in accordance with the following schedule:
2004 1,040
2005 900
2006 900
The agreement provides that certain penalties may be charged to the Company, if theCompany fails to satisfy the volume commitments.
Operating lease obligations
Long-term operating lease commitments totaled 739 million in 2003 (2002: 879
million). These leases expire at various dates during the next 20 years. The futurepayments that fall due in connection with these obligations are as follows:
2004 136
2005 124
2006 115
2007 84
2008 75
Later 205
102 Philips Annual Report 2003
Financial Statements and Analysis
The long-term operating leases are mainly related to the rental of buildings. A number ofthese leases originate from sale-and-lease-back arrangements. In 2003 there was one sale-and-operational-lease-back arrangement in Belgium for an aggregate amount of 14
million. In 2002 the Company entered into two sale-and-operational-lease-backarrangements in the Netherlands for office buildings. These buildings were sold for anaggregate amount of 166 million. In 2001 there were two sale-and-operational-lease-back arrangements for an aggregate amount of 89 million, in the Netherlandsand the USA. The lease-back rental periods are 9 years for the 2003 arrangement, 8 and 5years for the arrangement entered into in 2002 and 10 and 20 years for the arrangemententered into in 2001. The Company has the option of extending each of the lease-backterms. The rental payments are fixed. The rental payments for 2003 totaled 27
million (2002: 26 million, 2001: 0.2 million).The remaining minimum payments are as follows:
2004 25
2005 23
2006 19
2007 14
2008 12
Later 57
The Company has subleases with total expected future revenues of 34 million, asfollows:
2004 8
2005 7
2006 7
2007 4
2008 4
Later 4
Guarantees
In the normal course of business, the Company issues certain guarantees.The following guarantees were outstanding at December 31, 2003.
expiration per period
total amountscommitted
less than1 year
2-5 years after 5 years
Guarantees unconsolidated
companies/third parties 656 258 339 59
Stand-by letters of credit 274 – 274 –
Total 930 258 613 59
The guarantees are primarily issued with respect to debt obligations of unconsolidatedcompanies in which Philips maintains a significant ownership. The two most significantguarantees relate to debt obligations ( 159 million) of LG.Philips Displays and SSMC.
A guarantee amounting to 200 million was issued to the financing parties for thefacility agreement they issued to our unconsolidated joint venture LG.Philips Displays(LPD) for the amount of 2 billion. The guarantee was issued in May 2002 andexpires on December 31, 2004 or earlier if the joint venture meets the covenants of thefacility agreement. Under the guarantee the Company guarantees and shall pay, uponfailure to pay by the joint venture, all principal, interest and fees payable by the jointventure, for an amount of 100 million, and agrees to indemnify and hold harmlessthe financing parties on demand from any loss in respect of principal, interest and feespayable by the joint venture under the facility agreement for an amount of 100 million.
103Philips Annual Report 2003
In the fourth quarter of 2003, LPD breached certain covenants in its financing agreements.A refinancing package is currently being negotiated with the lenders of LPD.In the context of these negotiations both parents have indicated their willingness tocontribute cash to increase the equity of LPD by 250 million by each parent. As partof the negotiations both parents have required that the existing guarantees will be releasedand replaced by a new guarantee of 50 million from each parent. A reduction inpayment terms of 50 million by each parent on purchases from LPD is also part ofthe current negotiations. Additional financial support of 50 million has beenprovided by each parent in January 2004 which is also part of the negotiations. This willresult in a permanent 100 million reduction in working capital financing needs forLPD during the life of the restructured bank debt. The financial restructuring of LPD issubject to agreement by Philips and all other parties involved.
The Company issued a guarantee amounting to Singapore Dollar 600 million ( 280
million) to the Economic Development Board of Singapore in 2000. This guarantee isrelated to their loan granted to our 48%-associate Systems on Silicon Manufacturing Co.(SSMC). The loan matures in 2005 at which time the guarantee will end. In accordancewith FIN 46 ‘Consolidation of Variable Interest Entities’ SSMC has been identified as aVIE and will be consolidated in 2004. Accordingly, the guarantee will than be reported inthe amount of guarantees granted for obligations of consolidated companies goingforward.
The Company has posted a stand-by letter of credit of approximately 345 million( 274 million), related to pending litigation with respect to claims made byVolumetrics Medical Imaging Inc. against a subsidiary of the Company.
Environmental Remediation
The Company and its subsidiaries are subject to environmental laws and regulations.Under these laws, the Company and/or its subsidiaries may be required to remediate theeffects of the release or disposal of certain chemicals on the environment.In the United States, subsidiaries of the Company have been named as potentiallyresponsible parties in state and federal proceedings for the clean-up of various sites,including Superfund sites. The Company applies the provisions of SOP 96-1,‘Environmental Liabilities’, and SFAS No. 5, ‘Accounting for Contingencies’, and accruesfor losses associated with environmental obligations when such losses are probable andreasonably estimatable.
Generally, the costs of future expenditures for environmental remediation obligations arenot discounted to their present value since the amounts and the timing of related cashpayments are not reliably determinable. Potential insurance recoveries are recognized whenrecoveries are deemed probable.
Litigation
Royal Philips Electronics and certain of its Group companies are involved as plaintiff ordefendant in litigation relating to such matters as competition issues, commercialtransactions, product liability, participations and environmental pollution. One pendinglitigation includes claims by Volumetrics Medical Imaging, Inc. relating to the decision ofa Philips Ultrasound business not to collaborate with or acquire Volumetrics, a decisionthat occurred after the announcement of Philips Medical Systems’ acquisition of AgilentTechnologies, Inc.’s Healthcare Solutions Group.
104 Philips Annual Report 2003
Financial Statements and Analysis
On January 22, 2003, a jury in North Carolina, USA, delivered a verdict of approximately 152 million against the Philips subsidiary which was confirmed by the trial judge onJune 12, 2003. Because the trial judge granted the plaintiff’s motion to treble a componentof the jury verdict and because the plaintiffs made an election of remedies, this resulted inthe entry of a judgment for approximately 319 million plus interest. The Companydoes not believe that the facts of the case or the relevant legal principles support thedecision because it believes, among other things, that (i) the plaintiff was not allowed bythe relevant legal principles to rely on the subsidiary’s statements about the process ofnegotiations before there was an agreement between the parties and (ii) even if there wereliability on the part of the subsidiary, the methodology for the valuation of damagesemployed by the plaintiff was materially flawed.
The Company is appealing the verdict and has posted in September 2003 a letter of creditsupported by a stand-by credit facility for the amount of 345 million ( 274
million), which the Company believes would mitigate any effects on its liquidity if it wererequired to pay the amount of the judgment.
Following discussions with external and internal legal advisors, and given the large range ofpossible outcomes and the difficulties in estimating probable outcomes in a reliablemanner, the Company determined that it was appropriate not to make an accrual for theVolumetrics case.
Another pending litigation includes both patent infringement claims, as well as commercialclaims (e.g. false advertising and unfair competition, unfair and deceptive trade practicesand tortuous interference) by Elbex Video, Ltd. against the Company relating to theformer Philips’ Communication, Security and Imaging (CSI) business. Elbex requestsrecovery of 100 million in damages. Due to the fact that the CSI business has beendivested, on the basis of its current knowledge, management cannot establish whether aloss is probable or reasonably possible and determined that it was appropriate not to makean accrual for this case.
Judicial proceedings are pending in the United States, relating primarily to the activities ofa Philips subsidiary prior to 1981, involving allegations of personal injury relating to allegedasbestos exposure. The claims generally relate to asbestos used in the manufacture ofunrelated companies’ products in the United States and frequently involve claims forsubstantial general and punitive damages.At December 31, 2003, there were 1,081 cases pending, representing 2,753 claimants(compared to 499 cases representing 558 claimants pending at December 31, 2002, andapproximately 50 cases pending at December 31, 2001). Most of the claims are in casesinvolving a number of defendants. Of the new claims filed against the subsidiary in 2003,an increased percentage of the cases included multiple claimants.Many of the multiple claimant cases assert claims alleging less severe illnesses (i.e.non-malignancies).While management believes there are meritorious defenses to these claims, certain of thesecases have been settled for amounts management considered reasonable given the facts andcircumstances of each case. A number of other cases have been dismissed. During 2003, 379
cases, representing 392 claimants were settled or dismissed.
In addition to the pending cases discussed above, a subsidiary of the Company was one ofapproximately 160 defendants initially named in a case involving 3,784 claimants filed inAugust 1995. Since the time the case was brought in 1995, neither the Company nor thesubsidiary has been involved in any substantive activity in the case other than filing ananswer to the complaint.
105Philips Annual Report 2003
In accordance with SFAS No. 5, the Company accrues for loss contingencies when it isprobable that a liability has been incurred and the amount of such loss contingency can bereasonably estimated. The Company has established the accrual for loss contingencies withrespect to asbestos product liability based upon its recent settlement experience of similartypes of claims, taking into consideration the alleged illnesses in pending cases. While theCompany believes that this methodology provides a reasonable basis for estimating the loss,the actual resolution of each case will be based upon claimant-specific information, muchof which is not available until shortly before the scheduled trial date. For filed claims atDecember 31, 2003, where the exact type and extent of the alleged illness is not yet known,the Company has established an accrual for loss contingencies based upon a ‘low end of therange’ estimate using the average settlement experience for claims alleging only less severeillnesses (i.e. non-malignancy). If it was determined that all of such claims allegedmalignant diseases (which is unlikely since non-malignancies currently represent 65% ofknown alleged illnesses), management estimates that the maximum incremental exposureabove the Company’s current provision for asbestos product liability would beapproximately 36 million ( 45 million).
Although the Company believes it has a significant amount of insurance coverage forasbestos product liability, the subsidiary has recovered only minor amounts from itsinsurance carriers with respect to reimbursement of settled claims. In November 2002, thesubsidiary filed a complaint against certain third party insurance carriers who hadprovided various types of product liability coverage. The Company is currently indiscussions with certain of its insurance carriers regarding various coverage related issuesand expects to reach a favorable resolution of the matter with certain of the carriers in2004. The Company has not recognized a benefit for the expected reimbursement ofasbestos claims and related defense costs from its insurance carriers.
Although the final outcome of matters in litigation cannot be determined due to anumber of variables, after reviewing the proceedings that are currently pending (includingthe provisions made, number of cases and claimants, alleged illnesses, estimated probableoutcomes, reasonably anticipated costs and expenses, and uncertainties regarding theavailability and limits of insurance), management believes that the final outcome of any ofthe pending proceedings, or all of them combined, will not have a material adverse effecton the consolidated financial position or results of operations of the Company. TheCompany cannot reasonably predict the number of claims that may be asserted in thefuture. Accordingly, an accrual for loss contingencies has not been made for anyunasserted claims. If the general trends towards (i) higher costs of resolving individualasbestos personal injury cases, (ii) increasing numbers of cases and claimants, or (iii) thenaming of more peripheral defendants, such as the Company’s subsidiary in such casescontinue, or if insurance coverage is ultimately less than anticipated, the Company’sconsolidated financial position and results of operations could be materially and adverselyaffected.
106 Philips Annual Report 2003
Financial Statements and Analysis
L27 Stockholders’ equity
Priority shares
There are ten priority shares, which are currently held by a foundation called the Dr. A.F.Philips-Stichting. The self-electing Board of the Dr. A.F. Philips-Stichting consists of theChairman, the Vice-Chairman and the Secretary of the Supervisory Board, certain othermembers of the Supervisory Board and the President of the Company. The approval of theMeeting of Priority Shareholders is required for resolutions of the General Meeting ofShareholders of the Company regarding the issue of ordinary shares of the Company orrights to such shares, the cancellation of the shares, amendments to the Articles ofAssociation, and the liquidation of the Company. The Supervisory Board of the Companyand the Meeting of Priority Shareholders also make binding recommendations to theGeneral Meeting of Shareholders for the appointment of the members of the Board ofManagement and the Supervisory Board of the Company, which can be overruled by aresolution of the General Meeting of Shareholders approved by a majority of at least 2/3 ofthe votes cast and representing more than half of the issued share capital.
Preference shares
The ‘Stichting Preferente Aandelen Philips’ has been granted the right to acquirepreference shares in the Company. Such right has not been exercised.
Option rights/restricted shares
The Company has granted stock options on its common shares and rights to receivecommon shares in future (see note 32).
Treasury shares
Royal Philips Electronics’ shares which have been repurchased and are held in treasury fordelivery upon exercise of options and convertible personnel debentures are accounted for instockholders’ equity. Treasury shares are recorded at cost, representing the market price onthe acquisition date. When issued, shares are removed from treasury stock on a FIFO basis.Any difference between the cost and the market value at the time treasury shares are issued,is recorded in capital in excess of par value.In order to reduce potential dilution effects, a total of 43,904 shares were acquired during2003 at an average market price of 16.68 per share, totaling 0.7 million, and atotal of 4,752,111 shares were delivered at an average exercise price of 10.96, totaling 52 million.A total of 35,384,262 shares were held by Group companies at December 31, 2003 (2002:40,092,469 shares), acquired at an aggregate cost of 1,256 million.
Retained earnings
A dividend of 0.36 per common share will be proposed to the General Meeting ofShareholders.
107Philips Annual Report 2003
L28 Cash from derivativesThe Company has no trading derivatives. A total of 391 million cash was generated byforeign exchange derivative contracts related to financing of subsidiaries. Cash flow frominterest-related derivatives is part of cash flow from operating activities.
L29 Proceeds from other non-current financial assetsThe Company has no trading securities, nor a material amount of held-to-maturitysecurities. Available-for-sale securities are recorded under other non-current financial assetsand include shares in Vivendi Universal, ASML, JDS Uniphase and GN Great Nordic.
In 2003, a portion of available-for-sale securities were sold and generated a cash inflow of 272 million, consisting of ASML, JDS Uniphase and Vivendi Universal shares with abook value of 126 million resulting in a gain of 146 million, which is included infinancial income and expenses in the income statement.In 2002, some of the ASML shares were sold and generated a cash inflow of 72
million. Moreover, in 2002, JDS Uniphase shares were received in connection with thesale and related earn-out of Philips Optoelectronics in 1998.The cash inflow in 2001 mainly consisted of the redemption of redeemable preferredshares from LG Electronics for an amount of 486 million.
L30 Assets received in lieu of cash from the sale of businessesAssets received in lieu of cash in 2003 consist of 26 million representing a convertibledebenture of Scansoft Inc. received in connection with the sale of Speech ProcessingTelephony and Voice Control businesses.The 2002 amount of 113 million consists of JDS Uniphase shares received inconnection with the sale of and related earn-out of Philips Optoelectronics.In 2001, it represents an amount of 63 million not received in that year, but in theyear thereafter, related to the sale of Philips Broadcast.
L31 Related-party transactionsIn the normal course of business, Philips purchases and sells goods and services to variousrelated parties in which Philips holds a 50% or less equity interest. These transactions aregenerally conducted on an arm’s length basis with terms comparable to transactions withthird parties. In 2003, purchases of goods and services from related parties totaled 1,342 million, whereas sales of goods and services to related parties totaled 263
million. At December 31, 2003, receivables from related parties were 42 million;payables to related parties were 237 million.
In November 2002, Picker Financial Group, an affiliate acquired in the Marconiacquisition in 2001, sold approximately 140 million receivables to Philips MedicalCapital, in which the Company has a 40% equity interest.
108 Philips Annual Report 2003
Financial Statements and Analysis
L32 Stock-based compensationThe Company has granted stock options on its common shares and rights to receivecommon shares in the future (restricted share rights) to members of the Board ofManagement and other members of the Group Management Committee, PhilipsExecutives and certain non-executives. The purpose of the stock-based compensation plansis to align the interests of management with those of shareholders by providing additionalincentives to improve the Company’s performance on a long-term basis, thereby increasingshareholder value. Under the Company’s plans, options are granted at fair market value onthe date of grant. Exercise of all options, the sale of shares acquired on exercise thereof andthe sale of shares received under the restricted share rights program are restricted by theCompany’s rules on insider trading.
In 2003, the Company issued restricted share rights that vest in equal annual installmentsover a three-year period. Restricted shares are Philips shares that the grantee will receive inthree successive years, provided he/she is still with the Company on the respective deliverydates. If the grantee still holds the shares after three years from the delivery date, Philipswill grant 20% additional (premium) shares, provided he/she is still with Philips.
In 2002 and 2003, the Company granted fixed stock options that expire after 10 years.Generally, the options vest after 3 years; however, a limited number of options granted tocertain employees of acquired businesses contain accelerated vesting.
In prior years, fixed and variable (performance) options were issued with terms of five orten years, vesting one to three years after grant.
The actual number of variable (performance) stock options granted in 2001 that areultimately eligible to vest is dependent upon Total Shareholder Return of Philips, asdefined in comparison with a peer group of multinationals over a three-year period.During the year it was determined that 25% of the variable (performance) options thatwere issued in 2001 will not be eligible for vesting in 2004.
In contrast to the year 2001 and certain prior years, when variable (performance) stockoptions were issued, the stock-based compensation grants for 2002 and 2003 alreadyconsider the performance of the Company versus a peer group of multinationals.
-denominated stock options and restricted share rights are granted to employees inthe United States only.
Under the terms of employee stock purchase plans established by the Company in variouscountries, substantially all employees in those countries are eligible to purchase a limitednumber of shares of Philips stock at discounted prices through payroll withholdings, ofwhich the maximum ranges from 8.5% to 10% of total salary. Generally, the discountprovided to the employees is between the range of 10% to 20%. In the United States, thepurchase price equals the lower of 85% of the closing price at the beginning or end ofquarterly stock purchase periods. A total of 1,889,964 shares were sold in 2003 under theplan at an average price of 18.46 (2002: 1,722,575 shares, at a price of 23.69, 2001:955,668 shares, at a price of 24.29).
In the Netherlands, Philips issued personnel debentures with a 5-year right of conversioninto common shares of Royal Philips Electronics. In 2003, 907,988 shares were issued inconjunction with conversions at an average price of 15.41 (2002: 515,309 shares at anaverage price of 14.52, 2001: 415,038 shares at an average price of 9.08).
109Philips Annual Report 2003
Prior to 2003, the Company accounted for stock-based compensation using the intrinsicvalue method, and the recognition and measurement provisions of APB Opinion No. 25,‘Accounting for Stock Issued to Employees’, and related interpretations. Accordingly, nocompensation has been recorded for the fixed stock options granted or for the US stockpurchase plan. Compensation income of 5 million in 2002 and expense of 5
million in 2001 was recognized for the performance stock options granted.Additionally, approximately 1 million was recorded as an expense for sharespurchased through certain compensatory stock purchase plans in 2002.Effective January 1, 2003, the Company adopted the fair value recognition provisions ofSFAS No. 123, ‘Accounting for Stock Based Compensation’, prospectively to all employerawards granted, modified, or settled after January 1, 2003. Please refer to stock-basedcompensation under accounting policies, for a reconciliation of reported and pro formaincome (loss) of earnings per share. An expense of 41 million was recorded in 2003 forstock-based compensation, including 3 million related to the performance stockoptions issued in 2001. Since awards issued under the Company’s plans prior to 2003
generally vested over three years, the cost related to stock-based compensation included inthe determination of net income for 2003 is less than that which would have beenrecognized if the fair value method had been applied to all outstanding awards.
Pro forma net income may not be representative of that to be expected in future years.
In accordance with SFAS No. 123, the fair value of stock options granted is required to bebased upon a statistical option valuation model. Since the Company’s stock options are nottraded on any exchange, employees can receive no value nor derive any benefit fromholding these stock options without an increase in the market price of Philips’ stock. Suchan increase in stock price would benefit all shareholders commensurately.
The fair value of the Company’s 2001, 2002 and 2003 option grants was estimated using aBlack-Scholes option pricing model and the following weighted average assumptions:
2001 2002 2003
(EUR-denominated)
Risk-free interest rate 4.66% 4.70% 3.49%
Expected dividend yield 1.2% 1.2% 1.6%
Expected option life 5 yrs 5 yrs 5 yrs
Expected stock price volatility 49% 53% 56%
2001 2002 2003
(USD-denominated)
Risk-free interest rate 4.77% 4.65% 3.08%
Expected dividend yield 1.2% 1.2% 1.7%
Expected option life 5 yrs 5 yrs 5 yrs
Expected stock price volatility 49% 49% 51%
The assumptions were used for these calculations only and do not necessarily represent anindication of Management’s expectations of future developments.
The Black-Scholes option valuation model was developed for use in estimating the fairvalue of traded options which have no vesting restrictions and are fully transferable. Inaddition, option valuation models require the input of highly subjective assumptions,including the expected stock price volatility. The Company’s employee stock options havecharacteristics significantly different from those of traded options, and changes in thesubjective input assumptions can materially affect the fair value estimate.
110 Philips Annual Report 2003
Financial Statements and Analysis
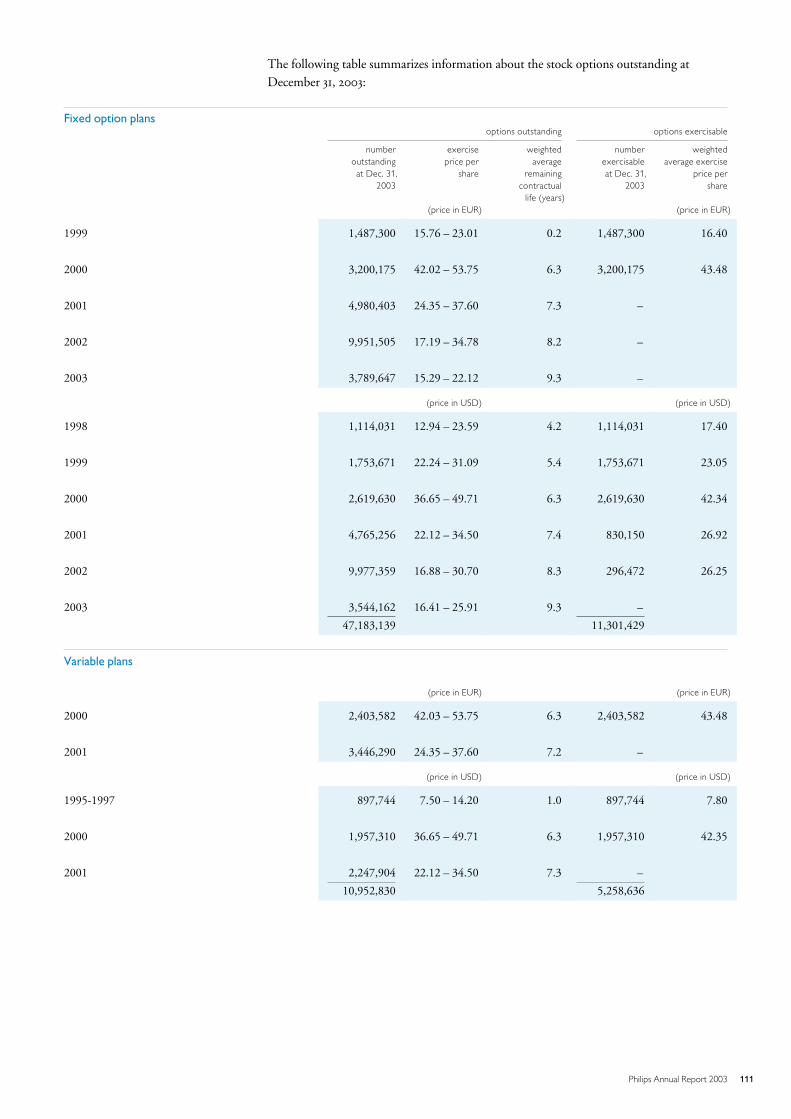
The following table summarizes information about the stock options outstanding atDecember 31, 2003:
Fixed option plansoptions outstanding options exercisable
numberoutstanding
exerciseprice per
weightedaverage
numberexercisable
weightedaverage exercise
at Dec. 31, share remaining at Dec. 31, price per2003 contractual 2003 share
life (years)(price in EUR) (price in EUR)
1999 1,487,300 15.76 – 23.01 0.2 1,487,300 16.40
2000 3,200,175 42.02 – 53.75 6.3 3,200,175 43.48
2001 4,980,403 24.35 – 37.60 7.3 –
2002 9,951,505 17.19 – 34.78 8.2 –
2003 3,789,647 15.29 – 22.12 9.3 –
(price in USD) (price in USD)
1998 1,114,031 12.94 – 23.59 4.2 1,114,031 17.40
1999 1,753,671 22.24 – 31.09 5.4 1,753,671 23.05
2000 2,619,630 36.65 – 49.71 6.3 2,619,630 42.34
2001 4,765,256 22.12 – 34.50 7.4 830,150 26.92
2002 9,977,359 16.88 – 30.70 8.3 296,472 26.25
2003 3,544,162 16.41 – 25.91 9.3 –
47,183,139 11,301,429
Variable plans
(price in EUR) (price in EUR)
2000 2,403,582 42.03 – 53.75 6.3 2,403,582 43.48
2001 3,446,290 24.35 – 37.60 7.2 –
(price in USD) (price in USD)
1995-1997 897,744 7.50 – 14.20 1.0 897,744 7.80
2000 1,957,310 36.65 – 49.71 6.3 1,957,310 42.35
2001 2,247,904 22.12 – 34.50 7.3 –
10,952,830 5,258,636
111Philips Annual Report 2003
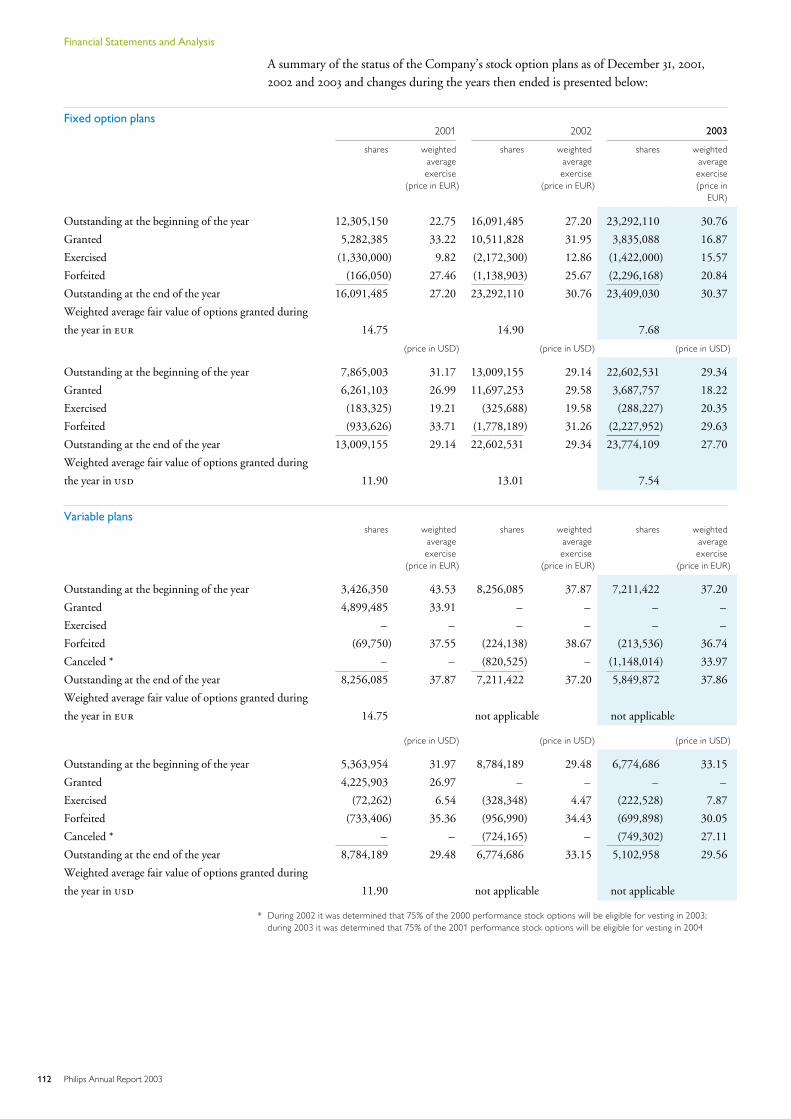
A summary of the status of the Company’s stock option plans as of December 31, 2001,2002 and 2003 and changes during the years then ended is presented below:
Fixed option plans2001 2002 2003
shares weightedaverageexercise
(price in EUR)
shares weightedaverageexercise
(price in EUR)
shares weightedaverageexercise(price in
EUR)
Outstanding at the beginning of the year 12,305,150 22.75 16,091,485 27.20 23,292,110 30.76
Granted 5,282,385 33.22 10,511,828 31.95 3,835,088 16.87
Exercised (1,330,000) 9.82 (2,172,300) 12.86 (1,422,000) 15.57
Forfeited (166,050) 27.46 (1,138,903) 25.67 (2,296,168) 20.84
Outstanding at the end of the year 16,091,485 27.20 23,292,110 30.76 23,409,030 30.37
Weighted average fair value of options granted during
the year in 14.75 14.90 7.68
(price in USD) (price in USD) (price in USD)
Outstanding at the beginning of the year 7,865,003 31.17 13,009,155 29.14 22,602,531 29.34
Granted 6,261,103 26.99 11,697,253 29.58 3,687,757 18.22
Exercised (183,325) 19.21 (325,688) 19.58 (288,227) 20.35
Forfeited (933,626) 33.71 (1,778,189) 31.26 (2,227,952) 29.63
Outstanding at the end of the year 13,009,155 29.14 22,602,531 29.34 23,774,109 27.70
Weighted average fair value of options granted during
the year in 11.90 13.01 7.54
Variable plansshares weighted
averageexercise
(price in EUR)
shares weightedaverageexercise
(price in EUR)
shares weightedaverageexercise
(price in EUR)
Outstanding at the beginning of the year 3,426,350 43.53 8,256,085 37.87 7,211,422 37.20
Granted 4,899,485 33.91 – – – –
Exercised – – – – – –
Forfeited (69,750) 37.55 (224,138) 38.67 (213,536) 36.74
Canceled * – – (820,525) – (1,148,014) 33.97
Outstanding at the end of the year 8,256,085 37.87 7,211,422 37.20 5,849,872 37.86
Weighted average fair value of options granted during
the year in 14.75 not applicable not applicable
(price in USD) (price in USD) (price in USD)
Outstanding at the beginning of the year 5,363,954 31.97 8,784,189 29.48 6,774,686 33.15
Granted 4,225,903 26.97 – – – –
Exercised (72,262) 6.54 (328,348) 4.47 (222,528) 7.87
Forfeited (733,406) 35.36 (956,990) 34.43 (699,898) 30.05
Canceled * – – (724,165) – (749,302) 27.11
Outstanding at the end of the year 8,784,189 29.48 6,774,686 33.15 5,102,958 29.56
Weighted average fair value of options granted during
the year in 11.90 not applicable not applicable
* During 2002 it was determined that 75% of the 2000 performance stock options will be eligible for vesting in 2003;during 2003 it was determined that 75% of the 2001 performance stock options will be eligible for vesting in 2004
112 Philips Annual Report 2003
Financial Statements and Analysis
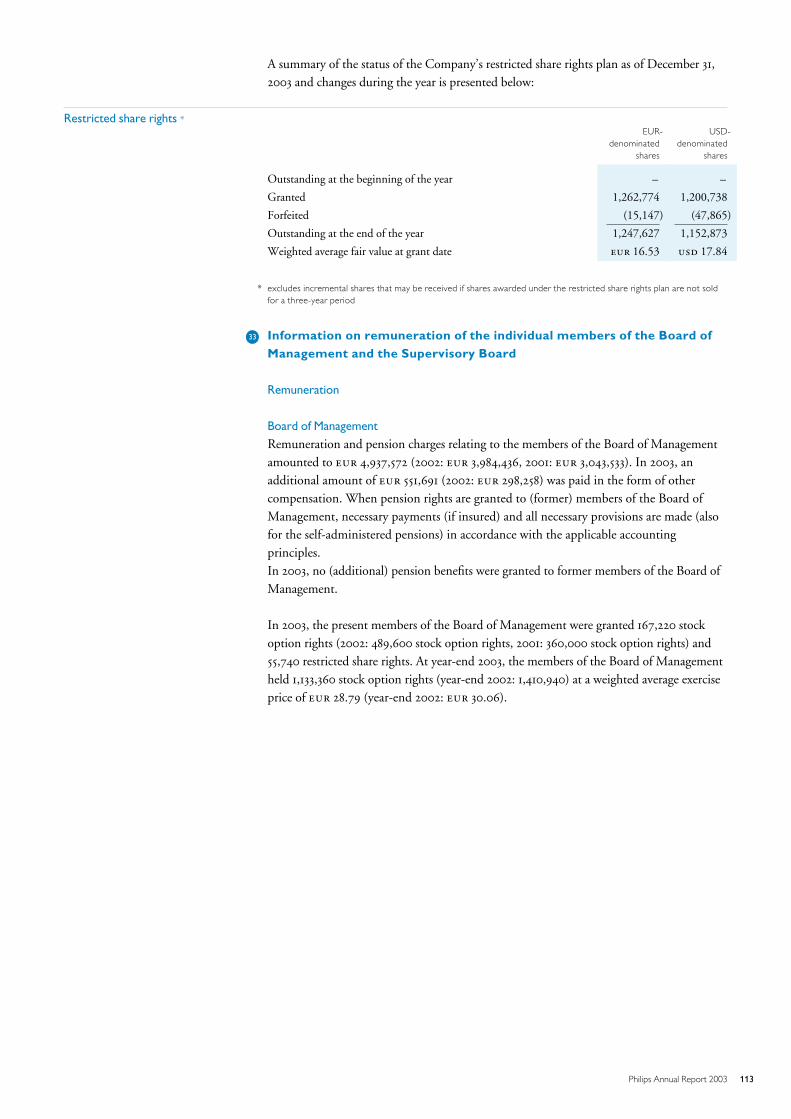
A summary of the status of the Company’s restricted share rights plan as of December 31,2003 and changes during the year is presented below:
Restricted share rights *EUR-
denominatedshares
USD-denominated
shares
Outstanding at the beginning of the year – –
Granted 1,262,774 1,200,738
Forfeited (15,147) (47,865)
Outstanding at the end of the year 1,247,627 1,152,873
Weighted average fair value at grant date 16.53 17.84
* excludes incremental shares that may be received if shares awarded under the restricted share rights plan are not soldfor a three-year period
L33 Information on remuneration of the individual members of the Board ofManagement and the Supervisory Board
Remuneration
Board of Management
Remuneration and pension charges relating to the members of the Board of Managementamounted to 4,937,572 (2002: 3,984,436, 2001: 3,043,533). In 2003, anadditional amount of 551,691 (2002: 298,258) was paid in the form of othercompensation. When pension rights are granted to (former) members of the Board ofManagement, necessary payments (if insured) and all necessary provisions are made (alsofor the self-administered pensions) in accordance with the applicable accountingprinciples.In 2003, no (additional) pension benefits were granted to former members of the Board ofManagement.
In 2003, the present members of the Board of Management were granted 167,220 stockoption rights (2002: 489,600 stock option rights, 2001: 360,000 stock option rights) and55,740 restricted share rights. At year-end 2003, the members of the Board of Managementheld 1,133,360 stock option rights (year-end 2002: 1,410,940) at a weighted average exerciseprice of 28.79 (year-end 2002: 30.06).
113Philips Annual Report 2003
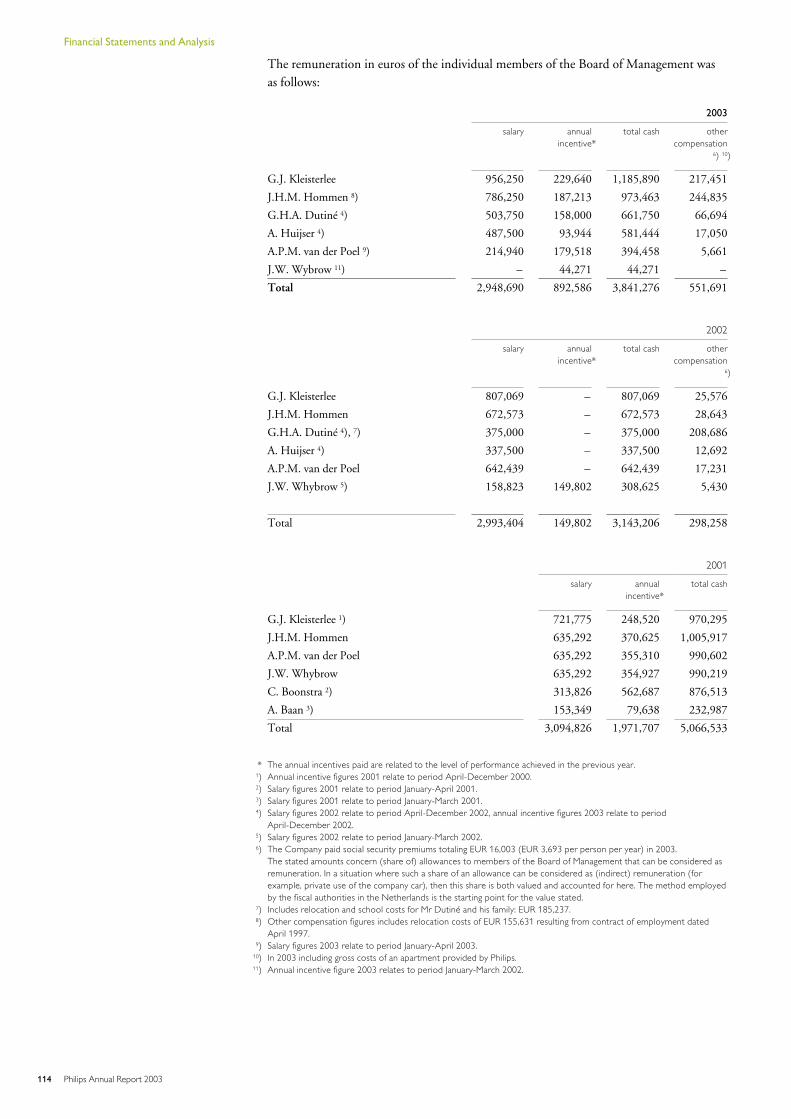
The remuneration in euros of the individual members of the Board of Management wasas follows:
2003
salary annualincentive*
total cash othercompensation
6) 10)
G.J. Kleisterlee 956,250 229,640 1,185,890 217,451
J.H.M. Hommen 8) 786,250 187,213 973,463 244,835
G.H.A. Dutiné 4) 503,750 158,000 661,750 66,694
A. Huijser 4) 487,500 93,944 581,444 17,050
A.P.M. van der Poel 9) 214,940 179,518 394,458 5,661
J.W. Wybrow 11) – 44,271 44,271 –
Total 2,948,690 892,586 3,841,276 551,691
2002
salary annualincentive*
total cash othercompensation
6)
G.J. Kleisterlee 807,069 – 807,069 25,576
J.H.M. Hommen 672,573 – 672,573 28,643
G.H.A. Dutiné 4), 7) 375,000 – 375,000 208,686
A. Huijser 4) 337,500 – 337,500 12,692
A.P.M. van der Poel 642,439 – 642,439 17,231
J.W. Whybrow 5) 158,823 149,802 308,625 5,430
Total 2,993,404 149,802 3,143,206 298,258
2001
salary annualincentive*
total cash
G.J. Kleisterlee 1) 721,775 248,520 970,295
J.H.M. Hommen 635,292 370,625 1,005,917
A.P.M. van der Poel 635,292 355,310 990,602
J.W. Whybrow 635,292 354,927 990,219
C. Boonstra 2) 313,826 562,687 876,513
A. Baan 3) 153,349 79,638 232,987
Total 3,094,826 1,971,707 5,066,533
* The annual incentives paid are related to the level of performance achieved in the previous year.1) Annual incentive figures 2001 relate to period April-December 2000.2) Salary figures 2001 relate to period January-April 2001.3) Salary figures 2001 relate to period January-March 2001.4) Salary figures 2002 relate to period April-December 2002, annual incentive figures 2003 relate to period
April-December 2002.5) Salary figures 2002 relate to period January-March 2002.6) The Company paid social security premiums totaling EUR 16,003 (EUR 3,693 per person per year) in 2003.
The stated amounts concern (share of) allowances to members of the Board of Management that can be considered asremuneration. In a situation where such a share of an allowance can be considered as (indirect) remuneration (forexample, private use of the company car), then this share is both valued and accounted for here. The method employedby the fiscal authorities in the Netherlands is the starting point for the value stated.
7) Includes relocation and school costs for Mr Dutiné and his family: EUR 185,237.8) Other compensation figures includes relocation costs of EUR 155,631 resulting from contract of employment dated
April 1997.9) Salary figures 2003 relate to period January-April 2003.
10) In 2003 including gross costs of an apartment provided by Philips.11) Annual incentive figure 2003 relates to period January-March 2002.
114 Philips Annual Report 2003
Financial Statements and Analysis
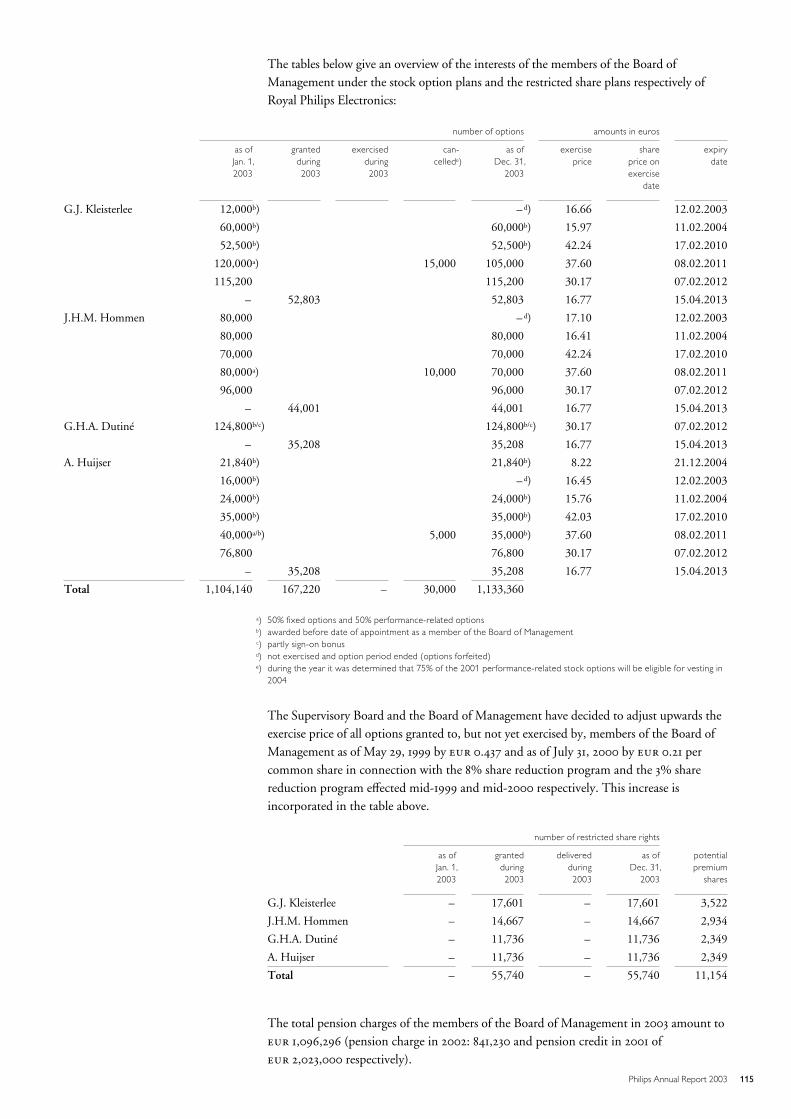
The tables below give an overview of the interests of the members of the Board ofManagement under the stock option plans and the restricted share plans respectively ofRoyal Philips Electronics:
number of options amounts in euros
as of granted exercised can- as of exercise share expiryJan. 1, during during cellede) Dec. 31, price price on date2003 2003 2003 2003 exercise
date
G.J. Kleisterlee 12,000b) – d) 16.66 12.02.2003
60,000b) 60,000b) 15.97 11.02.2004
52,500b) 52,500b) 42.24 17.02.2010
120,000a) 15,000 105,000 37.60 08.02.2011
115,200 115,200 30.17 07.02.2012
– 52,803 52,803 16.77 15.04.2013
J.H.M. Hommen 80,000 – d) 17.10 12.02.2003
80,000 80,000 16.41 11.02.2004
70,000 70,000 42.24 17.02.2010
80,000a) 10,000 70,000 37.60 08.02.2011
96,000 96,000 30.17 07.02.2012
– 44,001 44,001 16.77 15.04.2013
G.H.A. Dutiné 124,800b/c) 124,800b/c) 30.17 07.02.2012
– 35,208 35,208 16.77 15.04.2013
A. Huijser 21,840b) 21,840b) 8.22 21.12.2004
16,000b) – d) 16.45 12.02.2003
24,000b) 24,000b) 15.76 11.02.2004
35,000b) 35,000b) 42.03 17.02.2010
40,000a/b) 5,000 35,000b) 37.60 08.02.2011
76,800 76,800 30.17 07.02.2012
– 35,208 35,208 16.77 15.04.2013
Total 1,104,140 167,220 – 30,000 1,133,360
a) 50% fixed options and 50% performance-related optionsb) awarded before date of appointment as a member of the Board of Managementc) partly sign-on bonusd) not exercised and option period ended (options forfeited)e) during the year it was determined that 75% of the 2001 performance-related stock options will be eligible for vesting in
2004
The Supervisory Board and the Board of Management have decided to adjust upwards theexercise price of all options granted to, but not yet exercised by, members of the Board ofManagement as of May 29, 1999 by 0.437 and as of July 31, 2000 by 0.21 percommon share in connection with the 8% share reduction program and the 3% sharereduction program effected mid-1999 and mid-2000 respectively. This increase isincorporated in the table above.
number of restricted share rights
as ofJan. 1,
grantedduring
deliveredduring
as ofDec. 31,
potentialpremium
2003 2003 2003 2003 shares
G.J. Kleisterlee – 17,601 – 17,601 3,522
J.H.M. Hommen – 14,667 – 14,667 2,934
G.H.A. Dutiné – 11,736 – 11,736 2,349
A. Huijser – 11,736 – 11,736 2,349
Total – 55,740 – 55,740 11,154
The total pension charges of the members of the Board of Management in 2003 amount to 1,096,296 (pension charge in 2002: 841,230 and pension credit in 2001 of 2,023,000 respectively).
115Philips Annual Report 2003
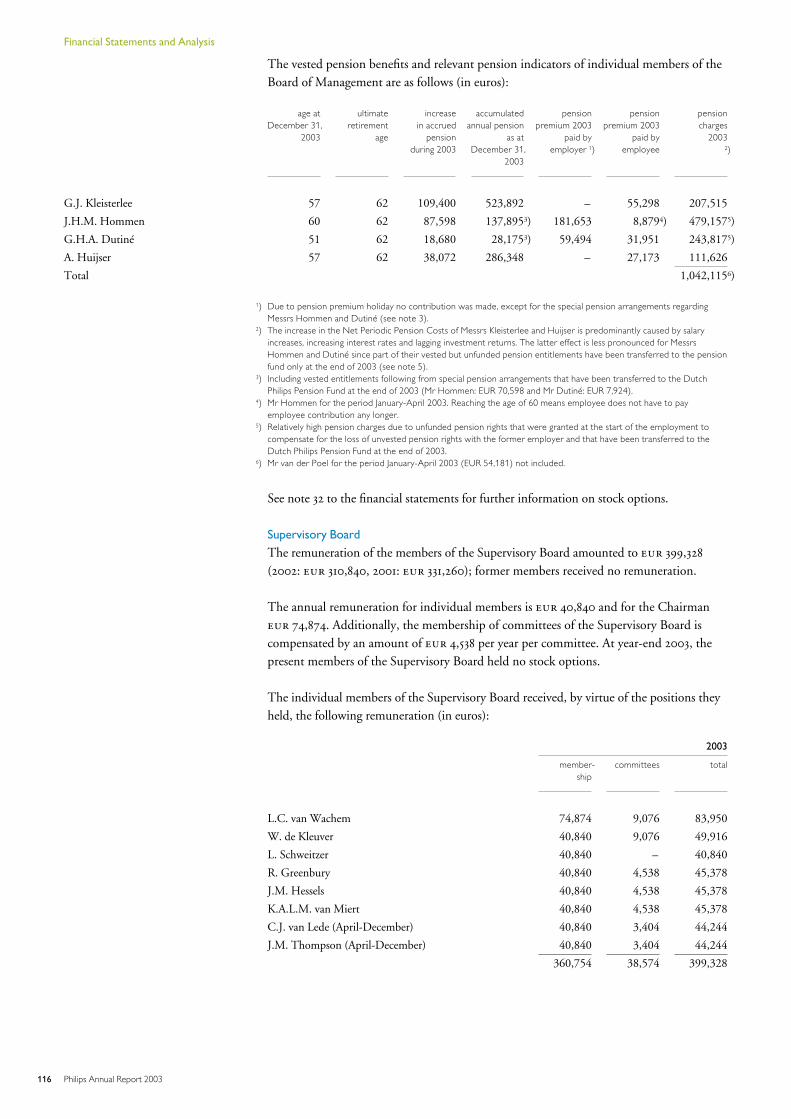
The vested pension benefits and relevant pension indicators of individual members of theBoard of Management are as follows (in euros):
age at ultimate increase accumulated pension pension pensionDecember 31, retirement in accrued annual pension premium 2003 premium 2003 charges
2003 age pension as at paid by paid by 2003during 2003 December 31, employer 1) employee 2)
2003
G.J. Kleisterlee 57 62 109,400 523,892 – 55,298 207,515
J.H.M. Hommen 60 62 87,598 137,8953) 181,653 8,8794) 479,1575)
G.H.A. Dutiné 51 62 18,680 28,1753) 59,494 31,951 243,8175)
A. Huijser 57 62 38,072 286,348 – 27,173 111,626
Total 1,042,1156)
1) Due to pension premium holiday no contribution was made, except for the special pension arrangements regardingMessrs Hommen and Dutiné (see note 3).
2) The increase in the Net Periodic Pension Costs of Messrs Kleisterlee and Huijser is predominantly caused by salaryincreases, increasing interest rates and lagging investment returns. The latter effect is less pronounced for MessrsHommen and Dutiné since part of their vested but unfunded pension entitlements have been transferred to the pensionfund only at the end of 2003 (see note 5).
3) Including vested entitlements following from special pension arrangements that have been transferred to the DutchPhilips Pension Fund at the end of 2003 (Mr Hommen: EUR 70,598 and Mr Dutiné: EUR 7,924).
4) Mr Hommen for the period January-April 2003. Reaching the age of 60 means employee does not have to payemployee contribution any longer.
5) Relatively high pension charges due to unfunded pension rights that were granted at the start of the employment tocompensate for the loss of unvested pension rights with the former employer and that have been transferred to theDutch Philips Pension Fund at the end of 2003.
6) Mr van der Poel for the period January-April 2003 (EUR 54,181) not included.
See note 32 to the financial statements for further information on stock options.
Supervisory Board
The remuneration of the members of the Supervisory Board amounted to 399,328
(2002: 310,840, 2001: 331,260); former members received no remuneration.
The annual remuneration for individual members is 40,840 and for the Chairman 74,874. Additionally, the membership of committees of the Supervisory Board iscompensated by an amount of 4,538 per year per committee. At year-end 2003, thepresent members of the Supervisory Board held no stock options.
The individual members of the Supervisory Board received, by virtue of the positions theyheld, the following remuneration (in euros):
2003
member- committees totalship
L.C. van Wachem 74,874 9,076 83,950
W. de Kleuver 40,840 9,076 49,916
L. Schweitzer 40,840 – 40,840
R. Greenbury 40,840 4,538 45,378
J.M. Hessels 40,840 4,538 45,378
K.A.L.M. van Miert 40,840 4,538 45,378
C.J. van Lede (April-December) 40,840 3,404 44,244
J.M. Thompson (April-December) 40,840 3,404 44,244
360,754 38,574 399,328
116 Philips Annual Report 2003
Financial Statements and Analysis
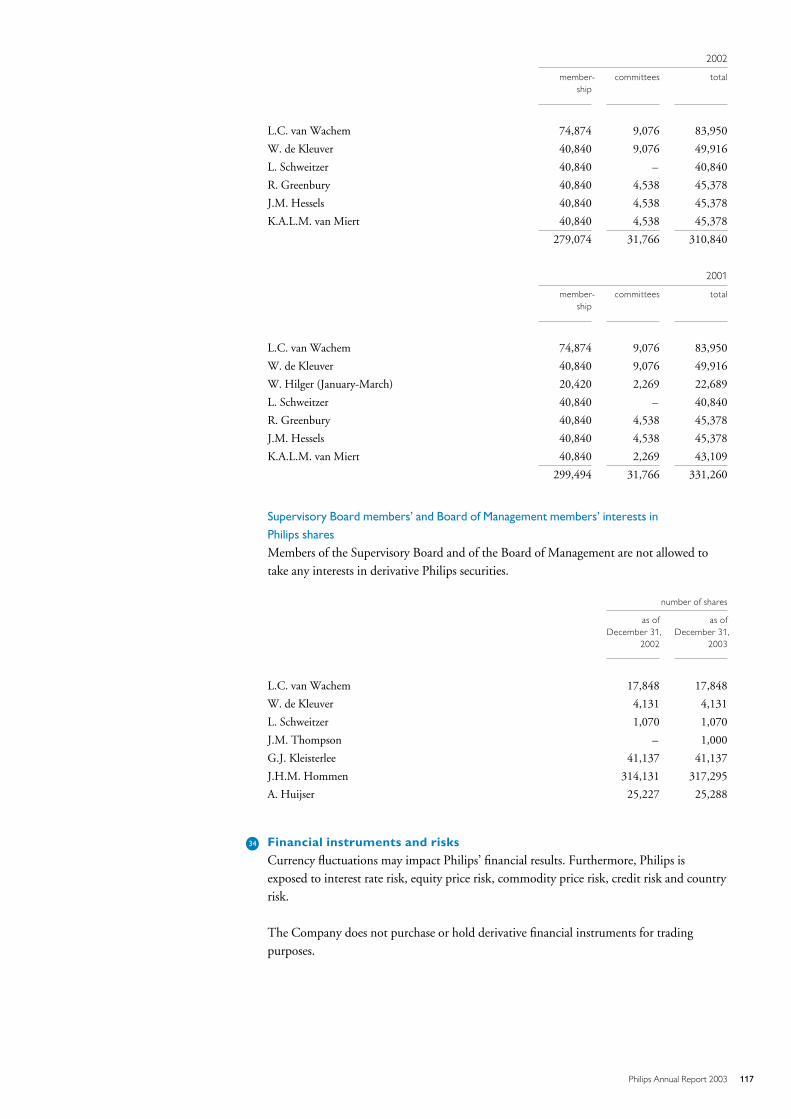
2002
member- committees totalship
L.C. van Wachem 74,874 9,076 83,950
W. de Kleuver 40,840 9,076 49,916
L. Schweitzer 40,840 – 40,840
R. Greenbury 40,840 4,538 45,378
J.M. Hessels 40,840 4,538 45,378
K.A.L.M. van Miert 40,840 4,538 45,378
279,074 31,766 310,840
2001
member- committees totalship
L.C. van Wachem 74,874 9,076 83,950
W. de Kleuver 40,840 9,076 49,916
W. Hilger (January-March) 20,420 2,269 22,689
L. Schweitzer 40,840 – 40,840
R. Greenbury 40,840 4,538 45,378
J.M. Hessels 40,840 4,538 45,378
K.A.L.M. van Miert 40,840 2,269 43,109
299,494 31,766 331,260
Supervisory Board members’ and Board of Management members’ interests in
Philips shares
Members of the Supervisory Board and of the Board of Management are not allowed totake any interests in derivative Philips securities.
number of shares
as of as ofDecember 31, December 31,
2002 2003
L.C. van Wachem 17,848 17,848
W. de Kleuver 4,131 4,131
L. Schweitzer 1,070 1,070
J.M. Thompson – 1,000
G.J. Kleisterlee 41,137 41,137
J.H.M. Hommen 314,131 317,295
A. Huijser 25,227 25,288
L34 Financial instruments and risksCurrency fluctuations may impact Philips’ financial results. Furthermore, Philips isexposed to interest rate risk, equity price risk, commodity price risk, credit risk and countryrisk.
The Company does not purchase or hold derivative financial instruments for tradingpurposes.
117Philips Annual Report 2003
Currency risk
The Company has a structural currency mismatch between costs and revenues, as asubstantial proportion of its production, administration and research & development costsis denominated in euros, while a substantial proportion of its revenues is denominated inUS dollars. Consequently, fluctuations in the exchange rate of the US dollar against theeuro can have a material impact on Philips’ financial results. In particular, a relatively weakUS dollar during any reporting period will reduce Philips’ income from operations, while astronger US dollar will improve it.
The Company is exposed to currency risk in the following areas:G transaction exposures, such as forecasted sales and purchases and receivables/payables
resulting from such transactions;G translation exposure of net income in foreign entities;G translation exposure of investments in foreign entities;G exposure of non-functional-currency-denominated debt;G exposure of non-functional-currency-denominated equity investments.
All businesses must identify and measure their exposures from material transactionsdenominated in currencies other than their own functional currency. It is Philips’ policythat significant transaction exposures are hedged by the businesses. The Philips policyrequires committed foreign currency exposures to be hedged fully using forwards.Anticipated transactions are hedged using forwards or options or a combination thereof.The policy for the hedging of anticipated exposures specifying the use of forwards/optionsand the hedge tenor varies per business and is a function of the ability to forecast cashflowsand the way in which the businesses can adapt to changed levels of foreign exchange rates.Generally, the maximum tenor of these hedges is less than 18 months.The Company does not hedge the exposure arising from translation exposure of netincome in foreign entities.
Translation exposure of equity invested in consolidated foreign entities financed by equityis in general not hedged. If a hedge is entered into, it is accounted for as a net investmenthedge.
Intercompany loans of the Company to its subsidiaries are generally provided in thefunctional currency of the borrowing entity. The currency of the external funding of theCompany is matched with the required financing of subsidiaries either directly by externalforeign currency loans, or by using foreign exchange swaps. In this way the translationexposure of investments in foreign entities financed by debt is hedged.Philips does not currently hedge the foreign exchange exposure arising fromunconsolidated equity investments.
The Company uses foreign exchange derivatives to manage its currency risk. The inherentrisk related to the use of these derivatives is outlined below.
The US dollar and related currencies, i.e. the Chinese renminbi and the Hong Kong dollaraccount for a high percentage of the foreign exchange derivatives of the Company. Apartfrom that, the Company has significant derivatives outstanding related to the poundsterling. An instantaneous 10% increase of the euro against the US dollar and the poundsterling from their levels at December 31, 2003, with all other variables held constant,would result in the following changes in the fair value of the Company’s financialderivatives.
118 Philips Annual Report 2003
Financial Statements and Analysis
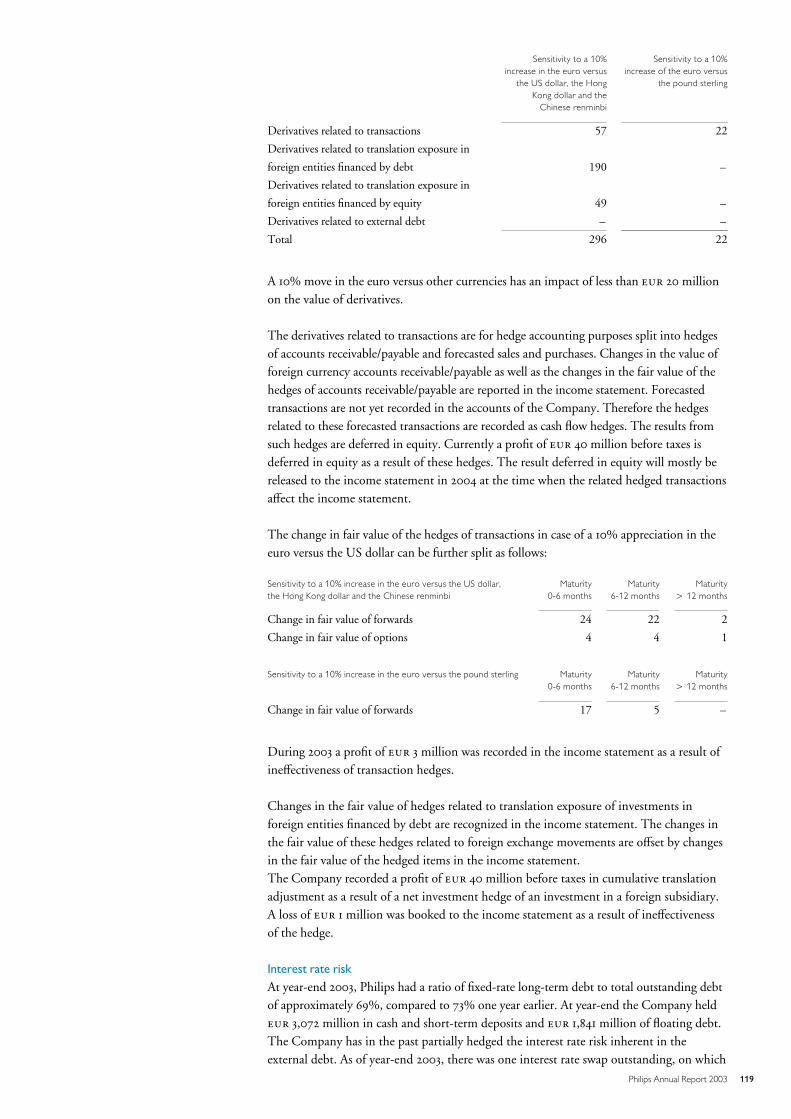
Sensitivity to a 10%increase in the euro versus
the US dollar, the HongKong dollar and the
Chinese renminbi
Sensitivity to a 10%increase of the euro versus
the pound sterling
Derivatives related to transactions 57 22
Derivatives related to translation exposure in
foreign entities financed by debt 190 –
Derivatives related to translation exposure in
foreign entities financed by equity 49 –
Derivatives related to external debt – –
Total 296 22
A 10% move in the euro versus other currencies has an impact of less than 20 millionon the value of derivatives.
The derivatives related to transactions are for hedge accounting purposes split into hedgesof accounts receivable/payable and forecasted sales and purchases. Changes in the value offoreign currency accounts receivable/payable as well as the changes in the fair value of thehedges of accounts receivable/payable are reported in the income statement. Forecastedtransactions are not yet recorded in the accounts of the Company. Therefore the hedgesrelated to these forecasted transactions are recorded as cash flow hedges. The results fromsuch hedges are deferred in equity. Currently a profit of 40 million before taxes isdeferred in equity as a result of these hedges. The result deferred in equity will mostly bereleased to the income statement in 2004 at the time when the related hedged transactionsaffect the income statement.
The change in fair value of the hedges of transactions in case of a 10% appreciation in theeuro versus the US dollar can be further split as follows:
Sensitivity to a 10% increase in the euro versus the US dollar, Maturity Maturity Maturitythe Hong Kong dollar and the Chinese renminbi 0-6 months 6-12 months A 12 months
Change in fair value of forwards 24 22 2
Change in fair value of options 4 4 1
Sensitivity to a 10% increase in the euro versus the pound sterling Maturity Maturity Maturity0-6 months 6-12 months A 12 months
Change in fair value of forwards 17 5 –
During 2003 a profit of 3 million was recorded in the income statement as a result ofineffectiveness of transaction hedges.
Changes in the fair value of hedges related to translation exposure of investments inforeign entities financed by debt are recognized in the income statement. The changes inthe fair value of these hedges related to foreign exchange movements are offset by changesin the fair value of the hedged items in the income statement.The Company recorded a profit of 40 million before taxes in cumulative translationadjustment as a result of a net investment hedge of an investment in a foreign subsidiary.A loss of 1 million was booked to the income statement as a result of ineffectivenessof the hedge.
Interest rate risk
At year-end 2003, Philips had a ratio of fixed-rate long-term debt to total outstanding debtof approximately 69%, compared to 73% one year earlier. At year-end the Company held 3,072 million in cash and short-term deposits and 1,841 million of floating debt.The Company has in the past partially hedged the interest rate risk inherent in theexternal debt. As of year-end 2003, there was one interest rate swap outstanding, on which
119Philips Annual Report 2003
the Company received fixed interest of 14 million. The results on this interest rateswap are recognized in the income statement.
Certain interest rate hedges related to bonds were unwound during 2003. The fair valueadjustments to the bonds will be amortized to the income statement based on therecalculated effective yield. In 2004 we expect to release a gain of 11 million. Noresults were released to the income statement as a result of ineffectiveness of interest ratehedges in 2003.
As of December 31, 2003 the majority of debt consisted of bonds. Of the 4,192
million of long-term debt, 5% consisted of bonds with a so-called ‘embedded put’ feature,which allows the investor to ask for redemption of the bonds in one specific date prior totheir final maturity date.
A sensitivity analysis shows that if long-term interest rates were to decreaseinstantaneously by 1% from their level of December 31, 2003, with all other variables(including foreign exchange rates) held constant, the fair value of the long-term debtwould increase by 211 million. This increase is based on the assumption that the‘putable’ bonds will be repaid at their final maturity date. If the bondholders requiredpayment at their respective put dates and there was an increase in interest rates by 1%, thiswould reduce the market value of the long-term debt by 191 million.
If interest rates were to increase instantaneously by 1% from their level of December 31,2003, with all other variables held constant, the net interest expense would decrease byapproximately 12 million in 2004 due to the significant cash position of theCompany. This impact is based on the outstanding position at year-end.
Other financial risks
Other financial risks include liquidity risk, equity price risk, commodity price risk, creditrisk and country risk.
Liquidity risk
The rating of the Company’s debt by major rating services may improve or deteriorate. Asa result, the Company’s borrowing capacity may be influenced and its financing costs mayfluctuate. The 3,072 million in cash and short-term deposits and the 3,500
million stand-by facility mitigate the liquidity risk for the Company.
Equity price risk
Philips is a shareholder in several publicly listed companies such as TSMC, Atos Origin,ASML, FEI, Vivendi Universal, JDS Uniphase and GN Great Nordic. As a result, Philipsis exposed to the equity price risk through movements in the share prices of thesecompanies. The aggregate market value of all these equity investments amounted toapproximately 8,290 million at year-end 2003 (2002: 6,798 million)
Commodity price risk
The Company is a purchaser of certain base metals (such as copper), precious metals andenergy. The Company hedges certain commodity price risks using derivative instrumentsto minimize significant, unanticipated earnings fluctuations caused by commodity pricevolatility. The commodity price derivatives that the Company enters into are concluded ascash flow hedges to offset forecasted purchases. A 10% increase in the market price of allcommodities would increase the fair value of the derivatives by 1 million.
120 Philips Annual Report 2003
Financial Statements and Analysis
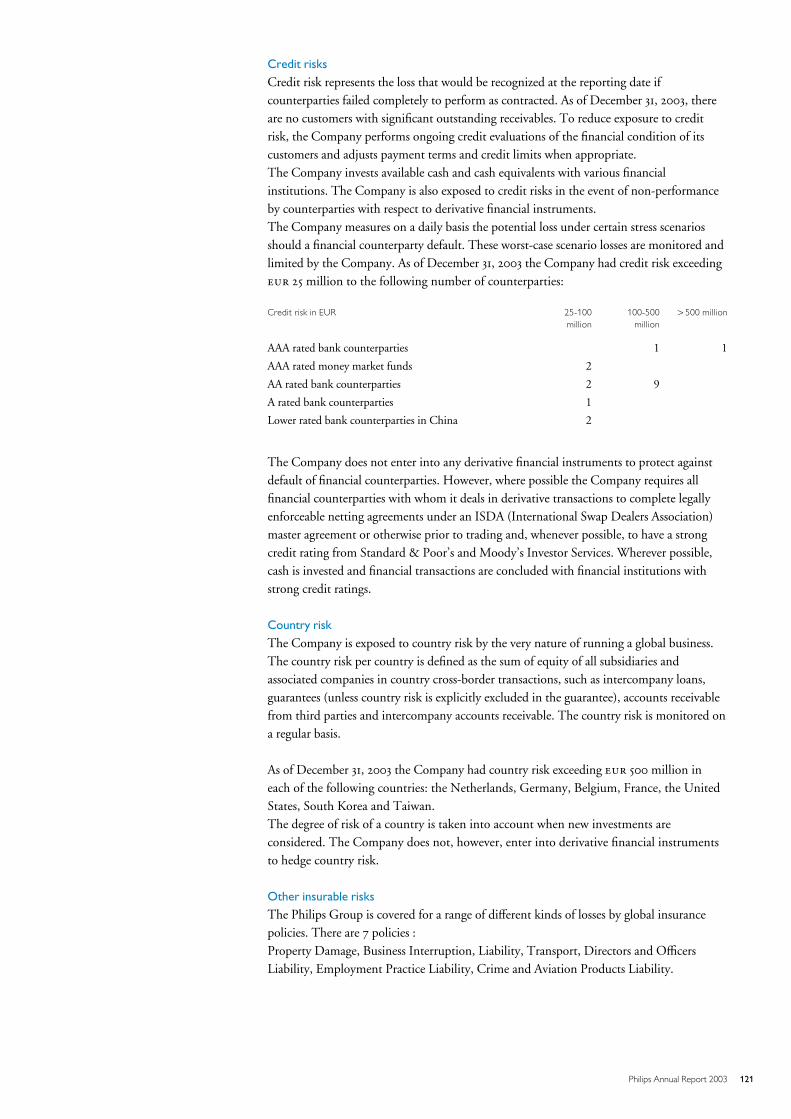
Credit risks
Credit risk represents the loss that would be recognized at the reporting date ifcounterparties failed completely to perform as contracted. As of December 31, 2003, thereare no customers with significant outstanding receivables. To reduce exposure to creditrisk, the Company performs ongoing credit evaluations of the financial condition of itscustomers and adjusts payment terms and credit limits when appropriate.The Company invests available cash and cash equivalents with various financialinstitutions. The Company is also exposed to credit risks in the event of non-performanceby counterparties with respect to derivative financial instruments.The Company measures on a daily basis the potential loss under certain stress scenariosshould a financial counterparty default. These worst-case scenario losses are monitored andlimited by the Company. As of December 31, 2003 the Company had credit risk exceeding 25 million to the following number of counterparties:
Credit risk in EUR 25-100million
100-500million
A500 million
AAA rated bank counterparties 1 1
AAA rated money market funds 2
AA rated bank counterparties 2 9
A rated bank counterparties 1
Lower rated bank counterparties in China 2
The Company does not enter into any derivative financial instruments to protect againstdefault of financial counterparties. However, where possible the Company requires allfinancial counterparties with whom it deals in derivative transactions to complete legallyenforceable netting agreements under an ISDA (International Swap Dealers Association)master agreement or otherwise prior to trading and, whenever possible, to have a strongcredit rating from Standard & Poor’s and Moody’s Investor Services. Wherever possible,cash is invested and financial transactions are concluded with financial institutions withstrong credit ratings.
Country risk
The Company is exposed to country risk by the very nature of running a global business.The country risk per country is defined as the sum of equity of all subsidiaries andassociated companies in country cross-border transactions, such as intercompany loans,guarantees (unless country risk is explicitly excluded in the guarantee), accounts receivablefrom third parties and intercompany accounts receivable. The country risk is monitored ona regular basis.
As of December 31, 2003 the Company had country risk exceeding 500 million ineach of the following countries: the Netherlands, Germany, Belgium, France, the UnitedStates, South Korea and Taiwan.The degree of risk of a country is taken into account when new investments areconsidered. The Company does not, however, enter into derivative financial instrumentsto hedge country risk.
Other insurable risks
The Philips Group is covered for a range of different kinds of losses by global insurancepolicies. There are 7 policies :Property Damage, Business Interruption, Liability, Transport, Directors and OfficersLiability, Employment Practice Liability, Crime and Aviation Products Liability.
121Philips Annual Report 2003
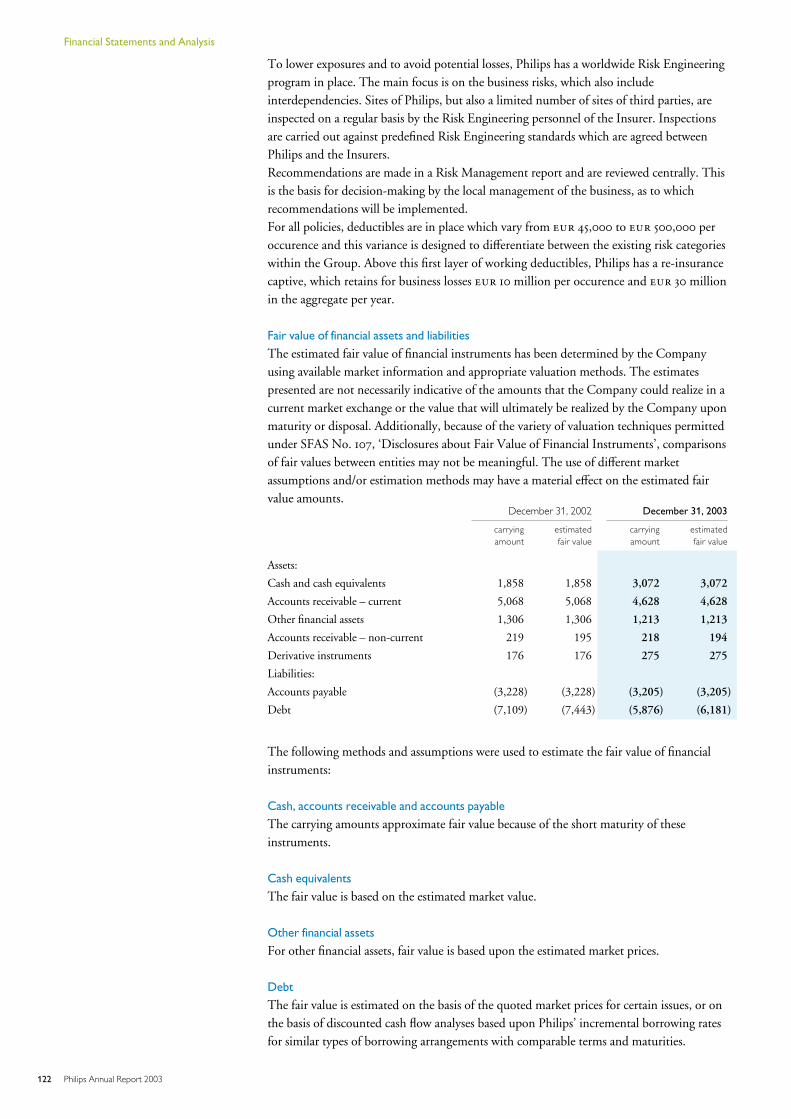
To lower exposures and to avoid potential losses, Philips has a worldwide Risk Engineeringprogram in place. The main focus is on the business risks, which also includeinterdependencies. Sites of Philips, but also a limited number of sites of third parties, areinspected on a regular basis by the Risk Engineering personnel of the Insurer. Inspectionsare carried out against predefined Risk Engineering standards which are agreed betweenPhilips and the Insurers.Recommendations are made in a Risk Management report and are reviewed centrally. Thisis the basis for decision-making by the local management of the business, as to whichrecommendations will be implemented.For all policies, deductibles are in place which vary from 45,000 to 500,000 peroccurence and this variance is designed to differentiate between the existing risk categorieswithin the Group. Above this first layer of working deductibles, Philips has a re-insurancecaptive, which retains for business losses 10 million per occurence and 30 millionin the aggregate per year.
Fair value of financial assets and liabilities
The estimated fair value of financial instruments has been determined by the Companyusing available market information and appropriate valuation methods. The estimatespresented are not necessarily indicative of the amounts that the Company could realize in acurrent market exchange or the value that will ultimately be realized by the Company uponmaturity or disposal. Additionally, because of the variety of valuation techniques permittedunder SFAS No. 107, ‘Disclosures about Fair Value of Financial Instruments’, comparisonsof fair values between entities may not be meaningful. The use of different marketassumptions and/or estimation methods may have a material effect on the estimated fairvalue amounts.
December 31, 2002 December 31, 2003
carrying estimated carrying estimatedamount fair value amount fair value
Assets:
Cash and cash equivalents 1,858 1,858 3,072 3,072
Accounts receivable – current 5,068 5,068 4,628 4,628
Other financial assets 1,306 1,306 1,213 1,213
Accounts receivable – non-current 219 195 218 194
Derivative instruments 176 176 275 275
Liabilities:
Accounts payable (3,228) (3,228) (3,205) (3,205)
Debt (7,109) (7,443) (5,876) (6,181)
The following methods and assumptions were used to estimate the fair value of financialinstruments:
Cash, accounts receivable and accounts payable
The carrying amounts approximate fair value because of the short maturity of theseinstruments.
Cash equivalents
The fair value is based on the estimated market value.
Other financial assets
For other financial assets, fair value is based upon the estimated market prices.
Debt
The fair value is estimated on the basis of the quoted market prices for certain issues, or onthe basis of discounted cash flow analyses based upon Philips’ incremental borrowing ratesfor similar types of borrowing arrangements with comparable terms and maturities.
122 Philips Annual Report 2003
Financial Statements and Analysis
L35 Information relating to product sectors and main countriesPhilips’ internal organization and internal reporting structure is organized in compliancewith SFAS No. 131. As a result, the following product sectors are distinguished as reportablesegments: Lighting, Consumer Electronics, Domestic Appliances and Personal Care,Semiconductors, Medical Systems and Miscellaneous.Last year, the Company announced that the Components division would be dissolved asfrom 2003. Part of the division’s activities have been moved to Semiconductors (MobileDisplay Systems and the telecom speakers activity). Another part has been moved toConsumer Electronics (LCD TV, multimedia projectors, LCoS TV, wireless connectivitymodules and parts of remote control systems). The Optical Storage business wasrestructured and transferred to the Miscellaneous sector. The remaining activities havebeen transferred to the Corporate Investments group (in the Miscellaneous sector) forpotential sale or merger.Furthermore, the activities belonging to Digital Networks have been relocated to theConsumer Electronics sector and partly to the Miscellaneous sector from 2003 onwards.
Lighting
Philips is the leader in the world lighting market. The division consists of four lines ofbusiness – Lamps, Luminaires, Lighting Electronics and Automotive & Special Lighting. Awide variety of applications are served by a full range of lamps, fixtures, ballasts andlighting electronics. Philips Lighting, along with Lumileds Lighting, the joint venture withAgilent Technologies, is spearheading the development of new applications using LEDtechnology, both in the home and in the wider outside environment.
Consumer Electronics
This division is a global leader in connected displays, home entertainment hubs andnetworks, and mobile infotainment. The product range includes widescreen and Flat TVs,monitors, optical disc products including DVD recorders and Super Audio CD, set-topboxes and web-enabled products, audio products such as portable audio players and miniand micro audio systems, PC peripherals such as DVD+RW data drives, and personalcommunication products including cellular phones and DECT phones.
Domestic Appliances and Personal Care
This division markets a wide range of products in the following areas: shaving & beauty(shavers, trimmers, etc.), oral healthcare (electric toothbrushes), home environment care(vacuum cleaners, air cleaners, steam irons, fans, etc.) and food & beverage (mixers, coffeemakers, toasters, etc.).
Semiconductors
Philips Semiconductors ranks among the world’s top ten semiconductor manufacturers. Asa leading provider of silicon solutions, it focuses on ‘Connected Consumer’ applicationsand serves the consumer, communications, automotive and computing markets.
Medical Systems
Philips Medical Systems is one of the world’s leading suppliers of medical imagingmodalities and patient monitoring systems. Philips Medical Systems holds global No. 1 or 2positions in most of the markets it serves. The product range includes best-in-classtechnologies in X-ray, ultrasound, magnetic resonance, computed tomography, nuclearmedicine, positron emission tomography, patient monitoring, resuscitation products andhealthcare information management, as well as a comprehensive range of customer supportservices.
123Philips Annual Report 2003
Miscellaneous
This sector comprises various activities and businesses not belonging to a product sector. Itconsists of four groups of activities: the central research and technology centers (such asPhilips Research, Intellectual Property and Standards, Philips Centre for IndustrialTechnology and Philips Design), Corporate Investments (such as Assembléon, PhilipsEnabling Technologies Group (PETG), Shared Service Centers and other activities.NavTech was consolidated for the first time in 2001 and included in the Miscellaneoussector. Until its deconsolidation in May 2001 FEI Company was included in theconsolidated figures of the Miscellaneous sector. Also included are some remaining formerbusinesses from other sectors and the equity investments in Atos Origin, LG.PhilipsDisplays and LG.Philips LCD.
Unallocated
Unallocated includes general and administrative expenses in the corporate center and theregional and country organizations.
The sales volumes of the various business activities and the associated income fromoperations by product sector and by geographic area are set forth in the following tables.Segment revenues represent the total of sales to third parties (‘sales’) and sales of productsand services between the product sectors (‘intersegment revenues’).Included in segment revenues by geographic area is the total revenue from worldwide salesto third parties and unconsolidated companies by consolidated companies located withinthat geographic area (‘sales’), as well as the total value of sales to consolidated companies inother geographic areas (‘interregional revenues’).The transfer prices charged for all intersegment (including interregional) sales are based onthe arm’s length principle as set forth in internationally accepted transfer pricing policiesand guidelines.
124 Philips Annual Report 2003
Financial Statements and Analysis
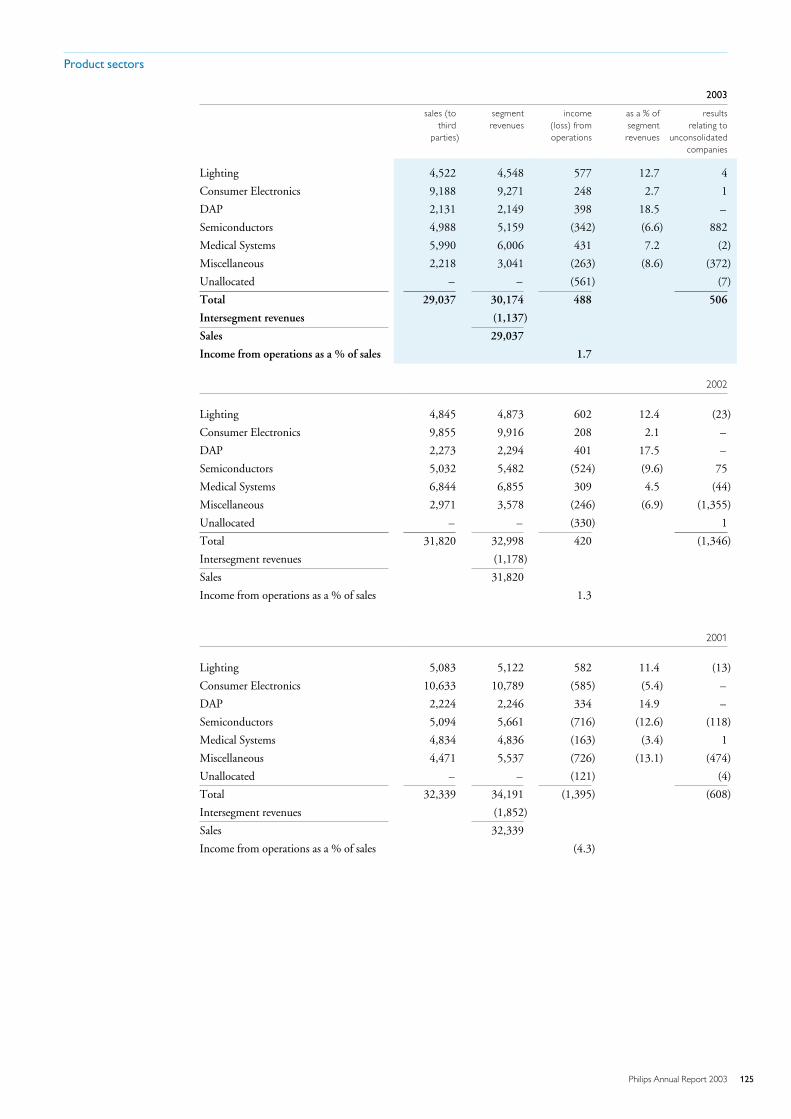
Product sectors
2003
sales (to segment income as a % of resultsthird revenues (loss) from segment relating to
parties) operations revenues unconsolidatedcompanies
Lighting 4,522 4,548 577 12.7 4
Consumer Electronics 9,188 9,271 248 2.7 1
DAP 2,131 2,149 398 18.5 –
Semiconductors 4,988 5,159 (342) (6.6) 882
Medical Systems 5,990 6,006 431 7.2 (2)
Miscellaneous 2,218 3,041 (263) (8.6) (372)
Unallocated – – (561) (7)
Total 29,037 30,174 488 506
Intersegment revenues (1,137)
Sales 29,037
Income from operations as a % of sales 1.7
2002
Lighting 4,845 4,873 602 12.4 (23)
Consumer Electronics 9,855 9,916 208 2.1 –
DAP 2,273 2,294 401 17.5 –
Semiconductors 5,032 5,482 (524) (9.6) 75
Medical Systems 6,844 6,855 309 4.5 (44)
Miscellaneous 2,971 3,578 (246) (6.9) (1,355)
Unallocated – – (330) 1
Total 31,820 32,998 420 (1,346)
Intersegment revenues (1,178)
Sales 31,820
Income from operations as a % of sales 1.3
2001
Lighting 5,083 5,122 582 11.4 (13)
Consumer Electronics 10,633 10,789 (585) (5.4) –
DAP 2,224 2,246 334 14.9 –
Semiconductors 5,094 5,661 (716) (12.6) (118)
Medical Systems 4,834 4,836 (163) (3.4) 1
Miscellaneous 4,471 5,537 (726) (13.1) (474)
Unallocated – – (121) (4)
Total 32,339 34,191 (1,395) (608)
Intersegment revenues (1,852)
Sales 32,339
Income from operations as a % of sales (4.3)
125Philips Annual Report 2003
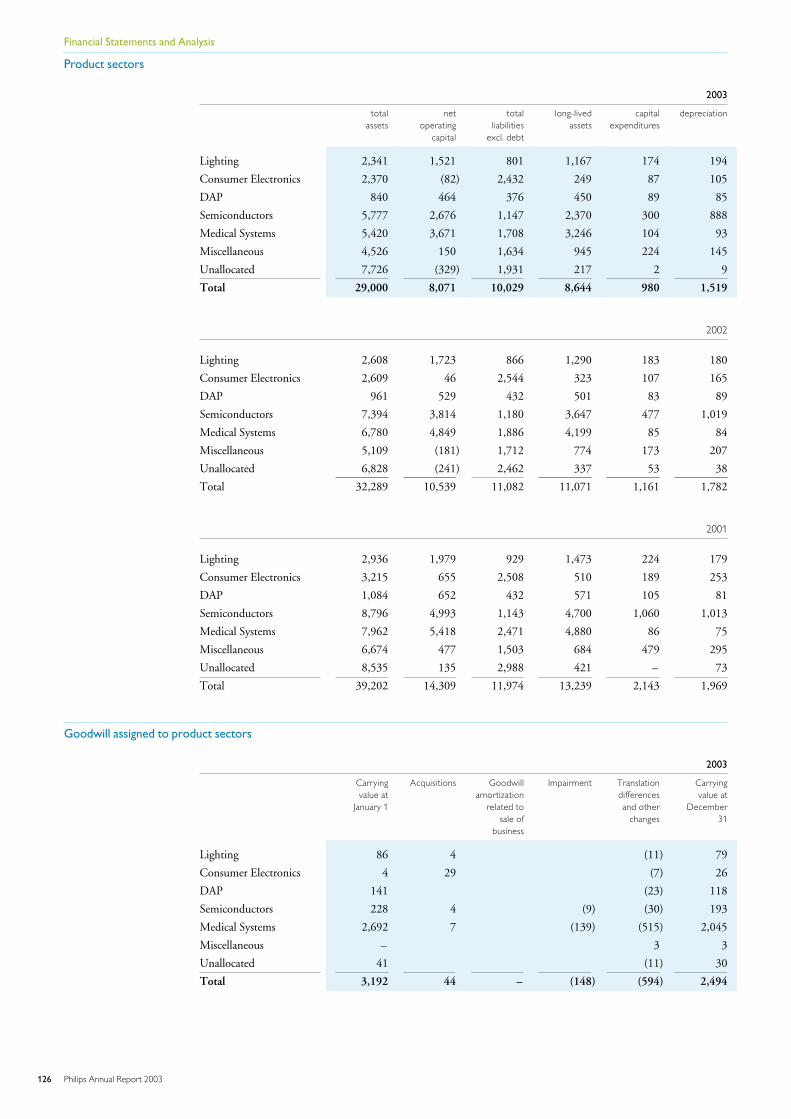
Product sectors
2003
total net total long-lived capital depreciationassets operating liabilities assets expenditures
capital excl. debt
Lighting 2,341 1,521 801 1,167 174 194
Consumer Electronics 2,370 (82) 2,432 249 87 105
DAP 840 464 376 450 89 85
Semiconductors 5,777 2,676 1,147 2,370 300 888
Medical Systems 5,420 3,671 1,708 3,246 104 93
Miscellaneous 4,526 150 1,634 945 224 145
Unallocated 7,726 (329) 1,931 217 2 9
Total 29,000 8,071 10,029 8,644 980 1,519
2002
Lighting 2,608 1,723 866 1,290 183 180
Consumer Electronics 2,609 46 2,544 323 107 165
DAP 961 529 432 501 83 89
Semiconductors 7,394 3,814 1,180 3,647 477 1,019
Medical Systems 6,780 4,849 1,886 4,199 85 84
Miscellaneous 5,109 (181) 1,712 774 173 207
Unallocated 6,828 (241) 2,462 337 53 38
Total 32,289 10,539 11,082 11,071 1,161 1,782
2001
Lighting 2,936 1,979 929 1,473 224 179
Consumer Electronics 3,215 655 2,508 510 189 253
DAP 1,084 652 432 571 105 81
Semiconductors 8,796 4,993 1,143 4,700 1,060 1,013
Medical Systems 7,962 5,418 2,471 4,880 86 75
Miscellaneous 6,674 477 1,503 684 479 295
Unallocated 8,535 135 2,988 421 – 73
Total 39,202 14,309 11,974 13,239 2,143 1,969
Goodwill assigned to product sectors
2003
Carryingvalue at
January 1
Acquisitions Goodwillamortization
related tosale of
business
Impairment Translationdifferencesand other
changes
Carryingvalue at
December31
Lighting 86 4 (11) 79
Consumer Electronics 4 29 (7) 26
DAP 141 (23) 118
Semiconductors 228 4 (9) (30) 193
Medical Systems 2,692 7 (139) (515) 2,045
Miscellaneous – 3 3
Unallocated 41 (11) 30
Total 3,192 44 – (148) (594) 2,494
126 Philips Annual Report 2003
Financial Statements and Analysis
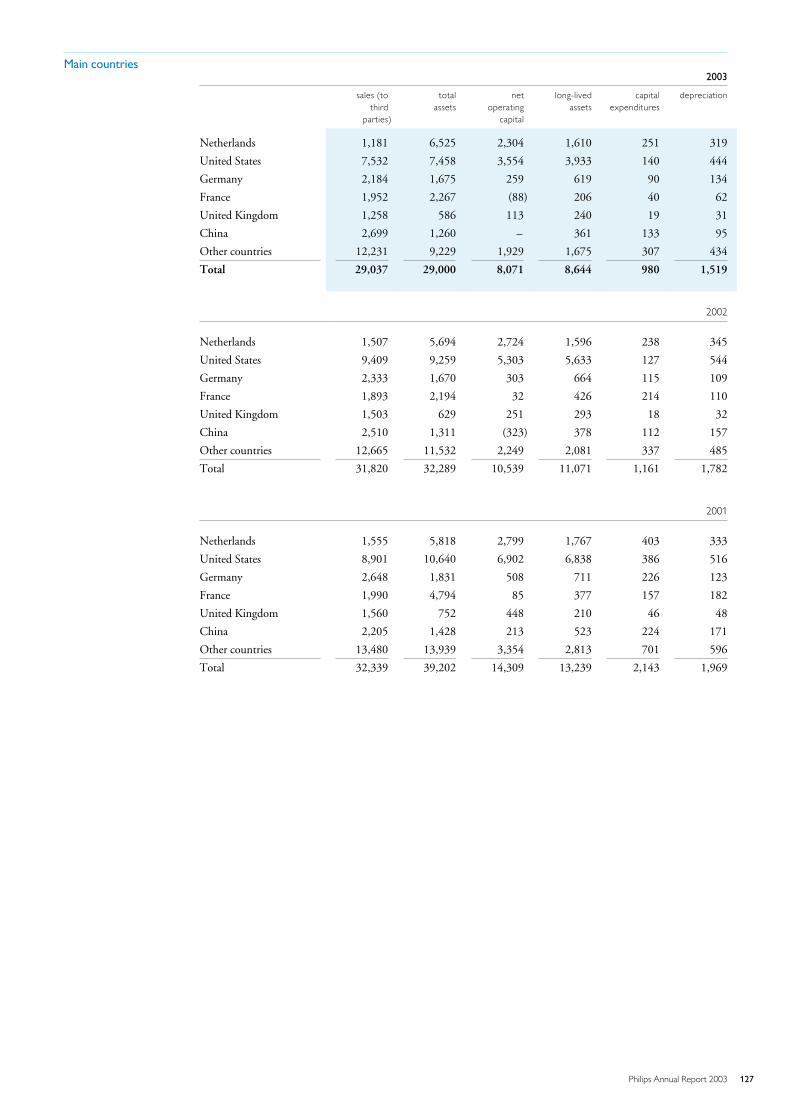
Main countries2003
sales (to total net long-lived capital depreciationthird assets operating assets expenditures
parties) capital
Netherlands 1,181 6,525 2,304 1,610 251 319
United States 7,532 7,458 3,554 3,933 140 444
Germany 2,184 1,675 259 619 90 134
France 1,952 2,267 (88) 206 40 62
United Kingdom 1,258 586 113 240 19 31
China 2,699 1,260 – 361 133 95
Other countries 12,231 9,229 1,929 1,675 307 434
Total 29,037 29,000 8,071 8,644 980 1,519
2002
Netherlands 1,507 5,694 2,724 1,596 238 345
United States 9,409 9,259 5,303 5,633 127 544
Germany 2,333 1,670 303 664 115 109
France 1,893 2,194 32 426 214 110
United Kingdom 1,503 629 251 293 18 32
China 2,510 1,311 (323) 378 112 157
Other countries 12,665 11,532 2,249 2,081 337 485
Total 31,820 32,289 10,539 11,071 1,161 1,782
2001
Netherlands 1,555 5,818 2,799 1,767 403 333
United States 8,901 10,640 6,902 6,838 386 516
Germany 2,648 1,831 508 711 226 123
France 1,990 4,794 85 377 157 182
United Kingdom 1,560 752 448 210 46 48
China 2,205 1,428 213 523 224 171
Other countries 13,480 13,939 3,354 2,813 701 596
Total 32,339 39,202 14,309 13,239 2,143 1,969
127Philips Annual Report 2003
Dutch GAAP information
Accounting principles applied for Dutch GAAP purposes
The financial statements of Koninklijke Philips Electronics N.V. and the consolidatedfinancial statements that are included in this section are prepared on a basis consistent withgenerally accepted accounting principles in the Netherlands (‘Dutch GAAP’).These accounting principles are largely in conformity with the accounting policies that areapplied in the Company’s primary consolidated financial statements as prepared underUnited States Generally Accepted Accounting Principles (‘US GAAP ’). The reader isreferred to these accounting policies on pages 53 through 62 of this report.The notes to the consolidated financial statements as prepared under US GAAP are anintegral part of the financial statements as prepared under Dutch regulations in thissection. Material differences based on differences between US GAAP and Dutch GAAP aredisclosed separately in this section.
Goodwill, which represents the excess of purchase price over fair value of net assetsacquired, is amortized on a straight-line basis over the expected periods to be benefited, notexceeding 20 years under Dutch GAAP. The Company assesses the recoverability bydetermining whether the unamortized balance of goodwill can be recovered from futureoperating cash flows of the acquired operation. The amount of goodwill impairment, ifany, is measured based on projected discounted future operating cash flows using abusiness-specific Weighted Average Cost of Capital.
Securities that are designated as available-for-sale are classified under other non-currentfinancial assets and are stated at their fair values. Changes in the fair values are recognizedin the revaluation reserve within stockholders’ equity. Other-than-temporary declines inthe fair value below cost price are charged to financial income and expenses.Other-than-temporary increases in fair value that reverse previously recognizedimpairments of available-for-sale securities are recognized in financial income.
Presentation of financial statements
The balance sheet presentation in the Dutch GAAP section is different from the one usedunder Dutch regulations and is more in line with common practice in the United States inorder to achieve optimal transparency for Dutch and US shareholders.Under this format, the order of presentation of assets and liabilities is based on the degreeof liquidity, which is common practice in the United States.
Dutch GAAP reconciliation
The accounting principles applied in the preparation of the US GAAP consolidatedfinancial statements differ in some respects from those generally accepted in theNetherlands.
For the determination of net income and stockholders’ equity in accordance with DutchGAAP, the following differences with US GAAP have been taken into account:
128 Philips Annual Report 2003
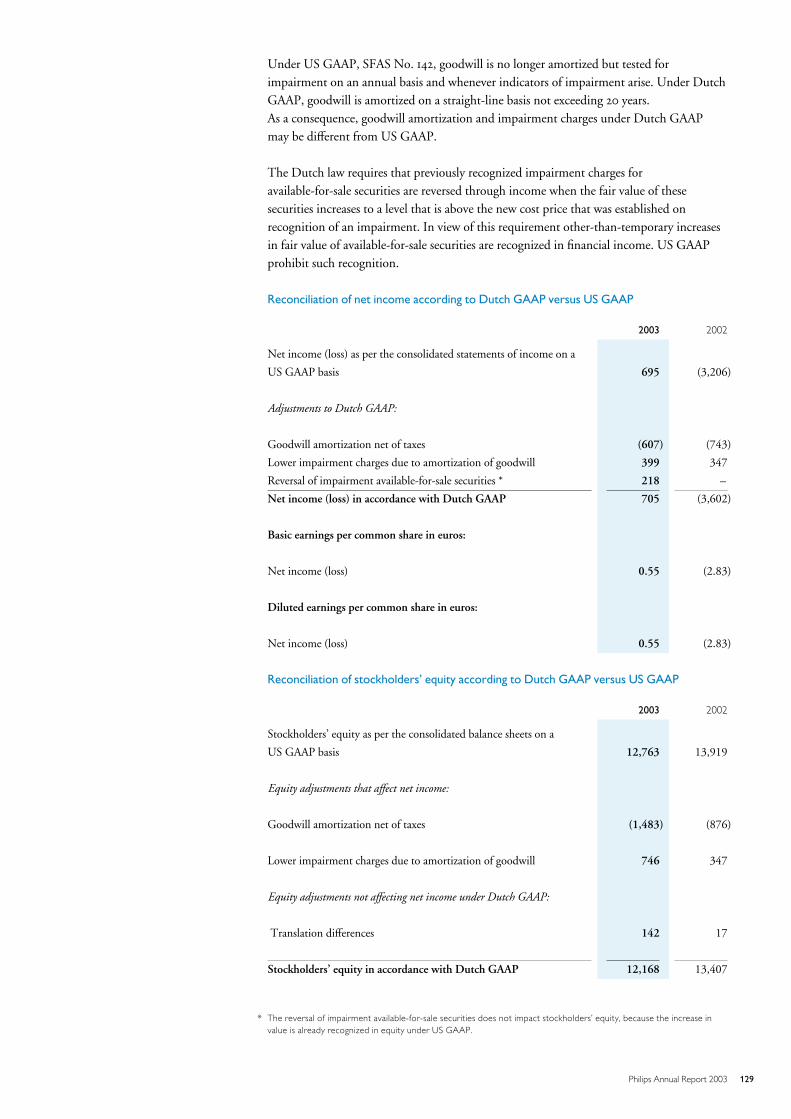
Under US GAAP, SFAS No. 142, goodwill is no longer amortized but tested forimpairment on an annual basis and whenever indicators of impairment arise. Under DutchGAAP, goodwill is amortized on a straight-line basis not exceeding 20 years.As a consequence, goodwill amortization and impairment charges under Dutch GAAPmay be different from US GAAP.
The Dutch law requires that previously recognized impairment charges foravailable-for-sale securities are reversed through income when the fair value of thesesecurities increases to a level that is above the new cost price that was established onrecognition of an impairment. In view of this requirement other-than-temporary increasesin fair value of available-for-sale securities are recognized in financial income. US GAAPprohibit such recognition.
Reconciliation of net income according to Dutch GAAP versus US GAAP
2003 2002
Net income (loss) as per the consolidated statements of income on a
US GAAP basis 695 (3,206)
Adjustments to Dutch GAAP:
Goodwill amortization net of taxes (607) (743)
Lower impairment charges due to amortization of goodwill 399 347
Reversal of impairment available-for-sale securities * 218 –
Net income (loss) in accordance with Dutch GAAP 705 (3,602)
Basic earnings per common share in euros:
Net income (loss) 0.55 (2.83)
Diluted earnings per common share in euros:
Net income (loss) 0.55 (2.83)
Reconciliation of stockholders’ equity according to Dutch GAAP versus US GAAP
2003 2002
Stockholders’ equity as per the consolidated balance sheets on a
US GAAP basis 12,763 13,919
Equity adjustments that affect net income:
Goodwill amortization net of taxes (1,483) (876)
Lower impairment charges due to amortization of goodwill 746 347
Equity adjustments not affecting net income under Dutch GAAP:
Translation differences 142 17
Stockholders’ equity in accordance with Dutch GAAP 12,168 13,407
* The reversal of impairment available-for-sale securities does not impact stockholders’ equity, because the increase invalue is already recognized in equity under US GAAP.
129Philips Annual Report 2003
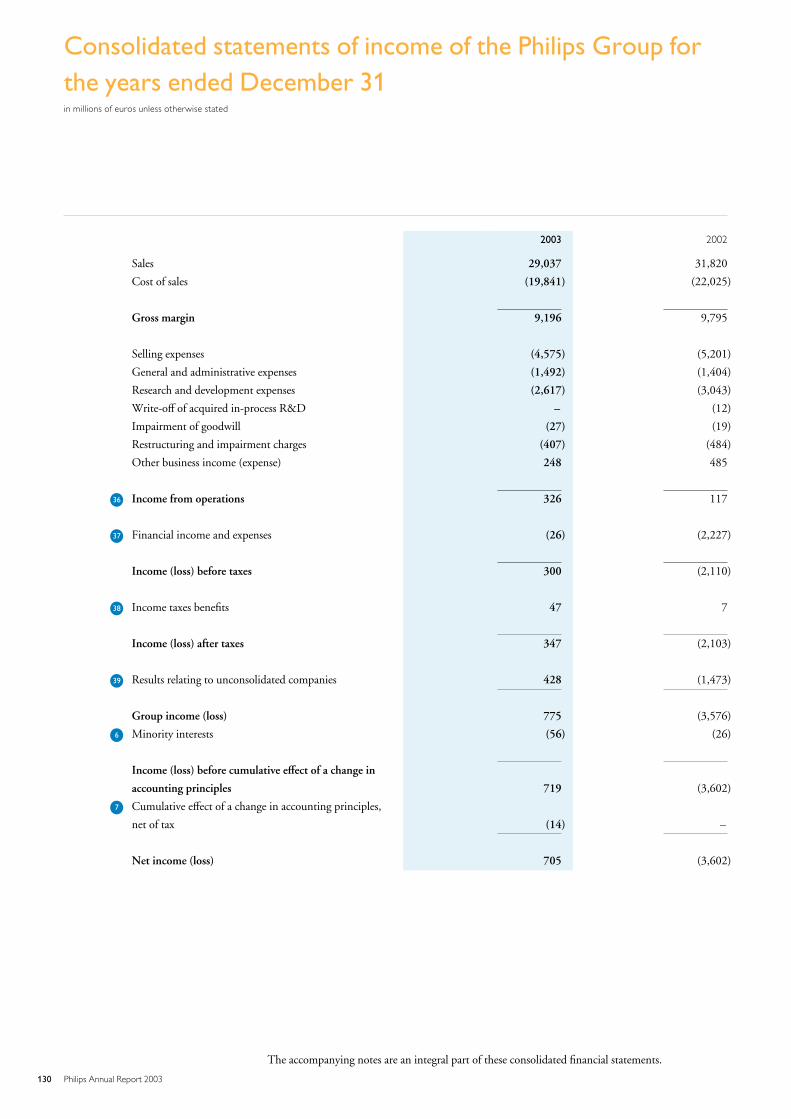
Consolidated statements of income of the Philips Group forthe years ended December 31in millions of euros unless otherwise stated
2003 2002
Sales 29,037 31,820
Cost of sales (19,841) (22,025)
Gross margin 9,196 9,795
Selling expenses (4,575) (5,201)
General and administrative expenses (1,492) (1,404)
Research and development expenses (2,617) (3,043)
Write-off of acquired in-process R&D – (12)
Impairment of goodwill (27) (19)
Restructuring and impairment charges (407) (484)
Other business income (expense) 248 485
L36 Income from operations 326 117
L37 Financial income and expenses (26) (2,227)
Income (loss) before taxes 300 (2,110)
L38 Income taxes benefits 47 7
Income (loss) after taxes 347 (2,103)
L39 Results relating to unconsolidated companies 428 (1,473)
Group income (loss) 775 (3,576)
L6 Minority interests (56) (26)
Income (loss) before cumulative effect of a change in
accounting principles 719 (3,602)
L7 Cumulative effect of a change in accounting principles,
net of tax (14) –
Net income (loss) 705 (3,602)
The accompanying notes are an integral part of these consolidated financial statements.
130 Philips Annual Report 2003
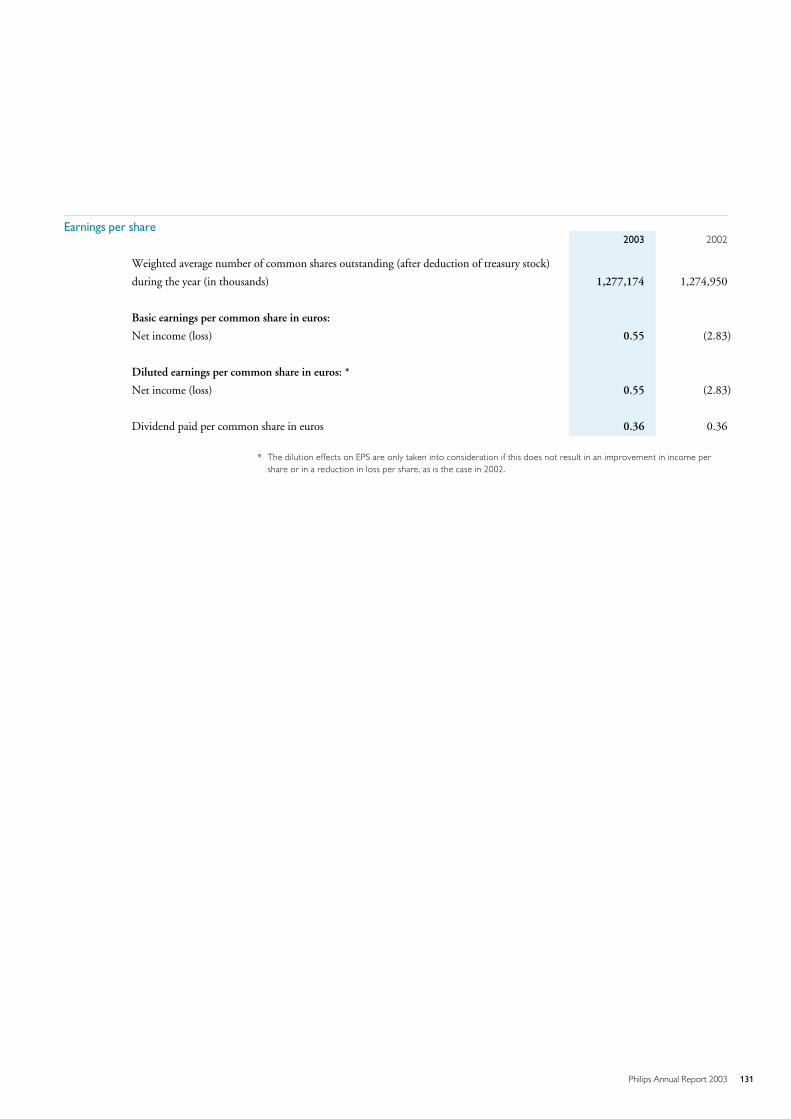
Earnings per share2003 2002
Weighted average number of common shares outstanding (after deduction of treasury stock)
during the year (in thousands) 1,277,174 1,274,950
Basic earnings per common share in euros:
Net income (loss) 0.55 (2.83)
Diluted earnings per common share in euros: *
Net income (loss) 0.55 (2.83)
Dividend paid per common share in euros 0.36 0.36
* The dilution effects on EPS are only taken into consideration if this does not result in an improvement in income pershare or in a reduction in loss per share, as is the case in 2002.
131Philips Annual Report 2003
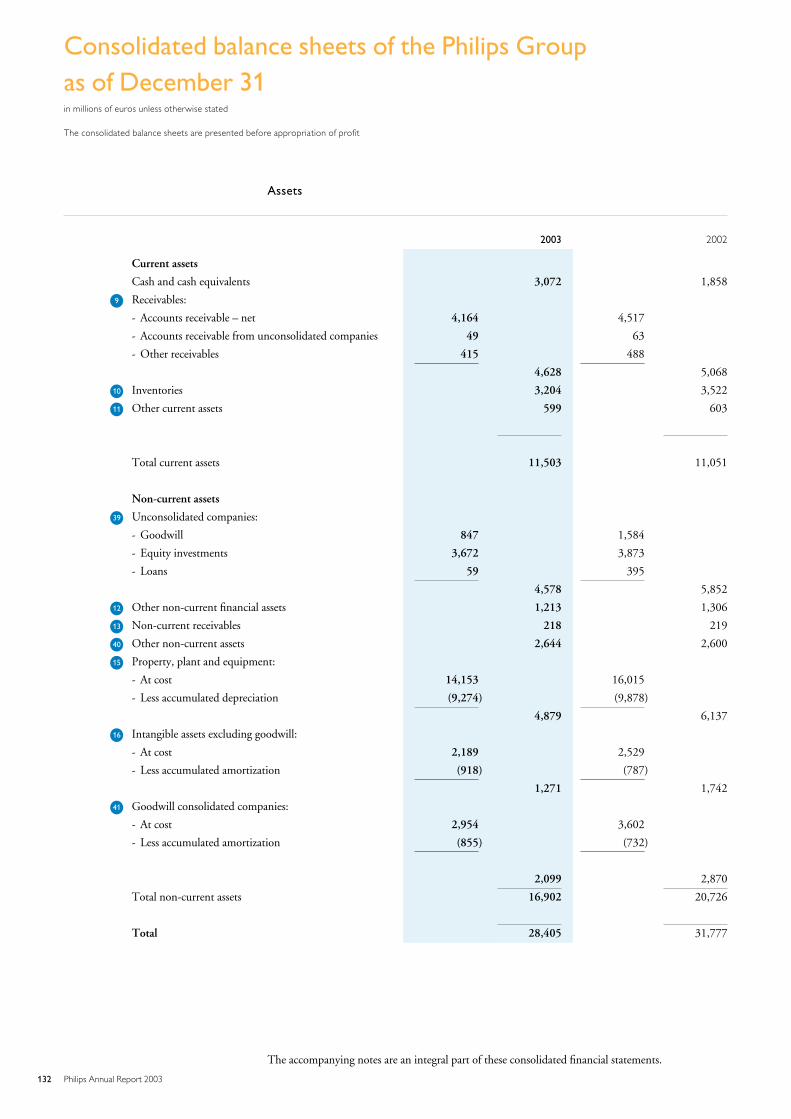
Consolidated balance sheets of the Philips Groupas of December 31in millions of euros unless otherwise stated
The consolidated balance sheets are presented before appropriation of profit
Assets
2003 2002
Current assets
Cash and cash equivalents 3,072 1,858
L9 Receivables:
- Accounts receivable – net 4,164 4,517
- Accounts receivable from unconsolidated companies 49 63
- Other receivables 415 488
4,628 5,068
L10 Inventories 3,204 3,522
L11 Other current assets 599 603
Total current assets 11,503 11,051
Non-current assets
L39 Unconsolidated companies:
- Goodwill 847 1,584
- Equity investments 3,672 3,873
- Loans 59 395
4,578 5,852
L12 Other non-current financial assets 1,213 1,306
L13 Non-current receivables 218 219
L40 Other non-current assets 2,644 2,600
L15 Property, plant and equipment:
- At cost 14,153 16,015
- Less accumulated depreciation (9,274) (9,878)
4,879 6,137
L16 Intangible assets excluding goodwill:
- At cost 2,189 2,529
- Less accumulated amortization (918) (787)
1,271 1,742
L41 Goodwill consolidated companies:
- At cost 2,954 3,602
- Less accumulated amortization (855) (732)
2,099 2,870
Total non-current assets 16,902 20,726
Total 28,405 31,777
The accompanying notes are an integral part of these consolidated financial statements.
132 Philips Annual Report 2003
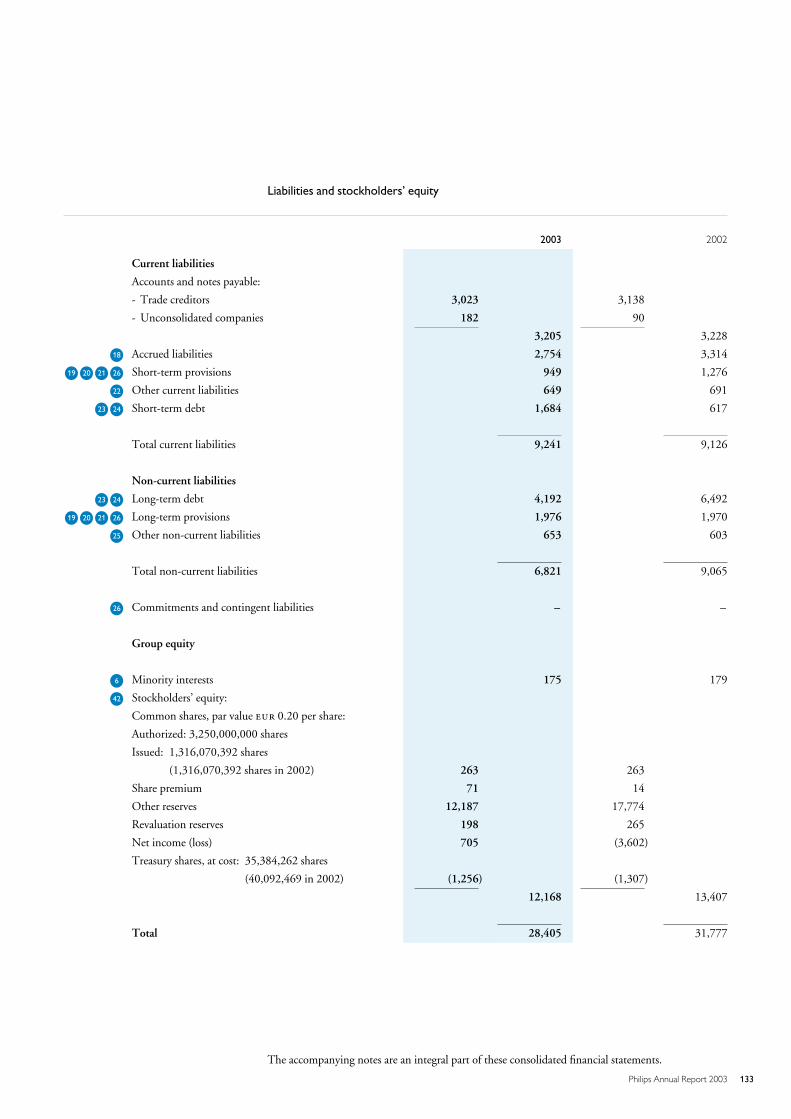
Liabilities and stockholders’ equity
2003 2002
Current liabilities
Accounts and notes payable:
- Trade creditors 3,023 3,138
- Unconsolidated companies 182 90
3,205 3,228
L18 Accrued liabilities 2,754 3,314
L19 L20 L21 L26 Short-term provisions 949 1,276
L22 Other current liabilities 649 691
L23 L24 Short-term debt 1,684 617
Total current liabilities 9,241 9,126
Non-current liabilities
L23 L24 Long-term debt 4,192 6,492
L19 L20 L21 L26 Long-term provisions 1,976 1,970
L25 Other non-current liabilities 653 603
Total non-current liabilities 6,821 9,065
L26 Commitments and contingent liabilities – –
Group equity
L6 Minority interests 175 179
L42 Stockholders’ equity:
Common shares, par value 0.20 per share:
Authorized: 3,250,000,000 shares
Issued: 1,316,070,392 shares
(1,316,070,392 shares in 2002) 263 263
Share premium 71 14
Other reserves 12,187 17,774
Revaluation reserves 198 265
Net income (loss) 705 (3,602)
Treasury shares, at cost: 35,384,262 shares
(40,092,469 in 2002) (1,256) (1,307)
12,168 13,407
Total 28,405 31,777
The accompanying notes are an integral part of these consolidated financial statements.
133Philips Annual Report 2003
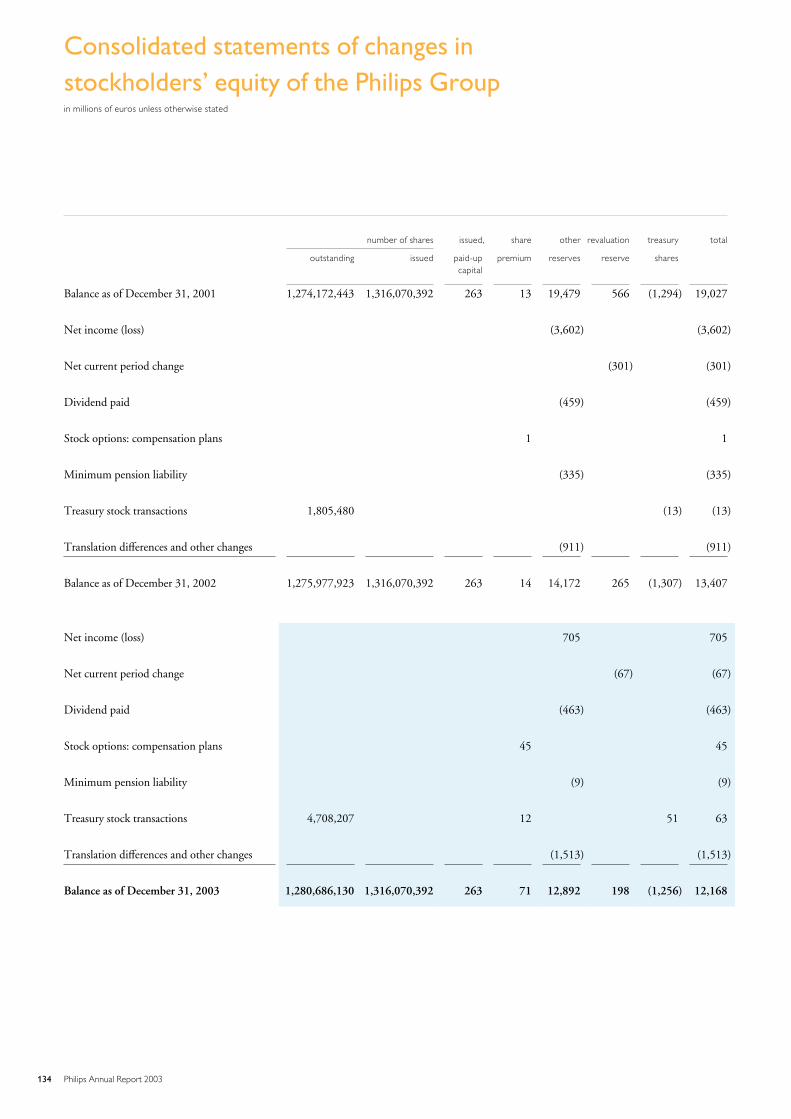
Consolidated statements of changes instockholders’ equity of the Philips Groupin millions of euros unless otherwise stated
number of shares issued, share other revaluation treasury total
outstanding issued paid-up premium reserves reserve sharescapital
Balance as of December 31, 2001 1,274,172,443 1,316,070,392 263 13 19,479 566 (1,294) 19,027
Net income (loss) (3,602) (3,602)
Net current period change (301) (301)
Dividend paid (459) (459)
Stock options: compensation plans 1 1
Minimum pension liability (335) (335)
Treasury stock transactions 1,805,480 (13) (13)
Translation differences and other changes (911) (911)
Balance as of December 31, 2002 1,275,977,923 1,316,070,392 263 14 14,172 265 (1,307) 13,407
Net income (loss) 705 705
Net current period change (67) (67)
Dividend paid (463) (463)
Stock options: compensation plans 45 45
Minimum pension liability (9) (9)
Treasury stock transactions 4,708,207 12 51 63
Translation differences and other changes (1,513) (1,513)
Balance as of December 31, 2003 1,280,686,130 1,316,070,392 263 71 12,892 198 (1,256) 12,168
134 Philips Annual Report 2003
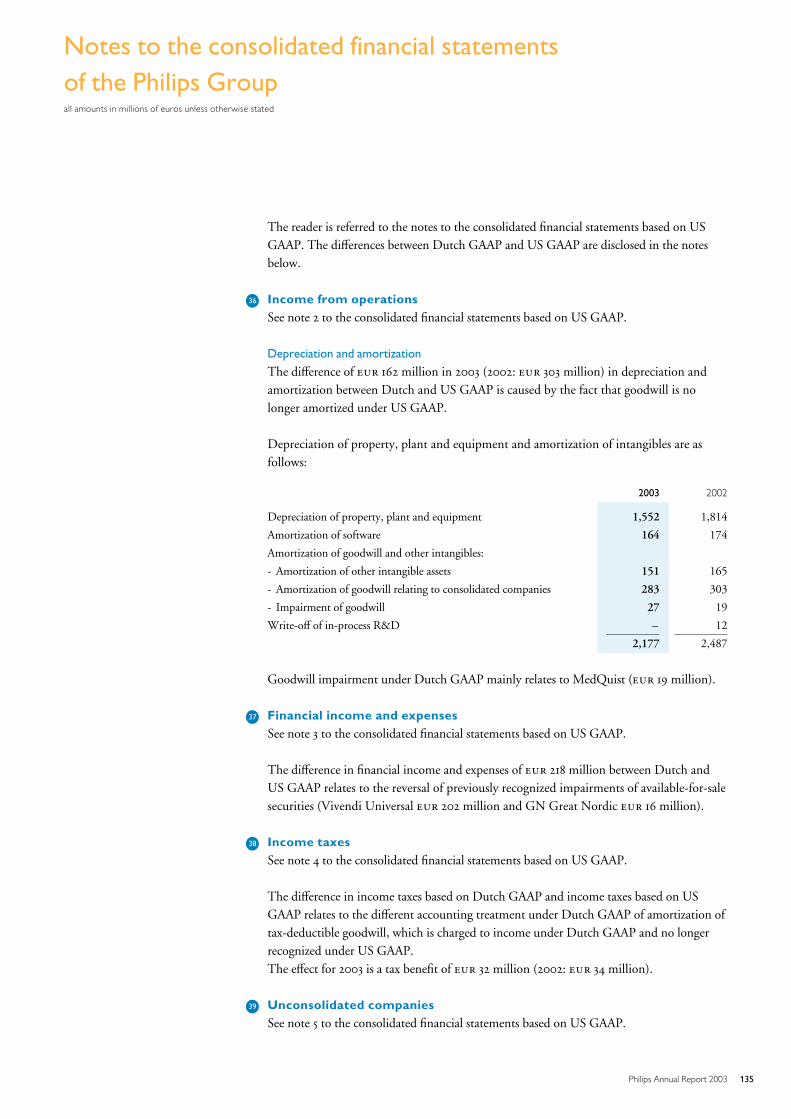
Notes to the consolidated financial statementsof the Philips Groupall amounts in millions of euros unless otherwise stated
The reader is referred to the notes to the consolidated financial statements based on USGAAP. The differences between Dutch GAAP and US GAAP are disclosed in the notesbelow.
L36 Income from operationsSee note 2 to the consolidated financial statements based on US GAAP.
Depreciation and amortization
The difference of 162 million in 2003 (2002: 303 million) in depreciation andamortization between Dutch and US GAAP is caused by the fact that goodwill is nolonger amortized under US GAAP.
Depreciation of property, plant and equipment and amortization of intangibles are asfollows:
2003 2002
Depreciation of property, plant and equipment 1,552 1,814
Amortization of software 164 174
Amortization of goodwill and other intangibles:
- Amortization of other intangible assets 151 165
- Amortization of goodwill relating to consolidated companies 283 303
- Impairment of goodwill 27 19
Write-off of in-process R&D – 12
2,177 2,487
Goodwill impairment under Dutch GAAP mainly relates to MedQuist ( 19 million).
L37 Financial income and expensesSee note 3 to the consolidated financial statements based on US GAAP.
The difference in financial income and expenses of 218 million between Dutch andUS GAAP relates to the reversal of previously recognized impairments of available-for-salesecurities (Vivendi Universal 202 million and GN Great Nordic 16 million).
L38 Income taxesSee note 4 to the consolidated financial statements based on US GAAP.
The difference in income taxes based on Dutch GAAP and income taxes based on USGAAP relates to the different accounting treatment under Dutch GAAP of amortization oftax-deductible goodwill, which is charged to income under Dutch GAAP and no longerrecognized under US GAAP.The effect for 2003 is a tax benefit of 32 million (2002: 34 million).
L39 Unconsolidated companiesSee note 5 to the consolidated financial statements based on US GAAP.
135Philips Annual Report 2003
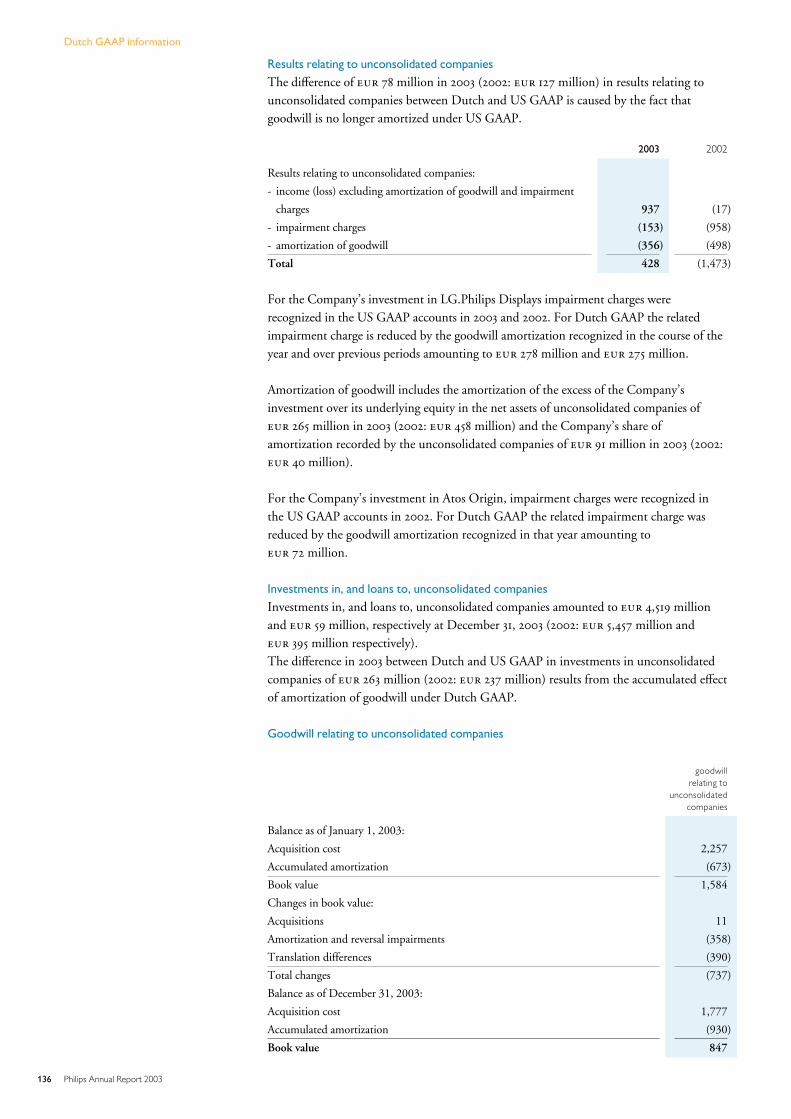
Results relating to unconsolidated companies
The difference of 78 million in 2003 (2002: 127 million) in results relating tounconsolidated companies between Dutch and US GAAP is caused by the fact thatgoodwill is no longer amortized under US GAAP.
2003 2002
Results relating to unconsolidated companies:
- income (loss) excluding amortization of goodwill and impairment
charges 937 (17)
- impairment charges (153) (958)
- amortization of goodwill (356) (498)
Total 428 (1,473)
For the Company’s investment in LG.Philips Displays impairment charges wererecognized in the US GAAP accounts in 2003 and 2002. For Dutch GAAP the relatedimpairment charge is reduced by the goodwill amortization recognized in the course of theyear and over previous periods amounting to 278 million and 275 million.
Amortization of goodwill includes the amortization of the excess of the Company’sinvestment over its underlying equity in the net assets of unconsolidated companies of 265 million in 2003 (2002: 458 million) and the Company’s share ofamortization recorded by the unconsolidated companies of 91 million in 2003 (2002: 40 million).
For the Company’s investment in Atos Origin, impairment charges were recognized inthe US GAAP accounts in 2002. For Dutch GAAP the related impairment charge wasreduced by the goodwill amortization recognized in that year amounting to 72 million.
Investments in, and loans to, unconsolidated companies
Investments in, and loans to, unconsolidated companies amounted to 4,519 millionand 59 million, respectively at December 31, 2003 (2002: 5,457 million and 395 million respectively).The difference in 2003 between Dutch and US GAAP in investments in unconsolidatedcompanies of 263 million (2002: 237 million) results from the accumulated effectof amortization of goodwill under Dutch GAAP.
Goodwill relating to unconsolidated companies
goodwillrelating to
unconsolidatedcompanies
Balance as of January 1, 2003:
Acquisition cost 2,257
Accumulated amortization (673)
Book value 1,584
Changes in book value:
Acquisitions 11
Amortization and reversal impairments (358)
Translation differences (390)
Total changes (737)
Balance as of December 31, 2003:
Acquisition cost 1,777
Accumulated amortization (930)
Book value 847
136 Philips Annual Report 2003
Dutch GAAP information
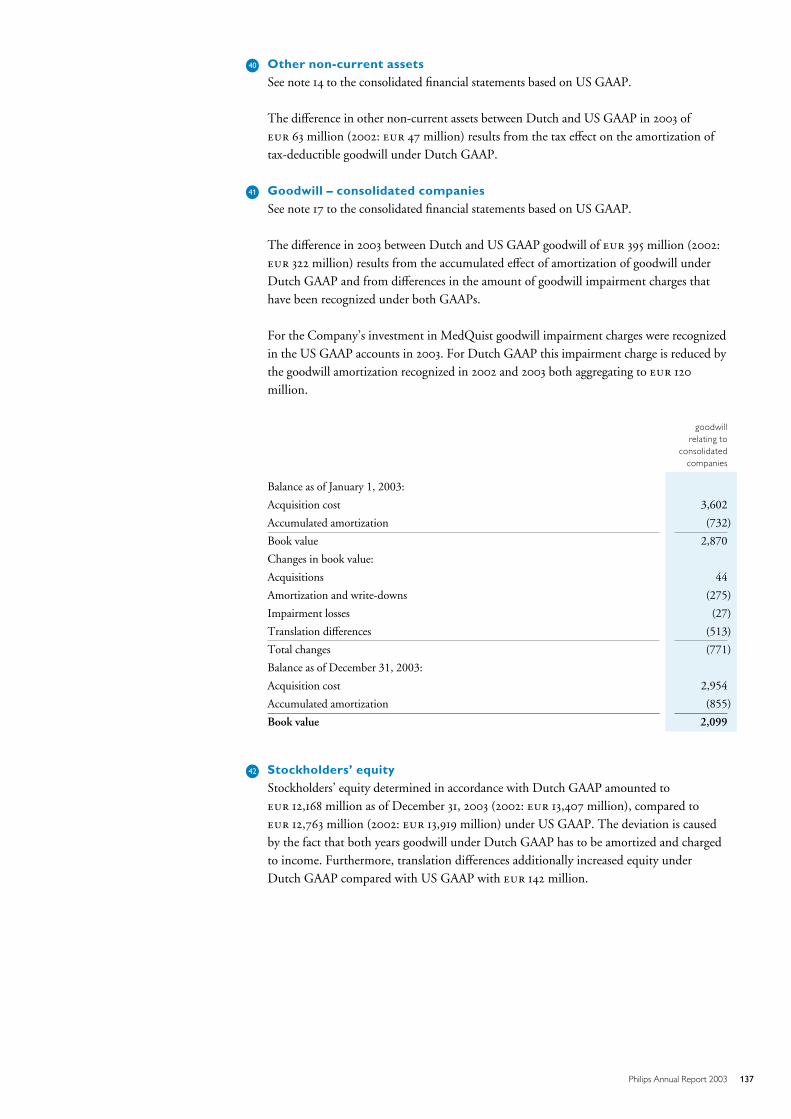
L40 Other non-current assetsSee note 14 to the consolidated financial statements based on US GAAP.
The difference in other non-current assets between Dutch and US GAAP in 2003 of 63 million (2002: 47 million) results from the tax effect on the amortization oftax-deductible goodwill under Dutch GAAP.
L41 Goodwill – consolidated companiesSee note 17 to the consolidated financial statements based on US GAAP.
The difference in 2003 between Dutch and US GAAP goodwill of 395 million (2002: 322 million) results from the accumulated effect of amortization of goodwill underDutch GAAP and from differences in the amount of goodwill impairment charges thathave been recognized under both GAAPs.
For the Company’s investment in MedQuist goodwill impairment charges were recognizedin the US GAAP accounts in 2003. For Dutch GAAP this impairment charge is reduced bythe goodwill amortization recognized in 2002 and 2003 both aggregating to 120
million.
goodwillrelating to
consolidatedcompanies
Balance as of January 1, 2003:
Acquisition cost 3,602
Accumulated amortization (732)
Book value 2,870
Changes in book value:
Acquisitions 44
Amortization and write-downs (275)
Impairment losses (27)
Translation differences (513)
Total changes (771)
Balance as of December 31, 2003:
Acquisition cost 2,954
Accumulated amortization (855)
Book value 2,099
L42 Stockholders’ equityStockholders’ equity determined in accordance with Dutch GAAP amounted to 12,168 million as of December 31, 2003 (2002: 13,407 million), compared to 12,763 million (2002: 13,919 million) under US GAAP. The deviation is causedby the fact that both years goodwill under Dutch GAAP has to be amortized and chargedto income. Furthermore, translation differences additionally increased equity underDutch GAAP compared with US GAAP with 142 million.
137Philips Annual Report 2003
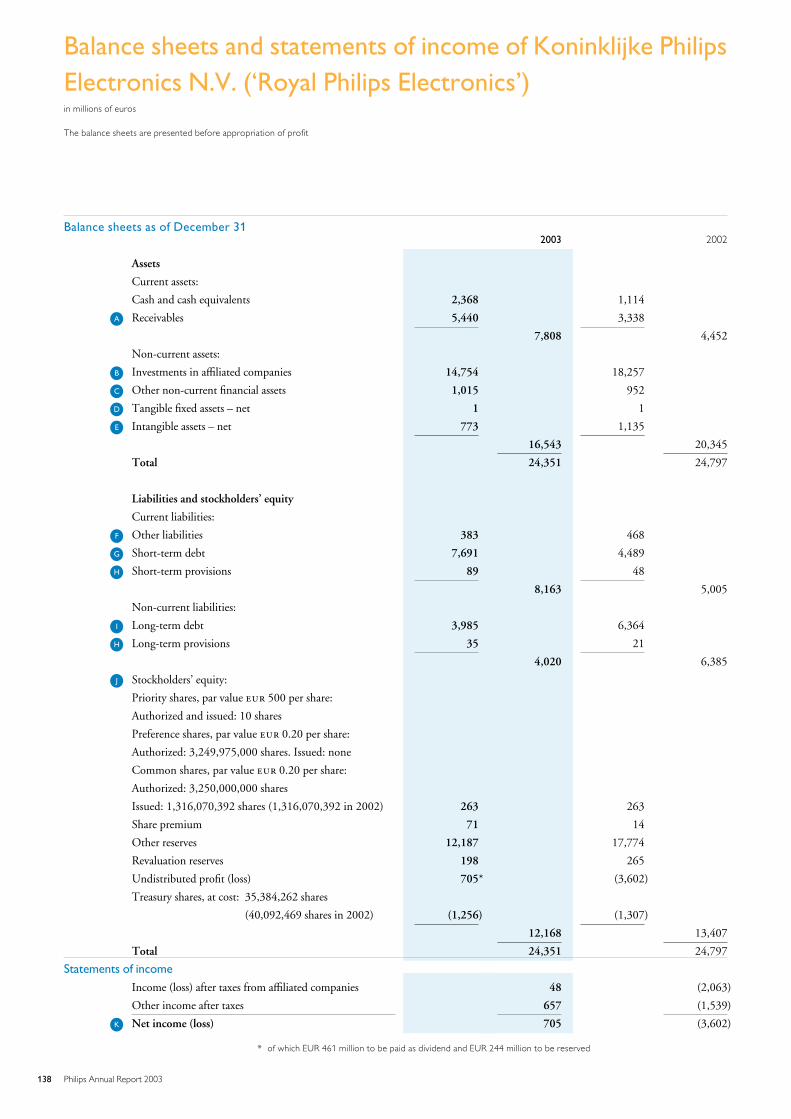
Balance sheets and statements of income of Koninklijke PhilipsElectronics N.V. (‘Royal Philips Electronics’)in millions of euros
The balance sheets are presented before appropriation of profit
Balance sheets as of December 312003 2002
Assets
Current assets:
Cash and cash equivalents 2,368 1,114
LA Receivables 5,440 3,338
7,808 4,452
Non-current assets:
LB Investments in affiliated companies 14,754 18,257
LC Other non-current financial assets 1,015 952
LD Tangible fixed assets – net 1 1
LE Intangible assets – net 773 1,135
16,543 20,345
Total 24,351 24,797
Liabilities and stockholders’ equity
Current liabilities:
LF Other liabilities 383 468
LG Short-term debt 7,691 4,489
LH Short-term provisions 89 48
8,163 5,005
Non-current liabilities:
LI Long-term debt 3,985 6,364
LH Long-term provisions 35 21
4,020 6,385
LJ Stockholders’ equity:
Priority shares, par value 500 per share:
Authorized and issued: 10 shares
Preference shares, par value 0.20 per share:
Authorized: 3,249,975,000 shares. Issued: none
Common shares, par value 0.20 per share:
Authorized: 3,250,000,000 shares
Issued: 1,316,070,392 shares (1,316,070,392 in 2002) 263 263
Share premium 71 14
Other reserves 12,187 17,774
Revaluation reserves 198 265
Undistributed profit (loss) 705* (3,602)
Treasury shares, at cost: 35,384,262 shares
(40,092,469 shares in 2002) (1,256) (1,307)
12,168 13,407
Total 24,351 24,797
Statements of income
Income (loss) after taxes from affiliated companies 48 (2,063)
Other income after taxes 657 (1,539)
LK Net income (loss) 705 (3,602)
* of which EUR 461 million to be paid as dividend and EUR 244 million to be reserved
138 Philips Annual Report 2003
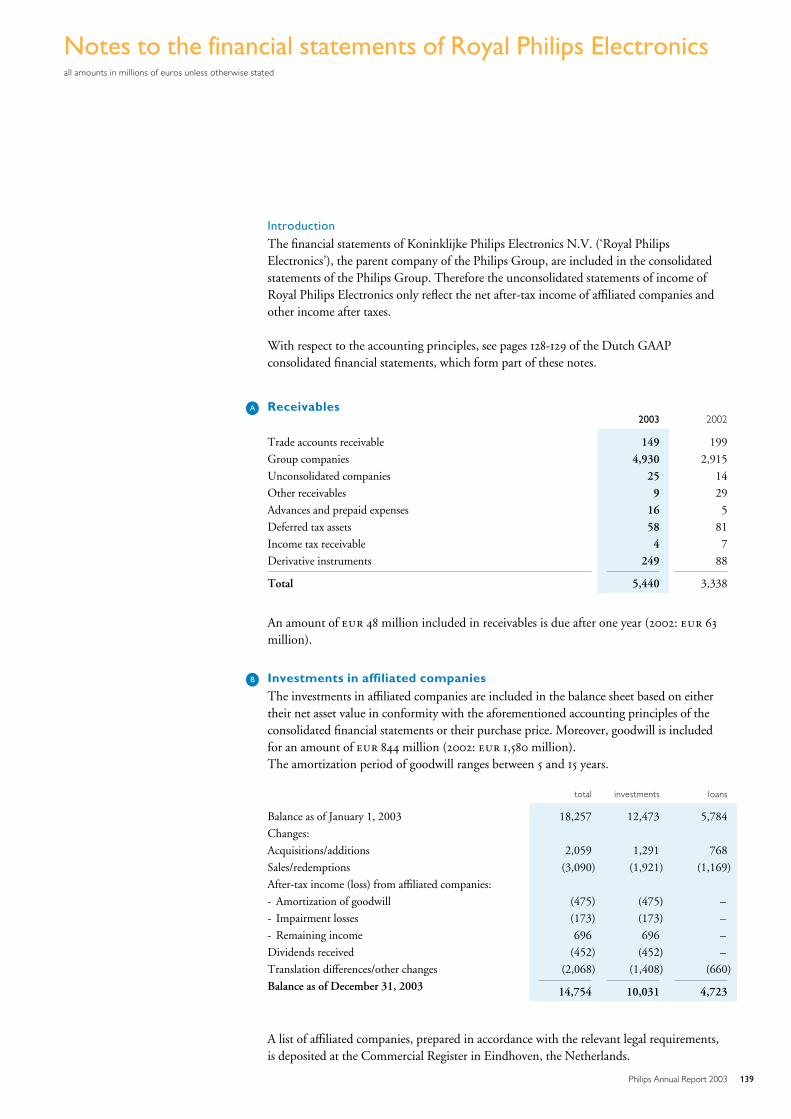
Notes to the financial statements of Royal Philips Electronicsall amounts in millions of euros unless otherwise stated
Introduction
The financial statements of Koninklijke Philips Electronics N.V. (‘Royal PhilipsElectronics’), the parent company of the Philips Group, are included in the consolidatedstatements of the Philips Group. Therefore the unconsolidated statements of income ofRoyal Philips Electronics only reflect the net after-tax income of affiliated companies andother income after taxes.
With respect to the accounting principles, see pages 128-129 of the Dutch GAAPconsolidated financial statements, which form part of these notes.
LA Receivables2003 2002
Trade accounts receivable 149 199
Group companies 4,930 2,915
Unconsolidated companies 25 14
Other receivables 9 29
Advances and prepaid expenses 16 5
Deferred tax assets 58 81
Income tax receivable 4 7
Derivative instruments 249 88
Total 5,440 3,338
An amount of 48 million included in receivables is due after one year (2002: 63
million).
LB Investments in affiliated companiesThe investments in affiliated companies are included in the balance sheet based on eithertheir net asset value in conformity with the aforementioned accounting principles of theconsolidated financial statements or their purchase price. Moreover, goodwill is includedfor an amount of 844 million (2002: 1,580 million).The amortization period of goodwill ranges between 5 and 15 years.
total investments loans
Balance as of January 1, 2003 18,257 12,473 5,784
Changes:
Acquisitions/additions 2,059 1,291 768
Sales/redemptions (3,090) (1,921) (1,169)
After-tax income (loss) from affiliated companies:
- Amortization of goodwill (475) (475) –
- Impairment losses (173) (173) –
- Remaining income 696 696 –
Dividends received (452) (452) –
Translation differences/other changes (2,068) (1,408) (660)
Balance as of December 31, 2003 14,754 10,031 4,723
A list of affiliated companies, prepared in accordance with the relevant legal requirements,is deposited at the Commercial Register in Eindhoven, the Netherlands.
139Philips Annual Report 2003
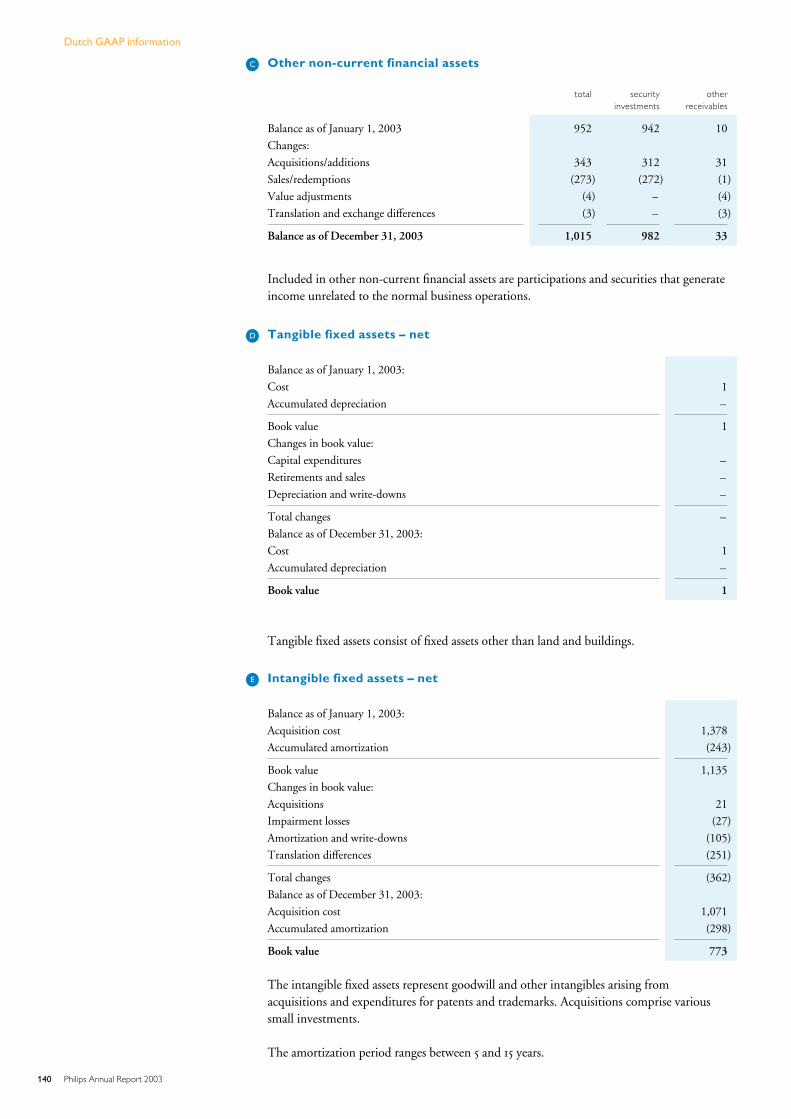
LC Other non-current financial assets
total securityinvestments
otherreceivables
Balance as of January 1, 2003 952 942 10
Changes:
Acquisitions/additions 343 312 31
Sales/redemptions (273) (272) (1)
Value adjustments (4) – (4)
Translation and exchange differences (3) – (3)
Balance as of December 31, 2003 1,015 982 33
Included in other non-current financial assets are participations and securities that generateincome unrelated to the normal business operations.
LD Tangible fixed assets – net
Balance as of January 1, 2003:
Cost 1
Accumulated depreciation –
Book value 1
Changes in book value:
Capital expenditures –
Retirements and sales –
Depreciation and write-downs –
Total changes –
Balance as of December 31, 2003:
Cost 1
Accumulated depreciation –
Book value 1
Tangible fixed assets consist of fixed assets other than land and buildings.
LE Intangible fixed assets – net
Balance as of January 1, 2003:
Acquisition cost 1,378
Accumulated amortization (243)
Book value 1,135
Changes in book value:
Acquisitions 21
Impairment losses (27)
Amortization and write-downs (105)
Translation differences (251)
Total changes (362)
Balance as of December 31, 2003:
Acquisition cost 1,071
Accumulated amortization (298)
Book value 773
The intangible fixed assets represent goodwill and other intangibles arising fromacquisitions and expenditures for patents and trademarks. Acquisitions comprise varioussmall investments.
The amortization period ranges between 5 and 15 years.
140 Philips Annual Report 2003
Dutch GAAP information
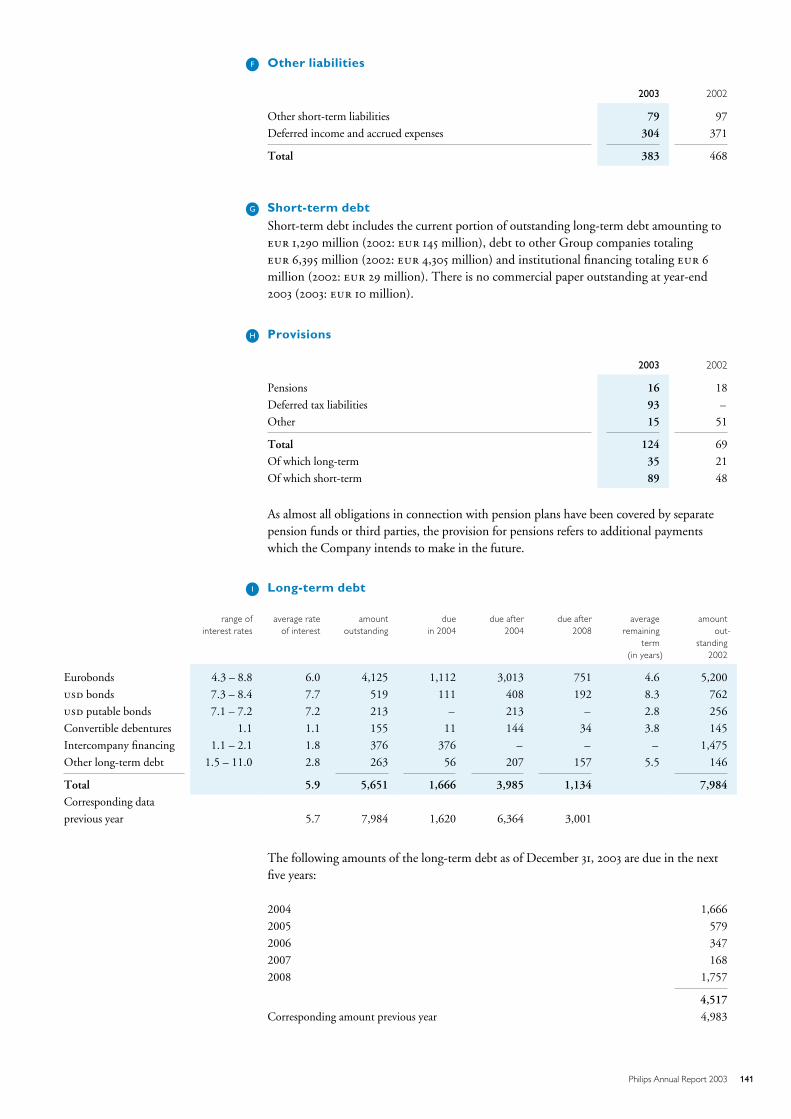
LF Other liabilities
2003 2002
Other short-term liabilities 79 97
Deferred income and accrued expenses 304 371
Total 383 468
LG Short-term debtShort-term debt includes the current portion of outstanding long-term debt amounting to 1,290 million (2002: 145 million), debt to other Group companies totaling 6,395 million (2002: 4,305 million) and institutional financing totaling 6
million (2002: 29 million). There is no commercial paper outstanding at year-end2003 (2003: 10 million).
LH Provisions
2003 2002
Pensions 16 18
Deferred tax liabilities 93 –
Other 15 51
Total 124 69
Of which long-term 35 21
Of which short-term 89 48
As almost all obligations in connection with pension plans have been covered by separatepension funds or third parties, the provision for pensions refers to additional paymentswhich the Company intends to make in the future.
LI Long-term debt
range ofinterest rates
average rateof interest
amountoutstanding
duein 2004
due after2004
due after2008
averageremaining
term(in years)
amountout-
standing2002
Eurobonds 4.3 – 8.8 6.0 4,125 1,112 3,013 751 4.6 5,200
bonds 7.3 – 8.4 7.7 519 111 408 192 8.3 762
putable bonds 7.1 – 7.2 7.2 213 – 213 – 2.8 256
Convertible debentures 1.1 1.1 155 11 144 34 3.8 145
Intercompany financing 1.1 – 2.1 1.8 376 376 – – – 1,475
Other long-term debt 1.5 – 11.0 2.8 263 56 207 157 5.5 146
Total 5.9 5,651 1,666 3,985 1,134 7,984
Corresponding data
previous year 5.7 7,984 1,620 6,364 3,001
The following amounts of the long-term debt as of December 31, 2003 are due in the nextfive years:
2004 1,666
2005 579
2006 347
2007 168
2008 1,757
4,517
Corresponding amount previous year 4,983
141Philips Annual Report 2003
Included in convertible debentures are Philips personnel debentures, for which the reader isreferred to the related note in the Group accounts.
LJ Stockholders’ equitySee the Group financial statements and related notes under Dutch GAAP.
No legal reserve for undistributed income from affiliated companies is required on the basisof the ‘collective method’, taking into account dividend distributions by affiliatedcompanies, the receipt of which can be effected without restrictions.
Priority shares
There are ten priority shares.The issuance of shares or rights to shares, cancellation of shares, amendments to theArticles of Association and the liquidation of the Company need the approval of thepriority shareholders, who also make a binding recommendation for the appointment ofmembers of the Board of Management and the Supervisory Board (see also page 158.).
Preference shares
The ‘Stichting Preferente Aandelen Philips’ has been granted the right to acquirepreference shares in the Company. Such right has not been exercised (see also page 158).
Option rights
The Company has granted stock options on shares of Royal Philips Electronics at originalexercise prices equal to market prices of the shares at the date of grant (see note 32).
Treasury shares
Royal Philips Electronics shares which have been repurchased and are held in treasury fordelivery upon exercise of options and convertible personnel debentures are accounted for instockholders’ equity. Treasury shares are recorded at cost, representing the market price onthe acquisition date.In order to reduce potential dilution effects, a total of 43,904 shares were acquired during2003 at an average market price of 16.68 per share, totaling 0.7 million, and atotal of 4,752,111 shares were delivered at an average exercise price of 10.96, totaling 52 million.A total of 35,384,262 shares were being held by Royal Philips Electronics at December 31,2003 (2002: 40,092,469 shares), acquired at an aggregate cost of 1,256 million.
Other reserves
A dividend of 0.36 per common share will be proposed to the General Meeting ofShareholders.
LK Net incomeNet income in 2003 amounted to a profit of 705 million (2002: a loss of 3,602
million).For the remuneration of past and present members of both the Board of Management andthe Supervisory Board, please refer to note 33 of the consolidated financial statements.
LL EmployeesThe number of persons employed by Royal Philips Electronics at year-end 2003
was 17 (2002: 12) and included the members of the Board of Management and mostmembers of the Group Management Committee.
142 Philips Annual Report 2003
Dutch GAAP information

LM Obligations not appearing in the balance sheetGeneral guarantees as defined in Book 2, Section 403 of the Netherlands Civil Code havebeen given by Royal Philips Electronics on behalf of several Group companies in theNetherlands. The liabilities of these companies to third parties and unconsolidatedcompanies totaled 1,130 million as of year-end 2003 (2002: 1,172 million).Guarantees totaling 788 million (2002: 621 million) have also been given onbehalf of other Group companies, and guarantees totaling 495 million (2002: 667 million) on behalf of unconsolidated companies and third parties.
February 6, 2004
The Supervisory Board
The Board of Management
143Philips Annual Report 2003

144 Philips Annual Report 2003
Other information
Auditors’ Report
Introduction
We have audited the 2003 financial statements of Koninklijke Philips Electronics N.V.appearing on pages 46 to 143. These financial statements are the responsibility of theCompany’s management. Our responsibility is to express an opinion on these financialstatements based on our audit.
Scope
We conducted our audit in accordance with auditing standards generally accepted in theNetherlands. Those standards require that we plan and perform the audit to obtainreasonable assurance about whether the financial statements are free of materialmisstatement. An audit includes examining, on a test basis, evidence supporting theamounts and disclosures in the financial statements. An audit also includes assessing theaccounting principles used and significant estimates made by management, as well asevaluating the overall financial statement presentation. We believe that our audit provides areasonable basis for our opinion.
Opinion
In our opinion, the financial statements present fairly, in all material respects, the financialposition of the Company as of December 31, 2003 and the results of its operations for theyear then ended in accordance with accounting principles generally accepted in theNetherlands and comply with the financial reporting requirements included in Part 9,Book 2 of the Netherlands Civil Code.
Eindhoven, February 6, 2004
KPMG Accountants N.V.
145Philips Annual Report 2003
Proposed dividend to shareholders of Royal Philips Electronics
A proposal will be submitted to the General Meeting of Shareholders to declare a dividendof 0.36 per common share ( 461 million).Pursuant to article 35 of the Articles of Association, and with the approval of theSupervisory Board and the Meeting of Priority Shareholders, the remainder of the incomefor the financial year 2003 has been retained by way of reserve.In 2002, a distribution was made of 0.36 per common share from the other reserves.The balance sheet presented in this report, as part of the consolidated financial statementsfor the period ended December 31, 2003, is before dividend, which is subject toshareholder approval after year-end.
Corporate governance of the Philips Group
General
Koninklijke Philips Electronics N.V. (the ‘Company’) is the parent company of the PhilipsGroup (’Philips’ or the ‘Group’). The Company, which started as a limited partnership in1891, is a public corporation governed by Dutch law since 1912, and its shares have beenlisted on the Amsterdam Stock Exchange Euronext Amsterdam since 1913. The shares havebeen traded in the United States since 1962 and have been listed on the New York StockExchange since 1987. It is envisaged that the other current listings on the Frankfurt stockexchange and Euronext Paris will be terminated in the first half of 2004.
Over the last decades the Company pursued a consistent policy to enhance and improve itscorporate governance in line with US, Dutch and international codes of best practices. Aseries of reorganizations of its corporate and Board structure resulted in enhancedtransparency of its management and oversight structure. The Company has also aimed fora fair disclosure practice in its investor relations policy and has strengthened theaccountability of its executive management and its independent supervisory directors, andhas increased the rights and powers of shareholders and the communication with investors.As a result of its shares being traded in the US capital market, the Company is required tocomply with the US Sarbanes-Oxley Act and related regulations. In Europe, the EuropeanCommission is aiming for a harmonized approach whereby listed companies shouldcomply with their home country corporate governance codes, failing which they wouldhave to indicate the reasons for non-compliance.A new Dutch code on corporate governance was published on December 9, 2003, which isexpected to be supported by a governmental decree requiring disclosure, in the annualreport, of information regarding the application of the code’s rules or an explanation ifrules, have not been applied. It is expected that such disclosure will be mandatory onlyfrom the fiscal year 2004 onwards. The Company addresses the way it intends to furtherimplement its overall corporate governance structure already in this report. TheSupervisory Board and the Board of Management, who are responsible for the corporategovernance structure of the Company, believe that in this structure the vast majority of thebest practice provisions of the code are already being applied, while anticipated(implementation) steps to further improve its corporate governance are described below.
146 Philips Annual Report 2003
Other information
Board of Management
General
The executive management of Philips is entrusted to its Board of Management under thechairmanship of the President/CEO and consists of at least three members (currently four).The members of the Board of Management have collective powers and responsibilities.They share responsibility for the management of the Company, the deployment of itsstrategy and policies, and the achievement of its objectives and results. The Board ofManagement has, for practical internal purposes, adopted a division of responsibilitiesindicating the functional and business areas monitored and reviewed by the individualmembers. According to the Company’s corporate objectives and Dutch law, the Board ofManagement is guided by the interests of the Company and its affiliated enterprises within thePhilips Group, taking into consideration the interests of the Company’s stakeholders, and isaccountable for the performance of its assignment to the Supervisory Board and the GeneralMeeting of Shareholders. The Board of Management follows its own Rules of Procedure,which govern procedures for meetings, resolutions, minutes and (vice) chairmanship.
(Term of) Appointment, individual data and conflicts of interests
Members of the Board of Management and the President/CEO are elected by the GeneralMeeting of Shareholders upon a binding recommendation from the Supervisory Board andthe Meeting of Priority Shareholders. According to the Company’s current articles ofassociation, this binding recommendation may be overruled by a resolution of the GeneralMeeting of Shareholders taken by a majority of at least 2/3 of the votes cast andrepresenting more than half of the issued share capital. From 2004 onwards, appointmentwill be for four years, renewable for consecutive terms of four years. Pending expectedamendment of Dutch legislation, if the General Meeting of Shareholders, by simplemajority, representing at least 1/3 of the Company’s share capital, does not adopt theproposed election, the Board of Management and the Supervisory Board may reconsiderthe recommended candidate. Members may be suspended by the Supervisory Board andthe General Meeting of Shareholders and dismissed by the latter.Individual data on the members of the Board of Management are published in the AnnualReport, and updated on the Company’s website. Under its own rules, the acceptance by amember of the Board of Management of a membership of the supervisory board of anotherlisted company requires the approval of the Supervisory Board. The Supervisory Board isnotified of other important positions (to be) held by a member of the Board ofManagement. No member of the Board of Management holds more than two supervisoryboard memberships of listed companies (other than (former) subsidiaries), or is a chairmanof such supervisory board. Because of the historic relationship between the Company andthe French listed company Atos Origin S.A. and Philips’ large stake therein,Mr Hommen’s supervisory board membership of Atos Origin in this respect is notconsidered to be an external membership.The Company is considering further formalizing its rules to avoid conflicts of interestsbetween the Company and members of the Board of Management. Any transaction thatcould create a conflict of interests for members of the Board of Management require theapproval of the Supervisory Board – except for transactions between the Company and itsassociated companies, general transactions with the Board member as a customer orcustomary transactions pursuant to arrangements applicable to other Philips Executives inthe Netherlands. No (potential) conflicts of interests have been reported.
Relationship between Board of Management and Supervisory Board
The Board of Management is supervised by the Supervisory Board and provides the latterwith any and all (written) information the Supervisory Board needs to fulfill its ownresponsibilities. Major decisions of the Board of Management require the approval of theSupervisory Board; these include those concerning (a) the operational and financialobjectives of the Company, (b) the strategy designed to achieve the objectives, and (c) theboundary conditions to be applied in relation to the strategy.
147Philips Annual Report 2003
Risk management approach
The Board of Management is responsible for ensuring that the Company complies with allrelevant legislation and regulations. It is responsible for proper financing of the Companyand the management of the risks that the Company is facing. It reports on and accountsfor internal risk management and control systems to the Supervisory Board and its AuditCommittee. Risk factors and the risk management approach – including the internal riskmanagement and control system and the certification thereof by the Board ofManagement, as well as the sensitivity of the Company’s results to external factors andvariables – are described in more detail on pages 39-41. Within Philips, risk managementand control forms an integral part of business management and is embedded in theperiodic business planning and review cycle. The Company’s risk management approachincludes company-wide self-assessments and evaluation and monitoring procedures withformal certification statements by Product Division management to the Board ofManagement to confirm the adequacy of the design and effectiveness of internal controlsover financial reporting.Philips also has a financial code of ethics which applies to some senior officers, includingthe CEO and CFO (the principal financial and principal accounting officer), and toemployees performing an accounting or financial function (refer to the Company’swebsite).In view of the requirements under the US Securities Exchange Act, procedures are in placeto enable the CEO and the CFO to certify the annual report on Form 20-F (whichincorporates major parts of the Annual Report). In 2003, the Board of Managementinstalled a Disclosure Committee which advises the various officers and departmentsinvolved, including the CEO and the CFO, on the timely review, publication and filing ofperiodic and current (financial) reports. Apart from the certification by the CEO and CFOunder US law, each individual member of the Supervisory Board and the Board ofManagement signs off under Dutch law the financial statements as being disclosed andsubmitted to the General Meeting of Shareholders for adoption. If one or more of theirsignatures is missing, this shall be stated, giving the reasons therefor.
Amount and composition of the remuneration of the Board of Management
The remuneration of the members of the Board of Management is determined by theSupervisory Board on the advice of the Remuneration Committee of the SupervisoryBoard, and is consistent with any policies thereon as adopted by the General Meeting ofShareholders. For the first time, the remuneration policy applicable to the Board ofManagement will be submitted for approval to the General Meeting of Shareholders ofMarch 25, 2004. A full and detailed description of the composition of the remuneration ofthe members of the Board of Management is included in the Report of the SupervisoryBoard and other parts of the Annual Report of the Company.The remuneration structure, including severance pay, is such that it promotes the interestsof the Company in the medium and long term, does not encourage members of the Boardof Management to act in their own interests and neglect the interests of the Company, anddoes not reward failing Board members upon termination of their employment. The leveland structure of remuneration shall be determined in the light of factors such as the results,the share price performance and other developments relevant to the Company.The main elements of the contract of employment of a new member of the Board ofManagement – including the amount of the (fixed) base salary, the structure and amountof the variable remuneration component, any severance plan, pension arrangements andperformance criteria – shall be made public immediately after it has become effective, butat the latest prior to the appointment. From 1 August 2003 onwards, for new members ofthe Board of Management the term of their contract of employment is set at 4 years, and incase of termination, severance payment is in principle limited to a maximum of one year’sbase salary. The Company does not grant personal loans, guarantees or the like to membersof the Board of Management, and no such (remissions of) loans and guarantees have beengranted to such members in 2003, nor are outstanding as of December 31, 2003.
148 Philips Annual Report 2003
Other information
In 2003, Philips adopted a Long-Term Incentive Plan (‘LTIP’ or the ‘Plan’) consisting of amix of restricted shares and stock options for members of the Board of Management,Group Management Committee, Philips Executives and other key employees. This Planwas approved by the General Meeting of Shareholders of 2003. Future substantial changesto that Plan will be submitted to the shareholders meeting for approval. As from 2002, theCompany grants fixed stock options that expire after ten years to members of the Board ofManagement (and other grantees). The options vest after three years and may not beexercised in the first three years after they have been granted. Options are granted at fairmarket value, based on the closing price of Euronext Amsterdam on the date of grant, andneither the exercise price nor the other conditions regarding the granted options can bemodified during the term of the options, except in certain exceptional circumstances. Thevalue of the options granted to the Board of Management and other personnel and themethod followed in calculating this value are stated in the notes to the annual accounts.Philips is one of the first firms to have introduced restricted shares as part of the LTIP. Agrantee will receive the restricted shares in three equal instalments in three successive years,provided he/she is still with the Company on the respective delivery dates. If the granteestill holds the shares after three years from the delivery date, Philips will grant 20%additional (premium) shares, provided he/she is still with Philips. This Plan is designed tostimulate long-term investment in Philips shares. To further align the interests of membersof the Board of Management and shareholders, restricted shares granted to these Boardmembers shall be retained for a period of at least five years or until at least the end ofemployment, if this period is shorter.
The actual number of long-term incentives (both stock options and restricted shares) thatare to be granted to the members of the Board of Management will be determined by theSupervisory Board and depends on the achievement of the set team targets based on theareas of responsibility monitored by the individual members of the Board of Managementand on the share performance of Philips.
The share performance of Philips is measured on the basis of the Philips Total ShareholderReturn (TSR) compared to the TSR of a peer group of 24 leading multinationalelectronics/electrical equipment companies over a three-year period; the composition ofthis group is described in the report of the Supervisory Board. The TSR performance ofPhilips and the companies in the peer group is divided into quintiles. Based on this relativeTSR position at the end of December, the Supervisory Board establishes a multiplier whichvaries from 0.8 – 1.2 and depends on the quintile in which the Philips TSR result falls.Every individual grant, the size of which depends on the positions and performance of theindividuals, will be multiplied by the multiplier.
According to Philips’ Rules of Conduct on Inside Information, members of the Board ofManagement are only allowed to trade in Philips securities (including the exercise of stockoptions) during ‘windows’ of ten business days following the publication dates of annualand quarterly results (provided the person involved has no ‘inside information’ regardingPhilips at that time). The Supervisory Board is considering developing a policy concerningownership of and transactions in securities by members of the Board of Management,other than Philips securities and the notification thereof to the Philips Compliance officer.
149Philips Annual Report 2003
Supervisory Board
General
The Supervisory Board supervises the policies of the executive management (the Board ofManagement) and the general course of affairs of the Company and its affiliates and advisesthe executive management thereon. The Supervisory Board, in the two-tier structureprescribed by Dutch law, is a separate and independent body from the Board ofManagement. That independent character is also reflected in the requirement thatmembers of the Supervisory Board can neither be a member of the Board of Managementnor an employee of the Company. The Supervisory Board considers all its members to beindependent under the applicable US standards and pursuant to the Dutch CorporateGovernance Code.
The Supervisory Board, acting in the interests of the Company and the Philips Group andtaking into account the relevant interest of the Company’s stakeholders, supervises andadvises the Board of Management in performing its management tasks and setting thedirection of the Group’s business, including (i) achievement of the Company’s objectives,(ii) corporate strategy and the risks inherent in the business activities, (iii) the structure andoperation of the internal risk management and control systems, (iv) the financial reportingprocess, and (v) compliance with legislation and regulations. Major management decisionsand the Group’s strategy are discussed with and approved by the Supervisory Board. In itsreport, the Supervisory Board describes its activities in the financial year, the number ofcommittee meetings and the main items discussed.
Rules of Procedure of the Supervisory Board
The Supervisory Board’s Rules of Procedure consolidate its own governance rules(including meetings, items to be discussed, resolutions, appointment and re-election,profile of the Supervisory Board). Its composition follows the profile, which aims for anappropriate combination of knowledge and experience among its members encompassingmarketing, manufacturing, technology, financial, economic, social and legal aspects ofinternational business and government and public administration in relation to the globaland multi-product character of the Company’s businesses. The Supervisory Board furtheraims to have available appropriate experience within Philips by having one former Philipsexecutive as a member of its Board. The Chairman of the Supervisory Board is not aformer Philips executive. The Rules of Procedure of the Supervisory Board are publishedon the Company’s Internet website. They include the charters of its committees, to whichthe plenary Supervisory Board, while retaining overall responsibility, has assigned certaintasks : the Corporate Governance and Nomination & Selection Committee, the AuditCommittee and the Remuneration Committee. A maximum of one member of eachcommittee need not be independent as defined by the Dutch Corporate Governance Code.Each committee reports, and submits its minutes for information, to the SupervisoryBoard.The Supervisory Board is assisted by the General Secretary of the Company. He sees to itthat correct procedures are followed and that the Supervisory Board acts in accordancewith its statutory obligations and its obligations under the articles of association. He assiststhe Chairman of the Supervisory Board in the actual organization of the affairs of theBoard (information, agenda, evaluation, training program) and is the contact person forinterested parties who want to make concerns known to the Supervisory Board. TheGeneral Secretary of the Company shall, either on the recommendation of the SupervisoryBoard or otherwise, be appointed by the Board of Management and may be dismissed bythe Board of Management, after the approval of the Supervisory Board has been obtained.The Supervisory Board is considering formalizing this procedure in its Rules of Procedure.
150 Philips Annual Report 2003
Other information
(Term of) Appointment, individual data and conflicts of interests
The Supervisory Board consists of at least three members (currently eight), including aChairman, Vice-Chairman and Secretary. The so-called Dutch ‘structure regime’ does notapply to the Company. Members are elected by the General Meeting of Shareholders forfixed terms of four years, upon a binding recommendation from the Supervisory Board andthe Meeting of Priority Shareholders. According to the Company’s current articles ofassociation, this binding recommendation may be overruled by a resolution of the GeneralMeeting of Shareholders taken by a majority of at least 2/3 of the votes cast andrepresenting more than half of the issued share capital. Pending expected amendment ofDutch legislation, if the General Meeting of Shareholders, by simple majority, representingat least 1/3 of the Company’s share capital, does not adopt the proposed election, the Boardof Management and the Supervisory Board may reconsider the recommended candidate.
Members may be suspended by the Supervisory Board and the General Meeting ofShareholders and dismissed by the latter. In the event of inadequate performance,structural incompatibility of interests, and in other instances in which resignation isdeemed necessary in the opinion of the Supervisory Board, the Board shall submit to theGeneral Meeting of Shareholders a proposal to dismiss the respective member of theSupervisory Board. There is no age limit applicable, and members may be re-elected twice.The expiration of the term of Supervisory Board members is put on the Company’swebsite.Individual data on the members of the Supervisory Board are published in the AnnualReport, and updated on the Company’s website.After their appointment, all members of the Supervisory Board shall follow an introductionprogramme, which covers general financial and legal affairs, financial reporting by theCompany, any specific aspects that are unique to the Company and its business activities,and the responsibilities of a Supervisory Board member. Any need for further training oreducation of members will be reviewed annually, also on the basis of an annual evaluationsurvey.
In accordance with policies adopted by the Supervisory Board, no member of theSupervisory Board shall hold as of year-end 2004 more than five supervisory boardmemberships of Netherlands-listed companies, the chairmanship of a supervisory boardcounting double.In compliance with the Dutch Corporate Governance Code, the Company is consideringformalizing its strict rules to avoid conflicts of interests between the Company andmembers of the Supervisory Board; all information about a conflict of interests situation isto be provided to the Chairman of the Supervisory Board. No conflicts of interests werereported in 2003.
151Philips Annual Report 2003
Meetings of the Supervisory Board
The Supervisory Board meets at least six times per year, including a two-day meeting onstrategy. The Supervisory Board, on the advice of its Audit Committee, also discusses, inany event at least once a year, the risks of the business, and the result of the assessment bythe Board of Management of the structure and operation of the internal risk managementand control systems, as well as any significant changes thereto. In 2003 all members of theBoard participated in five or more of the meetings of the Supervisory Board. The membersof the Board of Management attend meetings of the Supervisory Board except in mattersregarding the desired profile, composition and competence of the Supervisory Board, theBoard of Management and the Group Management Committee, as well as theremuneration and performance of individual members of the Board of Management andthe Group Management Committee and the conclusions that must be drawn on the basisthereof. In addition to these items, the Supervisory Board, being responsible for the qualityof its own performance, discusses, at least once a year on its own, without the members ofthe Board of Management being present, both its own functioning and that of theindividual members, and the conclusions that must be drawn on the basis thereof. Theabove conclusions will be published in the Report of the Supervisory Board in the AnnualReport. The Chairman and other members of the Board of Management have regularcontacts with the Chairman and other members of the Supervisory Board. The Board ofManagement is required to keep the Supervisory Board informed of all facts anddevelopments concerning the Company that the Supervisory Board may need in order tofunction as required and to properly carry out its duties, to consult it on important mattersand to submit certain important decisions to it for its prior approval. The SupervisoryBoard and its individual members each have their own responsibility for requesting fromthe Board of Management and the external auditor all information that the SupervisoryBoard needs in order to be able to carry out its duties properly as a supervisory organ. If theSupervisory Board considers it necessary, it may obtain information from officers andexternal advisers of the Company.
The Company provides the necessary means for this purpose. The Supervisory Board mayalso require that certain officers and external advisers attend its meetings.
The Chairman of the Supervisory Board
The Supervisory Board’s Chairman will see to it that: (a) the members of the SupervisoryBoard follow their induction and education or training program, (b) the members of theSupervisory Board receive in good time all information which is necessary for the properperformance of their duties, (c) there is sufficient time for consultation anddecision-making by the Supervisory Board, (d) the committees of the Supervisory Boardfunction properly, (e) the performance of the Board of Management members andSupervisory Board members will be assessed at least once a year, and (f) the SupervisoryBoard elects a Vice-Chairman.
152 Philips Annual Report 2003
Other information
Remuneration of the Supervisory Board/share ownership
The remuneration of the members of the Supervisory Board is determined by the GeneralMeeting of Shareholders of the Company. In accordance with the articles of association ofthe Company, the Supervisory Board has determined the additional remuneration for itschairman and the members of its committees. The remuneration of a Supervisory Boardmember is not dependent on the results of the Company. Further details are published inthe Annual Report.
Shares or rights to shares shall not be granted to a Supervisory Board member. Inaccordance with the Rules of Procedure, any shares in the Company held by a SupervisoryBoard member are long-term investments. The Supervisory Board is considering a policyon ownership of and transactions in non-Philips securities by members of the SupervisoryBoard. The Company shall not grant its Supervisory Board members any personal loans,guarantees or similar arrangements. No such (remissions of) loans and guarantees havebeen granted to such members in 2003, nor were outstanding as of December 31, 2003.
The Corporate Governance and Nomination & Selection Committee
The Corporate Governance and Nomination & Selection Committee consists of at leastthe Chairman, Vice-Chairman and Secretary of the Supervisory Board (ex officio). If oneand the same member of the Supervisory Board fulfils the function of Vice-Chairman andSecretary, the Board considers a minimum of two members of the Corporate Governanceand Nomination & Selection Committee sufficient. The Committee reviews the corporategovernance principles applicable to the Company at least once a year, and advises theSupervisory Board on any changes to these principles as it deems appropriate. It also (a)draws up selection criteria and appointment procedures for members of the SupervisoryBoard, the Board of Management and the Group Management Committee; (b)periodically assesses the size and composition of the Supervisory Board, the Board ofManagement and the Group Management Committee, and makes any proposals for acomposition profile of the Supervisory Board, if appropriate; (c) periodically assesses thefunctioning of individual members of the Supervisory Board, the Board of Managementand the Group Management Committee, and reports on this to the Supervisory Board.The Committee also consults with the President/CEO and the Board of Management oncandidates to fill vacancies on the Supervisory Board, the Board of Management and theGroup Management Committee, and advises, together with the Meeting of PriorityShareholders, the Supervisory Board on the candidates for appointment. It furthersupervises the policy of the Board of Management on the selection criteria andappointment procedures for Philips Executives.
The Remuneration Committee
The Remuneration Committee meets at least twice a year and is responsible for preparingdecisions of the Supervisory Board on the remuneration of members of the Board ofManagement and the Group Management Committee. It drafts the proposal for theremuneration policies to be pursued and a proposal for the remuneration of the individualmembers of the Board of Management to be adopted by the Supervisory Board. TheCommittee prepares an annual remuneration report.
153Philips Annual Report 2003
The remuneration report contains an account of the manner in which the remunerationpolicy has been implemented in the past financial year, as well as an overview of theimplementation of the remuneration policy planned by the Supervisory Board for the nextyears. The Supervisory Board aims to have available appropriate experience within theRemuneration Committee. Currently, the Chairman of the Supervisory Board is alsoChairman of the Remuneration Committee; the Board will reflect on the recommendationof the Dutch Corporate Governance Code that these functions should not be combined.No more than one member of the Remuneration Committee shall be a member of themanagement board of another listed company.
The Audit Committee
The Audit Committee meets at least four times a year, before the publication of the annualand quarterly results. At least one of the members of the Audit Committee, whichcurrently consists of three members of the Supervisory Board, is a financial expert as set outin the Dutch Corporate Governance Code. In accordance with this code, a financial experthas relevant knowledge and experience of financial administration and accounting at thecompany in question. The Supervisory Board considers the fact of being compliant withthe Dutch Corporate Governance Code, in combination with the knowledge andexperience available in the Audit Committee as well as the possibility to take advice frominternal and external experts and advisors, to be sufficient for the fulfillment of the tasksand responsibilities of the Audit Committee. Therefore, none of the members of the AuditCommittee has been determined by the Supervisory Board to be an Audit Committeefinancial expert as defined under the regulations of the US Securities and ExchangeCommission. The Supervisory Board will reconsider this decision if the composition of theAudit Committee changes. The Audit Committee shall not be chaired by the Chairman ofthe Supervisory Board or by a former Philips executive. The tasks and functions of theAudit Committee, as described in its charter which is published on the Company’s websiteas part of the Rules of Procedure of the Supervisory Board, include the dutiesrecommended in the Dutch Corporate Governance Code. More specifically, the AuditCommittee assists the Supervisory Board in fulfilling its oversight responsibilities for theintegrity of the Company’s financial statements, the financial reporting process, the systemof internal business controls and risk management, the internal and external audit process,the internal and external auditor’s qualifications, its independence and its performance aswell as the Company’s process for monitoring compliance with laws and regulations andthe General Business Principles. It reviews the Company’s annual and interim financialstatements, including non-financial information, prior to publication and advises theSupervisory Board on the adequacy and appropriateness of internal control policies andinternal audit programs and their findings.The Supervisory Board is considering a policyaccording to which complaints, if any, received by the Company in respect of the financialreporting, the internal risk management and control systems, and the audit shall berecorded and handled by the Audit Committee. Internal ‘whistleblowers’ will have theopportunity, without jeopardizing their position, to report on irregularities in theabove-mentioned matters and to report complaints about members of the Board ofManagement to the Chairman of the Supervisory Board.
In reviewing the Company’s annual and interim statements, including non-financialinformation, and advising the Supervisory Board on the adequacy and appropriateness ofinternal control policies and internal audit programs and their findings, the AuditCommittee reviews matters relating to accounting policies and compliance withaccounting standards, compliance with statutory and legal requirements and regulationsparticularly in the financial domain. Important findings and identified risks are examinedthoroughly by the Audit Committee in order to allow appropriate measures to be taken.With regard to the internal audit, the Audit Committee, in cooperation with the externalauditor, reviews the internal audit charter, audit plan, audit scope and its coverage inrelation to the scope of the external audit, staffing, independence and organizationalstructure of the internal audit function.
154 Philips Annual Report 2003
Other information
With regard to the external audit, the Committee reviews the proposed audit scope,approach and fees, the independence of the external auditor, its performance and its (re-)appointment, audit and permitted non-audit services provided by the external auditor inconformity with the Philips Policy on Auditor Independence, as well as any changes to thisPolicy. The Committee also considers the report of the external auditor and its report withrespect to the annual financial statements. According to the procedures, the AuditCommittee acts as the principal contact for the external auditor if the said auditor discoversirregularities in the content of the financial reports. It also advises on the SupervisoryBoard’s statement to shareholders in the annual accounts. The Audit Committeeperiodically discusses the Company’s policy on business controls, the General BusinessPrinciples including the deployment thereof, overviews on tax, IT, litigation,environmental exposures, financial exposures in the area of treasury, real estate, pensions,and the Company’s major areas of risk. The Company’s external auditor attends allCommittee meetings and the Committee meets separately on a quarterly basis with each ofthe President/Chief Executive Officer, the Chief Financial Officer, the internal auditor andthe external auditor.
Group Management Committee
The Group Management Committee consists of the members of the Board ofManagement, Chairmen of product divisions and certain key officers. Members other thanmembers of the Board of Management are appointed by the Supervisory Board. The taskof the Group Management Committee, the highest consultative body within Philips, is toensure that business issues and practices are shared across Philips and to implementcommon policies.
155Philips Annual Report 2003
General Meeting of Shareholders
General
A General Meeting of Shareholders is held at least once a year to discuss and resolve on thereport of the Board of Management, the annual financial statements with explanation andappendices, the report of the Supervisory Board, any proposal concerning dividends orother distributions, the appointment of members of the Board of Management andSupervisory Board, important management decisions as required by Dutch law, and anyother matters proposed by the Supervisory Board, the Board of Management, the Meetingof Priority Shareholders or shareholders in accordance with the provisions of theCompany’s articles of association. As a separate agenda item and in application of Dutchlaw, the General Meeting of Shareholders discusses the discharge of the members of theBoard of Management and the Supervisory Board from responsibility for the performanceof their respective corporate assignments in the preceding financial year.However, this discharge only covers matters that are known to the Company and theshareholders when the resolution is adopted. The General Meeting of Shareholders is heldin Eindhoven, Amsterdam, Rotterdam or The Hague no later than six months after theend of the financial year.Meetings are convened by public notice and mailed by letter to registered shareholders.Extraordinary General Meetings may be convened by the Supervisory Board or the Boardof Management if deemed necessary and must be held if the Meeting of PriorityShareholders or shareholders jointly representing at least 10% of the outstanding sharecapital make a written request to that effect to the Supervisory Board and the Board ofManagement, specifying in detail the business to be dealt with. The agenda of the GeneralMeeting of Shareholders shall contain such business as may be placed thereon by the Boardof Management, the Supervisory Board or the Meeting of Priority Shareholders, andagenda items will be explained – where necessary – in writing. In accordance with thearticles of association, requests from shareholders for items to be included on the agendawill generally be honored, subject to the Company’s rights to refuse to include therequested agenda item under Dutch law, provided that such requests are made to theBoard of Management and the Supervisory Board by shareholders representing at least 1%of the Company’s outstanding capital at least 60 days before a General Meeting ofShareholders.
Main powers of the General Meeting of Shareholders
All outstanding shares carry voting rights. The main powers of the General Meeting ofShareholders are to appoint, suspend and dismiss members of the Board of Managementand of the Supervisory Board, to adopt the financial statements, declare dividends and todischarge the Board of Management and the Supervisory Board from responsibility for theperformance of their respective duties for the previous financial year, to appoint theexternal auditor, to adopt amendments to the articles of association and proposals todissolve or liquidate the Company, to issue shares or rights to shares, to restrict or passpre-emptive rights of shareholders, to repurchase or cancel outstanding shares, and todetermine the record date for a General Meeting of Shareholders. Following commoncorporate practice in the Netherlands, the Company each year requests limitedauthorization to issue (rights to) shares, to pass pre-emptive rights and to repurchase shares.In compliance with Dutch law, decisions of the Board of Management that are sofar-reaching that they would greatly change the identity of the Company or the businessrequire the approval of the General Meeting of Shareholders. This, in principle, concernsresolutions to take or dispose of a holding in the capital of the Company, which holding isworth at least a quarter of the market value of the outstanding share capital of theCompany, plus the nominal value of the gross interest-bearing liabilities. The referenceprice shall be the closing price prior to the date on which the Board of Managementdecision is announced.
156 Philips Annual Report 2003
Other information
The Board of Management and Supervisory Board are also accountable, at the annualGeneral Meeting of Shareholders, for the policy on the additions to reserves and dividends(the level and purpose of the additions to reserves, the amount of the dividend and the typeof dividend). This subject shall be dealt with and explained as a separate agenda item at theGeneral Meeting of Shareholders. Philips aims for a sustainable and stable dividenddistribution to shareholders in the long term. A resolution to pay a dividend shall be dealtwith as a separate agenda item at the General Meeting of Shareholders.The Board of Management and the Supervisory Board provide the General Meeting ofShareholders with all requested information, unless this would be prejudicial to anoverriding interest of the Company. If the Board of Management and the SupervisoryBoard invoke an overriding interest, explicit reasons must be given. If a serious private bidis made for a business unit or a participating interest and the value of the bid exceeds acertain threshold, and such bid is made public, the Board of Management shall, at itsearliest convenience, make public its position on the bid and the reasons for this position.
Logistics of the General Meeting of Shareholders and provision of information
General
The Company may set a registration date for the exercise of the voting rights and the rightsrelating to General Meetings of Shareholders. Shareholders registered at such date areentitled to attend the meeting and to exercise the other shareholder rights (in the meetingin question) notwithstanding subsequent sale of their shares thereafter. This date will bepublished in advance of every General Meeting of Shareholders. Shareholders who areentitled to attend a General Meeting of Shareholders may be represented by proxies.All information distributed via the Shareholders’ Communication Channel (see below),and further information which is required to be published or deposited pursuant to theprovisions of company law and securities law applicable to the Company, is placed andupdated on the Philips website, or hyperlinks are established. The Board of Managementand Supervisory Board shall ensure that the General Meeting of Shareholders is informedby means of a ‘shareholders circular’ – published on the Company’s website – of facts andcircumstances relevant to the proposed resolutions.
Resolutions taken at a General Meeting of Shareholders shall be recorded by a civil lawnotary and co-signed by the chairman of the meeting; such resolutions shall also bepublished in English and Dutch on the Company’s website within one day after themeeting. A summary of the discussions during the General Meeting of Shareholders, in thelanguage of the meeting, is made available to shareholders, on request, no later than threemonths after the meeting. Shareholders shall have the opportunity to react to this summaryin the following three months, after which a final summary is adopted by the chairman ofthe meeting in question.
157Philips Annual Report 2003
Proxy voting and the Shareholders Communication Channel
Philips was one of the key companies in the establishment of the Shareholders’Communication Channel – a project of Euronext Amsterdam, banks in the Netherlandsand several major Dutch companies – to simplify contacts between a participatingcompany and shareholders that hold their shares through a Dutch bank account with aparticipating bank. The Company uses the Shareholders’ Communication Channel todistribute the Management Report booklet of its Annual Report, the Agenda for theannual General Meeting of Shareholders, and a voting instruction form. By returning thisform, shareholders grant power to an independent proxy holder who will vote according tothe instructions expressly given on the voting instruction form. The Shareholders’Communication Channel can also be used, under certain conditions, by participatingPhilips shareholders to distribute information directly related to the agenda of the GeneralMeeting of Shareholders to other participating Philips shareholders.
Meeting of Priority Shareholders and the Dr. A.F. Philips-Stichting
There are ten priority shares, which were originally held by individuals affiliated with theCompany and/or the Philips family and are currently held by a foundation called the Dr.A.F. Philips-Stichting. The self-electing Board of the Dr. A.F. Philips-Stichting consists ofthe Chairman and the Vice-Chairman and Secretary of the Supervisory Board, certainother members of the Supervisory Board, and the President of the Company. At present,the Board consists of Messrs L.C. van Wachem, W. de Kleuver, J-M. Hessels, K.A.L.M.van Miert and G.J. Kleisterlee.A Meeting of Priority Shareholders is held at least once a year, at least thirty days before theGeneral Meeting of Shareholders. Approval of the Meeting of Priority Shareholders isrequired for resolutions of the General Meeting of Shareholders regarding the issue ofordinary shares of the Company or rights to shares, the cancellation of the shares,amendments to the articles of association, and the liquidation of the Company. Acting inagreement with the Supervisory Board, the Meeting also makes binding recommendationsto the General Meeting of Shareholders for the appointment of members of the Board ofManagement and the Supervisory Board of the Company, which can be overruled by theGeneral Meeting of Shareholders approved by a majority of at least 2/3 of the votes cast andrepresenting more than half of the issued share capital.The Board of Management of the Company and the Board of the Dr. A.F. PhilipsStichting declare that they are jointly of the opinion that the Dr. A.F. Philips Stichting isindependent of the Company as required by the Listing Requirements of EuronextAmsterdam N.V.’s stock market.
Preference shares and the Stichting Preferente Aandelen Philips
As a means to protect the Company and its stakeholders against an unsolicited attempt totake over control of the Company, the General Meeting of Shareholders in 1989 adoptedamendments to the Company’s articles of association that allow the Board of Managementand the Supervisory Board to issue (rights to) preference shares to a third party. As thenanticipated and disclosed, the Stichting Preferente Aandelen Philips (’the Foundation’) wascreated, which was granted the right to acquire preference shares in the Company. Themere notification that the Foundation wishes to exercise its rights, should a third party everseem likely in the judgment of the Foundation to gain a controlling interest in theCompany, will result in the preference shares being effectively issued.The Foundation may exercise this right for as many preference shares as there are ordinaryshares in the Company outstanding at that time.
158 Philips Annual Report 2003
Other information
The object of the Foundation is to represent the interests of the Company, the enterprisesmaintained by the Company and its affiliated companies within the Philips Group, suchthat the interests of Philips, those enterprises and all parties involved with them aresafeguarded as effectively as possible, and that they are afforded maximum protectionagainst influences which, in conflict with those interests, may undermine the autonomyand identity of Philips and those enterprises, and also to do anything related to the aboveends or conducive to them. In the event of a hostile takeover attempt this arrangement willallow Philips and its Board of Management and Supervisory Board to determine itsposition in relation to the bidder and its plans, seek alternatives and defend the Company’sinterests and those of its stakeholders from a position of strength.
The members of the self-electing Board of the Foundation are Messrs J.R. Glasz,S.D. de Bree, W.E. Scherpenhuijsen Rom, L.C. van Wachem and G.J. Kleisterlee. AsChairman of the Supervisory Board and the Board of Management respectively, MessrsVan Wachem and Kleisterlee are members of the Board ex officio. Mr Kleisterlee is notentitled to vote.
The Board of Management of the Company and the Board of the Stichting PreferenteAandelen Philips declare that they are jointly of the opinion that the StichtingPreferente Aandelen Philips is independent of the Company as required by theListing Requirements of Euronext Amsterdam N.V.’s stock market.
Audit of the financial reporting and the position of the external auditor
The annual financial statements, observing Dutch law and applying US GAAP, areprepared by the Board of Management and reviewed by the Supervisory Board upon theadvice of its Audit Committee and the external auditor. Upon approval, the accounts aresigned by all members of both the Board of Management and the Supervisory Board and,together with the final opinion of the external auditor, disclosed promptly. The Board ofManagement is responsible, under supervision of the Supervisory Board, for the qualityand completeness of such publicly disclosed financial reports. The financial statements arepresented for discussion and adoption to the Annual General Meeting of Shareholders, tobe convened subsequently. Philips, under US securities regulations, separately discloses itsAnnual Report on Form 20-F, incorporating major parts of the Annual Report as preparedunder the requirements of Dutch law.
Internal controls and disclosure policies
Comprehensive internal procedures, compliance with which is supervised by theSupervisory Board, are in place for the preparation and publication of the Annual Report,the annual accounts, the quarterly figures and ad hoc financial information. As from 2003,the internal assurance process for business risk assessment has been strengthened and thereview frequency has been upgraded to a quarterly review cycle, in line with emerging bestpractices in this area.As part of these procedures, a Disclosure Committee is appointed by the Board ofManagement to oversee the Company’s disclosure activities and to assist the Board ofManagement in fulfilling its responsibilities in this respect. The Committee’s purpose is toensure that the Company implements and maintains internal procedures for the timelycollection, evaluation and disclosure, as appropriate, of information potentially subject topublic disclosure under the legal, regulatory and stock exchange requirements to which theCompany is subject. Such procedures are designed to capture information that is relevantto an assessment of the need to disclose developments and risks that pertain to theCompany’s various businesses, and their effectiveness for this purpose will be reviewedperiodically.
159Philips Annual Report 2003
Auditor information
In accordance with the procedures laid down in the Philips Policy on AuditorIndependence and as mandatorily required by Dutch law, the external auditor of theCompany is appointed by the General Meeting of Shareholders on the proposal of theSupervisory Board, after the latter has been advised by the Audit Committee and the Boardof Management. Under this policy, once every three years the Supervisory Board and theAudit Committee conduct a thorough assessment of the functioning of the externalauditor. The main conclusions of this assessment shall be communicated to the GeneralMeeting of Shareholders for the purposes of assessing the nomination for the appointmentof the external auditor. The current auditor of the Company, KPMG Accountants N.V.,was appointed by the General Meeting of Shareholders on May 2, 1995. In 2002, when theAuditor Policy was adopted, the appointment of KPMG Accountants N.V. was confirmedby the Supervisory Board for an additional three years. The General Meeting ofShareholders has to decide again at its meeting in 2005 on the appointment of the auditor.Mr. J.F.C. van Everdingen is the current partner of KPMG Accountants N.V. in charge ofthe audit duties for the Philips Group. In accordance with the rotation scheduledetermined in accordance with the Auditor Policy, he will be replaced by another partnerof KPMG Accountants N.V. no later than in 2006.The external auditor shall attend the Annual General Meeting of Shareholders.The Board of Management and the Audit Committee of the Supervisory Board shall reporton their dealings with the external auditor to the Supervisory Board on an annual basis,particularly with regard to the auditor’s independence. The Supervisory Board shall takethis into account when deciding its nomination for the appointment of an external auditor.The external auditor attends all meetings of the Audit Committee. The findings of theexternal auditor, the audit approach and the risk analysis are also discussed at thesemeetings. The external auditor attends the meeting of the Supervisory Board, at which thereport of the external auditor with respect to the audit of the annual accounts is discussed,and at which the annual accounts are approved. In its audit report on the annual accountsto the Board of Management and the Supervisory Board, the external auditor refers to thefinancial reporting risks and issues that were identified during the audit, internal controlmatters, and any other matters, as appropriate, requiring communication under theauditing standards generally accepted in the Netherlands and the USA.
Auditor policy
The Company maintains a policy of strict separation between the auditing and consultingfunctions of its auditing company, in line with US Securities and Exchange Commissionrules under which the appointed external auditor must be independent of the Companyboth in fact and appearance. The policy is laid down in the comprehensive policy onauditor independence published on the Company’s website.
160 Philips Annual Report 2003
Other information
Investor Relations
General
The Company is continuously striving to improve relations with its shareholders. Inaddition to communication with its shareholders at the Annual General Meeting ofShareholders, Philips elaborates its financial results during (public) conference calls, whichare broadly accessible. It acts within its fair disclosure policies which are designed toprovide all shareholders and other parties in the financial markets with equal andsimultaneous information about matters that may influence the share price, publishesinformative annual and quarterly reports and press releases, and informs investors via itsextensive website. Furthermore, each year the Company organizes major Philips ProductDivisional analysts days and participates in around ten broker conferences, announced inadvance on the Company’s website and by means of press releases. Shareholders can followsome of these meetings and presentations in real time, by means of webcasting or telephonelines. It is Philips’ policy to post presentations to analysts and shareholders on theCompany’s website. These meetings and presentations will not take place shortly before thepublication of annual and quarterly financial information.The Company shall not, in advance, assess, comment upon or correct, other than factually,any analyst’s reports and valuations. No fee(s) will be paid by the Company to parties forthe carrying-out of research for analysts’ reports or for the production or publication ofanalysts’ reports, with the exception of credit-rating agencies.
Major shareholders and other information for shareholders
As of December 31, 2003, no person is known to the Company to be the owner of morethan 5% of its Common Shares. The Common Shares are held by shareholders worldwidein bearer and registered form. Outside the United States, shares are held primarily in bearerform. As of December 31, 2003, approximately 88% of the Common Shares were held inbearer form. In the United States shares are held primarily in the form of registered sharesof New York Registry (Shares of New York Registry) for which Citibank, N.A., 111 WallStreet, New York, New York 10043 is the transfer agent and registrar. As of December 31,2003, approximately 12% of the total number of outstanding Common Shares wererepresented by Shares of New York Registry issued in the name of approximately1,500 holders of record, including Cede & Co, acting as nominee for the Depository TrustCompany holding the shares (indirectly) for individual investors as beneficiaries.
Only bearer shares are traded on the stock market of Euronext Amsterdam and otherEuropean stock exchanges. Only shares of New York Registry are traded on the New YorkStock Exchange. Bearer shares and registered shares may be exchanged for each other. Sincecertain shares are held by brokers and other nominees, these numbers may not berepresentative of the actual number of United States beneficial holders or the number ofShares of New York Registry beneficially held by US residents.
Corporate seat and head office
The statutory seat of the Company is Eindhoven, the Netherlands, and the statutory list ofall subsidiaries and affiliated companies, prepared in accordance with the relevant legalrequirements (The Netherlands Civil Code, Book 2, Articles 379 and 414), forms part ofthe notes to the consolidated financial statements and is deposited at the office of theCommercial Register in Eindhoven, the Netherlands (file no. 1910).The executive offices of the Company are located at the Breitner Center, Amstelplein 2,1096 BC Amsterdam, The Netherlands, telephone 31 (0)20 59 77 777.
161Philips Annual Report 2003
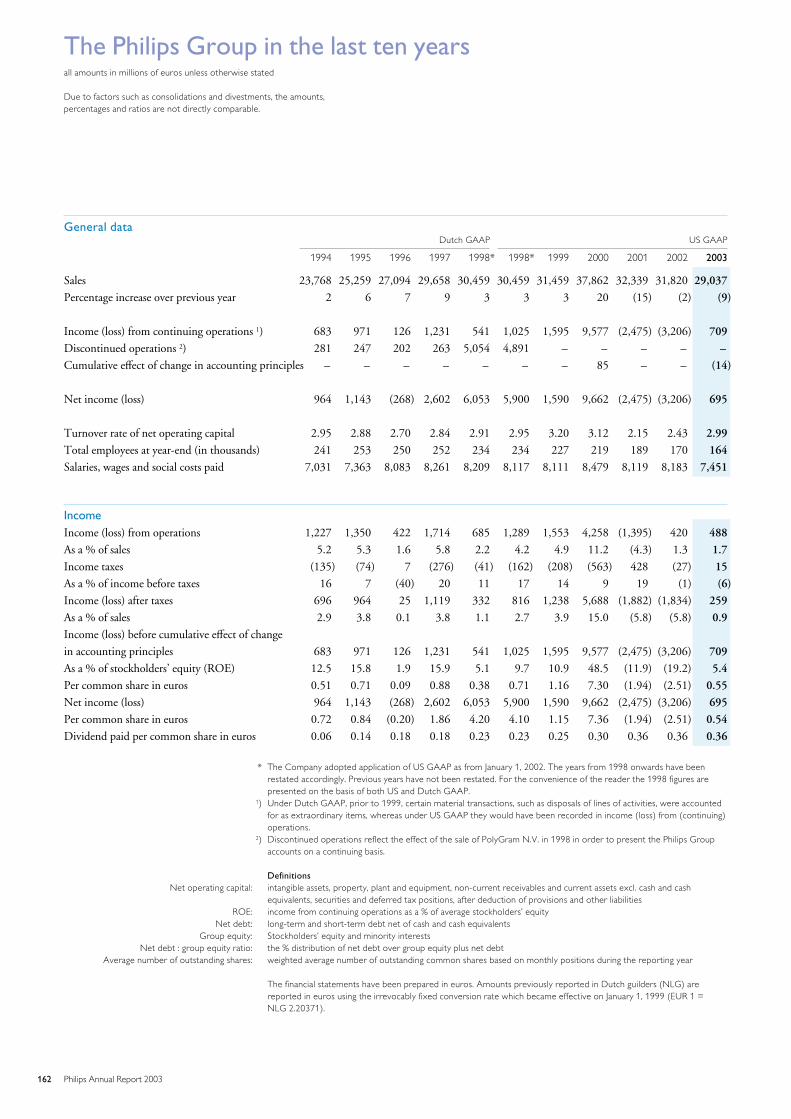
The Philips Group in the last ten yearsall amounts in millions of euros unless otherwise stated
Due to factors such as consolidations and divestments, the amounts,percentages and ratios are not directly comparable.
General dataDutch GAAP US GAAP
1994 1995 1996 1997 1998* 1998* 1999 2000 2001 2002 2003
Sales 23,768 25,259 27,094 29,658 30,459 30,459 31,459 37,862 32,339 31,820 29,037
Percentage increase over previous year 2 6 7 9 3 3 3 20 (15) (2) (9)
Income (loss) from continuing operations 1) 683 971 126 1,231 541 1,025 1,595 9,577 (2,475) (3,206) 709
Discontinued operations 2) 281 247 202 263 5,054 4,891 – – – – –
Cumulative effect of change in accounting principles – – – – – – – 85 – – (14)
Net income (loss) 964 1,143 (268) 2,602 6,053 5,900 1,590 9,662 (2,475) (3,206) 695
Turnover rate of net operating capital 2.95 2.88 2.70 2.84 2.91 2.95 3.20 3.12 2.15 2.43 2.99
Total employees at year-end (in thousands) 241 253 250 252 234 234 227 219 189 170 164
Salaries, wages and social costs paid 7,031 7,363 8,083 8,261 8,209 8,117 8,111 8,479 8,119 8,183 7,451
IncomeIncome (loss) from operations 1,227 1,350 422 1,714 685 1,289 1,553 4,258 (1,395) 420 488
As a % of sales 5.2 5.3 1.6 5.8 2.2 4.2 4.9 11.2 (4.3) 1.3 1.7
Income taxes (135) (74) 7 (276) (41) (162) (208) (563) 428 (27) 15
As a % of income before taxes 16 7 (40) 20 11 17 14 9 19 (1) (6)
Income (loss) after taxes 696 964 25 1,119 332 816 1,238 5,688 (1,882) (1,834) 259
As a % of sales 2.9 3.8 0.1 3.8 1.1 2.7 3.9 15.0 (5.8) (5.8) 0.9
Income (loss) before cumulative effect of change
in accounting principles 683 971 126 1,231 541 1,025 1,595 9,577 (2,475) (3,206) 709
As a % of stockholders’ equity (ROE) 12.5 15.8 1.9 15.9 5.1 9.7 10.9 48.5 (11.9) (19.2) 5.4
Per common share in euros 0.51 0.71 0.09 0.88 0.38 0.71 1.16 7.30 (1.94) (2.51) 0.55
Net income (loss) 964 1,143 (268) 2,602 6,053 5,900 1,590 9,662 (2,475) (3,206) 695
Per common share in euros 0.72 0.84 (0.20) 1.86 4.20 4.10 1.15 7.36 (1.94) (2.51) 0.54
Dividend paid per common share in euros 0.06 0.14 0.18 0.18 0.23 0.23 0.25 0.30 0.36 0.36 0.36
* The Company adopted application of US GAAP as from January 1, 2002. The years from 1998 onwards have beenrestated accordingly. Previous years have not been restated. For the convenience of the reader the 1998 figures arepresented on the basis of both US and Dutch GAAP.
1) Under Dutch GAAP, prior to 1999, certain material transactions, such as disposals of lines of activities, were accountedfor as extraordinary items, whereas under US GAAP they would have been recorded in income (loss) from (continuing)operations.
2) Discontinued operations reflect the effect of the sale of PolyGram N.V. in 1998 in order to present the Philips Groupaccounts on a continuing basis.
DefinitionsNet operating capital: intangible assets, property, plant and equipment, non-current receivables and current assets excl. cash and cash
equivalents, securities and deferred tax positions, after deduction of provisions and other liabilitiesROE: income from continuing operations as a % of average stockholders’ equity
Net debt: long-term and short-term debt net of cash and cash equivalentsGroup equity: Stockholders’ equity and minority interests
Net debt : group equity ratio: the % distribution of net debt over group equity plus net debtAverage number of outstanding shares: weighted average number of outstanding common shares based on monthly positions during the reporting year
The financial statements have been prepared in euros. Amounts previously reported in Dutch guilders (NLG) arereported in euros using the irrevocably fixed conversion rate which became effective on January 1, 1999 (EUR 1 =NLG 2.20371).
162 Philips Annual Report 2003
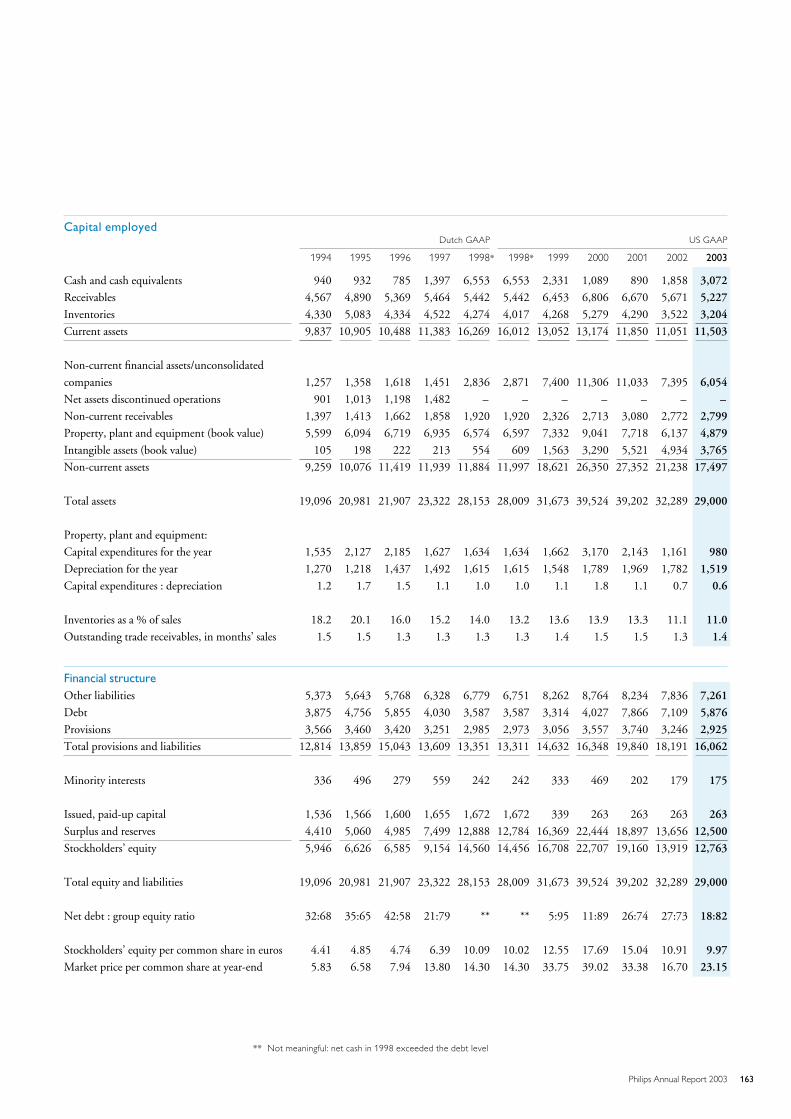
Capital employedDutch GAAP US GAAP
1994 1995 1996 1997 1998* 1998* 1999 2000 2001 2002 2003
Cash and cash equivalents 940 932 785 1,397 6,553 6,553 2,331 1,089 890 1,858 3,072
Receivables 4,567 4,890 5,369 5,464 5,442 5,442 6,453 6,806 6,670 5,671 5,227
Inventories 4,330 5,083 4,334 4,522 4,274 4,017 4,268 5,279 4,290 3,522 3,204
Current assets 9,837 10,905 10,488 11,383 16,269 16,012 13,052 13,174 11,850 11,051 11,503
Non-current financial assets/unconsolidated
companies 1,257 1,358 1,618 1,451 2,836 2,871 7,400 11,306 11,033 7,395 6,054
Net assets discontinued operations 901 1,013 1,198 1,482 – – – – – – –
Non-current receivables 1,397 1,413 1,662 1,858 1,920 1,920 2,326 2,713 3,080 2,772 2,799
Property, plant and equipment (book value) 5,599 6,094 6,719 6,935 6,574 6,597 7,332 9,041 7,718 6,137 4,879
Intangible assets (book value) 105 198 222 213 554 609 1,563 3,290 5,521 4,934 3,765
Non-current assets 9,259 10,076 11,419 11,939 11,884 11,997 18,621 26,350 27,352 21,238 17,497
Total assets 19,096 20,981 21,907 23,322 28,153 28,009 31,673 39,524 39,202 32,289 29,000
Property, plant and equipment:
Capital expenditures for the year 1,535 2,127 2,185 1,627 1,634 1,634 1,662 3,170 2,143 1,161 980
Depreciation for the year 1,270 1,218 1,437 1,492 1,615 1,615 1,548 1,789 1,969 1,782 1,519
Capital expenditures : depreciation 1.2 1.7 1.5 1.1 1.0 1.0 1.1 1.8 1.1 0.7 0.6
Inventories as a % of sales 18.2 20.1 16.0 15.2 14.0 13.2 13.6 13.9 13.3 11.1 11.0
Outstanding trade receivables, in months’ sales 1.5 1.5 1.3 1.3 1.3 1.3 1.4 1.5 1.5 1.3 1.4
Financial structureOther liabilities 5,373 5,643 5,768 6,328 6,779 6,751 8,262 8,764 8,234 7,836 7,261
Debt 3,875 4,756 5,855 4,030 3,587 3,587 3,314 4,027 7,866 7,109 5,876
Provisions 3,566 3,460 3,420 3,251 2,985 2,973 3,056 3,557 3,740 3,246 2,925
Total provisions and liabilities 12,814 13,859 15,043 13,609 13,351 13,311 14,632 16,348 19,840 18,191 16,062
Minority interests 336 496 279 559 242 242 333 469 202 179 175
Issued, paid-up capital 1,536 1,566 1,600 1,655 1,672 1,672 339 263 263 263 263
Surplus and reserves 4,410 5,060 4,985 7,499 12,888 12,784 16,369 22,444 18,897 13,656 12,500
Stockholders’ equity 5,946 6,626 6,585 9,154 14,560 14,456 16,708 22,707 19,160 13,919 12,763
Total equity and liabilities 19,096 20,981 21,907 23,322 28,153 28,009 31,673 39,524 39,202 32,289 29,000
Net debt : group equity ratio 32:68 35:65 42:58 21:79 ** ** 5:95 11:89 26:74 27:73 18:82
Stockholders’ equity per common share in euros 4.41 4.85 4.74 6.39 10.09 10.02 12.55 17.69 15.04 10.91 9.97
Market price per common share at year-end 5.83 6.58 7.94 13.80 14.30 14.30 33.75 39.02 33.38 16.70 23.15
** Not meaningful: net cash in 1998 exceeded the debt level
163Philips Annual Report 2003
Shareholder services
In the USAHolders of shares of New York Registry and other interested parties in theUSA can obtain, free of charge, copies of the Annual Report 2003 from theTransfer and Register Agent:Citibank Shareholder ServicesP.O. Box 43077Providence, Rhode Island 02940-3077Telephone: 1-877-CITI-ADR (toll-free)Fax: 1-201-324-3284E-mail: [email protected] address: www.citibank.com/adr
Communications concerning share transfers, lost certificates, dividends andchange of address should be directed to Citibank.
The Annual Report on Form 20-F is filed electronically with the United StatesSecurities and Exchange Commission.
Outside the USANon-US shareholders and other non-US interested parties can obtain copiesof the Annual Report 2003 free of charge from:Royal Philips ElectronicsAnnual Report OfficeP.O. Box 2185600 MD EindhovenThe NetherlandsFax: 31-40-2786436
Communications concerning share transfers, lost certificates, dividends andchange of address should be directed to:ABN AMROAfdeling Issuing InstitutionsKemelstede 24817 ST BredaThe NetherlandsTelephone: 31-76-5799482Fax: 31-76-5799359
Information sourcesInvestors and financial analysts may contact:Investor RelationsBreitner Center, HBT 11-8P.O. Box 779001070 MX AmsterdamThe Netherlands
Tel: 31-20-59 77221Fax: 31-20-59 77220
E-mail: [email protected]
Senior Vice-President – Investor Relations,Tel: 31-20-59 77222
Manager – Investor Relations,Tel: 31-20-59 77447
Printed in the NetherlandsThis Annual Report (Financial Statements and Analysis) is printed on Condatwoodfree coated paper manufactured using ECF (Elementary Chlorine-Free) pulp.
164 Philips Annual Report 2003