Embed Size (px)
Citation preview
Financial Statements
200
2800
3400
3900
4800
6800
7200
Financial Analysis and
Financial Analysis and Financial Statements
www.petrobras.com
Financial Analysis and Financial Statements
FINANCIAL ANALYSIS AND FINANCIAL STATEMENTS 2009 | PETROBRAS
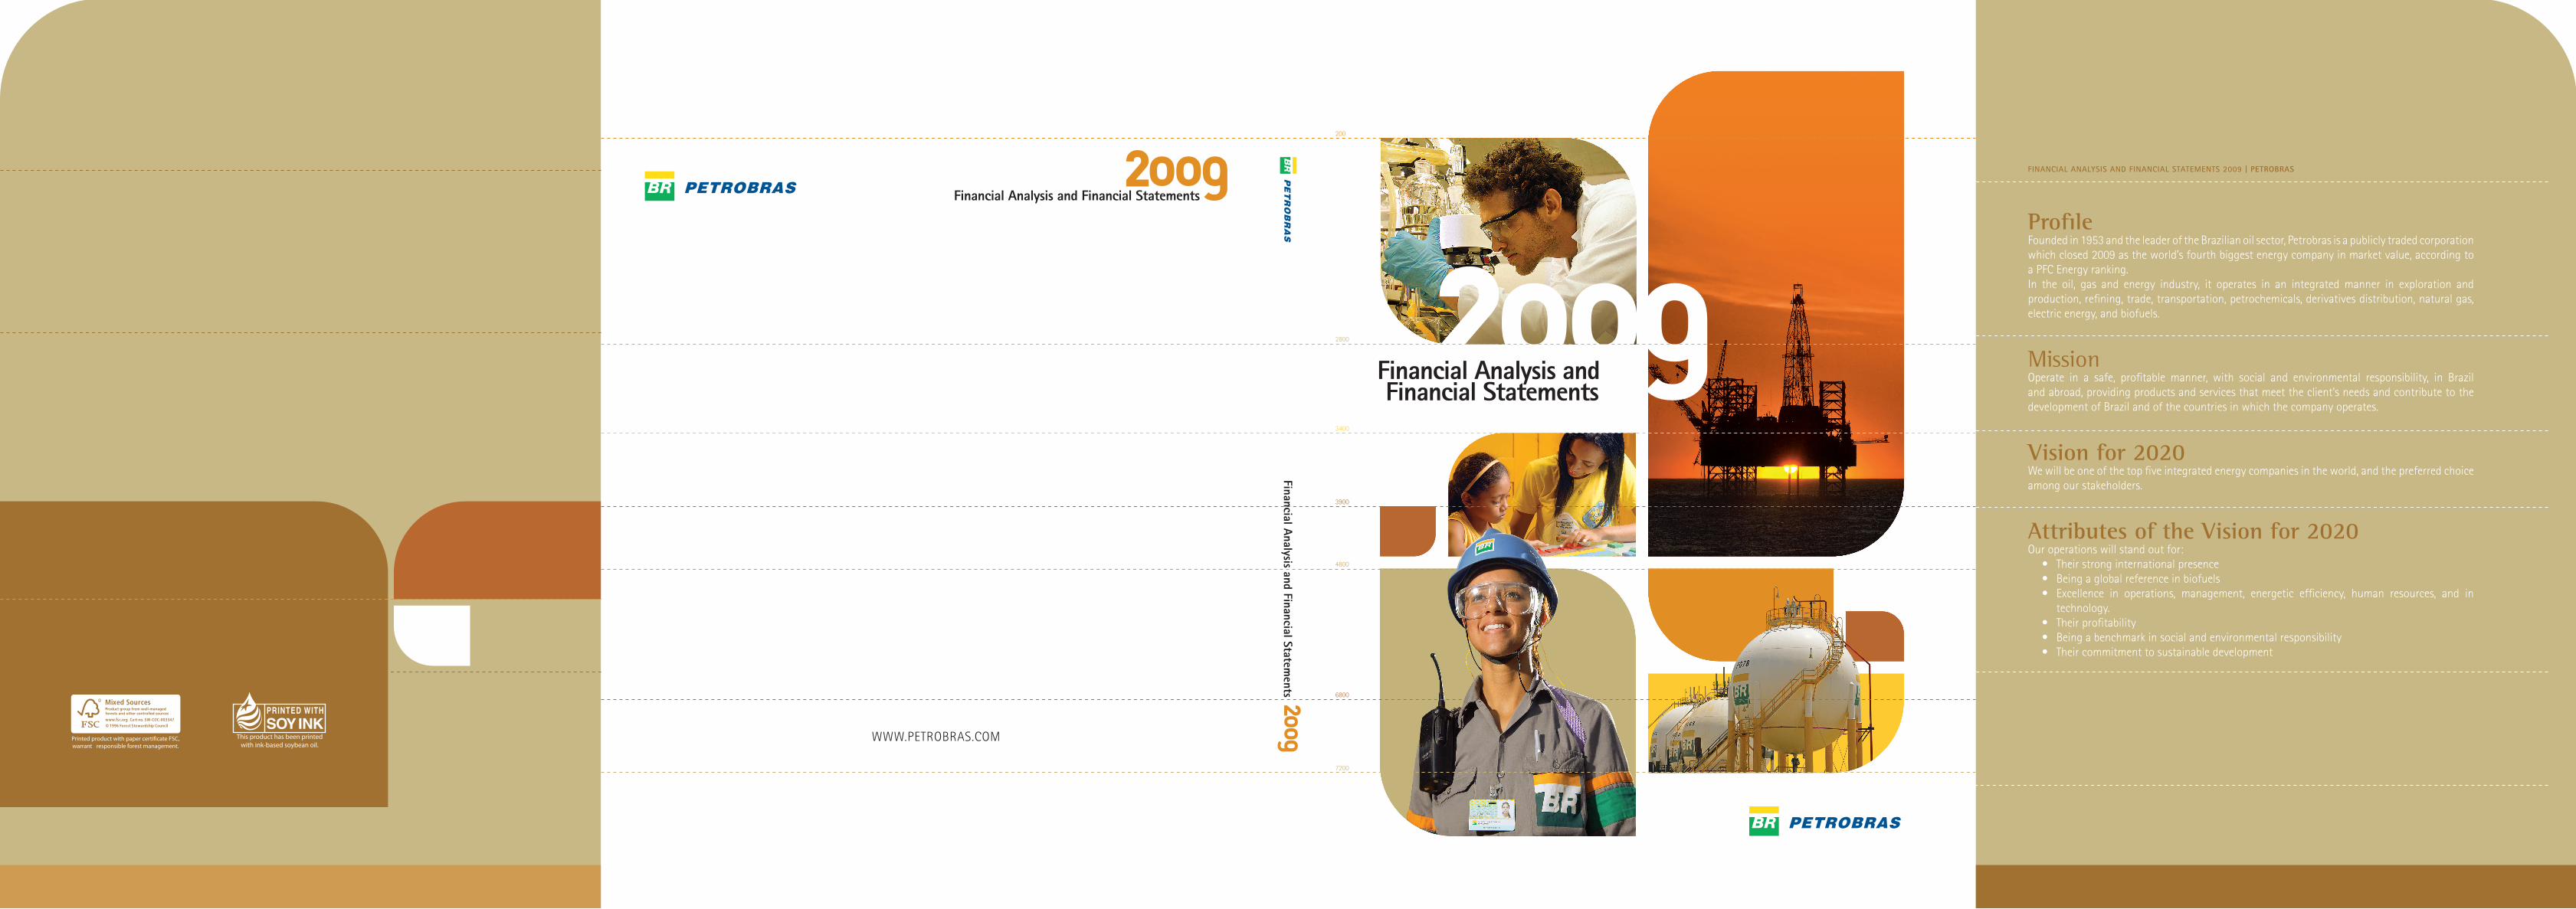
ProfileFounded in 1953 and the leader of the brazilian oil sector, petrobras is a publicly traded corporation which closed 2009 as the world’s fourth biggest energy company in market value, according to a pFc energy ranking. In the oil, gas and energy industry, it operates in an integrated manner in exploration and production, refining, trade, transportation, petrochemicals, derivatives distribution, natural gas, electric energy, and biofuels.
Missionoperate in a safe, profitable manner, with social and environmental responsibility, in brazil and abroad, providing products and services that meet the client’s needs and contribute to the development of brazil and of the countries in which the company operates.
Vision for 2020we will be one of the top five integrated energy companies in the world, and the preferred choice among our stakeholders.
Attributes of the Vision for 2020our operations will stand out for:
• Theirstronginternationalpresence• Beingaglobalreferenceinbiofuels• Excellence in operations, management, energetic efficiency, human resources, and in
technology.• Theirprofitability• Beingabenchmarkinsocialandenvironmentalresponsibility• Theircommitmenttosustainabledevelopment

NET INcOmE(r$ million)
2005
2006
2007
2008
2009
23,725
25,919
21,512
32,988
28,982
DOmESTIc mARkET
DIesel
GasolIne
Fuel oIl
naFta
Glp
QaV
natural Gas
ExPORTS
oIl
oIl proDucts anD other
39,944
15,143
3,543
7,386
5,660
5,237
4,349
11,101
10,648
44,571
17,993
3,823
8,290
5,744
5,358
5,076
14,323
10,299
47,001
17,550
4,146
8,658
5,890
5,678
5,454
16,134
12,018
55,708
19,593
5,162
8,886
6,567
8,050
9,297
23,886
11,989
51,107
18,866
3,464
5,926
6,422
5,367
6,830
18,174
9,084
HIgHlIgHTS OF NET OPERATINg REvENuES 2005 2006 2007 2008 2009OF mAIN PRODucTS (R$ mIllION)
Highlights
PROvED RESERvES(Billion BOE)
11.8 14.9
11.5 15.1
11.7 15.0
11.2 15.1
12.1 14.9
sec spe
TOTAl PRODucTION(Thousand BPD)
1,847 370 2,217
1,923 374 2,297
1,920 381 2,301
1,980 420 2,400
2,113 413 2,526
oil & nGl natural Gas
2005
2006
2007
2008
2009
INvESTmENTS(r$ million)
2005
13,934 3,286 3,153 5,337 25,710
2006
15,314 4,181 7,161 7,030 33,686
2007
18,418 9,632 6,574 10,661 45,285
2008
24,662 10,111 6,133 12,443 53,349
2009
30,819 16,508 6,833 16,597 70,757
exploration & production supply International others
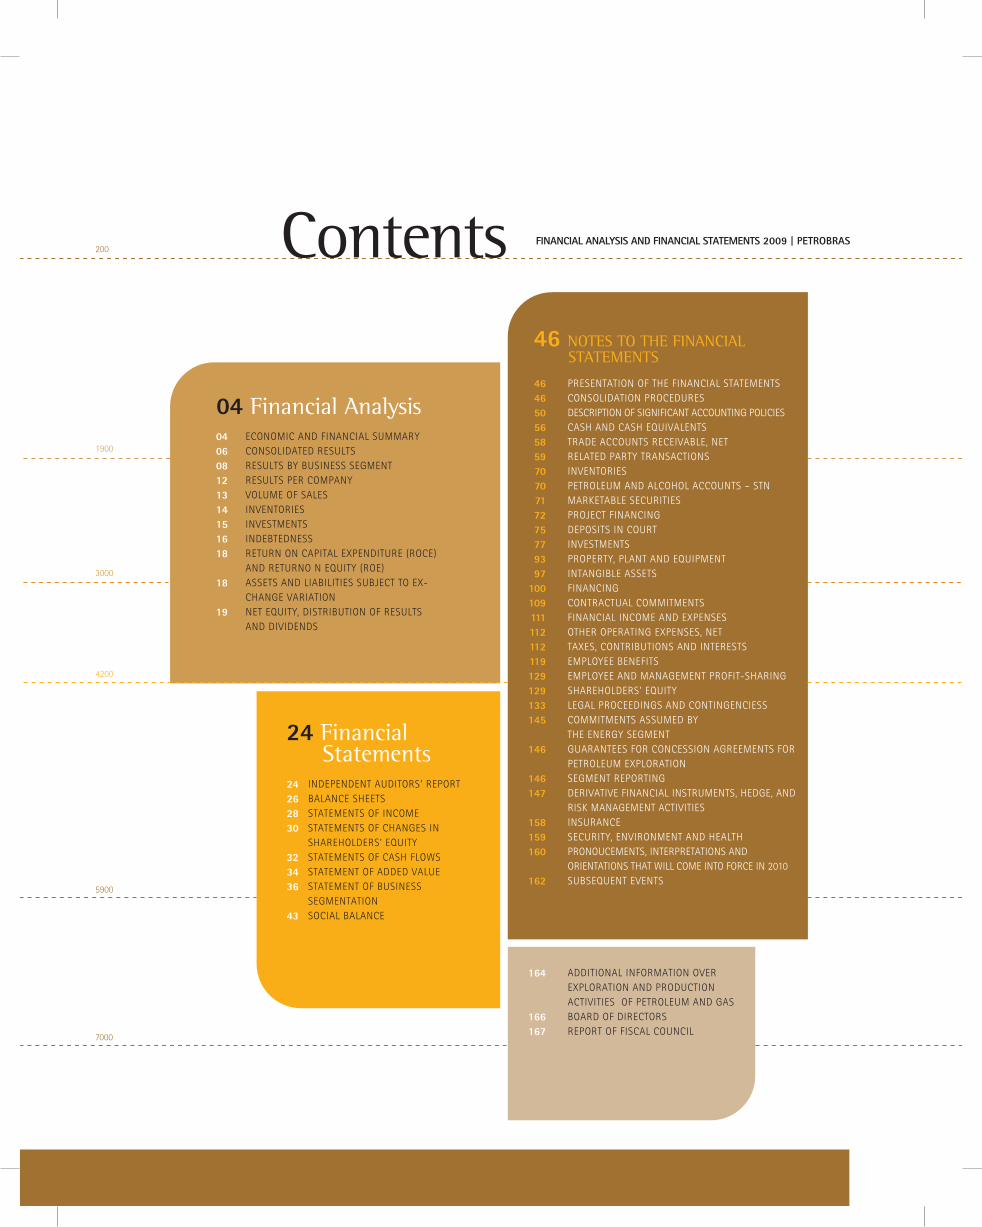
04 Financial AnalysisEconomic and Financial SummaryconSolidatEd rESultSrESultS by buSinESS SEgmEntrESultS pEr companyVolumE oF SalESinVEntoriESinVEStmEntSindEbtEdnESSrEturn on capital ExpEnditurE (rocE) and rEturno n Equity (roE)aSSEtS and liabilitiES SubjEct to Ex-changE VariationnEt Equity, diStribution oF rESultS and diVidEndS
0406 08 121314151618
18
19
46 Notes to the FiNANciAl stAtemeNts
prESEntation oF thE Financial StatEmEntSconSolidation procEdurESdEScription oF SigniFicant accounting policiEScaSh and caSh EquiValEntS tradE accountS rEcEiVablE, nEtrElatEd party tranSactionSinVEntoriESpEtrolEum and alcohol accountS – StnmarkEtablE SEcuritiESprojEct FinancingdEpoSitS in courtinVEStmEntSpropErty, plant and EquipmEntintangiblE aSSEtSFinancing contractual commitmEntSFinancial incomE and ExpEnSESothEr opErating ExpEnSES, nEttaxES, contributionS and intErEStSEmployEE bEnEFitSEmployEE and managEmEnt proFit-SharingSharEholdErS’ EquitylEgal procEEdingS and contingEnciESScommitmEntS aSSumEd by thE EnErgy SEgmEntguarantEES For concESSion agrEEmEntS For pEtrolEum ExplorationSEgmEnt rEporting dEriVatiVE Financial inStrumEntS, hEdgE, and riSk managEmEnt actiVitiESinSurancESEcurity, EnVironmEnt and hEalth pronoucEmEntS, intErprEtationS and oriEntationS that Will comE into ForcE in 2010SubSEquEnt EVEntS
additional inFormation oVEr Exploration and production actiVitiES oF pEtrolEum and gaSboard oF dirEctorSrEport oF FiScal council
4646505658597070717275779397
100109111112112119129129133145
146
146147
158159160
162
164
166167
24 Financial statements
indEpEndEnt auditorS’ rEportbalancE ShEEtSStatEmEntS oF incomEStatEmEntS oF changES in SharEholdErS’ EquityStatEmEntS oF caSh FloWSStatEmEnt oF addEd ValuEStatEmEnt oF buSinESS SEgmEntationSocial balancE
24262830
323436
43
1900
contents
3000
200
4200
7000
5900
Financial analysis and Financial statements 2009 | PetROBRas
6000
5200
2500
Financial Analysis
Financial analysis And Financial statements 2009 | PetROBRas
04
Financial analysis
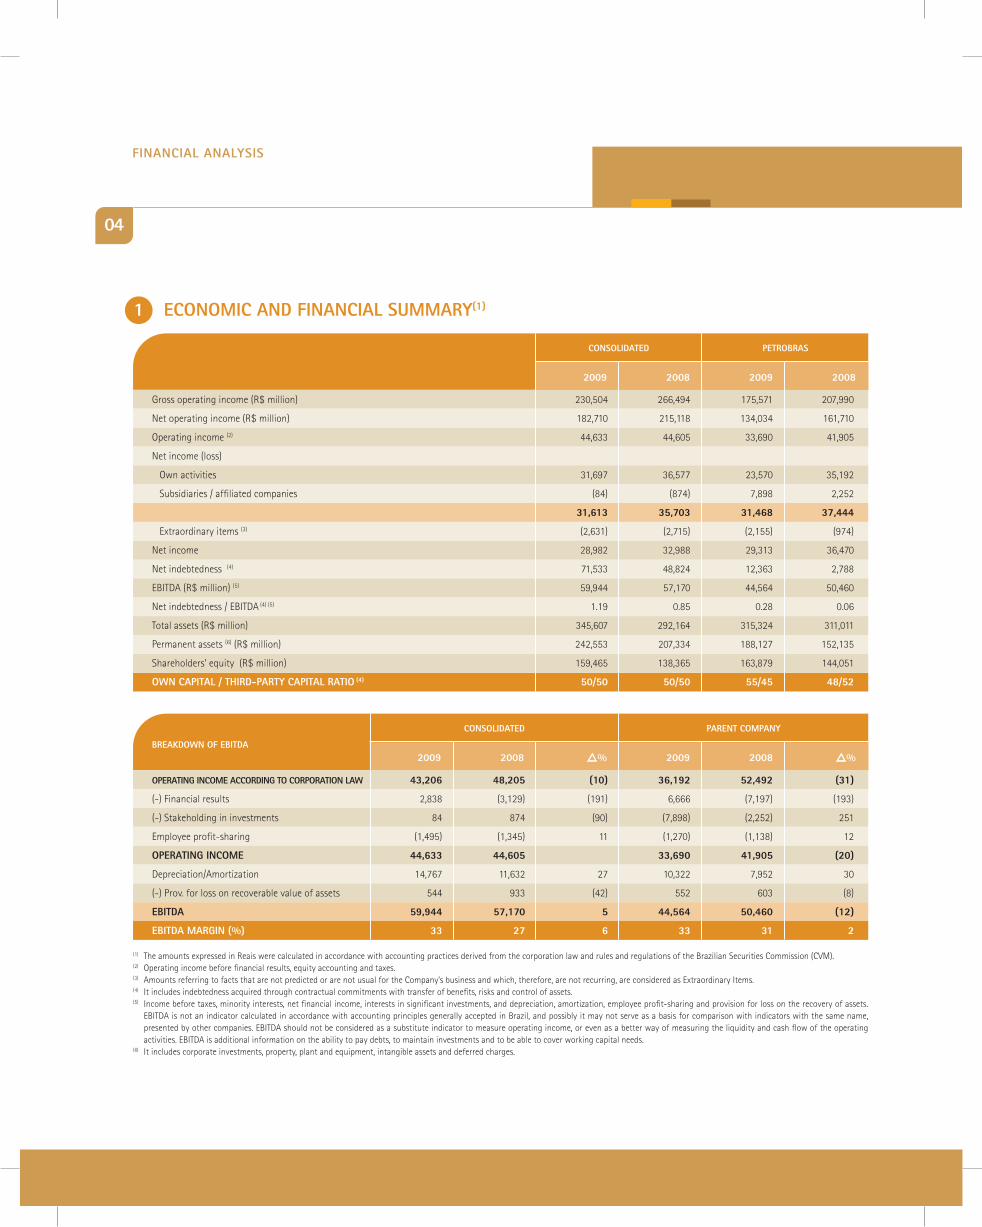
cOnsOlidated
gross operating income (r$ million) 230,504 266,494 175,571 207,990
net operating income (r$ million) 182,710 215,118 134,034 161,710
operating income (2) 44,633 44,605 33,690 41,905
net income (loss)
own activities 31,697 36,577 23,570 35,192
Subsidiaries / affiliated companies (84) (874) 7,898 2,252
31,613 35,703 31,468 37,444
Extraordinary items (3) (2,631) (2,715) (2,155) (974)
net income 28,982 32,988 29,313 36,470
net indebtedness (4) 71,533 48,824 12,363 2,788
Ebitda (r$ million) (5) 59,944 57,170 44,564 50,460
net indebtedness / Ebitda (4) (5) 1.19 0.85 0.28 0.06
total assets (r$ million) 345,607 292,164 315,324 311,011
permanent assets (6) (r$ million) 242,553 207,334 188,127 152,135
Shareholders’ equity (r$ million) 159,465 138,365 163,879 144,051
Own caPital / thiRd-PaRty caPital RatiO (4) 50/50 50/50 55/45 48/52
2009 2008 2009 2008
PetROBRas
(1) the amounts expressed in reais were calculated in accordance with accounting practices derived from the corporation law and rules and regulations of the brazilian Securities commission (cVm).(2) operating income before financial results, equity accounting and taxes.(3) amounts referring to facts that are not predicted or are not usual for the company’s business and which, therefore, are not recurring, are considered as Extraordinary items. (4) it includes indebtedness acquired through contractual commitments with transfer of benefits, risks and control of assets. (5) income before taxes, minority interests, net financial income, interests in significant investments, and depreciation, amortization, employee profit-sharing and provision for loss on the recovery of assets.
Ebitda is not an indicator calculated in accordance with accounting principles generally accepted in brazil, and possibly it may not serve as a basis for comparison with indicators with the same name, presented by other companies. Ebitda should not be considered as a substitute indicator to measure operating income, or even as a better way of measuring the liquidity and cash flow of the operating activities. Ebitda is additional information on the ability to pay debts, to maintain investments and to be able to cover working capital needs.
(6) it includes corporate investments, property, plant and equipment, intangible assets and deferred charges.
cOnsOlidated
OPeRating incOme accORding tO cORPORatiOn law 43,206 48,205 (10) 36,192 52,492 (31)
(-) Financial results 2,838 (3,129) (191) 6,666 (7,197) (193)
(-) Stakeholding in investments 84 874 (90) (7,898) (2,252) 251
Employee profit-sharing (1,495) (1,345) 11 (1,270) (1,138) 12
OPeRating incOme 44,633 44,605 33,690 41,905 (20)
depreciation/amortization 14,767 11,632 27 10,322 7,952 30
(-) prov. for loss on recoverable value of assets 544 933 (42) 552 603 (8)
eBitda 59,944 57,170 5 44,564 50,460 (12)
eBitda maRgin (%) 33 27 6 33 31 2
2009 2009 20082008 r%r%
PaRent cOmPany
BReaKdOwn OF eBitda
1 ecOnOmic and Financial sUmmaRy(1)
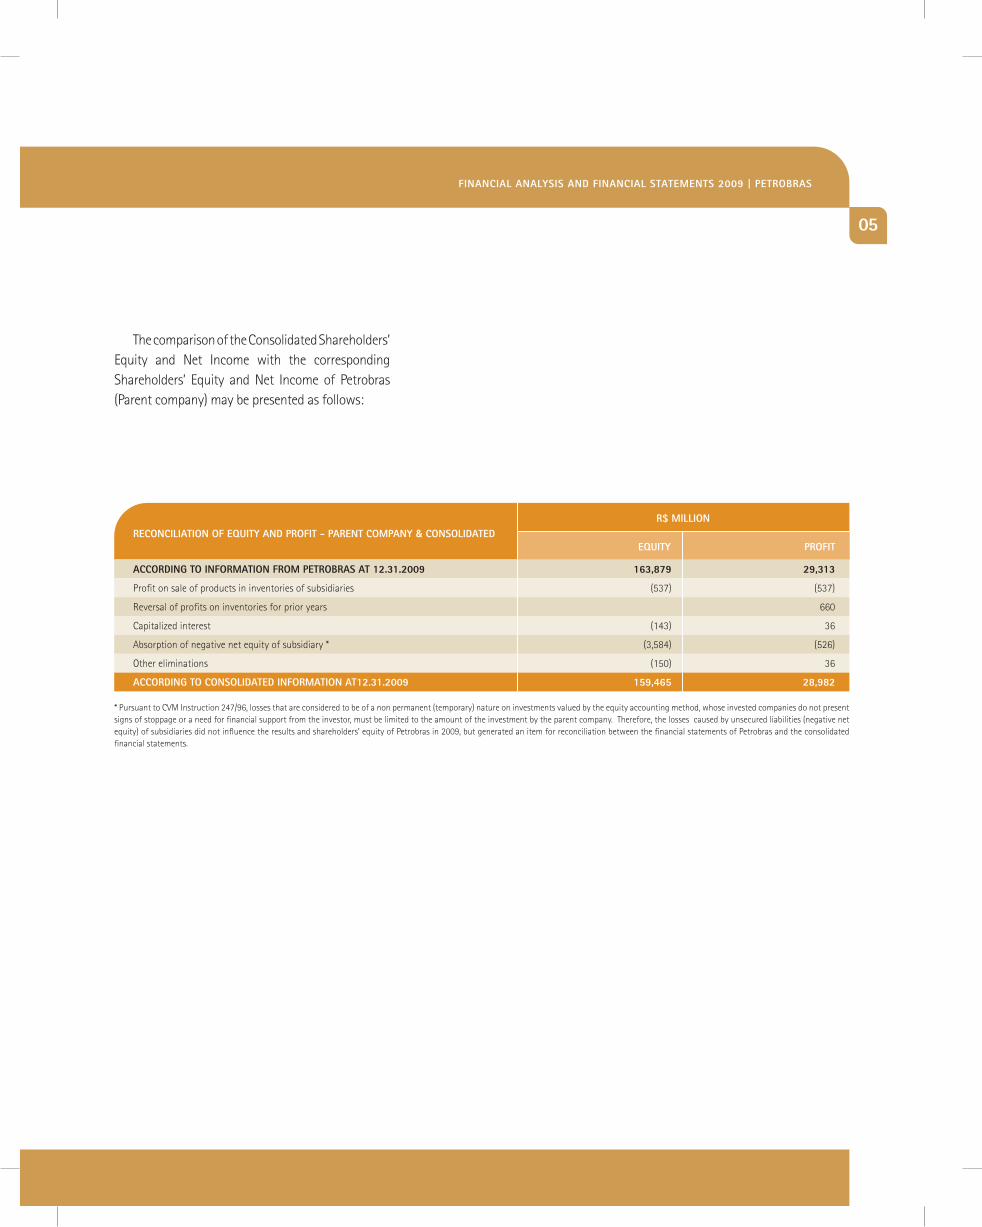
accORding tO inFORmatiOn FROm PetROBRas at 12.31.2009 163,879 29,313
profit on sale of products in inventories of subsidiaries (537) (537)
reversal of profits on inventories for prior years 660
capitalized interest (143) 36
absorption of negative net equity of subsidiary * (3,584) (526)
other eliminations (150) 36
accORding tO cOnsOlidated inFORmatiOn at12.31.2009 159,465 28,982
eqUity PROFit
R$ milliOnRecOnciliatiOn OF eqUity and PROFit - PaRent cOmPany & cOnsOlidated
* pursuant to cVm instruction 247/96, losses that are considered to be of a non permanent (temporary) nature on investments valued by the equity accounting method, whose invested companies do not present signs of stoppage or a need for financial support from the investor, must be limited to the amount of the investment by the parent company. therefore, the losses caused by unsecured liabilities (negative net equity) of subsidiaries did not influence the results and shareholders’ equity of petrobras in 2009, but generated an item for reconciliation between the financial statements of petrobras and the consolidated financial statements.
the comparison of the consolidated Shareholders’ Equity and net income with the corresponding Shareholders’ Equity and net income of petrobras (parent company) may be presented as follows:
05
Financial analysis And Financial statements 2009 | PetROBRas
06 07
Financial analysis
2 cOnsOlidated ResUlts
petrobras and its subsidiaries presented a consolidated net profit of r$ 28,982 million in the year ended december 31, 2009, after eliminating intercompany transactions and deducting the minority interest, which is a 12% decrease in relation to the previous year (r$ 32,988 million).
the following factors contributed towards this performance:• Maintenanceofthegrossprofitinrelationto
the prior year, due to:- A decrease in the average realization prices of oil
and oil products on the domestic market and for exports (R$ 27,423 million), with an emphasis on naphtha, aviation kerosene and fuel oil, which were influenced by international quotations. These effects were mitigated by the adjustments for diesel and gasoline from May 2008 to June 2009, permitting the average sales price in Brazil to decrease on a smaller scale (11%), in relation to the unit costs, and the replacement by local production of diesel imported for sale, as well as the appreciation of the average rate for the US dollar in the period (8.8%).
making it possible to absorb:- The decrease in average unit costs (R$
21,107 million), a consequence of the lower expenditure with importing oil, oil products and gas and with the governmental interest in Brazil, compensated by the higher cost for exhaustion and depreciation due to the review of the reserves.
• The operating expenses remained stable,emphasizing the main changes:
- Provision for loss in the recoverable value of the assets (R$ 389 million), a decrease due to the larger provision for exploration and production assets recognized in 2008, due to the fall in the quotations for petroleum in that period;
- Research and Development (R$ 342 million), as a consequence of the decrease in the provision allocated for contracting projects from institutions accredited by ANP (R$ 533 million), due to the lower quotation for petroleum which affects the calculation basis for fixing the minimum investment in research. This effect was partially offset by the increase in third party services;
- Taxes (R$ 205 million), a decrease due to less tax withheld this year in the distribution of dividends between the subsidiaries abroad (R$ 80 million), a decrease in PIS and COFINS on non-end activity and IOF on financial transactions (R$ 52 million); and
- Other operating expenses (R$ 876 million), an increase resulting from the extra expense in September 2009 with the special interest in the Marlim field, in accordance with the agreement between Petrobras and ANP (R$ 2,065 million). This effect was offset by the decrease in the loss with the devaluation of commodities (R$ 731 million), non-recurring expenses with the provision, in 2008, for contingencies related to additional royalties for the Guando field, in Colombia (R$ 227 million), lower expenses for
06 07
Financial analysis
institutional relations and cultural products (R$ 158 million) and the exchange effect on the translation of these expenses (R$ 159 million), as well as the inclusion of new operations in Chile and Japan.
R$ milliOn
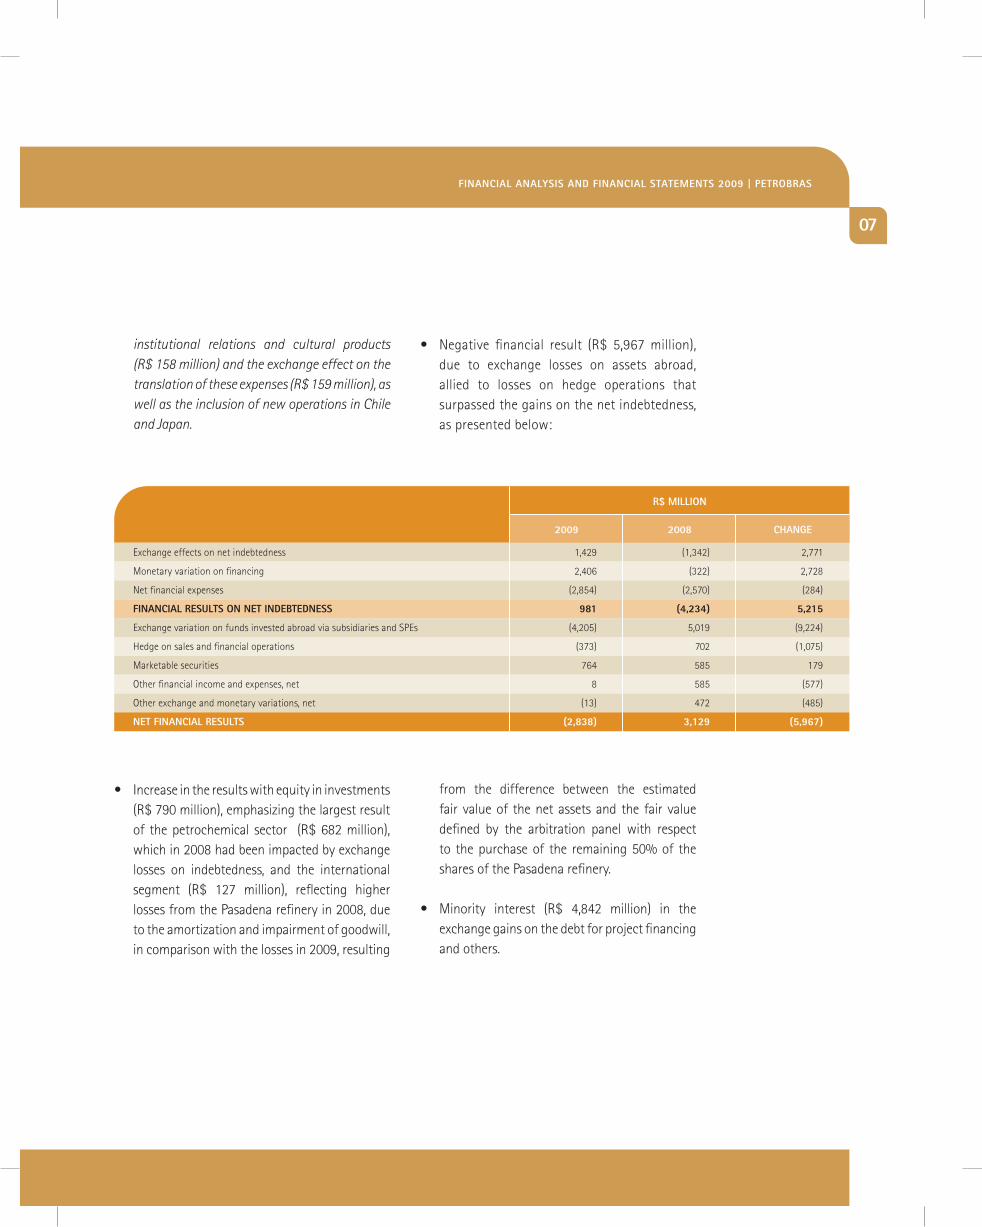
Exchange effects on net indebtedness 1,429 (1,342) 2,771
monetary variation on financing 2,406 (322) 2,728
net financial expenses (2,854) (2,570) (284)
Financial ResUlts On net indeBtedness 981 (4,234) 5,215
Exchange variation on funds invested abroad via subsidiaries and SpEs (4,205) 5,019 (9,224)
hedge on sales and financial operations (373) 702 (1,075)
marketable securities 764 585 179
other financial income and expenses, net 8 585 (577)
other exchange and monetary variations, net (13) 472 (485)
net Financial ResUlts (2,838) 3,129 (5,967)
change20082009
• Negative financial result (R$ 5,967 million),due to exchange losses on assets abroad, allied to losses on hedge operations that surpassed the gains on the net indebtedness, as presented below:
• Increaseintheresultswithequityininvestments(r$ 790 million), emphasizing the largest result of the petrochemical sector (r$ 682 million), which in 2008 had been impacted by exchange losses on indebtedness, and the international segment (r$ 127 million), reflecting higher losses from the pasadena refinery in 2008, due to the amortization and impairment of goodwill, in comparison with the losses in 2009, resulting
from the difference between the estimated fair value of the net assets and the fair value defined by the arbitration panel with respect to the purchase of the remaining 50% of the shares of the pasadena refinery.
• Minority interest (R$ 4,842 million) in theexchange gains on the debt for project financing and others.
Financial analysis And Financial statements 2009 | PetROBRas
08 09
Financial analysis
3 ResUlts By BUsiness segment
petrobras is an operationally integrated company and the major part of the production of petroleum and gas from the Exploration and production department is transferred to other departments of petrobras.
in the computation of the results by business segment, transactions carried out with third parties and the transfers between the business segments are considered and they are valued by internal transfer prices defined between the segments using calculation methodologies based on market parameters.
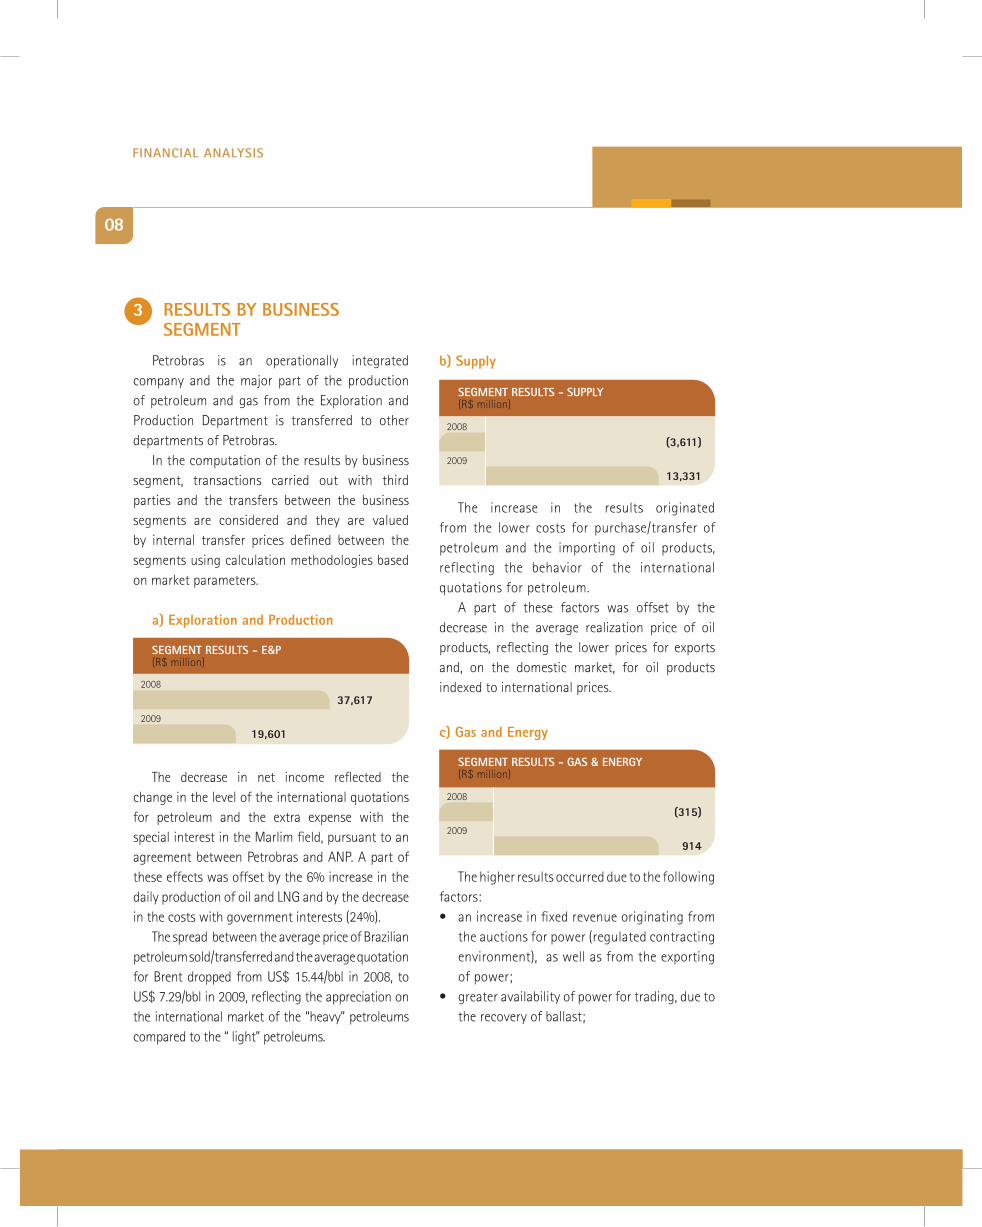
the decrease in net income reflected the change in the level of the international quotations for petroleum and the extra expense with the special interest in the marlim field, pursuant to an agreement between petrobras and anp. a part of these effects was offset by the 6% increase in the daily production of oil and lng and by the decrease in the costs with government interests (24%).
the spread between the average price of brazilian petroleum sold/transferred and the average quotation for brent dropped from uS$ 15.44/bbl in 2008, to uS$ 7.29/bbl in 2009, reflecting the appreciation on the international market of the “heavy” petroleums compared to the “ light” petroleums.
the higher results occurred due to the following factors:• anincreaseinfixedrevenueoriginatingfrom
the auctions for power (regulated contracting environment), as well as from the exporting of power;
• greateravailabilityofpowerfortrading,duetothe recovery of ballast;
a) exploration and Production
c) gas and energy
the increase in the results originated from the lower costs for purchase/transfer of petroleum and the importing of oil products, reflecting the behavior of the international quotations for petroleum.
a part of these factors was offset by the decrease in the average realization price of oil products, reflecting the lower prices for exports and, on the domestic market, for oil products indexed to international prices.
b) supply
segment ResUlts - sUPPly(r$ million)
(3,611)
13,331
2008
2009
segment ResUlts - gas & eneRgy(r$ million)
(315)
914
2008
2009
segment ResUlts - e&P(r$ million)
37,617
19,6012009
2008
• increaseinthelevelofthehydroelectricdams,reducing the average cost for purchase of power and increasing the trading margins. part of this effect was offset by the decrease in thermoelectric generation;
• decreaseinthecostsforimporting/transferringnatural gas, following the behavior of the international references.the conclusion of the infrastructure ven-
tures which have made the flow of natural gas production possible also contributed to the increase in the results and, consequently, avoided the penalties for supply failures that were incurred in 2008.
d) distribution
e) international
the increase in net income resulted from the 13% increase in the volume sold, mainly reflecting the inclusion of the commercial activities of alvo distribuidora, despite the consequent increase in selling, general and administrative expenses (r$ 313 million).
trading margins decreased 2%, due to lower average realization prices, offsetting part of the increase in the results.
the market share for distribution of fuels increased from 34.9% in 2008 to 38.6% in 2009.
segment ResUlts - distRiBUtiOn(r$ million)
1,234
1,254
2008
2009
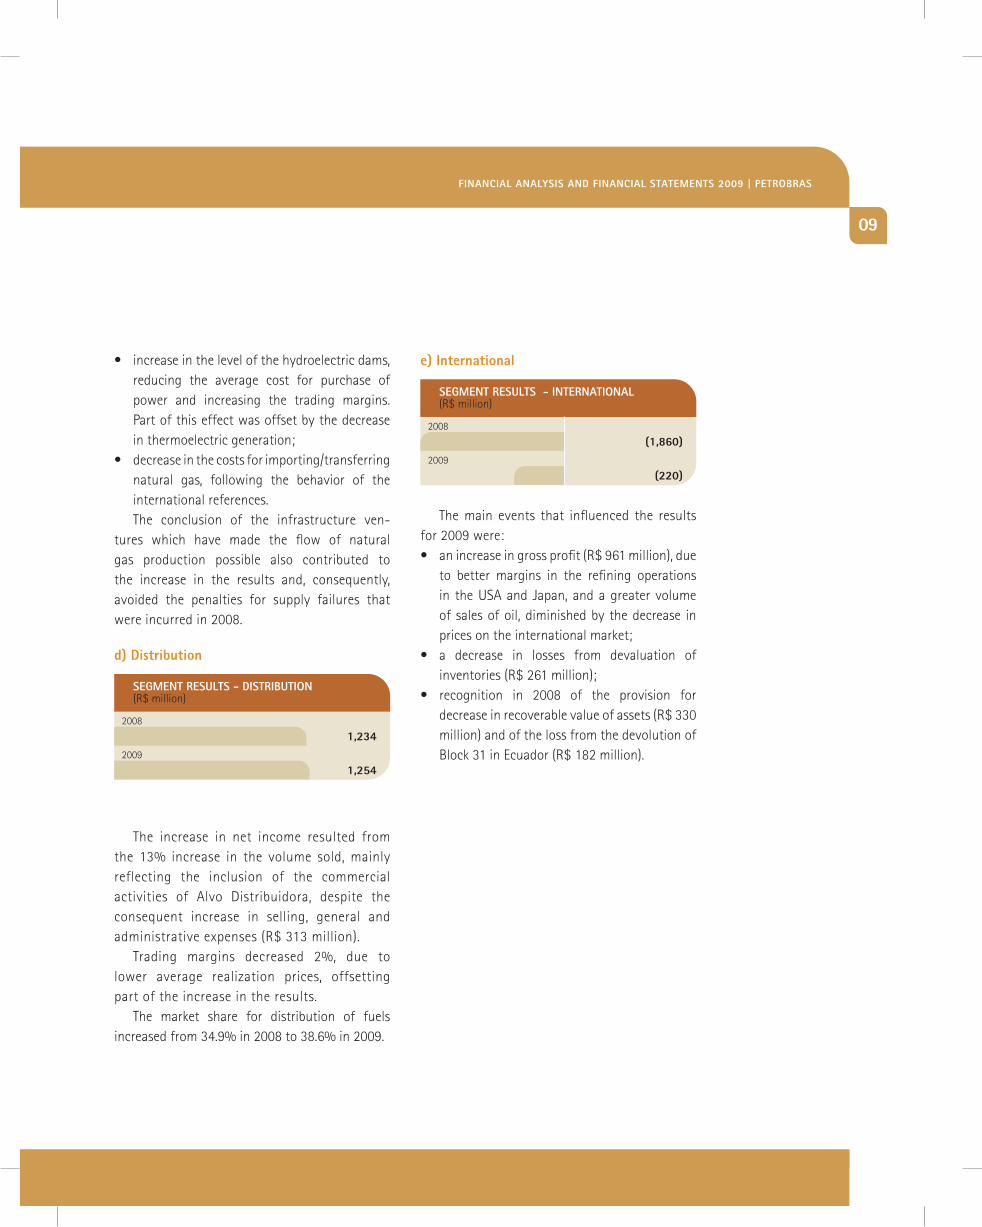
the main events that influenced the results for 2009 were: • anincreaseingrossprofit(R$961million),due
to better margins in the refining operations in the uSa and japan, and a greater volume of sales of oil, diminished by the decrease in prices on the international market;
• a decrease in losses from devaluation ofinventories (r$ 261 million);
• recognition in 2008 of the provision fordecrease in recoverable value of assets (r$ 330 million) and of the loss from the devolution of block 31 in Ecuador (r$ 182 million).
anÁlise FinanceiRa e demOnstRaÇÕes cOntÁBeis 2009 | PetROBRas
segment ResUlts - inteRnatiOnal (r$ million)
(1,860)
(220)
2008
2009
08 09
Financial analysis
Financial analysis And Financial statements 2009 | PetROBRas
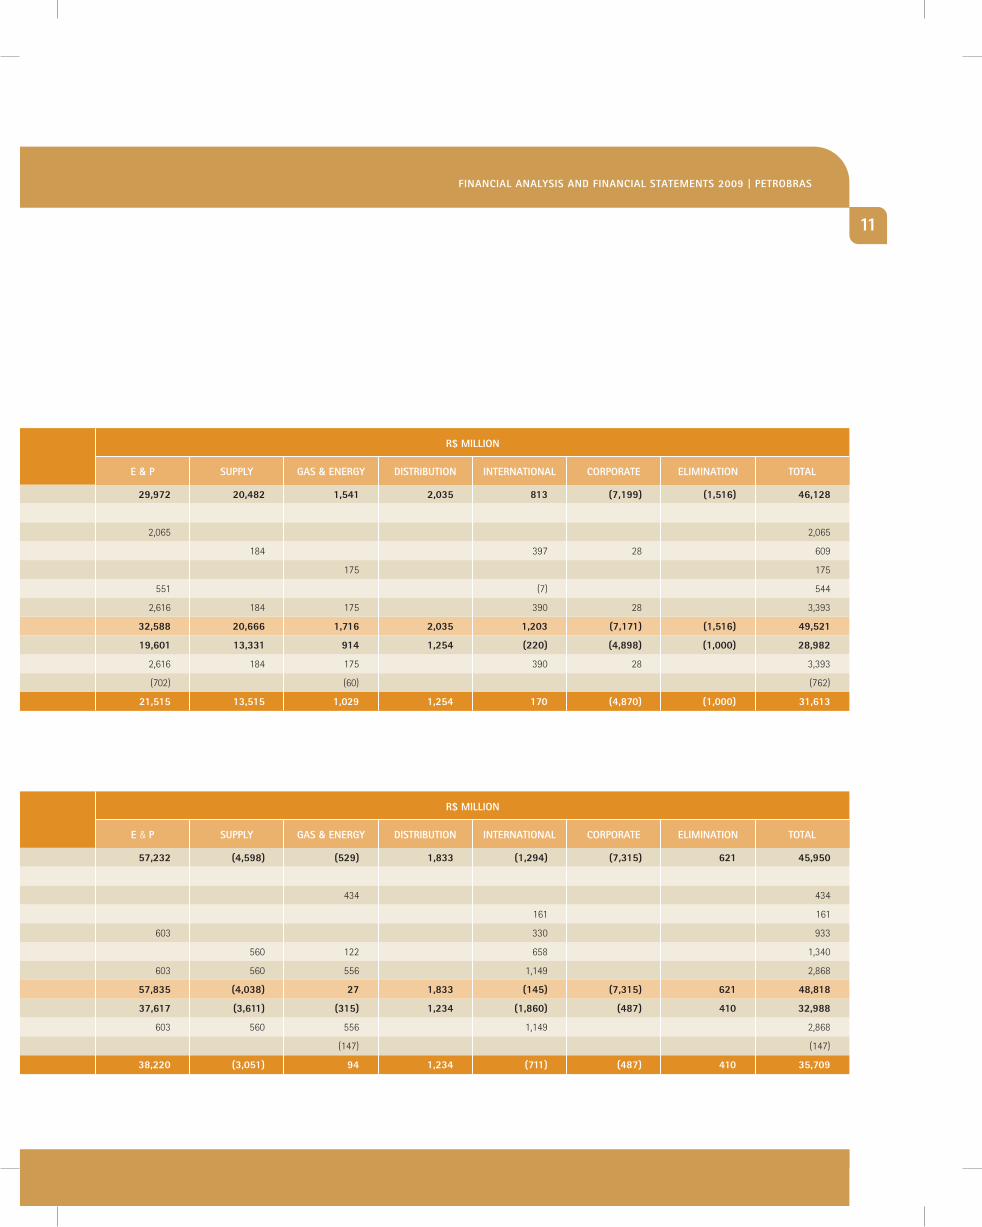
OPeRating incOme (lOss) 29,972 20,482 1,541 2,035 813 (7,199) (1,516) 46,128
extRaORdinaRy items:
legal agreement with anp on special interest 2,065 2,065
adjustment to market value of inventories 184 397 28 609
addendum to contract for supply of imported natural gas 175 175
provision for loss on recoverable value of assets 551 (7) 544
Subtotal Extraordinary items 2,616 184 175 390 28 3,393
OPeRating incOme (lOss) withOUt eFFects OF extRaORdinaRy items 32,588 20,666 1,716 2,035 1,203 (7,171) (1,516) 49,521
net incOme (lOss) 19,601 13,331 914 1,254 (220) (4,898) (1,000) 28,982
Extraordinary items 2,616 184 175 390 28 3,393
tax effect (702) (60) (762)
net incOme withOUt eFFects OF extRaORdinaRy items 21,515 13,515 1,029 1,254 170 (4,870) (1,000) 31,613
OPeRating incOme (lOss) 57,232 (4,598) (529) 1,833 (1,294) (7,315) 621 45,950
extRaORdinaRy items:
contractual charges and fines 434 434
provision for royalty litigations 161 161
provision for loss on recoverable value of assets 603 330 933
adjustment to market value of inventories 560 122 658 1,340
Subtotal Extraordinary items 603 560 556 1,149 2,868
OPeRating incOme (lOss) withOUt eFFects OF extRaORdinaRy items 57,835 (4,038) 27 1,833 (145) (7,315) 621 48,818
net incOme (lOss) 37,617 (3,611) (315) 1,234 (1,860) (487) 410 32,988
Extraordinary items 603 560 556 1,149 2,868
tax effects (147) (147)
net incOme withOUt eFFects OF extRaORdinaRy items 38,220 (3,051) 94 1,234 (711) (487) 410 35,709
10 11
Financial analysis
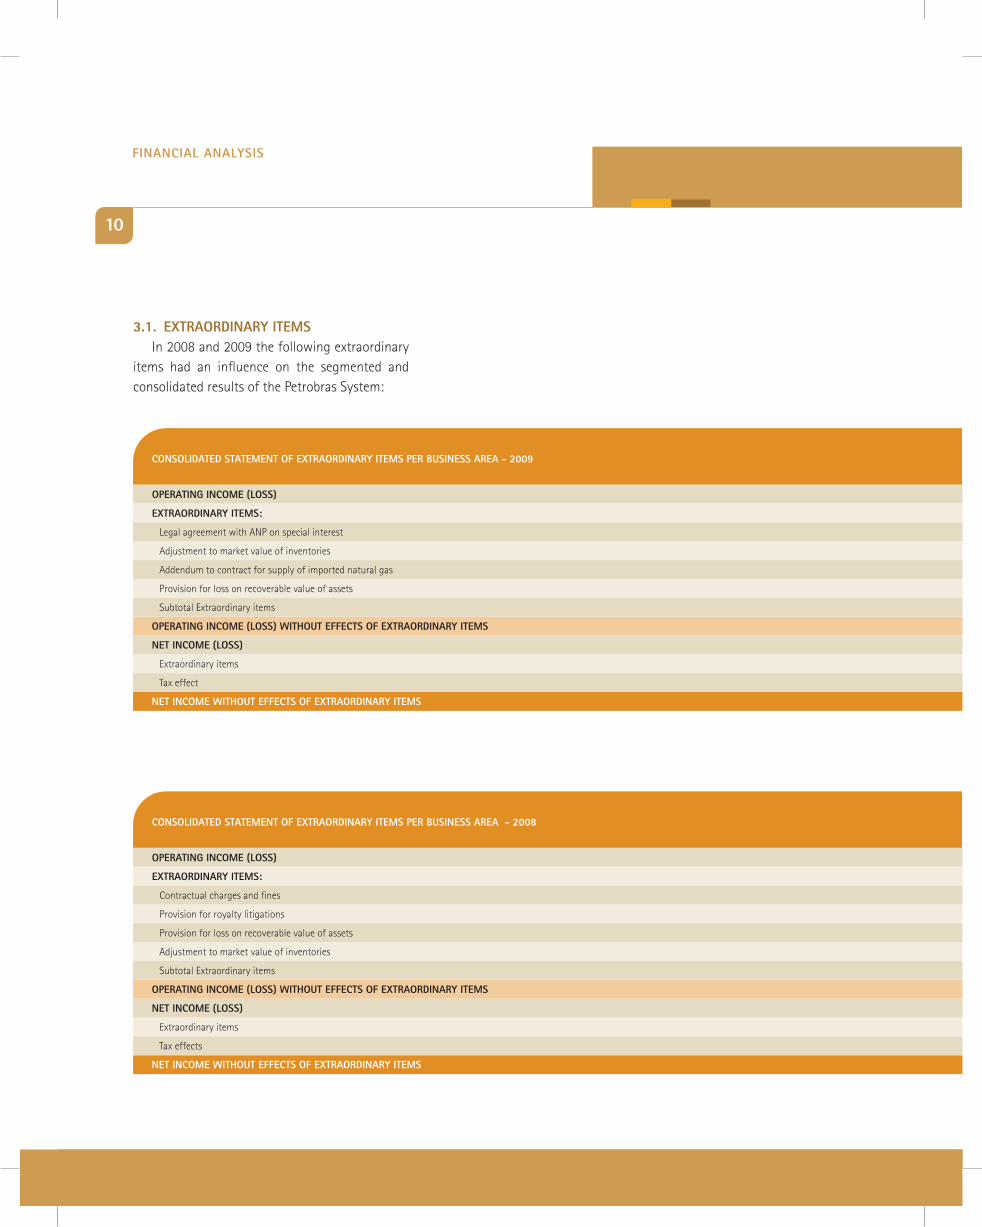
cOnsOlidated statement OF extRaORdinaRy items PeR BUsiness aRea - 2009
3.1. extRaORdinaRy itemsin 2008 and 2009 the following extraordinary
items had an influence on the segmented and consolidated results of the petrobras System:
cOnsOlidated statement OF extRaORdinaRy items PeR BUsiness aRea - 2008
OPeRating incOme (lOss) 29,972 20,482 1,541 2,035 813 (7,199) (1,516) 46,128
extRaORdinaRy items:
legal agreement with anp on special interest 2,065 2,065
adjustment to market value of inventories 184 397 28 609
addendum to contract for supply of imported natural gas 175 175
provision for loss on recoverable value of assets 551 (7) 544
Subtotal Extraordinary items 2,616 184 175 390 28 3,393
OPeRating incOme (lOss) withOUt eFFects OF extRaORdinaRy items 32,588 20,666 1,716 2,035 1,203 (7,171) (1,516) 49,521
net incOme (lOss) 19,601 13,331 914 1,254 (220) (4,898) (1,000) 28,982
Extraordinary items 2,616 184 175 390 28 3,393
tax effect (702) (60) (762)
net incOme withOUt eFFects OF extRaORdinaRy items 21,515 13,515 1,029 1,254 170 (4,870) (1,000) 31,613
e & P sUPPly gas & eneRgy distRiBUtiOn inteRnatiOnal cORPORate eliminatiOn tOtal
R$ milliOn
OPeRating incOme (lOss) 57,232 (4,598) (529) 1,833 (1,294) (7,315) 621 45,950
extRaORdinaRy items:
contractual charges and fines 434 434
provision for royalty litigations 161 161
provision for loss on recoverable value of assets 603 330 933
adjustment to market value of inventories 560 122 658 1,340
Subtotal Extraordinary items 603 560 556 1,149 2,868
OPeRating incOme (lOss) withOUt eFFects OF extRaORdinaRy items 57,835 (4,038) 27 1,833 (145) (7,315) 621 48,818
net incOme (lOss) 37,617 (3,611) (315) 1,234 (1,860) (487) 410 32,988
Extraordinary items 603 560 556 1,149 2,868
tax effects (147) (147)
net incOme withOUt eFFects OF extRaORdinaRy items 38,220 (3,051) 94 1,234 (711) (487) 410 35,709
e & P sUPPly gas & eneRgy distRiBUtiOn inteRnatiOnal cORPORate eliminatiOn tOtal
R$ milliOn
anÁlise FinanceiRa e demOnstRaÇÕes cOntÁBeis 2009 | PetROBRas
10 11
Financial analysis
Financial analysis And Financial statements 2009 | PetROBRas
12 13
Financial analysis
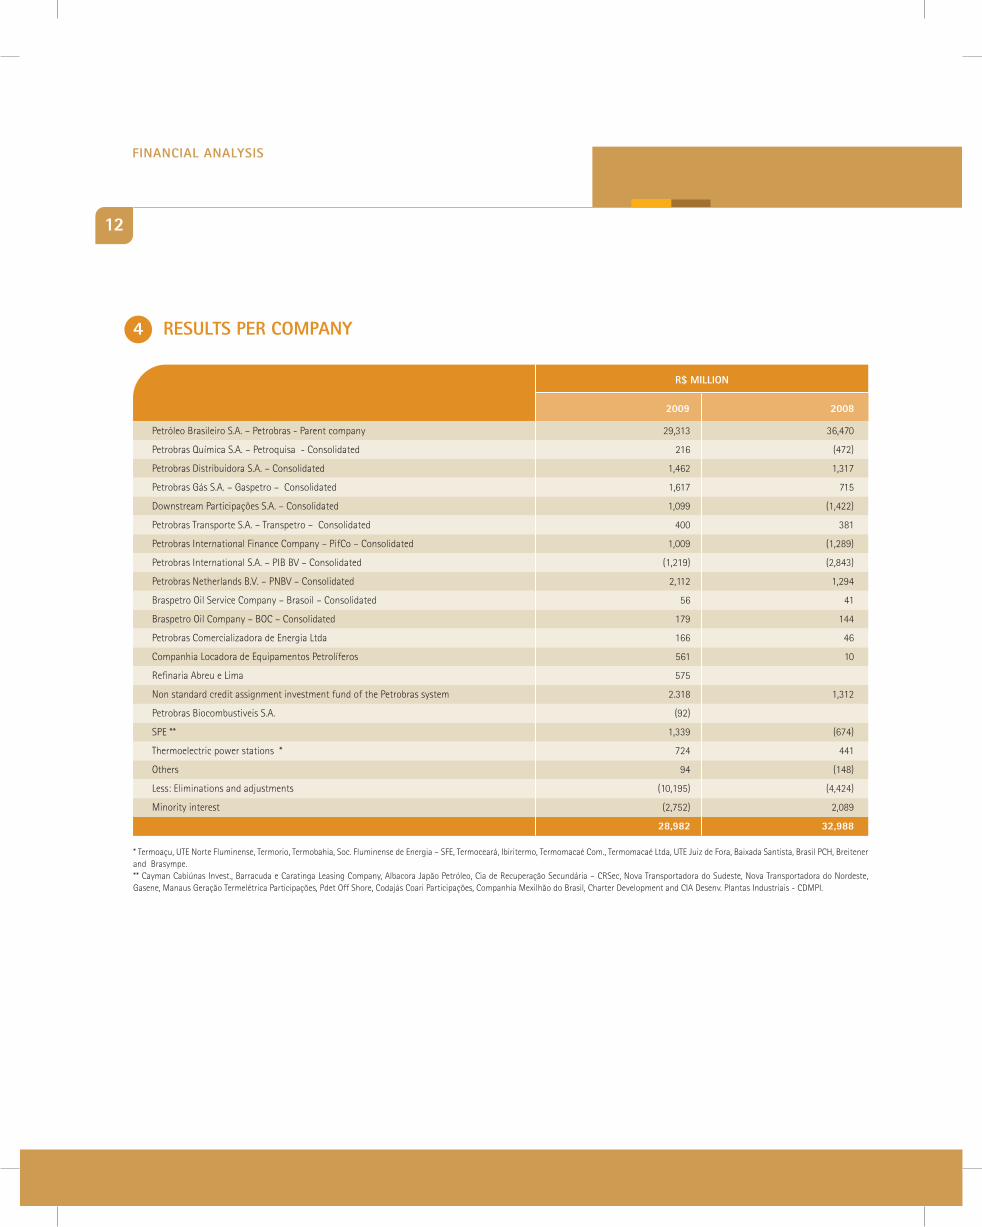
4 ResUlts PeR cOmPany
petróleo brasileiro S.a. – petrobras - parent company 29,313 36,470
petrobras química S.a. – petroquisa - consolidated 216 (472)
petrobras distribuidora S.a. – consolidated 1,462 1,317
petrobras gás S.a. – gaspetro – consolidated 1,617 715
downstream participações S.a. – consolidated 1,099 (1,422)
petrobras transporte S.a. – transpetro – consolidated 400 381
petrobras international Finance company – pifco – consolidated 1,009 (1,289)
petrobras international S.a. – pib bV – consolidated (1,219) (2,843)
petrobras netherlands b.V. – pnbV – consolidated 2,112 1,294
braspetro oil Service company – brasoil – consolidated 56 41
braspetro oil company – boc – consolidated 179 144
petrobras comercializadora de Energia ltda 166 46
companhia locadora de Equipamentos petrolíferos 561 10
refinaria abreu e lima 575
non standard credit assignment investment fund of the petrobras system 2.318 1,312
petrobras biocombustiveis S.a. (92)
SpE ** 1,339 (674)
thermoelectric power stations * 724 441
others 94 (148)
less: Eliminations and adjustments (10,195) (4,424)
minority interest (2,752) 2,089
28,982 32,988
2009 2008
R$ milliOn
* termoaçu, utE norte Fluminense, termorio, termobahia, Soc. Fluminense de Energia – SFE, termoceará, ibiritermo, termomacaé com., termomacaé ltda, utE juiz de Fora, baixada Santista, brasil pch, breitener and brasympe.** cayman cabiúnas invest., barracuda e caratinga leasing company, albacora japão petróleo, cia de recuperação Secundária – crSec, nova transportadora do Sudeste, nova transportadora do nordeste, gasene, manaus geração termelétrica participações, pdet off Shore, codajás coari participações, companhia mexilhão do brasil, charter development and cia desenv. plantas industriais - cdmpi.
12 13
Financial analysis
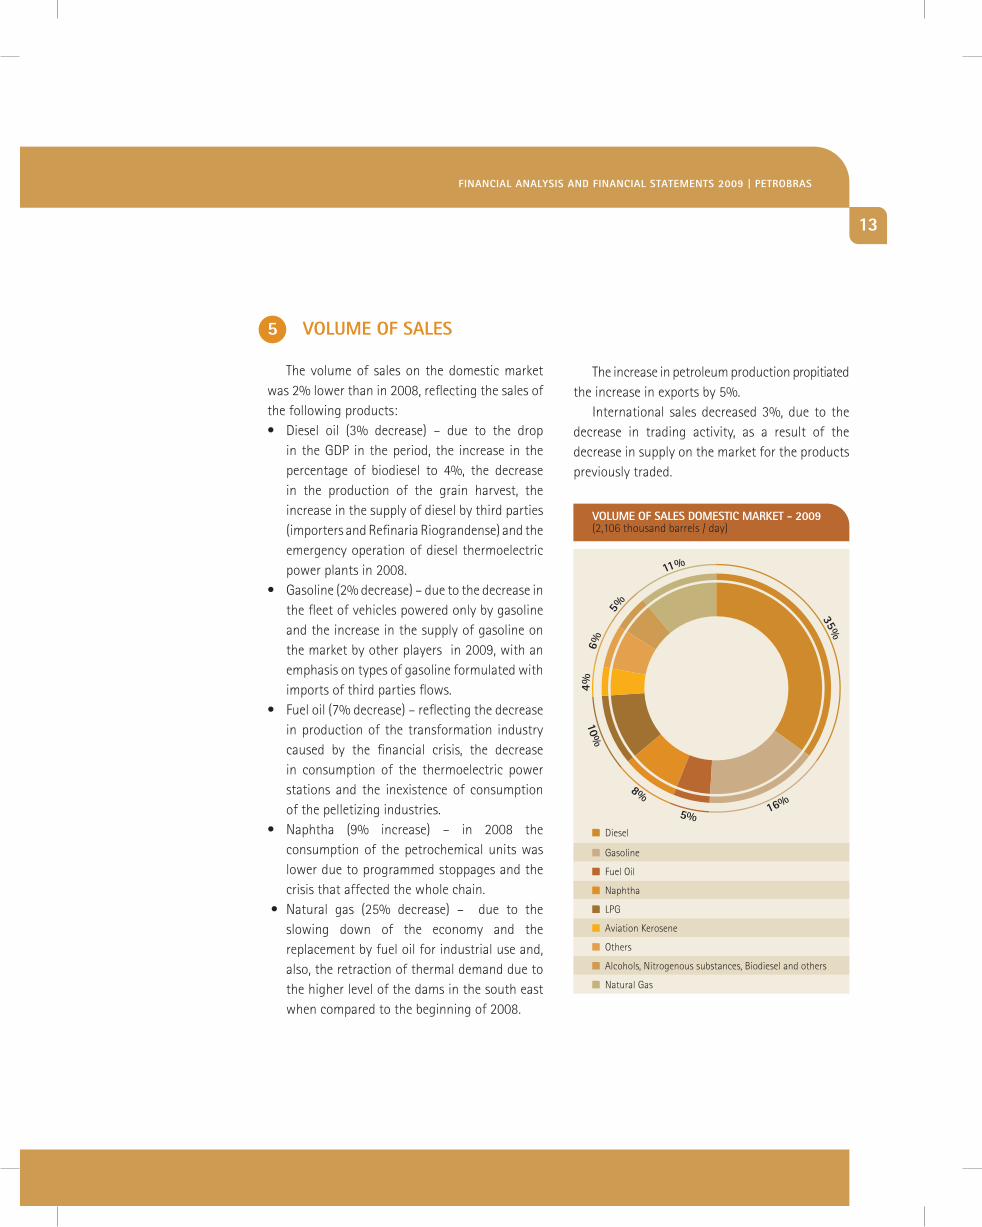
5 VOlUme OF sales
the volume of sales on the domestic market was 2% lower than in 2008, reflecting the sales of the following products: • Diesel oil (3% decrease) – due to the drop
in the gdp in the period, the increase in the percentage of biodiesel to 4%, the decrease in the production of the grain harvest, the increase in the supply of diesel by third parties (importers and refinaria riograndense) and the emergency operation of diesel thermoelectric power plants in 2008.
• Gasoline(2%decrease)–duetothedecreaseinthe fleet of vehicles powered only by gasoline and the increase in the supply of gasoline on the market by other players in 2009, with an emphasis on types of gasoline formulated with imports of third parties flows.
• Fueloil(7%decrease)–reflectingthedecreasein production of the transformation industry caused by the financial crisis, the decrease in consumption of the thermoelectric power stations and the inexistence of consumption of the pelletizing industries.
• Naphtha (9% increase) – in 2008 theconsumption of the petrochemical units was lower due to programmed stoppages and the crisis that affected the whole chain.
•Natural gas (25% decrease) – due to theslowing down of the economy and the replacement by fuel oil for industrial use and, also, the retraction of thermal demand due to the higher level of the dams in the south east when compared to the beginning of 2008.
the increase in petroleum production propitiated the increase in exports by 5%.
international sales decreased 3%, due to the decrease in trading activity, as a result of the decrease in supply on the market for the products previously traded.
VOlUme OF sales dOmestic maRKet - 2009 (2,106 thousand barrels / day)
diesel
gasoline
Fuel oil
naphtha
lpg
aviation kerosene
others
alcohols, nitrogenous substances, biodiesel and others
natural gas
4%6%
5%
11%
35%
Financial analysis And Financial statements 2009 | PetROBRas
14 15
Financial analysis
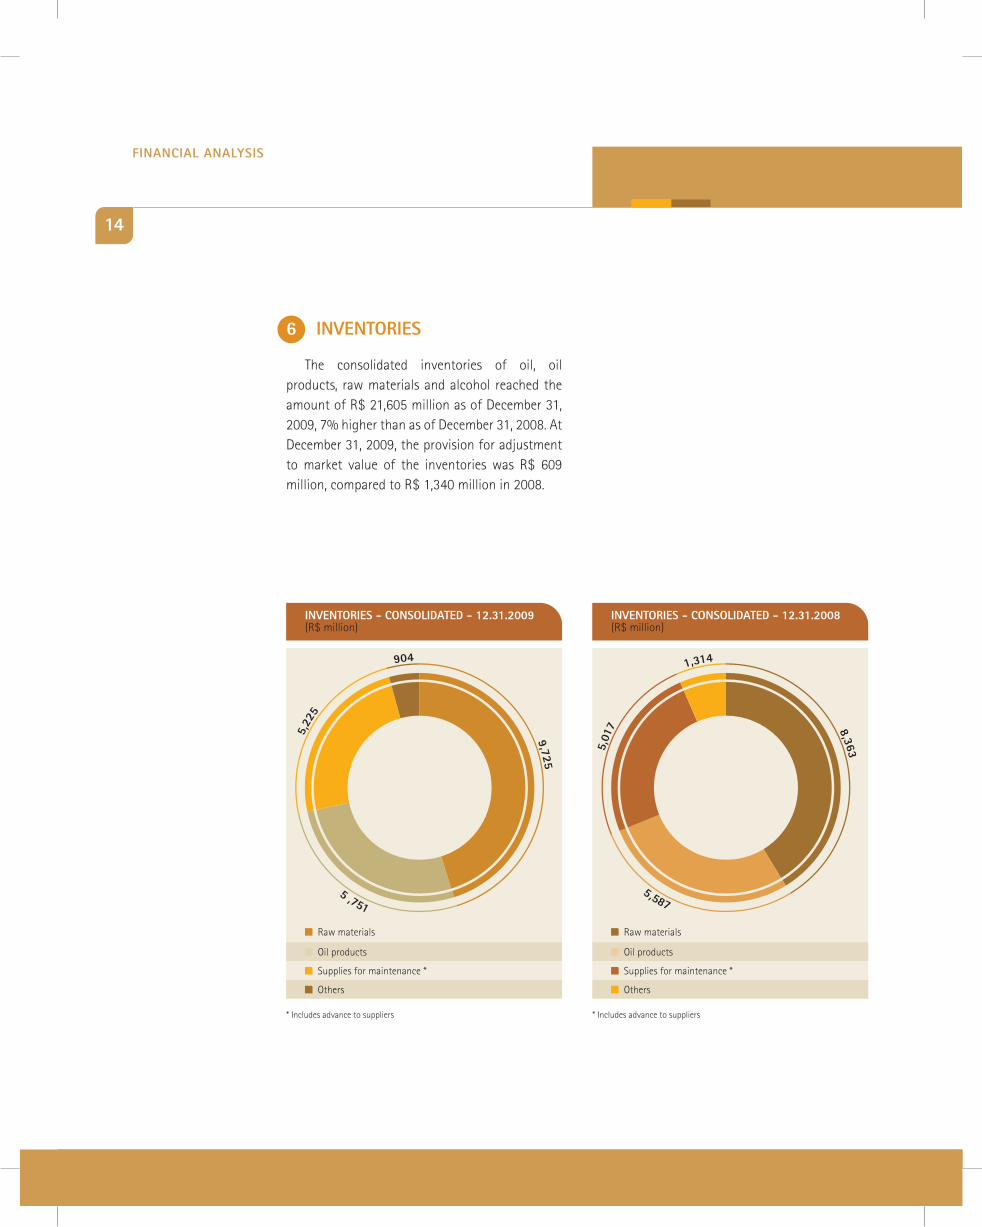
6 inVentORies
the consolidated inventories of oil, oil products, raw materials and alcohol reached the amount of r$ 21,605 million as of december 31, 2009, 7% higher than as of december 31, 2008. at december 31, 2009, the provision for adjustment to market value of the inventories was r$ 609 million, compared to r$ 1,340 million in 2008.
inVentORies - cOnsOlidated - 12.31.2009 (r$ million)
raw materials
oil products
Supplies for maintenance *
others
9725
522
5
904
* includes advance to suppliers
inVentORies - cOnsOlidated - 12.31.2008 (r$ million)
raw materials
oil products
Supplies for maintenance *
others
* includes advance to suppliers
R$ milliOn
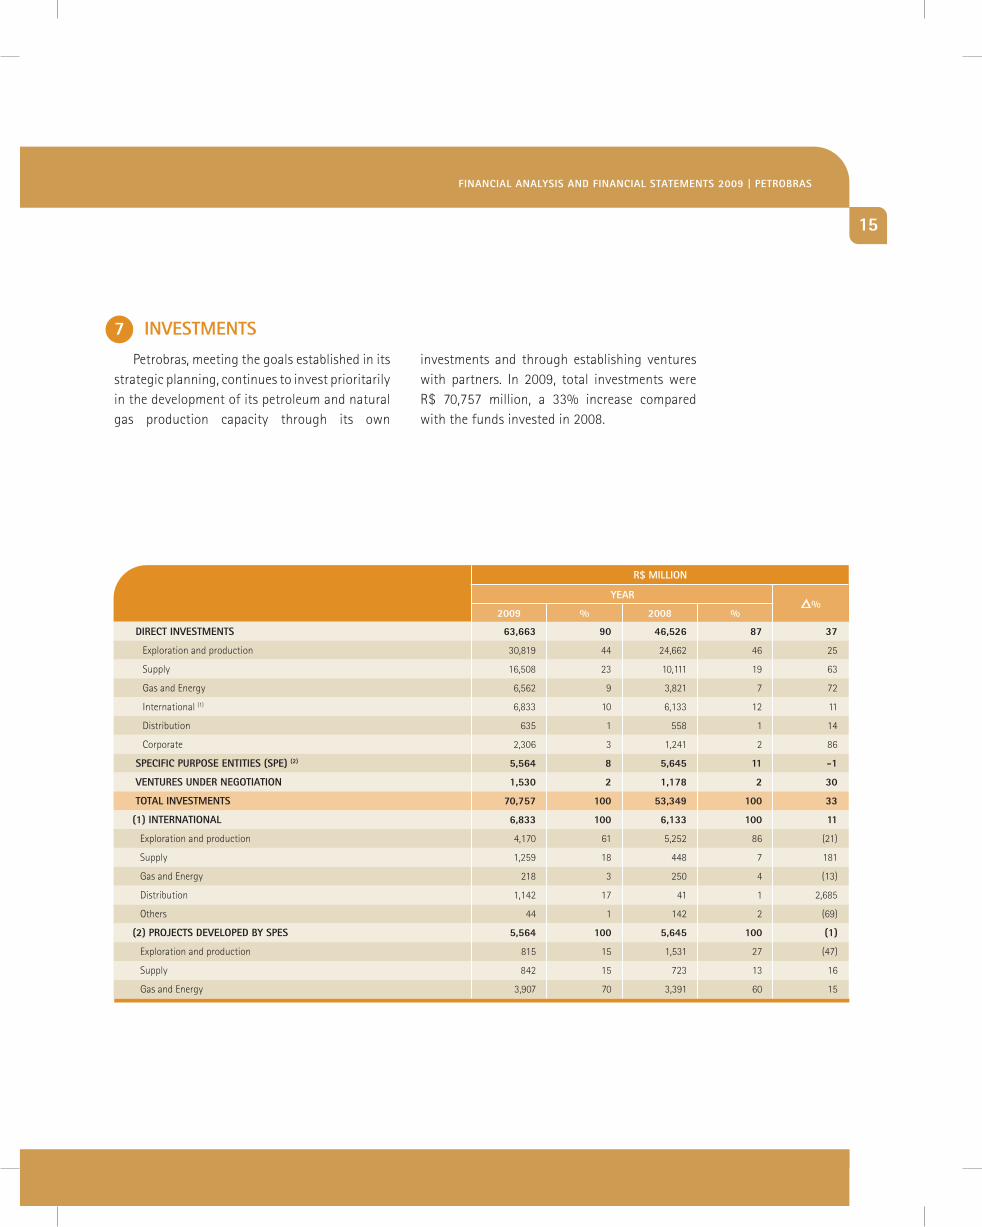
diRect inVestments 63,663 90 46,526 87 37
Exploration and production 30,819 44 24,662 46 25
Supply 16,508 23 10,111 19 63
gas and Energy 6,562 9 3,821 7 72
international (1) 6,833 10 6,133 12 11
distribution 635 1 558 1 14
corporate 2,306 3 1,241 2 86
sPeciFic PURPOse entities (sPe) (2) 5,564 8 5,645 11 -1
VentURes UndeR negOtiatiOn 1,530 2 1,178 2 30
tOtal inVestments 70,757 100 53,349 100 33
(1) inteRnatiOnal 6,833 100 6,133 100 11
Exploration and production 4,170 61 5,252 86 (21)
Supply 1,259 18 448 7 181
gas and Energy 218 3 250 4 (13)
distribution 1,142 17 41 1 2,685
others 44 1 142 2 (69)
(2) PROjects deVelOPed By sPes 5,564 100 5,645 100 (1)
Exploration and production 815 15 1,531 27 (47)
Supply 842 15 723 13 16
gas and Energy 3,907 70 3,391 60 15
yeaRr%
2009 % 2008 %
7 inVestments
petrobras, meeting the goals established in its strategic planning, continues to invest prioritarily in the development of its petroleum and natural gas production capacity through its own
investments and through establishing ventures with partners. in 2009, total investments were r$ 70,757 million, a 33% increase compared with the funds invested in 2008.
anÁlise FinanceiRa e demOnstRaÇÕes cOntÁBeis 2009 | PetROBRas
14 15
Financial analysis
Financial analysis And Financial statements 2009 | PetROBRas
16 17
Financial analysis
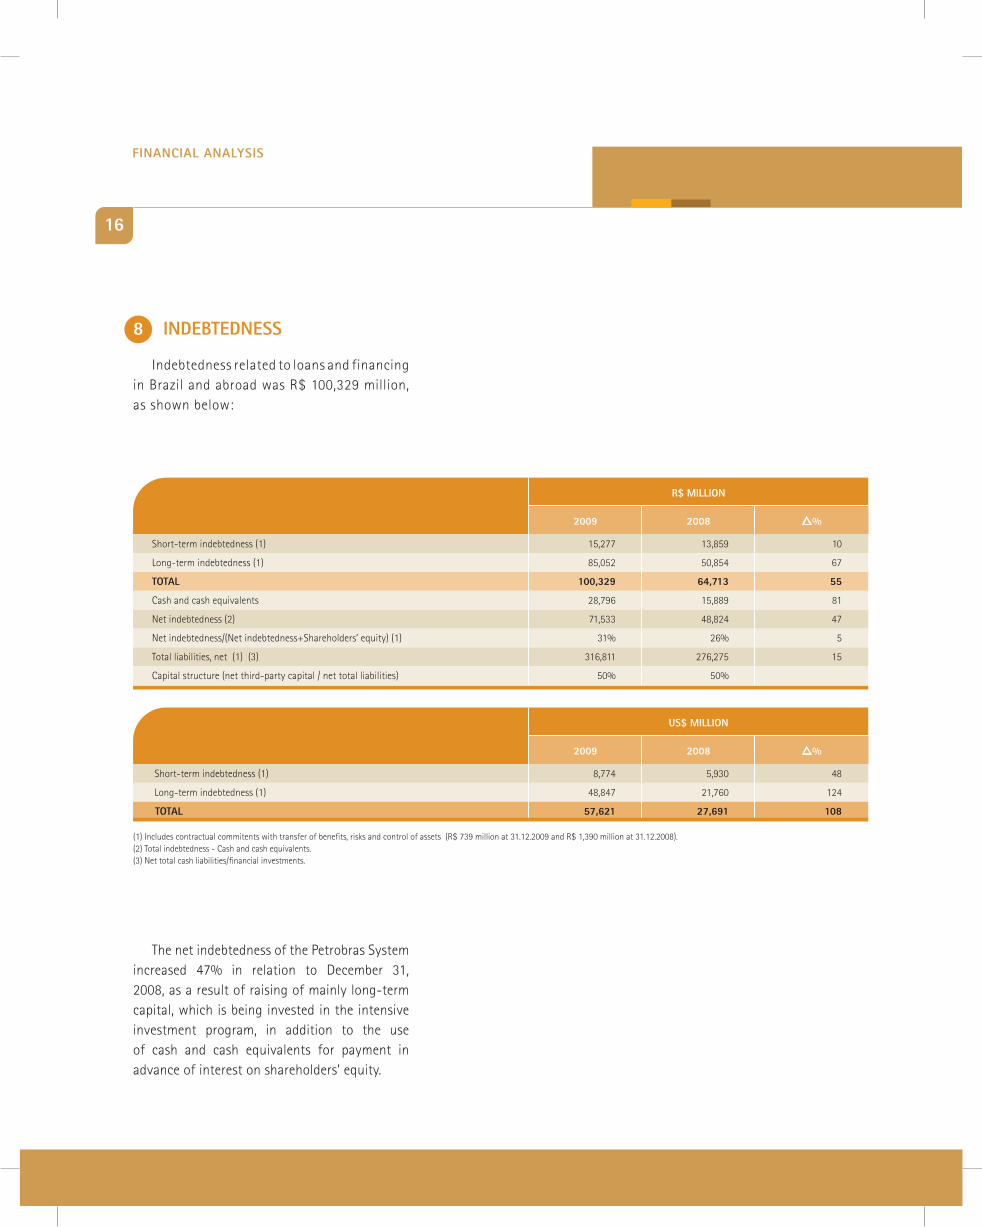
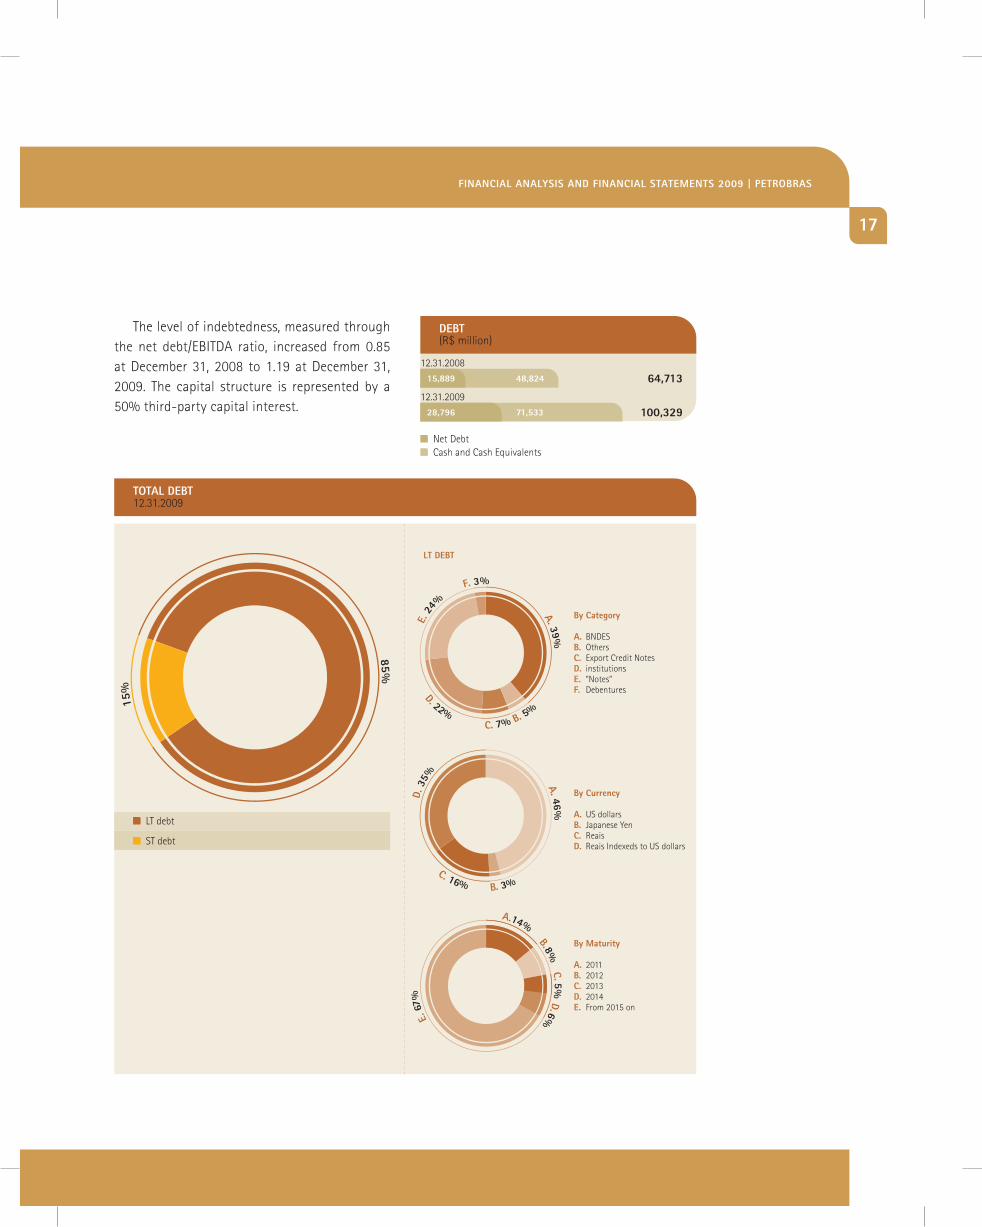
8 indeBtedness
indebtedness related to loans and financing in brazil and abroad was r$ 100,329 million, as shown below:
the net indebtedness of the petrobras System increased 47% in relation to december 31, 2008, as a result of raising of mainly long-term capital, which is being invested in the intensive investment program, in addition to the use of cash and cash equivalents for payment in advance of interest on shareholders’ equity.
R$ milliOn
Short-term indebtedness (1) 15,277 13,859 10
long-term indebtedness (1) 85,052 50,854 67
tOtal 100,329 64,713 55
cash and cash equivalents 28,796 15,889 81
net indebtedness (2) 71,533 48,824 47
net indebtedness/(net indebtedness+Shareholders’ equity) (1) 31% 26% 5
total liabilities, net (1) (3) 316,811 276,275 15
capital structure (net third-party capital / net total liabilities) 50% 50%
r%20082009
Us$ milliOn
Short-term indebtedness (1) 8,774 5,930 48
long-term indebtedness (1) 48,847 21,760 124
tOtal 57,621 27,691 108
r%20082009
(1) includes contractual commitents with transfer of benefits, risks and control of assets (r$ 739 million at 31.12.2009 and r$ 1,390 million at 31.12.2008).(2) total indebtedness - cash and cash equivalents.(3) net total cash liabilities/financial investments.
16 17
Financial analysis
tOtal deBt12.31.2009
lt debt
St debt
By category
a. bndESB. othersc. Export credit notesd. institutionse. “notes”F. debentures
By currency
a. uS dollarsB. japanese yenc. reaisd. reais indexeds to uS dollars
By maturity
a. 2011B. 2012c. 2013d. 2014e. From 2015 on
lt deBt
deBt(r$ million)
64,713
100,329
12.31.2008
12.31.2009
15,889
28,796
48,824
71,533
net debtcash and cash Equivalents
the level of indebtedness, measured through the net debt/Ebitda ratio, increased from 0.85 at december 31, 2008 to 1.19 at december 31, 2009. the capital structure is represented by a 50% third-party capital interest.
Financial analysis And Financial statements 2009 | PetROBRas
18 19
Financial analysis
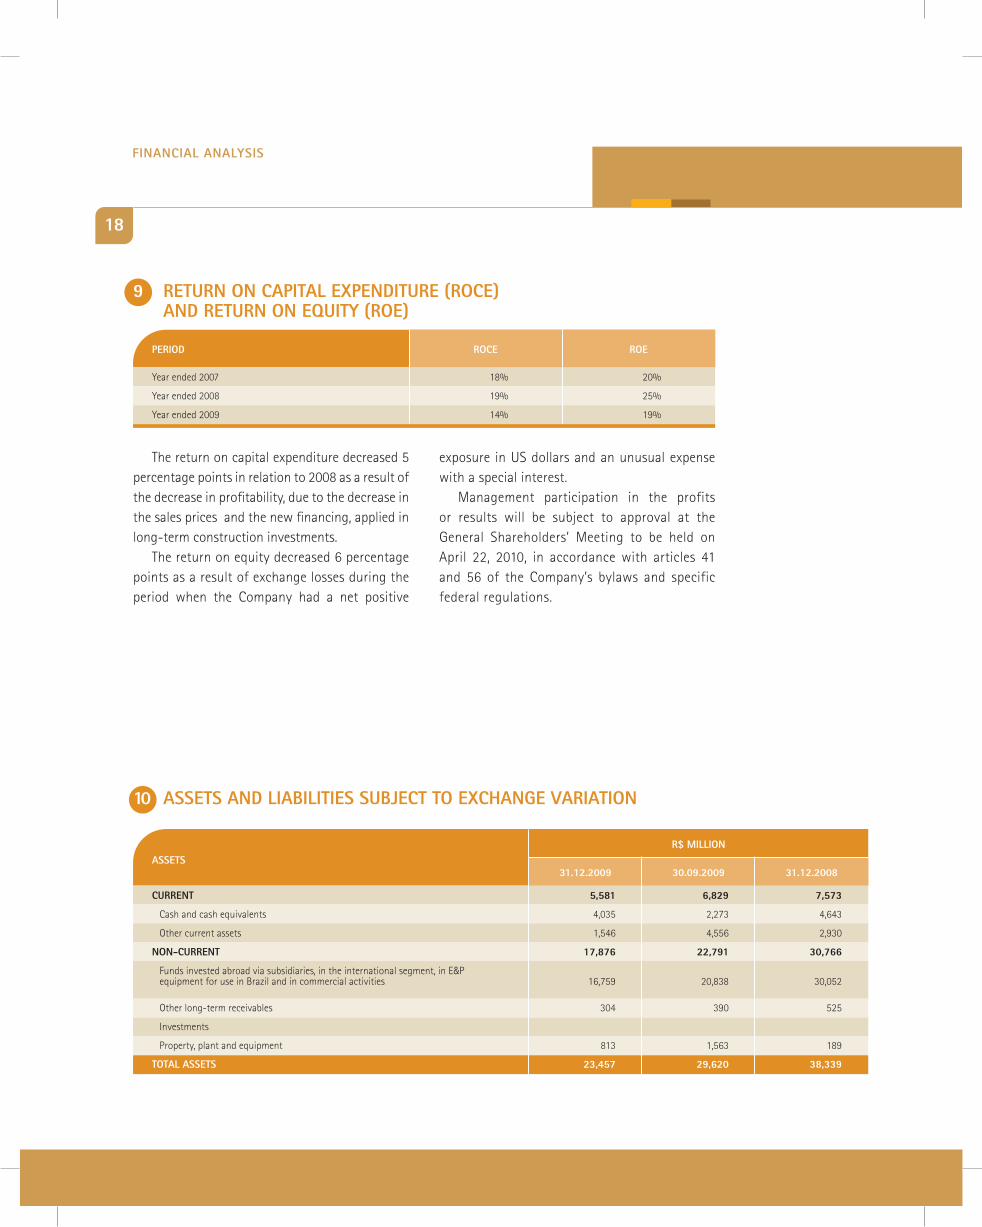
9 RetURn On caPital exPenditURe (ROce) and RetURn On eqUity (ROe)
10 assets and liaBilities sUBject tO exchange VaRiatiOn
year ended 2007 18% 20%
year ended 2008 19% 25%
year ended 2009 14% 19%
ROce ROePeRiOd
the return on capital expenditure decreased 5 percentage points in relation to 2008 as a result of the decrease in profitability, due to the decrease in the sales prices and the new financing, applied in long-term construction investments.
the return on equity decreased 6 percentage points as a result of exchange losses during the period when the company had a net positive
exposure in uS dollars and an unusual expense with a special interest.
management participation in the profits or results will be subject to approval at the general Shareholders’ meeting to be held on april 22, 2010, in accordance with articles 41 and 56 of the company’s bylaws and specific federal regulations.
R$ milliOn
cURRent 5,581 6,829 7,573
cash and cash equivalents 4,035 2,273 4,643
other current assets 1,546 4,556 2,930
nOn-cURRent 17,876 22,791 30,766
Funds invested abroad via subsidiaries, in the international segment, in E&p equipment for use in brazil and in commercial activities 16,759 20,838 30,052
other long-term receivables 304 390 525
investments
property, plant and equipment 813 1,563 189
tOtal assets 23,457 29,620 38,339
31.12.200830.09.200931.12.2009assets
18 19
Financial analysis
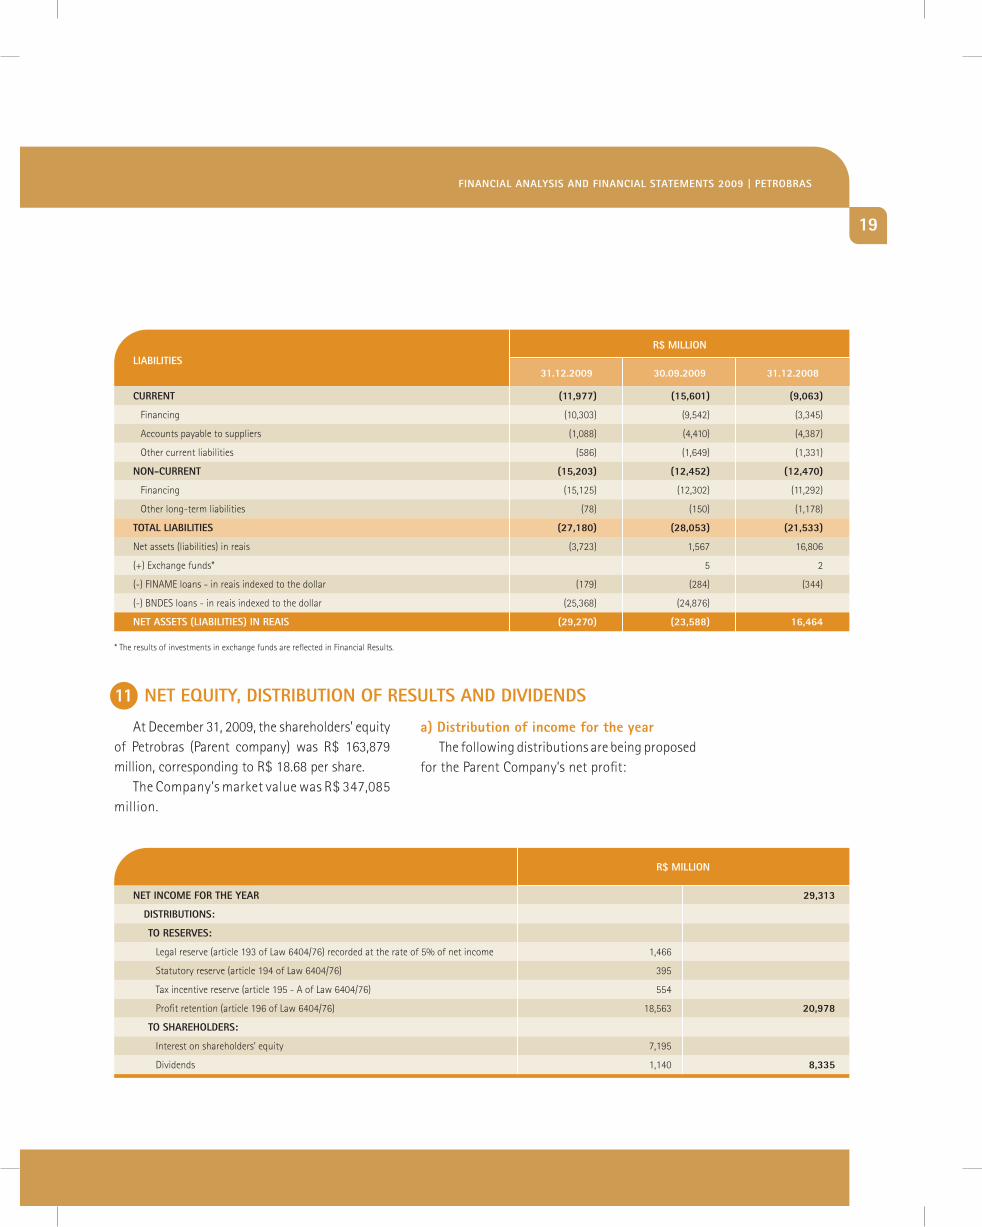
11 net eqUity, distRiBUtiOn OF ResUlts and diVidends
at december 31, 2009, the shareholders’ equity of petrobras (parent company) was r$ 163,879 million, corresponding to r$ 18.68 per share.
the company’s market value was r$ 347,085 million.
R$ milliOn
cURRent (11,977) (15,601) (9,063)
Financing (10,303) (9,542) (3,345)
accounts payable to suppliers (1,088) (4,410) (4,387)
other current liabilities (586) (1,649) (1,331)
nOn-cURRent (15,203) (12,452) (12,470)
Financing (15,125) (12,302) (11,292)
other long-term liabilities (78) (150) (1,178)
tOtal liaBilities (27,180) (28,053) (21,533)
net assets (liabilities) in reais (3,723) 1,567 16,806
(+) Exchange funds* 5 2
(-) FinamE loans - in reais indexed to the dollar (179) (284) (344)
(-) bndES loans - in reais indexed to the dollar (25,368) (24,876)
net assets (liaBilities) in Reais (29,270) (23,588) 16,464
31.12.200830.09.200931.12.2009liaBilities
* the results of investments in exchange funds are reflected in Financial results.
net incOme FOR the yeaR 29,313
distRiBUtiOns:
tO ReseRVes:
legal reserve (article 193 of law 6404/76) recorded at the rate of 5% of net income 1,466
Statutory reserve (article 194 of law 6404/76) 395
tax incentive reserve (article 195 - a of law 6404/76) 554
profit retention (article 196 of law 6404/76) 18,563 20,978
tO shaRehOldeRs:
interest on shareholders’ equity 7,195
dividends 1,140 8,335
R$ milliOn
a) distribution of income for the yearthe following distributions are being proposed
for the parent company’s net profit:
Financial analysis And Financial statements 2009 | PetROBRas
20 21
Financial analysis
b) capital increasethe capitalization of part of the profit reserves
in the amount of r$ 5,627 million is being proposed to the Special general Shareholders’ meeting on april 22, 2010, of which r$ 899 million is from the statutory reserve and r$ 4,713 million is from the profit retention reserve, pursuant to article 199, of law 6404/76, and r$ 15 million is from part of the tax incentive reserve formed in 2009, in compliance with article 35, paragraph 1, of ordinance 2091/07 of the government ministry of national integration and from capital reserves in the amount of r$ 515 million, without issuing new shares, increasing the capital from r$ 78,967 million to r$ 85,109 million, pursuant to article 169, paragraph 1, of law 6404/76.
c) Proposal for Profit Retentionin the general Shareholders’ meeting to be
held on april 22, 2010, a profit retention of
r$ 18,573 million is being proposed, and the portion of r$ 18,563 million, originating from the income for 2008 and r$ 10 million from the remaining balance of income originating from prior years, which is earmarked to partially meet the company’s annual investment program, established in the capital budget for 2010, is also to be decided in the general Shareholders’ meeting.
d) shareholders’ Remuneration
the board of directors of petrobras, based on statutory provisions, is proposing to the general Shareholders’ meeting to be held on april 22, 2010, the distribution of a dividend related to 2009 in the amount of r$ 8,335 million, corresponding to 30.53% of the basic profit for purposes of a dividend equivalent to r$ 0.95 per common and preferred share, without distinction, as presented below:
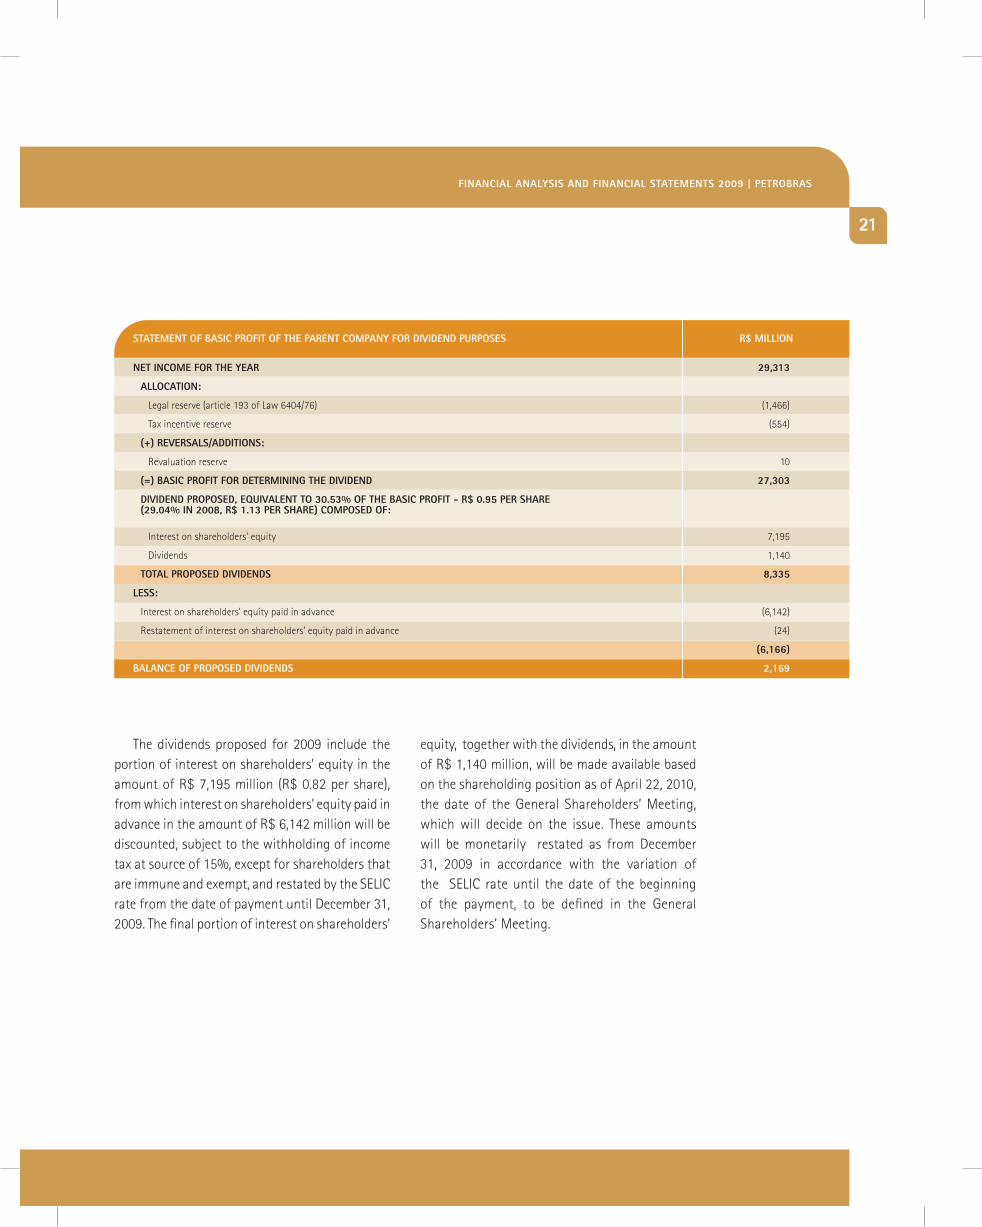
the dividends proposed for 2009 include the portion of interest on shareholders’ equity in the amount of r$ 7,195 million (r$ 0.82 per share), from which interest on shareholders’ equity paid in advance in the amount of r$ 6,142 million will be discounted, subject to the withholding of income tax at source of 15%, except for shareholders that are immune and exempt, and restated by the SElic rate from the date of payment until december 31, 2009. the final portion of interest on shareholders’
20 21
Financial analysis
net incOme FOR the yeaR 29,313
allOcatiOn:
legal reserve (article 193 of law 6404/76) (1,466)
tax incentive reserve (554)
(+) ReVeRsals/additiOns:
revaluation reserve 10
(=) Basic PROFit FOR deteRmining the diVidend 27,303
diVidend PROPOsed, eqUiValent tO 30.53% OF the Basic PROFit - R$ 0.95 PeR shaRe (29.04% in 2008, R$ 1.13 PeR shaRe) cOmPOsed OF:
interest on shareholders’ equity 7,195
dividends 1,140
tOtal PROPOsed diVidends 8,335
less:
interest on shareholders’ equity paid in advance (6,142)
restatement of interest on shareholders’ equity paid in advance (24)
(6,166)
Balance OF PROPOsed diVidends 2,169
R$ milliOnstatement OF Basic PROFit OF the PaRent cOmPany FOR diVidend PURPOses
equity, together with the dividends, in the amount of r$ 1,140 million, will be made available based on the shareholding position as of april 22, 2010, the date of the general Shareholders’ meeting, which will decide on the issue. these amounts will be monetarily restated as from december 31, 2009 in accordance with the variation of the SElic rate until the date of the beginning of the payment, to be defined in the general Shareholders’ meeting.
Financial analysis And Financial statements 2009 | PetROBRas
6600
1900
800
7300
Financial statements
Financial analysis And Financial statements 2009 | PetROBRas
24
independent Auditors’ ReportFinancial statements
tothe board of directors and Shareholders ofpetróleo brasileiro S.a. - petrobrasrio de janeiro - rj
1. We have examined the accompanying balance sheets of petróleo brasileiro S.a. - petrobras (“the company”) and the consolidated balance sheets of the company and its subsidiaries as of december 31, 2009 and 2008, and the related statements of income, changes in shareholders’ equity, cash flows and added value for the years then ended, which are the responsibility of its management. our responsibility is to express an opinion on these financial statements.
2. our examinations were conducted in accordance with auditing standards generally accepted in brazil and included: a) planning of the audit work, considering the materiality of the balances, the volume of transactions and the accounting systems and internal controls of the company and its subsidiaries; b) verification, on a test basis, of the evidence and records which support the amounts and accounting information disclosed; and c) evaluation of the most significant accounting policies and estimates adopted by company management and its subsidiaries, as well as the presentation of financial statements taken as a whole.
3. in our opinion, the aforementioned financial statements present fairly, in all material respects, the financial position of petróleo brasileiro S.a. - petrobras and the consolidated financial position of the company and its subsidiaries as of december 31, 2009 and
25
2008, the results of its operations, changes in shareholders’ equity, cash flows and added value for the years then ended, in conformity with accounting practices adopted in brazil.
4. our examinations were performed with the
objective of expressing an opinion on the aforementioned financial statements, taken as a whole. the statements of segmentation of business and the accounting information included on social balance sheet, for the years ended december 31, 2009 and 2008, are supplementary to the aforementioned financial statements, are not required by accounting practices adopted in brazil and have been included to facilitate additional
analysis. these supplementary information were subject to the same audit procedures applied to the financial statements and in our opinion are presented fairly, in all material respects, in relation to the financial statements referred to in the first paragraph, taken as a whole.
rio de janeiro, march 19, 2010
KPmg auditores independentescrc Sp-014428/o-6 F-rj
manuel Fernandes Rodrigues de sousaaccountant crc-rj-052428/o-2
Financial analysis And Financial statements 2009 | PetROBRas
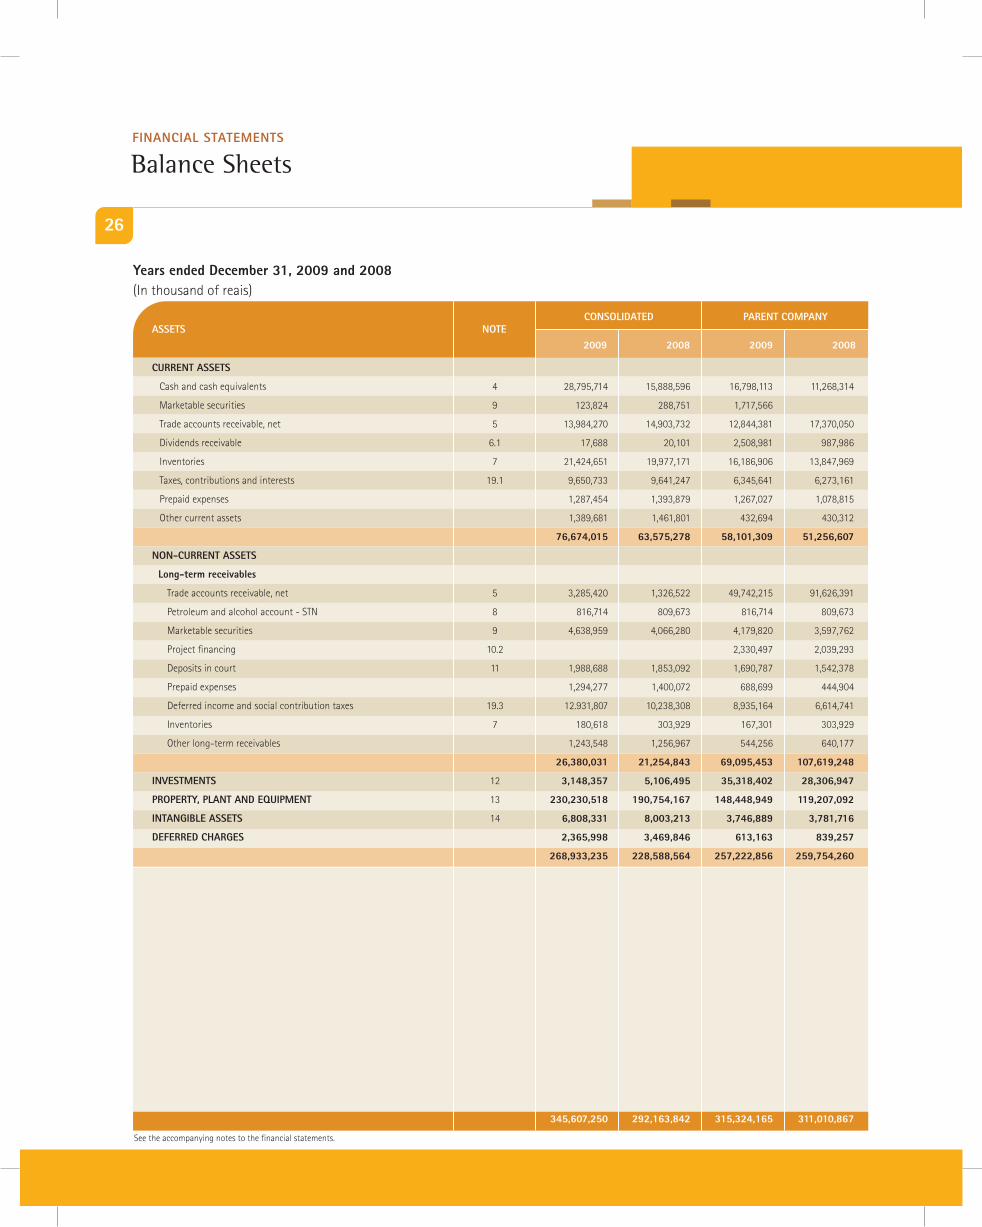
cOnsOlidated
cURRent assets
cash and cash equivalents 4 28,795,714 15,888,596 16,798,113 11,268,314
marketable securities 9 123,824 288,751 1,717,566
trade accounts receivable, net 5 13,984,270 14,903,732 12,844,381 17,370,050
dividends receivable 6.1 17,688 20,101 2,508,981 987,986
inventories 7 21,424,651 19,977,171 16,186,906 13,847,969
taxes, contributions and interests 19.1 9,650,733 9,641,247 6,345,641 6,273,161
prepaid expenses 1,287,454 1,393,879 1,267,027 1,078,815
other current assets 1,389,681 1,461,801 432,694 430,312
76,674,015 63,575,278 58,101,309 51,256,607
nOn-cURRent assets
long-term receivables
trade accounts receivable, net 5 3,285,420 1,326,522 49,742,215 91,626,391
petroleum and alcohol account - Stn 8 816,714 809,673 816,714 809,673
marketable securities 9 4,638,959 4,066,280 4,179,820 3,597,762
project financing 10.2 2,330,497 2,039,293
deposits in court 11 1,988,688 1,853,092 1,690,787 1,542,378
prepaid expenses 1,294,277 1,400,072 688,699 444,904
deferred income and social contribution taxes 19.3 12.931,807 10,238,308 8,935,164 6,614,741
inventories 7 180,618 303,929 167,301 303,929
other long-term receivables 1,243,548 1,256,967 544,256 640,177
26,380,031 21,254,843 69,095,453 107,619,248
inVestments 12 3,148,357 5,106,495 35,318,402 28,306,947
PROPeRty, Plant and eqUiPment 13 230,230,518 190,754,167 148,448,949 119,207,092
intangiBle assets 14 6,808,331 8,003,213 3,746,889 3,781,716
deFeRRed chaRges 2,365,998 3,469,846 613,163 839,257
268,933,235 228,588,564 257,222,856 259,754,260
345,607,250 292,163,842 315,324,165 311,010,867
2009 2008 2009 2008
PaRent cOmPanynOteassets
See the accompanying notes to the financial statements.
26
Balance sheetsFinancial statements
years ended december 31, 2009 and 2008(in thousand of reais)
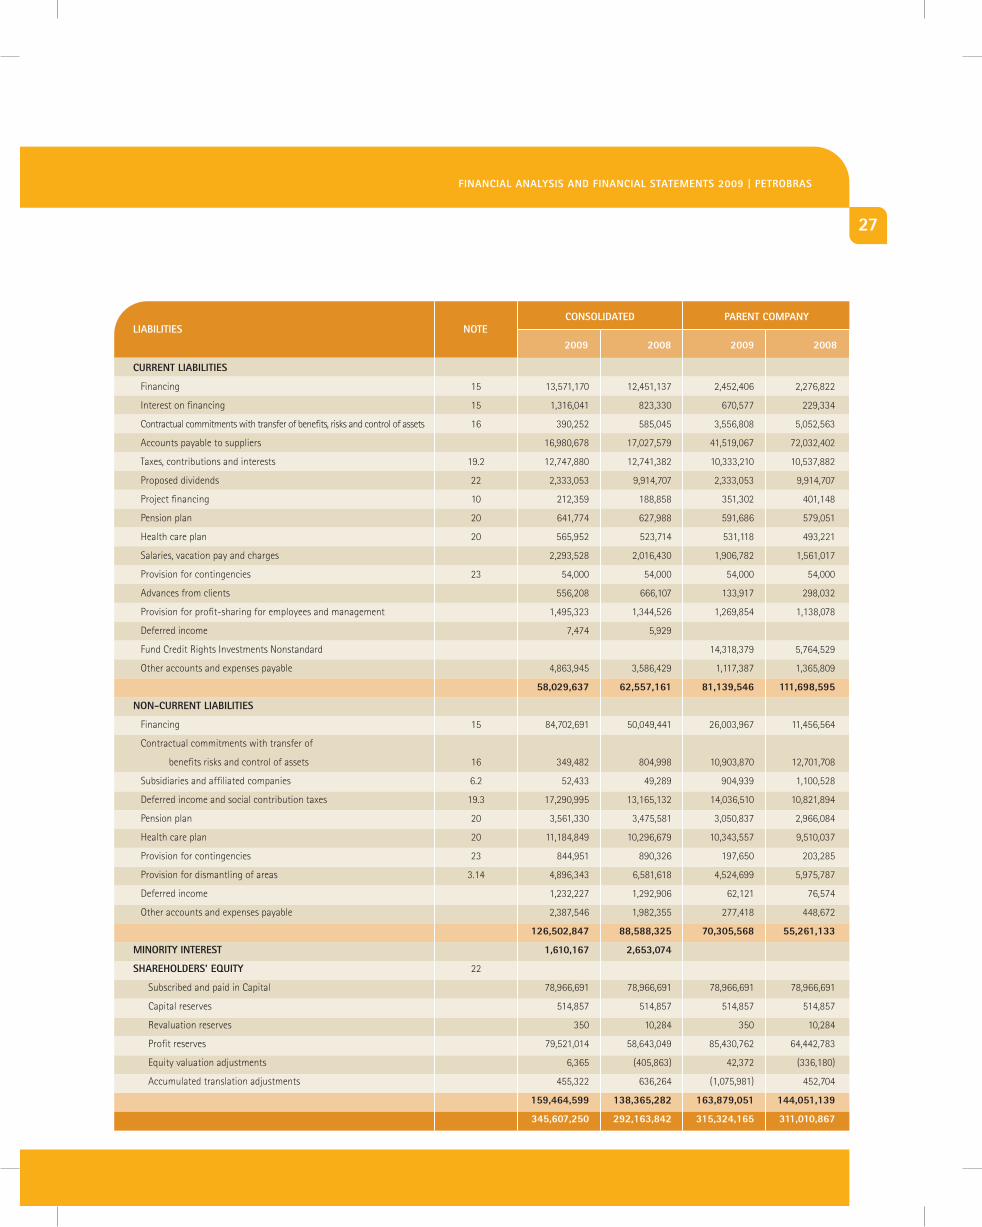
cOnsOlidated
cURRent liaBilities
Financing 15 13,571,170 12,451,137 2,452,406 2,276,822
interest on financing 15 1,316,041 823,330 670,577 229,334
contractual commitments with transfer of benefits, risks and control of assets 16 390,252 585,045 3,556,808 5,052,563
accounts payable to suppliers 16,980,678 17,027,579 41,519,067 72,032,402
taxes, contributions and interests 19.2 12,747,880 12,741,382 10,333,210 10,537,882
proposed dividends 22 2,333,053 9,914,707 2,333,053 9,914,707
project financing 10 212,359 188,858 351,302 401,148
pension plan 20 641,774 627,988 591,686 579,051
health care plan 20 565,952 523,714 531,118 493,221
Salaries, vacation pay and charges 2,293,528 2,016,430 1,906,782 1,561,017
provision for contingencies 23 54,000 54,000 54,000 54,000
advances from clients 556,208 666,107 133,917 298,032
provision for profit-sharing for employees and management 1,495,323 1,344,526 1,269,854 1,138,078
deferred income 7,474 5,929
Fund credit rights investments nonstandard 14,318,379 5,764,529
other accounts and expenses payable 4,863,945 3,586,429 1,117,387 1,365,809
58,029,637 62,557,161 81,139,546 111,698,595
nOn-cURRent liaBilities
Financing 15 84,702,691 50,049,441 26,003,967 11,456,564
contractual commitments with transfer of
benefits risks and control of assets 16 349,482 804,998 10,903,870 12,701,708
Subsidiaries and affiliated companies 6.2 52,433 49,289 904,939 1,100,528
deferred income and social contribution taxes 19.3 17,290,995 13,165,132 14,036,510 10,821,894
pension plan 20 3,561,330 3,475,581 3,050,837 2,966,084
health care plan 20 11,184,849 10,296,679 10,343,557 9,510,037
provision for contingencies 23 844,951 890,326 197,650 203,285
provision for dismantling of areas 3.14 4,896,343 6,581,618 4,524,699 5,975,787
deferred income 1,232,227 1,292,906 62,121 76,574
other accounts and expenses payable 2,387,546 1,982,355 277,418 448,672
126,502,847 88,588,325 70,305,568 55,261,133
minORity inteRest 1,610,167 2,653,074
shaRehOldeRs’ eqUity 22
Subscribed and paid in capital 78,966,691 78,966,691 78,966,691 78,966,691
capital reserves 514,857 514,857 514,857 514,857
revaluation reserves 350 10,284 350 10,284
profit reserves 79,521,014 58,643,049 85,430,762 64,442,783
Equity valuation adjustments 6,365 (405,863) 42,372 (336,180)
accumulated translation adjustments 455,322 636,264 (1,075,981) 452,704
159,464,599 138,365,282 163,879,051 144,051,139
345,607,250 292,163,842 315,324,165 311,010,867
2009 2008 2009 2008
PaRent cOmPanynOteliaBilities
27
Financial analysis And Financial statements 2009 | PetROBRas
28
See the accompanying notes to the financial statements.
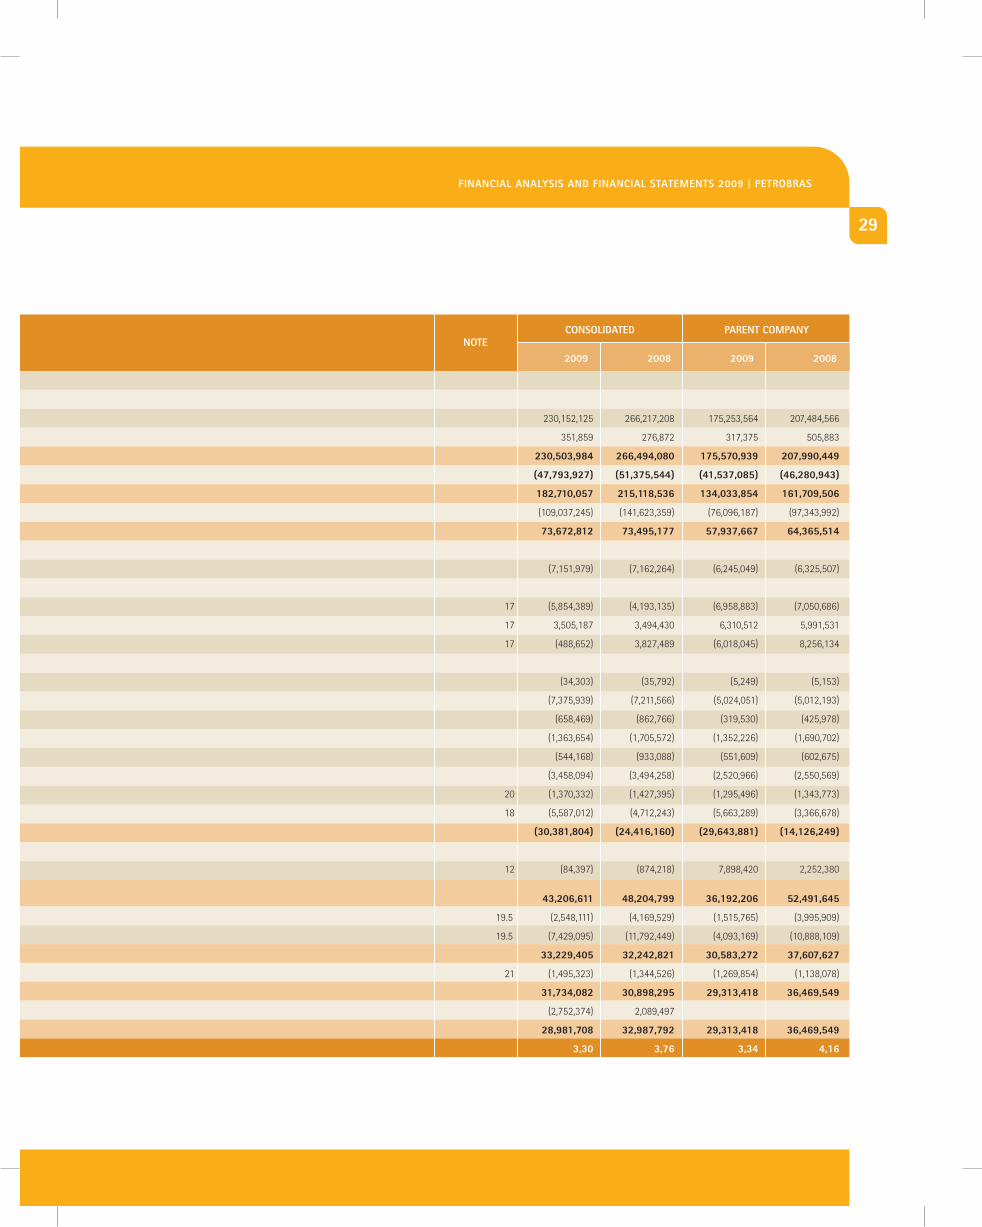
years ended december 31, 2009 and 2008(in thousand of reais, except net income per share at paid-up capital)
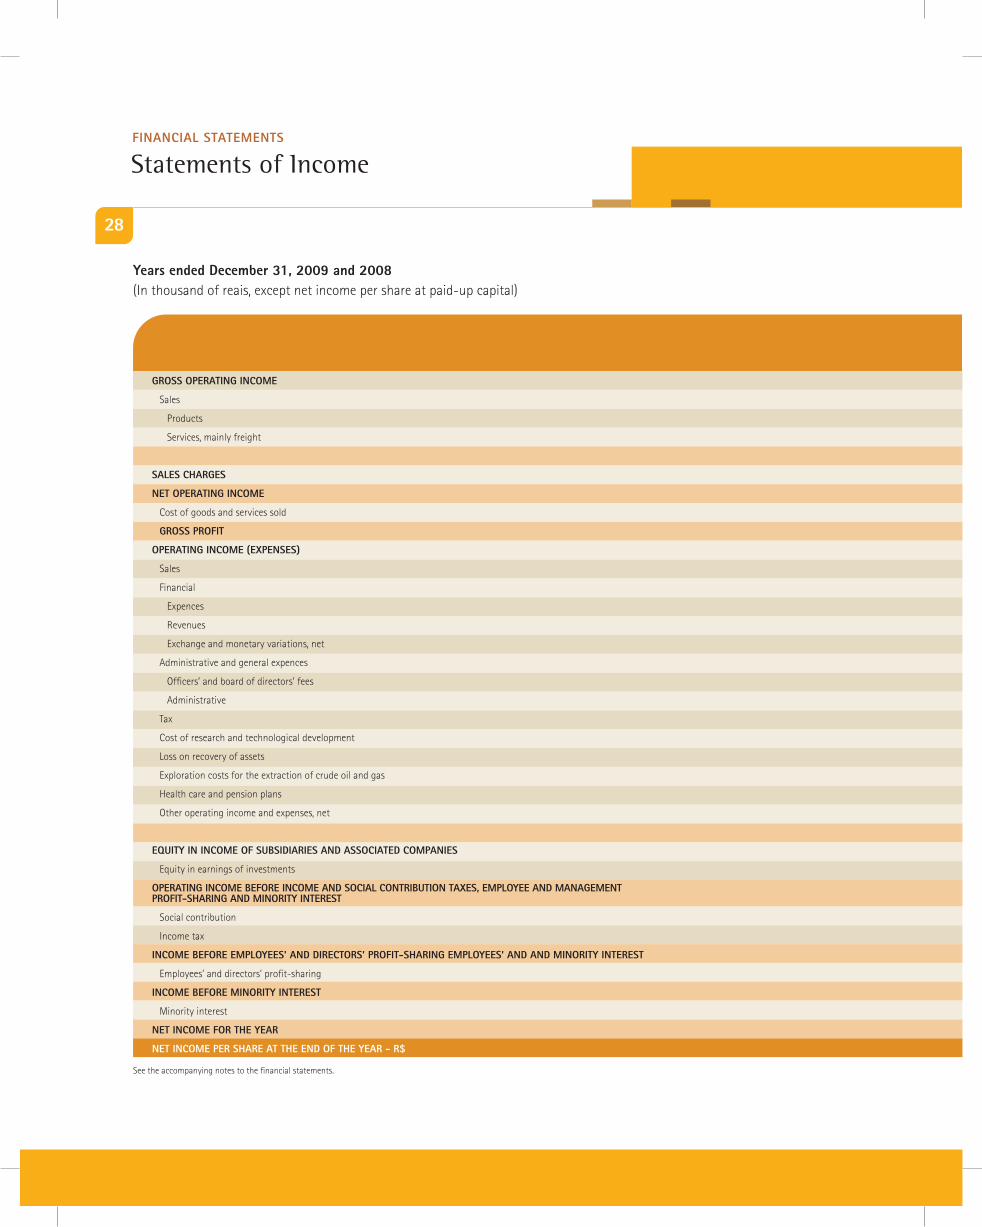
gROss OPeRating incOme
Sales
products 230,152,125 266,217,208 175,253,564 207,484,566
Services, mainly freight 351,859 276,872 317,375 505,883
230,503,984 266,494,080 175,570,939 207,990,449
sales chaRges (47,793,927) (51,375,544) (41,537,085) (46,280,943)
net OPeRating incOme 182,710,057 215,118,536 134,033,854 161,709,506
cost of goods and services sold (109,037,245) (141,623,359) (76,096,187) (97,343,992)
gROss PROFit 73,672,812 73,495,177 57,937,667 64,365,514
OPeRating incOme (exPenses)
Sales (7,151,979) (7,162,264) (6,245,049) (6,325,507)
Financial
Expences 17 (5,854,389) (4,193,135) (6,958,883) (7,050,686)
revenues 17 3,505,187 3,494,430 6,310,512 5,991,531
Exchange and monetary variations, net 17 (488,652) 3,827,489 (6,018,045) 8,256,134
administrative and general expences
officers’ and board of directors’ fees (34,303) (35,792) (5,249) (5,153)
administrative (7,375,939) (7,211,566) (5,024,051) (5,012,193)
tax (658,469) (862,766) (319,530) (425,978)
cost of research and technological development (1,363,654) (1,705,572) (1,352,226) (1,690,702)
loss on recovery of assets (544,168) (933,088) (551,609) (602,675)
Exploration costs for the extraction of crude oil and gas (3,458,094) (3,494,258) (2,520,966) (2,550,569)
health care and pension plans 20 (1,370,332) (1,427,395) (1,295,496) (1,343,773)
other operating income and expenses, net 18 (5,587,012) (4,712,243) (5,663,289) (3,366,678)
(30,381,804) (24,416,160) (29,643,881) (14,126,249)
eqUity in incOme OF sUBsidiaRies and assOciated cOmPanies
Equity in earnings of investments 12 (84,397) (874,218) 7,898,420 2,252,380
OPeRating incOme BeFORe incOme and sOcial cOntRiBUtiOn taxes, emPlOyee and management PROFit-shaRing and minORity inteRest 43,206,611 48,204,799 36,192,206 52,491,645
Social contribution 19.5 (2,548,111) (4,169,529) (1,515,765) (3,995,909)
income tax 19.5 (7,429,095) (11,792,449) (4,093,169) (10,888,109)
incOme BeFORe emPlOyees’ and diRectORs’ PROFit-shaRing emPlOyees’ and and minORity inteRest 33,229,405 32,242,821 30,583,272 37,607,627
Employees’ and directors’ profit-sharing 21 (1,495,323) (1,344,526) (1,269,854) (1,138,078)
incOme BeFORe minORity inteRest 31,734,082 30,898,295 29,313,418 36,469,549
minority interest (2,752,374) 2,089,497
net incOme FOR the yeaR 28,981,708 32,987,792 29,313,418 36,469,549
net incOme PeR shaRe at the end OF the yeaR - R$ 3,30 3,76 3,34 4,16
statements of incomeFinancial statements
29
cOnsOlidated
2009 2008 2009 2008
PaRent cOmPanynOte
Financial analysis And Financial statements 2009 | PetROBRas
gROss OPeRating incOme
Sales
products 230,152,125 266,217,208 175,253,564 207,484,566
Services, mainly freight 351,859 276,872 317,375 505,883
230,503,984 266,494,080 175,570,939 207,990,449
sales chaRges (47,793,927) (51,375,544) (41,537,085) (46,280,943)
net OPeRating incOme 182,710,057 215,118,536 134,033,854 161,709,506
cost of goods and services sold (109,037,245) (141,623,359) (76,096,187) (97,343,992)
gROss PROFit 73,672,812 73,495,177 57,937,667 64,365,514
OPeRating incOme (exPenses)
Sales (7,151,979) (7,162,264) (6,245,049) (6,325,507)
Financial
Expences 17 (5,854,389) (4,193,135) (6,958,883) (7,050,686)
revenues 17 3,505,187 3,494,430 6,310,512 5,991,531
Exchange and monetary variations, net 17 (488,652) 3,827,489 (6,018,045) 8,256,134
administrative and general expences
officers’ and board of directors’ fees (34,303) (35,792) (5,249) (5,153)
administrative (7,375,939) (7,211,566) (5,024,051) (5,012,193)
tax (658,469) (862,766) (319,530) (425,978)
cost of research and technological development (1,363,654) (1,705,572) (1,352,226) (1,690,702)
loss on recovery of assets (544,168) (933,088) (551,609) (602,675)
Exploration costs for the extraction of crude oil and gas (3,458,094) (3,494,258) (2,520,966) (2,550,569)
health care and pension plans 20 (1,370,332) (1,427,395) (1,295,496) (1,343,773)
other operating income and expenses, net 18 (5,587,012) (4,712,243) (5,663,289) (3,366,678)
(30,381,804) (24,416,160) (29,643,881) (14,126,249)
eqUity in incOme OF sUBsidiaRies and assOciated cOmPanies
Equity in earnings of investments 12 (84,397) (874,218) 7,898,420 2,252,380
OPeRating incOme BeFORe incOme and sOcial cOntRiBUtiOn taxes, emPlOyee and management PROFit-shaRing and minORity inteRest 43,206,611 48,204,799 36,192,206 52,491,645
Social contribution 19.5 (2,548,111) (4,169,529) (1,515,765) (3,995,909)
income tax 19.5 (7,429,095) (11,792,449) (4,093,169) (10,888,109)
incOme BeFORe emPlOyees’ and diRectORs’ PROFit-shaRing emPlOyees’ and and minORity inteRest 33,229,405 32,242,821 30,583,272 37,607,627
Employees’ and directors’ profit-sharing 21 (1,495,323) (1,344,526) (1,269,854) (1,138,078)
incOme BeFORe minORity inteRest 31,734,082 30,898,295 29,313,418 36,469,549
minority interest (2,752,374) 2,089,497
net incOme FOR the yeaR 28,981,708 32,987,792 29,313,418 36,469,549
net incOme PeR shaRe at the end OF the yeaR - R$ 3,30 3,76 3,34 4,16
30
years ended december 31, 2009 and 2008(in thousand of reais)
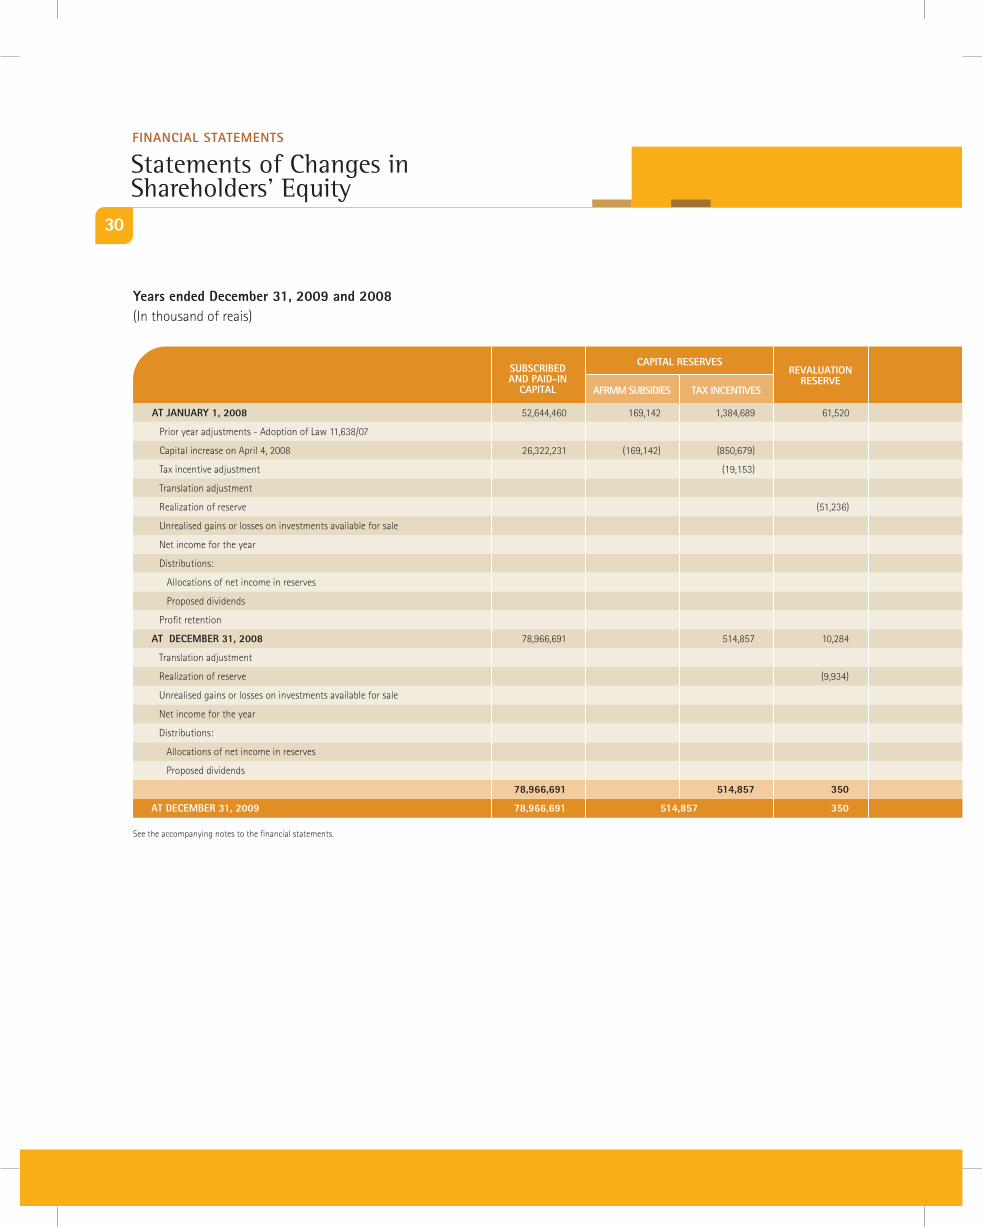
statements of changes in shareholders’ equity
Financial statements
caPital ReseRVes
at janUaRy 1, 2008 52,644,460 169,142 1,384,689 61,520 7,612,508 504,542 53,635,374 116,012,235
prior year adjustments - adoption of law 11,638/07 1,386,691 1,386,691
capital increase on april 4, 2008 26,322,231 (169,142) (850,679) (25,302,410)
tax incentive adjustment (19,153) (19,153)
translation adjustment 452,704 452,704
realization of reserve (51,236) 51,236
unrealised gains or losses on investments available for sale (336,180) (336,180)
net income for the year 36,469,549 36,469,549
distributions:
allocations of net income in reserves 1,823,477 394,834 557,185 23,779,347 (26,554,843)
proposed dividends (9,914,707) (9,914,707)
profit retention 1,437,926 (1,437,926)
at decemBeR 31, 2008 78,966,691 514,857 10,284 9,435,985 899,376 557,185 53,550,237 (336,180) 452,704 144,051,139
translation adjustment (1,528,685) (1,528,685)
realization of reserve (9,934) 9,934
unrealised gains or losses on investments available for sale 378,552 378,552
net income for the year 29,313,418 29,313,418
distributions:
allocations of net income in reserves 1,465,671 394,834 554,447 18,573,027 (20,987,979)
proposed dividends (8,335,373) (8,335,373)
78,966,691 514,857 350 10,901,656 1,294,210 1,111,632 72,123,264 42,372 (1,075,981) 163,879,051
at decemBeR 31, 2009 78,966,691 514,857 350 85,430,762 42,372 (1,075,981) 163,879,051
aFRmm sUBsidies tax incentiVes
ReValUatiOnReseRVe
sUBscRiBed and Paid-in
caPital
See the accompanying notes to the financial statements.
31
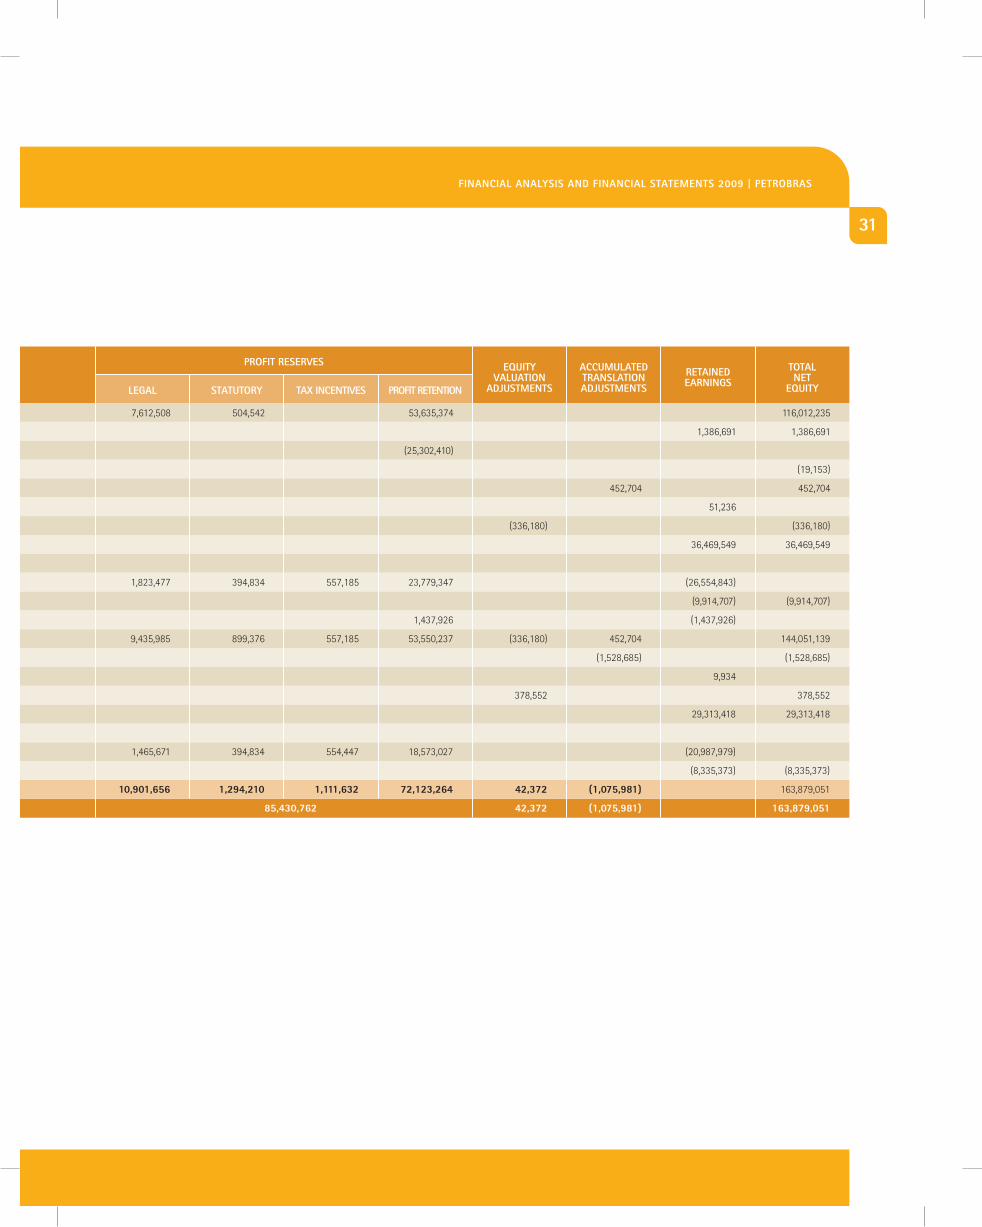
PROFit ReseRVes
legal statUtORy tax incentiVes PROFit RetentiOn
eqUityValUatiOn
adjUstments
accUmUlatedtRanslatiOnadjUstments
RetainedeaRnings
tOtalnet
eqUity
Financial analysis And Financial statements 2009 | PetROBRas
at janUaRy 1, 2008 52,644,460 169,142 1,384,689 61,520 7,612,508 504,542 53,635,374 116,012,235
prior year adjustments - adoption of law 11,638/07 1,386,691 1,386,691
capital increase on april 4, 2008 26,322,231 (169,142) (850,679) (25,302,410)
tax incentive adjustment (19,153) (19,153)
translation adjustment 452,704 452,704
realization of reserve (51,236) 51,236
unrealised gains or losses on investments available for sale (336,180) (336,180)
net income for the year 36,469,549 36,469,549
distributions:
allocations of net income in reserves 1,823,477 394,834 557,185 23,779,347 (26,554,843)
proposed dividends (9,914,707) (9,914,707)
profit retention 1,437,926 (1,437,926)
at decemBeR 31, 2008 78,966,691 514,857 10,284 9,435,985 899,376 557,185 53,550,237 (336,180) 452,704 144,051,139
translation adjustment (1,528,685) (1,528,685)
realization of reserve (9,934) 9,934
unrealised gains or losses on investments available for sale 378,552 378,552
net income for the year 29,313,418 29,313,418
distributions:
allocations of net income in reserves 1,465,671 394,834 554,447 18,573,027 (20,987,979)
proposed dividends (8,335,373) (8,335,373)
78,966,691 514,857 350 10,901,656 1,294,210 1,111,632 72,123,264 42,372 (1,075,981) 163,879,051
at decemBeR 31, 2009 78,966,691 514,857 350 85,430,762 42,372 (1,075,981) 163,879,051
32
years ended december 31, 2009 and 2008(in thousand of reais)
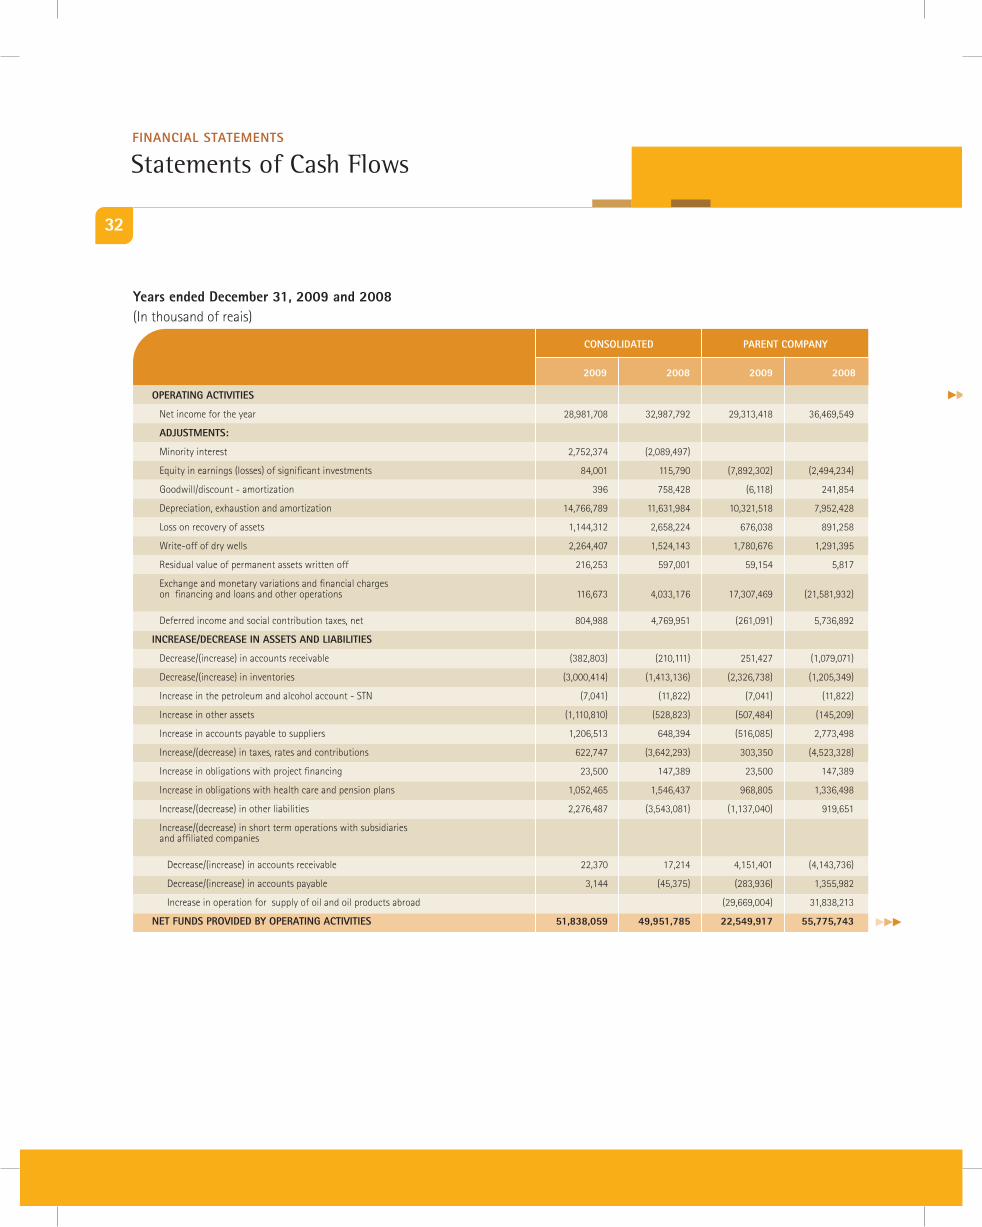
statements of cash Flows Financial statements
cOnsOlidated
OPeRating actiVities
net income for the year 28,981,708 32,987,792 29,313,418 36,469,549
adjUstments:
minority interest 2,752,374 (2,089,497)
Equity in earnings (losses) of significant investments 84,001 115,790 (7,892,302) (2,494,234)
goodwill/discount - amortization 396 758,428 (6,118) 241,854
depreciation, exhaustion and amortization 14,766,789 11,631,984 10,321,518 7,952,428
loss on recovery of assets 1,144,312 2,658,224 676,038 891,258
Write-off of dry wells 2,264,407 1,524,143 1,780,676 1,291,395
residual value of permanent assets written off 216,253 597,001 59,154 5,817
Exchange and monetary variations and financial charges on financing and loans and other operations 116,673 4,033,176 17,307,469 (21,581,932)
deferred income and social contribution taxes, net 804,988 4,769,951 (261,091) 5,736,892
incRease/decRease in assets and liaBilities
decrease/(increase) in accounts receivable (382,803) (210,111) 251,427 (1,079,071)
decrease/(increase) in inventories (3,000,414) (1,413,136) (2,326,738) (1,205,349)
increase in the petroleum and alcohol account - Stn (7,041) (11,822) (7,041) (11,822)
increase in other assets (1,110,810) (528,823) (507,484) (145,209)
increase in accounts payable to suppliers 1,206,513 648,394 (516,085) 2,773,498
increase/(decrease) in taxes, rates and contributions 622,747 (3,642,293) 303,350 (4,523,328)
increase in obligations with project financing 23,500 147,389 23,500 147,389
increase in obligations with health care and pension plans 1,052,465 1,546,437 968,805 1,336,498
increase/(decrease) in other liabilities 2,276,487 (3,543,081) (1,137,040) 919,651
increase/(decrease) in short term operations with subsidiaries and affiliated companies
decrease/(increase) in accounts receivable 22,370 17,214 4,151,401 (4,143,736)
decrease/(increase) in accounts payable 3,144 (45,375) (283,936) 1,355,982
increase in operation for supply of oil and oil products abroad (29,669,004) 31,838,213
net FUnds PROVided By OPeRating actiVities 51,838,059 49,951,785 22,549,917 55,775,743
2009 2008 2009 2008
PaRent cOmPany
33
See the accompanying notes to the financial statements.
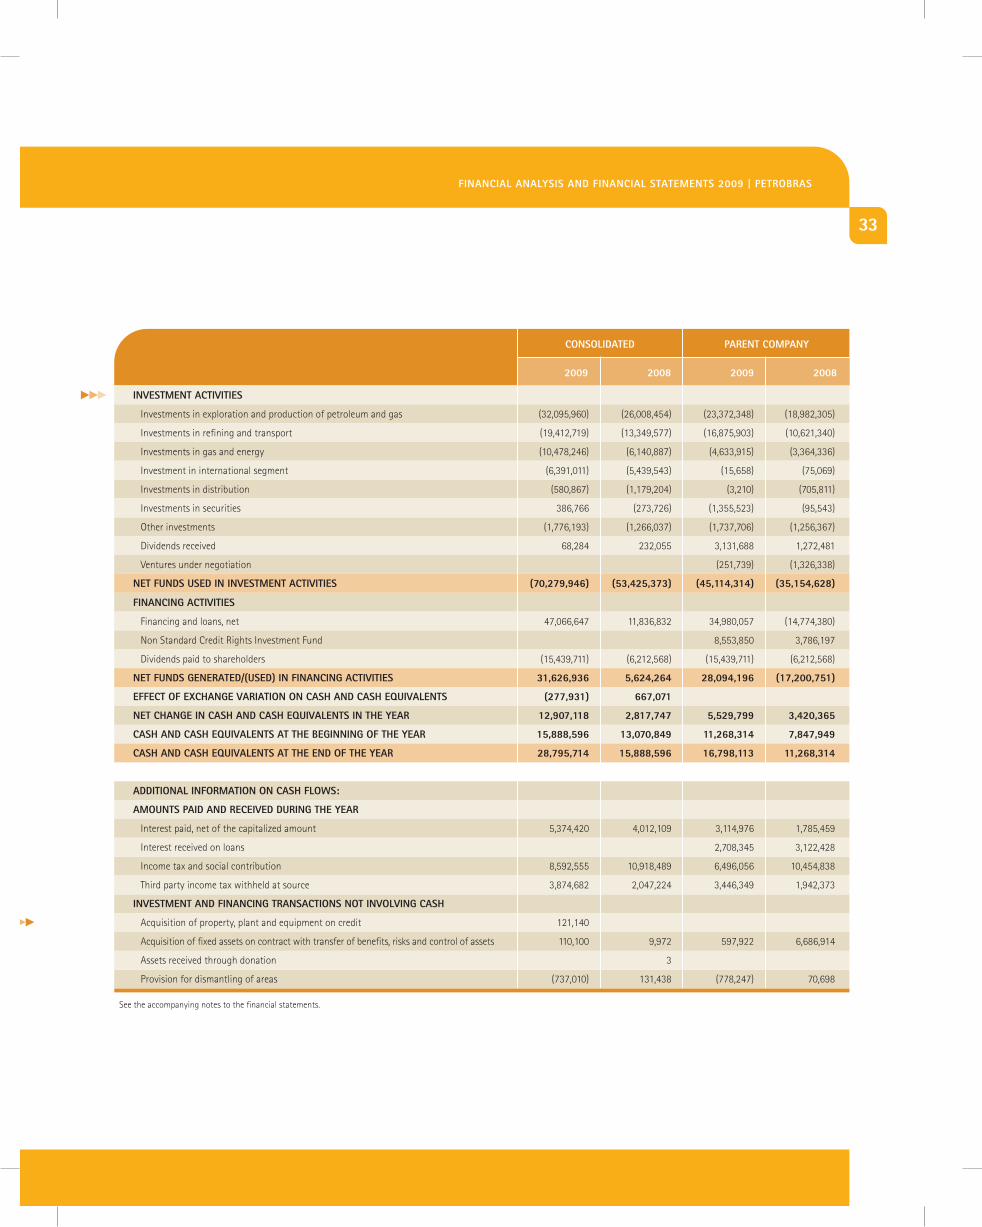
Financing actiVities
Financing and loans, net 47,066,647 11,836,832 34,980,057 (14,774,380)
non Standard credit rights investment Fund 8,553,850 3,786,197
dividends paid to shareholders (15,439,711) (6,212,568) (15,439,711) (6,212,568)
net FUnds geneRated/(Used) in Financing actiVities 31,626,936 5,624,264 28,094,196 (17,200,751)
eFFect OF exchange VaRiatiOn On cash and cash eqUiValents (277,931) 667,071
net change in cash and cash eqUiValents in the yeaR 12,907,118 2,817,747 5,529,799 3,420,365
cash and cash eqUiValents at the Beginning OF the yeaR 15,888,596 13,070,849 11,268,314 7,847,949
cash and cash eqUiValents at the end OF the yeaR 28,795,714 15,888,596 16,798,113 11,268,314
additiOnal inFORmatiOn On cash FlOws:
amOUnts Paid and ReceiVed dURing the yeaR
interest paid, net of the capitalized amount 5,374,420 4,012,109 3,114,976 1,785,459
interest received on loans 2,708,345 3,122,428
income tax and social contribution 8,592,555 10,918,489 6,496,056 10,454,838
third party income tax withheld at source 3,874,682 2,047,224 3,446,349 1,942,373
inVestment and Financing tRansactiOns nOt inVOlVing cash
acquisition of property, plant and equipment on credit 121,140
acquisition of fixed assets on contract with transfer of benefits, risks and control of assets 110,100 9,972 597,922 6,686,914
assets received through donation 3
provision for dismantling of areas (737,010) 131,438 (778,247) 70,698
cOnsOlidated
inVestment actiVities
investments in exploration and production of petroleum and gas (32,095,960) (26,008,454) (23,372,348) (18,982,305)
investments in refining and transport (19,412,719) (13,349,577) (16,875,903) (10,621,340)
investments in gas and energy (10,478,246) (6,140,887) (4,633,915) (3,364,336)
investment in international segment (6,391,011) (5,439,543) (15,658) (75,069)
investments in distribution (580,867) (1,179,204) (3,210) (705,811)
investments in securities 386,766 (273,726) (1,355,523) (95,543)
other investments (1,776,193) (1,266,037) (1,737,706) (1,256,367)
dividends received 68,284 232,055 3,131,688 1,272,481
Ventures under negotiation (251,739) (1,326,338)
net FUnds Used in inVestment actiVities (70,279,946) (53,425,373) (45,114,314) (35,154,628)
2009 2008 2009 2008
PaRent cOmPany
Financial analysis And Financial statements 2009 | PetROBRas
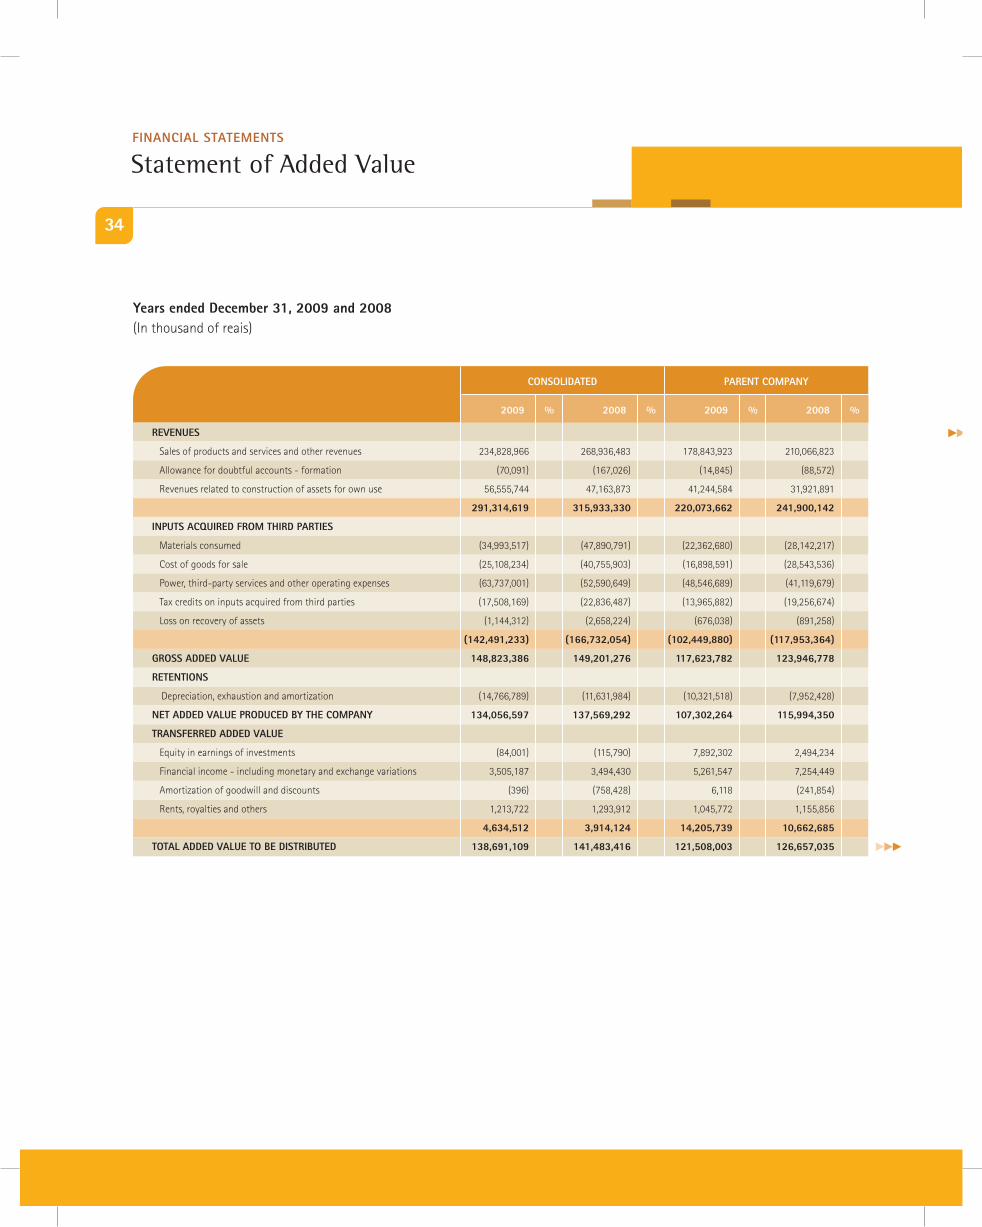
34
years ended december 31, 2009 and 2008(in thousand of reais)
statement of Added ValueFinancial statements
cOnsOlidated
ReVenUes
Sales of products and services and other revenues 234,828,966 268,936,483 178,843,923 210,066,823
allowance for doubtful accounts - formation (70,091) (167,026) (14,845) (88,572)
revenues related to construction of assets for own use 56,555,744 47,163,873 41,244,584 31,921,891
291,314,619 315,933,330 220,073,662 241,900,142
inPUts acqUiRed FROm thiRd PaRties
materials consumed (34,993,517) (47,890,791) (22,362,680) (28,142,217)
cost of goods for sale (25,108,234) (40,755,903) (16,898,591) (28,543,536)
power, third-party services and other operating expenses (63,737,001) (52,590,649) (48,546,689) (41,119,679)
tax credits on inputs acquired from third parties (17,508,169) (22,836,487) (13,965,882) (19,256,674)
loss on recovery of assets (1,144,312) (2,658,224) (676,038) (891,258)
(142,491,233) (166,732,054) (102,449,880) (117,953,364)
gROss added ValUe 148,823,386 149,201,276 117,623,782 123,946,778
RetentiOns
depreciation, exhaustion and amortization (14,766,789) (11,631,984) (10,321,518) (7,952,428)
net added ValUe PROdUced By the cOmPany 134,056,597 137,569,292 107,302,264 115,994,350
tRansFeRRed added ValUe
Equity in earnings of investments (84,001) (115,790) 7,892,302 2,494,234
Financial income - including monetary and exchange variations 3,505,187 3,494,430 5,261,547 7,254,449
amortization of goodwill and discounts (396) (758,428) 6,118 (241,854)
rents, royalties and others 1,213,722 1,293,912 1,045,772 1,155,856
4,634,512 3,914,124 14,205,739 10,662,685
tOtal added ValUe tO Be distRiBUted 138,691,109 141,483,416 121,508,003 126,657,035
2008200920082009
PaRent cOmPany
%%%%
35
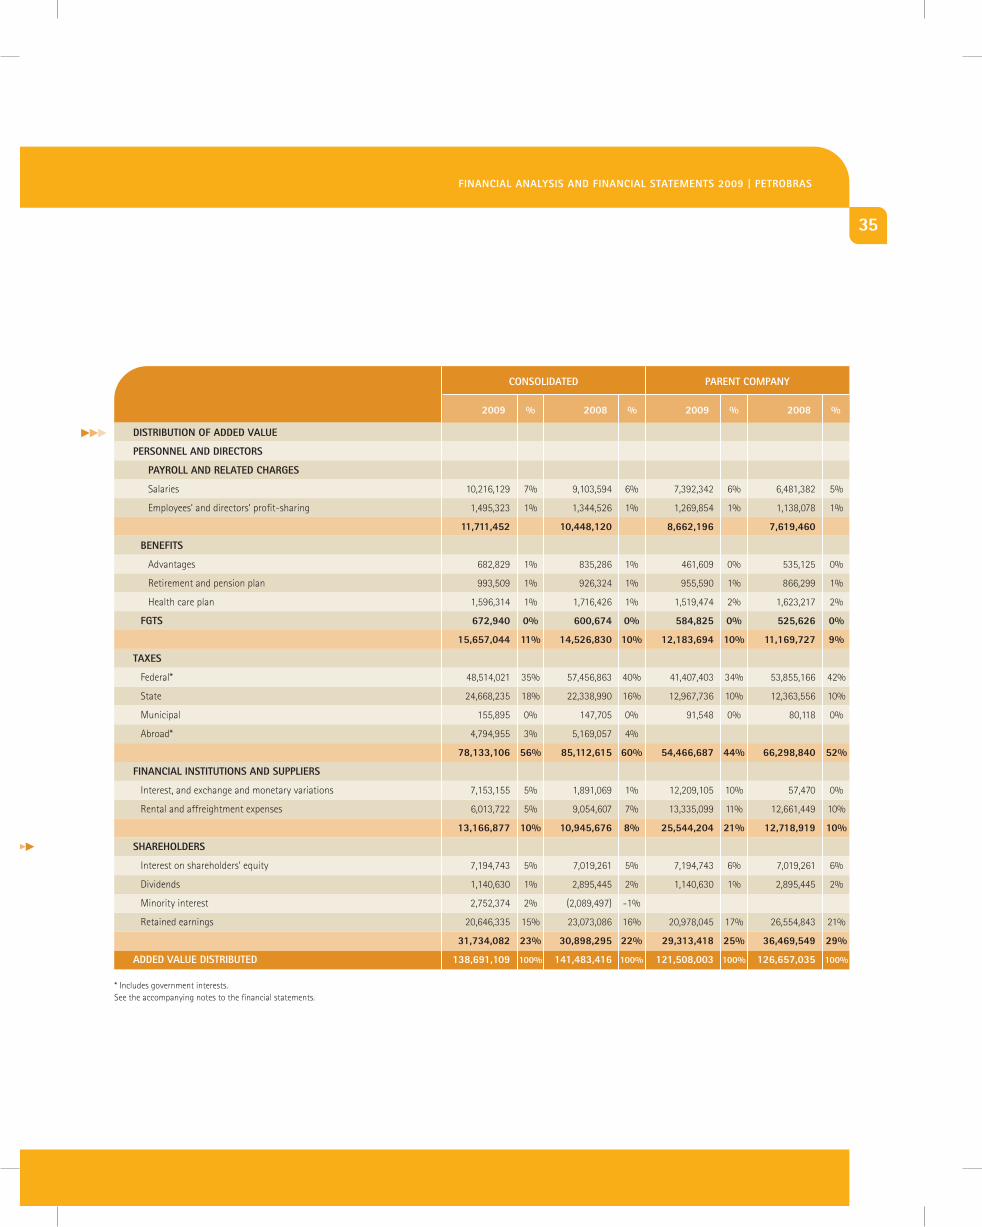
cOnsOlidated
distRiBUtiOn OF added ValUe
PeRsOnnel and diRectORs
PayROll and Related chaRges
Salaries 10,216,129 7% 9,103,594 6% 7,392,342 6% 6,481,382 5%
Employees’ and directors’ profit-sharing 1,495,323 1% 1,344,526 1% 1,269,854 1% 1,138,078 1%
11,711,452 10,448,120 8,662,196 7,619,460
BeneFits
advantages 682,829 1% 835,286 1% 461,609 0% 535,125 0%
retirement and pension plan 993,509 1% 926,324 1% 955,590 1% 866,299 1%
health care plan 1,596,314 1% 1,716,426 1% 1,519,474 2% 1,623,217 2%
Fgts 672,940 0% 600,674 0% 584,825 0% 525,626 0%
15,657,044 11% 14,526,830 10% 12,183,694 10% 11,169,727 9%
taxes
Federal* 48,514,021 35% 57,456,863 40% 41,407,403 34% 53,855,166 42%
State 24,668,235 18% 22,338,990 16% 12,967,736 10% 12,363,556 10%
municipal 155,895 0% 147,705 0% 91,548 0% 80,118 0%
abroad* 4,794,955 3% 5,169,057 4%
78,133,106 56% 85,112,615 60% 54,466,687 44% 66,298,840 52%
Financial institUtiOns and sUPPlieRs
interest, and exchange and monetary variations 7,153,155 5% 1,891,069 1% 12,209,105 10% 57,470 0%
rental and affreightment expenses 6,013,722 5% 9,054,607 7% 13,335,099 11% 12,661,449 10%
13,166,877 10% 10,945,676 8% 25,544,204 21% 12,718,919 10%
shaRehOldeRs
interest on shareholders’ equity 7,194,743 5% 7,019,261 5% 7,194,743 6% 7,019,261 6%
dividends 1,140,630 1% 2,895,445 2% 1,140,630 1% 2,895,445 2%
minority interest 2,752,374 2% (2,089,497) -1%
retained earnings 20,646,335 15% 23,073,086 16% 20,978,045 17% 26,554,843 21%
31,734,082 23% 30,898,295 22% 29,313,418 25% 36,469,549 29%
added ValUe distRiBUted 138,691,109 100% 141,483,416 100% 121,508,003 100% 126,657,035 100%
2008200920082009
PaRent cOmPany
%%%%
* includes government interests.See the accompanying notes to the financial statements.
Financial analysis And Financial statements 2009 | PetROBRas
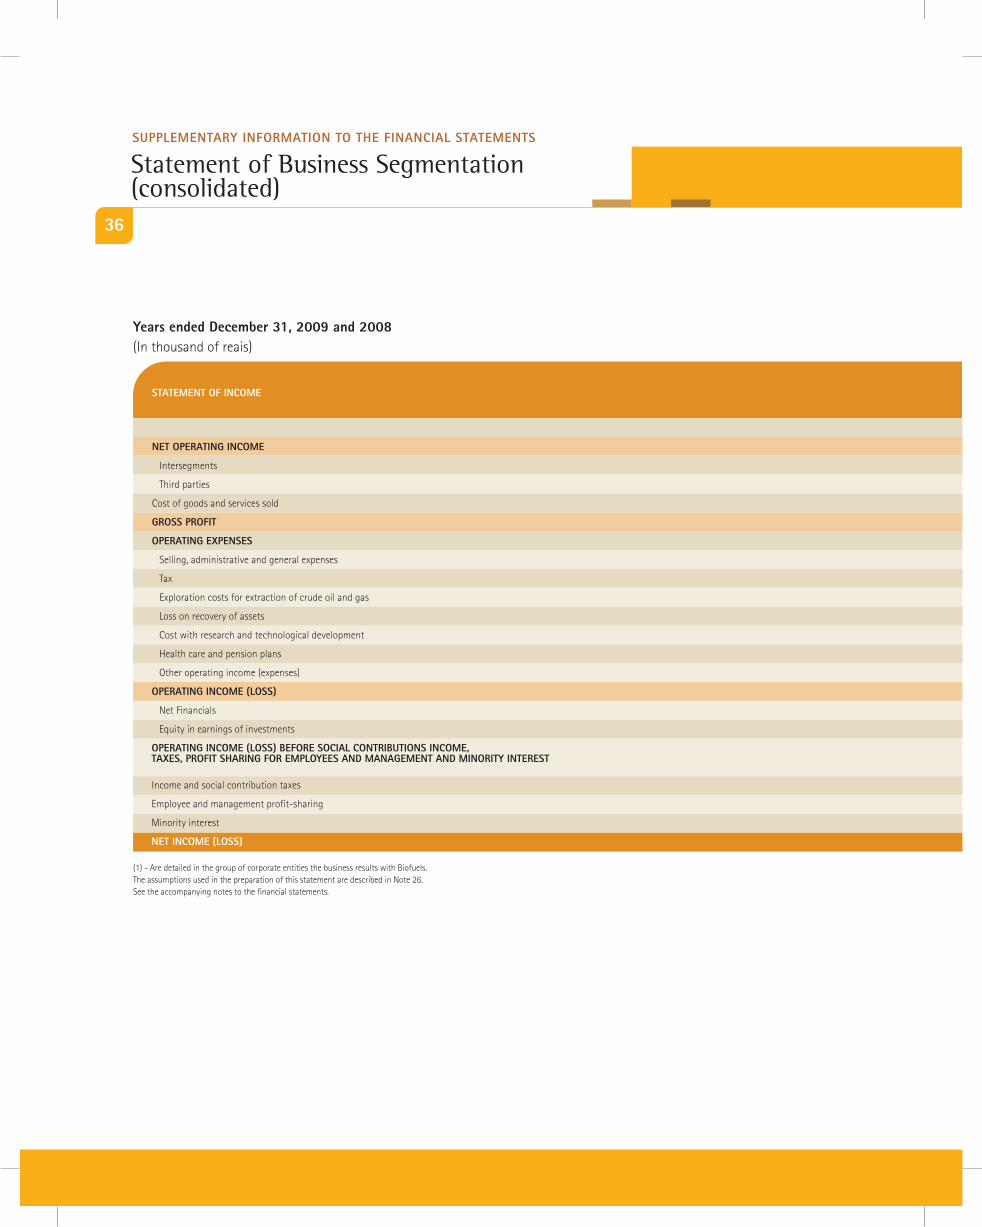
36
years ended december 31, 2009 and 2008(in thousand of reais)
statement of Business segmentation (consolidated)
sUPPlementaRy inFORmatiOn tO the Financial statements
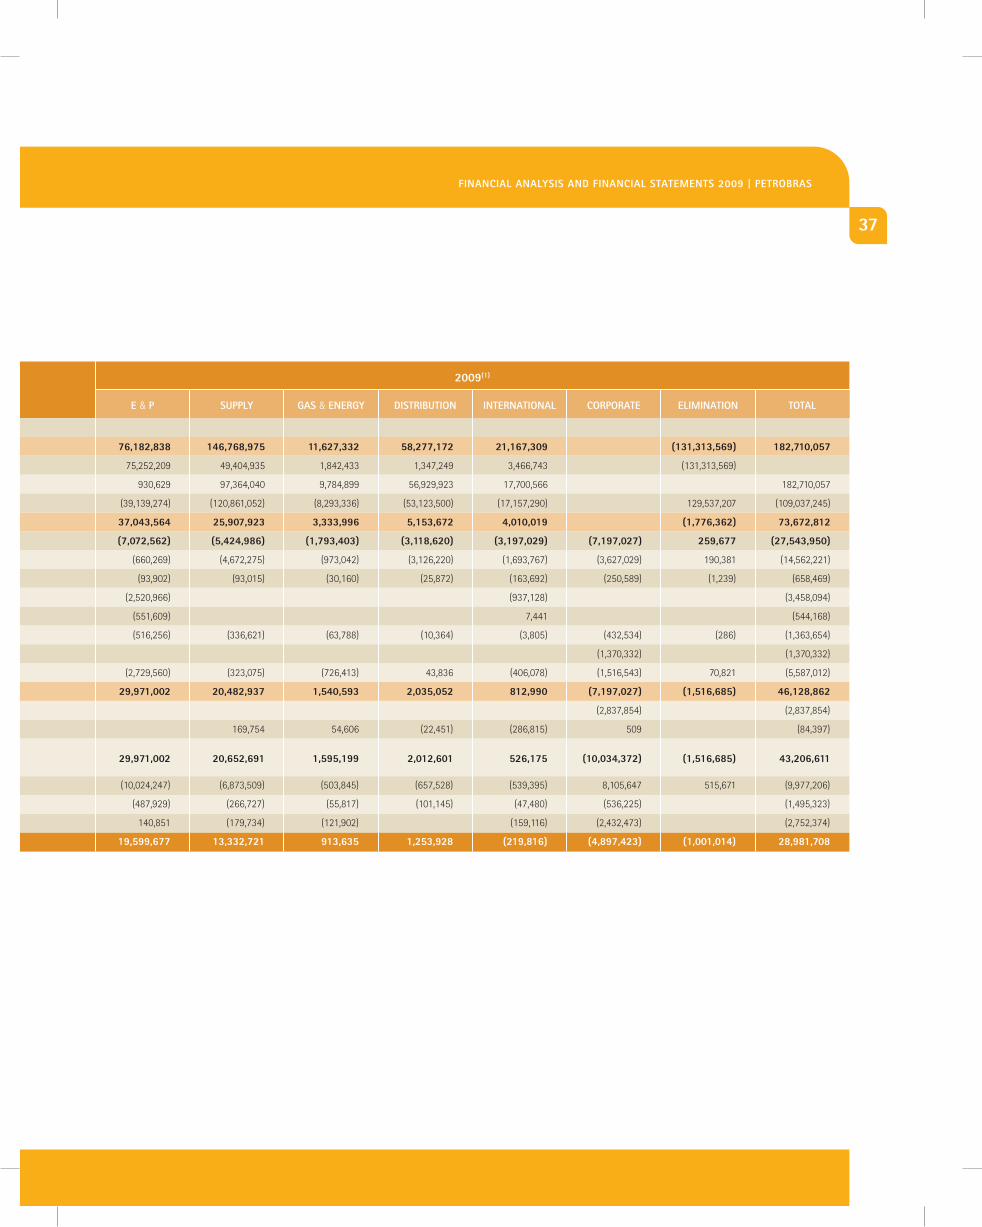
net OPeRating incOme 76,182,838 146,768,975 11,627,332 58,277,172 21,167,309 (131,313,569) 182,710,057
intersegments 75,252,209 49,404,935 1,842,433 1,347,249 3,466,743 (131,313,569)
third parties 930,629 97,364,040 9,784,899 56,929,923 17,700,566 182,710,057
cost of goods and services sold (39,139,274) (120,861,052) (8,293,336) (53,123,500) (17,157,290) 129,537,207 (109,037,245)
gROss PROFit 37,043,564 25,907,923 3,333,996 5,153,672 4,010,019 (1,776,362) 73,672,812
OPeRating exPenses (7,072,562) (5,424,986) (1,793,403) (3,118,620) (3,197,029) (7,197,027) 259,677 (27,543,950)
Selling, administrative and general expenses (660,269) (4,672,275) (973,042) (3,126,220) (1,693,767) (3,627,029) 190,381 (14,562,221)
tax (93,902) (93,015) (30,160) (25,872) (163,692) (250,589) (1,239) (658,469)
Exploration costs for extraction of crude oil and gas (2,520,966) (937,128) (3,458,094)
loss on recovery of assets (551,609) 7,441 (544,168)
cost with research and technological development (516,256) (336,621) (63,788) (10,364) (3,805) (432,534) (286) (1,363,654)
health care and pension plans (1,370,332) (1,370,332)
other operating income (expenses) (2,729,560) (323,075) (726,413) 43,836 (406,078) (1,516,543) 70,821 (5,587,012)
OPeRating incOme (lOss) 29,971,002 20,482,937 1,540,593 2,035,052 812,990 (7,197,027) (1,516,685) 46,128,862
net Financials (2,837,854) (2,837,854)
Equity in earnings of investments 169,754 54,606 (22,451) (286,815) 509 (84,397)
OPeRating incOme (lOss) BeFORe sOcial cOntRiBUtiOns incOme, taxes, PROFit shaRing FOR emPlOyees and management and minORity inteRest 29,971,002 20,652,691 1,595,199 2,012,601 526,175 (10,034,372) (1,516,685) 43,206,611
income and social contribution taxes (10,024,247) (6,873,509) (503,845) (657,528) (539,395) 8,105,647 515,671 (9,977,206)
Employee and management profit-sharing (487,929) (266,727) (55,817) (101,145) (47,480) (536,225) (1,495,323)
minority interest 140,851 (179,734) (121,902) (159,116) (2,432,473) (2,752,374)
net incOme (lOss) 19,599,677 13,332,721 913,635 1,253,928 (219,816) (4,897,423) (1,001,014) 28,981,708
(1) - are detailed in the group of corporate entities the business results with biofuels. the assumptions used in the preparation of this statement are described in note 26. See the accompanying notes to the financial statements.
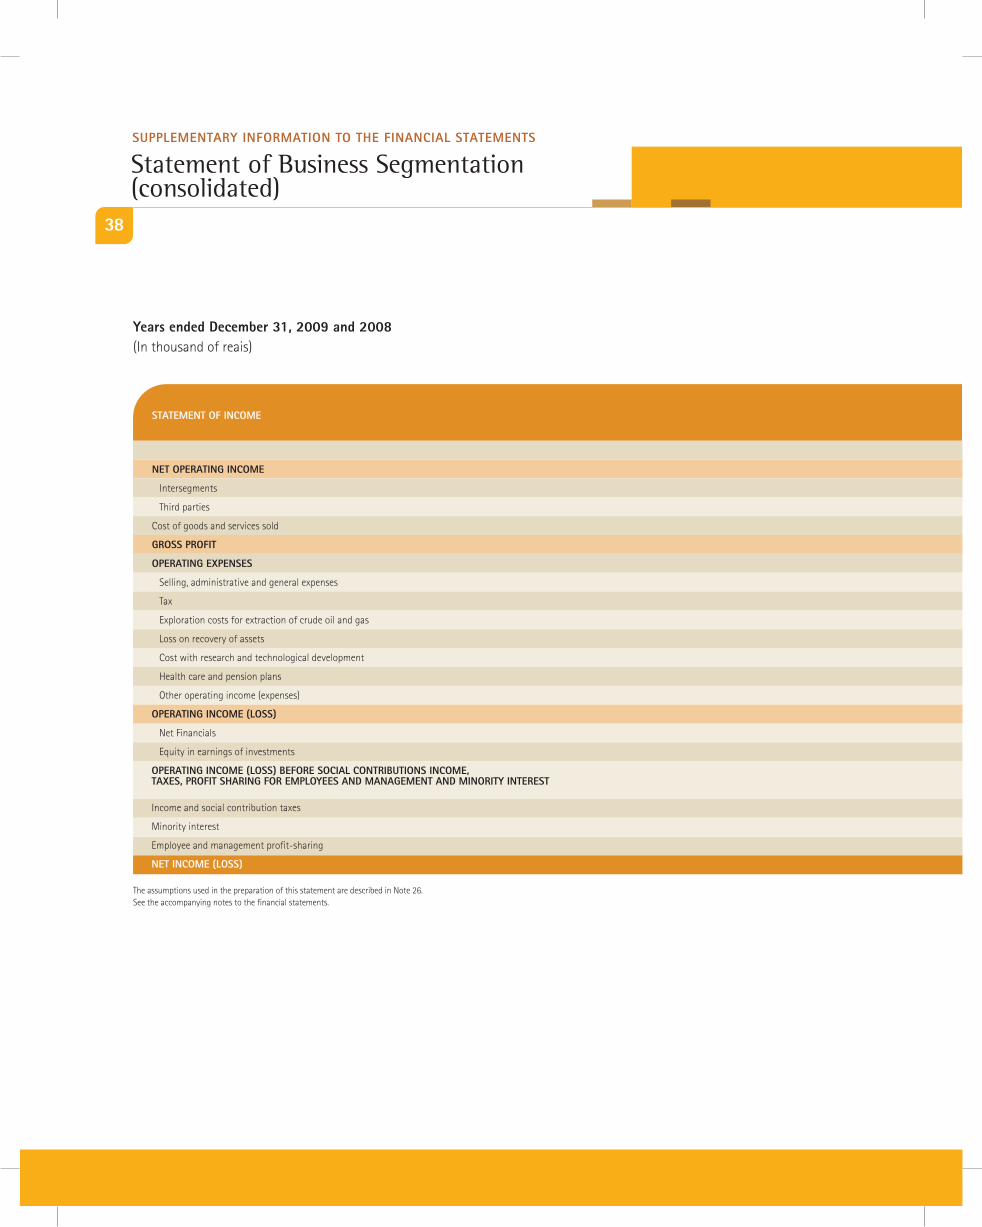
statement OF incOme
37
2009(1)
e & P sUPPly gas & eneRgy distRiBUtiOn inteRnatiOnal cORPORate eliminatiOn tOtal
Financial analysis And Financial statements 2009 | PetROBRas
net OPeRating incOme 76,182,838 146,768,975 11,627,332 58,277,172 21,167,309 (131,313,569) 182,710,057
intersegments 75,252,209 49,404,935 1,842,433 1,347,249 3,466,743 (131,313,569)
third parties 930,629 97,364,040 9,784,899 56,929,923 17,700,566 182,710,057
cost of goods and services sold (39,139,274) (120,861,052) (8,293,336) (53,123,500) (17,157,290) 129,537,207 (109,037,245)
gROss PROFit 37,043,564 25,907,923 3,333,996 5,153,672 4,010,019 (1,776,362) 73,672,812
OPeRating exPenses (7,072,562) (5,424,986) (1,793,403) (3,118,620) (3,197,029) (7,197,027) 259,677 (27,543,950)
Selling, administrative and general expenses (660,269) (4,672,275) (973,042) (3,126,220) (1,693,767) (3,627,029) 190,381 (14,562,221)
tax (93,902) (93,015) (30,160) (25,872) (163,692) (250,589) (1,239) (658,469)
Exploration costs for extraction of crude oil and gas (2,520,966) (937,128) (3,458,094)
loss on recovery of assets (551,609) 7,441 (544,168)
cost with research and technological development (516,256) (336,621) (63,788) (10,364) (3,805) (432,534) (286) (1,363,654)
health care and pension plans (1,370,332) (1,370,332)
other operating income (expenses) (2,729,560) (323,075) (726,413) 43,836 (406,078) (1,516,543) 70,821 (5,587,012)
OPeRating incOme (lOss) 29,971,002 20,482,937 1,540,593 2,035,052 812,990 (7,197,027) (1,516,685) 46,128,862
net Financials (2,837,854) (2,837,854)
Equity in earnings of investments 169,754 54,606 (22,451) (286,815) 509 (84,397)
OPeRating incOme (lOss) BeFORe sOcial cOntRiBUtiOns incOme, taxes, PROFit shaRing FOR emPlOyees and management and minORity inteRest 29,971,002 20,652,691 1,595,199 2,012,601 526,175 (10,034,372) (1,516,685) 43,206,611
income and social contribution taxes (10,024,247) (6,873,509) (503,845) (657,528) (539,395) 8,105,647 515,671 (9,977,206)
Employee and management profit-sharing (487,929) (266,727) (55,817) (101,145) (47,480) (536,225) (1,495,323)
minority interest 140,851 (179,734) (121,902) (159,116) (2,432,473) (2,752,374)
net incOme (lOss) 19,599,677 13,332,721 913,635 1,253,928 (219,816) (4,897,423) (1,001,014) 28,981,708
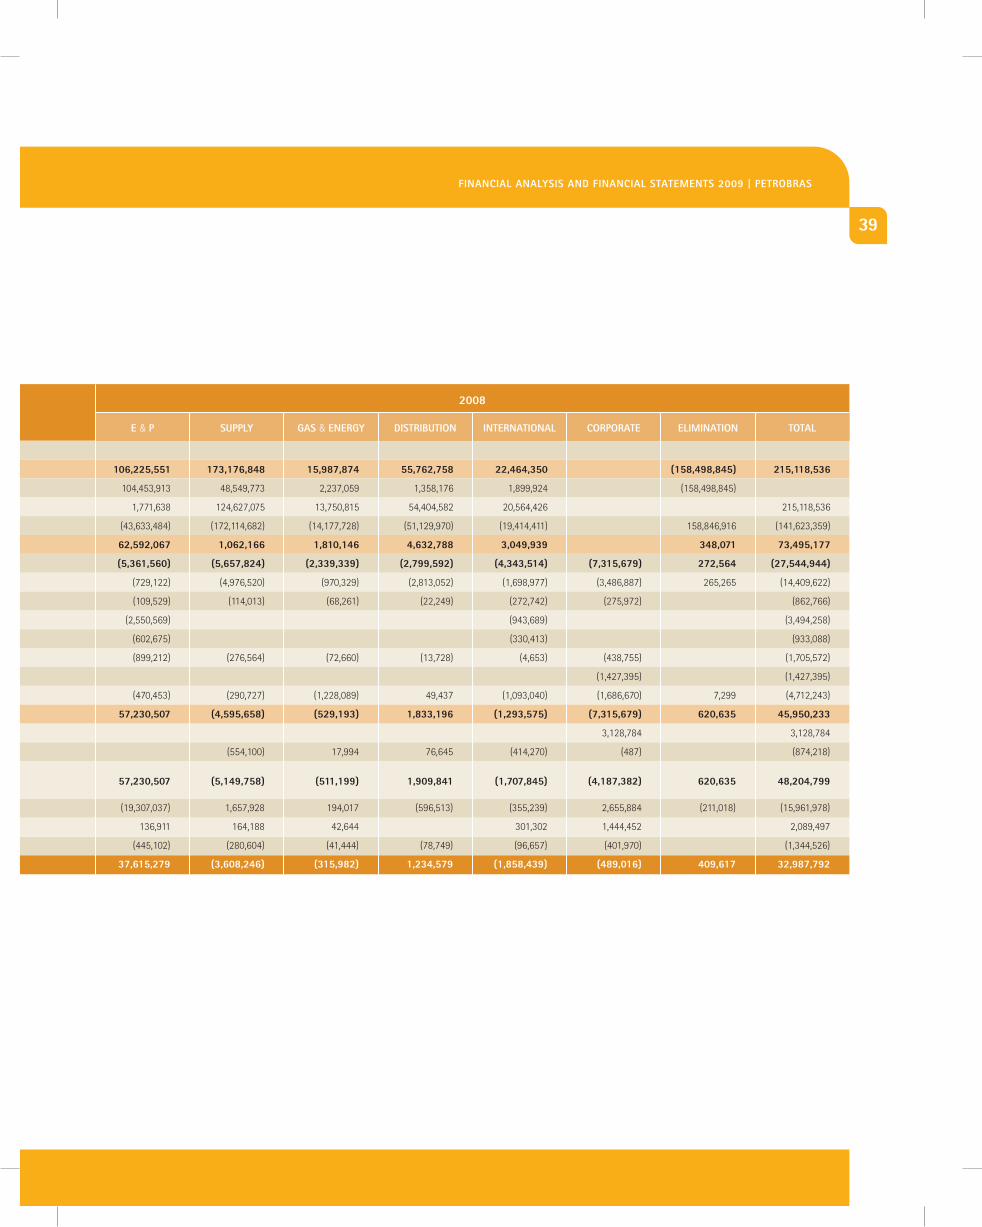
net OPeRating incOme 106,225,551 173,176,848 15,987,874 55,762,758 22,464,350 (158,498,845) 215,118,536
intersegments 104,453,913 48,549,773 2,237,059 1,358,176 1,899,924 (158,498,845)
third parties 1,771,638 124,627,075 13,750,815 54,404,582 20,564,426 215,118,536
cost of goods and services sold (43,633,484) (172,114,682) (14,177,728) (51,129,970) (19,414,411) 158,846,916 (141,623,359)
gROss PROFit 62,592,067 1,062,166 1,810,146 4,632,788 3,049,939 348,071 73,495,177
OPeRating exPenses (5,361,560) (5,657,824) (2,339,339) (2,799,592) (4,343,514) (7,315,679) 272,564 (27,544,944)
Selling, administrative and general expenses (729,122) (4,976,520) (970,329) (2,813,052) (1,698,977) (3,486,887) 265,265 (14,409,622)
tax (109,529) (114,013) (68,261) (22,249) (272,742) (275,972) (862,766)
Exploration costs for extraction of crude oil and gas (2,550,569) (943,689) (3,494,258)
loss on recovery of assets (602,675) (330,413) (933,088)
cost with research and technological development (899,212) (276,564) (72,660) (13,728) (4,653) (438,755) (1,705,572)
health care and pension plans (1,427,395) (1,427,395)
other operating income (expenses) (470,453) (290,727) (1,228,089) 49,437 (1,093,040) (1,686,670) 7,299 (4,712,243)
OPeRating incOme (lOss) 57,230,507 (4,595,658) (529,193) 1,833,196 (1,293,575) (7,315,679) 620,635 45,950,233
net Financials 3,128,784 3,128,784
Equity in earnings of investments (554,100) 17,994 76,645 (414,270) (487) (874,218)
OPeRating incOme (lOss) BeFORe sOcial cOntRiBUtiOns incOme, taxes, PROFit shaRing FOR emPlOyees and management and minORity inteRest 57,230,507 (5,149,758) (511,199) 1,909,841 (1,707,845) (4,187,382) 620,635 48,204,799
income and social contribution taxes (19,307,037) 1,657,928 194,017 (596,513) (355,239) 2,655,884 (211,018) (15,961,978)
minority interest 136,911 164,188 42,644 301,302 1,444,452 2,089,497
Employee and management profit-sharing (445,102) (280,604) (41,444) (78,749) (96,657) (401,970) (1,344,526)
net incOme (lOss) 37,615,279 (3,608,246) (315,982) 1,234,579 (1,858,439) (489,016) 409,617 32,987,792
the assumptions used in the preparation of this statement are described in note 26.See the accompanying notes to the financial statements.
statement OF incOme
years ended december 31, 2009 and 2008(in thousand of reais)
38
sUPPlementaRy inFORmatiOn tO the Financial statements
statement of Business segmentation (consolidated)
2008
e & P sUPPly gas & eneRgy distRiBUtiOn inteRnatiOnal cORPORate eliminatiOn tOtal
net OPeRating incOme 106,225,551 173,176,848 15,987,874 55,762,758 22,464,350 (158,498,845) 215,118,536
intersegments 104,453,913 48,549,773 2,237,059 1,358,176 1,899,924 (158,498,845)
third parties 1,771,638 124,627,075 13,750,815 54,404,582 20,564,426 215,118,536
cost of goods and services sold (43,633,484) (172,114,682) (14,177,728) (51,129,970) (19,414,411) 158,846,916 (141,623,359)
gROss PROFit 62,592,067 1,062,166 1,810,146 4,632,788 3,049,939 348,071 73,495,177
OPeRating exPenses (5,361,560) (5,657,824) (2,339,339) (2,799,592) (4,343,514) (7,315,679) 272,564 (27,544,944)
Selling, administrative and general expenses (729,122) (4,976,520) (970,329) (2,813,052) (1,698,977) (3,486,887) 265,265 (14,409,622)
tax (109,529) (114,013) (68,261) (22,249) (272,742) (275,972) (862,766)
Exploration costs for extraction of crude oil and gas (2,550,569) (943,689) (3,494,258)
loss on recovery of assets (602,675) (330,413) (933,088)
cost with research and technological development (899,212) (276,564) (72,660) (13,728) (4,653) (438,755) (1,705,572)
health care and pension plans (1,427,395) (1,427,395)
other operating income (expenses) (470,453) (290,727) (1,228,089) 49,437 (1,093,040) (1,686,670) 7,299 (4,712,243)
OPeRating incOme (lOss) 57,230,507 (4,595,658) (529,193) 1,833,196 (1,293,575) (7,315,679) 620,635 45,950,233
net Financials 3,128,784 3,128,784
Equity in earnings of investments (554,100) 17,994 76,645 (414,270) (487) (874,218)
OPeRating incOme (lOss) BeFORe sOcial cOntRiBUtiOns incOme, taxes, PROFit shaRing FOR emPlOyees and management and minORity inteRest 57,230,507 (5,149,758) (511,199) 1,909,841 (1,707,845) (4,187,382) 620,635 48,204,799
income and social contribution taxes (19,307,037) 1,657,928 194,017 (596,513) (355,239) 2,655,884 (211,018) (15,961,978)
minority interest 136,911 164,188 42,644 301,302 1,444,452 2,089,497
Employee and management profit-sharing (445,102) (280,604) (41,444) (78,749) (96,657) (401,970) (1,344,526)
net incOme (lOss) 37,615,279 (3,608,246) (315,982) 1,234,579 (1,858,439) (489,016) 409,617 32,987,792
39
Financial analysis And Financial statements 2009 | PetROBRas
40
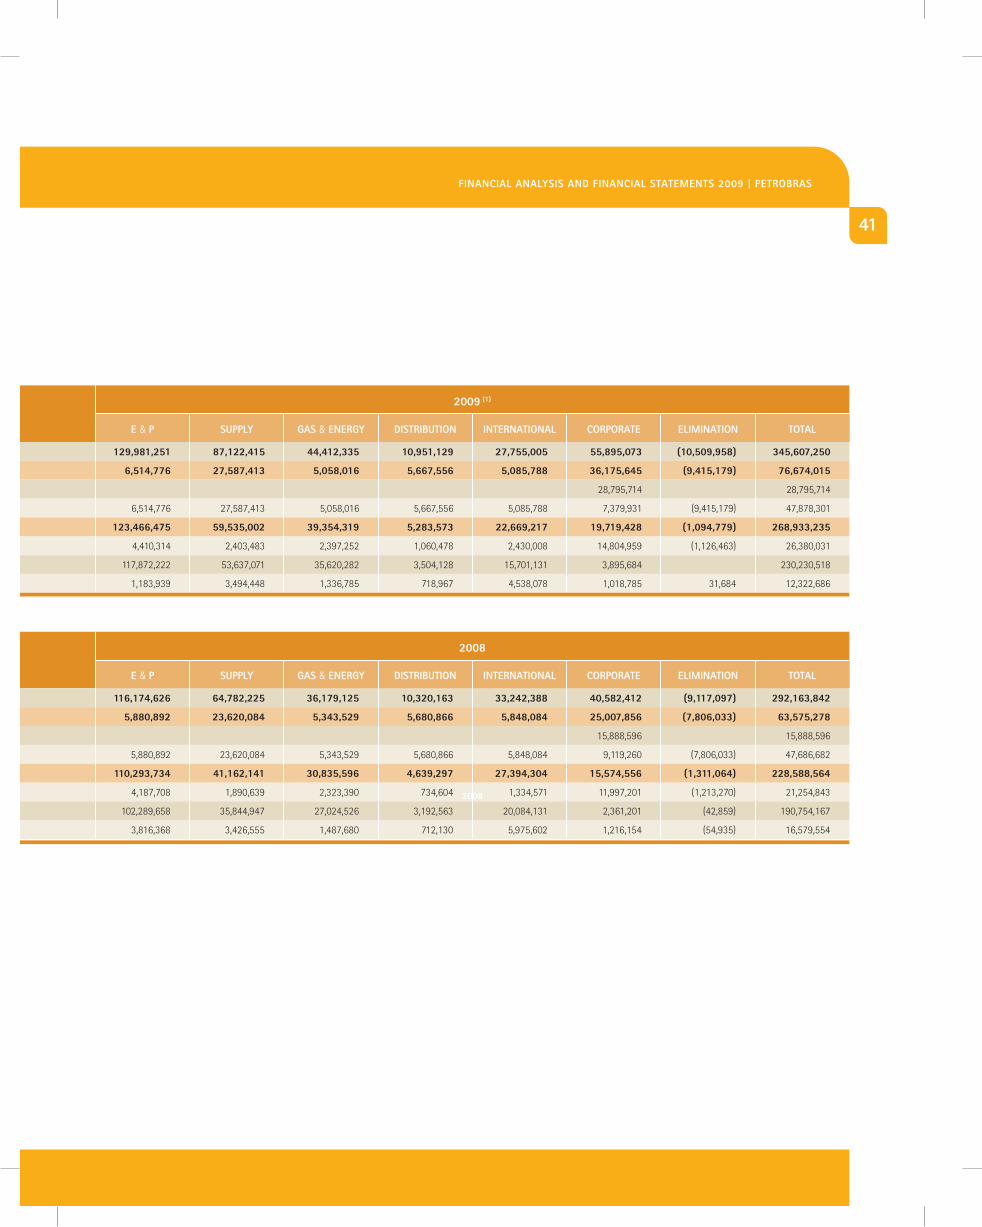
assets 129,981,251 87,122,415 44,412,335 10,951,129 27,755,005 55,895,073 (10,509,958) 345,607,250
cURRent assets 6,514,776 27,587,413 5,058,016 5,667,556 5,085,788 36,175,645 (9,415,179) 76,674,015
cash and cash equivalents 28,795,714 28,795,714
other current assets 6,514,776 27,587,413 5,058,016 5,667,556 5,085,788 7,379,931 (9,415,179) 47,878,301
nOn-cURRent assets 123,466,475 59,535,002 39,354,319 5,283,573 22,669,217 19,719,428 (1,094,779) 268,933,235
long-term receivables 4,410,314 2,403,483 2,397,252 1,060,478 2,430,008 14,804,959 (1,126,463) 26,380,031
property, plant and equipment 117,872,222 53,637,071 35,620,282 3,504,128 15,701,131 3,895,684 230,230,518
others 1,183,939 3,494,448 1,336,785 718,967 4,538,078 1,018,785 31,684 12,322,686
assets 116,174,626 64,782,225 36,179,125 10,320,163 33,242,388 40,582,412 (9,117,097) 292,163,842
cURRent assets 5,880,892 23,620,084 5,343,529 5,680,866 5,848,084 25,007,856 (7,806,033) 63,575,278
cash and cash equivalents 15,888,596 15,888,596
other current assets 5,880,892 23,620,084 5,343,529 5,680,866 5,848,084 9,119,260 (7,806,033) 47,686,682
nOn-cURRent assets 110,293,734 41,162,141 30,835,596 4,639,297 27,394,304 15,574,556 (1,311,064) 228,588,564
long-term receivables 4,187,708 1,890,639 2,323,390 734,604 1,334,571 11,997,201 (1,213,270) 21,254,843
property, plant and equipment 102,289,658 35,844,947 27,024,526 3,192,563 20,084,131 2,361,201 (42,859) 190,754,167
others 3,816,368 3,426,555 1,487,680 712,130 5,975,602 1,216,154 (54,935) 16,579,554
(1) - are detailed in the group of corporate entities the business assets with biofuels. the assumptions used in the preparation of this statement are described in note 26. See the accompanying notes to the financial statements.
sUPPlementaRy inFORmatiOn tO the Financial statements
statement of Business segmentation (consolidated)
years ended december 31, 2009 and 2008(in thousand of reais)
41
2009 (1)
e & P sUPPly gas & eneRgy distRiBUtiOn inteRnatiOnal cORPORate eliminatiOn tOtal
2008
2008
e & P sUPPly gas & eneRgy distRiBUtiOn inteRnatiOnal cORPORate eliminatiOn tOtal
Financial analysis And Financial statements 2009 | PetROBRas
assets 129,981,251 87,122,415 44,412,335 10,951,129 27,755,005 55,895,073 (10,509,958) 345,607,250
cURRent assets 6,514,776 27,587,413 5,058,016 5,667,556 5,085,788 36,175,645 (9,415,179) 76,674,015
cash and cash equivalents 28,795,714 28,795,714
other current assets 6,514,776 27,587,413 5,058,016 5,667,556 5,085,788 7,379,931 (9,415,179) 47,878,301
nOn-cURRent assets 123,466,475 59,535,002 39,354,319 5,283,573 22,669,217 19,719,428 (1,094,779) 268,933,235
long-term receivables 4,410,314 2,403,483 2,397,252 1,060,478 2,430,008 14,804,959 (1,126,463) 26,380,031
property, plant and equipment 117,872,222 53,637,071 35,620,282 3,504,128 15,701,131 3,895,684 230,230,518
others 1,183,939 3,494,448 1,336,785 718,967 4,538,078 1,018,785 31,684 12,322,686
assets 116,174,626 64,782,225 36,179,125 10,320,163 33,242,388 40,582,412 (9,117,097) 292,163,842
cURRent assets 5,880,892 23,620,084 5,343,529 5,680,866 5,848,084 25,007,856 (7,806,033) 63,575,278
cash and cash equivalents 15,888,596 15,888,596
other current assets 5,880,892 23,620,084 5,343,529 5,680,866 5,848,084 9,119,260 (7,806,033) 47,686,682
nOn-cURRent assets 110,293,734 41,162,141 30,835,596 4,639,297 27,394,304 15,574,556 (1,311,064) 228,588,564
long-term receivables 4,187,708 1,890,639 2,323,390 734,604 1,334,571 11,997,201 (1,213,270) 21,254,843
property, plant and equipment 102,289,658 35,844,947 27,024,526 3,192,563 20,084,131 2,361,201 (42,859) 190,754,167
others 3,816,368 3,426,555 1,487,680 712,130 5,975,602 1,216,154 (54,935) 16,579,554
42
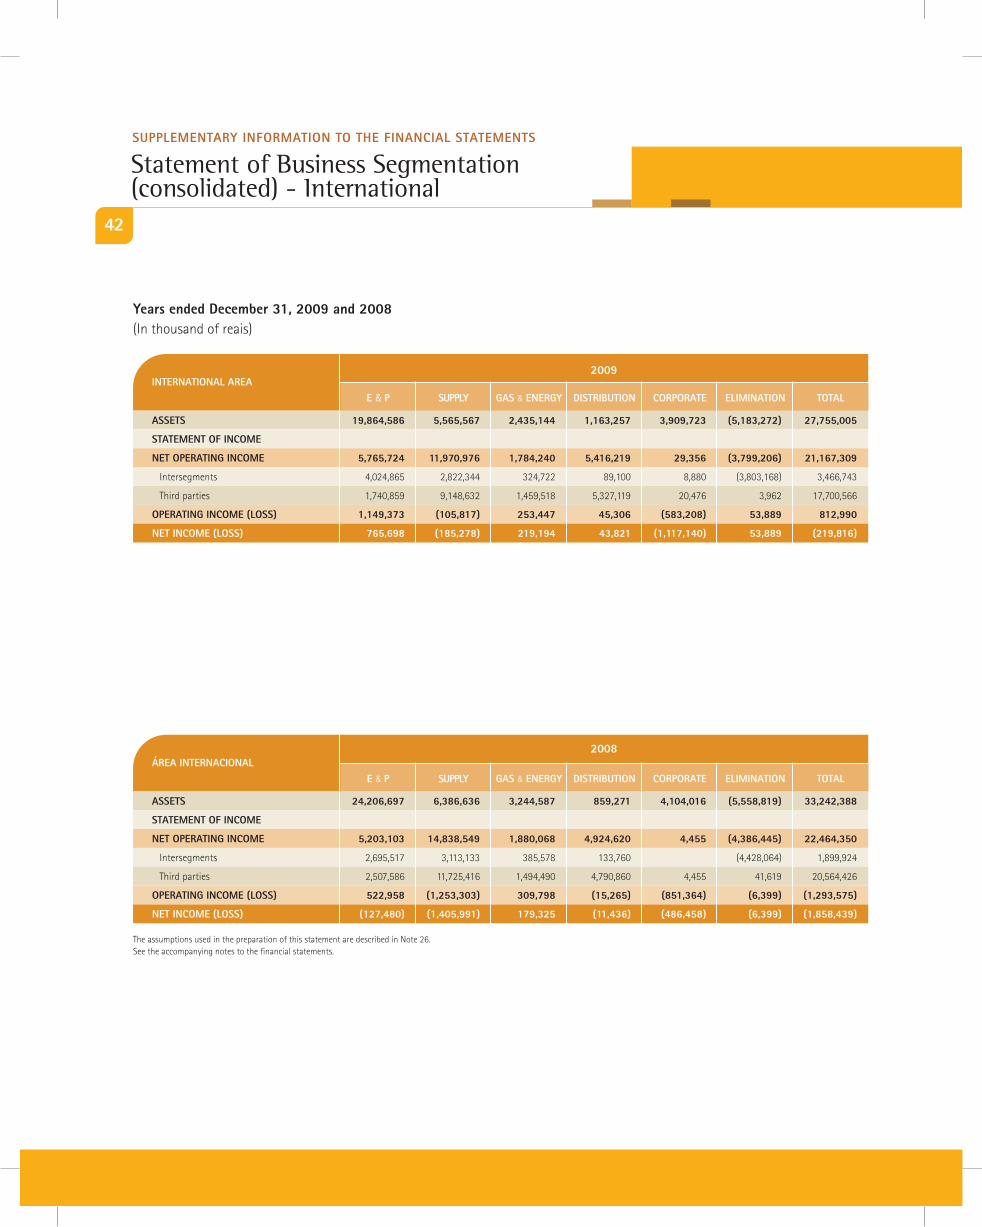
statement of Business segmentation (consolidated) - international
years ended december 31, 2009 and 2008(in thousand of reais)
2009
assets 19,864,586 5,565,567 2,435,144 1,163,257 3,909,723 (5,183,272) 27,755,005
statement OF incOme
net OPeRating incOme 5,765,724 11,970,976 1,784,240 5,416,219 29,356 (3,799,206) 21,167,309
intersegments 4,024,865 2,822,344 324,722 89,100 8,880 (3,803,168) 3,466,743
third parties 1,740,859 9,148,632 1,459,518 5,327,119 20,476 3,962 17,700,566
OPeRating incOme (lOss) 1,149,373 (105,817) 253,447 45,306 (583,208) 53,889 812,990
net incOme (lOss) 765,698 (185,278) 219,194 43,821 (1,117,140) 53,889 (219,816)
tOtaleliminatiOncORPORatedistRiBUtiOngas & eneRgysUPPlye & PinteRnatiOnal aRea
2008
assets 24,206,697 6,386,636 3,244,587 859,271 4,104,016 (5,558,819) 33,242,388
statement OF incOme
net OPeRating incOme 5,203,103 14,838,549 1,880,068 4,924,620 4,455 (4,386,445) 22,464,350
intersegments 2,695,517 3,113,133 385,578 133,760 (4,428,064) 1,899,924
third parties 2,507,586 11,725,416 1,494,490 4,790,860 4,455 41,619 20,564,426
OPeRating incOme (lOss) 522,958 (1,253,303) 309,798 (15,265) (851,364) (6,399) (1,293,575)
net incOme (lOss) (127,480) (1,405,991) 179,325 (11,436) (486,458) (6,399) (1,858,439)
tOtaleliminatiOncORPORatedistRiBUtiOngas & eneRgysUPPlye & PÁRea inteRnaciOnal
the assumptions used in the preparation of this statement are described in note 26. See the accompanying notes to the financial statements.
sUPPlementaRy inFORmatiOn tO the Financial statements
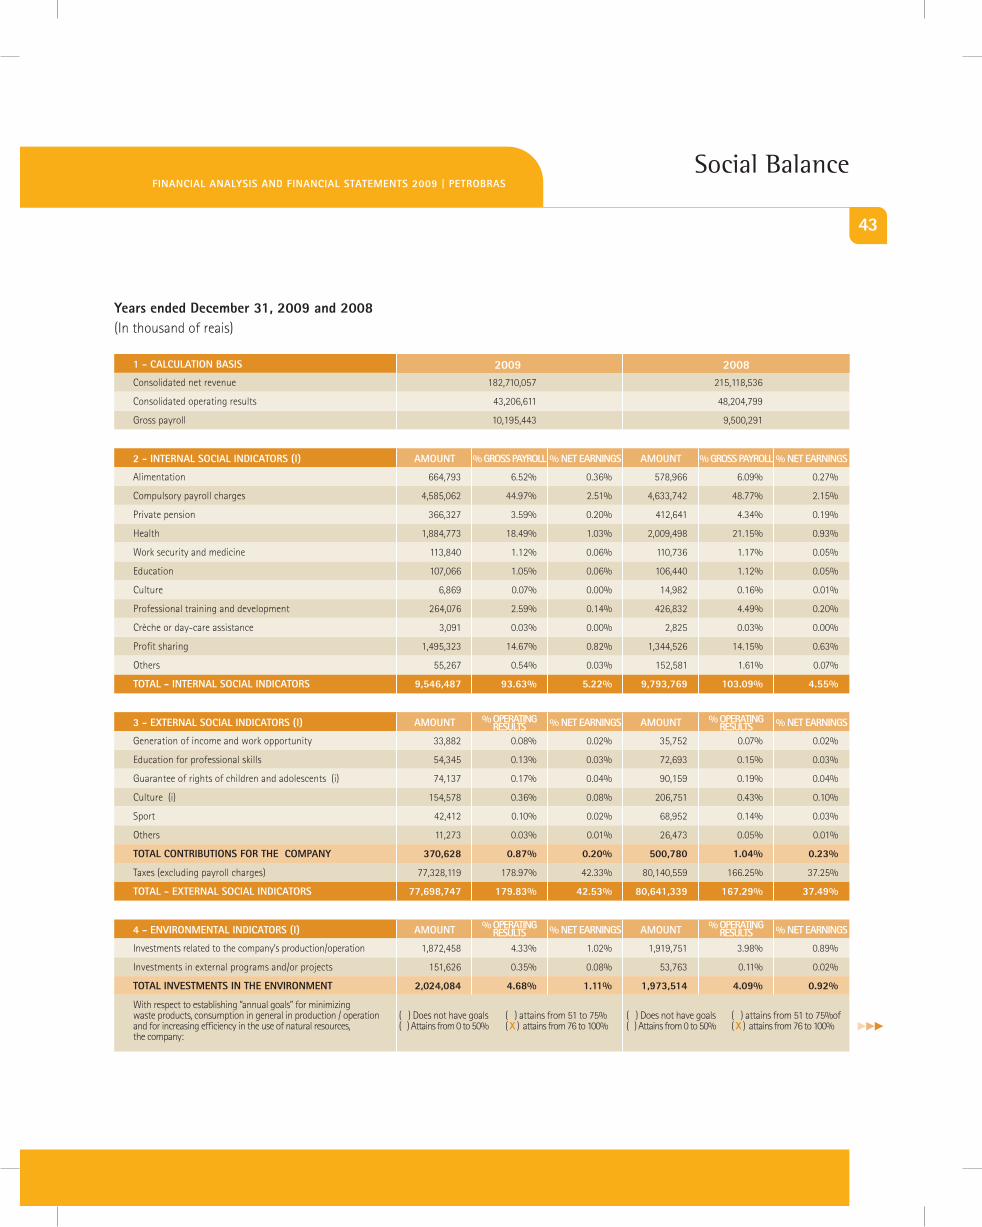
43
years ended december 31, 2009 and 2008(in thousand of reais)
Financial analysis And Financial statements 2009 | PetROBRassocial Balance
consolidated net revenue 182,710,057 215,118,536
consolidated operating results 43,206,611 48,204,799
gross payroll 10,195,443 9,500,291
1 - calcUlatiOn Basis 2009 2008
2 - inteRnal sOcial indicatORs (i) amOUnt % gROss PayROll % net eaRnings amOUnt % gROss PayROll % net eaRnings
alimentation 664,793 6.52% 0.36% 578,966 6.09% 0.27%
compulsory payroll charges 4,585,062 44.97% 2.51% 4,633,742 48.77% 2.15%
private pension 366,327 3.59% 0.20% 412,641 4.34% 0.19%
health 1,884,773 18.49% 1.03% 2,009,498 21.15% 0.93%
Work security and medicine 113,840 1.12% 0.06% 110,736 1.17% 0.05%
Education 107,066 1.05% 0.06% 106,440 1.12% 0.05%
culture 6,869 0.07% 0.00% 14,982 0.16% 0.01%
professional training and development 264,076 2.59% 0.14% 426,832 4.49% 0.20%
crèche or day-care assistance 3,091 0.03% 0.00% 2,825 0.03% 0.00%
profit sharing 1,495,323 14.67% 0.82% 1,344,526 14.15% 0.63%
others 55,267 0.54% 0.03% 152,581 1.61% 0.07%
tOtal - inteRnal sOcial indicatORs 9,546,487 93.63% 5.22% 9,793,769 103.09% 4.55%
3 - exteRnal sOcial indicatORs (i) amOUnt % OPeRating ResUlts
% OPeRating ResUlts% net eaRnings amOUnt % net eaRnings
generation of income and work opportunity 33,882 0.08% 0.02% 35,752 0.07% 0.02%
Education for professional skills 54,345 0.13% 0.03% 72,693 0.15% 0.03%
guarantee of rights of children and adolescents (i) 74,137 0.17% 0.04% 90,159 0.19% 0.04%
culture (i) 154,578 0.36% 0.08% 206,751 0.43% 0.10%
Sport 42,412 0.10% 0.02% 68,952 0.14% 0.03%
others 11,273 0.03% 0.01% 26,473 0.05% 0.01%
tOtal cOntRiBUtiOns FOR the cOmPany 370,628 0.87% 0.20% 500,780 1.04% 0.23%
taxes (excluding payroll charges) 77,328,119 178.97% 42.33% 80,140,559 166.25% 37.25%
tOtal - exteRnal sOcial indicatORs 77,698,747 179.83% 42.53% 80,641,339 167.29% 37.49%
4 - enViROnmental indicatORs (i) amOUnt % net eaRnings amOUnt % net eaRnings
investments related to the company’s production/operation 1,872,458 4.33% 1.02% 1,919,751 3.98% 0.89%
investments in external programs and/or projects 151,626 0.35% 0.08% 53,763 0.11% 0.02%
tOtal inVestments in the enViROnment 2,024,084 4.68% 1.11% 1,973,514 4.09% 0.92%
With respect to establishing “annual goals” for minimizing waste products, consumption in general in production / operation ( ) does not have goals ( ) attains from 51 to 75% ( ) does not have goals ( ) attains from 51 to 75%of and for increasing efficiency in the use of natural resources, ( ) attains from 0 to 50% ( x ) attains from 76 to 100% ( ) attains from 0 to 50% ( x ) attains from 76 to 100% the company:
% OPeRating ResUlts
% OPeRating ResUlts
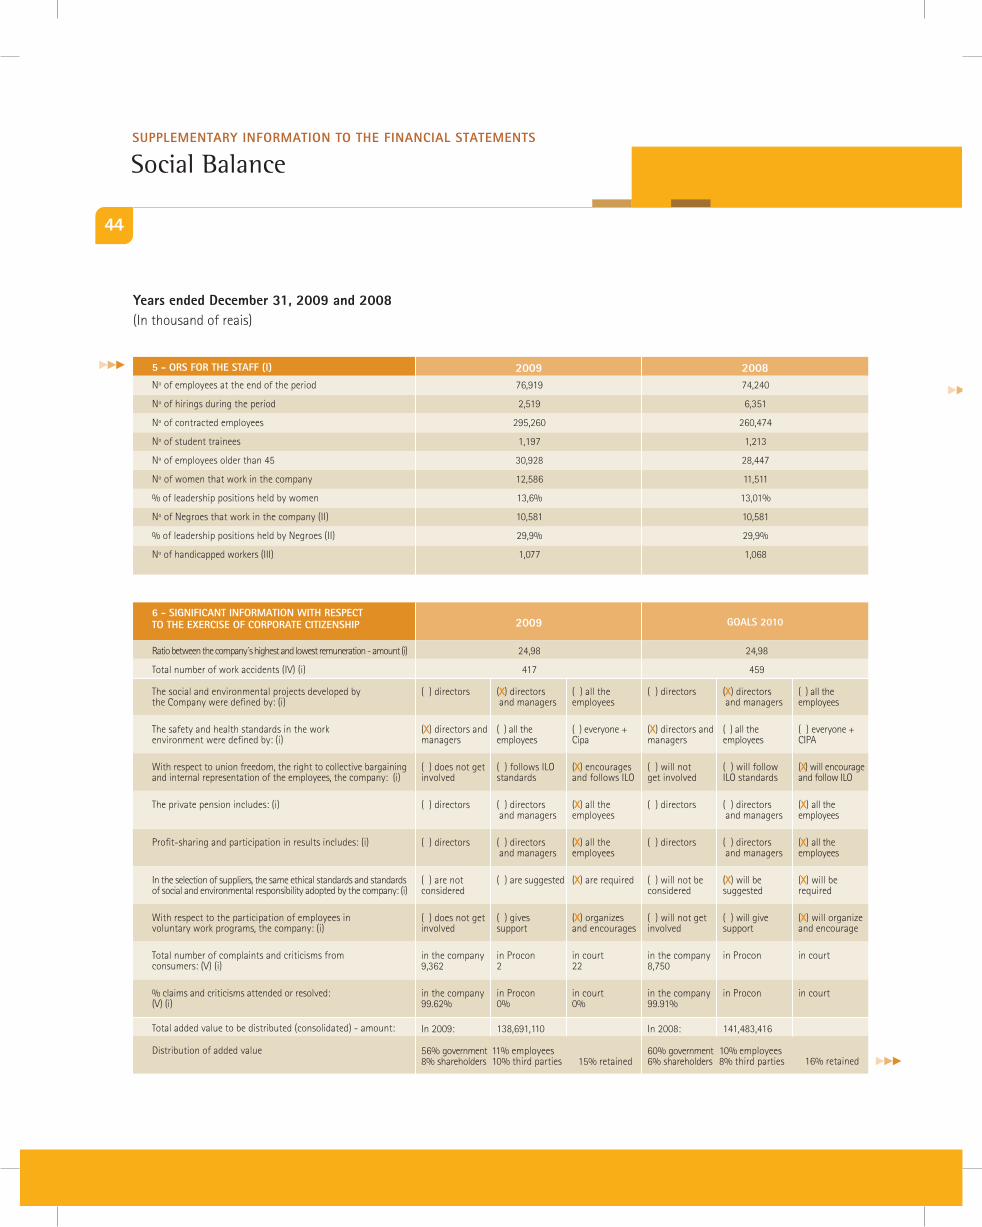
44
years ended december 31, 2009 and 2008(in thousand of reais)
social Balance
5 - ORs FOR the staFF (i) 2009 2008nº of employees at the end of the period 76,919 74,240
nº of hirings during the period 2,519 6,351
nº of contracted employees 295,260 260,474
nº of student trainees 1,197 1,213
nº of employees older than 45 30,928 28,447
nº of women that work in the company 12,586 11,511
% of leadership positions held by women 13,6% 13,01%
nº of negroes that work in the company (ii) 10,581 10,581
% of leadership positions held by negroes (ii) 29,9% 29,9%
nº of handicapped workers (iii) 1,077 1,068
6 - signiFicant inFORmatiOn with ResPect tO the exeRcise OF cORPORate citizenshiP 2009 gOals 2010
ratio between the company s highest and lowest remuneration - amount (i) 24,98 24,98
total number of work accidents (iV) (i) 417 459
( ) directors ( ) directors and managers
( ) all the employees
( ) all the employees
( ) directors ( ) directors and managers
xthe social and environmental projects developed by the company were defined by: (i)
( ) directors and managers
( ) directors and managers
( ) all the employees
( ) all the employees
( ) everyone + cipa
( ) everyone + cipa
xthe safety and health standards in the work environment were defined by: (i)
( ) does not get involved
( ) directors
( ) directors
( ) are not considered
( ) does not get involved
in the company 9,362
in the company99.62%
in 2009:
56% government8% shareholders
60% government6% shareholders
( ) will not be considered
( ) will not get involved
in the company8,750
in the company99.91%
in 2008:
( ) directors
( ) directors
( ) will not get involved
( ) follows ilo standards
( ) directors and managers
( ) directors and managers
( ) are suggested
( ) gives support
in procon2
in procon0%
138,691,110
11% employees10% third parties
10% employees8% third parties
( ) will be suggested
( ) will give support
in procon
in procon
141,483,416
( ) directors and managers
( ) directors and managers
( ) will follow ilo standards
( ) encourages and follows ilo
( ) all the employees
( ) all the employees
( ) are required
( ) organizes and encourages
in court22
in court0%
( ) will be required
( ) will organize and encourage
in court
in court
( ) all the employees
( ) all the employees
( ) will encourage and follow ilo
x
x
x
x
x
x
x
x
x
xWith respect to union freedom, the right to collective bargaining and internal representation of the employees, the company: (i)
the private pension includes: (i)
profit-sharing and participation in results includes: (i)
in the selection of suppliers, the same ethical standards and standards of social and environmental responsibility adopted by the company: (i)
With respect to the participation of employees in voluntary work programs, the company: (i)
total number of complaints and criticisms fromconsumers: (V) (i)
% claims and criticisms attended or resolved: (V) (i)
total added value to be distributed (consolidated) - amount:
distribution of added value
x
x
x
15% retained 16% retained
sUPPlementaRy inFORmatiOn tO the Financial statements
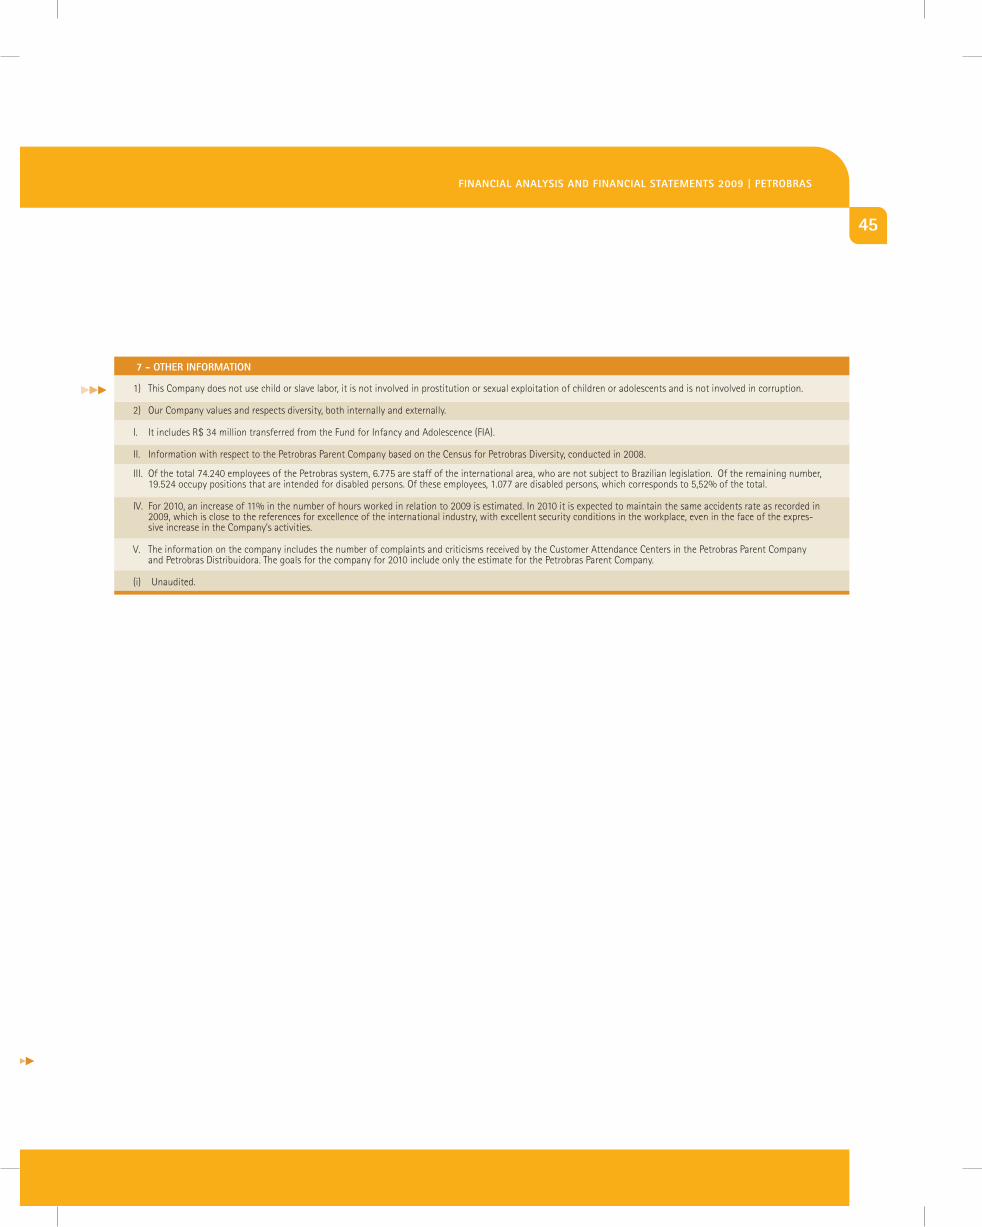
45
Financial analysis And Financial statements 2009 | PetROBRas
7 - OtheR inFORmatiOn
1) this company does not use child or slave labor, it is not involved in prostitution or sexual exploitation of children or adolescents and is not involved in corruption.
2) our company values and respects diversity, both internally and externally.
i. it includes r$ 34 million transferred from the Fund for infancy and adolescence (Fia).
ii. information with respect to the petrobras parent company based on the census for petrobras diversity, conducted in 2008.
iii. of the total 74.240 employees of the petrobras system, 6.775 are staff of the international area, who are not subject to brazilian legislation. of the remaining number, 19.524 occupy positions that are intended for disabled persons. of these employees, 1.077 are disabled persons, which corresponds to 5,52% of the total.
iV. For 2010, an increase of 11% in the number of hours worked in relation to 2009 is estimated. in 2010 it is expected to maintain the same accidents rate as recorded in 2009, which is close to the references for excellence of the international industry, with excellent security conditions in the workplace, even in the face of the expres-sive increase in the company’s activities.
V. the information on the company includes the number of complaints and criticisms received by the customer attendance centers in the petrobras parent company and petrobras distribuidora. the goals for the company for 2010 include only the estimate for the petrobras parent company.
(i) unaudited.
by the Financial accounting Standards board, which was approved by cVm/Snc/SEp directive release 01/2007.
in the statements per business area, the company’s operations are structured according to the following segments: Exploration and production, Supply, gas and Energy, distribution, international and corporate group entities.
1.2 sOcial Balancethe social balance presents social,
environmental and functional quantitative indexes and relevant information with respect to the exercise of corporate citizenship. Some information was obtained through the company’s subsidiary records and managerial information.
46
nOtes tO the Financial statements (cOnsOlidated and PaRent cOmPany)
1 PResentatiOn OF the Financial statements
the financial statements were prepared based on accounting practices adopted in brazil, observing the provisions contained in the corporation law, and incorporate the changes introduced through law 11.638/07 and law 11.941/09 (provisional measure 449/08), complemented by pronouncements, interpretations and orientations of the accounting pronouncements committee (cpc), approved by resolutions of the Federal accounting council (cFc) and rules of the brazilian Securities commission (cVm).
the board of directors authorized the publication of these financial statements in a meeting held on march 19, 2010.
additionally, the company is presenting the following information:
1.1 BUsiness segment RePORtingthe information per business segment was
prepared in accordance with SFaS-131 issued
the financial statements were prepared based on accounting practices adopted in brazil
2 cOnsOlidatiOn PROcedURes
the consolidated financial statements as of december 31, 2009 and 2008 were prepared in accordance with accounting practices adopted in brazil and supplementary provisions of the brazilian Securities commission - cVm and included the financial statements of petróleo brasileiro S.a. - petrobras and the following subsidiaries, jointly controlled subsidiaries and specific purpose entities (SpE):
year ended december 31, 2009 and 2008(in thousand of reais)
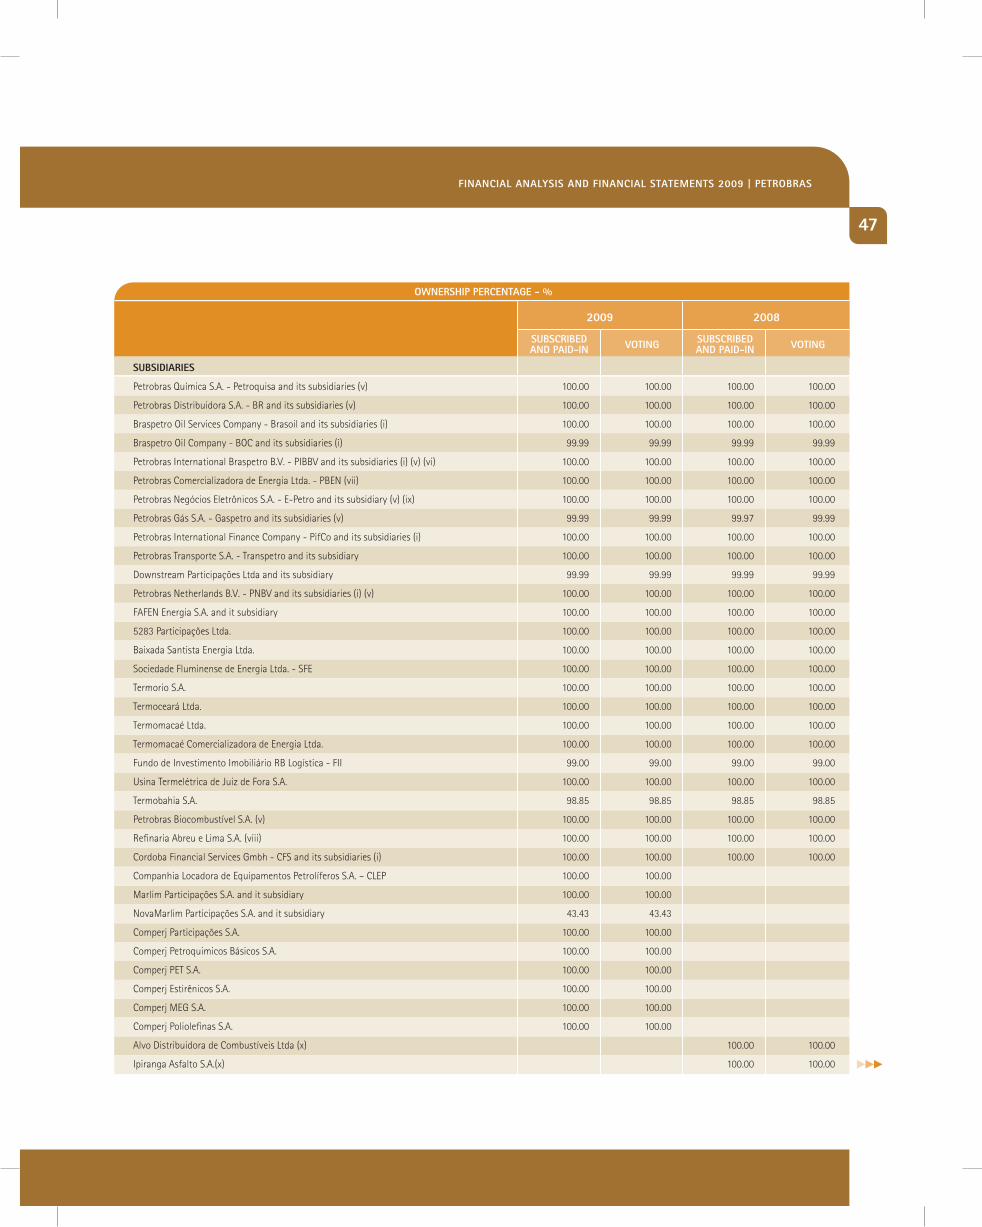
2009
sUBsidiaRies
petrobras química S.a. - petroquisa and its subsidiaries (v) 100.00 100.00 100.00 100.00
petrobras distribuidora S.a. - br and its subsidiaries (v) 100.00 100.00 100.00 100.00
braspetro oil Services company - brasoil and its subsidiaries (i) 100.00 100.00 100.00 100.00
braspetro oil company - boc and its subsidiaries (i) 99.99 99.99 99.99 99.99
petrobras international braspetro b.V. - pibbV and its subsidiaries (i) (v) (vi) 100.00 100.00 100.00 100.00
petrobras comercializadora de Energia ltda. - pbEn (vii) 100.00 100.00 100.00 100.00
petrobras negócios Eletrônicos S.a. - E-petro and its subsidiary (v) (ix) 100.00 100.00 100.00 100.00
petrobras gás S.a. - gaspetro and its subsidiaries (v) 99.99 99.99 99.97 99.99
petrobras international Finance company - pifco and its subsidiaries (i) 100.00 100.00 100.00 100.00
petrobras transporte S.a. - transpetro and its subsidiary 100.00 100.00 100.00 100.00
downstream participações ltda and its subsidiary 99.99 99.99 99.99 99.99
petrobras netherlands b.V. - pnbV and its subsidiaries (i) (v) 100.00 100.00 100.00 100.00
FaFEn Energia S.a. and it subsidiary 100.00 100.00 100.00 100.00
5283 participações ltda. 100.00 100.00 100.00 100.00
baixada Santista Energia ltda. 100.00 100.00 100.00 100.00
Sociedade Fluminense de Energia ltda. - SFE 100.00 100.00 100.00 100.00
termorio S.a. 100.00 100.00 100.00 100.00
termoceará ltda. 100.00 100.00 100.00 100.00
termomacaé ltda. 100.00 100.00 100.00 100.00
termomacaé comercializadora de Energia ltda. 100.00 100.00 100.00 100.00
Fundo de investimento imobiliário rb logística - Fii 99.00 99.00 99.00 99.00
usina termelétrica de juiz de Fora S.a. 100.00 100.00 100.00 100.00
termobahia S.a. 98.85 98.85 98.85 98.85
petrobras biocombustível S.a. (v) 100.00 100.00 100.00 100.00
refinaria abreu e lima S.a. (viii) 100.00 100.00 100.00 100.00
cordoba Financial Services gmbh - cFS and its subsidiaries (i) 100.00 100.00 100.00 100.00
companhia locadora de Equipamentos petrolíferos S.a. – clEp 100.00 100.00
marlim participações S.a. and it subsidiary 100.00 100.00
novamarlim participações S.a. and it subsidiary 43.43 43.43
comperj participações S.a. 100.00 100.00
comperj petroquimicos básicos S.a. 100.00 100.00
comperj pEt S.a. 100.00 100.00
comperj Estirênicos S.a. 100.00 100.00
comperj mEg S.a. 100.00 100.00
comperj poliolefinas S.a. 100.00 100.00
alvo distribuidora de combustíveis ltda (x) 100.00 100.00
ipiranga asfalto S.a.(x) 100.00 100.00
sUBscRiBed and Paid-in
sUBscRiBed and Paid-inVOting VOting
2008
47
Financial analysis And Financial statements 2009 | PetROBRas
OwneRshiP PeRcentage - %
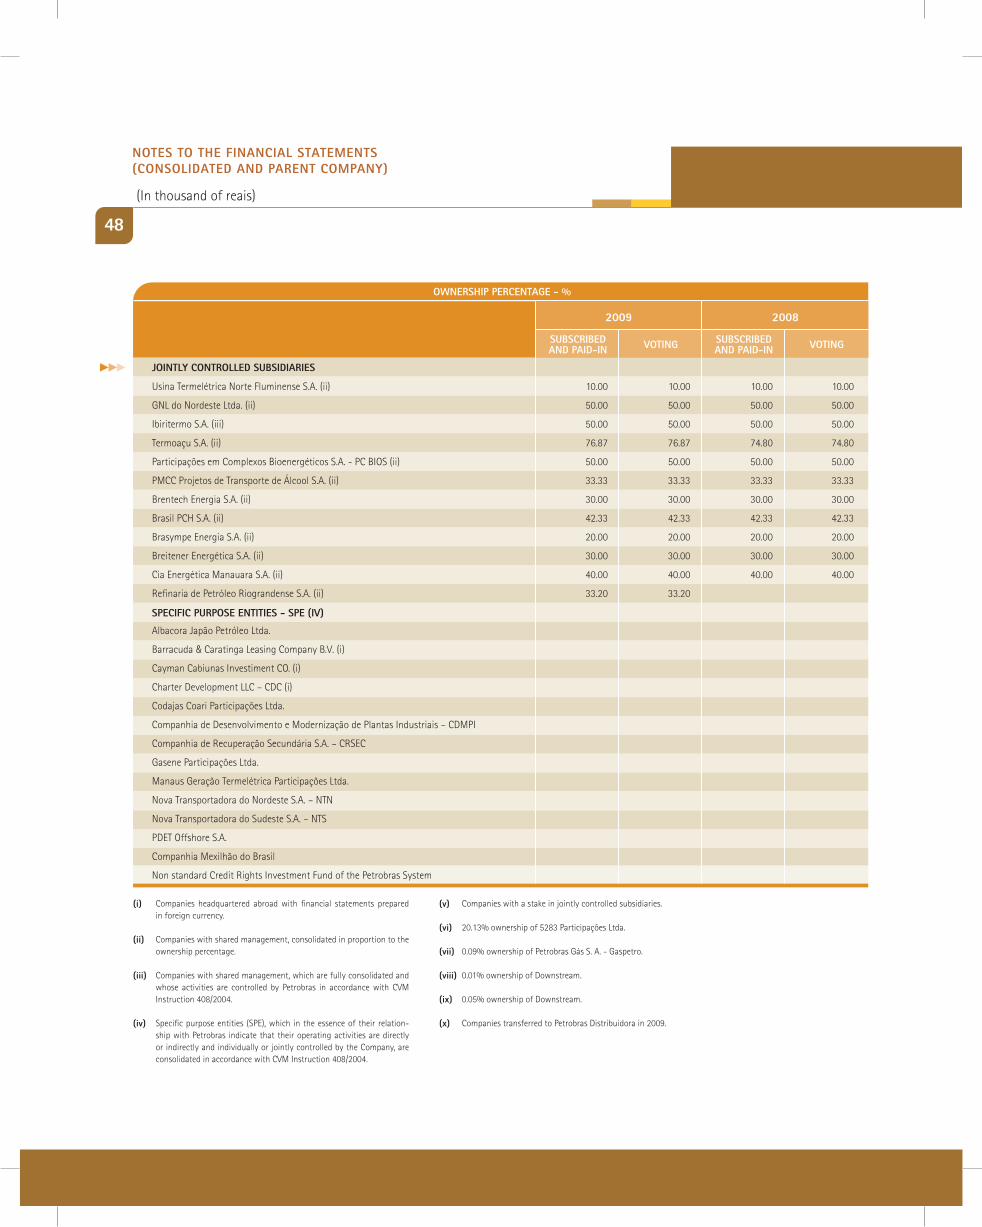
2009
sUBscRiBed and Paid-in
sUBscRiBed and Paid-inVOting VOting
2008
OwneRshiP PeRcentage - %
48
nOtes tO the Financial statements (cOnsOlidated and PaRent cOmPany)
jOintly cOntROlled sUBsidiaRies
usina termelétrica norte Fluminense S.a. (ii) 10.00 10.00 10.00 10.00
gnl do nordeste ltda. (ii) 50.00 50.00 50.00 50.00
ibiritermo S.a. (iii) 50.00 50.00 50.00 50.00
termoaçu S.a. (ii) 76.87 76.87 74.80 74.80
participações em complexos bioenergéticos S.a. - pc bioS (ii) 50.00 50.00 50.00 50.00
pmcc projetos de transporte de Álcool S.a. (ii) 33.33 33.33 33.33 33.33
brentech Energia S.a. (ii) 30.00 30.00 30.00 30.00
brasil pch S.a. (ii) 42.33 42.33 42.33 42.33
brasympe Energia S.a. (ii) 20.00 20.00 20.00 20.00
breitener Energética S.a. (ii) 30.00 30.00 30.00 30.00
cia Energética manauara S.a. (ii) 40.00 40.00 40.00 40.00
refinaria de petróleo riograndense S.a. (ii) 33.20 33.20
companies headquartered abroad with financial statements prepared in foreign currency.
companies with shared management, consolidated in proportion to the ownership percentage.
companies with shared management, which are fully consolidated and whose activities are controlled by petrobras in accordance with cVm instruction 408/2004.
Specific purpose entities (SpE), which in the essence of their relation-ship with petrobras indicate that their operating activities are directly or indirectly and individually or jointly controlled by the company, are consolidated in accordance with cVm instruction 408/2004.
companies with a stake in jointly controlled subsidiaries.
20.13% ownership of 5283 participações ltda.
0.09% ownership of petrobras gás S. a. - gaspetro.
0.01% ownership of downstream.
0.05% ownership of downstream.
companies transferred to petrobras distribuidora in 2009.
(i)
(ii)
(iii)
(iv)
(v)
(vi)
(vii)
(viii)
(ix)
(x)
(in thousand of reais)
albacora japão petróleo ltda.
barracuda & caratinga leasing company b.V. (i)
cayman cabiunas investiment co. (i)
charter development llc – cdc (i)
codajas coari participações ltda.
companhia de desenvolvimento e modernização de plantas industriais – cdmpi
companhia de recuperação Secundária S.a. – crSEc
gasene participações ltda.
manaus geração termelétrica participações ltda.
nova transportadora do nordeste S.a. – ntn
nova transportadora do Sudeste S.a. – ntS
pdEt offshore S.a.
companhia mexilhão do brasil
non standard credit rights investment Fund of the petrobras System
sPeciFic PURPOse entities - sPe (iV)
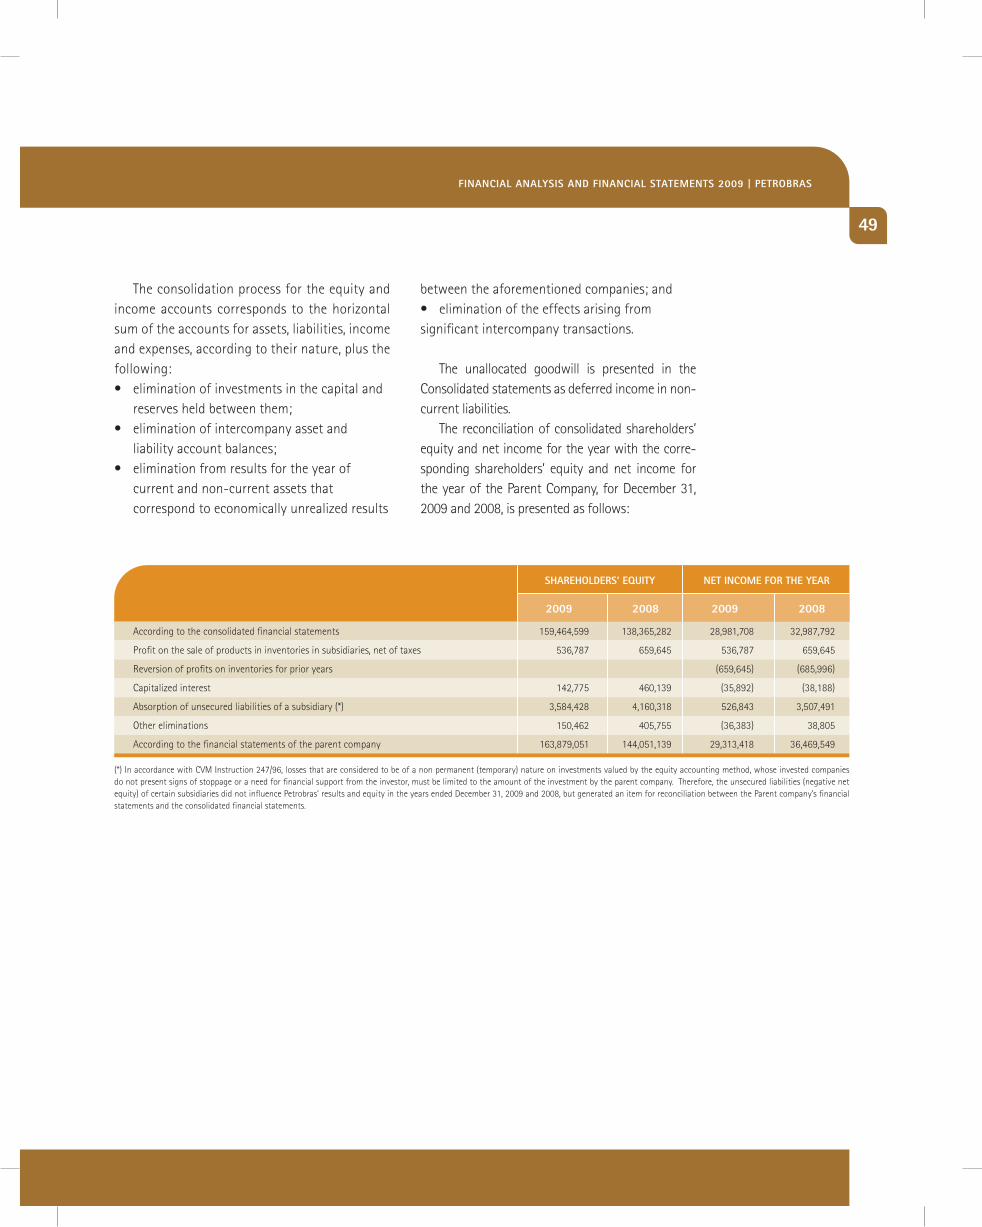
49
2008
shaRehOldeRs’ eqUity
according to the consolidated financial statements 159,464,599 138,365,282 28,981,708 32,987,792
profit on the sale of products in inventories in subsidiaries, net of taxes 536,787 659,645 536,787 659,645
reversion of profits on inventories for prior years (659,645) (685,996)
capitalized interest 142,775 460,139 (35,892) (38,188)
absorption of unsecured liabilities of a subsidiary (*) 3,584,428 4,160,318 526,843 3,507,491
other eliminations 150,462 405,755 (36,383) 38,805
according to the financial statements of the parent company 163,879,051 144,051,139 29,313,418 36,469,549
2009 2009 20082008
net incOme FOR the yeaR
(*) in accordance with cVm instruction 247/96, losses that are considered to be of a non permanent (temporary) nature on investments valued by the equity accounting method, whose invested companies do not present signs of stoppage or a need for financial support from the investor, must be limited to the amount of the investment by the parent company. therefore, the unsecured liabilities (negative net equity) of certain subsidiaries did not influence petrobras’ results and equity in the years ended december 31, 2009 and 2008, but generated an item for reconciliation between the parent company’s financial statements and the consolidated financial statements.
the consolidation process for the equity and income accounts corresponds to the horizontal sum of the accounts for assets, liabilities, income and expenses, according to their nature, plus the following:• eliminationofinvestmentsinthecapitaland reserves held between them;• eliminationofintercompanyassetand liability account balances;• eliminationfromresultsfortheyearof current and non-current assets that correspond to economically unrealized results
between the aforementioned companies; and• eliminationoftheeffectsarisingfromsignificant intercompany transactions.
the unallocated goodwill is presented in the consolidated statements as deferred income in non-current liabilities.
the reconciliation of consolidated shareholders’ equity and net income for the year with the corre-sponding shareholders’ equity and net income for the year of the parent company, for december 31, 2009 and 2008, is presented as follows:
Financial analysis And Financial statements 2009 | PetROBRas
50
3 descRiPtiOn OF signiFicant accOUnting POlicies
3.1 FUnctiOnal cURRencythe company’s functional currency, as established
by management, is the real.the exchange variations on investments in
subsidiaries and affiliated companies with a functional currency different from the parent company are recorded in shareholders’ equity, as an accumulated translation adjustment and are transferred to the statement of income upon realization of the investments.
the income statements of invested companies in a stable economic environment with a functional currency different from the parent company are translated by the monthly average exchange rate, and the other items of shareholders’ equity are translated at the historic rate.
3.2 accOUnting estimatesin the preparation of the financial statements
it is necessary to use estimates for certain assets, liabilities and other transactions. these estimates include: petroleum and gas reserves, liabilities of pension and health plans, depreciation, depletion and amortization, abandonment costs, provisions for contingent liabilities, market value of financial instruments, income tax and social contribution. although management uses assumptions and judgments that are reviewed periodically, the actual results may differ from these estimates.
3.3 cOmPUtatiOn OF incOme, and cURRent and nOn-cURRent assets and liaBilities
income, recognized on the accrual basis, includes income, charges and monetary or exchange gains and losses at official indices or rates, due on current and non-current assets and liabilities, including, when applicable, the effects of adjustments to present value of significant transactions, adjustments to market value or realization value, as well as the allowance for doubtful accounts recorded at a limit considered sufficient to cover possible losses on the realization of accounts receivable.
revenue from the sale of products is recognized in the statement of income when the risks and rewards of ownership have been transferred to the buyer. revenue from services rendered is recognized in the statement of income in proportion to the stage of completion of the service.
the company´s functional currency, as established by management, it the real
nOtes tO the Financial statements (cOnsOlidated and PaRent cOmPany)
(in thousand of reais)
51
3.4 cash and cash eqUiValentscash and cash equivalents are represented by
short-term investments of high liquidity which are readily convertible into cash, with maturity within three months or less of the date of acquisition.
3.5 maRKetaBle secURitiesthe company classifies marketable securities on
initial recognition, based on management’s strategies for these securities in the following categories:• Securities for trading are stated at fair value.
interest, monetary updating and changes resulting from the valuation to fair value are recorded in the income statement when incurred.
• Securitiesavailable for saleare statedat fairvalue. interest and monetary updating are recorded in the income statement, when incurred, while the changes resulting from valuation to fair value are recorded in equity valuation adjustments, in shareholders’ equity, and transferred to the income statement for the year, upon settlement.
• Securities held until maturity are stated atcost of acquisition, plus interest and monetary updating, which are recorded in the income statement when incurred.
3.6 inVentORiesinventories are presented as follows:
• Raw material comprises mainly the stocksof petroleum, which are stated at the average value of the costs for importing and production, adjusted, when applicable, to their realization value;
• Oil and alcohol products are stated at theaverage cost of refining or purchase, adjusted, when applicable, to their realization value;
• Materials and supplies are stated at theaverage purchase cost which does not exceed replacement cost. imports in transit are stated at the identified cost and advances are stated at the amount effectively spent.
3.7 cORPORate inVestments investments in subsidiaries, jointly controlled
subsidiaries and also in affiliated companies over which management has significant influence, and in other companies which are part of the same group or under common control, are valued by the equity accounting method.
Financial analysis And Financial statements 2009 | PetROBRas
3.8 PROPeRty, Plant and eqUiPmentthey are stated at the cost of acquisition,
restated monetarily until december 31, 1995 for the companies headquartered in brazil, and until fiscal year 2002 for the companies headquartered in argentina, and the rights that have as objects tangible assets intended for the maintenance of the company’s activities, resulting from transactions that transfer the benefits, risks and control of these assets, are stated at fair value or, if lower, by the present value of the minimum payments of the contract.
the equipment and facilities for petroleum and gas production, related to the respective developed wells are depreciated according to the monthly volume of production in relation to the proven and developed reserves of each producing field. the straight line method is used for assets with a useful life shorter than the life of the field or for assets that are linked to fields in various stages of production. other equipment and assets not related to petroleum and gas production are depreciated by the straight line method according to their estimated useful life.
Expenditure on exploration and development of petroleum and gas production is recorded according to the successful efforts method. this method establishes that the development costs of the production wells and the successful exploration wells, linked to economically viable reserves, are capitalized, while the geology and geophysics costs should be considered expenses for the period in which they occur and the cost of dry exploration wells and the costs linked to non-commercial reserves should be recorded in the income statement when they are identified as such.
capitalized costs are depreciated using the unit of production method in relation to the proven,
52
developed reserves. these reserves are estimated by the company’s geologists and petroleum engineers according to international standards and are reviewed annually or when there are indications of material changes.
material expenses incurred with maintenance of the industrial units and ships, which include spare parts, dismantling and assembly services, amongst others, are recorded in property, plant and equipment. these stoppages occur in programmed periods, on average every four years, and the respective expenses are depreciated as a production cost until the beginning of the following stoppage.
3.9 intangiBle assetsthey are stated at the cost of acquisition, less
accumulated amortization and impairment. they comprise rights and concessions that include, mainly, the signing bonus paid for obtaining concessions for exploration of petroleum or natural gas, in addition to trademarks and patents, software and goodwill for expectations of future profitability resulting from acquisition of a controlling interest (subsidiaries and jointly controlled subsidiaries). goodwill resulting from acquisition of an interest in affiliated companies is presented in the investment. as from 2009, this goodwill is no longer amortized and is subject to impairment testing. the effect of this amortization in 2008 was r$ 247,972 in the parent company and r$ 340,163 in consolidated.
the signing bonuses are amortized by the unit of production method in relation to the total proven reserves, while the other intangible assets are amortized on a straight line basis according to their estimated useful life.
nOtes tO the Financial statements (cOnsOlidated and PaRent cOmPany)
(in thousand of reais)
53
3.10 deFeRRed chaRges the company maintained the balance of
deferred assets as of december 31, 2008, which will continue to be amortized in up to 10 years, subject to testing for reduction to recoverable value of assets (impairment), in conformity with the law 11.941/09.
3.11 decRease tO RecOVeRaBle ValUe - imPaiRment
the company values the items of property, plant and equipment, of intangible assets with a definite useful life and of deferred charges when there are indications they will not recover their book values. the assets that have an indefinite useful life, such an as goodwill for expectations of future profitability, are tested for impairment annually, regardless of whether there are indications of impairment or not.
When applying the impairment test to the recoverable value of assets, the carrying value of an asset or a cash generating unit is compared with its recoverable value. the recoverable value is the higher value between the net sales value of an asset and its value in use. considering the particularities of the company’s assets, the recoverable value used for evaluation of the impairment test to recoverable value is the value in use, except when specifically indicated.
this use value is estimated based on the present value of future cash flows, resulting
from the company’s best estimates. the cash flows resulting from continuous use of the related assets are adjusted by the specific risks and use the pre-tax discount rate. this rate is derived from the structured post-tax rate in the weighted average cost of capital (Wacc). the main assumptions for the cash flows are: prices based on the last strategic plan published, production curves associated with existing products in the company’s portfolio, market operating costs and investments needed for carrying out the projects.
these evaluations are performed at the lowest level of assets for which there are identifiable cash flows. assets linked to the exploration and development of petroleum and gas are reviewed annually, field by field, in order to identify possible losses on recovery based on the estimated future cash flow.
reversal of previously recognized losses is permitted, except in relation to the reduction in the value of goodwill for expectations of future profitability.
3.12 lOans and Financingthey are initially recognized at fair value
less transaction costs incurred and, after initial recognition, are stated at amortized cost using the effective interest rate method.
Financial analysis And Financial statements 2009 | PetROBRas
54
3.13 cOntRacts with tRansFeR OF BeneFits, RisKs and cOntROl OF assets
the company records the rights that have as their objects tangible assets intended for the maintenance of the company’s activities resulting from operations that transferred the benefits, risks and control of these assets, as well as their correlated liability, in its property, plant and equipment at their fair value or, if lower, at the present value of the minimum payments of the contract.
3.14 aBandOnment OF wells and dismantling OF the aReas
the future liability for abandonment of wells and dismantling the production area is stated at its present value, discounted at a risk free rate and is fully recorded at the time of the declaration of commercial viability of each field, as part of the costs of the related assets (property, plant and equipment) as a balancing item to the provision recorded in the liabilities that will bear these expenses.
3.15 deRiVatiVe Financial instRUments and hedge OPeRatiOns
all the derivative instruments were recognized in the company’s balance sheet, both in assets and in liabilities, and are stated at fair value.
in the operations with derivatives, for hedge against variations in the prices of oil and oil products and currency, the gains and losses resulting from the changes in fair value are recorded in the financial results.
For cash flow hedges, the gains and losses resulting from the changes in their fair value are recorded in equity valuation adjustments, in shareholders’ equity, until their settlement.
3.16 incOme tax and sOcial cOntRiBUtiOn
these taxes are calculated and recorded based on the effective rates in force on the date of preparation of the financial statements. deferred taxes are recognized as a result of temporary differences, tax loss carry forwards and negative basis of social contribution, when applicable.
nOtes tO the Financial statements (cOnsOlidated and PaRent cOmPany)
(in thousand of reais)
55
3.17 emPlOyee BeneFitsthe actuarial commitments with pension
and retirement plans and health-care plans are provisioned for in accordance with cVm resolution 371/00, based on an actuarial calculation prepared annually by an independent actuary, in accordance with the projected credit unit method, net of the guarantor assets of the plan, when applicable, and the costs referring to the increase in the present amount of the liability, resulting from the service provided by the employee, recognized during the employees’ time of service.
the projected credit unit method considers each period of service as a generating fact for an additional unit of benefit, which are accumulated for the computation of the final obligation. additionally, other actuarial assumptions are used, such as estimates of the evolution of costs with health care benefits, biological and economic hypotheses and, also, past data on expenses incurred and contributions from employees.
the actuarial gains and losses resulting from adjustments based on experience and on changes in the actuarial assumptions are included or excluded, respectively, when determining the net actuarial commitment and are amortized over the average period of service remaining for the active employees.
the company also contributes to the national pension and social security plans of international subsidiaries, whose percentages are based on the payroll, and these contributions are taken to the income statement when incurred.
3.18 gOVeRnment sUBsidies and assistance
government subsidies for investments, received as from january 1, 2008, are recognized as revenue throughout the period, compared with the expenses that it intends to offset on a systematic basis, and are applied in petrobras in the following manner:• Subsidies with re-investments: in the same
proportion as the depreciation of the asset, and
• Directsubsidiesrelatedtotheoperatingprofit:directly in the results.the amounts allocated in the results will
be distributed to the tax incentive reserve, in shareholders’ equity.
the balances of the capital reserves referring to donations and subsidies for investments at december 31, 2007 were held in shareholders’ equity until their total use, as established in law 6.404/76.
3.19 ReValUatiOn ReseRVethe company maintained the balance of the
revaluation reserves as of december 31, 2007 until their total realization, in conformity with law 11.638/07.
Financial analysis And Financial statements 2009 | PetROBRas
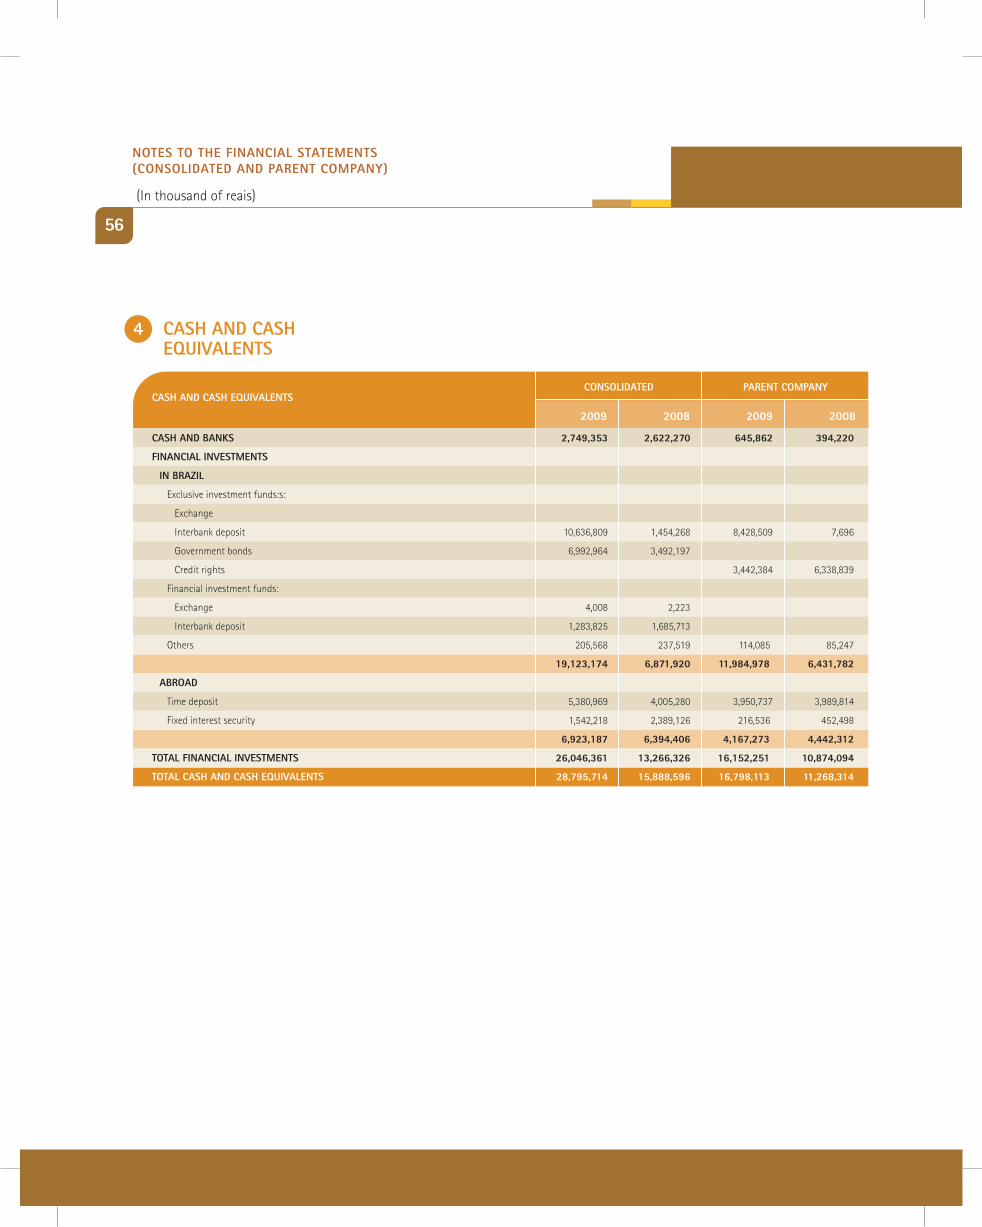
56
4 cash and cash eqUiValents
cOnsOlidated
2009 2008 2009 2008
PaRent cOmPany cash and cash eqUiValents
cash and BanKs 2,749,353 2,622,270 645,862 394,220
Financial inVestments
in BRazil
Exclusive investment funds:s:
Exchange
interbank deposit 10,636,809 1,454,268 8,428,509 7,696
government bonds 6,992,964 3,492,197
credit rights 3,442,384 6,338,839
Financial investment funds:
Exchange 4,008 2,223
interbank deposit 1,283,825 1,685,713
others 205,568 237,519 114,085 85,247
19,123,174 6,871,920 11,984,978 6,431,782
aBROad
time deposit 5,380,969 4,005,280 3,950,737 3,989,814
Fixed interest security 1,542,218 2,389,126 216,536 452,498
6,923,187 6,394,406 4,167,273 4,442,312
tOtal Financial inVestments 26,046,361 13,266,326 16,152,251 10,874,094
tOtal cash and cash eqUiValents 28,795,714 15,888,596 16,798,113 11,268,314
nOtes tO the Financial statements (cOnsOlidated and PaRent cOmPany)
(in thousand of reais)
57
the interest earning bank deposits in brazil have immediate liquidity and comprise quotas in exclusive funds, whose proceeds are invested in federal government bonds and derivative operations, executed by the managers of the funds, with uS dollar futures contracts and interbank deposits (di) guaranteed by the brazilian Futures and commodities Exchange (bm&F). the exclusive funds do not have material financial obligations and are limited to the obligations of daily adjustments of the positions on the bm&F, audit services, service fees related to the custody of assets and execution of financial operations and other administrative expenses. Financial investment balances are recorded at cost, plus accrued income, which is recognized proportionally up to the balance sheet date at amounts not exceeding their respective market values.
at december 31, 2009, the parent company had amounts invested in the petrobras System’s non-standard credit investment fund (Fidc-np). this investment fund is intended predominantly for acquiring performing and/or non-performing credit rights from operations carried out by
companies of the petrobras System, and aims at optimizing the financial management of the cash of the parent company and its subsidiaries. the assignments of credit rights recorded in the current liabilities of the parent company in the amount of r$ 14,318,379 (r$ 5,764,529 in 2008) were offset in the consolidated statements with the amounts invested in the Fidc-np. the investments in government bonds in the Fidc-np are recorded under cash and cash equivalents (consolidated) according to their respective realization terms.
at december 31, 2009 and 2008, the company and its subsidiaries pifco and brasoil had amounts invested abroad in an investment fund that held, amongst others, debt securities of companies of the petrobras System and a specific purpose entity related to the company’s projects, mainly the clEp, malhas and marlim leste (p-53) and gasene projects, equivalent to r$ 12,724,142 (r$ 11,595,171 at december 31, 2008). these amounts refer to the consolidated companies and were offset against the balance of financing in current and non-current liabilities.
Financial analysis And Financial statements 2009 | PetROBRas
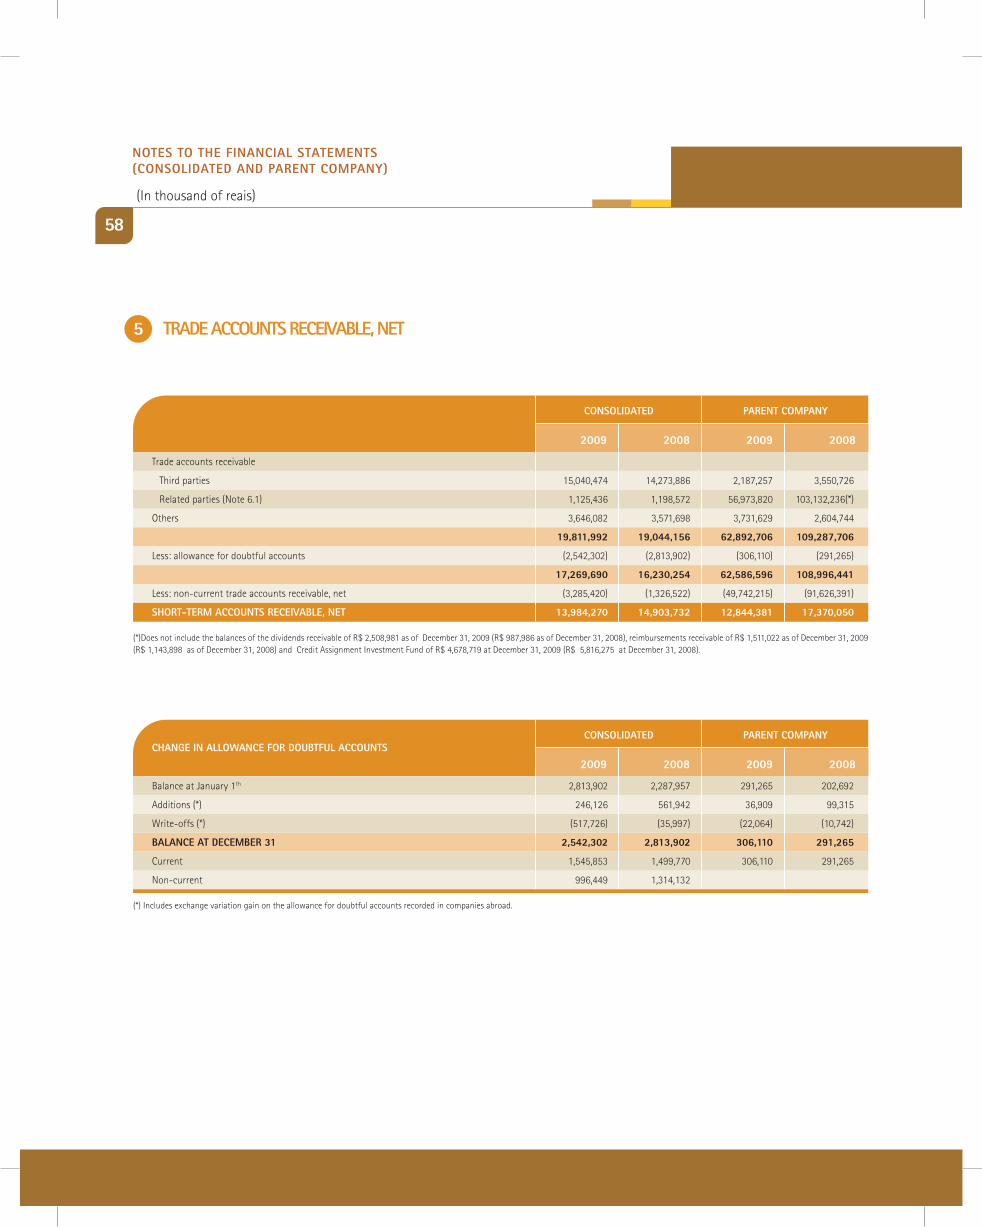
58
5 tRade accOUnts ReceiVaBle, net
cOnsOlidated
trade accounts receivable
third parties 15,040,474 14,273,886 2,187,257 3,550,726
related parties (note 6.1) 1,125,436 1,198,572 56,973,820 103,132,236(*)
others 3,646,082 3,571,698 3,731,629 2,604,744
19,811,992 19,044,156 62,892,706 109,287,706
less: allowance for doubtful accounts (2,542,302) (2,813,902) (306,110) (291,265)
17,269,690 16,230,254 62,586,596 108,996,441
less: non-current trade accounts receivable, net (3,285,420) (1,326,522) (49,742,215) (91,626,391)
shORt-teRm accOUnts ReceiVaBle, net 13,984,270 14,903,732 12,844,381 17,370,050
2009 2008 2009 2008
PaRent cOmPany
(*)does not include the balances of the dividends receivable of r$ 2,508,981 as of december 31, 2009 (r$ 987,986 as of december 31, 2008), reimbursements receivable of r$ 1,511,022 as of december 31, 2009 (r$ 1,143,898 as of december 31, 2008) and credit assignment investment Fund of r$ 4,678,719 at december 31, 2009 (r$ 5,816,275 at december 31, 2008).
cOnsOlidated
balance at january 1th 2,813,902 2,287,957 291,265 202,692
additions (*) 246,126 561,942 36,909 99,315
Write-offs (*) (517,726) (35,997) (22,064) (10,742)
Balance at decemBeR 31 2,542,302 2,813,902 306,110 291,265
current 1,545,853 1,499,770 306,110 291,265
non-current 996,449 1,314,132
2009 2008 2009 2008
PaRent cOmPanychange in allOwance FOR dOUBtFUl accOUnts
(*) includes exchange variation gain on the allowance for doubtful accounts recorded in companies abroad.
nOtes tO the Financial statements (cOnsOlidated and PaRent cOmPany)
(in thousand of reais)
59
6 Related PaRty tRansactiOns
petrobras carries out commercial transactions with its subsidiaries and special purpose entities at market prices under market conditions. the transactions for the purchase of oil and oil products carried out by petrobras with its subsidiary pifco have longer settlement terms due to the fact that pifco is a subsidiary created for this purpose, with the levying of the due charges
in the period. the passing on of prepayments for exports is carried out at the same rates as those obtained by the subsidiary. intercompany loans are made in accordance with market conditions and applicable legislation.
at december 31, 2009 and 2008, losses were not expected on the realization of these accounts receivable.
Financial analysis And Financial statements 2009 | PetROBRas
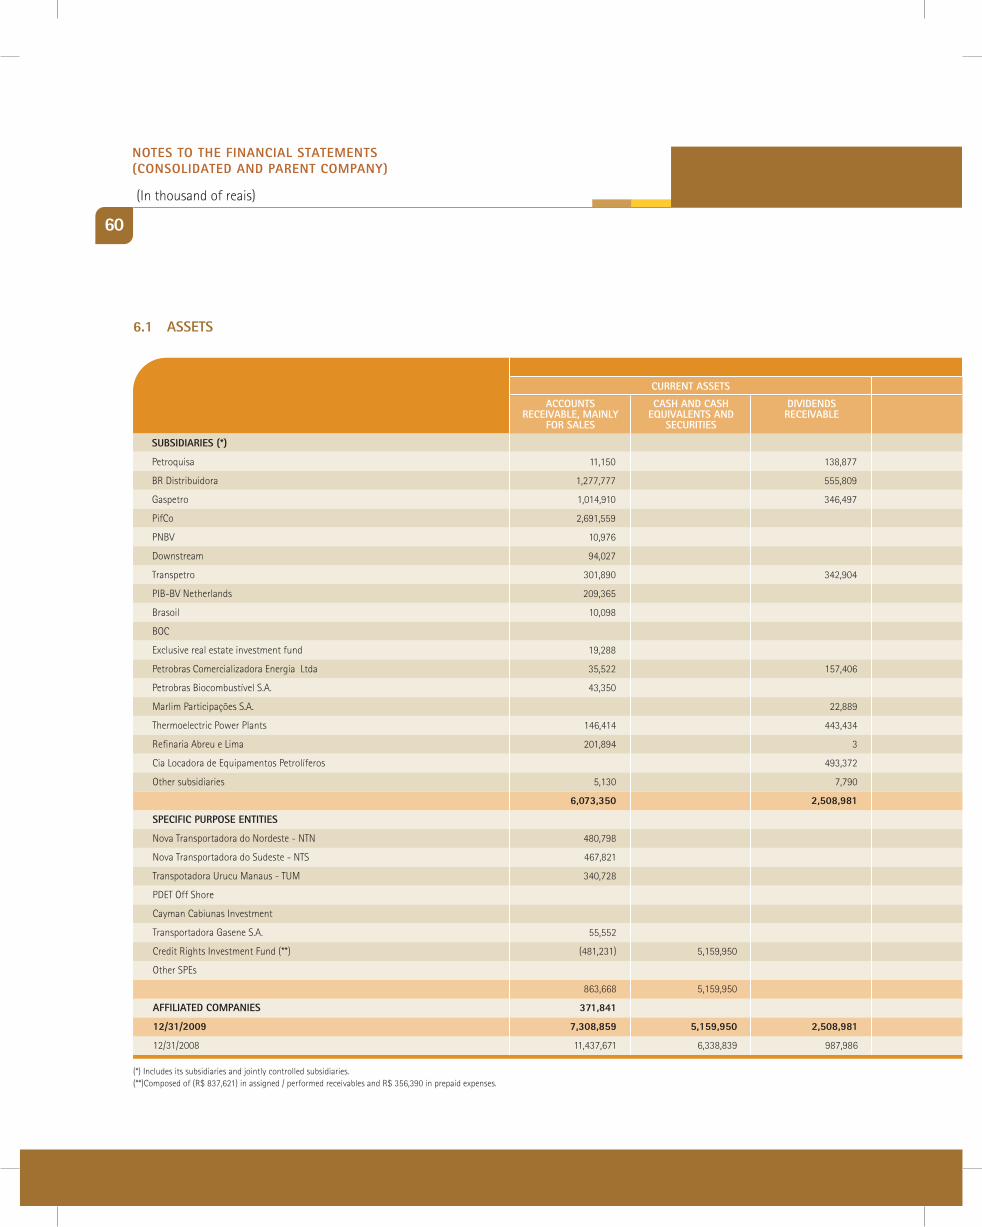
sUBsidiaRies (*)
petroquisa 11,150 138,877 150,027
br distribuidora 1,277,777 555,809 206,289 2,039,875
gaspetro 1,014,910 346,497 3 973,404 14,617 2,349,431
pifco 2,691,559 13,689,388 3,523 16,384,470
pnbV 10,976 8,562 6,712 26,250
downstream 94,027 223,917 317,944
transpetro 301,890 342,904 644,794
pib-bV netherlands 209,365 63,924 273,289
brasoil 10,098 33,259,866 3,699 33,273,663
boc 219,608 265 219,873
Exclusive real estate investment fund 19,288 135,962 155,250
petrobras comercializadora Energia ltda 35,522 157,406 192,928
petrobras biocombustível S.a. 43,350 45,000 88,350
marlim participações S.a. 22,889 22,889
thermoelectric power plants 146,414 443,434 92,381 223,398 905,627
refinaria abreu e lima 201,894 3 201,897
cia locadora de Equipamentos petrolíferos 493,372 493,372
other subsidiaries 5,130 7,790 3,900 14 16,834
6,073,350 2,508,981 285,808 973,404 47,837,083 78,137 57,756,763
sPeciFic PURPOse entities
nova transportadora do nordeste - ntn 480,798 71,236 552,034
nova transportadora do Sudeste - ntS 467,821 34,623 502,444
transpotadora urucu manaus - tum 340,728 340,728
pdEt off Shore 1,151,729 1,151,729
cayman cabiunas investment 253,306 253,306
transportadora gasene S.a. 55,552 55,552
credit rights investment Fund (**) (481,231) 5,159,950 4,678,719
other SpEs 128 128
863,668 5,159,950 1,511,022 7,534,640
aFFiliated cOmPanies 371,841 9,299 381,140
12/31/2009 7,308,859 5,159,950 2,508,981 295,107 973,404 47,837,083 78,137 1,511,022 65,672,543
12/31/2008 11,437,671 6,338,839 987,986 500,530 907,862 89,550,219 130,731 1,143,898 110,997,737
(*) includes its subsidiaries and jointly controlled subsidiaries. (**)composed of (r$ 837,621) in assigned / performed receivables and r$ 356,390 in prepaid expenses.
60
6.1 assets
PaRent cOmPany
cURRent assets
accOUnts ReceiVaBle, mainly
FOR sales
cash and cash eqUiValents and
secURities
diVidendsReceiVaBle
nOtes tO the Financial statements (cOnsOlidated and PaRent cOmPany)
(in thousand of reais)
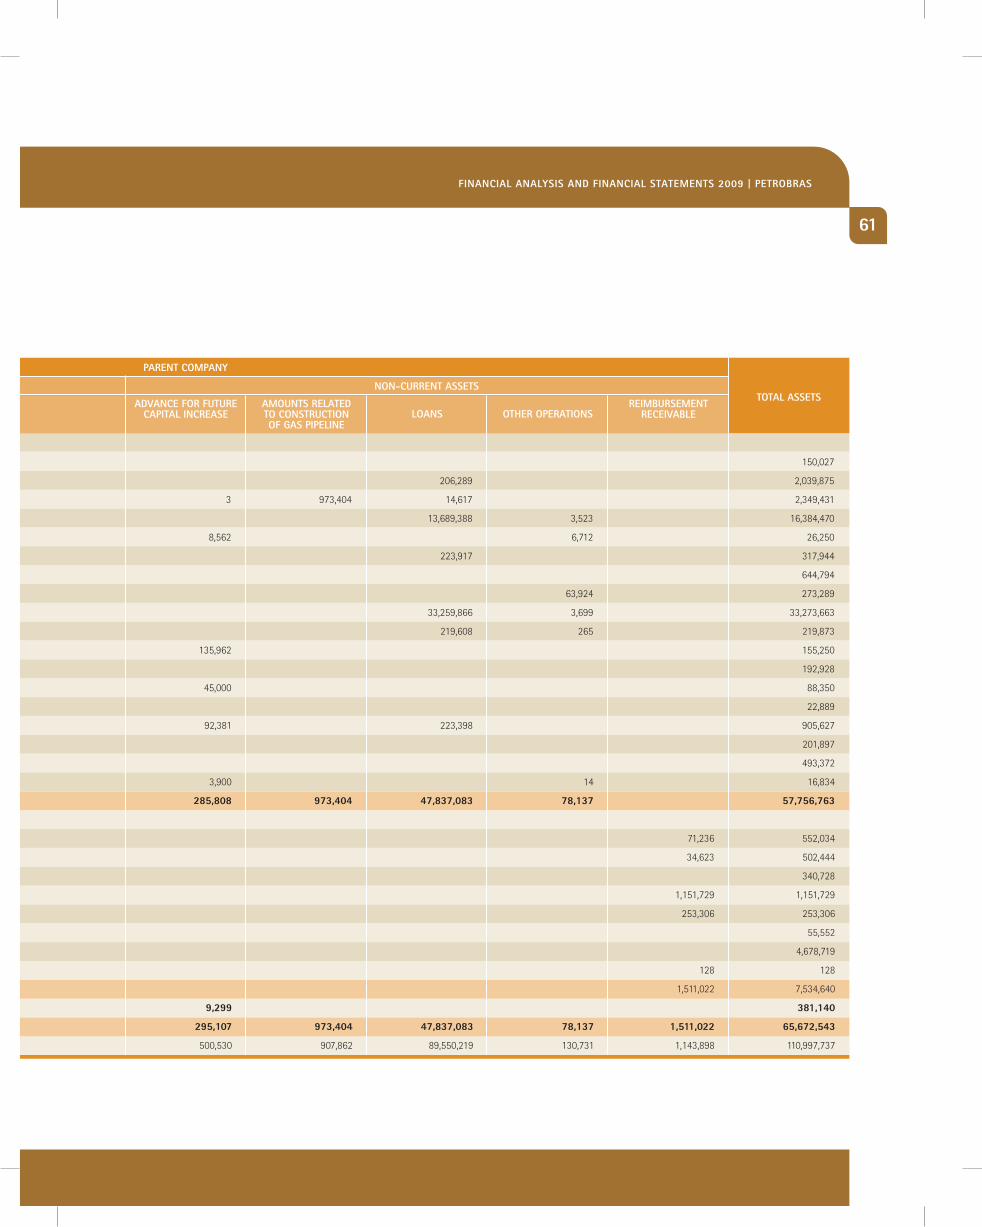
61
Financial analysis And Financial statements 2009 | PetROBRas
sUBsidiaRies (*)
petroquisa 11,150 138,877 150,027
br distribuidora 1,277,777 555,809 206,289 2,039,875
gaspetro 1,014,910 346,497 3 973,404 14,617 2,349,431
pifco 2,691,559 13,689,388 3,523 16,384,470
pnbV 10,976 8,562 6,712 26,250
downstream 94,027 223,917 317,944
transpetro 301,890 342,904 644,794
pib-bV netherlands 209,365 63,924 273,289
brasoil 10,098 33,259,866 3,699 33,273,663
boc 219,608 265 219,873
Exclusive real estate investment fund 19,288 135,962 155,250
petrobras comercializadora Energia ltda 35,522 157,406 192,928
petrobras biocombustível S.a. 43,350 45,000 88,350
marlim participações S.a. 22,889 22,889
thermoelectric power plants 146,414 443,434 92,381 223,398 905,627
refinaria abreu e lima 201,894 3 201,897
cia locadora de Equipamentos petrolíferos 493,372 493,372
other subsidiaries 5,130 7,790 3,900 14 16,834
6,073,350 2,508,981 285,808 973,404 47,837,083 78,137 57,756,763
sPeciFic PURPOse entities
nova transportadora do nordeste - ntn 480,798 71,236 552,034
nova transportadora do Sudeste - ntS 467,821 34,623 502,444
transpotadora urucu manaus - tum 340,728 340,728
pdEt off Shore 1,151,729 1,151,729
cayman cabiunas investment 253,306 253,306
transportadora gasene S.a. 55,552 55,552
credit rights investment Fund (**) (481,231) 5,159,950 4,678,719
other SpEs 128 128
863,668 5,159,950 1,511,022 7,534,640
aFFiliated cOmPanies 371,841 9,299 381,140
12/31/2009 7,308,859 5,159,950 2,508,981 295,107 973,404 47,837,083 78,137 1,511,022 65,672,543
12/31/2008 11,437,671 6,338,839 987,986 500,530 907,862 89,550,219 130,731 1,143,898 110,997,737
adVance FOR FUtURe caPital incRease
amOUnts Related tO cOnstRUctiOn OF gas PiPeline
lOans OtheR OPeRatiOnsReimBURsement
ReceiVaBle
tOtal assetsnOn-cURRent assets
PaRent cOmPany
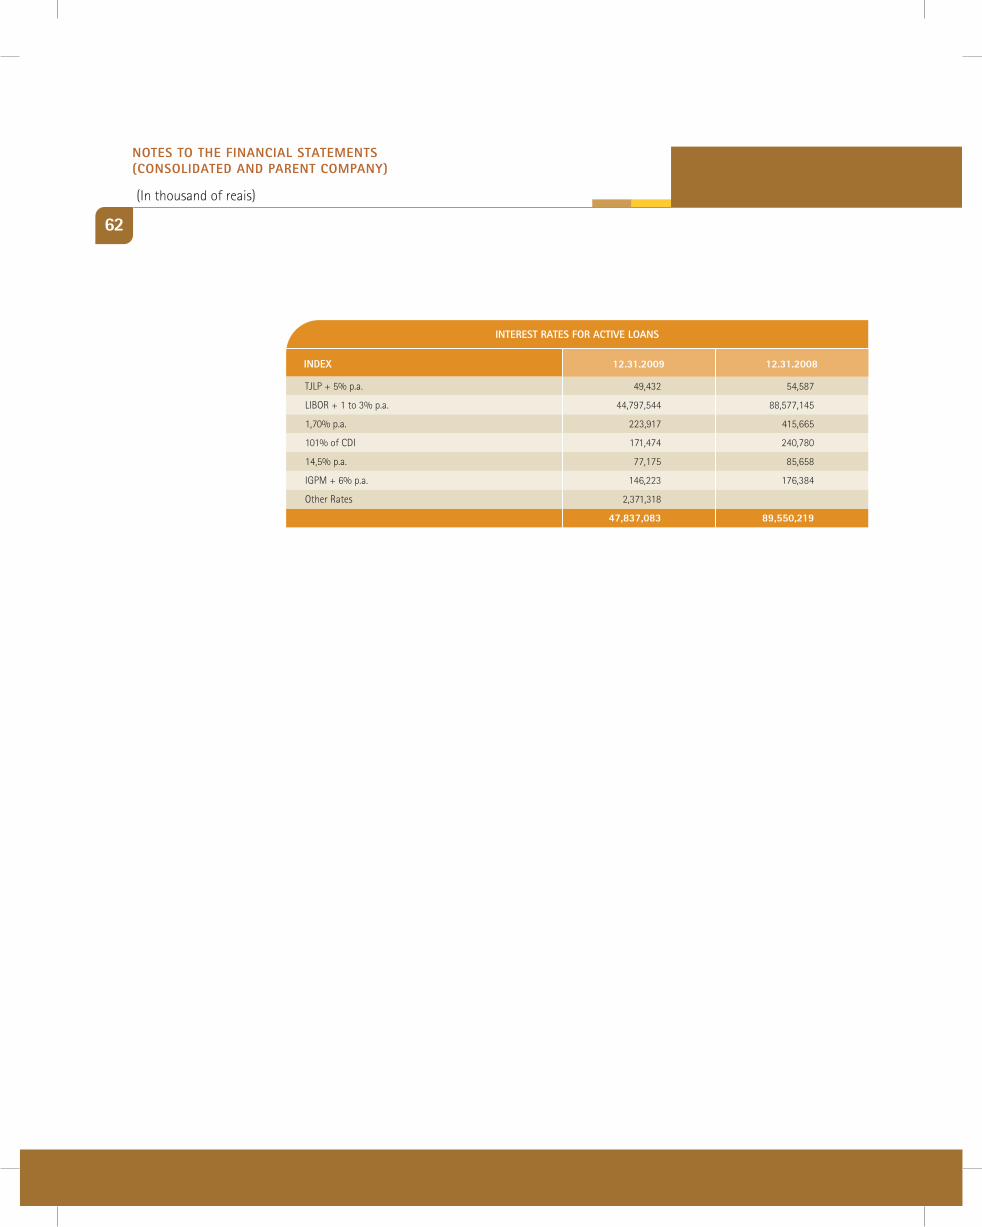
62
tjlp + 5% p.a. 49,432 54,587
libor + 1 to 3% p.a. 44,797,544 88,577,145
1,70% p.a. 223,917 415,665
101% of cdi 171,474 240,780
14,5% p.a. 77,175 85,658
igpm + 6% p.a. 146,223 176,384
other rates 2,371,318
47,837,083 89,550,219
12.31.2009
inteRest Rates FOR actiVe lOans
12.31.2008index
nOtes tO the Financial statements (cOnsOlidated and PaRent cOmPany)
(in thousand of reais)
63
BOliVia-BRazil gas PiPelinethe section of the bolivia-brazil gas pipeline
in bolivia is the property of the company gás transboliviano S.a. (gtb), in which gaspetro holds a minority interest (11%).
a uS$ 350 million turnkey contract for the construction of the bolivian section of the pipeline was entered into with yacimientos petrolíferos Fiscales bolivianos (ypFb), which was subsequently passed on to gtb, and it is being paid off in the form of transport services over 12 years, since january 2000.
at december 31, 2009 the balance of the rights to future transport services, on account of costs already incurred in the construction up to that date, plus interest of 10.7% p.a., is r$ 338,558 (r$ 560,369 at december 31, 2008 ), of which r$ 231.045 is classified in long term receivables as an advance to suppliers (r$ 416,745 at december 31, 2008), which includes the amount of r$ 101,912 (r$ 141,530 at december 31, 2008) related to the acquisition in advance of the right to transport 6 million cubic meters of gas for a period of 40 years (tco - transportation capacity option).
the brazilian section of the gas pipeline is the property of transportadora brasileira gasoduto bolívia-brasil S.a. (tbg), a subsidiary of gaspetro. at december 31, 2009, petrobras’ total receivable from tbg for management, forwarding of costs and financing related to the construction of the gas pipeline and the acquisition in advance of
the right to transport 6 million cubic meters of gas for a period of 40 years (tco) was r$ 973,404 (r$ 907,862 at december 31, 2008), and is classified under long-term assets as accounts receivable, net.
The brazillian section of the gas pipeline is the property of Transportadora Brasileira Gasoduto Bolívia-Brazil S.A. (TBG)
Financial analysis And Financial statements 2009 | PetROBRas
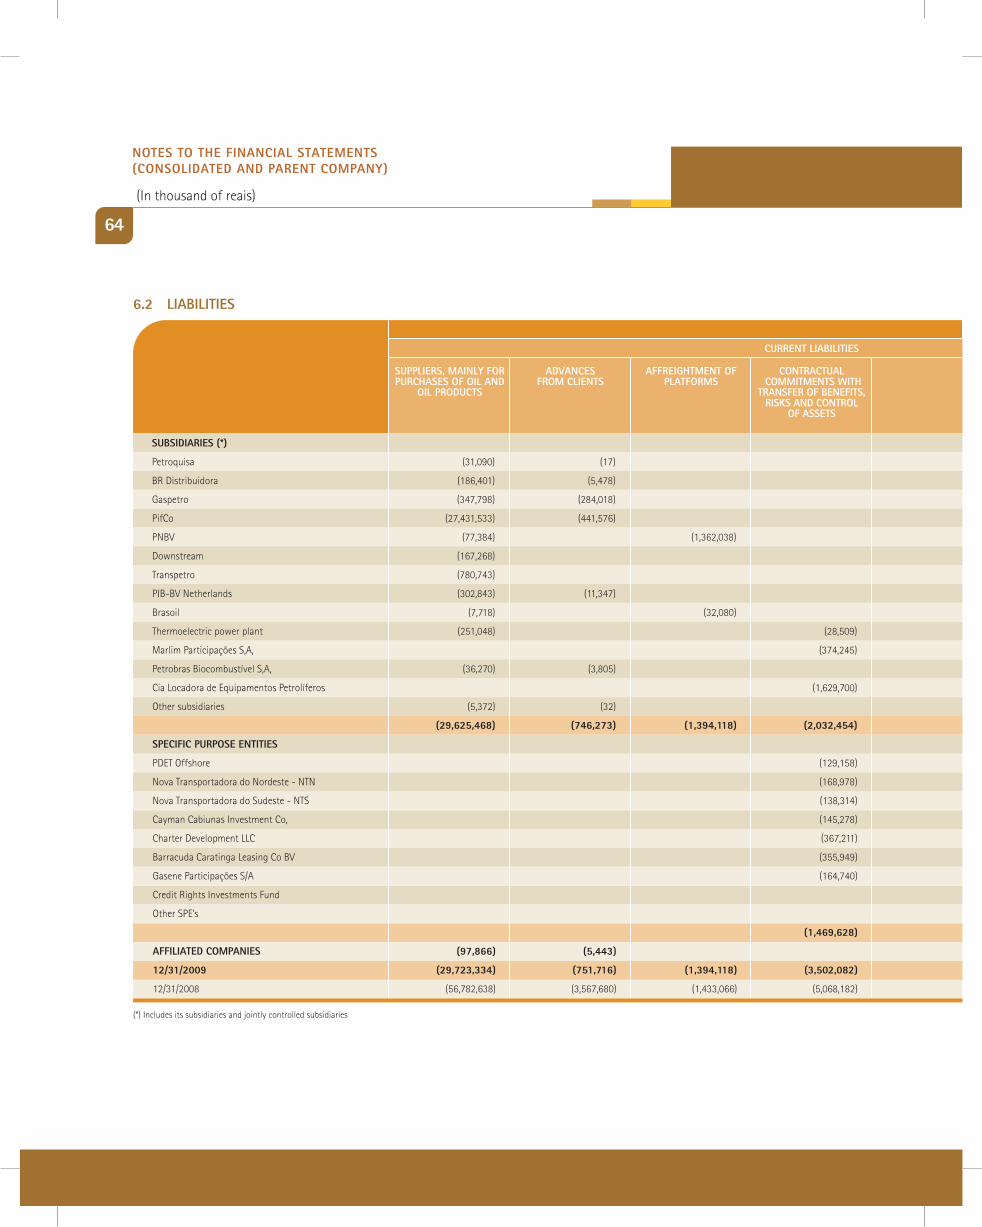
64
6.2 liaBilities
cURRent liaBilities
sUBsidiaRies (*)
petroquisa (31,090) (17) (27) (31,134)
br distribuidora (186,401) (5,478) (396,809) (588,688)
gaspetro (347,798) (284,018) (631,816)
pifco (27,431,533) (441,576) (458,771) (28,331,880)
pnbV (77,384) (1,362,038) (1,439,422)
downstream (167,268) (167,268)
transpetro (780,743) (50) (780,793)
pib-bV netherlands (302,843) (11,347) (5) (314,195)
brasoil (7,718) (32,080) (39,798)
thermoelectric power plant (251,048) (28,509) (582,704) (862,261)
marlim participações S,a, (374,245) (276,574) (650,819)
petrobras biocombustível S,a, (36,270) (3,805) (40,075)
cia locadora de Equipamentos petrolíferos (1,629,700) (2,144,678) (3,774,378)
other subsidiaries (5,372) (32) (2) (157,406) (162,812)
(29,625,468) (746,273) (1,394,118) (2,032,454) (84) (3,161,362) (855,580) (37,815,339)
sPeciFic PURPOse entities
pdEt offshore (129,158) (138,943) (1,503,792) (1,771,893)
nova transportadora do nordeste - ntn (168,978) (1,188,539) (1,357,517)
nova transportadora do Sudeste - ntS (138,314) (1,121,059) (1,259,373)
cayman cabiunas investment co, (145,278) (145,278)
charter development llc (367,211) (2,766,101) (3,133,312)
barracuda caratinga leasing co bV (355,949) (355,949)
gasene participações S/a (164,740) (1,163,017) (1,327,757)
credit rights investments Fund (14,318,379) (14,318,379)
other SpE’s
(1,469,628) (14,318,379) (138,943) (7,742,508) (23,669,458)
aFFiliated cOmPanies (97,866) (5,443) (49,359) (152,668)
12/31/2009 (29,723,334) (751,716) (1,394,118) (3,502,082) (14,318,379) (139,027) (10,903,870) (49,359) (855,580) (61,637,465)
12/31/2008 (56,782,638) (3,567,680) (1,433,066) (5,068,182) (5,764,529) (212,371) (12,654,967) (46,261) (1,054,267) (86,583,961)
adVances FROm clients
sUPPlieRs, mainly FOR PURchases OF Oil and
Oil PROdUcts
aFFReightment OF PlatFORms
cOntRactUal cOmmitments with
tRansFeR OF BeneFits, RisKs and cOntROl
OF assets
(*) includes its subsidiaries and jointly controlled subsidiaries
PaRent cOmPany
nOtes tO the Financial statements (cOnsOlidated and PaRent cOmPany)
(in thousand of reais)
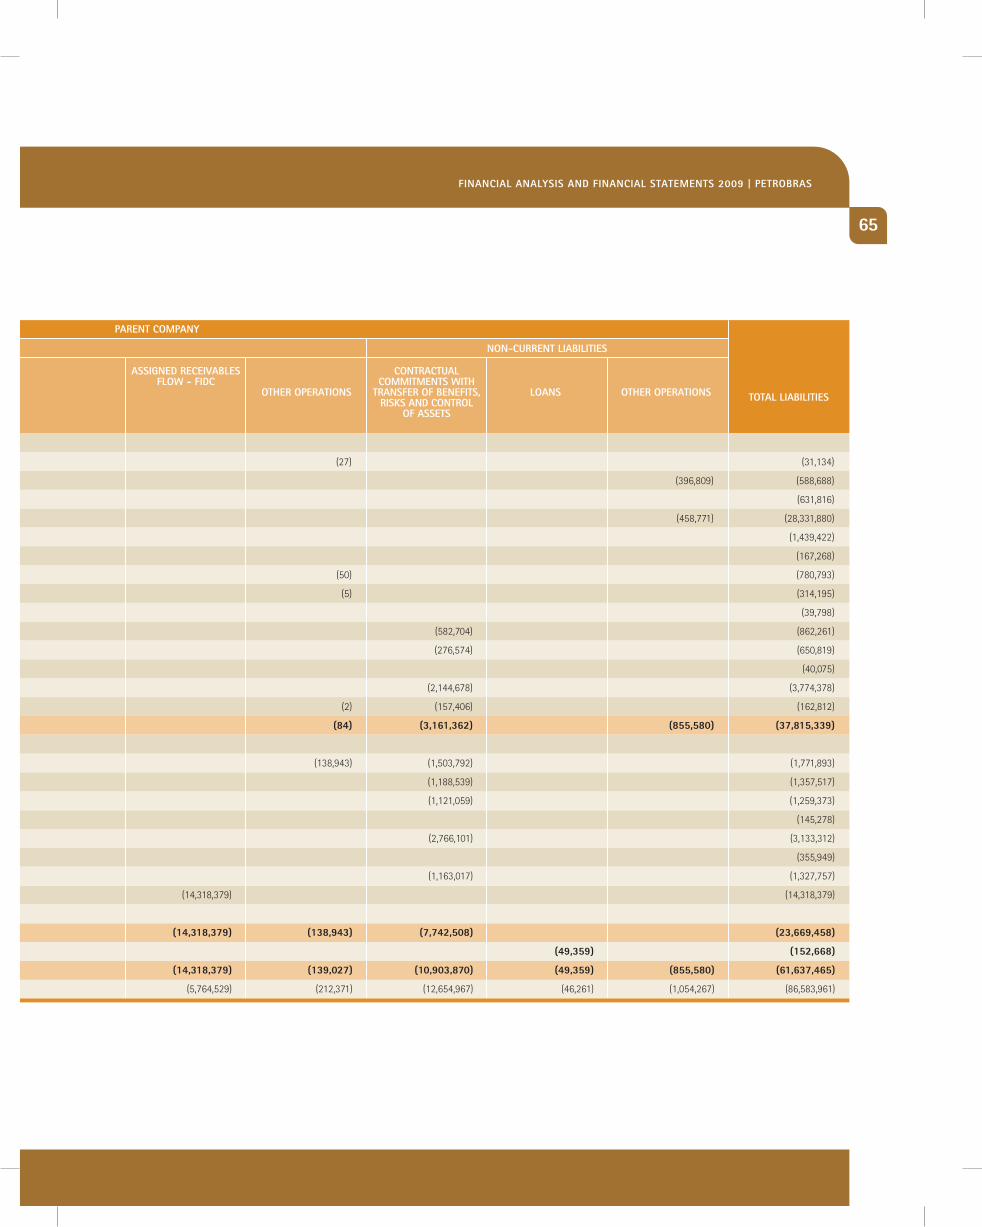
65
cOntRactUal cOmmitments with
tRansFeR OF BeneFits, RisKs and cOntROl
OF assets
assigned ReceiVaBles FlOw - Fidc
OtheR OPeRatiOns lOans OtheR OPeRatiOns tOtal liaBilities
nOn-cURRent liaBilities
Financial analysis And Financial statements 2009 | PetROBRas
cURRent liaBilities
sUBsidiaRies (*)
petroquisa (31,090) (17) (27) (31,134)
br distribuidora (186,401) (5,478) (396,809) (588,688)
gaspetro (347,798) (284,018) (631,816)
pifco (27,431,533) (441,576) (458,771) (28,331,880)
pnbV (77,384) (1,362,038) (1,439,422)
downstream (167,268) (167,268)
transpetro (780,743) (50) (780,793)
pib-bV netherlands (302,843) (11,347) (5) (314,195)
brasoil (7,718) (32,080) (39,798)
thermoelectric power plant (251,048) (28,509) (582,704) (862,261)
marlim participações S,a, (374,245) (276,574) (650,819)
petrobras biocombustível S,a, (36,270) (3,805) (40,075)
cia locadora de Equipamentos petrolíferos (1,629,700) (2,144,678) (3,774,378)
other subsidiaries (5,372) (32) (2) (157,406) (162,812)
(29,625,468) (746,273) (1,394,118) (2,032,454) (84) (3,161,362) (855,580) (37,815,339)
sPeciFic PURPOse entities
pdEt offshore (129,158) (138,943) (1,503,792) (1,771,893)
nova transportadora do nordeste - ntn (168,978) (1,188,539) (1,357,517)
nova transportadora do Sudeste - ntS (138,314) (1,121,059) (1,259,373)
cayman cabiunas investment co, (145,278) (145,278)
charter development llc (367,211) (2,766,101) (3,133,312)
barracuda caratinga leasing co bV (355,949) (355,949)
gasene participações S/a (164,740) (1,163,017) (1,327,757)
credit rights investments Fund (14,318,379) (14,318,379)
other SpE’s
(1,469,628) (14,318,379) (138,943) (7,742,508) (23,669,458)
aFFiliated cOmPanies (97,866) (5,443) (49,359) (152,668)
12/31/2009 (29,723,334) (751,716) (1,394,118) (3,502,082) (14,318,379) (139,027) (10,903,870) (49,359) (855,580) (61,637,465)
12/31/2008 (56,782,638) (3,567,680) (1,433,066) (5,068,182) (5,764,529) (212,371) (12,654,967) (46,261) (1,054,267) (86,583,961)
PaRent cOmPany
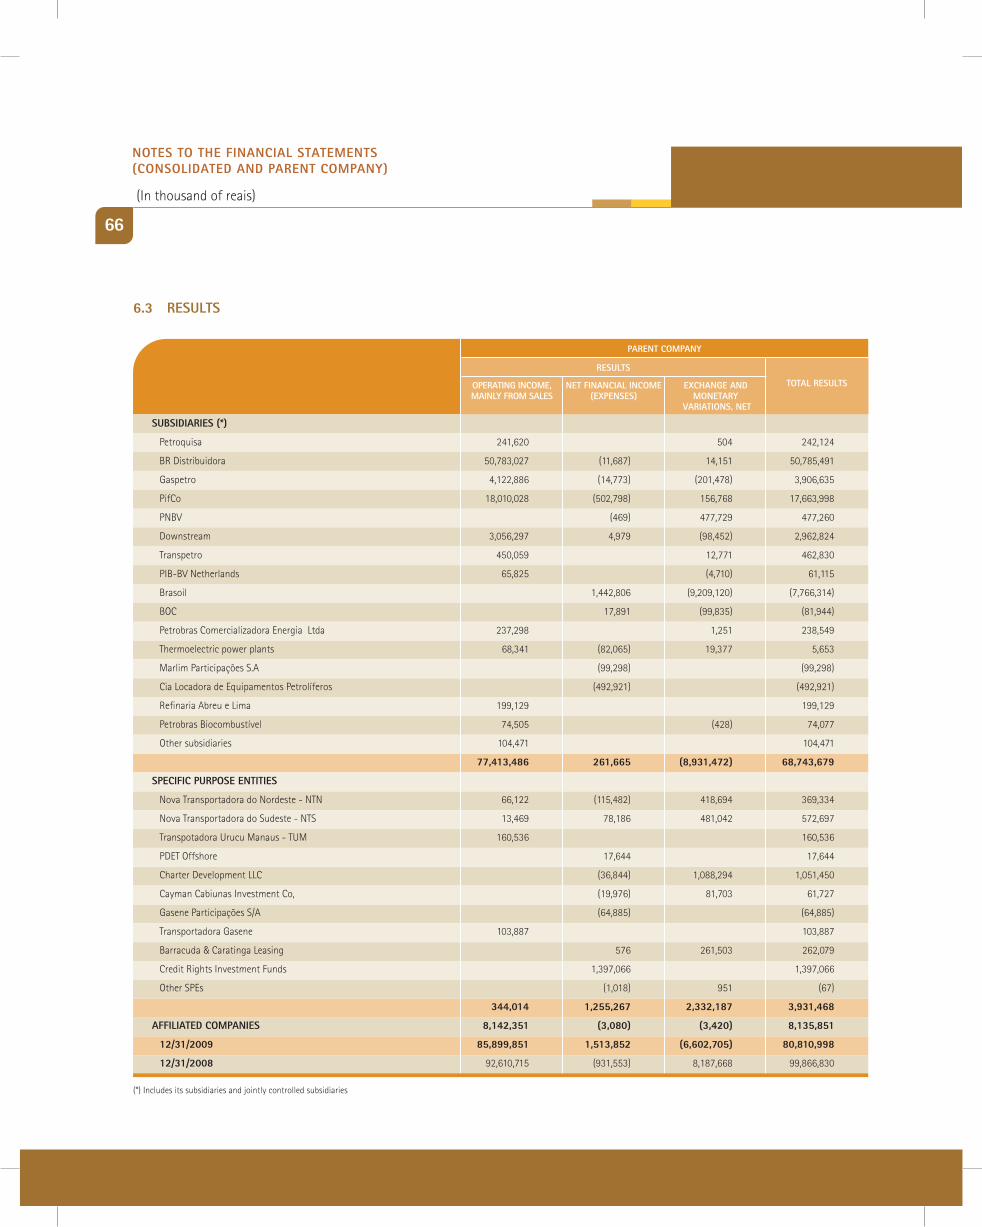
66
6.3 ResUlts
ResUlts
sUBsidiaRies (*)
petroquisa 241,620 504 242,124
br distribuidora 50,783,027 (11,687) 14,151 50,785,491
gaspetro 4,122,886 (14,773) (201,478) 3,906,635
pifco 18,010,028 (502,798) 156,768 17,663,998
pnbV (469) 477,729 477,260
downstream 3,056,297 4,979 (98,452) 2,962,824
transpetro 450,059 12,771 462,830
pib-bV netherlands 65,825 (4,710) 61,115
brasoil 1,442,806 (9,209,120) (7,766,314)
boc 17,891 (99,835) (81,944)
petrobras comercializadora Energia ltda 237,298 1,251 238,549
thermoelectric power plants 68,341 (82,065) 19,377 5,653
marlim participações S.a (99,298) (99,298)
cia locadora de Equipamentos petrolíferos (492,921) (492,921)
refinaria abreu e lima 199,129 199,129
petrobras biocombustível 74,505 (428) 74,077
other subsidiaries 104,471 104,471
77,413,486 261,665 (8,931,472) 68,743,679
sPeciFic PURPOse entities
nova transportadora do nordeste - ntn 66,122 (115,482) 418,694 369,334
nova transportadora do Sudeste - ntS 13,469 78,186 481,042 572,697
transpotadora urucu manaus - tum 160,536 160,536
pdEt offshore 17,644 17,644
charter development llc (36,844) 1,088,294 1,051,450
cayman cabiunas investment co, (19,976) 81,703 61,727
gasene participações S/a (64,885) (64,885)
transportadora gasene 103,887 103,887
barracuda & caratinga leasing 576 261,503 262,079
credit rights investment Funds 1,397,066 1,397,066
other SpEs (1,018) 951 (67)
344,014 1,255,267 2,332,187 3,931,468
aFFiliated cOmPanies 8,142,351 (3,080) (3,420) 8,135,851
12/31/2009 85,899,851 1,513,852 (6,602,705) 80,810,998
12/31/2008 92,610,715 (931,553) 8,187,668 99,866,830
OPeRating incOme, mainly FROm sales
net Financial incOme (exPenses)
exchange and mOnetaRy
VaRiatiOns, net
tOtal ResUlts
PaRent cOmPany
(*) includes its subsidiaries and jointly controlled subsidiaries
nOtes tO the Financial statements (cOnsOlidated and PaRent cOmPany)
(in thousand of reais)
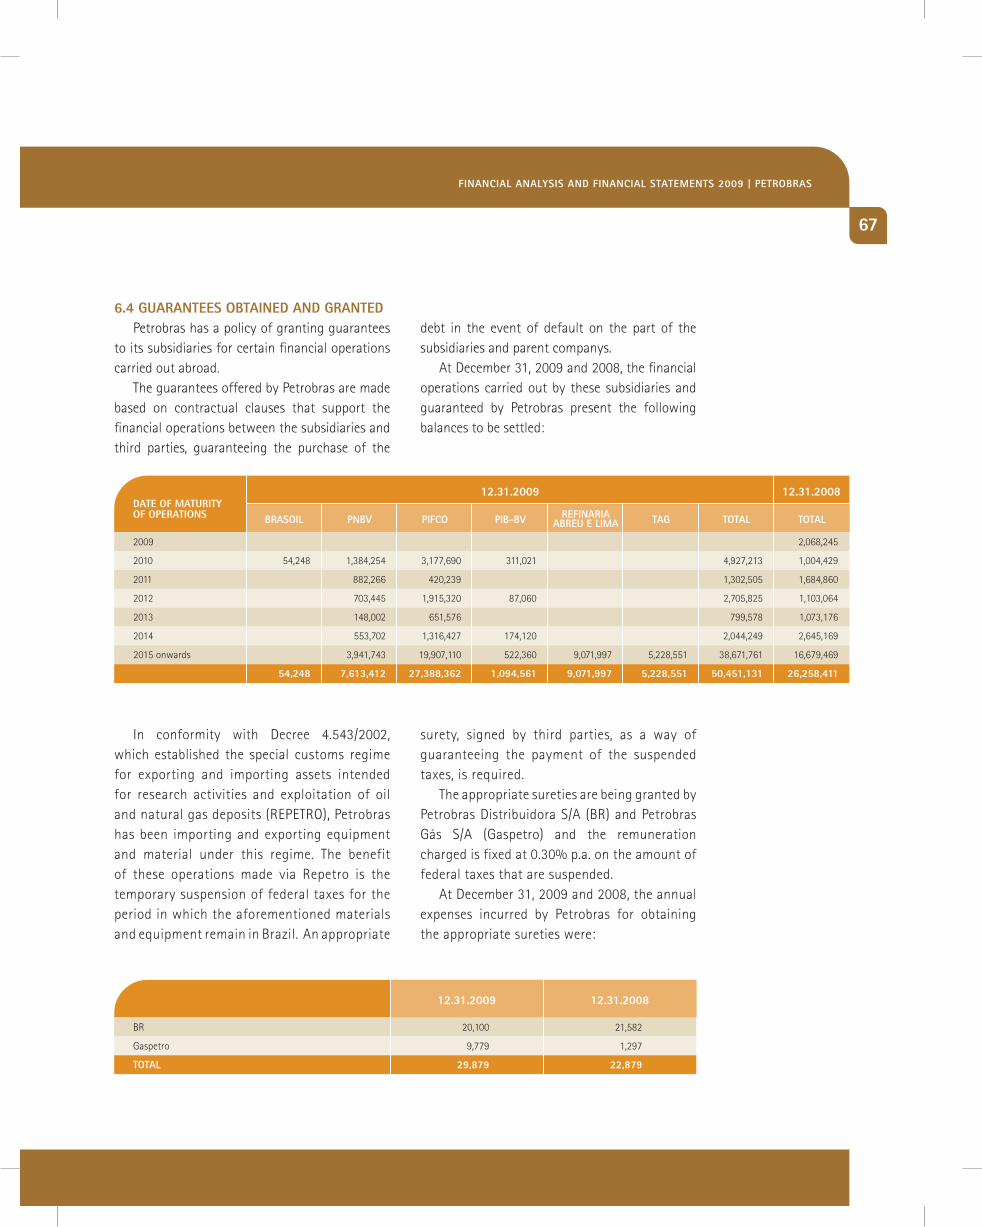
67
6.4 gUaRantees OBtained and gRantedpetrobras has a policy of granting guarantees
to its subsidiaries for certain financial operations carried out abroad.
the guarantees offered by petrobras are made based on contractual clauses that support the financial operations between the subsidiaries and third parties, guaranteeing the purchase of the
debt in the event of default on the part of the subsidiaries and parent companys.
at december 31, 2009 and 2008, the financial operations carried out by these subsidiaries and guaranteed by petrobras present the following balances to be settled:
12.31.2009
2009 2,068,245
2010 54,248 1,384,254 3,177,690 311,021 4,927,213 1,004,429
2011 882,266 420,239 1,302,505 1,684,860
2012 703,445 1,915,320 87,060 2,705,825 1,103,064
2013 148,002 651,576 799,578 1,073,176
2014 553,702 1,316,427 174,120 2,044,249 2,645,169
2015 onwards 3,941,743 19,907,110 522,360 9,071,997 5,228,551 38,671,761 16,679,469
54,248 7,613,412 27,388,362 1,094,561 9,071,997 5,228,551 50,451,131 26,258,411
tOtaltOtaltagReFinaRiaaBReU e limaPiB-BVPiFcOPnBVBRasOil
Date of maturity of operations
12.31.2008
br 20,100 21,582
gaspetro 9,779 1,297
tOtal 29,879 22,879
12.31.2009 12.31.2008
in conformity with decree 4.543/2002, which established the special customs regime for exporting and importing assets intended for research activities and exploitation of oil and natural gas deposits (rEpEtro), petrobras has been importing and exporting equipment and material under this regime. the benefit of these operations made via repetro is the temporary suspension of federal taxes for the period in which the aforementioned materials and equipment remain in brazil. an appropriate
surety, signed by third parties, as a way of guaranteeing the payment of the suspended taxes, is required.
the appropriate sureties are being granted by petrobras distribuidora S/a (br) and petrobras gás S/a (gaspetro) and the remuneration charged is fixed at 0.30% p.a. on the amount of federal taxes that are suspended.
at december 31, 2009 and 2008, the annual expenses incurred by petrobras for obtaining the appropriate sureties were:
Financial analysis And Financial statements 2009 | PetROBRas
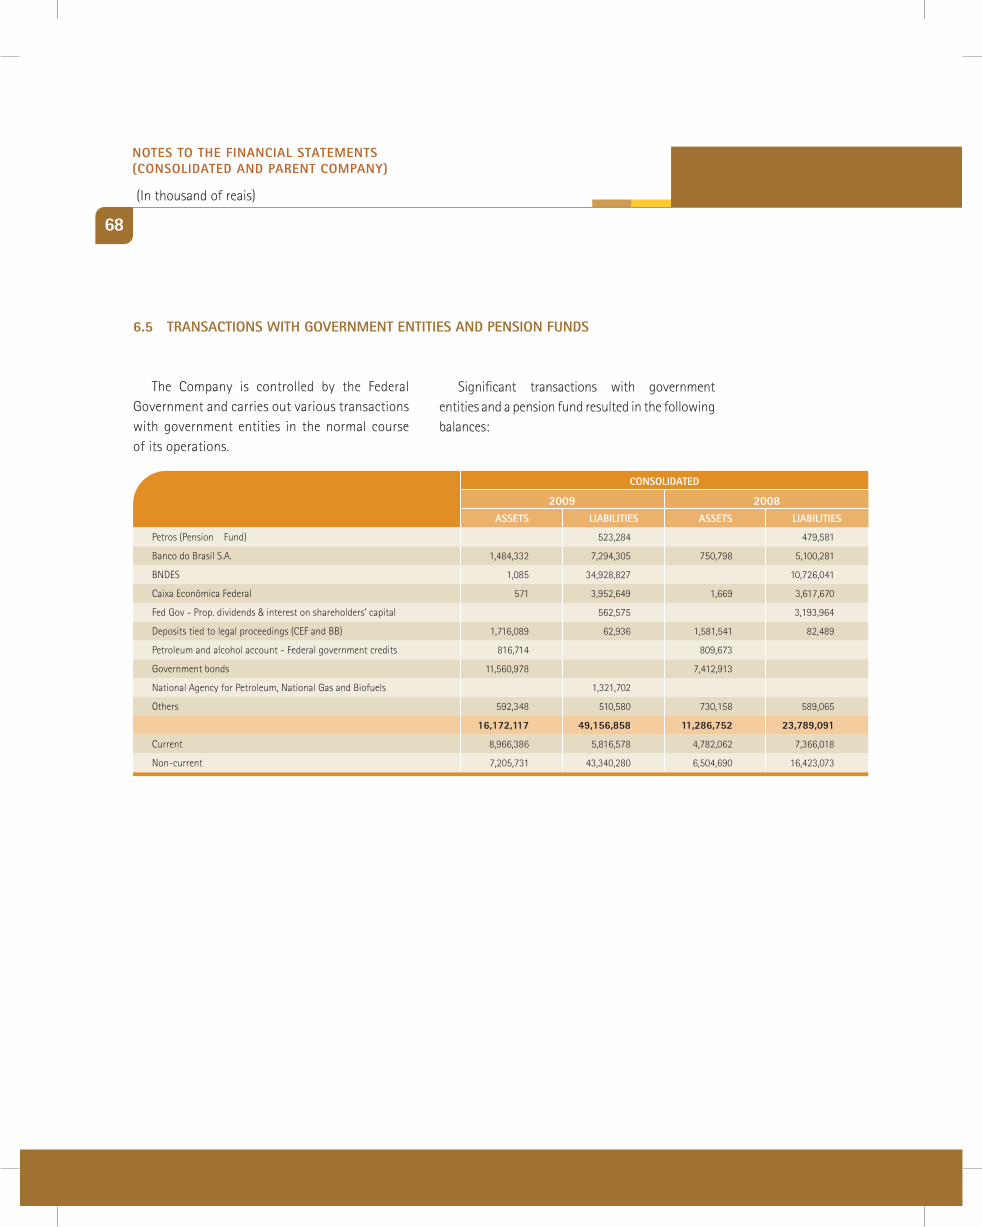
68
2009
petros (pension Fund) 523,284 479,581
banco do brasil S.a. 1,484,332 7,294,305 750,798 5,100,281
bndES 1,085 34,928,827 10,726,041
caixa Econômica Federal 571 3,952,649 1,669 3,617,670
Fed gov - prop. dividends & interest on shareholders’ capital 562,575 3,193,964
deposits tied to legal proceedings (cEF and bb) 1,716,089 62,936 1,581,541 82,489
petroleum and alcohol account - Federal government credits 816,714 809,673
government bonds 11,560,978 7,412,913
national agency for petroleum, national gas and biofuels 1,321,702
others 592,348 510,580 730,158 589,065
16,172,117 49,156,858 11,286,752 23,789,091
current 8,966,386 5,816,578 4,782,062 7,366,018
non-current 7,205,731 43,340,280 6,504,690 16,423,073
assets liaBilities assets liaBilities
cOnsOlidated
2008
the company is controlled by the Federal government and carries out various transactions with government entities in the normal course of its operations.
Significant transactions with government entities and a pension fund resulted in the following balances:
6.5 tRansactiOns with gOVeRnment entities and PensiOn FUnds
nOtes tO the Financial statements (cOnsOlidated and PaRent cOmPany)
(in thousand of reais)
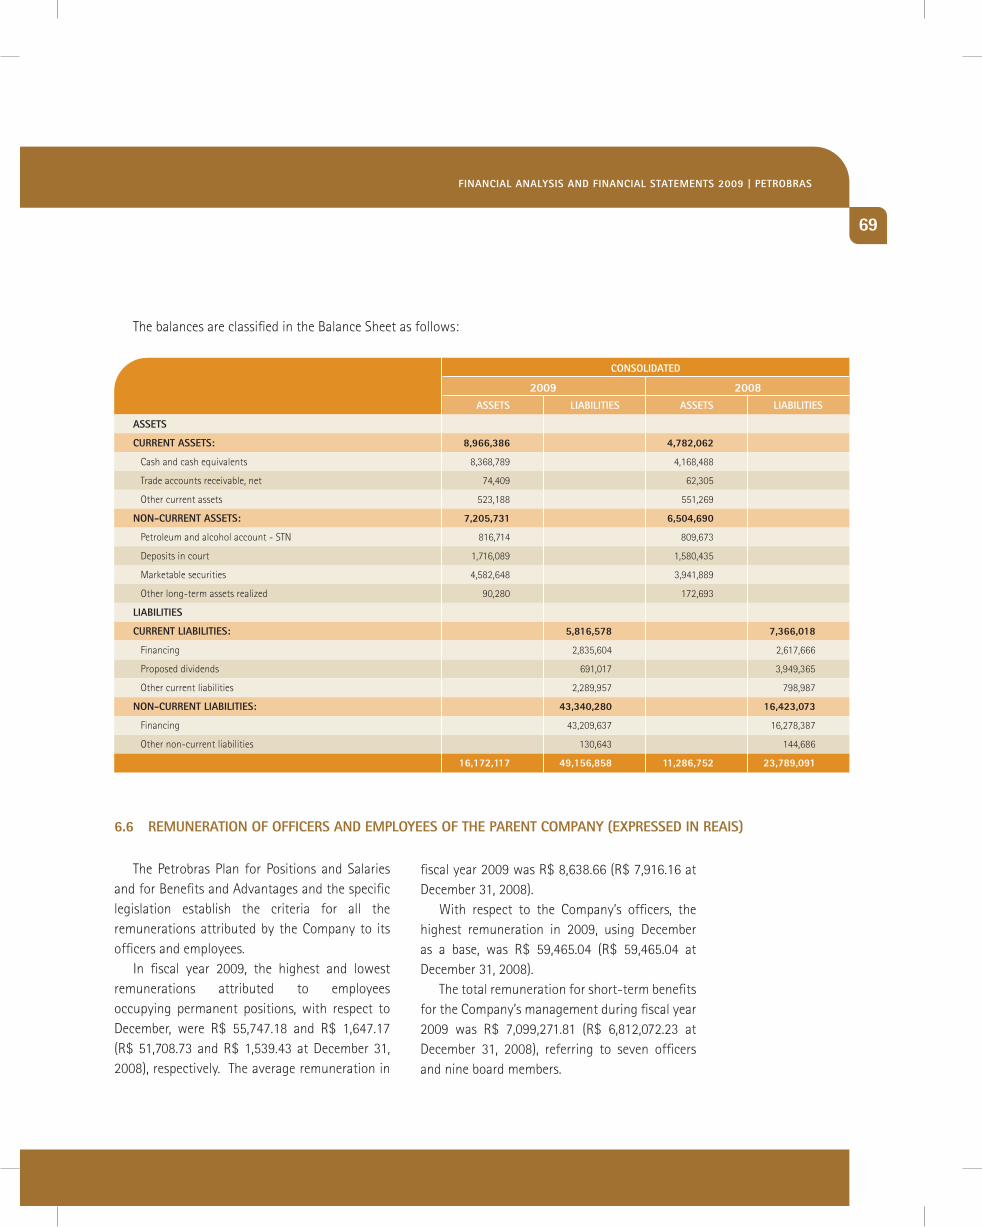
69
2009
assets
cURRent assets: 8,966,386 4,782,062
cash and cash equivalents 8,368,789 4,168,488
trade accounts receivable, net 74,409 62,305
other current assets 523,188 551,269
nOn-cURRent assets: 7,205,731 6,504,690
petroleum and alcohol account - Stn 816,714 809,673
deposits in court 1,716,089 1,580,435
marketable securities 4,582,648 3,941,889
other long-term assets realized 90,280 172,693
liaBilities
cURRent liaBilities: 5,816,578 7,366,018
Financing 2,835,604 2,617,666
proposed dividends 691,017 3,949,365
other current liabilities 2,289,957 798,987
nOn-cURRent liaBilities: 43,340,280 16,423,073
Financing 43,209,637 16,278,387
other non-current liabilities 130,643 144,686
16,172,117 49,156,858 11,286,752 23,789,091
assets liaBilities assets liaBilities
cOnsOlidated
2008
the balances are classified in the balance Sheet as follows:
the petrobras plan for positions and Salaries and for benefits and advantages and the specific legislation establish the criteria for all the remunerations attributed by the company to its officers and employees.
in fiscal year 2009, the highest and lowest remunerations attributed to employees occupying permanent positions, with respect to december, were r$ 55,747.18 and r$ 1,647.17 (r$ 51,708.73 and r$ 1,539.43 at december 31, 2008), respectively. the average remuneration in
fiscal year 2009 was r$ 8,638.66 (r$ 7,916.16 at december 31, 2008).
With respect to the company’s officers, the highest remuneration in 2009, using december as a base, was r$ 59,465.04 (r$ 59,465.04 at december 31, 2008).
the total remuneration for short-term benefits for the company’s management during fiscal year 2009 was r$ 7,099,271.81 (r$ 6,812,072.23 at december 31, 2008), referring to seven officers and nine board members.
6.6 RemUneRatiOn OF OFFiceRs and emPlOyees OF the PaRent cOmPany (exPRessed in Reais)
Financial analysis And Financial statements 2009 | PetROBRas
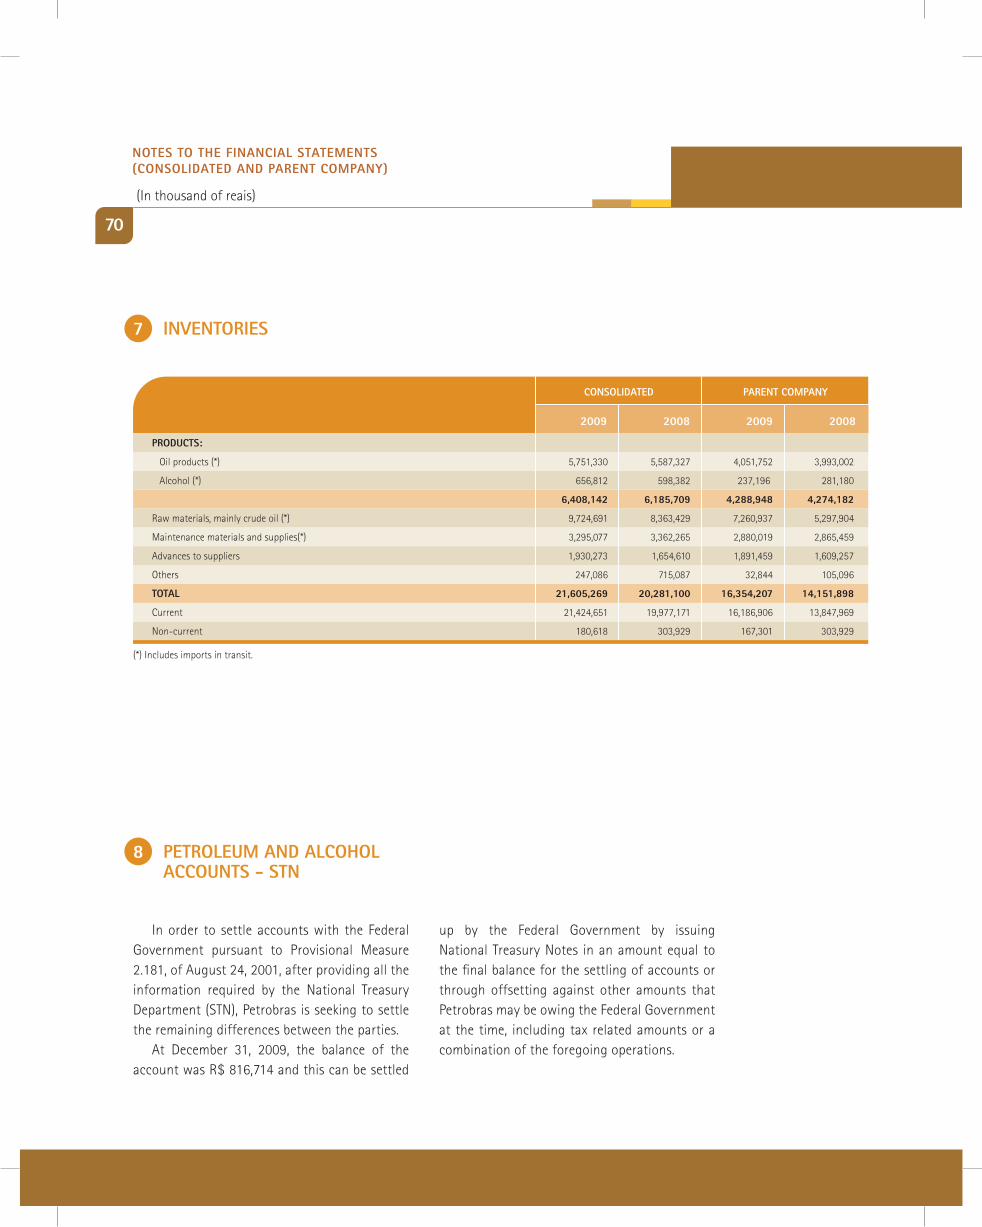
70
7 inVentORies
cOnsOlidated
PROdUcts:
oil products (*) 5,751,330 5,587,327 4,051,752 3,993,002
alcohol (*) 656,812 598,382 237,196 281,180
6,408,142 6,185,709 4,288,948 4,274,182
raw materials, mainly crude oil (*) 9,724,691 8,363,429 7,260,937 5,297,904
maintenance materials and supplies(*) 3,295,077 3,362,265 2,880,019 2,865,459
advances to suppliers 1,930,273 1,654,610 1,891,459 1,609,257
others 247,086 715,087 32,844 105,096
tOtal 21,605,269 20,281,100 16,354,207 14,151,898
current 21,424,651 19,977,171 16,186,906 13,847,969
non-current 180,618 303,929 167,301 303,929
2009 2008 2009 2008
PaRent cOmPany
(*) includes imports in transit.
8 PetROleUm and alcOhOl accOUnts - stn
in order to settle accounts with the Federal government pursuant to provisional measure 2.181, of august 24, 2001, after providing all the information required by the national treasury department (Stn), petrobras is seeking to settle the remaining differences between the parties.
at december 31, 2009, the balance of the account was r$ 816,714 and this can be settled
up by the Federal government by issuing national treasury notes in an amount equal to the final balance for the settling of accounts or through offsetting against other amounts that petrobras may be owing the Federal government at the time, including tax related amounts or a combination of the foregoing operations.
nOtes tO the Financial statements (cOnsOlidated and PaRent cOmPany)
(in thousand of reais)
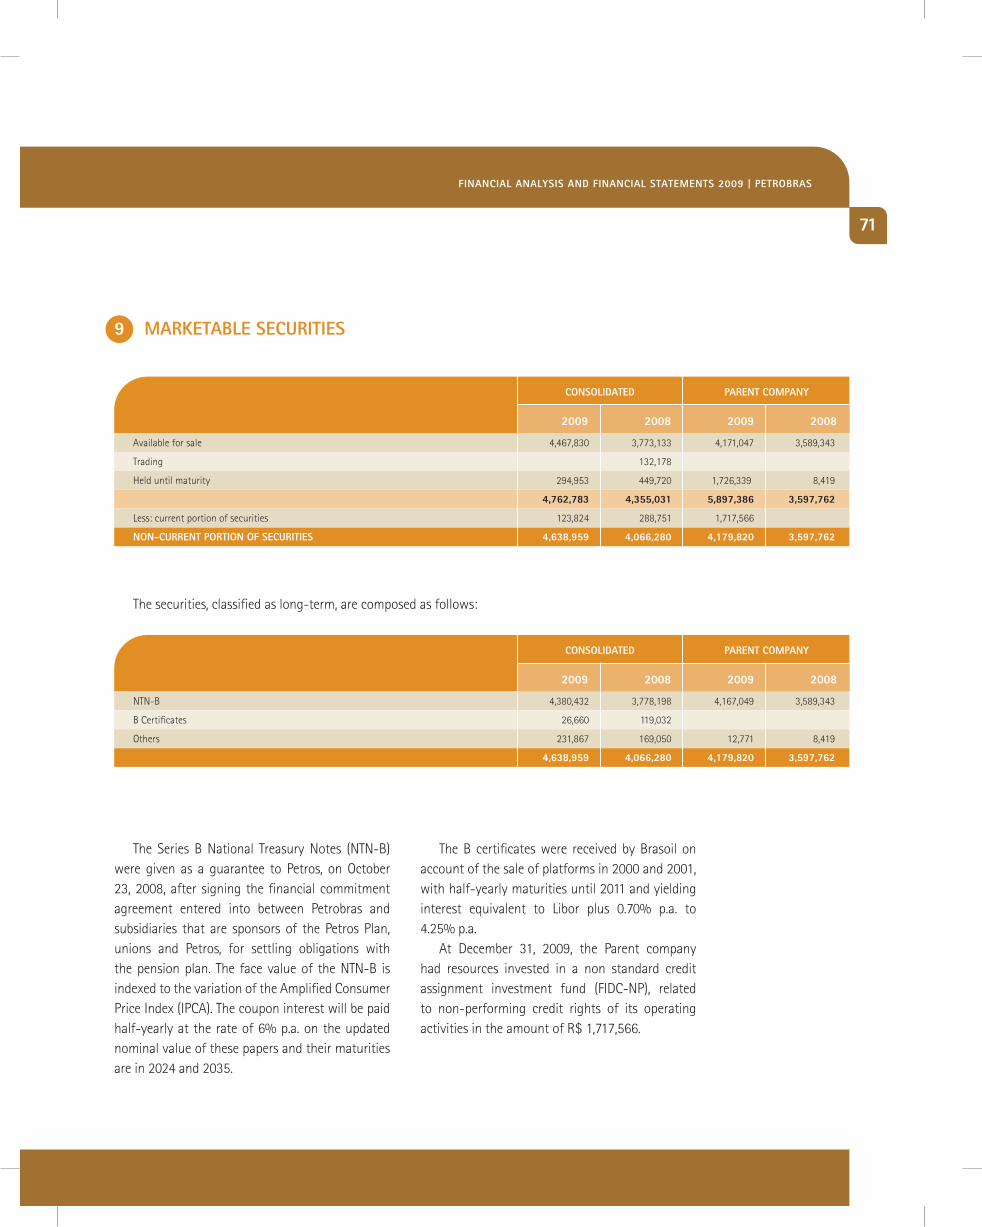
71
cOnsOlidated
available for sale 4,467,830 3,773,133 4,171,047 3,589,343
trading 132,178
held until maturity 294,953 449,720 1,726,339 8,419
4,762,783 4,355,031 5,897,386 3,597,762
less: current portion of securities 123,824 288,751 1,717,566
nOn-cURRent PORtiOn OF secURities 4,638,959 4,066,280 4,179,820 3,597,762
2009 2008 2009 2008
PaRent cOmPany
cOnsOlidated
ntn-b 4,380,432 3,778,198 4,167,049 3,589,343
b certificates 26,660 119,032
others 231,867 169,050 12,771 8,419
4,638,959 4,066,280 4,179,820 3,597,762
2009 2008 2009 2008
PaRent cOmPany
9 maRKetaBle secURities
the Series b national treasury notes (ntn-b) were given as a guarantee to petros, on october 23, 2008, after signing the financial commitment agreement entered into between petrobras and subsidiaries that are sponsors of the petros plan, unions and petros, for settling obligations with the pension plan. the face value of the ntn-b is indexed to the variation of the amplified consumer price index (ipca). the coupon interest will be paid half-yearly at the rate of 6% p.a. on the updated nominal value of these papers and their maturities are in 2024 and 2035.
the b certificates were received by brasoil on account of the sale of platforms in 2000 and 2001, with half-yearly maturities until 2011 and yielding interest equivalent to libor plus 0.70% p.a. to 4.25% p.a.
at december 31, 2009, the parent company had resources invested in a non standard credit assignment investment fund (Fidc-np), related to non-performing credit rights of its operating activities in the amount of r$ 1,717,566.
the securities, classified as long-term, are composed as follows:
Financial analysis And Financial statements 2009 | PetROBRas
72
10 PROject Financing
petrobras carries out projects jointly with bra-zilian and international financial agents and with companies in the petroleum and energy sector for the purpose of making feasible the investments needed in the business areas in which the com-pany operates.
10.1 sPeciFic PURPOse entitiesthe project financing is made feasible through
specific purpose companies (SpE), whose activities are, in essence, controlled by petrobras through contractual commitments with the transfer of as-
sumed benefits, risks and controls and upon the termination of each contract the company has the right to exercise its option for purchase of the as-sets or the total common shares of the SpEs.
a) Projects with assets in operation the assets and liabilities originating from
these contractual commitments are recognized in the individual financial statements of petro-bras as from the entry into operation of these assets and they are inserted in notes 13.1(1) and 16, respectively.
nOtes tO the Financial statements (cOnsOlidated and PaRent cOmPany)
(in thousand of reais)
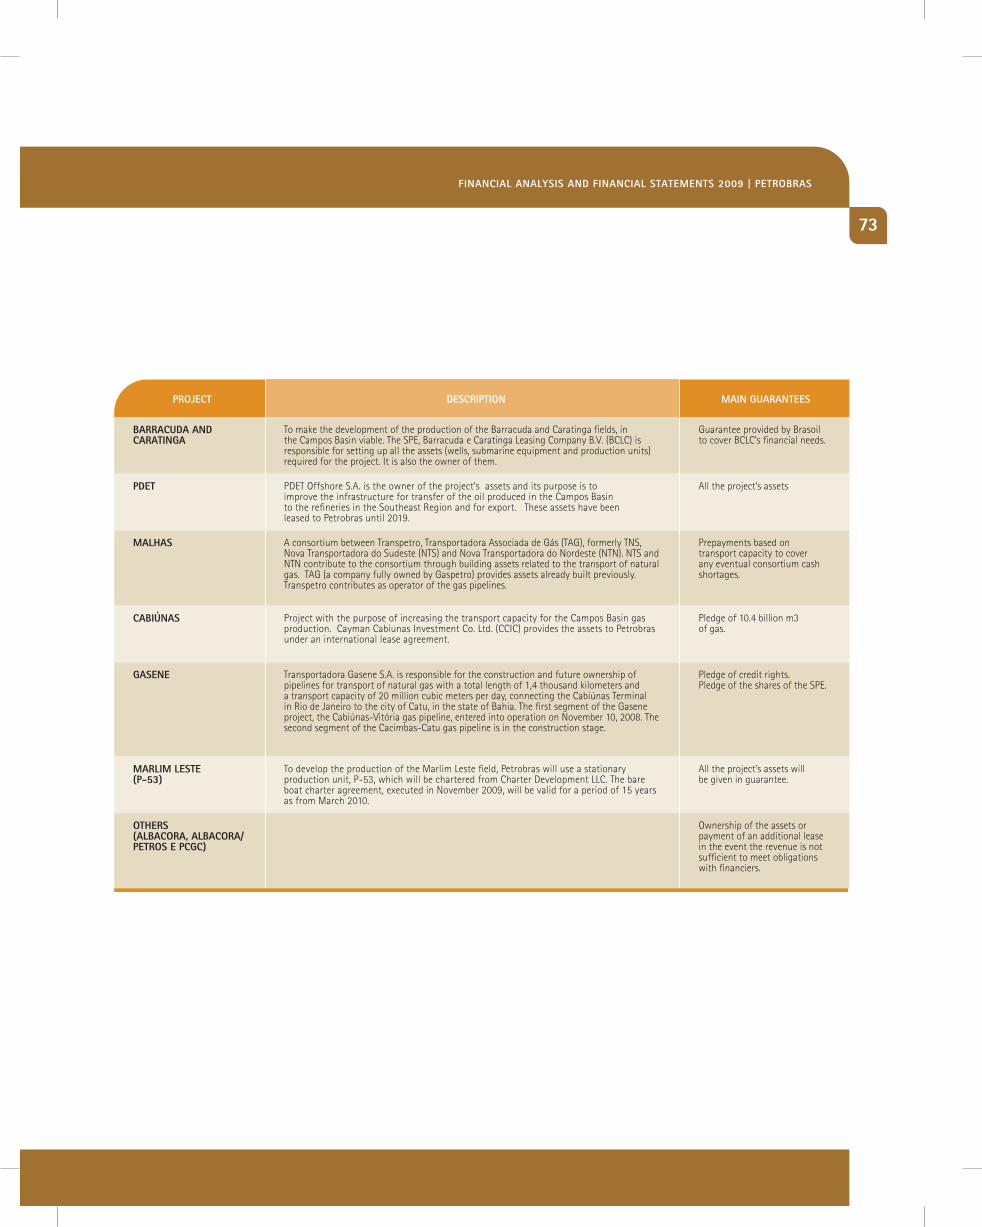
73
to make the development of the production of the barracuda and caratinga fields, in the campos basin viable. the SpE, barracuda e caratinga leasing company b.V. (bclc) is responsible for setting up all the assets (wells, submarine equipment and production units) required for the project. it is also the owner of them.
a consortium between transpetro, transportadora associada de gás (tag), formerly tnS, nova transportadora do Sudeste (ntS) and nova transportadora do nordeste (ntn). ntS and ntn contribute to the consortium through building assets related to the transport of natural gas. tag (a company fully owned by gaspetro) provides assets already built previously. transpetro contributes as operator of the gas pipelines.
transportadora gasene S.a. is responsible for the construction and future ownership of pipelines for transport of natural gas with a total length of 1,4 thousand kilometers and a transport capacity of 20 million cubic meters per day, connecting the cabiúnas terminal in rio de janeiro to the city of catu, in the state of bahia. the first segment of the gasene project, the cabiúnas-Vitória gas pipeline, entered into operation on november 10, 2008. the second segment of the cacimbas-catu gas pipeline is in the construction stage.
pdEt offshore S.a. is the owner of the project’s assets and its purpose is to improve the infrastructure for transfer of the oil produced in the campos basin to the refineries in the Southeast region and for export. these assets have been leased to petrobras until 2019.
project with the purpose of increasing the transport capacity for the campos basin gas production. cayman cabiunas investment co. ltd. (ccic) provides the assets to petrobras under an international lease agreement.
to develop the production of the marlim leste field, petrobras will use a stationary production unit, p-53, which will be chartered from charter development llc. the bare boat charter agreement, executed in november 2009, will be valid for a period of 15 years as from march 2010.
PROject descRiPtiOn main gUaRantees
guarantee provided by brasoil to cover bclc’s financial needs.
prepayments based on transport capacity to cover any eventual consortium cash shortages.
pledge of credit rights.pledge of the shares of the SpE.
all the project’s assets
pledge of 10.4 billion m3 of gas.
all the project’s assets will be given in guarantee.
ownership of the assets or payment of an additional lease in the event the revenue is not sufficient to meet obligations with financiers.
BaRRacUda and caRatinga
malhas
gasene
Pdet
caBiúnas
maRlim leste(P-53)
OtheRs(alBacORa, alBacORa/PetROs e Pcgc)
Financial analysis And Financial statements 2009 | PetROBRas
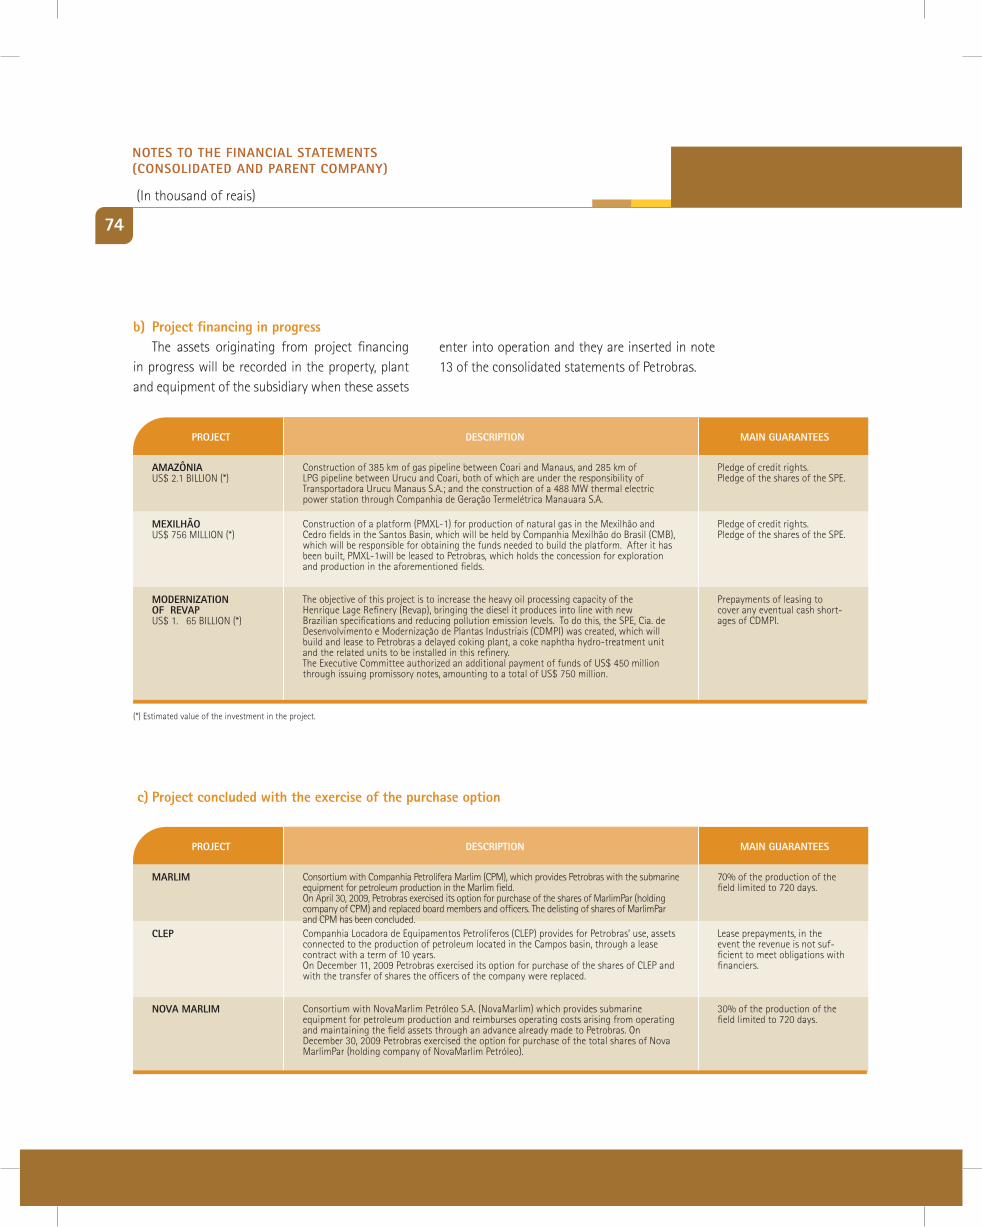
74
construction of 385 km of gas pipeline between coari and manaus, and 285 km of lpg pipeline between urucu and coari, both of which are under the responsibility of transportadora urucu manaus S.a.; and the construction of a 488 mW thermal electric power station through companhia de geração termelétrica manauara S.a.
the objective of this project is to increase the heavy oil processing capacity of the henrique lage refinery (revap), bringing the diesel it produces into line with new brazilian specifications and reducing pollution emission levels. to do this, the SpE, cia. de desenvolvimento e modernização de plantas industriais (cdmpi) was created, which will build and lease to petrobras a delayed coking plant, a coke naphtha hydro-treatment unit and the related units to be installed in this refinery. the Executive committee authorized an additional payment of funds of uS$ 450 million through issuing promissory notes, amounting to a total of uS$ 750 million.
construction of a platform (pmxl-1) for production of natural gas in the mexilhão and cedro fields in the Santos basin, which will be held by companhia mexilhão do brasil (cmb), which will be responsible for obtaining the funds needed to build the platform. after it has been built, pmxl-1will be leased to petrobras, which holds the concession for exploration and production in the aforementioned fields.
PROject descRiPtiOn main gUaRantees
pledge of credit rights.pledge of the shares of the SpE.
prepayments of leasing to cover any eventual cash short-ages of cdmpi.
pledge of credit rights.pledge of the shares of the SpE.
amazôniauS$ 2.1 billion (*)
mOdeRnizatiOn OF ReVaPuS$ 1. 65 billion (*)
mexilhãOuS$ 756 million (*)
(*) Estimated value of the investment in the project.
c) Project concluded with the exercise of the purchase option
b) Project financing in progressthe assets originating from project financing
in progress will be recorded in the property, plant and equipment of the subsidiary when these assets
enter into operation and they are inserted in note 13 of the consolidated statements of petrobras.
consortium with companhia petrolífera marlim (cpm), which provides petrobras with the submarine equipment for petroleum production in the marlim field. on april 30, 2009, petrobras exercised its option for purchase of the shares of marlimpar (holding company of cpm) and replaced board members and officers. the delisting of shares of marlimpar and cpm has been concluded.
consortium with novamarlim petróleo S.a. (novamarlim) which provides submarine equipment for petroleum production and reimburses operating costs arising from operating and maintaining the field assets through an advance already made to petrobras. on december 30, 2009 petrobras exercised the option for purchase of the total shares of nova marlimpar (holding company of novamarlim petróleo).
companhia locadora de Equipamentos petrolíferos (clEp) provides for petrobras’ use, assets connected to the production of petroleum located in the campos basin, through a lease contract with a term of 10 years. on december 11, 2009 petrobras exercised its option for purchase of the shares of clEp and with the transfer of shares the officers of the company were replaced.
PROject descRiPtiOn main gUaRantees
70% of the production of the field limited to 720 days.
30% of the production of the field limited to 720 days.
lease prepayments, in the event the revenue is not suf-ficient to meet obligations with financiers.
maRlim
nOVa maRlim
cleP
nOtes tO the Financial statements (cOnsOlidated and PaRent cOmPany)
(in thousand of reais)
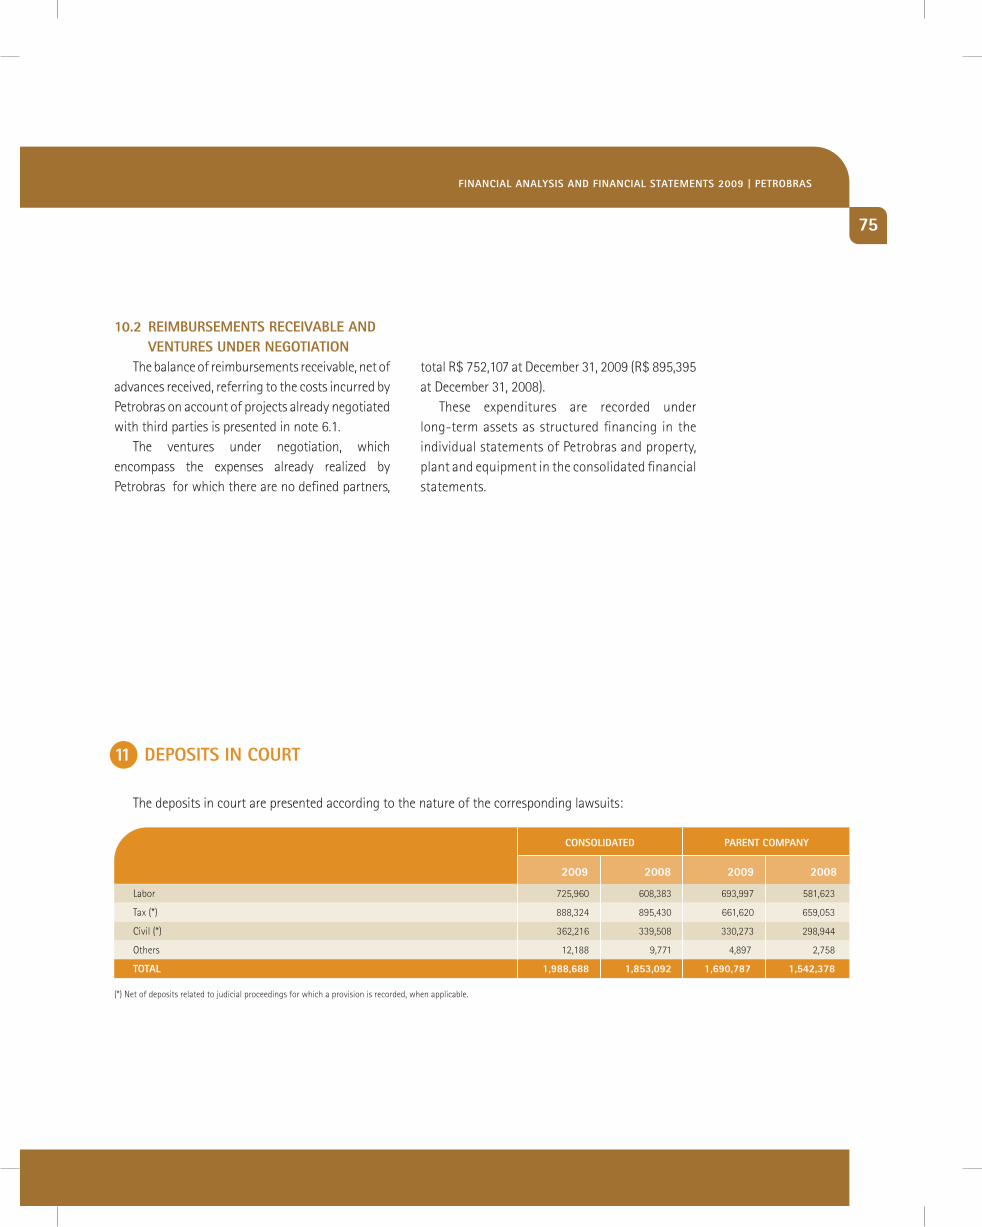
75
10.2 ReimBURsements ReceiVaBle and VentURes UndeR negOtiatiOn
the balance of reimbursements receivable, net of advances received, referring to the costs incurred by petrobras on account of projects already negotiated with third parties is presented in note 6.1.
the ventures under negotiation, which encompass the expenses already realized by petrobras for which there are no defined partners,
total r$ 752,107 at december 31, 2009 (r$ 895,395 at december 31, 2008).
these expenditures are recorded under long-term assets as structured financing in the individual statements of petrobras and property, plant and equipment in the consolidated financial statements.
the deposits in court are presented according to the nature of the corresponding lawsuits:
11 dePOsits in cOURt
cOnsOlidated
labor 725,960 608,383 693,997 581,623
tax (*) 888,324 895,430 661,620 659,053
civil (*) 362,216 339,508 330,273 298,944
others 12,188 9,771 4,897 2,758
tOtal 1,988,688 1,853,092 1,690,787 1,542,378
2009 2008 2009 2008
PaRent cOmPany
(*) net of deposits related to judicial proceedings for which a provision is recorded, when applicable.
Financial analysis And Financial statements 2009 | PetROBRas
76
OtheR inFORmatiOn• Search and apprehension of ICMS/tax
substitution considered not to be due. in the period from 2000 to 2001, petrobras
was sued in the courts of the States of goiás, tocantins, bahia, pará, maranhão and the Federal district by petrol distribution companies under the supposed allegation that it did not pass on to the state governments the tax on circulation of goods and services (icmS) withheld by law on the sale of fuels. of the total amount of these lawsuits, approximately r$ 80,159 was effectively withdrawn from the company’s accounts, through legal decisions of advance relief. on appeal, these judicial rulings of advance relief were annulled.
petrobras, with the support of the state and federal authorities, in addition to succeeding in stopping the execution of other withdrawals, is making every possible effort to obtain reimbursement of the amounts that have been unduly withdrawn from its accounts. the current position of our legal advisers is that there is no expectation of future disbursements for the company under these proceedings.
• Otherrestricteddeposits the courts have blocked other amounts due
to labor grievances that totaled r$ 49,987 at december 31, 2009 (r$ 34,767 at december 31, 2008), classified under non-current assets.
nOtes tO the Financial statements (cOnsOlidated and PaRent cOmPany)
(in thousand of reais)
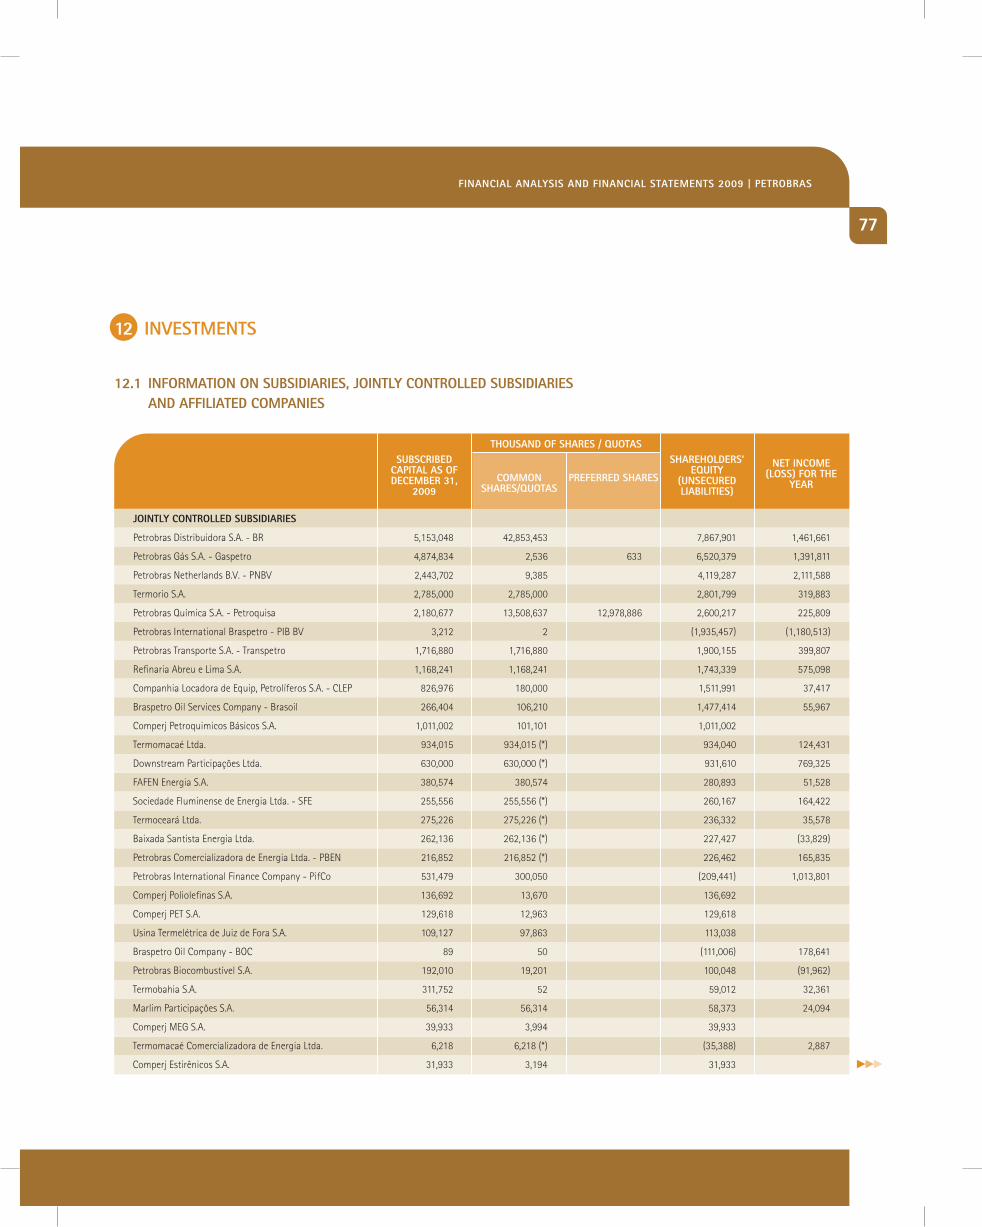
77
12.1 inFORmatiOn On sUBsidiaRies, jOintly cOntROlled sUBsidiaRies and aFFiliated cOmPanies
12 inVestments
jOintly cOntROlled sUBsidiaRies
petrobras distribuidora S.a. - br 5,153,048 42,853,453 7,867,901 1,461,661
petrobras gás S.a. - gaspetro 4,874,834 2,536 633 6,520,379 1,391,811
petrobras netherlands b.V. - pnbV 2,443,702 9,385 4,119,287 2,111,588
termorio S.a. 2,785,000 2,785,000 2,801,799 319,883
petrobras química S.a. - petroquisa 2,180,677 13,508,637 12,978,886 2,600,217 225,809
petrobras international braspetro - pib bV 3,212 2 (1,935,457) (1,180,513)
petrobras transporte S.a. - transpetro 1,716,880 1,716,880 1,900,155 399,807
refinaria abreu e lima S.a. 1,168,241 1,168,241 1,743,339 575,098
companhia locadora de Equip, petrolíferos S.a. - clEp 826,976 180,000 1,511,991 37,417
braspetro oil Services company - brasoil 266,404 106,210 1,477,414 55,967
comperj petroquimicos básicos S.a. 1,011,002 101,101 1,011,002
termomacaé ltda. 934,015 934,015 (*) 934,040 124,431
downstream participações ltda. 630,000 630,000 (*) 931,610 769,325
FaFEn Energia S.a. 380,574 380,574 280,893 51,528
Sociedade Fluminense de Energia ltda. - SFE 255,556 255,556 (*) 260,167 164,422
termoceará ltda. 275,226 275,226 (*) 236,332 35,578
baixada Santista Energia ltda. 262,136 262,136 (*) 227,427 (33,829)
petrobras comercializadora de Energia ltda. - pbEn 216,852 216,852 (*) 226,462 165,835
petrobras international Finance company - pifco 531,479 300,050 (209,441) 1,013,801
comperj poliolefinas S.a. 136,692 13,670 136,692
comperj pEt S.a. 129,618 12,963 129,618
usina termelétrica de juiz de Fora S.a. 109,127 97,863 113,038
braspetro oil company - boc 89 50 (111,006) 178,641
petrobras biocombustível S.a. 192,010 19,201 100,048 (91,962)
termobahia S.a. 311,752 52 59,012 32,361
marlim participações S.a. 56,314 56,314 58,373 24,094
comperj mEg S.a. 39,933 3,994 39,933
termomacaé comercializadora de Energia ltda. 6,218 6,218 (*) (35,388) 2,887
comperj Estirênicos S.a. 31,933 3,194 31,933
sUBscRiBed caPital as OF decemBeR 31,
2009
shaRehOldeRs’ eqUity
(UnsecURed liaBilities)
net incOme (lOss) FOR the
yeaRcOmmOn
shaRes/qUOtasPReFeRRed shaRes
thOUsand OF shaRes / qUOtas
Financial analysis And Financial statements 2009 | PetROBRas
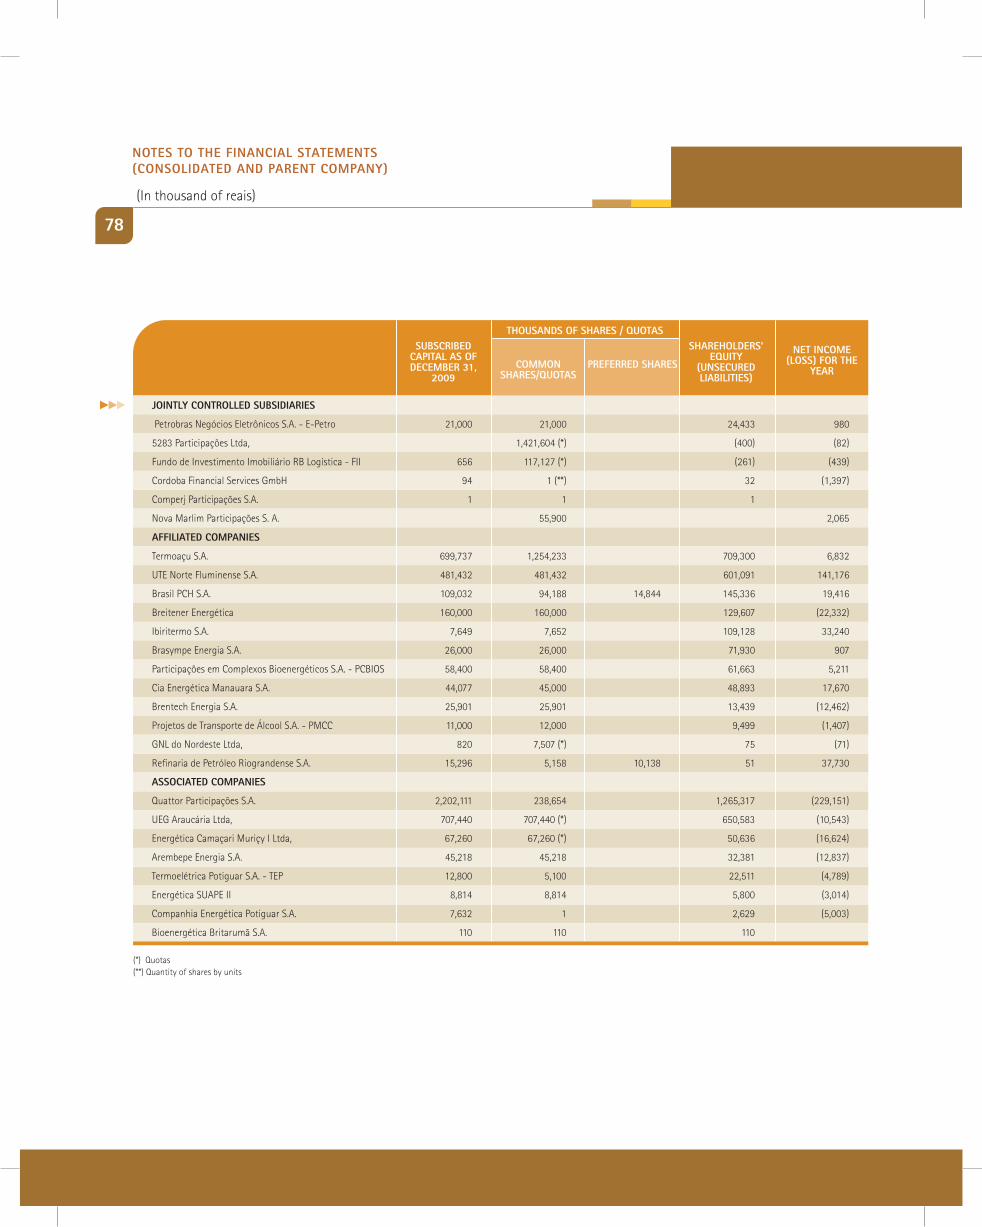
78
jOintly cOntROlled sUBsidiaRies
petrobras negócios Eletrônicos S.a. - E-petro 21,000 21,000 24,433 980
5283 participações ltda, 1,421,604 (*) (400) (82)
Fundo de investimento imobiliário rb logística - Fii 656 117,127 (*) (261) (439)
cordoba Financial Services gmbh 94 1 (**) 32 (1,397)
comperj participações S.a. 1 1 1
nova marlim participações S. a. 55,900 2,065
sUBscRiBed caPital as OF decemBeR 31,
2009
shaRehOldeRs’ eqUity
(UnsecURed liaBilities)
net incOme (lOss) FOR the
yeaRcOmmOn
shaRes/qUOtasPReFeRRed shaRes
thOUsands OF shaRes / qUOtas
aFFiliated cOmPanies
termoaçu S.a. 699,737 1,254,233 709,300 6,832
utE norte Fluminense S.a. 481,432 481,432 601,091 141,176
brasil pch S.a. 109,032 94,188 14,844 145,336 19,416
breitener Energética 160,000 160,000 129,607 (22,332)
ibiritermo S.a. 7,649 7,652 109,128 33,240
brasympe Energia S.a. 26,000 26,000 71,930 907
participações em complexos bioenergéticos S.a. - pcbioS 58,400 58,400 61,663 5,211
cia Energética manauara S.a. 44,077 45,000 48,893 17,670
brentech Energia S.a. 25,901 25,901 13,439 (12,462)
projetos de transporte de Álcool S.a. - pmcc 11,000 12,000 9,499 (1,407)
gnl do nordeste ltda, 820 7,507 (*) 75 (71)
refinaria de petróleo riograndense S.a. 15,296 5,158 10,138 51 37,730
assOciated cOmPanies
quattor participações S.a. 2,202,111 238,654 1,265,317 (229,151)
uEg araucária ltda, 707,440 707,440 (*) 650,583 (10,543)
Energética camaçari muriçy i ltda, 67,260 67,260 (*) 50,636 (16,624)
arembepe Energia S.a. 45,218 45,218 32,381 (12,837)
termoelétrica potiguar S.a. - tEp 12,800 5,100 22,511 (4,789)
Energética SuapE ii 8,814 8,814 5,800 (3,014)
companhia Energética potiguar S.a. 7,632 1 2,629 (5,003)
bioenergética britarumã S.a. 110 110 110
(*) quotas(**) quantity of shares by units
nOtes tO the Financial statements (cOnsOlidated and PaRent cOmPany)
(in thousand of reais)
79
a) Petrobras química s.a. - Petroquisait holds interests in companies whose purpose
is the manufacture, trading, distribution, transport, importing and exporting of products of the chemical and petrochemical industries and it provides technical and administrative services related to the abovementioned activities.
b) Petrobras distribuidora s.a. - BR distribuidora
it operates in the area of distribution, trading and further processing of products and byproducts of petroleum, alcohol, energy and other fuels.
c) Petrobras gás s.a. - gaspetroit holds interests in companies that operate
with the transport of natural gas, the transmission of data, voice and image signals through cable and radio telecommunications systems and it also provides technical services related to these activities. it also holds interests in a number of state gas distributors, exercising shared control, which are consolidated in proportion to its stake in the capital.
d) Petrobras transporte s.a. transpetroit carries out, either directly or through a
subsidiary, operations for bulk transport and storage of oil and oil products and gas in general, through its own pipelines, terminals and vessels or those of third parties.
e) downstream Participações ltda.it holds interests in companies that operate in
the refining segment.
f) Petrobras international Finance company - Pifco
it carries out trading activities for oil and oil products abroad; it intermediates the purchase and sale of oil and oil products and materials for companies of the petrobras System and it raises funds abroad.
g) Petrobras internacional Braspetro B.V. - PiB BV
it holds interests in companies that operate abroad with research, drilling, further processing, trading, transport, storage, importing and exporting of oil and oil products, as well as providing services and other activities related to the various segments of the oil industry.
h) Braspetro Oil services company - Brasoilits corporate purpose is to provide services in
all the areas of the oil industry, as well as in the trading of oil and oil products.
i) Petrobras netherlands B.V. - PnBVit operates, directly or through subsidiaries, in the
purchase, sale, lease, renting or chartering of materials, equipment and platforms for oil and gas exploration and production.
12.2 descRiPtiOn OF the actiVities OF the sUBsidiaRies
Financial analysis And Financial statements 2009 | PetROBRas
j) 5283 Participações ltda.it is a brazilian limited liability company with
its headquarters in the city of rio de janeiro and its corporate purpose is to hold interests in the capital of other companies.
k) Petrobras negócios eletrônicos s.a. e-PetRO
it holds interests in the capital of companies whose corporate purposes are activities carried out through the internet or electronic means.
l) Braspetro Oil company - BOcits corporate purpose is to encourage research,
drilling, further processing, trading, transport, storage, importing and exporting of oil and oil products, as well as providing services and other activities related to the various segments of the oil industry.
m) Fundo de investimento imobiliário RB logística - Fii
its corporate purpose is to make feasible the construction of four administrative buildings in macaé through issuing real Estate receivables certificates through rio bravo Securitizadora S.a., that are pegged to leasing credit rights with petrobras.
n) thermoelectric power stations• Termorio S.A.; FAFEN Energia S.A.; Baixada
Santista Energia ltda.; termomacaé ltda.; Sociedade Fluminense de Energia ltda - SFE.; termoceará ltda.; termobahia S.a.; ibiritermo S.a. and usina termelétrica de juiz de Fora S.a.
80
the corporate purpose of this group of companies is the implementation and commercial exploitation of thermoelectric power stations, some of which have cogeneration processes and all of which are located in brazil and use natural gas as a fuel for generating electric power.
they are composed of thermoelectric power stations with an installed potential, or in the final stage of installation, of 3.4 gW (unaudited), and this capacity is sold through auctions of the brazilian Electricity regulatory agency (anEEl), agreements for selling power and exports.
o) electric power traders• Petrobras Comercializadora de Energia Ltda.
- pbEn; e termomacaé comercializadora de Energia ltda. - tmcthese traders centralize the management of the
portfolio for purchase and sale of electric power of the petrobras System and they are responsible for the sale of electric power of the generating assets of the petrobras System and eventual purchase of electric power from the market.
p) Petrobras Biocombustível s.a.its corporate purpose is to develop the
production of ethanol, biodiesel and any other correlated or similar products and the generation of electric power associated with its operations, and it may also exploit all these activities through holding interests in other companies, as well as encouraging the integration of various departments of the company around the theme of biofuels.
nOtes tO the Financial statements (cOnsOlidated and PaRent cOmPany)
(in thousand of reais)
81
q) Refinaria abreu e lima s.a.it is a closely held joint stock company and
its corporate purpose is the construction and operation of an oil refinery in ipojuca in the state of pernambuco, as well as refining, processing, trading, importing, exporting and transporting oil and oil products, correlated products and biofuels.
r) cordoba Financial services gmbh - cFsa limited liability company with its head office
in Vienna, austria and its corporate purpose is to hold interests in the capital of other companies in austria and abroad. cordoba is the sole shareholder of World Fund Financial Services (WFFS), a company established under the laws of the cayman islands, and its corporate purpose is to operate in banking and financial operations outside the cayman islands.
s) companhia locadora de equipamentos Petrolíferos - cleP
a closely-held joint stock company, with its headquarters in the city of rio de janeiro, whose purpose is the leasing of assets for exploration and production of petroleum and natural gas, including providing and contracting services related to the production of petroleum and all other related activities.
t) marlim Participações s.a.company, with its headquarters in the
city of rio de janeiro, created exclusively to participate in the capital of companhia petrolífera marlim (cpm). cpm, in turn, is a
specific purpose entity created exclusively to participate in the consortium formed with petrobras and its object is to combine efforts and resources from the parties with the specific purpose of complementing the development of the production of the marlim Field.
u) nova marlim Participações s.a.a publicly-held company, with its headquarters
in the city of rio de janeiro, created exclusively to participate in the capital of novamarlim petróleo S.a. (novamarlim). novamarlim, in turn, was created exclusively to participate in a consortium formed with petrobras and its object is to combine efforts and resources from the parties to optimize the complementing of the development of the production of the marlim Field.
v) Petrochemical complex of Rio de janeiro - cOmPeRj
the main purpose of the petrochemical complex of rio de janeiro (comperj) is to increase brazilian production of petrochemical products, with the processing of around 150 thousand barrels per day of brazilian heavy oil. the following companies were created for this purpose: comperj participações S.a. - a specific purpose entity, which will hold the interests of petrobras in the producing companies of compErj; comperj petroquímicos básicos S.a. - a company producing basic petrochemicals; comperj pEt S.a. - a company producing pta/pEt; comperj Estirênicos S.a. - a company producing styrene; comperj mEg S.a. - a company producing glycol ethylene and ethylene oxide; and comperj poliolefinas S.a. - a company producing polyolephines (pp/pE).
Financial analysis And Financial statements 2009 | PetROBRas
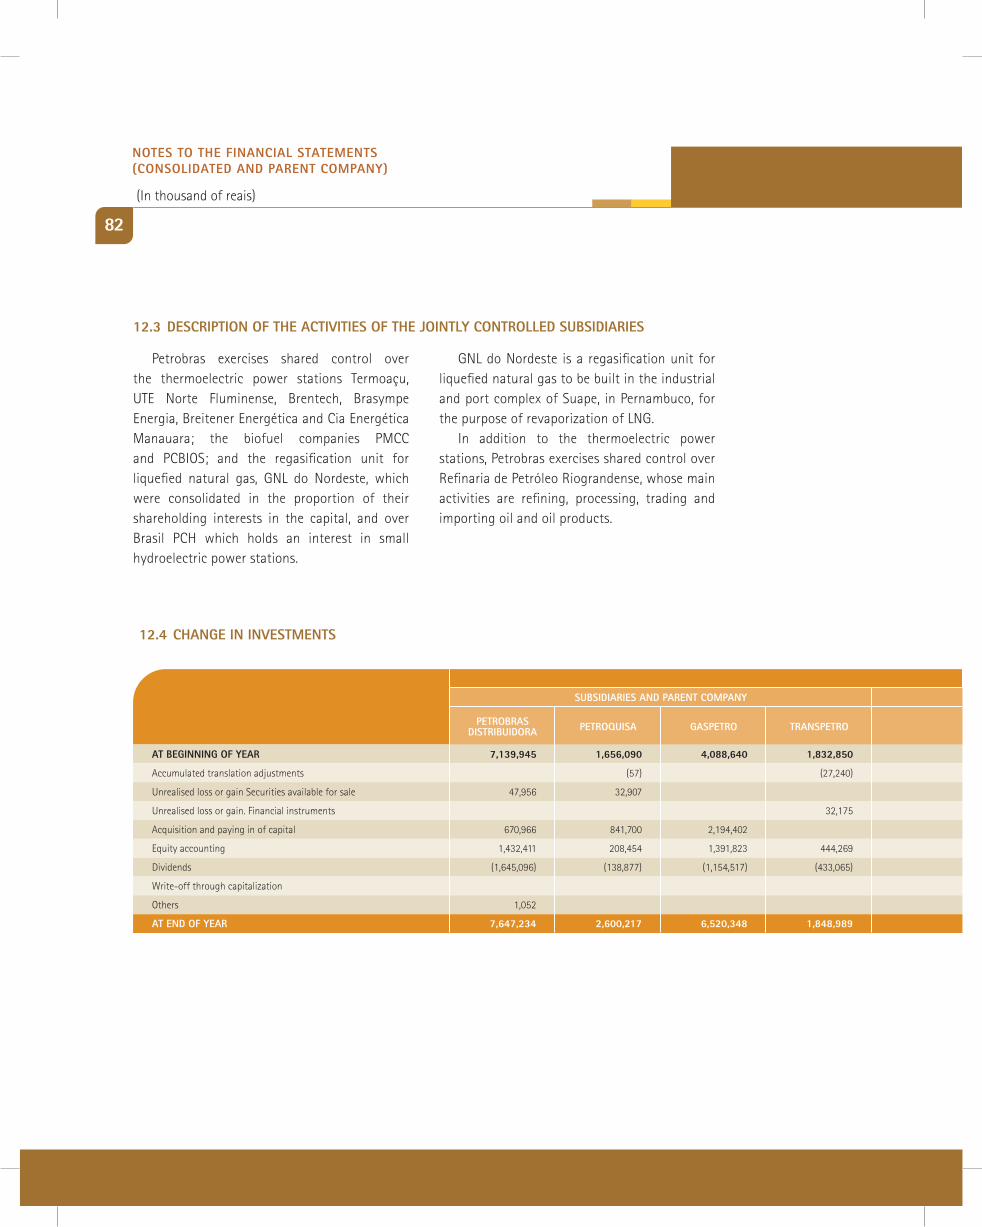
sUBsidiaRies and PaRent cOmPany
7,139,945 1,656,090 4,088,640 1,832,850 1,421,878 168,835 242,996 2,811,810 219,073 2,882,200 198,512
(57) (27,240) (492,228) (1,079,829)
47,956 32,907
32,175
670,966 841,700 2,194,402 43,680
1,432,411 208,454 1,391,823 444,269 (8,454) 752,681 165,691 309,164 61,820 2,069,954 (14,765)
(1,645,096) (138,877) (1,154,517) (433,065) (182,422) (319,175)
1,052
7,647,234 2,600,217 6,520,348 1,848,989 921,196 921,516 226,265 2,801,799 280,893 3,872,325 227,427
PetROBRasdistRiBUidORa PetROqUisa gasPetRO tRansPetRO BRasOil dOwnstReam PBen teRmORiO FaFen PnBV Baixada santista
sUBsidiaRies and PaRent cOmPany
PaRent cOmPany
at Beginning OF yeaR
accumulated translation adjustments
unrealised loss or gain Securities available for sale
unrealised loss or gain. Financial instruments
acquisition and paying in of capital
Equity accounting
dividends
Write-off through capitalization
others
at end OF yeaR
12.4 change in inVestments
82
12.3 descRiPtiOn OF the actiVities OF the jOintly cOntROlled sUBsidiaRies
petrobras exercises shared control over the thermoelectric power stations termoaçu, utE norte Fluminense, brentech, brasympe Energia, breitener Energética and cia Energética manauara; the biofuel companies pmcc and pcbioS; and the regasification unit for liquefied natural gas, gnl do nordeste, which were consolidated in the proportion of their shareholding interests in the capital, and over brasil pch which holds an interest in small hydroelectric power stations.
gnl do nordeste is a regasification unit for liquefied natural gas to be built in the industrial and port complex of Suape, in pernambuco, for the purpose of revaporization of lng.
in addition to the thermoelectric power stations, petrobras exercises shared control over refinaria de petróleo riograndense, whose main activities are refining, processing, trading and importing oil and oil products.
nOtes tO the Financial statements (cOnsOlidated and PaRent cOmPany)
(in thousand of reais)
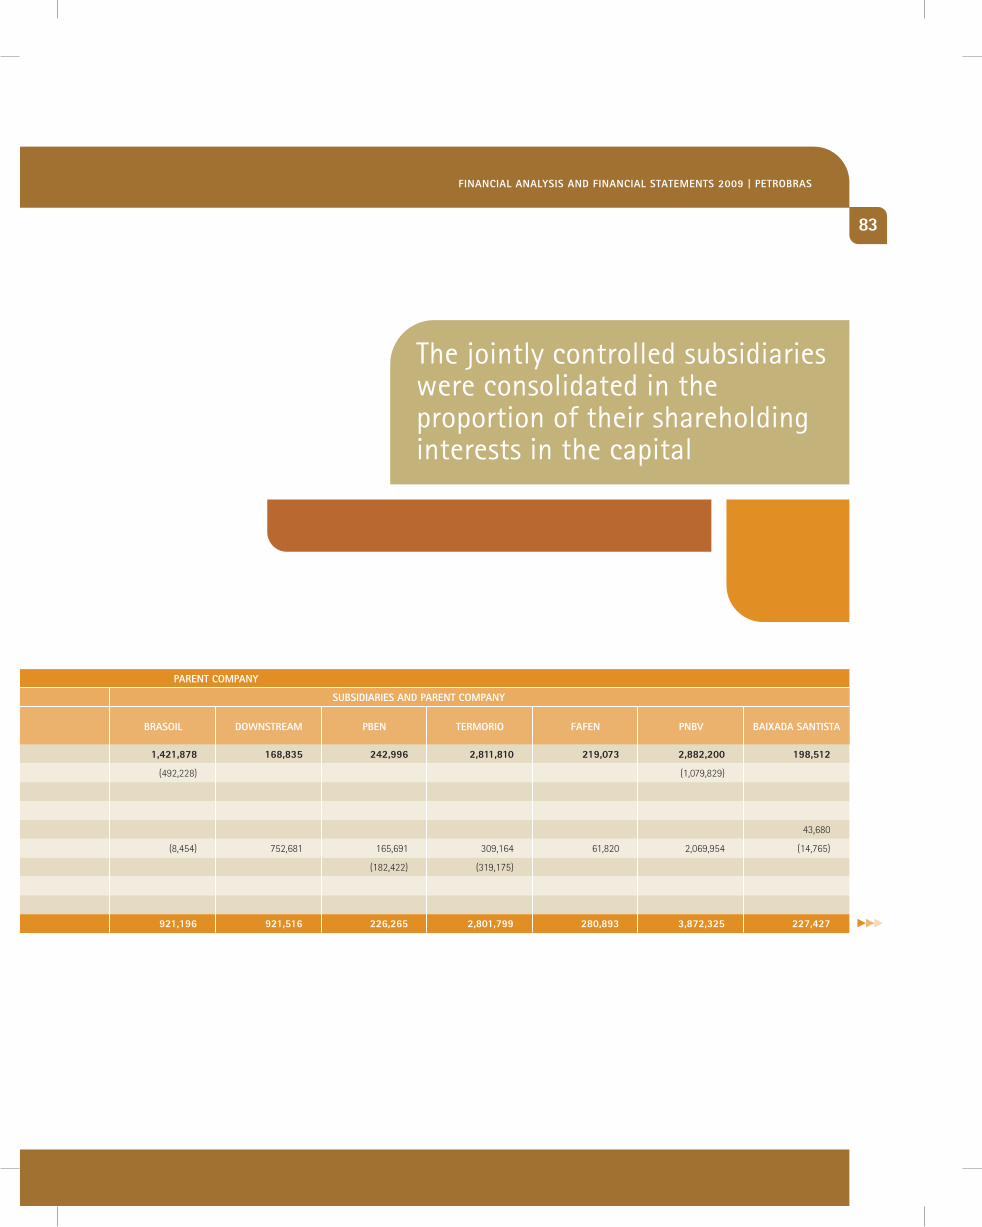
83
sUBsidiaRies and PaRent cOmPany
7,139,945 1,656,090 4,088,640 1,832,850 1,421,878 168,835 242,996 2,811,810 219,073 2,882,200 198,512
(57) (27,240) (492,228) (1,079,829)
47,956 32,907
32,175
670,966 841,700 2,194,402 43,680
1,432,411 208,454 1,391,823 444,269 (8,454) 752,681 165,691 309,164 61,820 2,069,954 (14,765)
(1,645,096) (138,877) (1,154,517) (433,065) (182,422) (319,175)
1,052
7,647,234 2,600,217 6,520,348 1,848,989 921,196 921,516 226,265 2,801,799 280,893 3,872,325 227,427
PetROBRasdistRiBUidORa PetROqUisa gasPetRO tRansPetRO BRasOil dOwnstReam PBen teRmORiO FaFen PnBV Baixada santista
sUBsidiaRies and PaRent cOmPany
PaRent cOmPany
at Beginning OF yeaR
accumulated translation adjustments
unrealised loss or gain Securities available for sale
unrealised loss or gain. Financial instruments
acquisition and paying in of capital
Equity accounting
dividends
Write-off through capitalization
others
at end OF yeaR
Financial analysis And Financial statements 2009 | PetROBRas
The jointly controlled subsidiaries were consolidated in the proportion of their shareholding interests in the capital
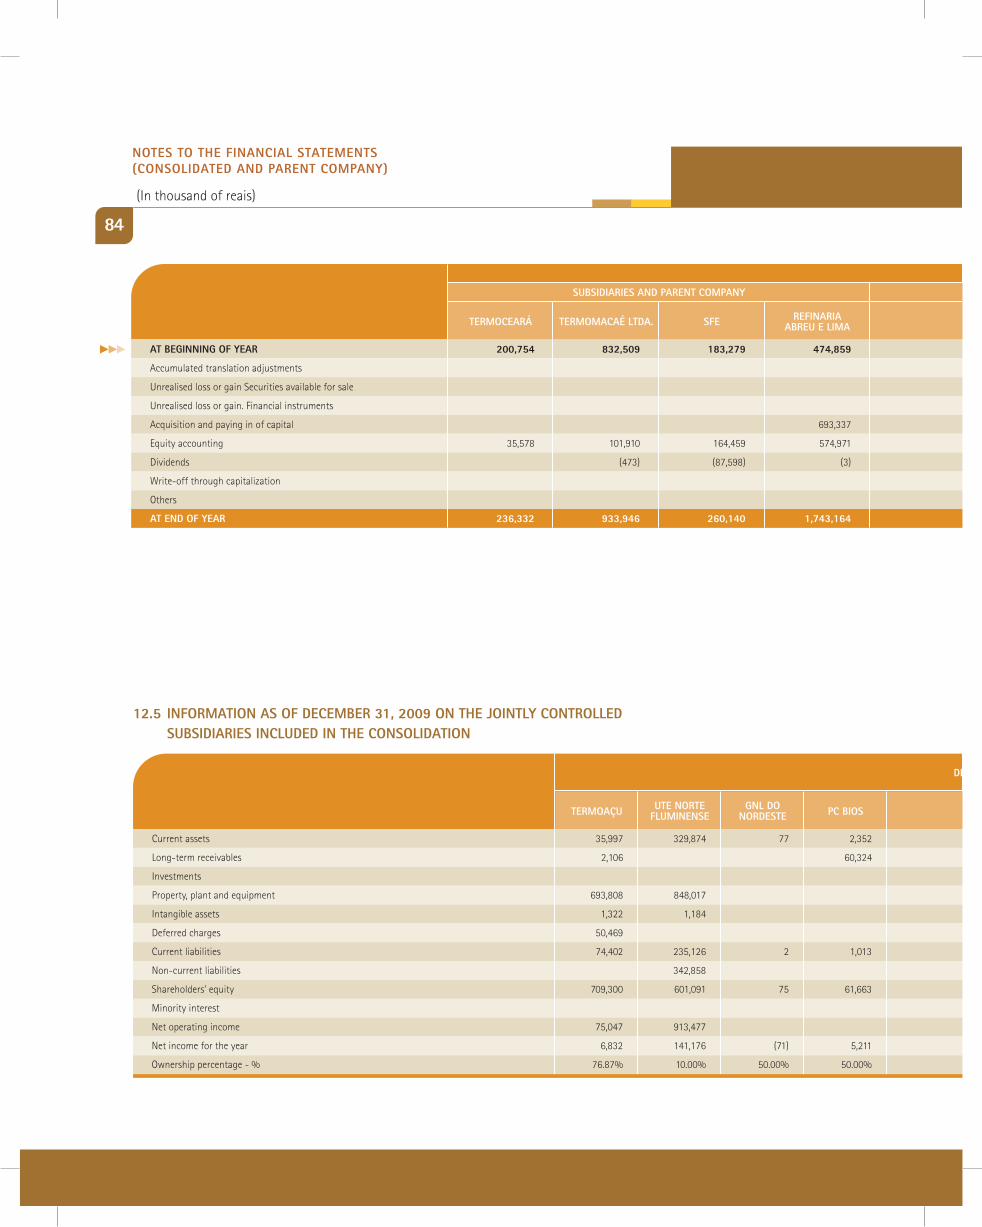
diRect jOintly cOntROlled sUBsidiaRies
current assets 35,997 329,874 77 2,352 1,943 8,780 125,632 20,853 244,563 100,065 213,806 1,688,254 261,124
long-term receivables 2,106 60,324 6,986 9,480 72,774 37,807 14,055 444 237,127 13,506
investments 104 1,523 509
property, plant and equipment 693,808 848,017 18 87,566 1,272,868 32,532 212,346 164,954 40,592 1,691,907 720,767
intangible assets 1,322 1,184 8,047 12 132 6,024 132 222 13,773 4,212
deferred charges 50,469 3,840 79,837 71,844 6,079 50,067 26,168
current liabilities 74,402 235,126 2 1,013 78,159 128,410 17,301 282,601 197,043
non-current liabilities 342,858 509 15,690 1,214,203 31,434 154,484 87,730 201,439 1,340,987 89,307
Shareholders’ equity 709,300 601,091 75 61,663 9,499 13,439 145,336 71,930 129,607 148,752 53,353 277,935 739,557
minority interest 11,518 48,893 51 2,063,729 379
net operating income 75,047 913,477 25,369 218,612 7,122 243,725 123,204 752,922 3,822,639 322,137
net income for the year 6,832 141,176 (71) 5,211 (1,407) (12,462) 19,416 907 (22,332) 123,204 37,730 425,559 17,346
ownership percentage - % 76.87% 10.00% 50.00% 50.00% 33.33% 30.00% 42.33% 20.00% 30.00% 40.00% 33.20% 23.50% to 83.0% 33.00 to 72.00%
sUBsidiaRies and PaRent cOmPany
200,754 832,509 183,279 474,859 977,418 728,859 660,547 26,721,054 22,565,831
1,189 (1,598,165) 424,985
80,863 (81,796)
32,175 (32,175)
693,337 1,011,002 1,967,946 547,329 40,173 12,502 8,023,037 5,548,667
35,578 101,910 164,459 574,971 37,417 34,600 24,342 (98,072) 7,688,253 2,088,728
(473) (87,598) (3) (493,372) (141,531) (16,285) (4,612,414) (1,567,526)
(672,018) (672,018) (2,078,543)
1,052 (147,117)
236,332 933,946 260,140 1,743,164 1,011,002 1,511,991 746,987 777,089 574,977 35,663,837 26,721,054
teRmOmacaé ltda.teRmOceaRÁ sFe ReFinaRiaaBReU e lima
cOmPeRjPetROqUímicOs cleP
OtheR sUBsidiaRies
jOintly cOntROlled sUBsidiaRies
aFFiliated cOmPanies 2009 2008
sUBsidiaRies and PaRent cOmPany
PaRent cOmPany
at Beginning OF yeaR
accumulated translation adjustments
unrealised loss or gain Securities available for sale
unrealised loss or gain. Financial instruments
acquisition and paying in of capital
Equity accounting
dividends
Write-off through capitalization
others
at end OF yeaR
84
Pc BiOsgnl dO nORdeste
Ute nORteFlUminenseteRmOaÇU
12.5 inFORmatiOn as OF decemBeR 31, 2009 On the jOintly cOntROlled sUBsidiaRies inclUded in the cOnsOlidatiOn
nOtes tO the Financial statements (cOnsOlidated and PaRent cOmPany)
(in thousand of reais)
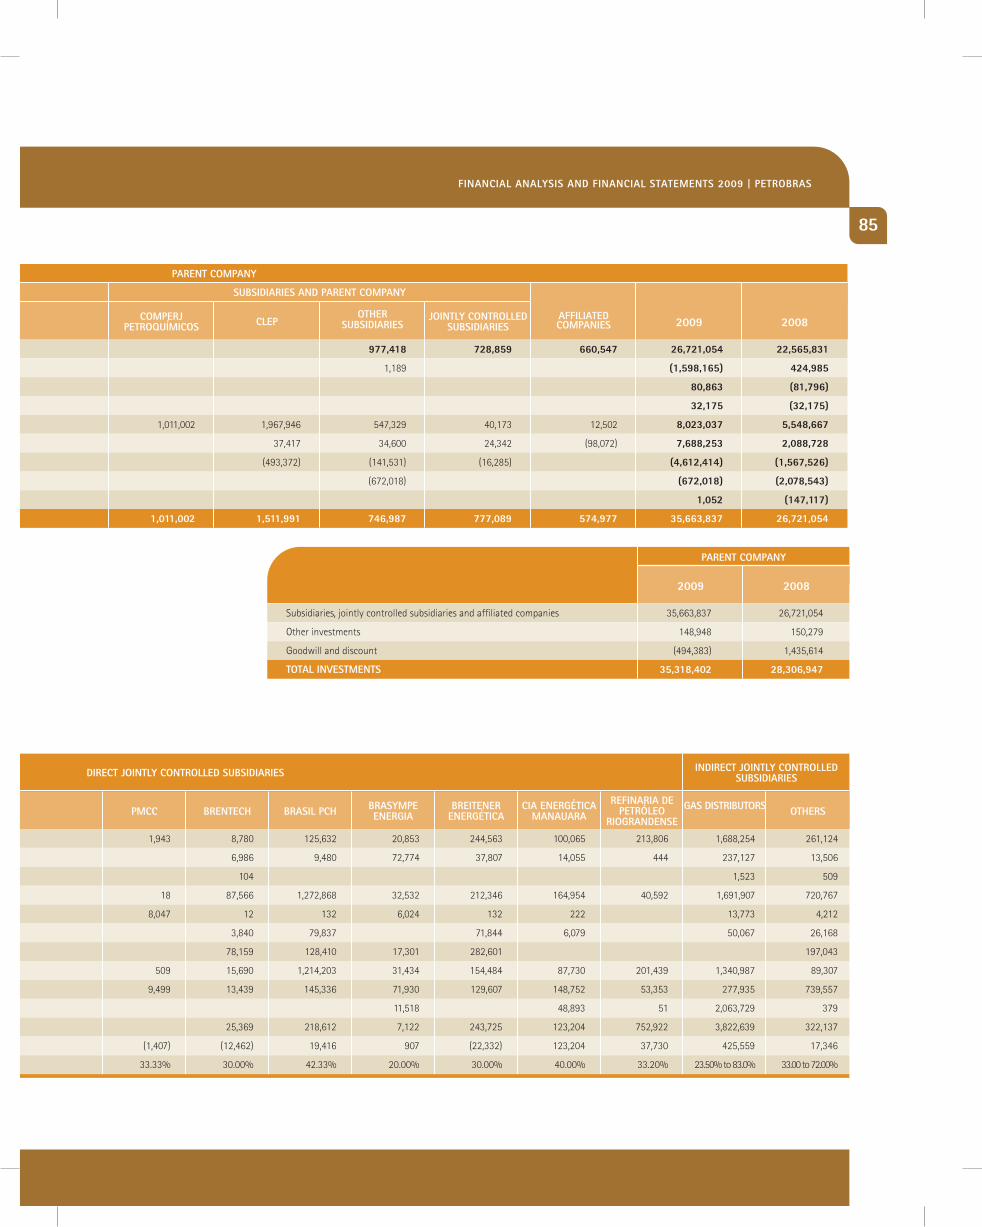
85
diRect jOintly cOntROlled sUBsidiaRies
OtheRsgas distRiBUtORsReFinaRia dePetRóleO
RiOgRandensecia eneRgética
manaUaRaBReiteneR
eneRgéticaBRasymPeeneRgiaBRasil PchBRentechPmcc
indiRect jOintly cOntROlled sUBsidiaRies
current assets 35,997 329,874 77 2,352 1,943 8,780 125,632 20,853 244,563 100,065 213,806 1,688,254 261,124
long-term receivables 2,106 60,324 6,986 9,480 72,774 37,807 14,055 444 237,127 13,506
investments 104 1,523 509
property, plant and equipment 693,808 848,017 18 87,566 1,272,868 32,532 212,346 164,954 40,592 1,691,907 720,767
intangible assets 1,322 1,184 8,047 12 132 6,024 132 222 13,773 4,212
deferred charges 50,469 3,840 79,837 71,844 6,079 50,067 26,168
current liabilities 74,402 235,126 2 1,013 78,159 128,410 17,301 282,601 197,043
non-current liabilities 342,858 509 15,690 1,214,203 31,434 154,484 87,730 201,439 1,340,987 89,307
Shareholders’ equity 709,300 601,091 75 61,663 9,499 13,439 145,336 71,930 129,607 148,752 53,353 277,935 739,557
minority interest 11,518 48,893 51 2,063,729 379
net operating income 75,047 913,477 25,369 218,612 7,122 243,725 123,204 752,922 3,822,639 322,137
net income for the year 6,832 141,176 (71) 5,211 (1,407) (12,462) 19,416 907 (22,332) 123,204 37,730 425,559 17,346
ownership percentage - % 76.87% 10.00% 50.00% 50.00% 33.33% 30.00% 42.33% 20.00% 30.00% 40.00% 33.20% 23.50% to 83.0% 33.00 to 72.00%
Financial analysis And Financial statements 2009 | PetROBRas
Subsidiaries, jointly controlled subsidiaries and affiliated companies 35,663,837 26,721,054
other investments 148,948 150,279
goodwill and discount (494,383) 1,435,614
tOtal inVestments 35,318,402 28,306,947
2009
PaRent cOmPany
2008
sUBsidiaRies and PaRent cOmPany
200,754 832,509 183,279 474,859 977,418 728,859 660,547 26,721,054 22,565,831
1,189 (1,598,165) 424,985
80,863 (81,796)
32,175 (32,175)
693,337 1,011,002 1,967,946 547,329 40,173 12,502 8,023,037 5,548,667
35,578 101,910 164,459 574,971 37,417 34,600 24,342 (98,072) 7,688,253 2,088,728
(473) (87,598) (3) (493,372) (141,531) (16,285) (4,612,414) (1,567,526)
(672,018) (672,018) (2,078,543)
1,052 (147,117)
236,332 933,946 260,140 1,743,164 1,011,002 1,511,991 746,987 777,089 574,977 35,663,837 26,721,054
teRmOmacaé ltda.teRmOceaRÁ sFe ReFinaRiaaBReU e lima
cOmPeRjPetROqUímicOs cleP
OtheR sUBsidiaRies
jOintly cOntROlled sUBsidiaRies
aFFiliated cOmPanies 2009 2008
sUBsidiaRies and PaRent cOmPany
PaRent cOmPany
at Beginning OF yeaR
accumulated translation adjustments
unrealised loss or gain Securities available for sale
unrealised loss or gain. Financial instruments
acquisition and paying in of capital
Equity accounting
dividends
Write-off through capitalization
others
at end OF yeaR
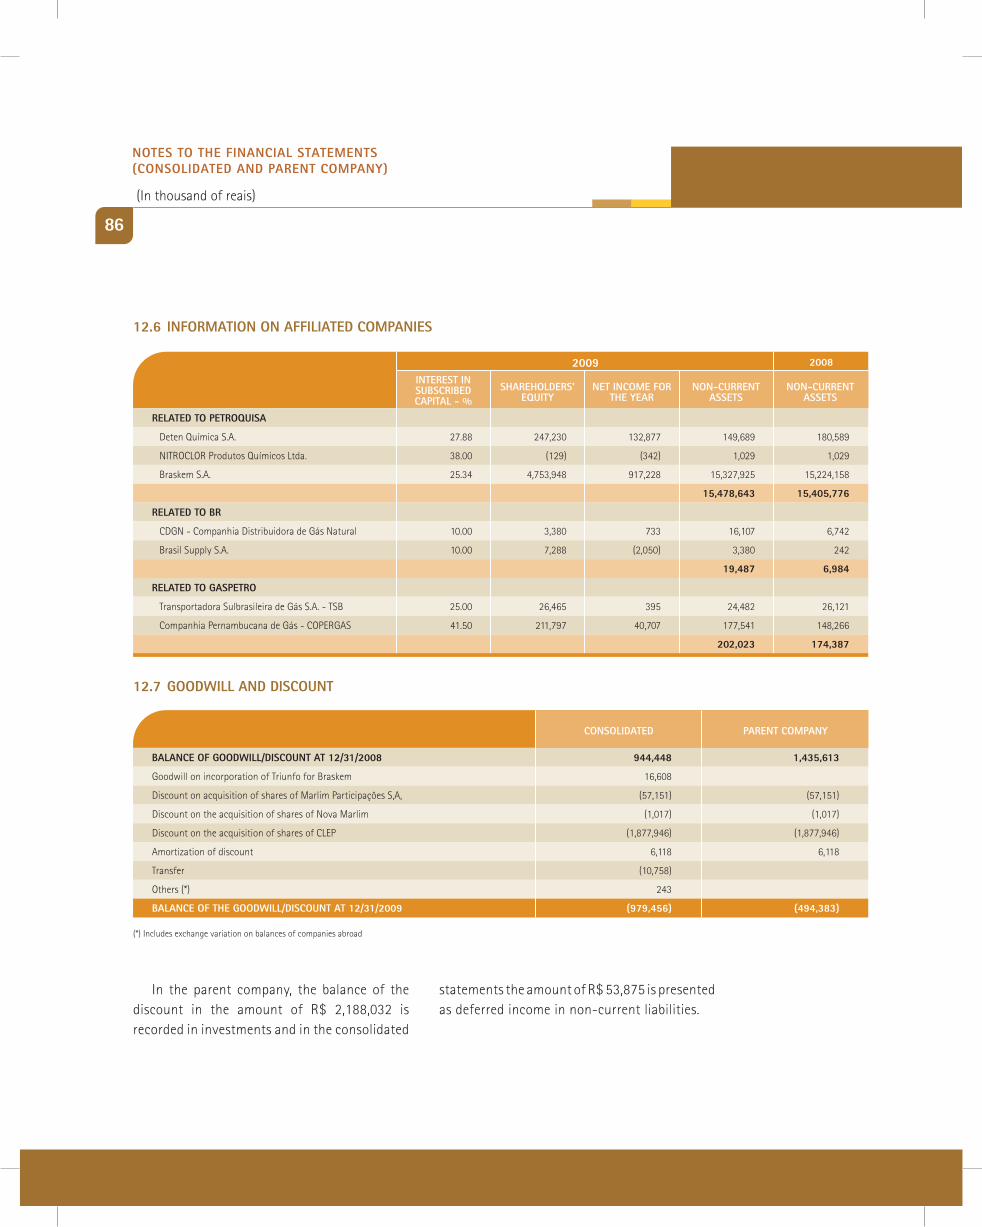
86
Related tO PetROqUisa
deten química S.a. 27.88 247,230 132,877 149,689 180,589
nitroclor produtos químicos ltda. 38.00 (129) (342) 1,029 1,029
braskem S.a. 25.34 4,753,948 917,228 15,327,925 15,224,158
15,478,643 15,405,776
Related tO BR
cdgn - companhia distribuidora de gás natural 10.00 3,380 733 16,107 6,742
brasil Supply S.a. 10.00 7,288 (2,050) 3,380 242
19,487 6,984
Related tO gasPetRO
transportadora Sulbrasileira de gás S.a. - tSb 25.00 26,465 395 24,482 26,121
companhia pernambucana de gás - copErgaS 41.50 211,797 40,707 177,541 148,266
202,023 174,387
inteRest in sUBscRiBed caPital - %
shaRehOldeRs’ eqUity
net incOme FOR the yeaR
nOn-cURRent assets
nOn-cURRent assets
2009 2008
12.6 inFORmatiOn On aFFiliated cOmPanies
12.7 gOOdwill and discOUnt
cOnsOlidated
Balance OF gOOdwill/discOUnt at 12/31/2008 944,448 1,435,613
goodwill on incorporation of triunfo for braskem 16,608
discount on acquisition of shares of marlim participações S,a, (57,151) (57,151)
discount on the acquisition of shares of nova marlim (1,017) (1,017)
discount on the acquisition of shares of clEp (1,877,946) (1,877,946)
amortization of discount 6,118 6,118
transfer (10,758)
others (*) 243
Balance OF the gOOdwill/discOUnt at 12/31/2009 (979,456) (494,383)
PaRent cOmPany
(*) includes exchange variation on balances of companies abroad
in the parent company, the balance of the discount in the amount of r$ 2,188,032 is recorded in investments and in the consolidated
statements the amount of r$ 53,875 is presented as deferred income in non-current liabilities.
nOtes tO the Financial statements (cOnsOlidated and PaRent cOmPany)
(in thousand of reais)
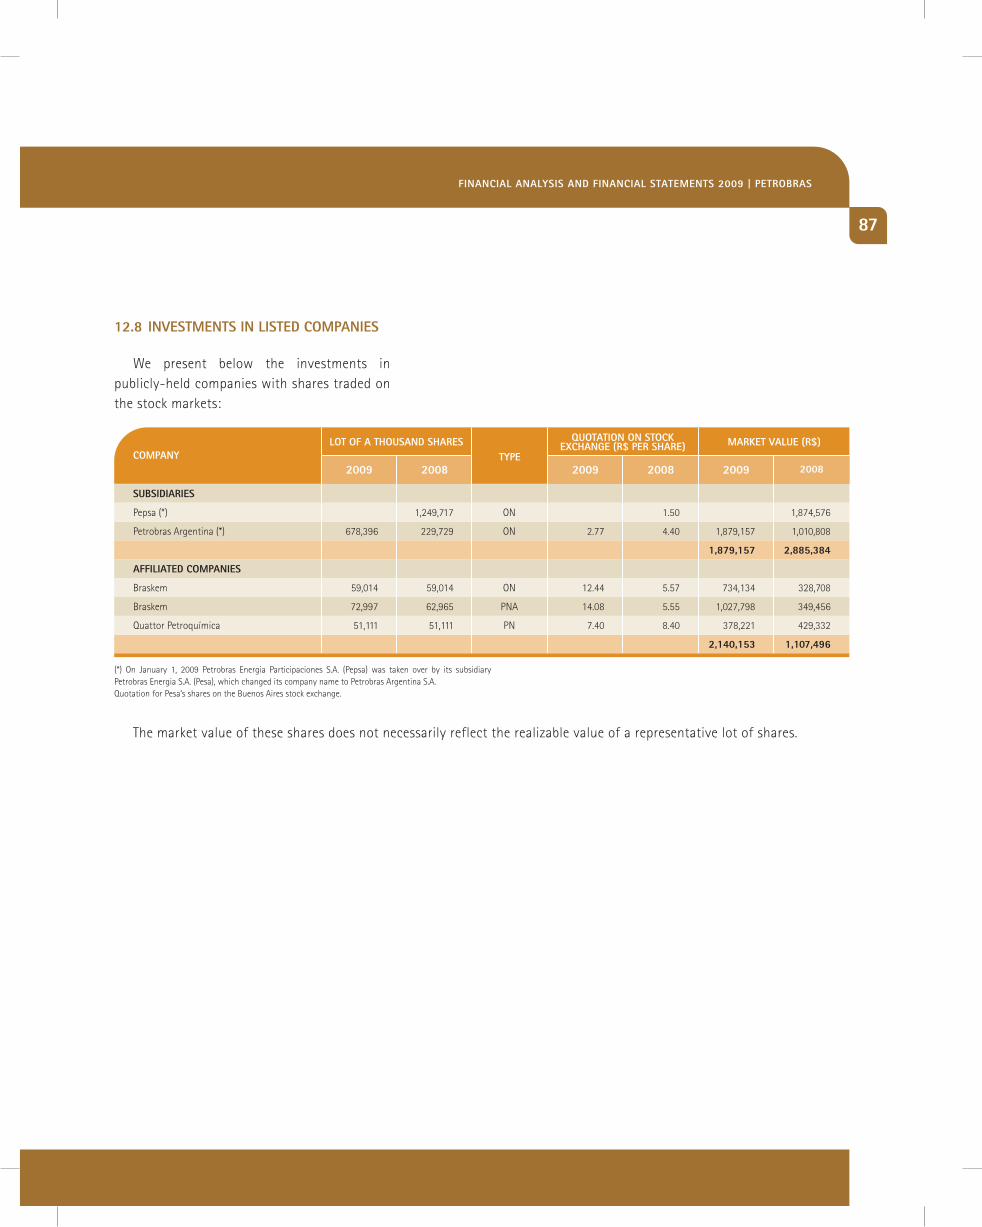
87
12.8 inVestments in listed cOmPanies
We present below the investments in publicly-held companies with shares traded on the stock markets:
the market value of these shares does not necessarily reflect the realizable value of a representative lot of shares.
sUBsidiaRies
pepsa (*) 1,249,717 on 1.50 1,874,576
petrobras argentina (*) 678,396 229,729 on 2.77 4.40 1,879,157 1,010,808
1,879,157 2,885,384
aFFiliated cOmPanies
braskem 59,014 59,014 on 12.44 5.57 734,134 328,708
braskem 72,997 62,965 pna 14.08 5.55 1,027,798 349,456
quattor petroquímica 51,111 51,111 pn 7.40 8.40 378,221 429,332
2,140,153 1,107,496
qUOtatiOn On stOcK exchange (R$ PeR shaRe) maRKet ValUe (R$)
200820092008200920082009
lOt OF a thOUsand shaRestyPecOmPany
(*) on january 1, 2009 petrobras Energia participaciones S.a. (pepsa) was taken over by its subsidiary petrobras Energia S.a. (pesa), which changed its company name to petrobras argentina S.a.quotation for pesa’s shares on the buenos aires stock exchange.
Financial analysis And Financial statements 2009 | PetROBRas
12.9 OtheR inFORmatiOn
a) new investments abroada.1) Acquisition of the entire Pasadena Refinery
in a decision handed down on april 10, 2009, in an arbitration process existing between petrobras america inc. (pai) and others and astra oil trading nV (aStra) and others, which was in progress in accordance with the arbitration rules of the international centre for dispute resolution, the exercise of the put option exercised by aStra was confirmed as valid with respect to pai and subsidiaries of the remaining 50% of the shares of aStra in pasadena refinery Systems inc. (prSi) and in the correlated trading company. prSi owns the pasadena refinery, with an operating office in texas. the operating, management and financial responsibilities had already been transferred to pai since September 17, 2008, based on a preliminary arbitration decision on october 24, 2008.
according to the arbitration decision on april 10, the amount to be paid for the remaining 50% shareholding interest in the refinery and in the trading company in pasadena was fixed at uS$ 466 million. the payment would be made in three installments, the first in the amount of uS$ 296 million (originally due on april 27, 2009, according to the decision) and the following two payments in the amount uS$ 85 million each, with due dates fixed by the arbitrators for September 2009 and September 2010. the disputing parties presented requests for clarification to the arbitration panel on certain points of the decision, but on june 3, 2009 the arbitration panel had already confirmed “in totum” the original decision without presenting any further explanations. the arbitration decision also determined, in addition to the amount attributed to the purchase of that shares,
88
reimbursement to aStra by pai of the amount of uS$ 156 million, consisting of a guarantee related to the loan taken out by the trading company from bnp paribas, since the line of credit for this company from the aforementioned bank had been closed.
the amounts corresponding to the purchase of the shares and the reimbursement of the payment of the guarantee to aStra by bnp have been recognized in the accounting by the company since the arbitration decision in april 2009. at december 31, 2009, these amounts corresponded to uS$ 488 million and uS$ 177 million, respectively, already considering the interest due up to this date.
in march 2009 a loss was recognized in the amount of r$ 341,179 thousand (rS 147,365 thousand), corresponding to the difference between the value of the net assets and the value defined by the arbitration panel.
until now the parties have not reached an agreement with respect to the finalization of various pending items existing between them, some of them the object of double collection on the part of aStra, for signing the overall term of agreement that will put an end to the litigation and permit the payments that are the object of the arbitration decision.
on march 10, 2010, the Federal court of houston, texas, uSa confirmed the arbitration award handed down on april 10, 2009, rejecting a request by pai for extinguishment of the process without resolution of merit, through incompetence of the judge, and of partial annulment and modification of the arbitration ward. it ratified,
nOtes tO the Financial statements (cOnsOlidated and PaRent cOmPany)
(in thousand of reais)
89
notwithstanding, the decision that pai acquired 100% of the shareholding of astra oil trading nV in prSi. pai is going to appeal the part of the decision that confirmed the competence of the Federal court in question and other aspects of the decision.
judicial proceedings in which requests are made for reciprocal indemnifications made by the parties also continue in progress. additionally, prSi and the trading company are seeking recovery of certain accounting and fiscal books and records of these companies incorrectly withheld by aStra and two legal firms.
a.2) In Chileon april 30, 2009, petrobras, through
its wholly owned subsidiaries petrobras Venezuela investments & Services b.V and petrobras participaciones, S.l., located in the netherlands and Spain, respectively, concluded the process for the acquisition of the distribution and logistics businesses of Exxonmobil in chile, with the payment of uS$ 400 million, net of the cash and cash equivalents of the companies purchased.
With this acquisition, petrobras entered the chilean market fuel distribution market with a network of around 230 service stations, its presence in 11 airports, an interest in six distribution terminals, four of which are its own and two of which are joint ventures, and a 22% interest in the company Sociedad nacional de oleodutos and a 33,3% interest in the company Sociedad de inversiones de aviación.
on december 1, 2009 an agreement was signed for the purchase for about uS$ 14 million of chevron chile S.a.c, which produces and sells lubricants of the texaco brand in chile.
chevron chile S.a.c. is a chilean company that has a plant located in Santiago, with a production capacity of 15,900 m³ per year and a share of approximately 6% of the chilean finished lubricants market.
this acquisition has consolidated the company’s presence in the fuel and lubricants distribution segment in latin america, where, in addition to brazil, the company already operates in argentina, colombia, paraguay, chile and uruguay through a network of more than 1,200 service stations.
Financial analysis And Financial statements 2009 | PetROBRas
b) investments in VenezuelaWith the conversion of the operating
agreements in Venezuela into the government-controlled companies, with a 60% interest held by the Venezuelan government and 40% by the other private partners, petrobras Energia S.a. (pESa) ceased to consolidate the assets, liabilities and results referring to the aforementioned operation, presenting them as corporate investments in affiliated companies as from april 2006. the recovery of these investments is related to the volatility of the price of petroleum, to economic, social and regulatory conditions in Venezuela and, particularly, to the interests of its shareholders with respect to the development of the petroleum reserves. accordingly, in order to adjust the book value of the investment to its estimated recoverable value, losses were recognized on investments in the amount equivalent to r$ 134,816 (uS$ 77,007 thousand) in 2009 and r$ 55,425 (uS$ 23,115 thousand) in 2008.
c) ipiranga groupc.1) Refining assets
in march 2009 the receipt of the refining assets of the ipiranga group was finalized with the effective delivery of the shares of refinaria de petróleo riograndense S.a. belonging to petrobras and braskem.
the delivery of the shares occurred concomitantly with the refinery’s capital increase through the subscription and consequent payment for new shares by petrobras, braskem and ultrapar, in order to equalize the corporate interests between these companies. on march 18, 2009 a shareholders’ agreement was executed between petrobras, ultrapar and braskem, in
90
which the governance rules for making the joint control and management between the signatories viable were established.
c.2) Distribution and asphalt assetson march 6, 2009, the board of directors of
petrobras and petrobras distribuidora authorized the transfer of the interests in alvo and iaSa, through a capital increase corresponding to the net equity of these companies.
on april 9, 2009, the Special general Shareholders’ meeting of petrobras distribuidora approved the proposed capital increase in the amount of r$ 670.966, thus concluding the process for transfer of alvo and iaSa, which became subsidiaries of petrobras distribuidora.
on october 31, 2009 the Special Shareholders’ meeting of petrobras distribuidora approved the total merger of alvo into the equity of br, for the purpose of optimizing management of the distribution business and benefiting from the estimated synergies at the time of acquisition of the ipiranga group.
d) Braskem investment agreementthe merger of petroquímica triunfo S.a.
(triunfo) into braskem, in the terms of the protocol and justification for merger of april 7, 2009, was approved in the Special general Shareholders’ meeting of braskem held on april 30 and in the Special general Shareholders’ meeting of triunfo held on may 5. this transaction concluded the integration of assets established in the investment agreement between braskem, odebrecht, petrobras, petroquisa and norquisa, executed in november 2007 and approved by cadE in july 2008. With this merger petroquisa now holds 31.0% of the voting capital and 25.3% of the total capital of braskem.
nOtes tO the Financial statements (cOnsOlidated and PaRent cOmPany)
(in thousand of reais)
e) creation of companies of the Rio de janeiro Petrochemical complex (cOmPeRj)on February 5, 2009, petrobras, in continuation
of the implementation of the rio de janeiro petrochemical complex (compErj), established six (6) joint stock companies, in rio de janeiro, as follows:• Comperj Participações S.A. - a specific
purpose entity that will hold the interests of petrobras in the producing companies of compErj; comperj petroquímicos básicos S.a. - a company producing basic petrochemicals; comperj pEt S.a. - a company producing pta/pEt; comperj Estirênicos S.a. - a company producing styrene; comperj mEg S.a. - a company producing glycol ethylene and ethylene oxide; and comperj poliolefinas S.a. - a company producing polyolefines (pp/pE).currently, petrobras holds 100% of the total
and voting capital of these companies, and the integration and relationship model of the companies of compErj is being implemented. this model seeks to capture the synergies arising from locating a number of companies on the same production site. the assets, obligations and rights related to compErj will be transferred to these companies by petrobras at an opportune moment.
on december 30, 2009, petrobras made transfers of assets in the total amount r$ 1,349,173 recorded in accounting reports approved by the management of each company.
91
on january 21, 2010, petrobras, odebrecht and braskem executed a joint-Venture agreement, the purpose of which is to regulate the commercial and corporate relationship in compErj, as described in detail in note 31 - Subsequent events.
f) Petrobras Bicombustível acquires 50% of a biodiesel plant in Paranáin december 2009, petrobras biocombustível
made investments in the amount of r$ 55 million in the capital of the company bSbioS marialva indústria e comércio de biodiesel Sul brasil S.a. and now holds 50% of the company’s shares. of the total investment, r$ 45 million was already paid in 2009 and the remaining r$ 10 million will be paid in on the occasion of the start-up of operations of the company, forecast for the second quarter of 2010.
bSbioS marialva, established on june 12, 2009, is located in the municipality of marialva, in the State of paraná, and is capable of producing 120 million liters of biodiesel per year. in the region, Family agriculture is responsible for 31% of the soybeans produced, constituting a scenario propitious for obtaining Social Fuel Seal certification.
the social object consists of industrialization, further processing, trading, importing, exporting and distribution of oleaginous cereals and seeds, unrefined and refined vegetable oils, biodiesel, glycerin, their derivatives and byproducts including, but not limited to, vegetable protein.
Financial analysis And Financial statements 2009 | PetROBRas
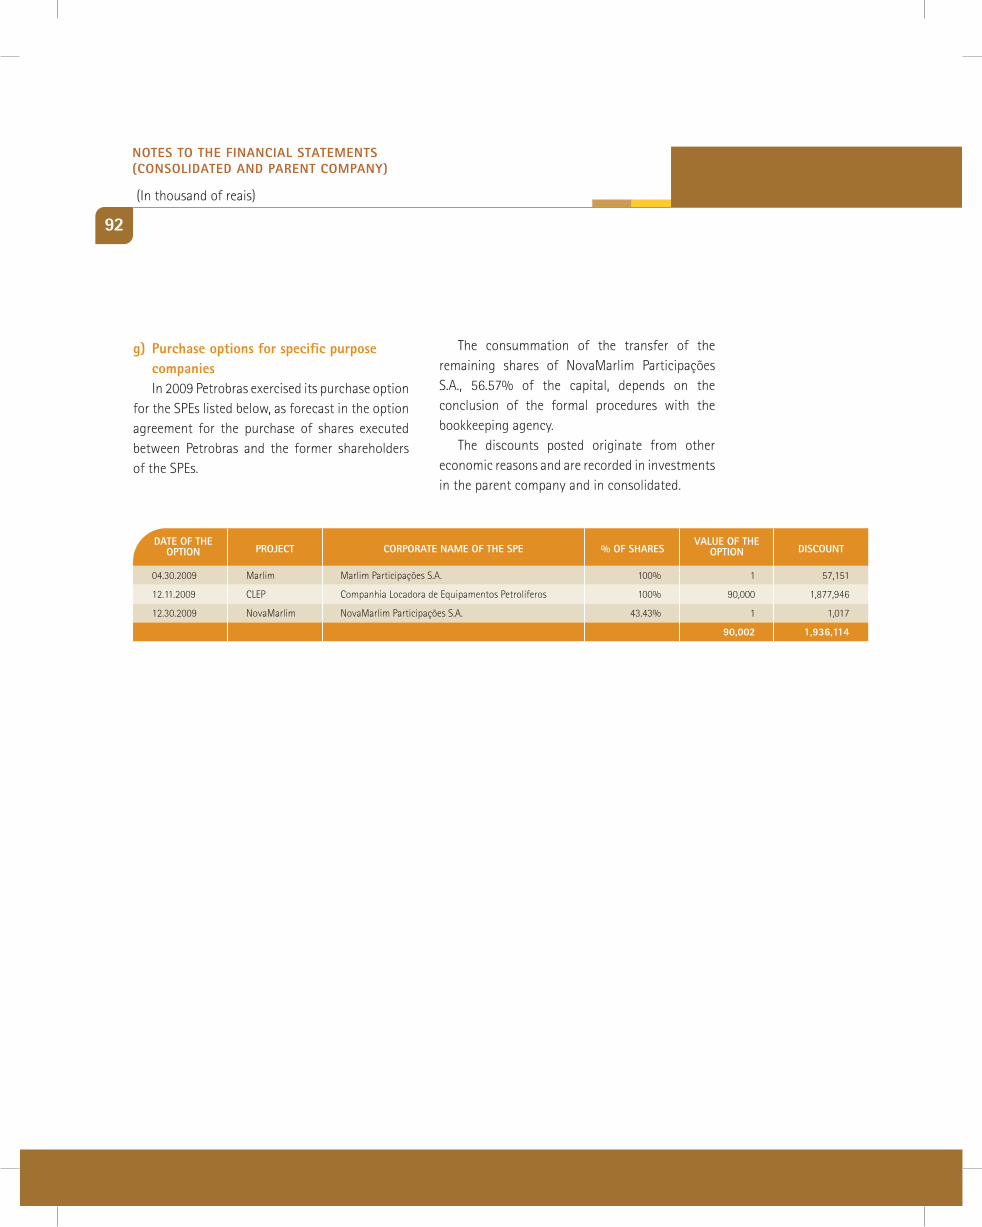
92
g) Purchase options for specific purpose companiesin 2009 petrobras exercised its purchase option
for the SpEs listed below, as forecast in the option agreement for the purchase of shares executed between petrobras and the former shareholders of the SpEs.
the consummation of the transfer of the remaining shares of novamarlim participações S.a., 56.57% of the capital, depends on the conclusion of the formal procedures with the bookkeeping agency.
the discounts posted originate from other economic reasons and are recorded in investments in the parent company and in consolidated.
date OF the OPtiOn PROject cORPORate name OF the sPe % OF shaRes
ValUe OF the OPtiOn discOUnt
04.30.2009 marlim marlim participações S.a. 100% 1 57,151
12.11.2009 clEp companhia locadora de Equipamentos petrolíferos 100% 90,000 1,877,946
12.30.2009 novamarlim novamarlim participações S.a. 43.43% 1 1,017
90,002 1,936,114
nOtes tO the Financial statements (cOnsOlidated and PaRent cOmPany)
(in thousand of reais)
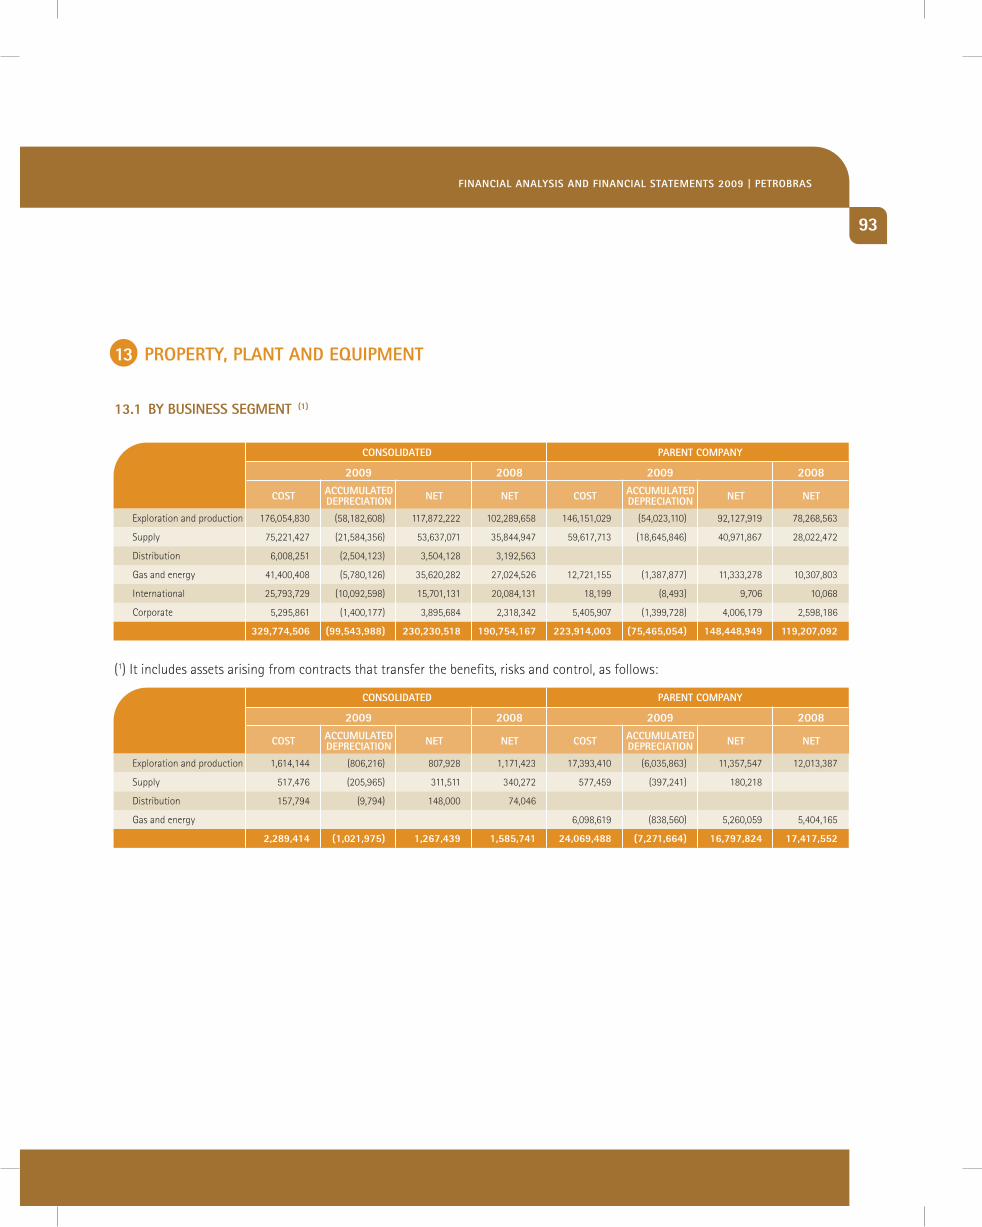
93
13.1 By BUsiness segment (1)
13 PROPeRty, Plant and eqUiPment
cOnsOlidated PaRent cOmPany
Exploration and production 1,614,144 (806,216) 807,928 1,171,423 17,393,410 (6,035,863) 11,357,547 12,013,387
Supply 517,476 (205,965) 311,511 340,272 577,459 (397,241) 180,218
distribution 157,794 (9,794) 148,000 74,046
gas and energy 6,098,619 (838,560) 5,260,059 5,404,165
2,289,414 (1,021,975) 1,267,439 1,585,741 24,069,488 (7,271,664) 16,797,824 17,417,552
net netnet netaccUmUlated dePReciatiOn
accUmUlated dePReciatiOncOst cOst
2009 20092008 2008
cOnsOlidated PaRent cOmPany
Exploration and production 176,054,830 (58,182,608) 117,872,222 102,289,658 146,151,029 (54,023,110) 92,127,919 78,268,563
Supply 75,221,427 (21,584,356) 53,637,071 35,844,947 59,617,713 (18,645,846) 40,971,867 28,022,472
distribution 6,008,251 (2,504,123) 3,504,128 3,192,563
gas and energy 41,400,408 (5,780,126) 35,620,282 27,024,526 12,721,155 (1,387,877) 11,333,278 10,307,803
international 25,793,729 (10,092,598) 15,701,131 20,084,131 18,199 (8,493) 9,706 10,068
corporate 5,295,861 (1,400,177) 3,895,684 2,318,342 5,405,907 (1,399,728) 4,006,179 2,598,186
329,774,506 (99,543,988) 230,230,518 190,754,167 223,914,003 (75,465,054) 148,448,949 119,207,092
net netnet netaccUmUlated dePReciatiOn
accUmUlated dePReciatiOncOst cOst
2009 20092008 2008
(1) it includes assets arising from contracts that transfer the benefits, risks and control, as follows:
Financial analysis And Financial statements 2009 | PetROBRas
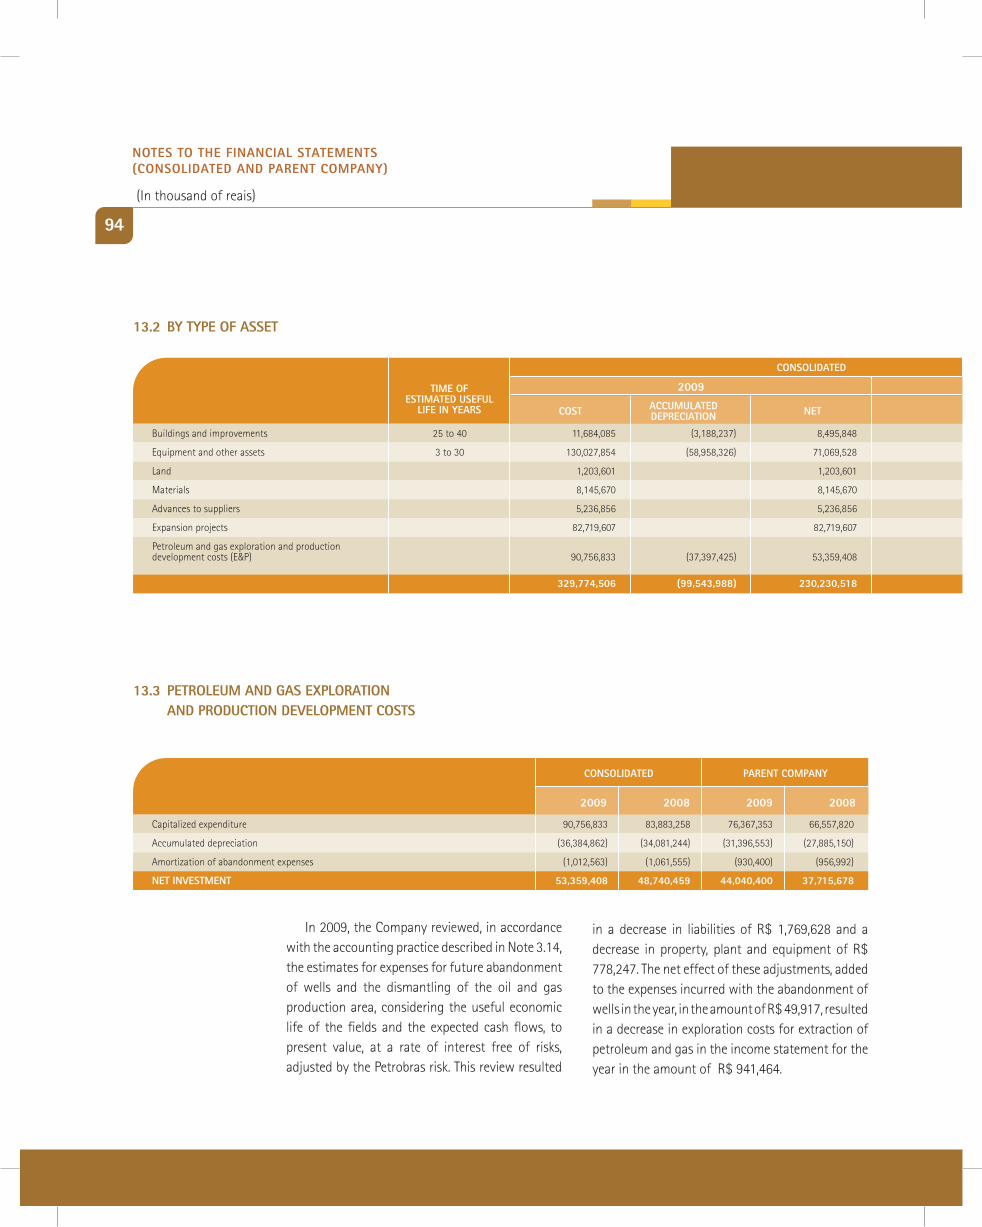
94
13.2 By tyPe OF asset
13.3 PetROleUm and gas exPlORatiOn and PROdUctiOn deVelOPment cOsts
2009
buildings and improvements 25 to 40 11,684,085 (3,188,237) 8,495,848 6,267,055 7,506,019 (1,979,134) 5,526,885 3,731,538
Equipment and other assets 3 to 30 130,027,854 (58,958,326) 71,069,528 64,145,157 81,135,800 (41,158,967) 39,976,833 34,122,523
land 1,203,601 1,203,601 1,138,720 464,514 464,514 478,350
materials 8,145,670 8,145,670 6,034,143 6,780,171 6,780,171 4,579,142
advances to suppliers 5,236,856 5,236,856 5,189,735 1,526,921 1,526,921 1,602,179
Expansion projects 82,719,607 82,719,607 59,238,898 50,133,225 50,133,225 36,977,682
petroleum and gas exploration and production development costs (E&p) 90,756,833 (37,397,425) 53,359,408 48,740,459 76,367,353 (32,326,953) 44,040,400 37,715,678
329,774,506 (99,543,988) 230,230,518 190,754,167 223,914,003 (75,465,054) 148,448,949 119,207,092
2009
cOnsOlidated
net netnet netaccUmUlated dePReciatiOn
accUmUlated dePReciatiOncOst cOst
time OF estimated UseFUl
liFe in yeaRs
20082008
PaRent cOmPany
cOnsOlidated
capitalized expenditure 90,756,833 83,883,258 76,367,353 66,557,820
accumulated depreciation (36,384,862) (34,081,244) (31,396,553) (27,885,150)
amortization of abandonment expenses (1,012,563) (1,061,555) (930,400) (956,992)
net inVestment 53,359,408 48,740,459 44,040,400 37,715,678
2009 2008 2009 2008
PaRent cOmPany
in 2009, the company reviewed, in accordance with the accounting practice described in note 3.14, the estimates for expenses for future abandonment of wells and the dismantling of the oil and gas production area, considering the useful economic life of the fields and the expected cash flows, to present value, at a rate of interest free of risks, adjusted by the petrobras risk. this review resulted
in a decrease in liabilities of r$ 1,769,628 and a decrease in property, plant and equipment of r$ 778,247. the net effect of these adjustments, added to the expenses incurred with the abandonment of wells in the year, in the amount of r$ 49,917, resulted in a decrease in exploration costs for extraction of petroleum and gas in the income statement for the year in the amount of r$ 941,464.
nOtes tO the Financial statements (cOnsOlidated and PaRent cOmPany)
(in thousand of reais)
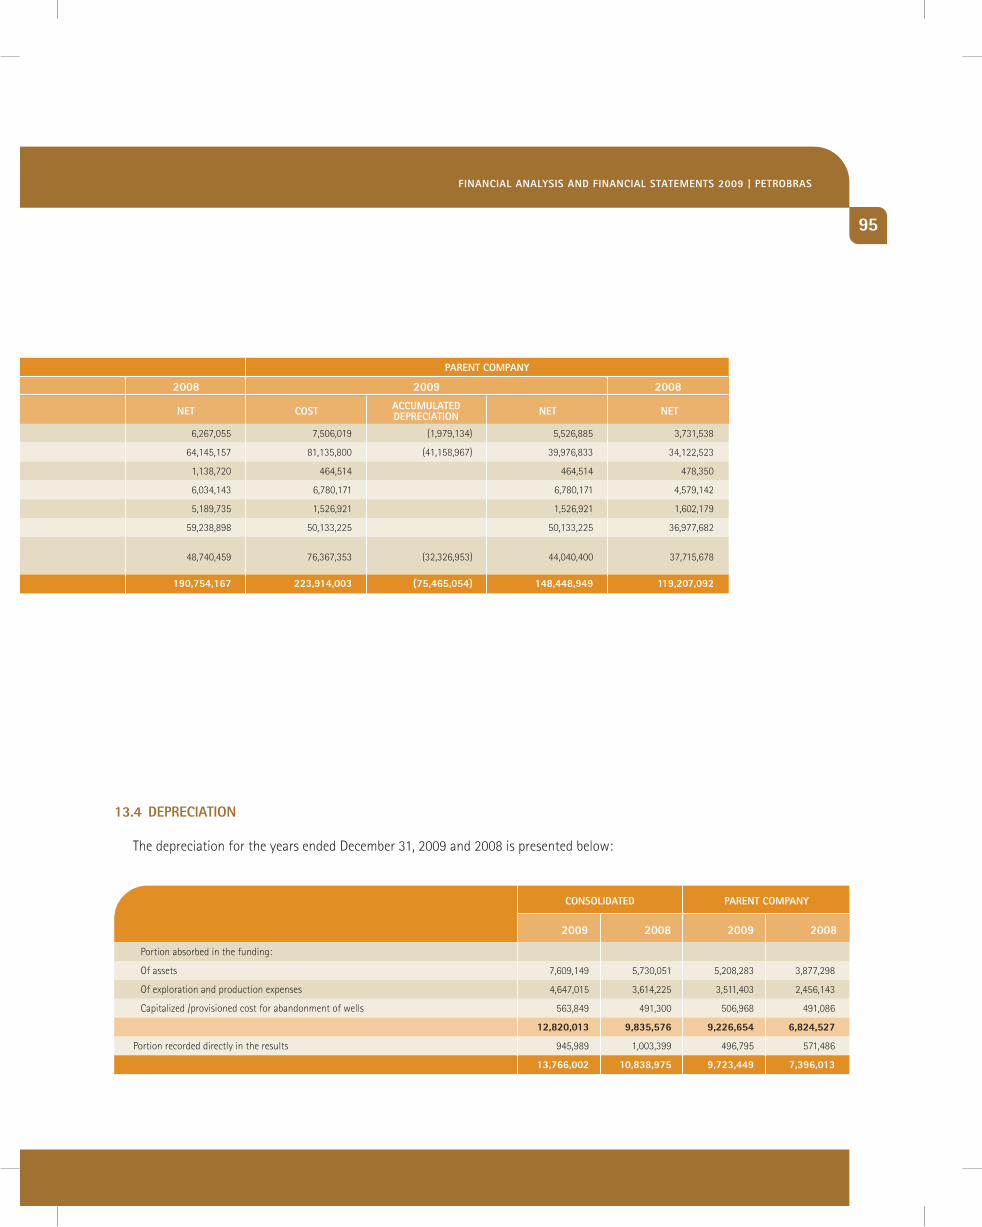
95
13.4 dePReciatiOn
the depreciation for the years ended december 31, 2009 and 2008 is presented below:
cOnsOlidated
portion absorbed in the funding:
of assets 7,609,149 5,730,051 5,208,283 3,877,298
of exploration and production expenses 4,647,015 3,614,225 3,511,403 2,456,143
capitalized /provisioned cost for abandonment of wells 563,849 491,300 506,968 491,086
12,820,013 9,835,576 9,226,654 6,824,527
portion recorded directly in the results 945,989 1,003,399 496,795 571,486
13,766,002 10,838,975 9,723,449 7,396,013
2009 2008 2009 2008
PaRent cOmPany
Financial analysis And Financial statements 2009 | PetROBRas
2009
buildings and improvements 25 to 40 11,684,085 (3,188,237) 8,495,848 6,267,055 7,506,019 (1,979,134) 5,526,885 3,731,538
Equipment and other assets 3 to 30 130,027,854 (58,958,326) 71,069,528 64,145,157 81,135,800 (41,158,967) 39,976,833 34,122,523
land 1,203,601 1,203,601 1,138,720 464,514 464,514 478,350
materials 8,145,670 8,145,670 6,034,143 6,780,171 6,780,171 4,579,142
advances to suppliers 5,236,856 5,236,856 5,189,735 1,526,921 1,526,921 1,602,179
Expansion projects 82,719,607 82,719,607 59,238,898 50,133,225 50,133,225 36,977,682
petroleum and gas exploration and production development costs (E&p) 90,756,833 (37,397,425) 53,359,408 48,740,459 76,367,353 (32,326,953) 44,040,400 37,715,678
329,774,506 (99,543,988) 230,230,518 190,754,167 223,914,003 (75,465,054) 148,448,949 119,207,092
2009
cOnsOlidated
net netnet netaccUmUlated dePReciatiOn
accUmUlated dePReciatiOncOst cOst
time OF estimated UseFUl
liFe in yeaRs
20082008
PaRent cOmPany
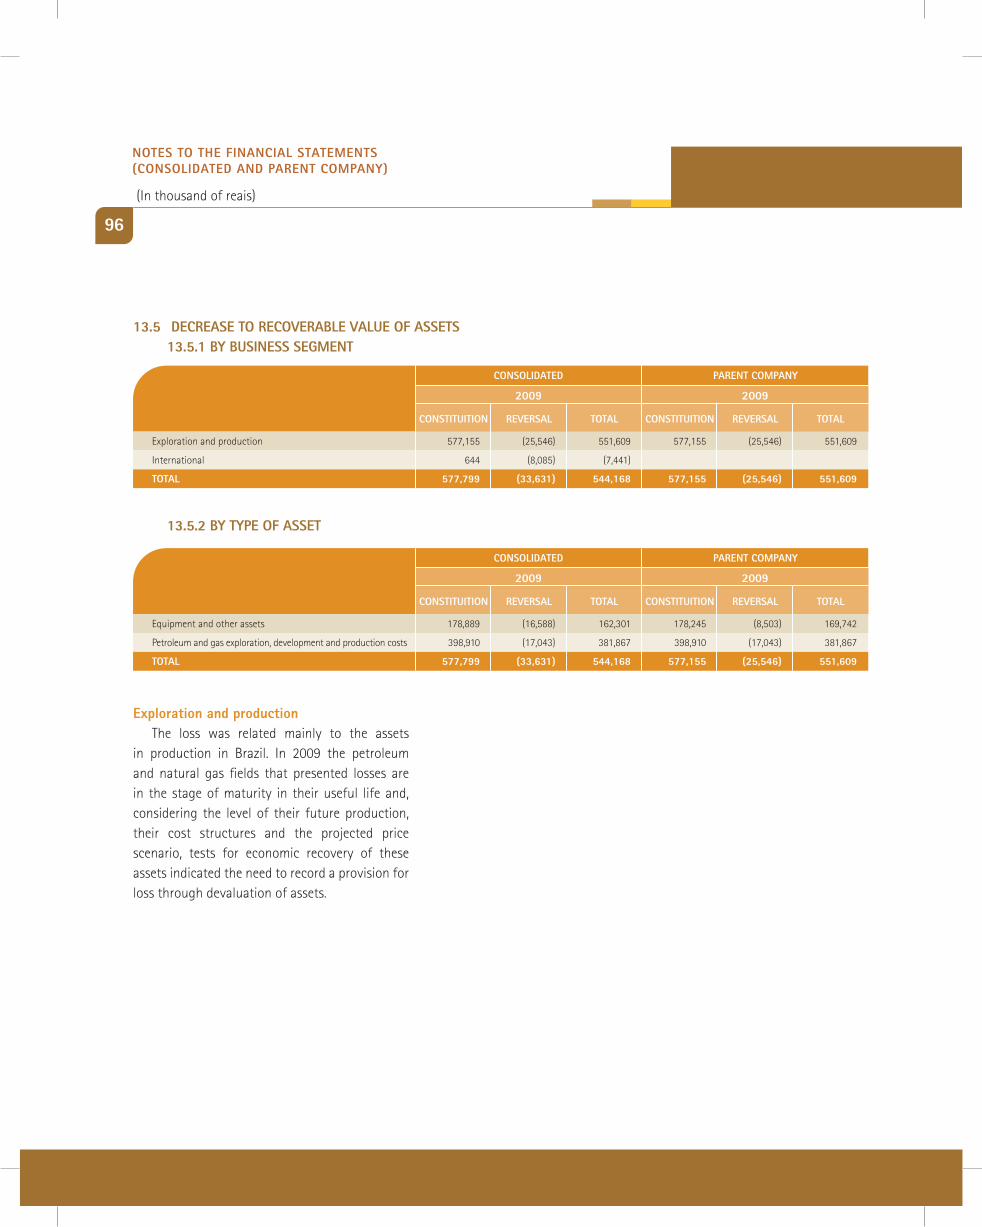
96
cOnsOlidated PaRent cOmPany
Exploration and production 577,155 (25,546) 551,609 577,155 (25,546) 551,609
international 644 (8,085) (7,441)
tOtal 577,799 (33,631) 544,168 577,155 (25,546) 551,609
ReVeRsal ReVeRsalcOnstitUitiOn cOnstitUitiOntOtal tOtal
2009 2009
cOnsOlidated PaRent cOmPany
Equipment and other assets 178,889 (16,588) 162,301 178,245 (8,503) 169,742
petroleum and gas exploration, development and production costs 398,910 (17,043) 381,867 398,910 (17,043) 381,867
tOtal 577,799 (33,631) 544,168 577,155 (25,546) 551,609
ReVeRsal ReVeRsalcOnstitUitiOn cOnstitUitiOntOtal tOtal
2009 2009
13.5 decRease tO RecOVeRaBle ValUe OF assets 13.5.1 By BUsiness segment
13.5.2 By tyPe OF asset
exploration and productionthe loss was related mainly to the assets
in production in brazil. in 2009 the petroleum and natural gas fields that presented losses are in the stage of maturity in their useful life and, considering the level of their future production, their cost structures and the projected price scenario, tests for economic recovery of these assets indicated the need to record a provision for loss through devaluation of assets.
nOtes tO the Financial statements (cOnsOlidated and PaRent cOmPany)
(in thousand of reais)
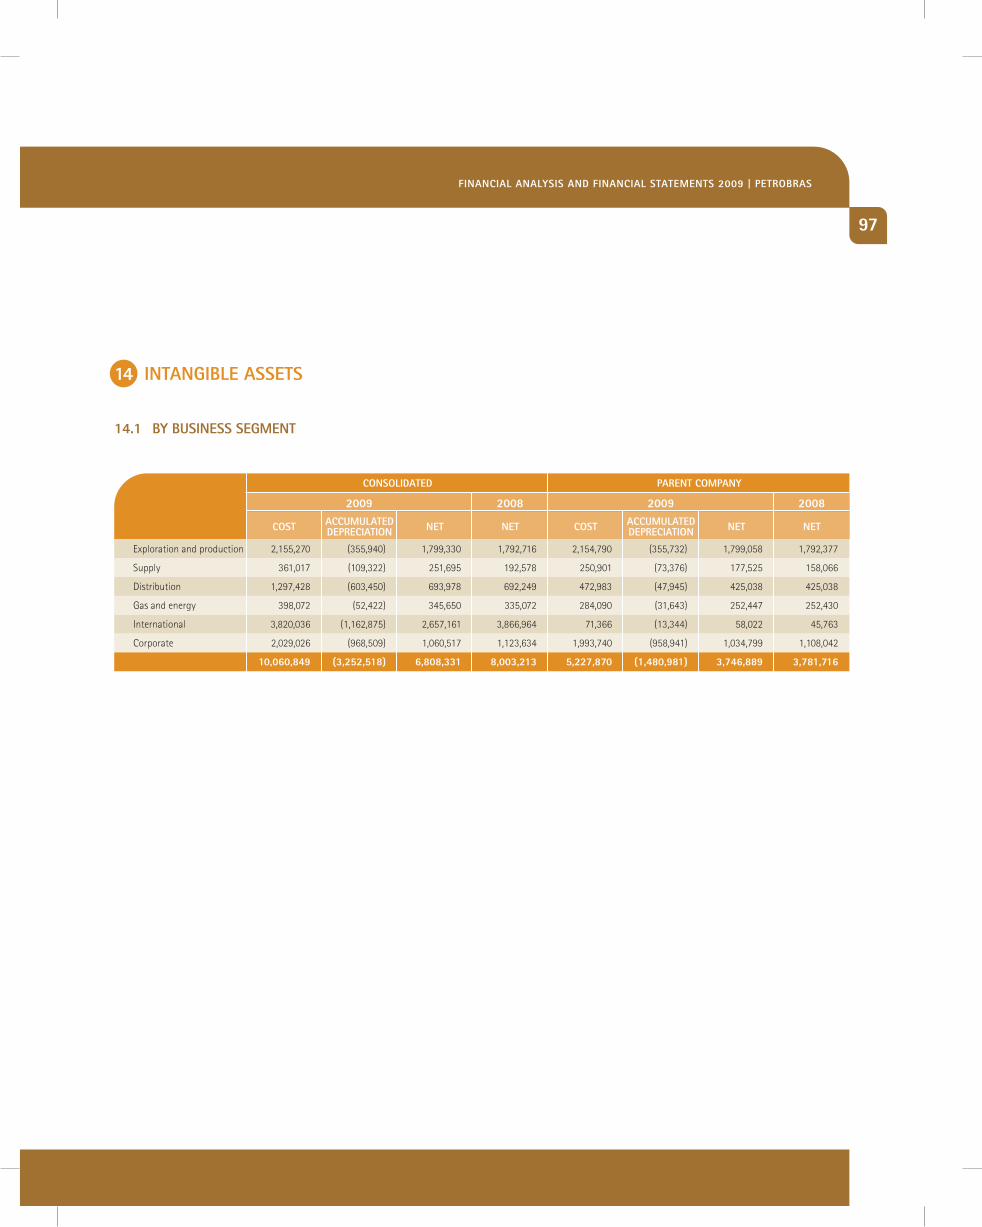
97
cOnsOlidated PaRent cOmPany
Exploration and production 2,155,270 (355,940) 1,799,330 1,792,716 2,154,790 (355,732) 1,799,058 1,792,377
Supply 361,017 (109,322) 251,695 192,578 250,901 (73,376) 177,525 158,066
distribution 1,297,428 (603,450) 693,978 692,249 472,983 (47,945) 425,038 425,038
gas and energy 398,072 (52,422) 345,650 335,072 284,090 (31,643) 252,447 252,430
international 3,820,036 (1,162,875) 2,657,161 3,866,964 71,366 (13,344) 58,022 45,763
corporate 2,029,026 (968,509) 1,060,517 1,123,634 1,993,740 (958,941) 1,034,799 1,108,042
10,060,849 (3,252,518) 6,808,331 8,003,213 5,227,870 (1,480,981) 3,746,889 3,781,716
net netnet netaccUmUlated dePReciatiOn
accUmUlated dePReciatiOncOst cOst
2009 20092008 2008
14.1 By BUsiness segment
14 intangiBle assets
Financial analysis And Financial statements 2009 | PetROBRas
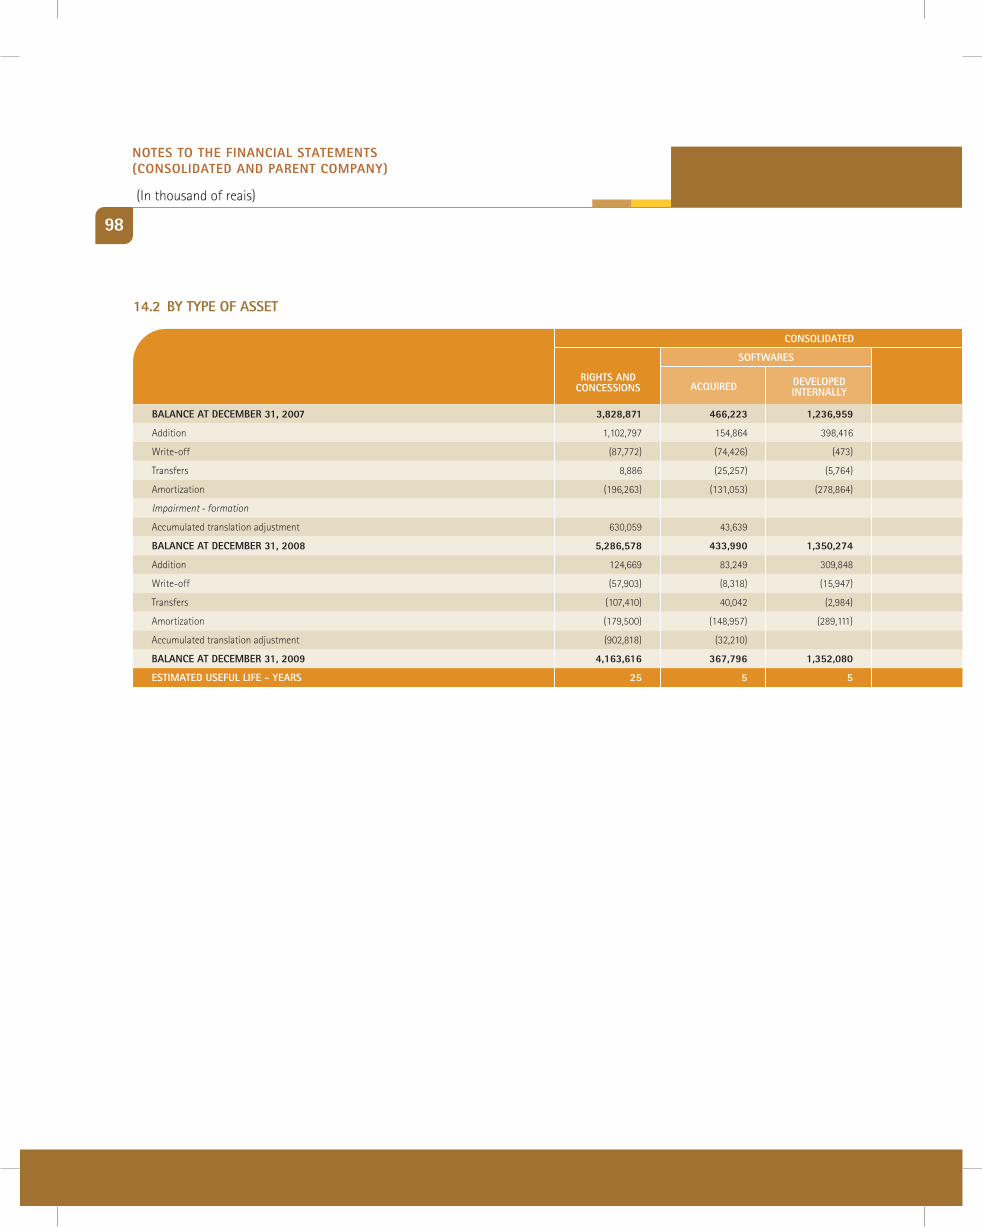
sOFtwaRes sOFtwaRes
Balance at decemBeR 31, 2007 3,828,871 466,223 1,236,959 5,532,053 1,655,632 197,171 1,221,872 3,074,675
addition 1,102,797 154,864 398,416 27,158 1,683,235 98,927 80,951 389,542 27,158 596,578
Write-off (87,772) (74,426) (473) (9,438) (172,109) (43,858) (86) (473) (44,417)
transfers 8,886 (25,257) (5,764) 1,221,814 1,199,679 (640) (8,968) (450) 553,853 543,795
amortization (196,263) (131,053) (278,864) (118,257) (724,437) (2,200) (75,309) (278,864) (32,542) (388,915)
Impairment - formation (384,431) (384,431)
accumulated translation adjustment 630,059 43,639 195,525 869,223
Balance at decemBeR 31, 2008 5,286,578 433,990 1,350,274 932,371 8,003,213 1,707,861 193,759 1,331,627 548,469 3,781,716
addition 124,669 83,249 309,848 16,463 534,229 15,454 51,073 296,282 362,809
Write-off (57,903) (8,318) (15,947) (82,168) (15,478) (3,248) (9,558) (28,284)
transfers (107,410) 40,042 (2,984) 16,471 (53,881) 216 1,170 1,386
amortization (179,500) (148,957) (289,111) (617,568) (3,498) (79,757) (287,483) (370,738)
accumulated translation adjustment (902,818) (32,210) (40,466) (975,494)
Balance at decemBeR 31, 2009 4,163,616 367,796 1,352,080 924,839 6,808,331 1,704,339 162,043 1,332,038 548,469 3,746,889
estimated UseFUl liFe - yeaRs 25 5 5 indeFinite 25 5 5 indeFinite
Rights and cOncessiOns acqUiRed acqUiReddeVelOPed
inteRnally deVelOPed inteRnally
gOOdwill FROmexPectatiOns OF
FUtURePROFitaBility
gOOdwill FROmexPectatiOns OF
FUtURePROFitaBility
tOtal tOtalRights and cOncessiOns
cOnsOlidated PaRent cOmPany
98
14.2 By tyPe OF asset
nOtes tO the Financial statements (cOnsOlidated and PaRent cOmPany)
(in thousand of reais)
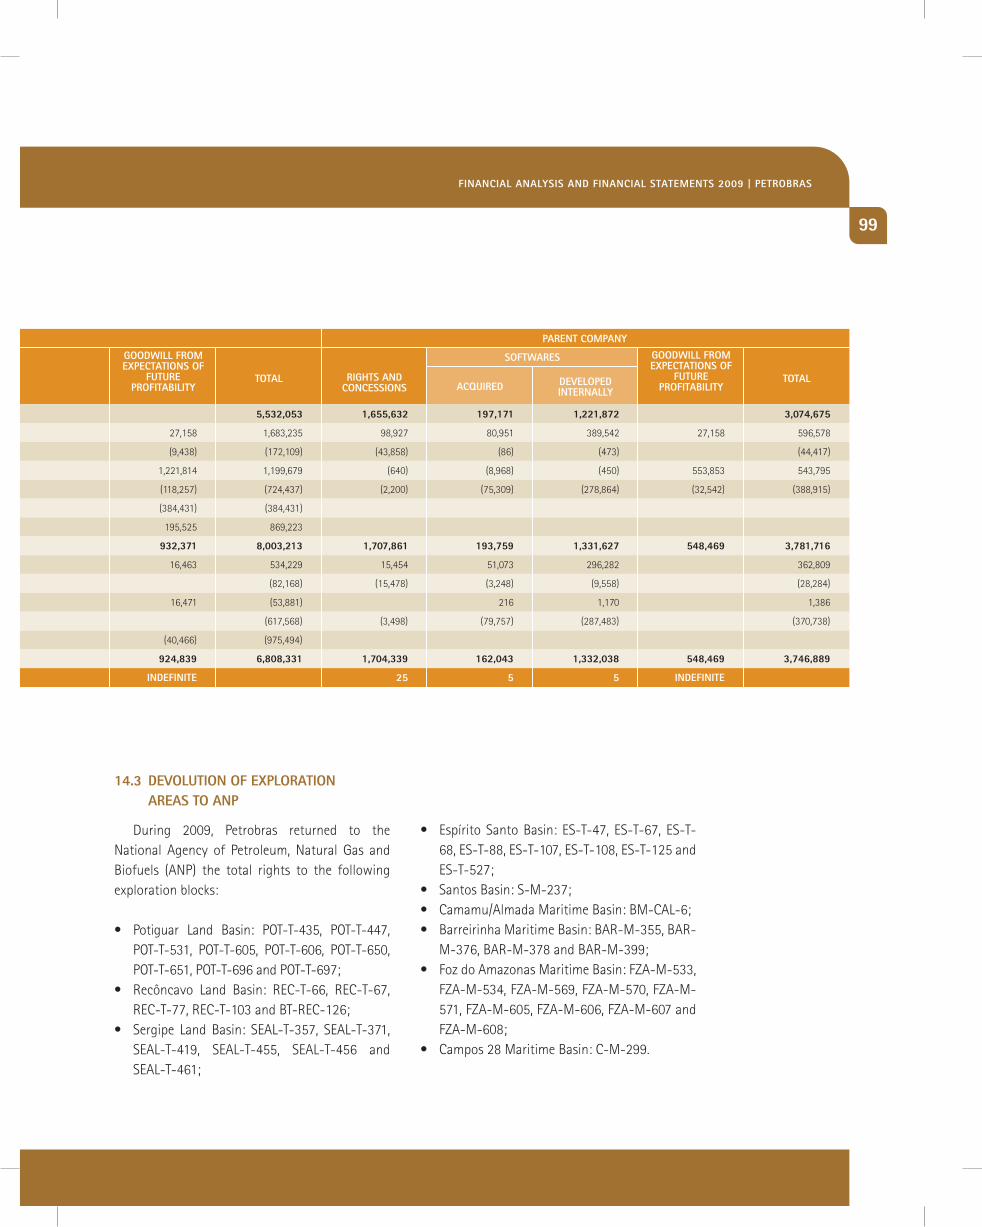
99
sOFtwaRes sOFtwaRes
Balance at decemBeR 31, 2007 3,828,871 466,223 1,236,959 5,532,053 1,655,632 197,171 1,221,872 3,074,675
addition 1,102,797 154,864 398,416 27,158 1,683,235 98,927 80,951 389,542 27,158 596,578
Write-off (87,772) (74,426) (473) (9,438) (172,109) (43,858) (86) (473) (44,417)
transfers 8,886 (25,257) (5,764) 1,221,814 1,199,679 (640) (8,968) (450) 553,853 543,795
amortization (196,263) (131,053) (278,864) (118,257) (724,437) (2,200) (75,309) (278,864) (32,542) (388,915)
Impairment - formation (384,431) (384,431)
accumulated translation adjustment 630,059 43,639 195,525 869,223
Balance at decemBeR 31, 2008 5,286,578 433,990 1,350,274 932,371 8,003,213 1,707,861 193,759 1,331,627 548,469 3,781,716
addition 124,669 83,249 309,848 16,463 534,229 15,454 51,073 296,282 362,809
Write-off (57,903) (8,318) (15,947) (82,168) (15,478) (3,248) (9,558) (28,284)
transfers (107,410) 40,042 (2,984) 16,471 (53,881) 216 1,170 1,386
amortization (179,500) (148,957) (289,111) (617,568) (3,498) (79,757) (287,483) (370,738)
accumulated translation adjustment (902,818) (32,210) (40,466) (975,494)
Balance at decemBeR 31, 2009 4,163,616 367,796 1,352,080 924,839 6,808,331 1,704,339 162,043 1,332,038 548,469 3,746,889
estimated UseFUl liFe - yeaRs 25 5 5 indeFinite 25 5 5 indeFinite
Rights and cOncessiOns acqUiRed acqUiReddeVelOPed
inteRnally deVelOPed inteRnally
gOOdwill FROmexPectatiOns OF
FUtURePROFitaBility
gOOdwill FROmexPectatiOns OF
FUtURePROFitaBility
tOtal tOtalRights and cOncessiOns
cOnsOlidated PaRent cOmPany
14.3 deVOlUtiOn OF exPlORatiOn aReas tO anP
during 2009, petrobras returned to the national agency of petroleum, natural gas and biofuels (anp) the total rights to the following exploration blocks:
• Potiguar Land Basin: POT-T-435, POT-T-447,pot-t-531, pot-t-605, pot-t-606, pot-t-650, pot-t-651, pot-t-696 and pot-t-697;
• Recôncavo Land Basin: REC-T-66, REC-T-67,rEc-t-77, rEc-t-103 and bt-rEc-126;
• Sergipe Land Basin: SEAL-T-357, SEAL-T-371,SEal-t-419, SEal-t-455, SEal-t-456 and SEal-t-461;
• EspíritoSantoBasin: ES-T-47, ES-T-67, ES-T-68, ES-t-88, ES-t-107, ES-t-108, ES-t-125 and ES-t-527;
• SantosBasin:S-M-237;• Camamu/AlmadaMaritimeBasin:BM-CAL-6;• BarreirinhaMaritimeBasin:BAR-M-355,BAR-
m-376, bar-m-378 and bar-m-399;• FozdoAmazonasMaritimeBasin:FZA-M-533,
FZA-M-534,FZA-M-569,FZA-M-570,FZA-M-571,FZA-M-605,FZA-M-606,FZA-M-607andFZA-M-608;
• Campos28MaritimeBasin:C-M-299.
Financial analysis And Financial statements 2009 | PetROBRas
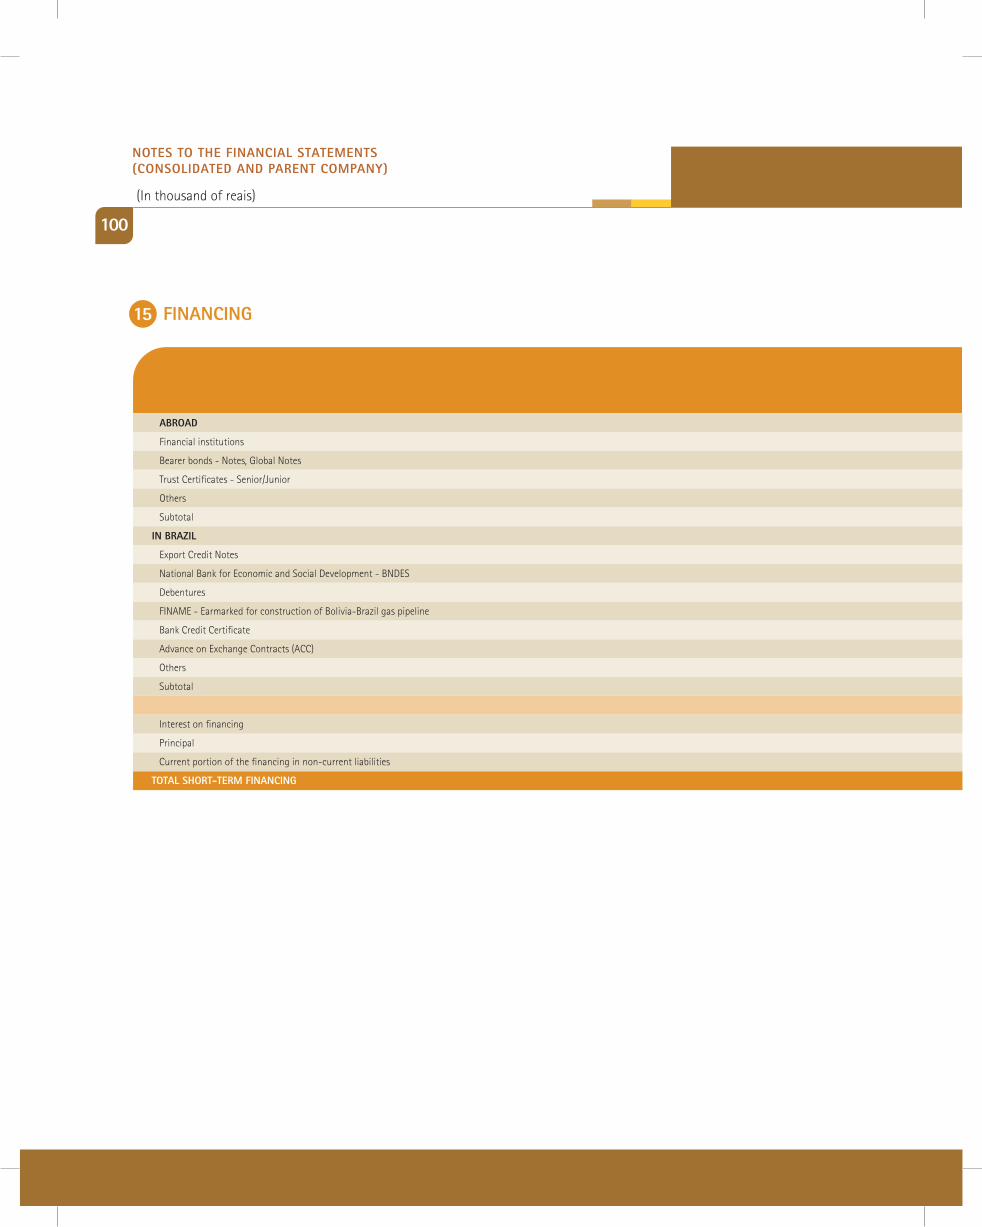
100
aBROad
Financial institutions 9,314,364 8,216,007 18,802,103 17,144,130 255,425 423,041 5,855,615 1,186,744
bearer bonds - notes, global notes 996,330 740,483 20,737,402 12,989,912
trust certificates - Senior/junior 120,372 159,719 450,704 762,432
others 3,224 253,346 174,120 233,700
Subtotal 10,434,290 9,369,555 40,164,329 31,130,174 255,425 423,041 5,855,615 1,186,744
in BRazil
Export credit notes 1,099,897 578,559 6,177,294 3,367,472 1,099,897 578,559 6,177,294 3,367,472
national bank for Economic and Social development - bndES 1,519,973 1,137,540 32,065,415 7,642,362 190,571 8,631,698
debentures 1,653,519 328,590 2,358,730 3,740,615 1,492,576 175,858 1,631,833 3,056,412
FinamE - Earmarked for construction of bolivia-brazil gas pipeline 80,678 99,475 103,653 244,967 77,431 96,427 101,593 240,002
bank credit certificate 7,083 11,735 3,770,630 3,605,934 7,083 11,735 3,605,934 3,605,934
advance on Exchange contracts (acc) 4,476 1,614,543 1,179,159
others 87,295 134,470 62,640 317,917 41,377
Subtotal 4,452,921 3,904,912 44,538,362 18,919,267 2,867,558 2,083,115 20,148,352 10,269,820
14,887,211 13,274,467 84,702,691 50,049,441 3,122,983 2,506,156 26,003,967 11,456,564
interest on financing (1,316,041) (823,330) (670,577) (229,334)
principal 13,571,170 12,451,137 2,452,406 2,276,822
current portion of the financing in non-current liabilities (5,987,558) (8,541,232) (2,452,406) (1,108,321)
tOtal shORt-teRm Financing 7,583,612 3,909,905 1,168,501
15 Financing
nOtes tO the Financial statements (cOnsOlidated and PaRent cOmPany)
(in thousand of reais)
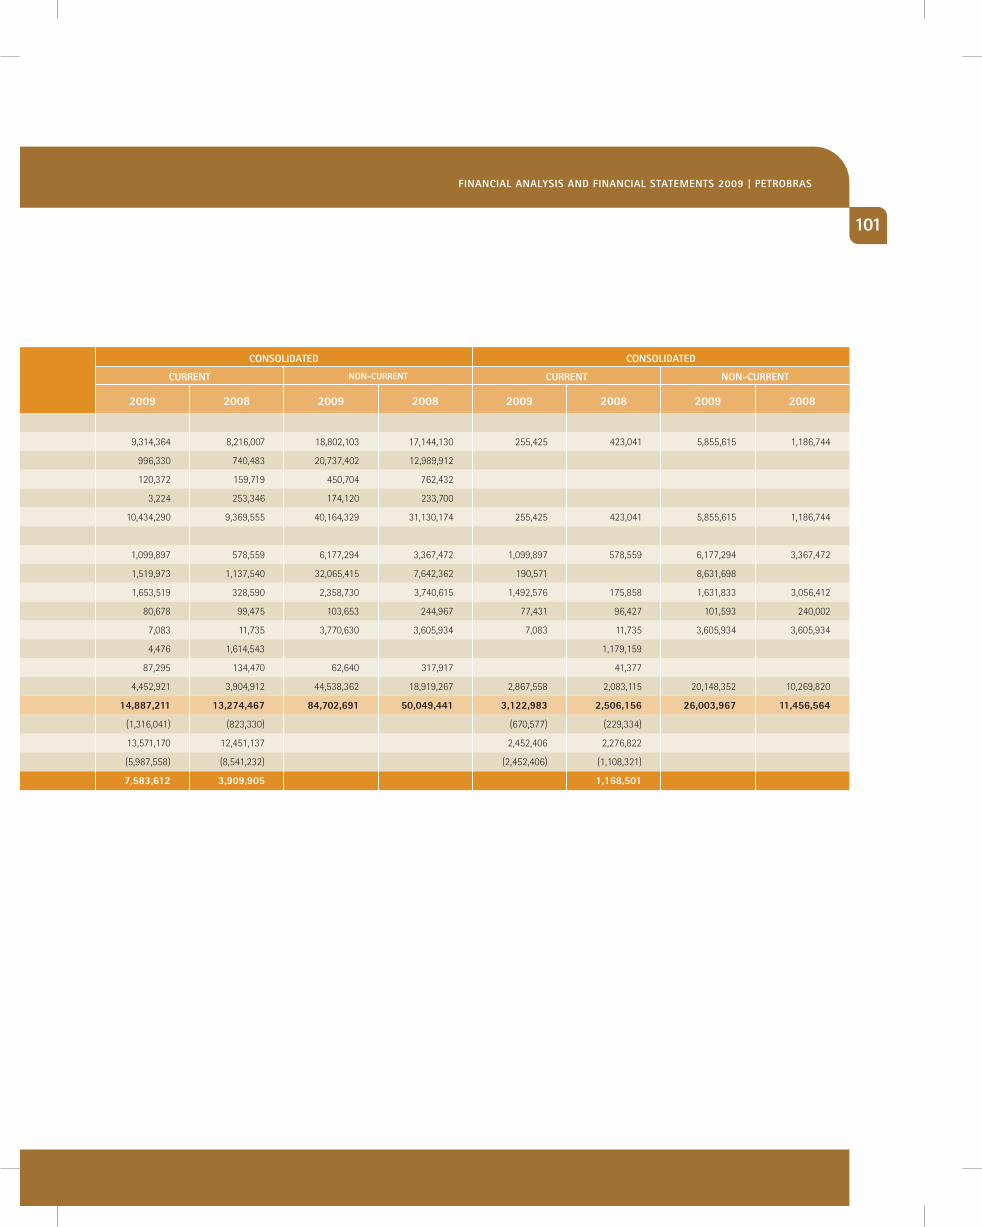
101
2009 (1)
2009 2008 2009 2008 2009 2008 2009 2008
cURRent cURRentnOn-cURRent nOn-cURRent
cOnsOlidated cOnsOlidated
Financial analysis And Financial statements 2009 | PetROBRas
aBROad
Financial institutions 9,314,364 8,216,007 18,802,103 17,144,130 255,425 423,041 5,855,615 1,186,744
bearer bonds - notes, global notes 996,330 740,483 20,737,402 12,989,912
trust certificates - Senior/junior 120,372 159,719 450,704 762,432
others 3,224 253,346 174,120 233,700
Subtotal 10,434,290 9,369,555 40,164,329 31,130,174 255,425 423,041 5,855,615 1,186,744
in BRazil
Export credit notes 1,099,897 578,559 6,177,294 3,367,472 1,099,897 578,559 6,177,294 3,367,472
national bank for Economic and Social development - bndES 1,519,973 1,137,540 32,065,415 7,642,362 190,571 8,631,698
debentures 1,653,519 328,590 2,358,730 3,740,615 1,492,576 175,858 1,631,833 3,056,412
FinamE - Earmarked for construction of bolivia-brazil gas pipeline 80,678 99,475 103,653 244,967 77,431 96,427 101,593 240,002
bank credit certificate 7,083 11,735 3,770,630 3,605,934 7,083 11,735 3,605,934 3,605,934
advance on Exchange contracts (acc) 4,476 1,614,543 1,179,159
others 87,295 134,470 62,640 317,917 41,377
Subtotal 4,452,921 3,904,912 44,538,362 18,919,267 2,867,558 2,083,115 20,148,352 10,269,820
14,887,211 13,274,467 84,702,691 50,049,441 3,122,983 2,506,156 26,003,967 11,456,564
interest on financing (1,316,041) (823,330) (670,577) (229,334)
principal 13,571,170 12,451,137 2,452,406 2,276,822
current portion of the financing in non-current liabilities (5,987,558) (8,541,232) (2,452,406) (1,108,321)
tOtal shORt-teRm Financing 7,583,612 3,909,905 1,168,501
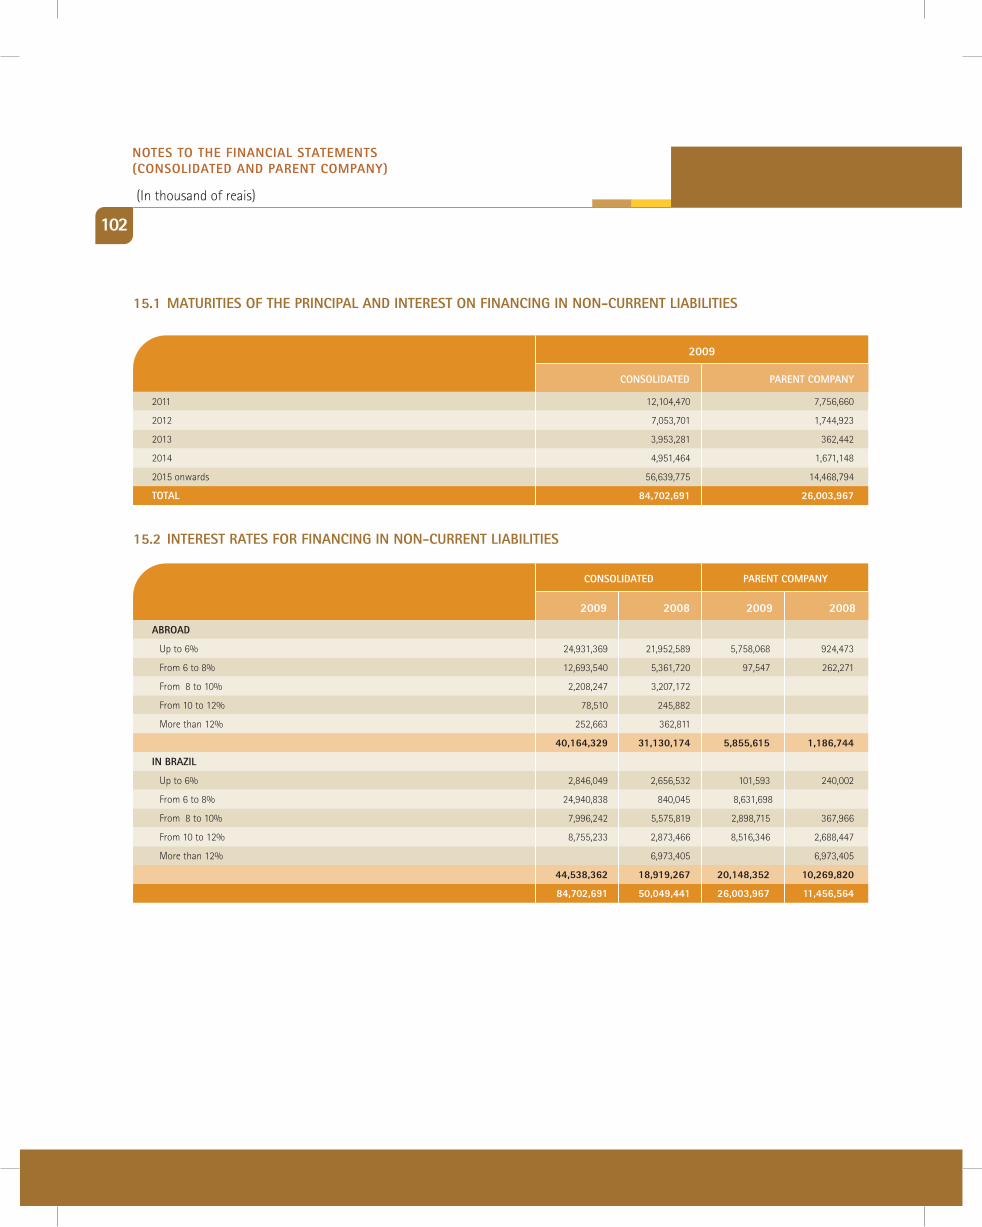
2011 12,104,470 7,756,660
2012 7,053,701 1,744,923
2013 3,953,281 362,442
2014 4,951,464 1,671,148
2015 onwards 56,639,775 14,468,794
tOtal 84,702,691 26,003,967
cOnsOlidated PaRent cOmPany
2009
cOnsOlidated
aBROad
up to 6% 24,931,369 21,952,589 5,758,068 924,473
From 6 to 8% 12,693,540 5,361,720 97,547 262,271
From 8 to 10% 2,208,247 3,207,172
From 10 to 12% 78,510 245,882
more than 12% 252,663 362,811
40,164,329 31,130,174 5,855,615 1,186,744
in BRazil
up to 6% 2,846,049 2,656,532 101,593 240,002
From 6 to 8% 24,940,838 840,045 8,631,698
From 8 to 10% 7,996,242 5,575,819 2,898,715 367,966
From 10 to 12% 8,755,233 2,873,466 8,516,346 2,688,447
more than 12% 6,973,405 6,973,405
44,538,362 18,919,267 20,148,352 10,269,820
84,702,691 50,049,441 26,003,967 11,456,564
2009 2008 2009 2008
PaRent cOmPany
102
15.1 matURities OF the PRinciPal and inteRest On Financing in nOn-cURRent liaBilities
15.2 inteRest Rates FOR Financing in nOn-cURRent liaBilities
nOtes tO the Financial statements (cOnsOlidated and PaRent cOmPany)
(in thousand of reais)
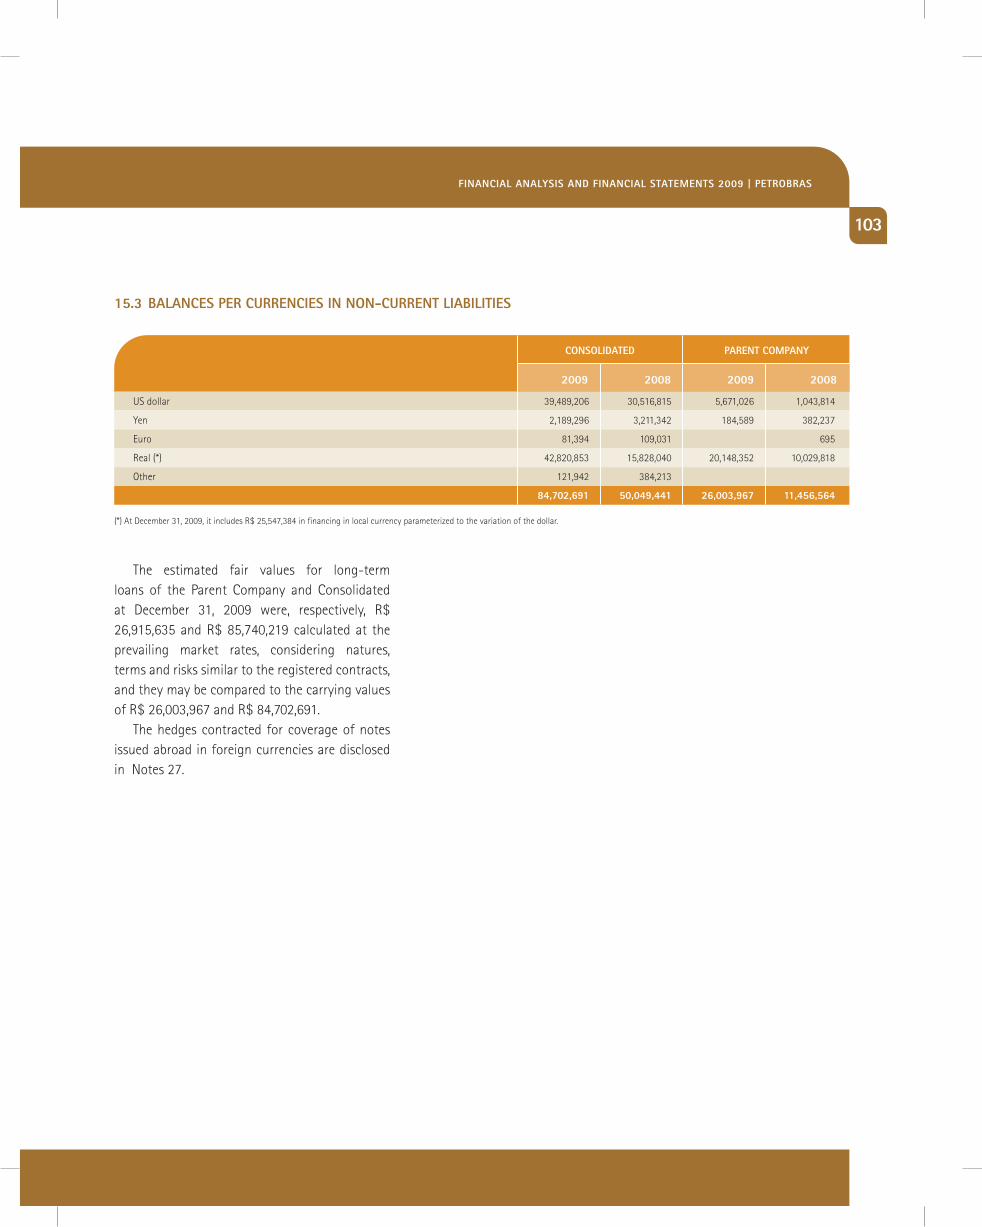
103
15.3 Balances PeR cURRencies in nOn-cURRent liaBilities
cOnsOlidated
uS dollar 39,489,206 30,516,815 5,671,026 1,043,814
yen 2,189,296 3,211,342 184,589 382,237
Euro 81,394 109,031 695
real (*) 42,820,853 15,828,040 20,148,352 10,029,818
other 121,942 384,213
84,702,691 50,049,441 26,003,967 11,456,564
2009 2008 2009 2008
PaRent cOmPany
(*) at december 31, 2009, it includes r$ 25,547,384 in financing in local currency parameterized to the variation of the dollar.
the estimated fair values for long-term loans of the parent company and consolidated at december 31, 2009 were, respectively, r$ 26,915,635 and r$ 85,740,219 calculated at the prevailing market rates, considering natures, terms and risks similar to the registered contracts, and they may be compared to the carrying values of r$ 26,003,967 and r$ 84,702,691.
the hedges contracted for coverage of notes issued abroad in foreign currencies are disclosed in notes 27.
Financial analysis And Financial statements 2009 | PetROBRas
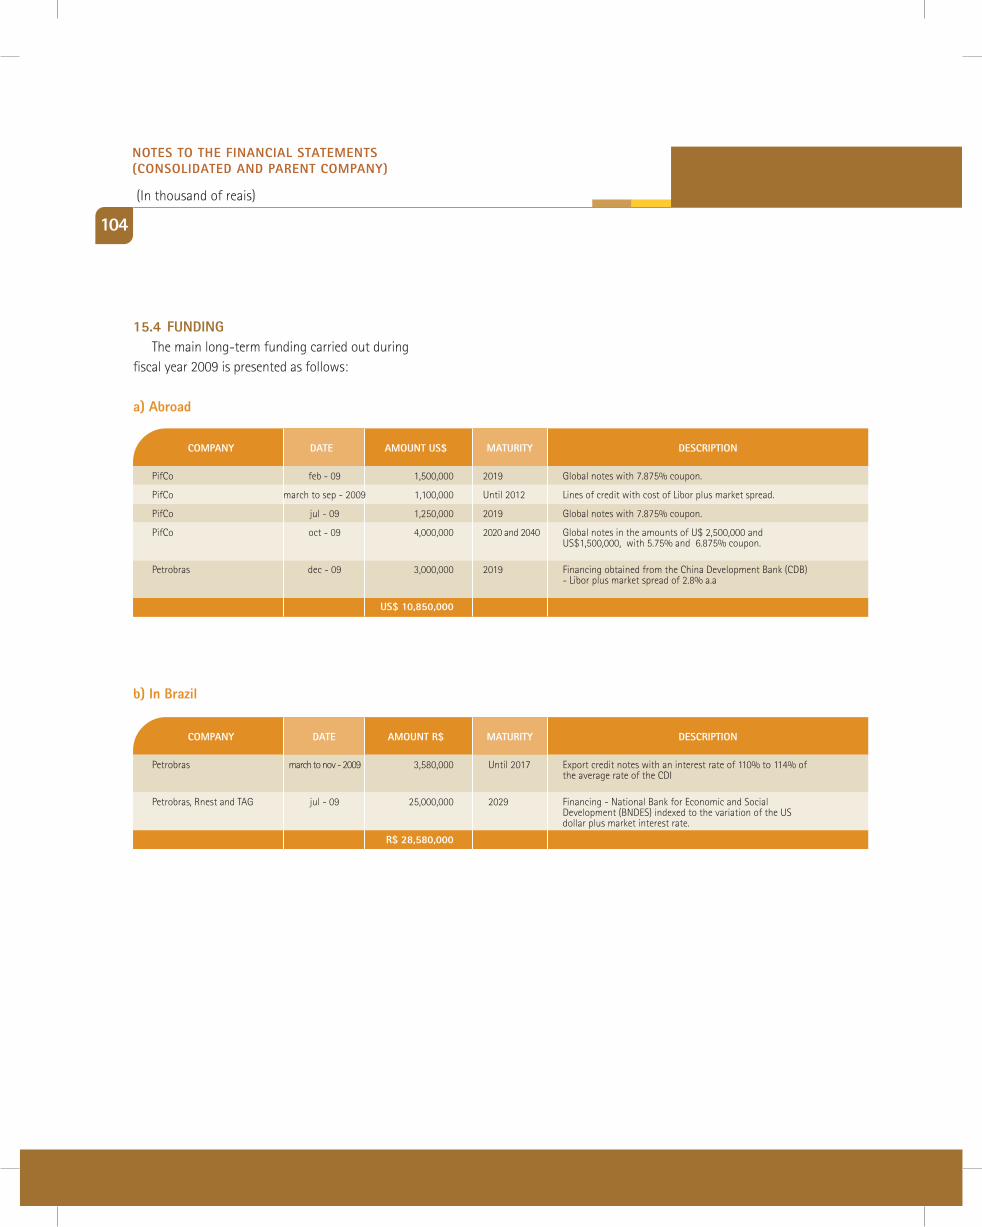
104
15.4 FUnding the main long-term funding carried out during
fiscal year 2009 is presented as follows:
a) abroad
cOmPany date amOUnt Us$ matURity descRiPtiOn
pifco feb - 09 1,500,000 2019 global notes with 7.875% coupon.
pifco march to sep - 2009 1,100,000 until 2012 lines of credit with cost of libor plus market spread.
pifco jul - 09 1,250,000 2019 global notes with 7.875% coupon.
pifco oct - 09 4,000,000 2020 and 2040 global notes in the amounts of u$ 2,500,000 and uS$1,500,000, with 5.75% and 6.875% coupon.
petrobras dec - 09 3,000,000 2019 Financing obtained from the china development bank (cdb) - libor plus market spread of 2.8% a.a
Us$ 10,850,000
cOmPany date amOUnt R$ matURity descRiPtiOn
petrobras march to nov - 2009 3,580,000 until 2017 Export credit notes with an interest rate of 110% to 114% of the average rate of the cdi
petrobras, rnest and tag jul - 09 25,000,000 2029 Financing - national bank for Economic and Social development (bndES) indexed to the variation of the uS dollar plus market interest rate.
R$ 28,580,000
b) in Brazil
nOtes tO the Financial statements (cOnsOlidated and PaRent cOmPany)
(in thousand of reais)
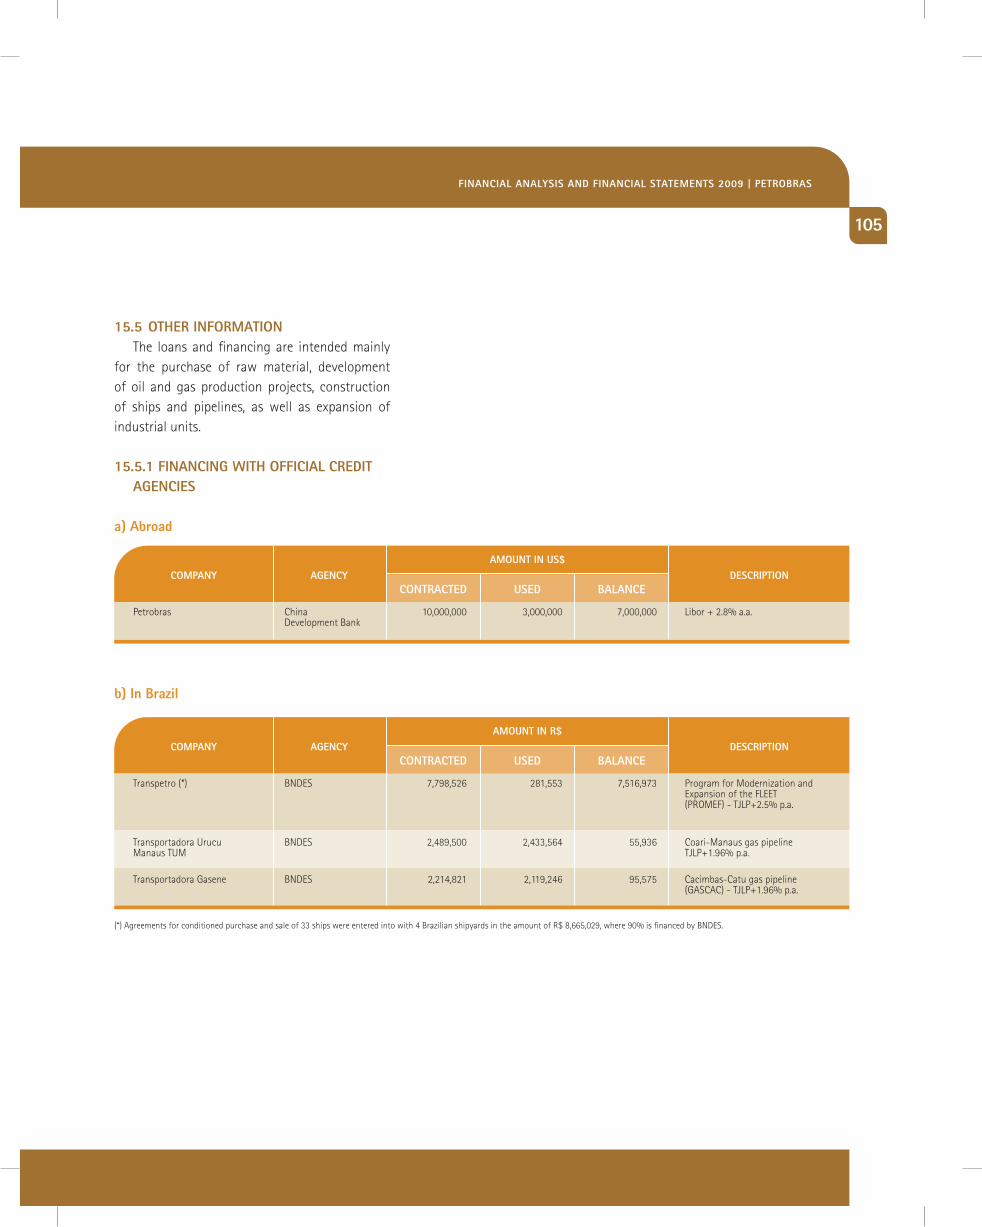
105
15.5 OtheR inFORmatiOnthe loans and financing are intended mainly
for the purchase of raw material, development of oil and gas production projects, construction of ships and pipelines, as well as expansion of industrial units.
15.5.1 Financing with OFFicial cRedit agencies
a) abroad
petrobras china 10,000,000 3,000,000 7,000,000 libor + 2.8% a.a. development bank
cOntRacted Used BalancedescRiPtiOn
amOUnt in Us$cOmPany agency
transpetro (*) bndES 7,798,526 281,553 7,516,973 program for modernization and Expansion of the FlEEt (promEF) - tjlp+2.5% p.a.
transportadora urucu bndES 2,489,500 2,433,564 55,936 coari-manaus gas pipeline manaus tum tjlp+1.96% p.a.
transportadora gasene bndES 2,214,821 2,119,246 95,575 cacimbas-catu gas pipeline (gaScac) - tjlp+1.96% p.a.
cOntRacted Used BalancedescRiPtiOn
amOUnt in R$cOmPany agency
(*) agreements for conditioned purchase and sale of 33 ships were entered into with 4 brazilian shipyards in the amount of r$ 8,665,029, where 90% is financed by bndES.
b) in Brazil
Financial analysis And Financial statements 2009 | PetROBRas
106
15.5.2 deBentUResthe debentures issued by petrobras financed
through bndES the anticipated acquisition of the right to use the bolivia-brazil gas pipeline over a period of 40 years to transport 6 million cubic meters of gas per day (tco - transportation capacity option) totaled r$ 430,000 (43,000 debentures with a face value of r$ 10.00) with maturity on February 15, 2015. these debentures are secured by common shares of tbg.
in august 2006, refinária alberto pasqualini - refap S.a. issued 852,600 simple, registered, book-entry debentures in the amount of r$ 852,600 with the aim of expanding and modernizing its industrial park, with the following characteristics (basic conditions approved by bndES and bndESpar on june 23, 2006): amortization over 96 months plus a six-month grace period; 90% of the debentures subscribed by bndES with tjlp interest + 3.8% p.a.; 10% of the debentures subscribed by bndESpar with bndES basket of currencies interest + 2.3% p.a.. in may 2008 refap issued another 507,989 debentures with similar characteristics in the amount of r$ 507,989. the balance at december 31, 2009 was r$ 722,736, where r$ 144,287 is in current liabilities.
Petrobras is not required to provide guarantees to financial institutions abroad
nOtes tO the Financial statements (cOnsOlidated and PaRent cOmPany)
(in thousand of reais)
107
15.5.3 gUaRanteespetrobras is not required to provide
guarantees to financial institutions abroad. Financing obtained from bndES is secured by the assets being financed (carbon steel pipes for the bolivia-brazil gas pipeline and vessels).
on account of a guarantee agreement issued by the Federal government in favor of multilateral loan agencies, motivated by financings funded by tbg, counter guarantee agreements were entered into, having as signatories the Federal government, tbg, petrobras, petroquisa and banco do brasil S.a. where tbg undertakes to entail its revenues to the order of the brazilian treasury until the settlement of the obligations guaranteed by the Federal government.
in guarantee of the debentures issued, refap has a short-term investment account (deposits tied to loans), indexed to the variation of the interbank deposit certificate (cdi). the balance of the account must be three times the value of the sum of the amortization of the principal and related charges of the last payment that was due.
industrial credit note (nci): refap issued industrial credit note 40/00627-1, on august 19, 2009, and 40/00646-8 on october 15, 2009, in the amounts of r$ 50,000 and r$ 150,000,
respectively, in favor of banco do brasil S/a., in order to be given funds from the Special credit program (pEc) of the national bank for Economic and Social development (bndES).
the credit is earmarked solely and exclusively for financing working capital. after the grace period, the amount will be paid in 24 (twenty-four) monthly installments. the first payment of nci 40/00627-1 falls due on october 15, 2010 and the last payment on September 15, 2012, and the first payment of nci 40/00646-8 falls due on december 15, 2010 and the last payment on november 15, 2012, and each payment corresponds to the result of dividing the debtor balance by the number of installments payable.
the interest will be due at the annual rate of 4.75% on nci 40/00627-1 and 3.75% on nci 40/00646-8, by way of spread above the long-term interest rate (tjlp), published by the central bank of brazil.
Financial analysis And Financial statements 2009 | PetROBRas
108
15.5.4 indeBtedness OF ciesa and tgsin order to clear the financial encumbrances
of compañia de inversiones de Energia S.a. (ciESa) (a jointly controlled company), pesa transferred its 7.35% interest in the capital of transportadora de gás del Sur S.a. (tgS) (a subsidiary of ciESa) to Enron pipeline company argentina S.a. - Enron and, simultaneously, Enron transferred 40% of its interest in the capital of ciESa to a trustee, the addressee of which would be indicated by ciESa, pursuant to the terms for its financial restructuring to be agreed upon with its creditors.
in the second stage of the process, in conformity with the agreement for restructuring the financial debt, once the necessary approvals have been obtained from Ente nacional regulador del gas (EnargaS) and comisión nacional de defensa de la competencia, Enron would transfer the remaining 10% interest in ciESa to the financial creditors in exchange for 4.3% of the class b common shares of tgS that ciESa would deliver to its financial creditors as partial payment of the debt.
the restructuring agreement entered into with the creditors in September 2005 established that the remaining balance of the financial debt would be capitalized by the creditors. it also established a term of validity that was extended successively until december 31, 2008, as from which date any one of the parties could consider the agreement as unilaterally terminated.
the period of validity of the agreement expired without the government approvals having been obtained and on january 9, 2009, ashmore Energy international limited (currently aEi) declared that it was the sole owner of the negotiable obligations of ciESa.
on january 28, 2009, ciESa filed litigation in the courts of the State of new york in the united States of america, challenging the lapse of the above mentioned negotiable obligations.
on april 21, 2009, the aEi filed a petition for annulment of the process filed by ciESa in the state of new york.
on may 14, 2009, ciESa and aEi were present in the new york court for discussion of the petition for annulment filed by aEi. up till now, the new york court has still not handed down a decision on the matter.
additionally, on april 6, 2009 ciESa was notified of a petition for bankruptcy filed by aEi in the argentine court, and reimbursement of the amount equivalent to uS$ 127 million, referring to supposed credit originating from the negotiable bonds. ciESa replied to the notice, opposing the petition for bankruptcy, presenting, mainly, the following motives: (i) not fulfilling the requirements of a petition for bankruptcy considering that the requests for corporate bonds have a statute of limitation under new york law. (ii) ciESa is not insolvent.
in a decision in the second instance handed down by the cámara nacional de apelaciones on october 09, 2009 the situation of insolvency of ciESa requested by aEi was dismissed. the decision is unappealable, therefore, definitive.
as a result of the chamber’s decision, ciESa presented to the new york courts a request for revival and reargumentation with respect to the request by aEi for annulment of the process filed by ciESa in the State of new york, requesting the repeal of the court decision of july 29, 2009 in which it admitted the request for annulment presented by aEi.
nOtes tO the Financial statements (cOnsOlidated and PaRent cOmPany)
(in thousand of reais)
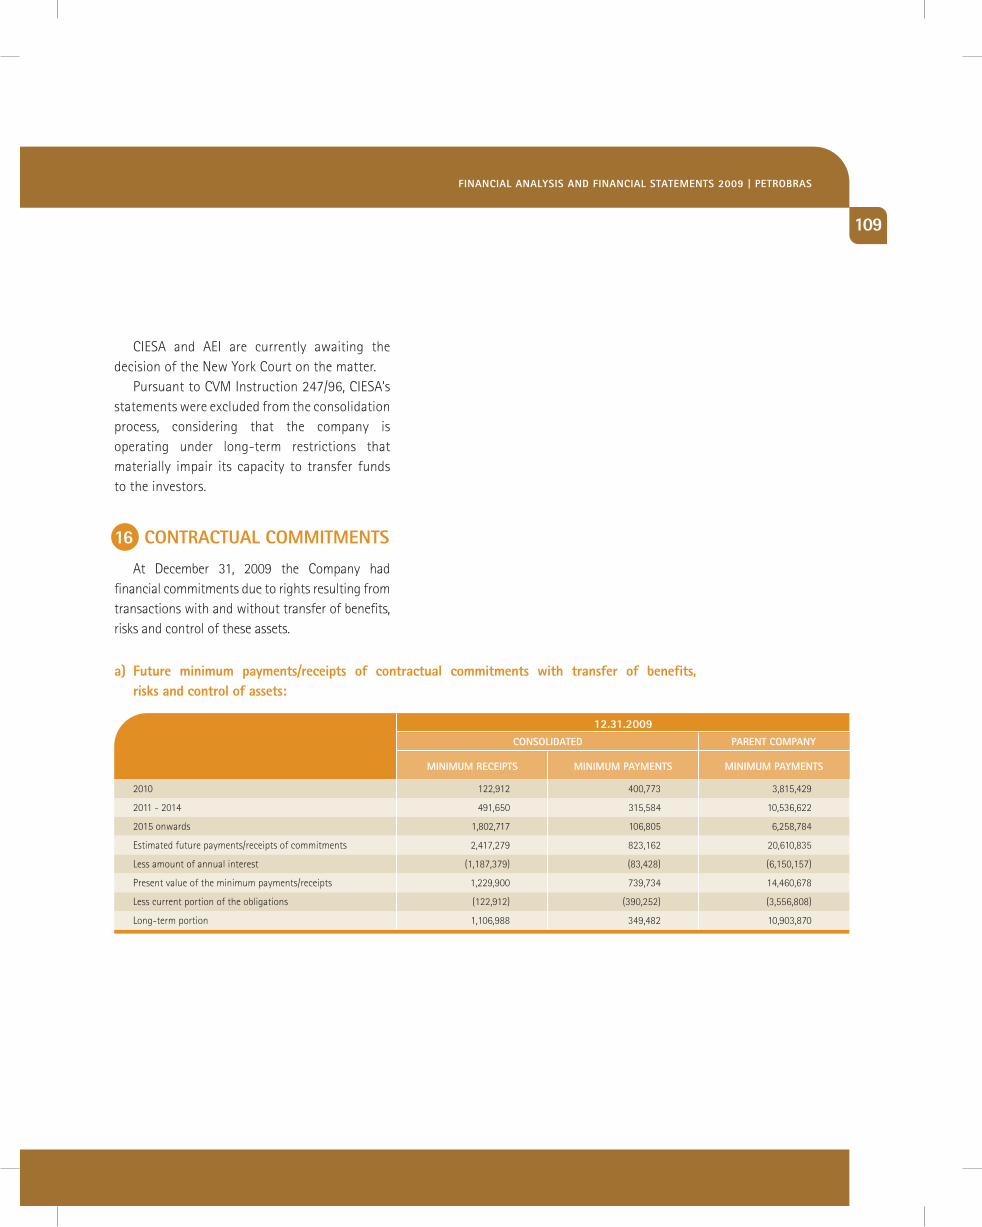
109
ciESa and aEi are currently awaiting the decision of the new york court on the matter.
pursuant to cVm instruction 247/96, ciESa’s statements were excluded from the consolidation process, considering that the company is operating under long-term restrictions that materially impair its capacity to transfer funds to the investors.
at december 31, 2009 the company had financial commitments due to rights resulting from transactions with and without transfer of benefits, risks and control of these assets.
16 cOntRactUal cOmmitments
Financial analysis And Financial statements 2009 | PetROBRas
2010 122,912 400,773 3,815,429
2011 - 2014 491,650 315,584 10,536,622
2015 onwards 1,802,717 106,805 6,258,784
Estimated future payments/receipts of commitments 2,417,279 823,162 20,610,835
less amount of annual interest (1,187,379) (83,428) (6,150,157)
present value of the minimum payments/receipts 1,229,900 739,734 14,460,678
less current portion of the obligations (122,912) (390,252) (3,556,808)
long-term portion 1,106,988 349,482 10,903,870
minimUm ReceiPts minimUm Payments
12.31.2009
minimUm Payments
cOnsOlidated PaRent cOmPany
a) Future minimum payments/receipts of contractual commitments with transfer of benefits, risks and control of assets:
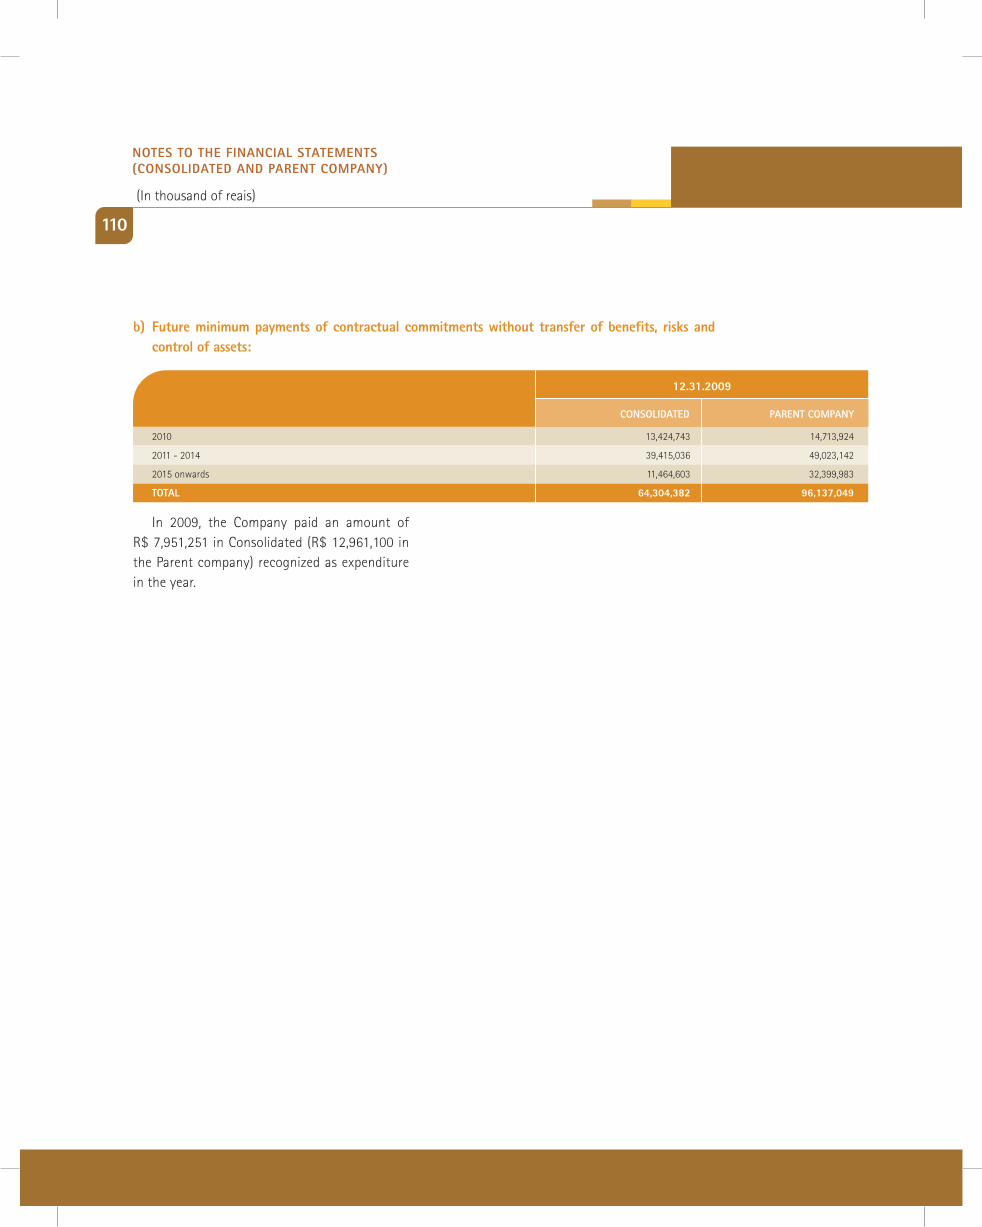
110
b) Future minimum payments of contractual commitments without transfer of benefits, risks and control of assets:
2010 13,424,743 14,713,924
2011 - 2014 39,415,036 49,023,142
2015 onwards 11,464,603 32,399,983
tOtal 64,304,382 96,137,049
cOnsOlidated PaRent cOmPany
12.31.2009
in 2009, the company paid an amount of r$ 7,951,251 in consolidated (r$ 12,961,100 in the parent company) recognized as expenditure in the year.
nOtes tO the Financial statements (cOnsOlidated and PaRent cOmPany)
(in thousand of reais)
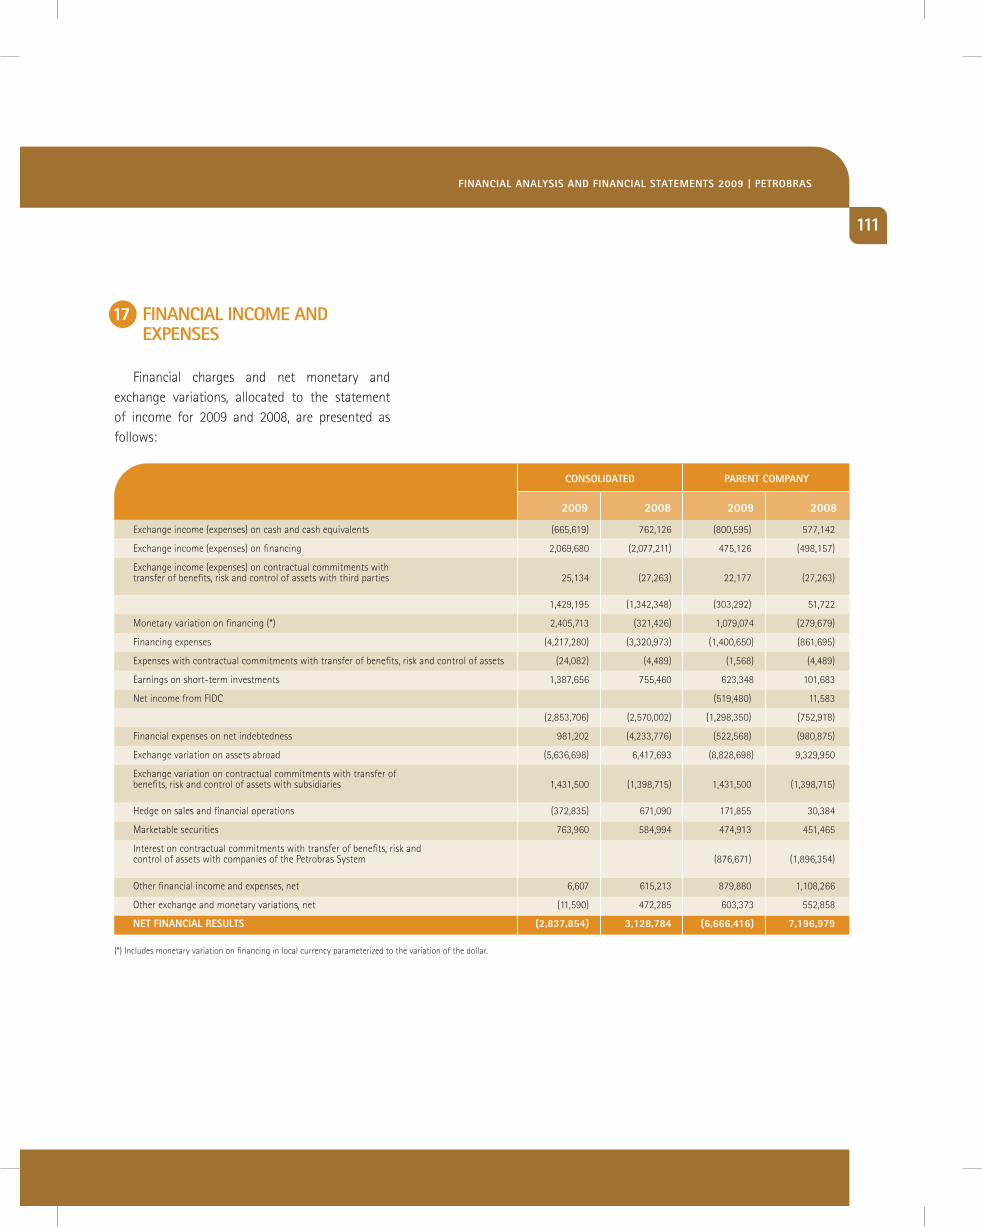
111
Financial charges and net monetary and exchange variations, allocated to the statement of income for 2009 and 2008, are presented as follows:
17 Financial incOme and exPenses
cOnsOlidated
Exchange income (expenses) on cash and cash equivalents (665,619) 762,126 (800,595) 577,142
Exchange income (expenses) on financing 2,069,680 (2,077,211) 475,126 (498,157)
Exchange income (expenses) on contractual commitments with transfer of benefits, risk and control of assets with third parties 25,134 (27,263) 22,177 (27,263)
1,429,195 (1,342,348) (303,292) 51,722
monetary variation on financing (*) 2,405,713 (321,426) 1,079,074 (279,679)
Financing expenses (4,217,280) (3,320,973) (1,400,650) (861,695)
Expenses with contractual commitments with transfer of benefits, risk and control of assets (24,082) (4,489) (1,568) (4,489)
Earnings on short-term investments 1,387,656 755,460 623,348 101,683
net income from Fidc (519,480) 11,583
(2,853,706) (2,570,002) (1,298,350) (752,918)
Financial expenses on net indebtedness 981,202 (4,233,776) (522,568) (980,875)
Exchange variation on assets abroad (5,636,698) 6,417,693 (8,828,698) 9,329,950
Exchange variation on contractual commitments with transfer of benefits, risk and control of assets with subsidiaries 1,431,500 (1,398,715) 1,431,500 (1,398,715)
hedge on sales and financial operations (372,835) 671,090 171,855 30,384
marketable securities 763,960 584,994 474,913 451,465
interest on contractual commitments with transfer of benefits, risk and control of assets with companies of the petrobras System (876,671) (1,896,354)
other financial income and expenses, net 6,607 615,213 879,880 1,108,266
other exchange and monetary variations, net (11,590) 472,285 603,373 552,858
net Financial ResUlts (2,837,854) 3,128,784 (6,666,416) 7,196,979
2009 2008 2009 2008
PaRent cOmPany
(*) includes monetary variation on financing in local currency parameterized to the variation of the dollar.
Financial analysis And Financial statements 2009 | PetROBRas
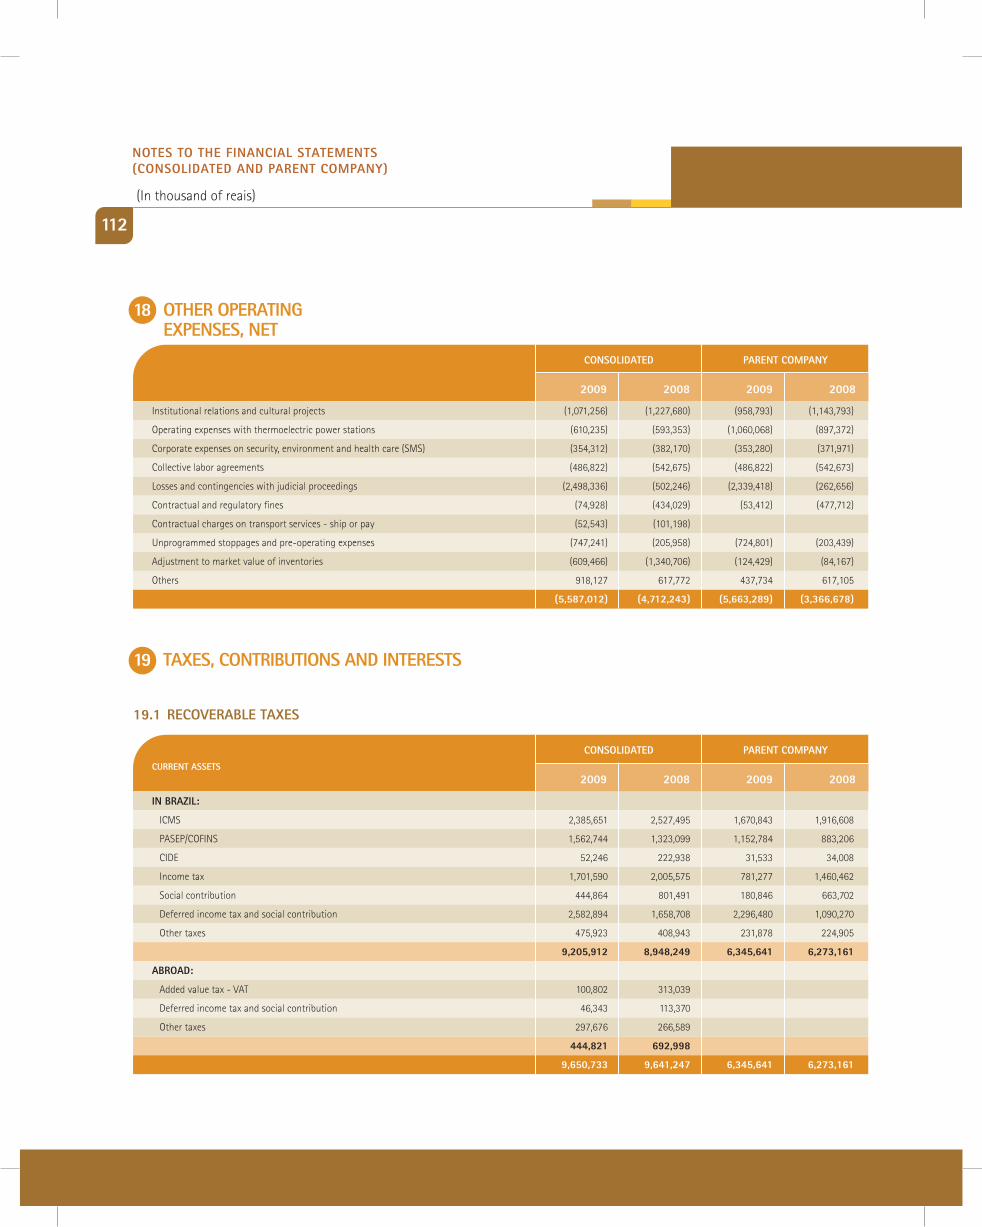
112
18 OtheR OPeRating exPenses, net
19 taxes, cOntRiBUtiOns and inteRests
cOnsOlidated
institutional relations and cultural projects (1,071,256) (1,227,680) (958,793) (1,143,793)
operating expenses with thermoelectric power stations (610,235) (593,353) (1,060,068) (897,372)
corporate expenses on security, environment and health care (SmS) (354,312) (382,170) (353,280) (371,971)
collective labor agreements (486,822) (542,675) (486,822) (542,673)
losses and contingencies with judicial proceedings (2,498,336) (502,246) (2,339,418) (262,656)
contractual and regulatory fines (74,928) (434,029) (53,412) (477,712)
contractual charges on transport services - ship or pay (52,543) (101,198)
unprogrammed stoppages and pre-operating expenses (747,241) (205,958) (724,801) (203,439)
adjustment to market value of inventories (609,466) (1,340,706) (124,429) (84,167)
others 918,127 617,772 437,734 617,105
(5,587,012) (4,712,243) (5,663,289) (3,366,678)
2009 2008 2009 2008
PaRent cOmPany
cOnsOlidated
in BRazil:
icmS 2,385,651 2,527,495 1,670,843 1,916,608
paSEp/coFinS 1,562,744 1,323,099 1,152,784 883,206
cidE 52,246 222,938 31,533 34,008
income tax 1,701,590 2,005,575 781,277 1,460,462
Social contribution 444,864 801,491 180,846 663,702
deferred income tax and social contribution 2,582,894 1,658,708 2,296,480 1,090,270
other taxes 475,923 408,943 231,878 224,905
9,205,912 8,948,249 6,345,641 6,273,161
aBROad:
added value tax - Vat 100,802 313,039
deferred income tax and social contribution 46,343 113,370
other taxes 297,676 266,589
444,821 692,998
9,650,733 9,641,247 6,345,641 6,273,161
2009 2008 2009 2008
PaRent cOmPanycURRent assets
19.1 RecOVeRaBle taxes
nOtes tO the Financial statements (cOnsOlidated and PaRent cOmPany)
(in thousand of reais)
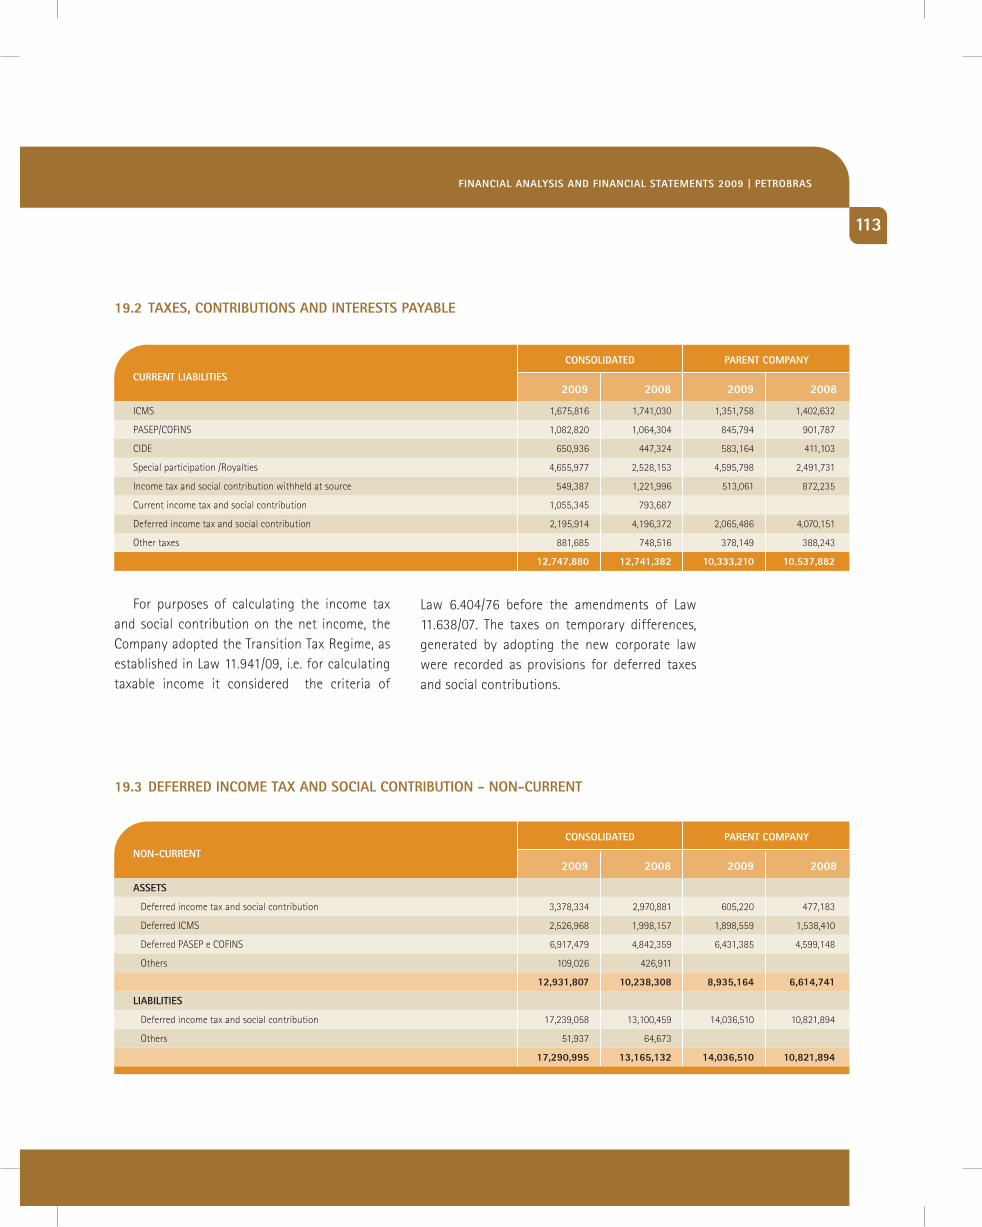
113
19.2 taxes, cOntRiBUtiOns and inteRests PayaBle
cOnsOlidated
icmS 1,675,816 1,741,030 1,351,758 1,402,632
paSEp/coFinS 1,082,820 1,064,304 845,794 901,787
cidE 650,936 447,324 583,164 411,103
Special participation /royalties 4,655,977 2,528,153 4,595,798 2,491,731
income tax and social contribution withheld at source 549,387 1,221,996 513,061 872,235
current income tax and social contribution 1,055,345 793,687
deferred income tax and social contribution 2,195,914 4,196,372 2,065,486 4,070,151
other taxes 881,685 748,516 378,149 388,243
12,747,880 12,741,382 10,333,210 10,537,882
2009 2008 2009 2008
PaRent cOmPany
cURRent liaBilities
cOnsOlidated
assets
deferred income tax and social contribution 3,378,334 2,970,881 605,220 477,183
deferred icmS 2,526,968 1,998,157 1,898,559 1,538,410
deferred paSEp e coFinS 6,917,479 4,842,359 6,431,385 4,599,148
others 109,026 426,911
12,931,807 10,238,308 8,935,164 6,614,741
liaBilities
deferred income tax and social contribution 17,239,058 13,100,459 14,036,510 10,821,894
others 51,937 64,673
17,290,995 13,165,132 14,036,510 10,821,894
2009 2008 2009 2008
PaRent cOmPany
nOn-cURRent
For purposes of calculating the income tax and social contribution on the net income, the company adopted the transition tax regime, as established in law 11.941/09, i.e. for calculating taxable income it considered the criteria of
law 6.404/76 before the amendments of law 11.638/07. the taxes on temporary differences, generated by adopting the new corporate law were recorded as provisions for deferred taxes and social contributions.
19.3 deFeRRed incOme tax and sOcial cOntRiBUtiOn - nOn-cURRent
Financial analysis And Financial statements 2009 | PetROBRas
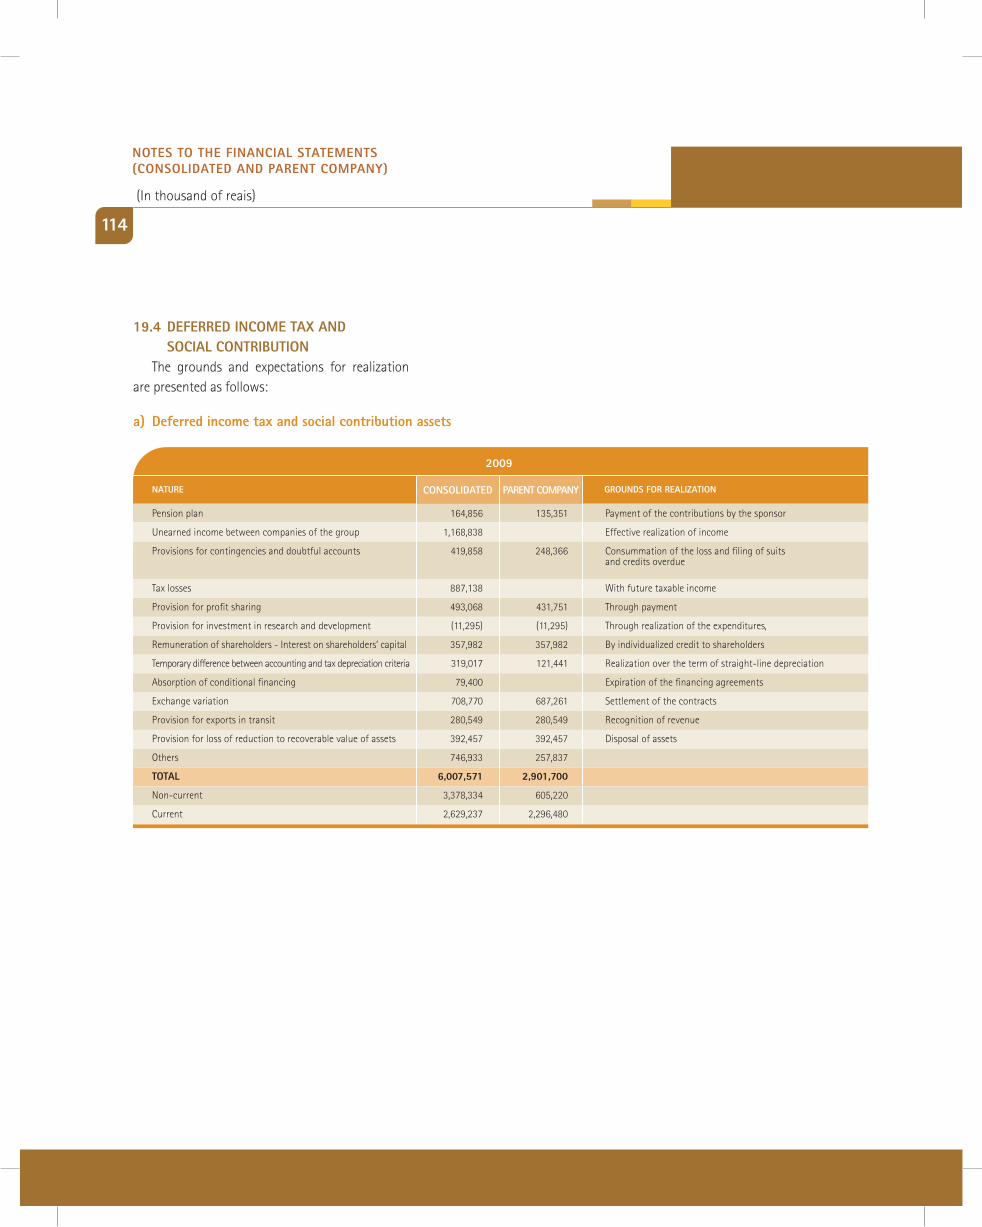
114
19.4 deFeRRed incOme tax and sOcial cOntRiBUtiOn
2009
pension plan 164,856 135,351 payment of the contributions by the sponsor
unearned income between companies of the group 1,168,838 Effective realization of income
provisions for contingencies and doubtful accounts 419,858 248,366 consummation of the loss and filing of suits and credits overdue
tax losses 887,138 With future taxable income
provision for profit sharing 493,068 431,751 through payment
provision for investment in research and development (11,295) (11,295) through realization of the expenditures,
remuneration of shareholders - interest on shareholders’ capital 357,982 357,982 by individualized credit to shareholders
temporary difference between accounting and tax depreciation criteria 319,017 121,441 realization over the term of straight-line depreciation
absorption of conditional financing 79,400 Expiration of the financing agreements
Exchange variation 708,770 687,261 Settlement of the contracts
provision for exports in transit 280,549 280,549 recognition of revenue
provision for loss of reduction to recoverable value of assets 392,457 392,457 disposal of assets
others 746,933 257,837
tOtal 6,007,571 2,901,700
non-current 3,378,334 605,220
current 2,629,237 2,296,480
cOnsOlidated PaRent cOmPany gROUnds FOR RealizatiOnnatURe
the grounds and expectations for realization are presented as follows:
a) deferred income tax and social contribution assets
nOtes tO the Financial statements (cOnsOlidated and PaRent cOmPany)
(in thousand of reais)
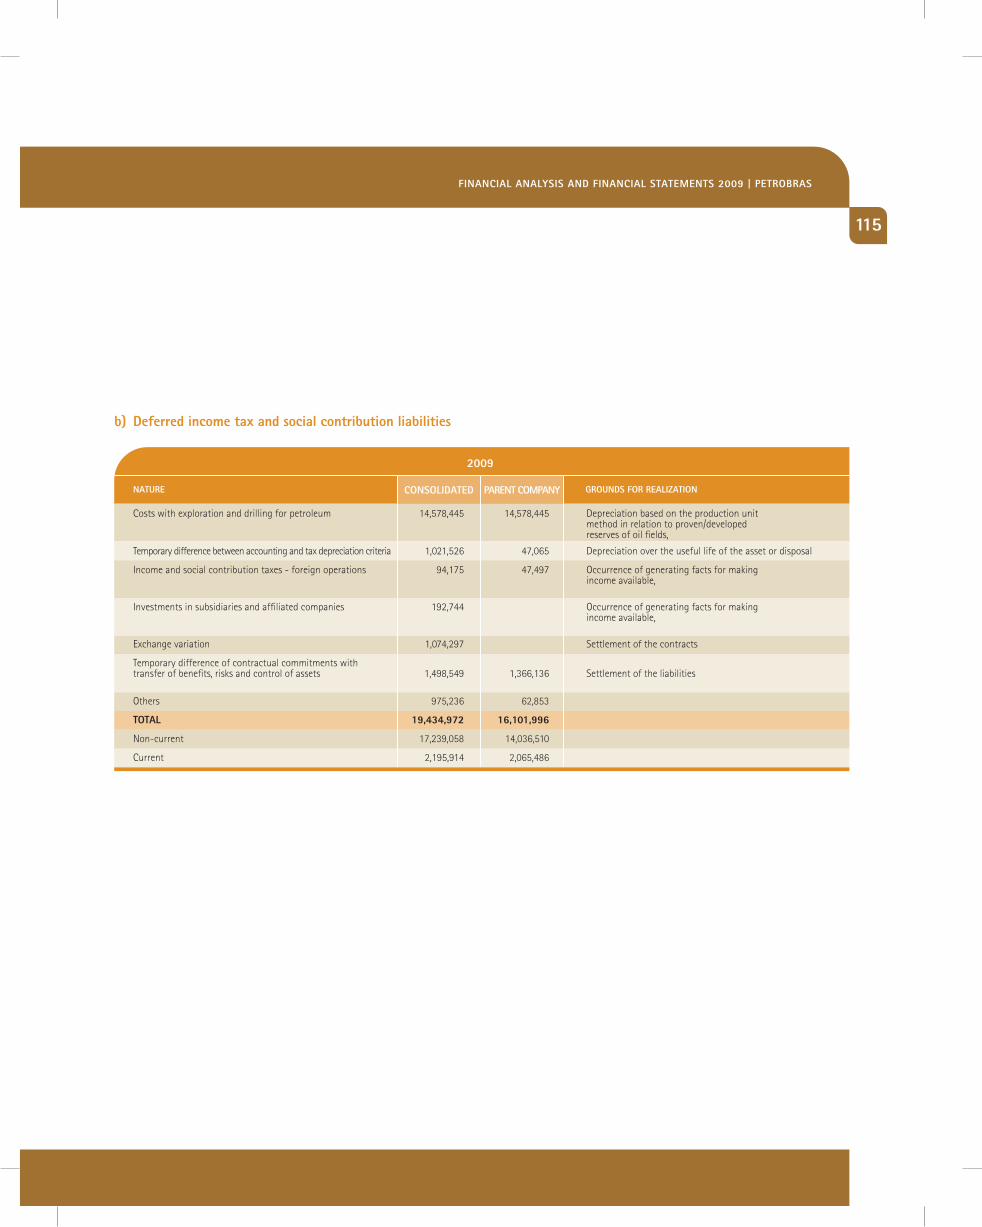
115
b) deferred income tax and social contribution liabilities
2009
costs with exploration and drilling for petroleum 14,578,445 14,578,445 depreciation based on the production unit method in relation to proven/developed reserves of oil fields,
temporary difference between accounting and tax depreciation criteria 1,021,526 47,065 depreciation over the useful life of the asset or disposal
income and social contribution taxes - foreign operations 94,175 47,497 occurrence of generating facts for making income available,
investments in subsidiaries and affiliated companies 192,744 occurrence of generating facts for making income available,
Exchange variation 1,074,297 Settlement of the contracts
temporary difference of contractual commitments with transfer of benefits, risks and control of assets 1,498,549 1,366,136 Settlement of the liabilities
others 975,236 62,853
tOtal 19,434,972 16,101,996
non-current 17,239,058 14,036,510
current 2,195,914 2,065,486
cOnsOlidated PaRent cOmPany gROUnds FOR RealizatiOnnatURe
Financial analysis And Financial statements 2009 | PetROBRas
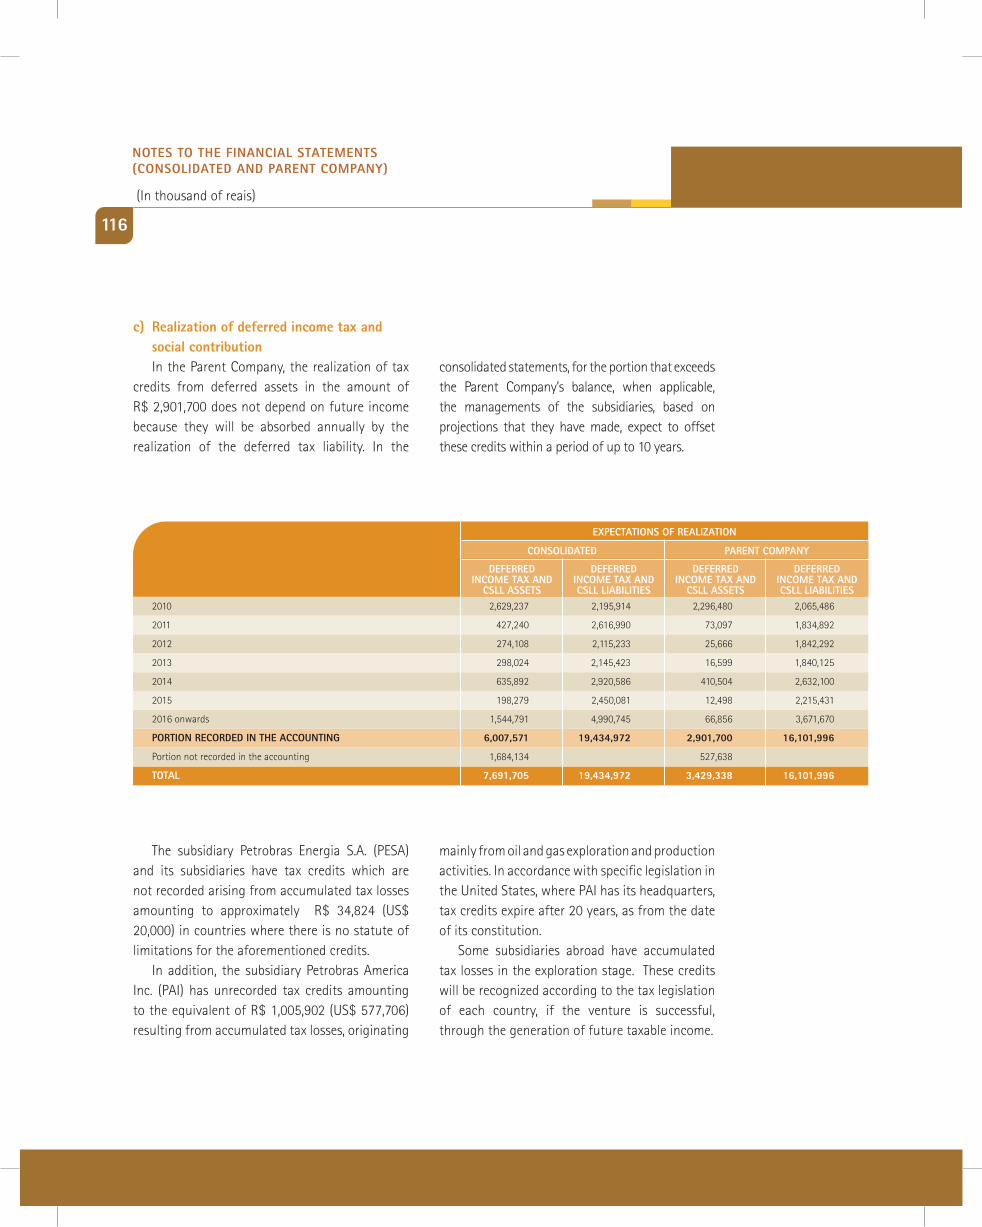
116
c) Realization of deferred income tax and social contribution in the parent company, the realization of tax
credits from deferred assets in the amount of r$ 2,901,700 does not depend on future income because they will be absorbed annually by the realization of the deferred tax liability. in the
cOnsOlidated
2010 2,629,237 2,195,914 2,296,480 2,065,486
2011 427,240 2,616,990 73,097 1,834,892
2012 274,108 2,115,233 25,666 1,842,292
2013 298,024 2,145,423 16,599 1,840,125
2014 635,892 2,920,586 410,504 2,632,100
2015 198,279 2,450,081 12,498 2,215,431
2016 onwards 1,544,791 4,990,745 66,856 3,671,670
PORtiOn RecORded in the accOUnting 6,007,571 19,434,972 2,901,700 16,101,996
portion not recorded in the accounting 1,684,134 527,638
tOtal 7,691,705 19,434,972 3,429,338 16,101,996
deFeRRed incOme tax and
csll assets
deFeRRed incOme tax and csll liaBilities
deFeRRed incOme tax and
csll assets
deFeRRed incOme tax and csll liaBilities
exPectatiOns OF RealizatiOn
PaRent cOmPany
the subsidiary petrobras Energia S.a. (pESa) and its subsidiaries have tax credits which are not recorded arising from accumulated tax losses amounting to approximately r$ 34,824 (uS$ 20,000) in countries where there is no statute of limitations for the aforementioned credits.
in addition, the subsidiary petrobras america inc. (pai) has unrecorded tax credits amounting to the equivalent of r$ 1,005,902 (uS$ 577,706) resulting from accumulated tax losses, originating
consolidated statements, for the portion that exceeds the parent company’s balance, when applicable, the managements of the subsidiaries, based on projections that they have made, expect to offset these credits within a period of up to 10 years.
mainly from oil and gas exploration and production activities. in accordance with specific legislation in the united States, where pai has its headquarters, tax credits expire after 20 years, as from the date of its constitution.
Some subsidiaries abroad have accumulated tax losses in the exploration stage. these credits will be recognized according to the tax legislation of each country, if the venture is successful, through the generation of future taxable income.
nOtes tO the Financial statements (cOnsOlidated and PaRent cOmPany)
(in thousand of reais)

117
19.5 RecOnciliatiOn OF incOme tax and sOcial cOntRiBUtiOn On incOme
the reconciliation of taxes calculated according to nominal, statutory rates and the amount of taxes recorded in fiscal years 2009 and 2008 are presented as follows:
a) consolidated
2009
income for the year before taxes and after employee profit sharing 41,711,288 46,860,272
income tax and social contribution at statutory rates (34%) (14,181,838) (15,932,493)
adjUstments FOR calcUlatiOn OF the eFFectiVe Rate:
permanent additions, net (201,422) (1,081,649)
tax incentives 159,707 226,942
credit resulting from inclusion of interest on shareholders’ capital as operating expenses 2,446,220 2,386,549
tax credits of companies abroad in the exploration stage (152,071) (124,437)
tax losses 110,575 (941,713)
results of companies abroad with different rates 1,361,533 (270,873)
others 480,090 (224,303)
exPense FOR PROVisiOn FOR incOme tax and sOcial cOntRiBUtiOn (9,977,206) (15,961,977)
deferred income tax / social contribution (804,988) (4,769,951)
current income tax / social contribution (9,172,218) (11,192,026)
(9,977,206) (15,961,977)
eFFectiVe Rate FOR incOme tax and sOcial cOntRiBUtiOn 23.9% 34.1%
2008
Financial analysis And Financial statements 2009 | PetROBRas
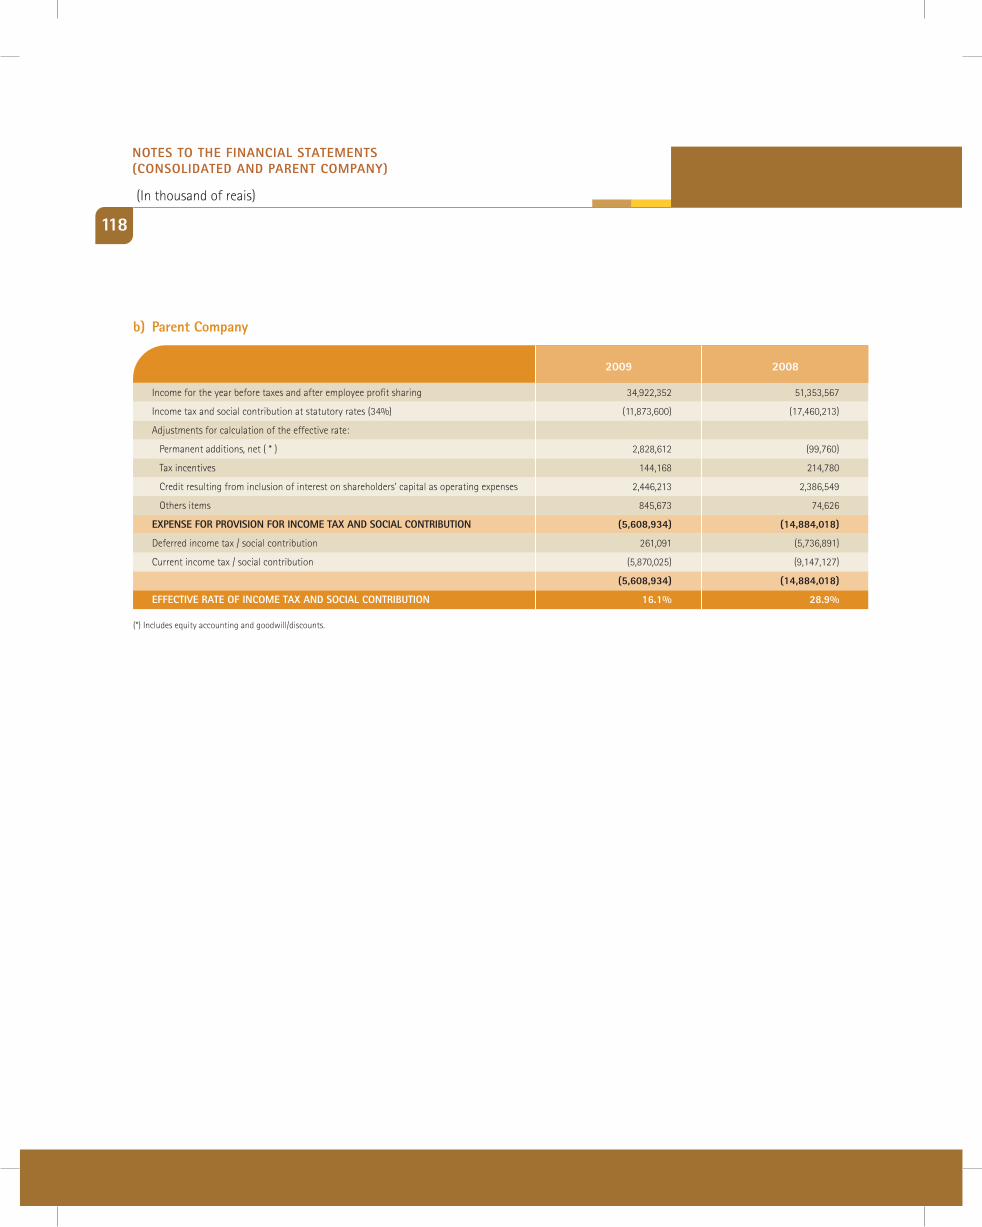
118
b) Parent company
2009
income for the year before taxes and after employee profit sharing 34,922,352 51,353,567
income tax and social contribution at statutory rates (34%) (11,873,600) (17,460,213)
adjustments for calculation of the effective rate:
permanent additions, net ( * ) 2,828,612 (99,760)
tax incentives 144,168 214,780
credit resulting from inclusion of interest on shareholders’ capital as operating expenses 2,446,213 2,386,549
others items 845,673 74,626
exPense FOR PROVisiOn FOR incOme tax and sOcial cOntRiBUtiOn (5,608,934) (14,884,018)
deferred income tax / social contribution 261,091 (5,736,891)
current income tax / social contribution (5,870,025) (9,147,127)
(5,608,934) (14,884,018)
eFFectiVe Rate OF incOme tax and sOcial cOntRiBUtiOn 16.1% 28.9%
2008
(*) includes equity accounting and goodwill/discounts.
nOtes tO the Financial statements (cOnsOlidated and PaRent cOmPany)
(in thousand of reais)
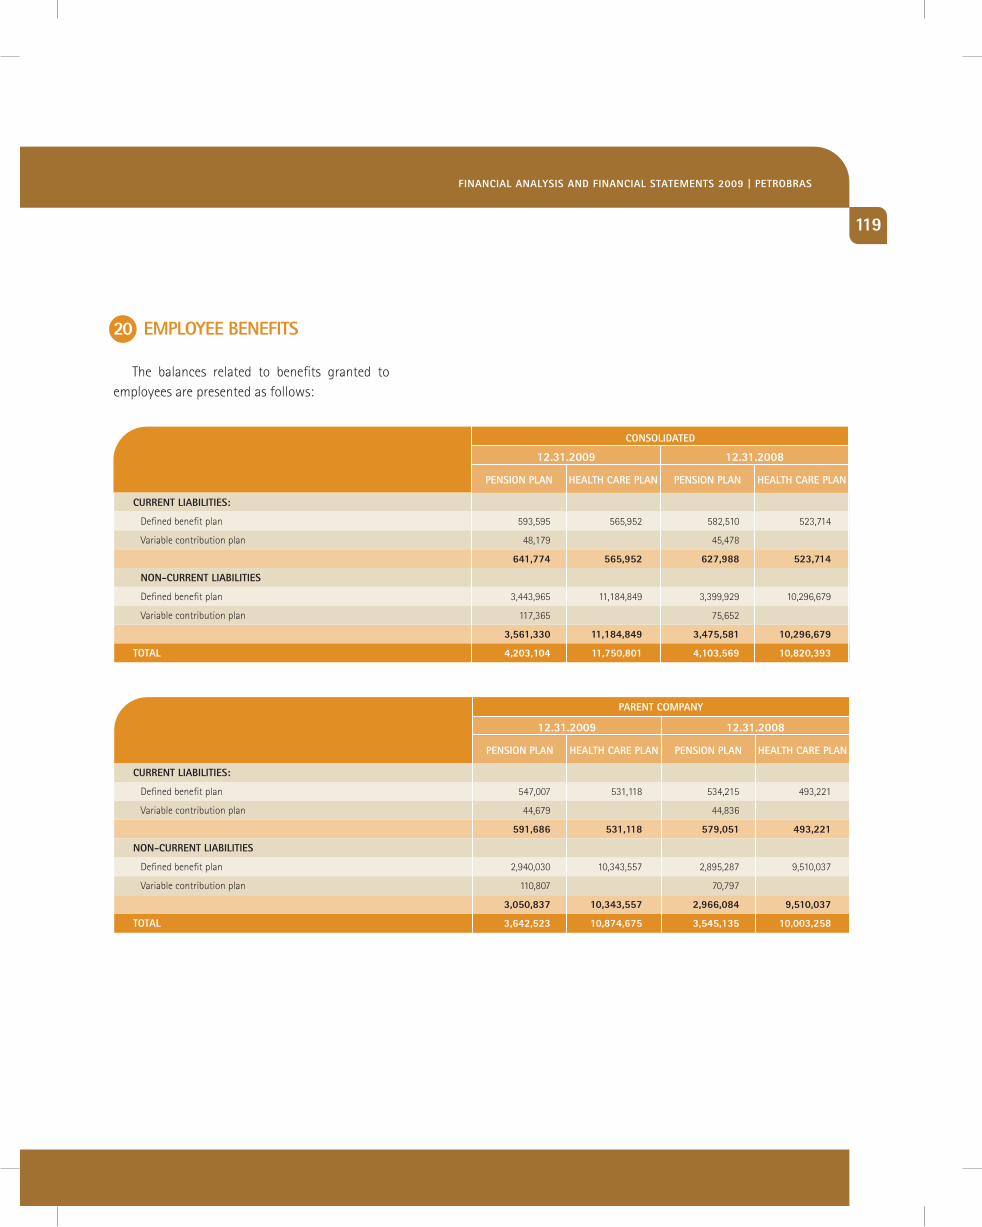
119
PensiOn Plan health caRe Plan PensiOn Plan health caRe Plan
12.31.2009 12.31.2008
cURRent liaBilities:
defined benefit plan 547,007 531,118 534,215 493,221
Variable contribution plan 44,679 44,836
591,686 531,118 579,051 493,221
nOn-cURRent liaBilities
defined benefit plan 2,940,030 10,343,557 2,895,287 9,510,037
Variable contribution plan 110,807 70,797
3,050,837 10,343,557 2,966,084 9,510,037
tOtal 3,642,523 10,874,675 3,545,135 10,003,258
PaRent cOmPany
cURRent liaBilities:
defined benefit plan 593,595 565,952 582,510 523,714
Variable contribution plan 48,179 45,478
641,774 565,952 627,988 523,714
nOn-cURRent liaBilities
defined benefit plan 3,443,965 11,184,849 3,399,929 10,296,679
Variable contribution plan 117,365 75,652
3,561,330 11,184,849 3,475,581 10,296,679
tOtal 4,203,104 11,750,801 4,103,569 10,820,393
PensiOn Plan health caRe Plan PensiOn Plan health caRe Plan
12.31.2009 12.31.2008
cOnsOlidated
20 emPlOyee BeneFits
the balances related to benefits granted to employees are presented as follows:
Financial analysis And Financial statements 2009 | PetROBRas
120
The evaluation of the Petros costing plan is done by independent actuaries
20.1 PensiOn Plan - FUndaÇãO PetROBRas de segURidade sOcial (PetROs)
a) Petros PlanFundação petrobras de Seguridade Social
(petros) is a defined benefit plan set up by petrobras in july 1970 to ensure that members of the plan receive a supplement to the benefits provided by the Social Security system. in addition to petrobras, the petros plan is sponsored by petrobras distribuidora S.a. (br), petroquisa and alberto pasqualini (refap), and is closed to employees hired as from September 2002.
the evaluation of the petros costing plan is done by independent actuaries on a capitalization basis for the majority of the benefits. the sponsors make regular contributions in amounts equal to the amounts of the contributions of the participants (employees) and assisted persons (retirees and pensioners), i.e. equally.
if a deficit is verified in the defined benefit plan, it should be settled by an adjustment to the costing plan through extraordinary contributions to be shared equally between the sponsors and the members, as established by constitutional amendment 20 of 1998.
on october 23, 2008, petrobras and the subsidiaries that sponsored the petros plan and petros signed Financial commitment agreements (tcF) as a result of the ratification of a legal transaction related to the pension plan, as established in the reciprocal obligations agreement (aor) entered into between these sponsors and the union entities. the Financial commitment agreement has a term of 20 years with payment of half-yearly interest of 6% p.a. on the updated balance payable. at december 31, 2009, the balance of the Financial commitment agreement was r$ 4,304,177 (r$ 4,047,527 in the parent company), of which r$ 37,438 (r$ 34,164 in the parent company) matures in 2010.
the company’s obligation, through the financial commitment agreement, represents a counterpart to the concessions made by the members/beneficiaries of the petros plan in the amendment of the plan’s regulations, in relation to the benefits, and the closing of existing litigations.
on april 16, 2009, the regional Federal court of the First region, in brasília, suspended the effects of an injunction granted on march 24, 2009, to
nOtes tO the Financial statements (cOnsOlidated and PaRent cOmPany)
(in thousand of reais)
oil worker unions, retired workers’ associations and other associations, which nullified the renegotiation process. accordingly, all the changes in the regulations of the plan arising from this process were maintained.
at december 31, 2009, petrobras and its subsidiaries held long-term national treasury notes in the amount of r$ 4,114,811 (r$ 3,901,428 in the parent company), acquired to balance liabilities with petros, which will be held in the company’s portfolio as a guarantee for the tcF.
b) Petros Plan 2as from july 1, 2007, petrobras, petrobras
distribuidora S.a. (br), petroquisa and alberto pasqualini - refap S.a. implemented a new supplementary pension plan, called petros plan 2, in the form of a variable contribution or mixed plan for the employees with no supplementary pension plan. afterwards, ipiranga asfaltos S.a. (iaSa), FaFEn Energia S.a., termorio S.a. and termoceará joined the plan.
the portion of this plan with defined benefit characteristics refers to risk coverage for disability and death, a guarantee of a minimum benefit
and a lifetime income, and the related actuarial commitments are recorded according to the projected credit unit method. the portion of the plan with defined contribution characteristics is earmarked for forming a reserve for programmed retirement and was recognized in the results for the year as the contributions are made. in fiscal year 2009, the contribution of petrobras and subsidiaries to the defined contribution portion of this plan was r$ 256,470 (r$ 245,376 in the parent company).
the sponsors petrobras, petrobras distribuidora S.a. (br), petroquisa and alberto pasqualini - refap S.a. assumed the past service of the contributions corresponding to the period in which the members had no plan, as from august 2002, or from later hiring, until august 29, 2007. the plan will continue to be open for inscriptions after this date, but there will no longer be payment for past service.
the disbursements related to the cost of past service will be made on a monthly basis over the same number of months during which the member had no plan and, therefore, will cover the part related to the members and the sponsors.
121
Financial analysis And Financial statements 2009 | PetROBRas
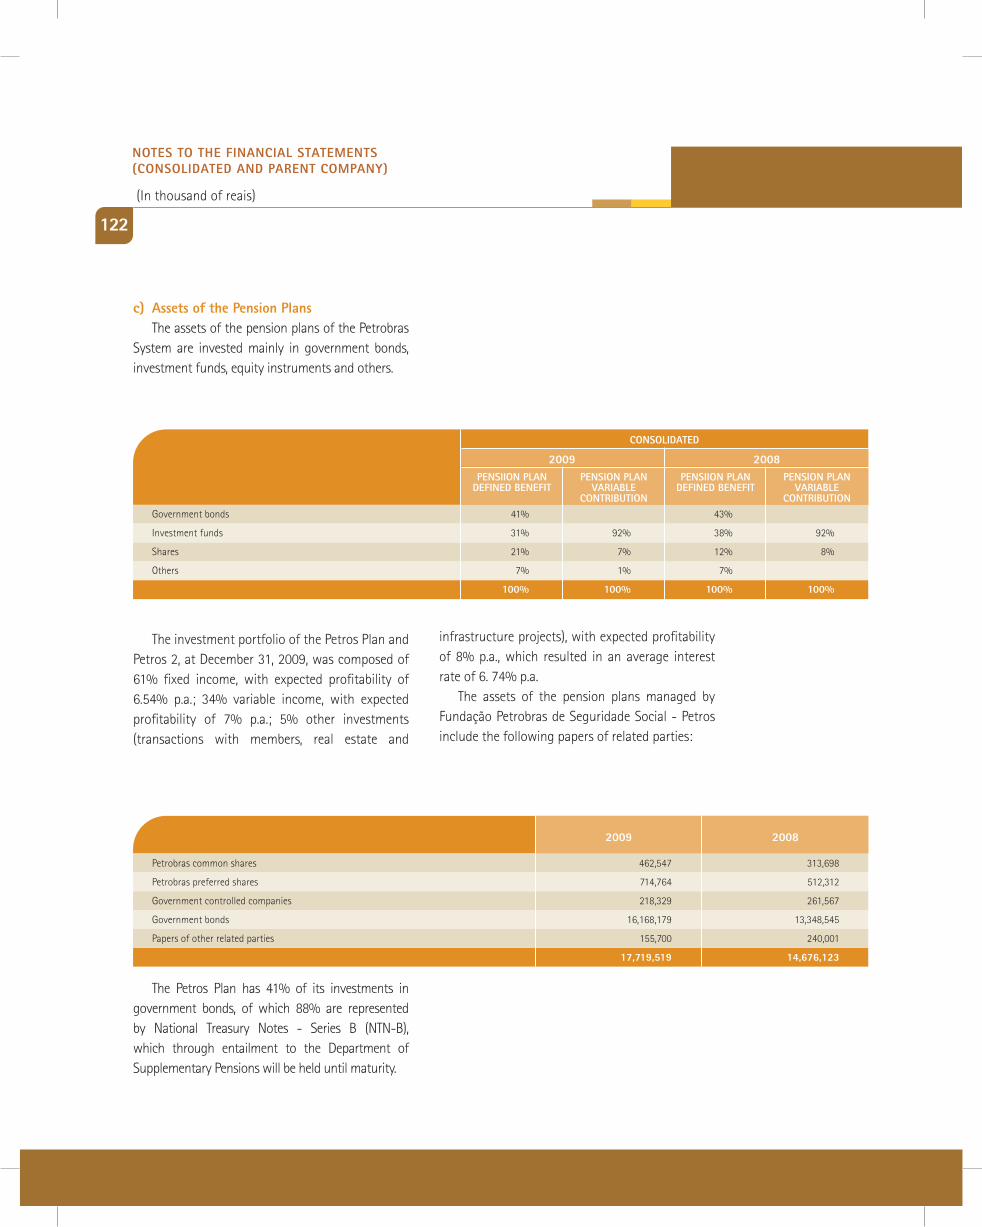
122
c) assets of the Pension Plansthe assets of the pension plans of the petrobras
System are invested mainly in government bonds, investment funds, equity instruments and others.
2009
government bonds 41% 43%
investment funds 31% 92% 38% 92%
Shares 21% 7% 12% 8%
others 7% 1% 7%
100% 100% 100% 100%
PensiiOn Plan deFined BeneFit
PensiOn Plan VaRiaBle
cOntRiBUtiOn
PensiiOn Plan deFined BeneFit
PensiOn PlanVaRiaBle
cOntRiBUtiOn
cOnsOlidated
2008
2009
petrobras common shares 462,547 313,698
petrobras preferred shares 714,764 512,312
government controlled companies 218,329 261,567
government bonds 16,168,179 13,348,545
papers of other related parties 155,700 240,001
17,719,519 14,676,123
2008
the investment portfolio of the petros plan and petros 2, at december 31, 2009, was composed of 61% fixed income, with expected profitability of 6.54% p.a.; 34% variable income, with expected profitability of 7% p.a.; 5% other investments (transactions with members, real estate and
infrastructure projects), with expected profitability of 8% p.a., which resulted in an average interest rate of 6. 74% p.a.
the assets of the pension plans managed by Fundação petrobras de Seguridade Social - petros include the following papers of related parties:
the petros plan has 41% of its investments in government bonds, of which 88% are represented by national treasury notes - Series b (ntn-b), which through entailment to the department of Supplementary pensions will be held until maturity.
nOtes tO the Financial statements (cOnsOlidated and PaRent cOmPany)
(in thousand of reais)
20.2 PetROBRas inteRnatiOnal BRasPetRO B.V. – PiB BV
20.2.1 PetROBRas eneRgia s.a.a) defined contribution pension plan
in 2005, petrobras Energia S.a. (pesa) implemented this voluntary plan for all employees who meet certain conditions. the company contributes with amounts equal to the contributions made by the employees in accordance with the contributions specified for each salary level.
the cost of the plan is recognized in accordance with the contributions that the company makes, which on december 31, 2009 totaled r$ 5,292 (r$ 4,619 on december 31, 2008).
b) defined benefit pension planb.1) “Termination Indemnity” Plan
this is a benefit plan in which employees who meet certain targets are eligible on retirement to receive one month’s salary for each year they have worked in the company, according to a decreasing scale, according to the number of years the plan has existed.b.2) ”Compensator Fund” Plan
this plan is available for all pesa employees who joined the defined contribution plans in force in the past and who joined the company prior to may 31, 1995 and have accumulated the required time of service. the benefit is calculated as a supplement to the benefits granted by these plans and by the retirement system, so that the total benefit received by each employee is equivalent to the amount defined in this plan.
if a surplus is recorded in the funds allocated to trusts for payment of the defined benefits awarded by the plans and it is duly certified by an independent actuary, pesa may use these funds simply by notifying the trustee of this fact.
20.2.2 nansei seKiyU K.K.the nansei Sekiyu k.k. refinery offers its
employees a supplementary retirement benefit plan, a defined benefit plan, where the members in order to become eligible for the benefit need to be at least 50 years old and have 20 years service in the company. contributions are made only by the sponsor. the plan is managed by the Sumitomo trust & banking.
123
Financial analysis And Financial statements 2009 | PetROBRas
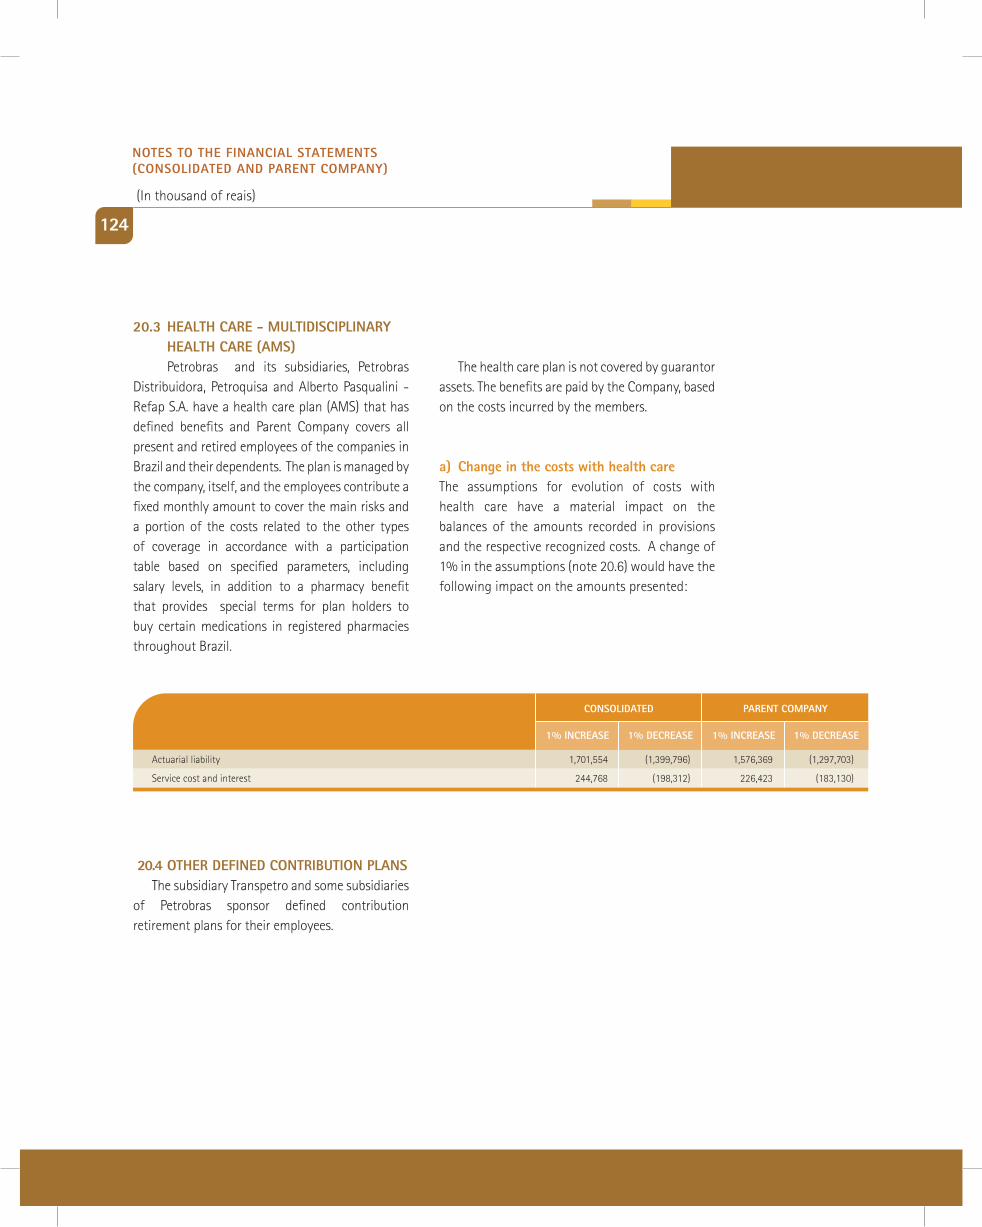
124
20.3 health caRe - mUltidisciPlinaRy health caRe (ams)
petrobras and its subsidiaries, petrobras distribuidora, petroquisa and alberto pasqualini - refap S.a. have a health care plan (amS) that has defined benefits and parent company covers all present and retired employees of the companies in brazil and their dependents. the plan is managed by the company, itself, and the employees contribute a fixed monthly amount to cover the main risks and a portion of the costs related to the other types of coverage in accordance with a participation table based on specified parameters, including salary levels, in addition to a pharmacy benefit that provides special terms for plan holders to buy certain medications in registered pharmacies throughout brazil.
20.4 OtheR deFined cOntRiBUtiOn Plans the subsidiary transpetro and some subsidiaries of petrobras sponsor defined contribution retirement plans for their employees.
cOnsOlidated
actuarial liability 1,701,554 (1,399,796) 1,576,369 (1,297,703)
Service cost and interest 244,768 (198,312) 226,423 (183,130)
1% incRease 1% decRease 1% incRease 1% decRease
PaRent cOmPany
the health care plan is not covered by guarantor assets. the benefits are paid by the company, based on the costs incurred by the members.
a) change in the costs with health carethe assumptions for evolution of costs with health care have a material impact on the balances of the amounts recorded in provisions and the respective recognized costs. a change of 1% in the assumptions (note 20.6) would have the following impact on the amounts presented:
nOtes tO the Financial statements (cOnsOlidated and PaRent cOmPany)
(in thousand of reais)
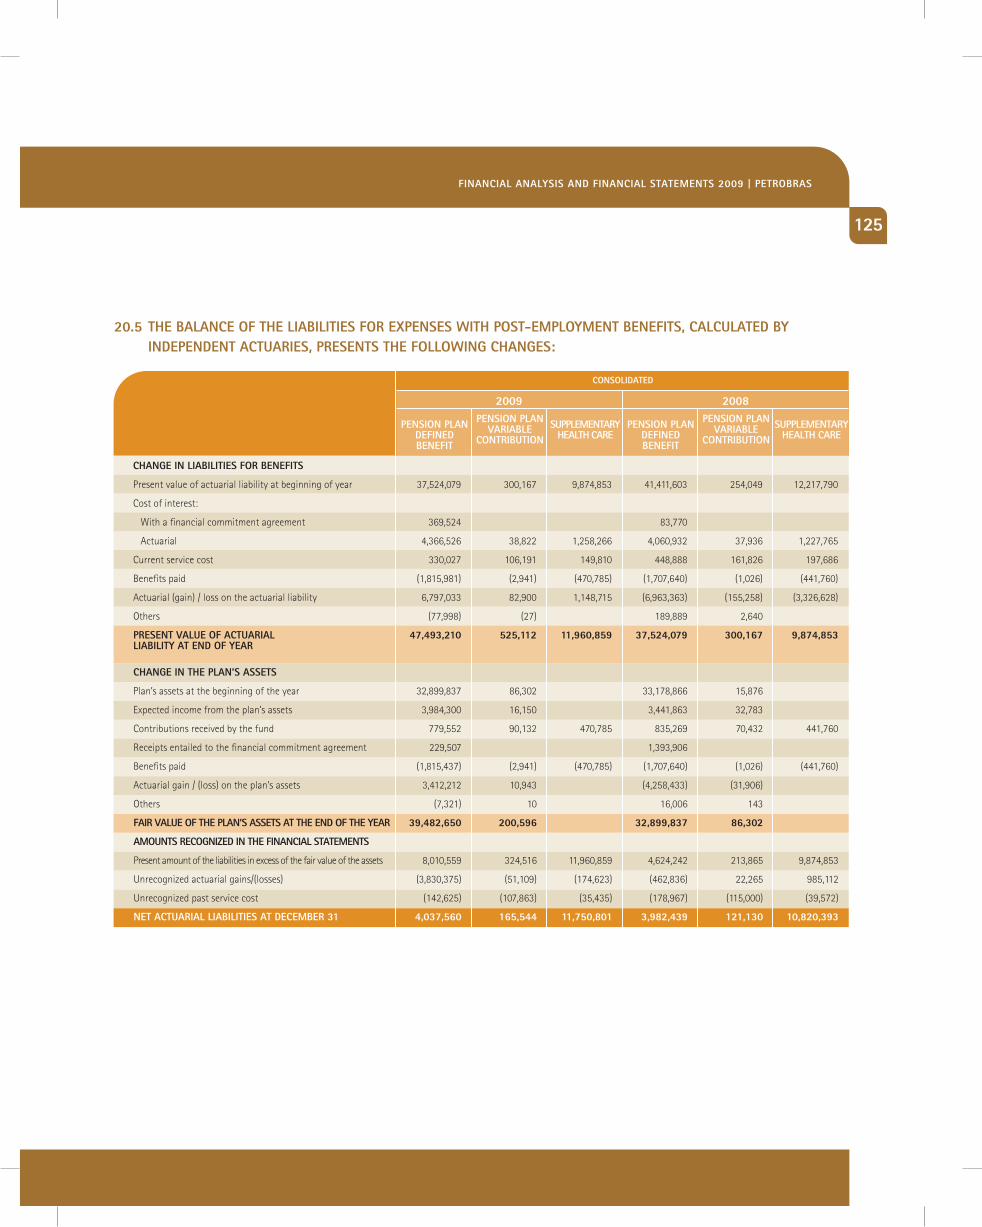
20.5 the Balance OF the liaBilities FOR exPenses with POst-emPlOyment BeneFits, calcUlated By indePendent actUaRies, PResents the FOllOwing changes:
cOnsOlidated
change in liaBilities FOR BeneFits
present value of actuarial liability at beginning of year 37,524,079 300,167 9,874,853 41,411,603 254,049 12,217,790
cost of interest:
With a financial commitment agreement 369,524 83,770
actuarial 4,366,526 38,822 1,258,266 4,060,932 37,936 1,227,765
current service cost 330,027 106,191 149,810 448,888 161,826 197,686
benefits paid (1,815,981) (2,941) (470,785) (1,707,640) (1,026) (441,760)
actuarial (gain) / loss on the actuarial liability 6,797,033 82,900 1,148,715 (6,963,363) (155,258) (3,326,628)
others (77,998) (27) 189,889 2,640
PResent ValUe OF actUaRial 47,493,210 525,112 11,960,859 37,524,079 300,167 9,874,853 liaBility at end OF yeaR
change in the Plan’s assets
plan’s assets at the beginning of the year 32,899,837 86,302 33,178,866 15,876
Expected income from the plan’s assets 3,984,300 16,150 3,441,863 32,783
contributions received by the fund 779,552 90,132 470,785 835,269 70,432 441,760
receipts entailed to the financial commitment agreement 229,507 1,393,906
benefits paid (1,815,437) (2,941) (470,785) (1,707,640) (1,026) (441,760)
actuarial gain / (loss) on the plan’s assets 3,412,212 10,943 (4,258,433) (31,906)
others (7,321) 10 16,006 143
FaiR ValUe OF the Plan’s assets at the end OF the yeaR 39,482,650 200,596 32,899,837 86,302
amOUnts RecOgnized in the Financial statements
present amount of the liabilities in excess of the fair value of the assets 8,010,559 324,516 11,960,859 4,624,242 213,865 9,874,853
unrecognized actuarial gains/(losses) (3,830,375) (51,109) (174,623) (462,836) 22,265 985,112
unrecognized past service cost (142,625) (107,863) (35,435) (178,967) (115,000) (39,572)
net actUaRial liaBilities at decemBeR 31 4,037,560 165,544 11,750,801 3,982,439 121,130 10,820,393
PensiOn Plan deFined BeneFit
PensiOn Plan deFined BeneFit
PensiOn Plan VaRiaBle
cOntRiBUtiOn
PensiOn Plan VaRiaBle
cOntRiBUtiOnsUPPlementaRy
health caResUPPlementaRy
health caRe
2009 2008
125
Financial analysis And Financial statements 2009 | PetROBRas
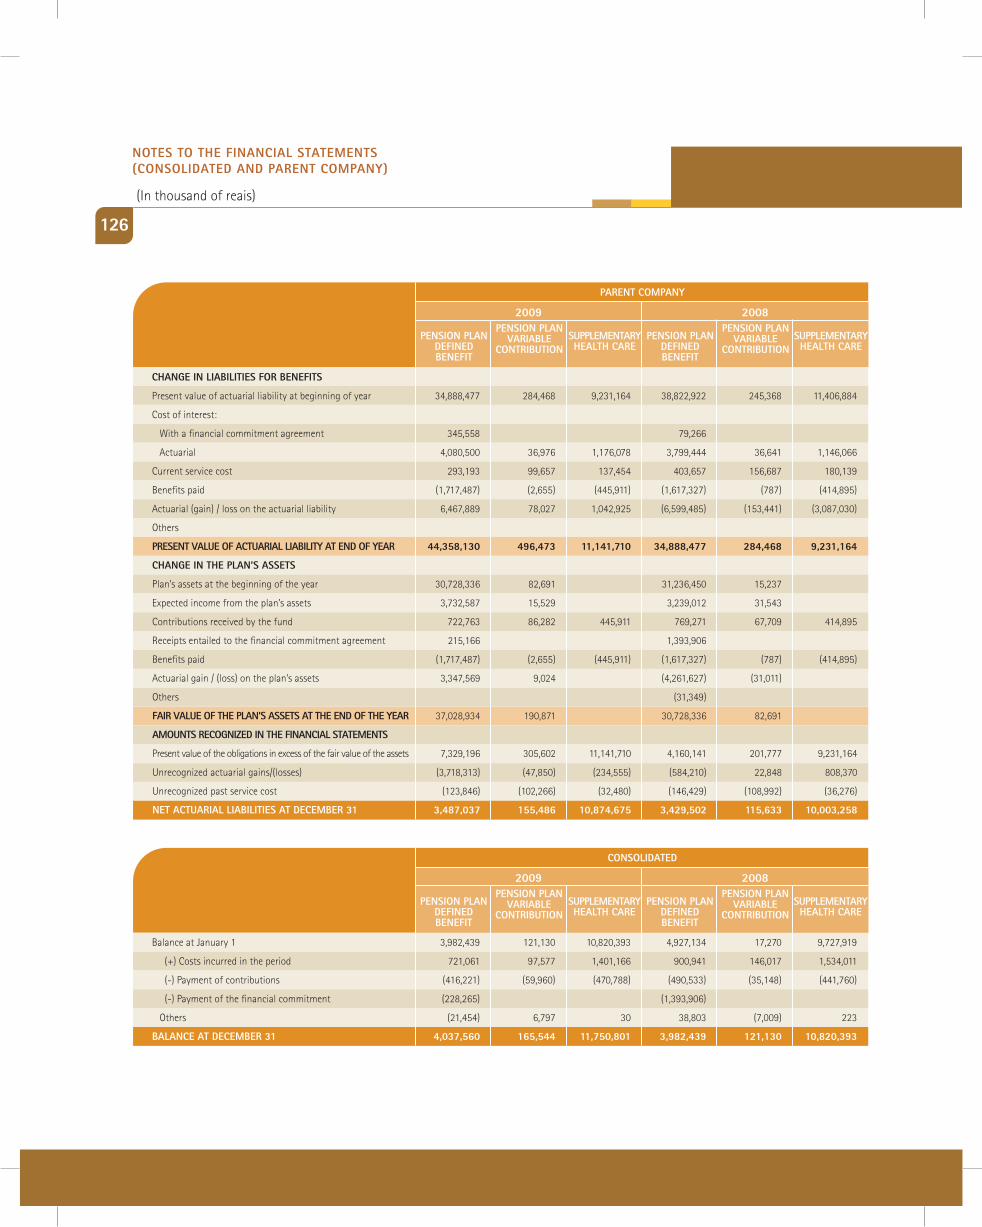
126
PaRent cOmPany
change in liaBilities FOR BeneFits
present value of actuarial liability at beginning of year 34,888,477 284,468 9,231,164 38,822,922 245,368 11,406,884
cost of interest:
With a financial commitment agreement 345,558 79,266
actuarial 4,080,500 36,976 1,176,078 3,799,444 36,641 1,146,066
current service cost 293,193 99,657 137,454 403,657 156,687 180,139
benefits paid (1,717,487) (2,655) (445,911) (1,617,327) (787) (414,895)
actuarial (gain) / loss on the actuarial liability 6,467,889 78,027 1,042,925 (6,599,485) (153,441) (3,087,030)
others
PResent ValUe OF actUaRial liaBility at end OF yeaR 44,358,130 496,473 11,141,710 34,888,477 284,468 9,231,164
change in the Plan’s assets
plan’s assets at the beginning of the year 30,728,336 82,691 31,236,450 15,237
Expected income from the plan’s assets 3,732,587 15,529 3,239,012 31,543
contributions received by the fund 722,763 86,282 445,911 769,271 67,709 414,895
receipts entailed to the financial commitment agreement 215,166 1,393,906
benefits paid (1,717,487) (2,655) (445,911) (1,617,327) (787) (414,895)
actuarial gain / (loss) on the plan’s assets 3,347,569 9,024 (4,261,627) (31,011)
others (31,349)
FaiR ValUe OF the Plan’s assets at the end OF the yeaR 37,028,934 190,871 30,728,336 82,691
amOUnts RecOgnized in the Financial statements
present value of the obligations in excess of the fair value of the assets 7,329,196 305,602 11,141,710 4,160,141 201,777 9,231,164
unrecognized actuarial gains/(losses) (3,718,313) (47,850) (234,555) (584,210) 22,848 808,370
unrecognized past service cost (123,846) (102,266) (32,480) (146,429) (108,992) (36,276)
net actUaRial liaBilities at decemBeR 31 3,487,037 155,486 10,874,675 3,429,502 115,633 10,003,258
PensiOn Plan deFined BeneFit
PensiOn Plan deFined BeneFit
PensiOn Plan VaRiaBle
cOntRiBUtiOn
PensiOn Plan VaRiaBle
cOntRiBUtiOnsUPPlementaRy health caRe
sUPPlementaRy health caRe
2009 2008
cOnsOlidated
balance at january 1 3,982,439 121,130 10,820,393 4,927,134 17,270 9,727,919
(+) costs incurred in the period 721,061 97,577 1,401,166 900,941 146,017 1,534,011
(-) payment of contributions (416,221) (59,960) (470,788) (490,533) (35,148) (441,760)
(-) payment of the financial commitment (228,265) (1,393,906)
others (21,454) 6,797 30 38,803 (7,009) 223
Balance at decemBeR 31 4,037,560 165,544 11,750,801 3,982,439 121,130 10,820,393
PensiOn Plan deFined BeneFit
PensiOn Plan deFined BeneFit
PensiOn Plan VaRiaBle
cOntRiBUtiOn
PensiOn Plan VaRiaBle
cOntRiBUtiOnsUPPlementaRy health caRe
sUPPlementaRy health caRe
2009 2008
nOtes tO the Financial statements (cOnsOlidated and PaRent cOmPany)
(in thousand of reais)
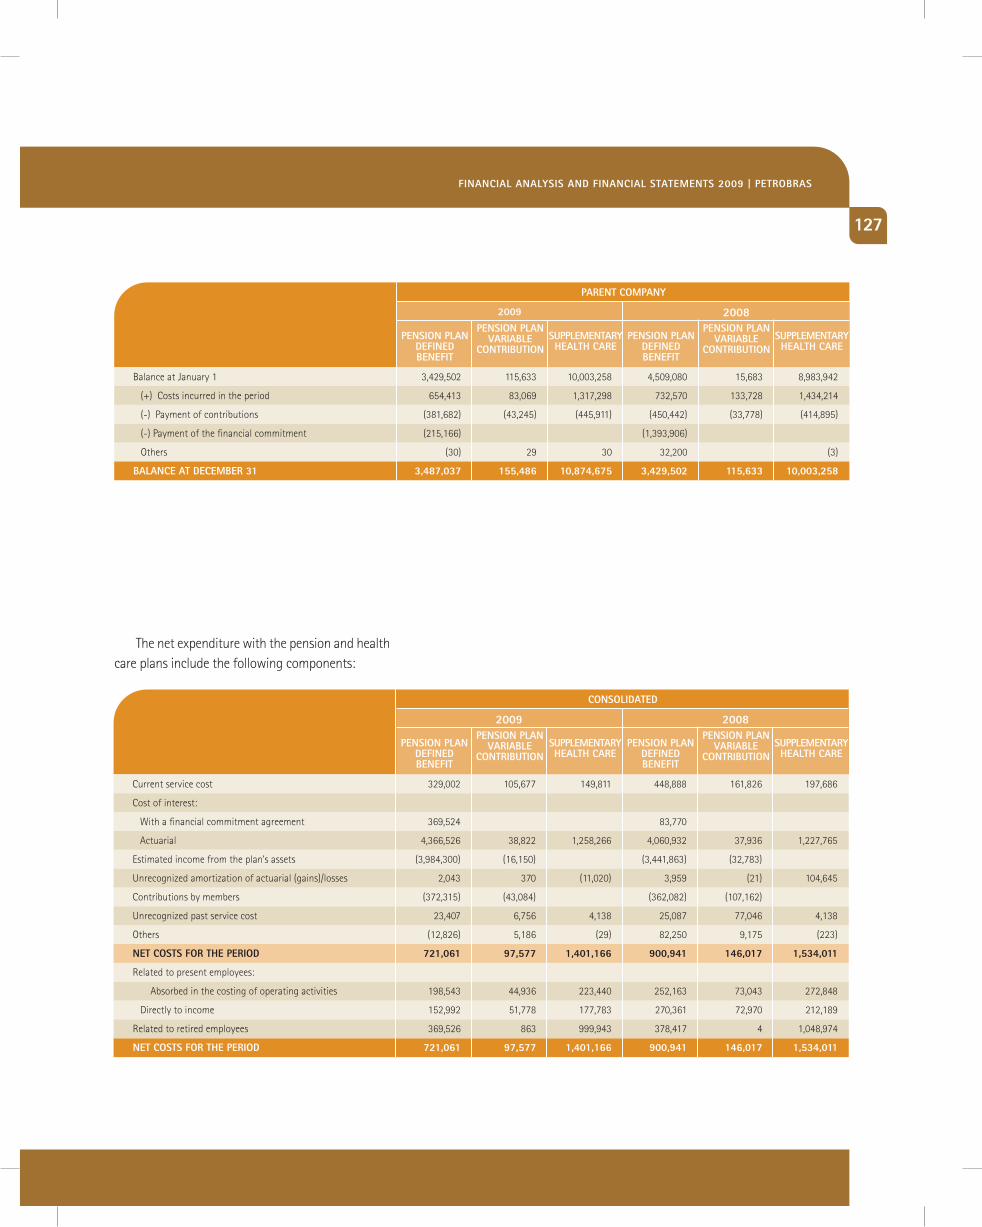
PaRent cOmPany
balance at january 1 3,429,502 115,633 10,003,258 4,509,080 15,683 8,983,942
(+) costs incurred in the period 654,413 83,069 1,317,298 732,570 133,728 1,434,214
(-) payment of contributions (381,682) (43,245) (445,911) (450,442) (33,778) (414,895)
(-) payment of the financial commitment (215,166) (1,393,906)
others (30) 29 30 32,200 (3)
Balance at decemBeR 31 3,487,037 155,486 10,874,675 3,429,502 115,633 10,003,258
PensiOn Plan deFined BeneFit
PensiOn Plan deFined BeneFit
PensiOn Plan VaRiaBle
cOntRiBUtiOn
PensiOn Plan VaRiaBle
cOntRiBUtiOnsUPPlementaRy health caRe
sUPPlementaRy health caRe
2009 2008
cOnsOlidated
current service cost 329,002 105,677 149,811 448,888 161,826 197,686
cost of interest:
With a financial commitment agreement 369,524 83,770
actuarial 4,366,526 38,822 1,258,266 4,060,932 37,936 1,227,765
Estimated income from the plan’s assets (3,984,300) (16,150) (3,441,863) (32,783)
unrecognized amortization of actuarial (gains)/losses 2,043 370 (11,020) 3,959 (21) 104,645
contributions by members (372,315) (43,084) (362,082) (107,162)
unrecognized past service cost 23,407 6,756 4,138 25,087 77,046 4,138
others (12,826) 5,186 (29) 82,250 9,175 (223)
net cOsts FOR the PeRiOd 721,061 97,577 1,401,166 900,941 146,017 1,534,011
related to present employees:
absorbed in the costing of operating activities 198,543 44,936 223,440 252,163 73,043 272,848
directly to income 152,992 51,778 177,783 270,361 72,970 212,189
related to retired employees 369,526 863 999,943 378,417 4 1,048,974
net cOsts FOR the PeRiOd 721,061 97,577 1,401,166 900,941 146,017 1,534,011
PensiOn Plan deFined BeneFit
PensiOn Plan deFined BeneFit
PensiOn Plan VaRiaBle
cOntRiBUtiOn
PensiOn Plan VaRiaBle
cOntRiBUtiOnsUPPlementaRy health caRe
sUPPlementaRy health caRe
2009 2008
the net expenditure with the pension and health care plans include the following components:
127
Financial analysis And Financial statements 2009 | PetROBRas
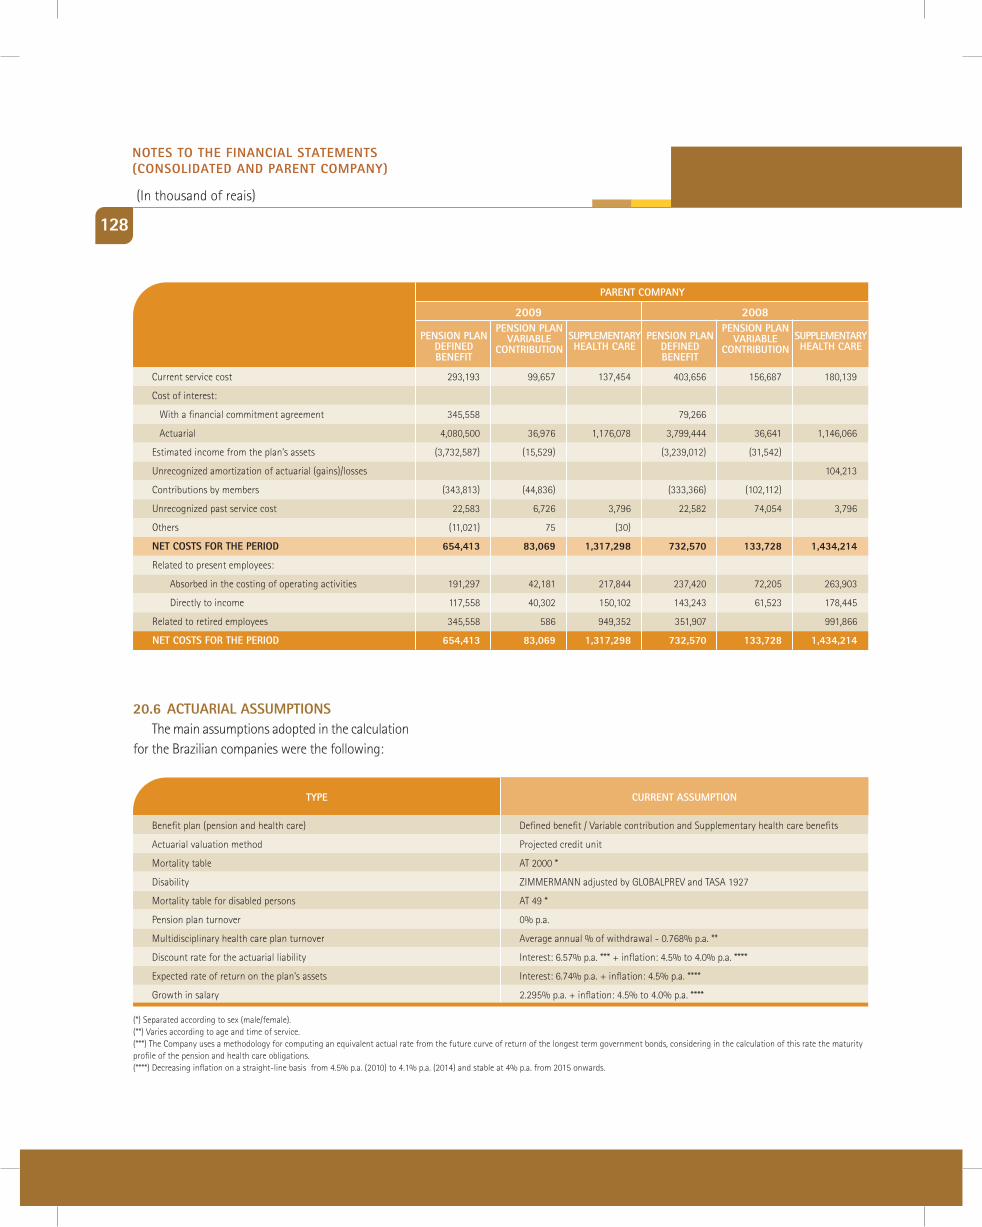
128
20.6 actUaRial assUmPtiOns the main assumptions adopted in the calculation for the brazilian companies were the following:
defined benefit / Variable contribution and Supplementary health care benefits
projected credit unit
at 2000 *
ZIMMERMANNadjustedbyGLOBALPREVandTASA1927
at 49 *
0% p.a.
average annual % of withdrawal - 0.768% p.a. **
interest: 6.57% p.a. *** + inflation: 4.5% to 4.0% p.a. ****
interest: 6.74% p.a. + inflation: 4.5% p.a. ****
2.295% p.a. + inflation: 4.5% to 4.0% p.a. ****
tyPe cURRent assUmPtiOn
benefit plan (pension and health care)
actuarial valuation method
mortality table
disability
mortality table for disabled persons
pension plan turnover
multidisciplinary health care plan turnover
discount rate for the actuarial liability
Expected rate of return on the plan’s assets
growth in salary
(*) Separated according to sex (male/female).(**) Varies according to age and time of service.(***) the company uses a methodology for computing an equivalent actual rate from the future curve of return of the longest term government bonds, considering in the calculation of this rate the maturity profile of the pension and health care obligations. (****) decreasing inflation on a straight-line basis from 4.5% p.a. (2010) to 4.1% p.a. (2014) and stable at 4% p.a. from 2015 onwards.
PaRent cOmPany
current service cost 293,193 99,657 137,454 403,656 156,687 180,139
cost of interest:
With a financial commitment agreement 345,558 79,266
actuarial 4,080,500 36,976 1,176,078 3,799,444 36,641 1,146,066
Estimated income from the plan’s assets (3,732,587) (15,529) (3,239,012) (31,542)
unrecognized amortization of actuarial (gains)/losses 104,213
contributions by members (343,813) (44,836) (333,366) (102,112)
unrecognized past service cost 22,583 6,726 3,796 22,582 74,054 3,796
others (11,021) 75 (30)
net cOsts FOR the PeRiOd 654,413 83,069 1,317,298 732,570 133,728 1,434,214
related to present employees:
absorbed in the costing of operating activities 191,297 42,181 217,844 237,420 72,205 263,903
directly to income 117,558 40,302 150,102 143,243 61,523 178,445
related to retired employees 345,558 586 949,352 351,907 991,866
net cOsts FOR the PeRiOd 654,413 83,069 1,317,298 732,570 133,728 1,434,214
PensiOn Plan deFined BeneFit
PensiOn Plan deFined BeneFit
PensiOn Plan VaRiaBle
cOntRiBUtiOn
PensiOn Plan VaRiaBle
cOntRiBUtiOnsUPPlementaRy health caRe
sUPPlementaRy health caRe
2009 2008
nOtes tO the Financial statements (cOnsOlidated and PaRent cOmPany)
(in thousand of reais)
129
The preferred shares are given priority in the event of capital reimbursement and the receipt of dividends
21 emPlOyee and management PROFit-shaRing
22 shaRehOldeRs’ eqUity
according to the provisions of current legislation, the employees’ participation in profits or results may be based on voluntary programs maintained by the companies or on agreements with employees or unions.
accordingly, in 2009 petrobras recorded a provision in the amount of r$ 1,495,323 in the consolidated financial statements (r$ 1,344,526 in 2008) and r$ 1,269,854 in the parent company (r$ 1,138,078 in 2008), for profit sharing of employees and management. the amount of the provision complies with the limits established by resolution 10, of may 30, 1995 issued by the council for control of State companies (ccE).
management participation in the profits or results will be subject to approval at the general Shareholders’ meeting to be held on march, 31, 2010, in accordance with articles 41 and 56 of the company’s bylaws and specific federal regulations.
22.1 sUBscRiBed and Paid in caPitalat december 31, 2009 and 2008 subscribed
and fully paid-in capital in the amount of r$ 78,966,691 is represented by 5,073,347,344 common shares and 3,700,729.396 preferred shares, all of which are registered and have no par value.
the preferred shares are given priority in the event of capital reimbursement and the receipt of dividends of at least 3% (three percent) of the value of the net equity of the share, or 5% (five percent) calculated on the part of the capital represented by this type of shares, where the higher amount shall always prevail, on the same terms as the common shares, in the capital increases arising from the incorporation of reserves and profits. preferred shares are not assured voting rights and are not convertible into common shares and vice versa.
the management of petrobras is proposing to the Special general Shareholders’ meeting to be held jointly with the annual general Shareholders’ meeting on april 22, 2010, a capital increase in the company from r$ 78,966,691 to r$ 85,108,544, through capitalization of part of a profit reserve recorded in the amount of r$ 5,626,997, of which r$ 899,376 is from statutory reserve and r$ 4,713,168 from a profit retention reserve, pursuant to article 199 of law 6.404/76 and r$ 14,452 from part of a tax incentive reserve established in 2009, in compliance with article 35, paragraph 1, of ordnance 2.091/07 of the State ministry of national integration, and capital reserve in the amount of r$ 514,856. this capitalization will be carried out without the issuing of new shares, pursuant to article 169, paragraph 1, of law 6.404/76.
Financial analysis And Financial statements 2009 | PetROBRas
130
22.4 PROFit ReseRVes
a) legal reservethe legal reserve is formed through the
appropriation of 5% of the net income for the year, as required by article 193 of the brazilian corporation law.b) statutory reserve
the statutory reserve is formed through the appropriation of the net income for each year in an amount equivalent to at least 0.5% of the paid-in capital at year-end. this reserve is used to fund research and technological development programs. the balance of this reserve may not exceed 5% of the paid-in capital, according to article 55 of the company’s bylaws.c) tax incentive reserve
it is created through distribution of part of the results for the year equivalent to the tax incentives resulting from government donations or subsidies, pursuant to article 195-a of the corporation law. this reserve may only be used for absorbing losses or increasing capital.
in 2009, r$ 539,995 was earmarked from the results referring to the incentive for subsidies for investments in the northeast and amazônia, in the ambit of the Superintendencies for development of the northeast (SudEnE) and amazonia (Sudam), and r$ 14,452 referring to the realization of part of the deposits for reinvestments with its own funds.
22.2 caPital ReseRVes
a) tax incentives it includes an incentive for investments
in the north East, within the ambit of the Superintendency for development of the north East (SudEnE), with a 75% reduction in the income tax due, calculated on the working profits of activities with incentives, in the amount of r$ 514,856 up till december 31, 2007, which may only be used to offset losses or to increase capital, as established in article 545 of the income tax regulations.
the donations and subsidies for investment recorded in the accounting up to december 31, 2007 will be maintained in a capital reserve until they have been totally used.
22.3 ReValUatiOn ReseRVe
this reserve is formed as a result of revaluation of assets of property, plant and equipment, recorded by a jointly controlled subsidy and by affiliated companies of a subsidiary, in prior years.
the company opted to maintain the balance of the respective revaluation reserves at december 31, 2007 until their total realization.
the realization of this reserve in 2009, proportional to the depreciation of the revalued assets, was fully transferred to retained earnings in the amount of r$ 9,934 (r$ 51,236 in 2008).
nOtes tO the Financial statements (cOnsOlidated and PaRent cOmPany)
(in thousand of reais)
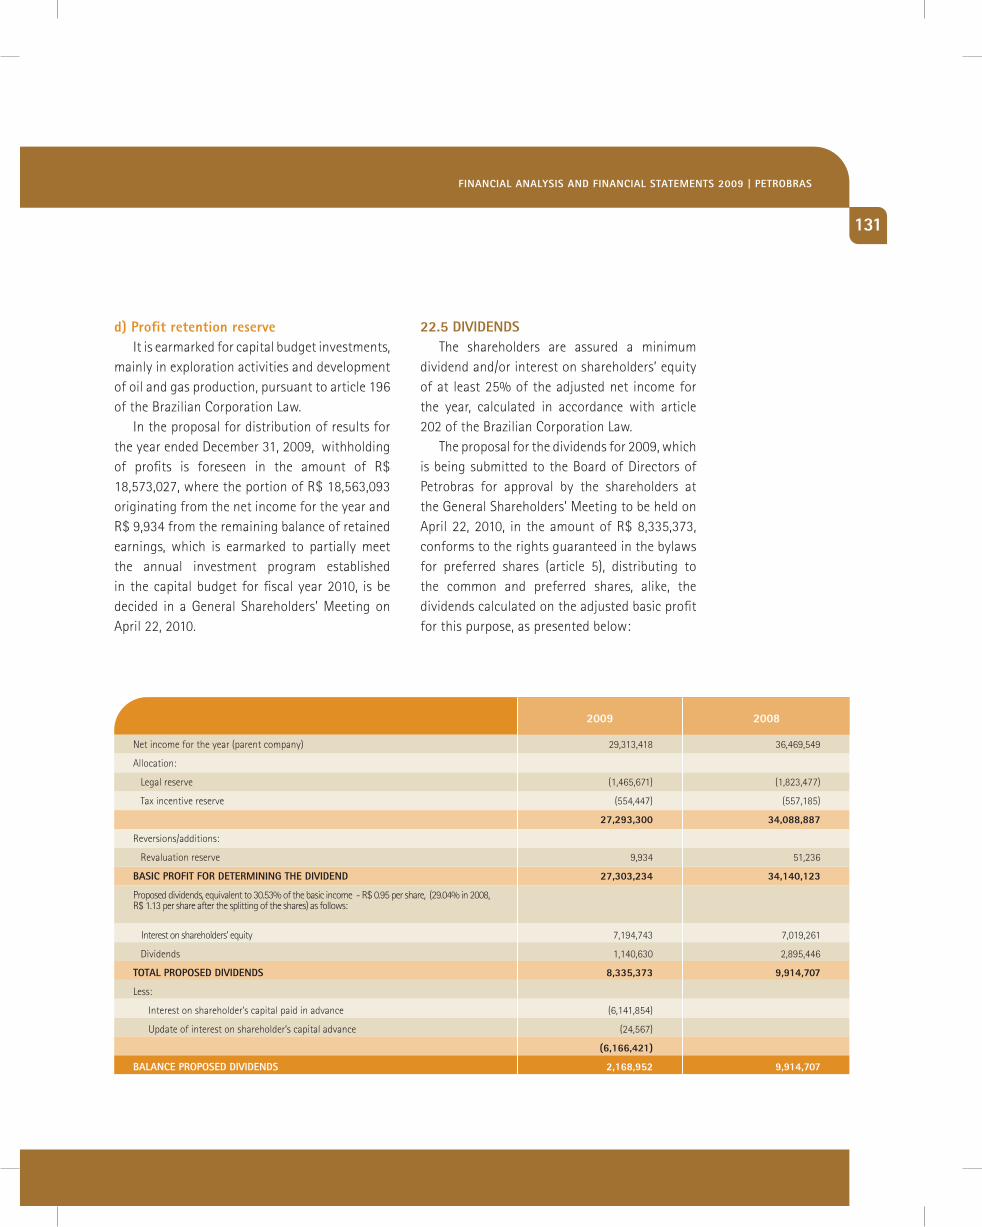
22.5 diVidendsthe shareholders are assured a minimum
dividend and/or interest on shareholders’ equity of at least 25% of the adjusted net income for the year, calculated in accordance with article 202 of the brazilian corporation law.
the proposal for the dividends for 2009, which is being submitted to the board of directors of petrobras for approval by the shareholders at the general Shareholders’ meeting to be held on april 22, 2010, in the amount of r$ 8,335,373, conforms to the rights guaranteed in the bylaws for preferred shares (article 5), distributing to the common and preferred shares, alike, the dividends calculated on the adjusted basic profit for this purpose, as presented below:
d) Profit retention reserve it is earmarked for capital budget investments,
mainly in exploration activities and development of oil and gas production, pursuant to article 196 of the brazilian corporation law.
in the proposal for distribution of results for the year ended december 31, 2009, withholding of profits is foreseen in the amount of r$ 18,573,027, where the portion of r$ 18,563,093 originating from the net income for the year and r$ 9,934 from the remaining balance of retained earnings, which is earmarked to partially meet the annual investment program established in the capital budget for fiscal year 2010, is be decided in a general Shareholders’ meeting on april 22, 2010.
2009
net income for the year (parent company) 29,313,418 36,469,549
allocation:
legal reserve (1,465,671) (1,823,477)
tax incentive reserve (554,447) (557,185)
27,293,300 34,088,887
reversions/additions:
revaluation reserve 9,934 51,236
Basic PROFit FOR deteRmining the diVidend 27,303,234 34,140,123
proposed dividends, equivalent to 30.53% of the basic income - r$ 0.95 per share, (29.04% in 2008, r$ 1.13 per share after the splitting of the shares) as follows:
interest on shareholders’ equity 7,194,743 7,019,261
dividends 1,140,630 2,895,446
tOtal PROPOsed diVidends 8,335,373 9,914,707
less:
interest on shareholder’s capital paid in advance (6,141,854)
update of interest on shareholder’s capital advance (24,567)
(6,166,421)
Balance PROPOsed diVidends 2,168,952 9,914,707
2008
131
Financial analysis And Financial statements 2009 | PetROBRas
132
the proposed dividends as of december 31, 2009, in the amount of r$ 8,335,373, include interest on shareholders’ equity in the total amount of r$ 7,194,743, approved by the board of directors, as follows:• OnJune24,2009,R$2,632,224,corresponding
to r$ 0.30 per share, made available to the shareholders on november 30, 2009, based on the shareholding position at july 3, 2009;
• On September 21, 2009, R$ 1,754,815,corresponding to r$ 0.20 per share, distributed on december 21, 2009, based on the shareholding position at September 30, 2009;
• On December 17, 2009, R$ 1,754,815,corresponding to r$ 0.20 per share, made available on december 29, 2009, based on the shareholding position at december 18, 2009;
• OnMarch19,2010,thefinalportionofintereston shareholders’ equity, to be made available based on the shareholding position as of april 22, 2010, the date of the annual general Shareholders’ meeting, which will decide on the subject, in the amount of r$ 1,052,889, corresponding to r$ 0.12 per common and preferred share, together with the dividends of r$ 1,140,630 corresponding to r$ 0.13 per
common and preferred share.the payments of interest on shareholders’
equity distributed in advance in 2009 will be discounted from the dividends proposed for this year, restated by the SElic rate from the date of their payment until december 31, 2009. the dividends and the final payment of interest on shareholders’ equity will be paid on the date that is fixed in the annual general Shareholders’ meeting and their values will be monetarily restated according to the variation of the SElic rate as from december 31, 2009 until the date for the beginning of payment.
the interest on shareholders’ equity is subject to the withholding of income tax at source of 15%, except for the shareholders that are immune and exempt, as established in law 9.249/95. this interest was ascribed to the dividends for the year in the manner established in the company’s bylaws, recorded in operating results, as required by the tax legislation, and were reversed against retained earnings, as stipulated by cVm resolution 207/96, resulting in an income tax and social contribution tax credit in the amount of r$ 2,446,213 (r$ 2,386,549 in 2008).
the payments of interest shareholders´ equity distributed in advance in 2009 will be discounted from the dividends proposed for this year
nOtes tO the Financial statements (cOnsOlidated and PaRent cOmPany)
(in thousand of reais)
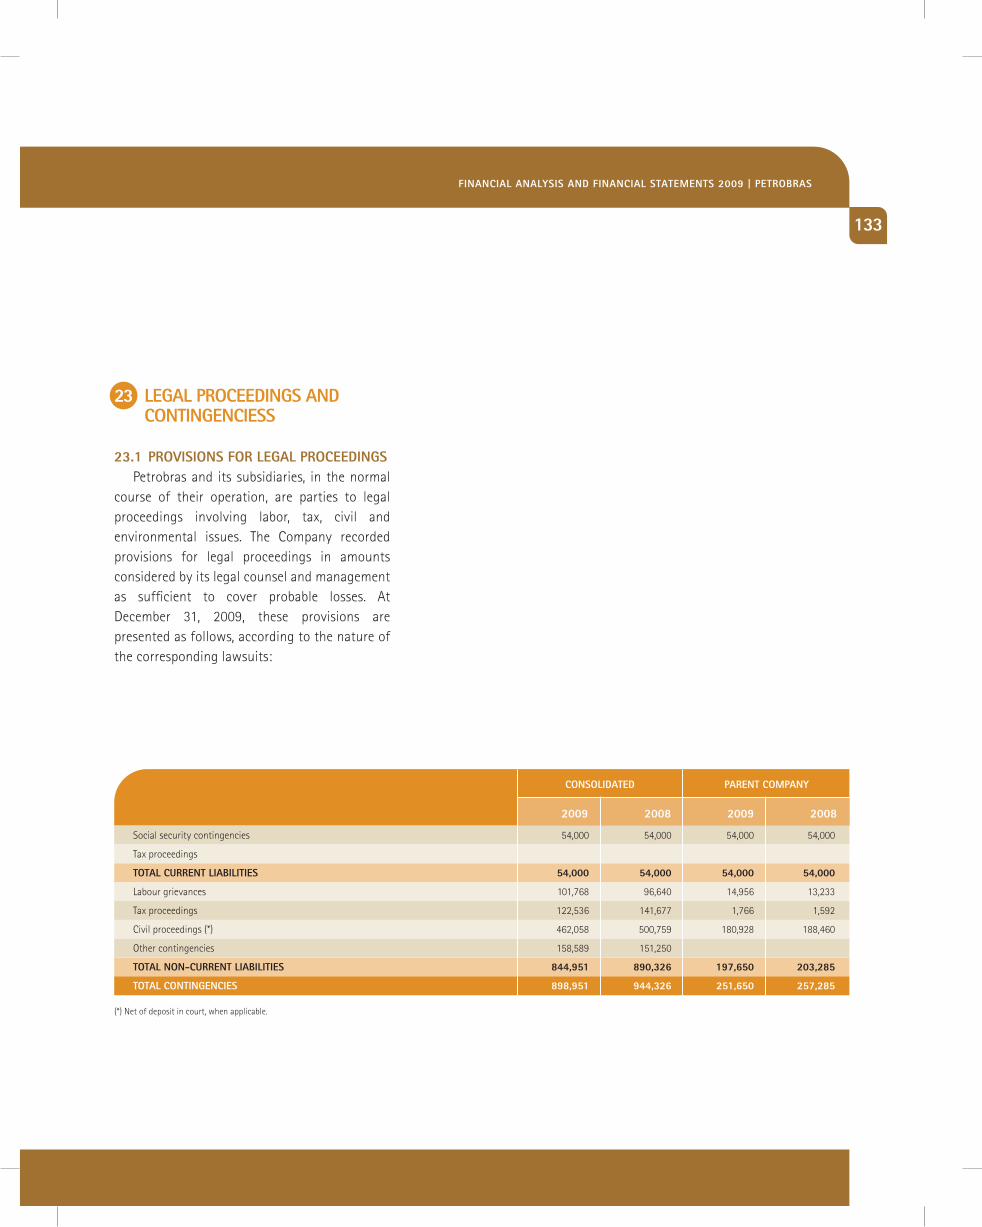
23 legal PROceedings and cOntingenciess
23.1 PROVisiOns FOR legal PROceedings petrobras and its subsidiaries, in the normal
course of their operation, are parties to legal proceedings involving labor, tax, civil and environmental issues. the company recorded provisions for legal proceedings in amounts considered by its legal counsel and management as sufficient to cover probable losses. at december 31, 2009, these provisions are presented as follows, according to the nature of the corresponding lawsuits:
cOnsOlidated
Social security contingencies 54,000 54,000 54,000 54,000
tax proceedings
tOtal cURRent liaBilities 54,000 54,000 54,000 54,000
labour grievances 101,768 96,640 14,956 13,233
tax proceedings 122,536 141,677 1,766 1,592
civil proceedings (*) 462,058 500,759 180,928 188,460
other contingencies 158,589 151,250
tOtal nOn-cURRent liaBilities 844,951 890,326 197,650 203,285
tOtal cOntingencies 898,951 944,326 251,650 257,285
2009 2008 2009 2008
PaRent cOmPany
(*) net of deposit in court, when applicable.
133
Financial analysis And Financial statements 2009 | PetROBRas
134
Fishermen’s Federation of Rio de janeiro - FePeRj
on behalf of its members, FEpErj is making a number of claims for indemnification as a result of an oil spill in guanabara bay which occurred on january 18, 2000. at the time, petrobras paid out extrajudicial indemnification to all who proved they were fishermen when the accident happened. according to the records of the national fishermen’s registry, only 3,339 people were eligible to claim indemnification.
on February 2, 2007, a decision, partially accepting the expert report, was published and which, on the pretext of quantifying the amount of the conviction, established the parameters for the respective calculations which, through these criteria, would result in the amount of r$ 1,102,207. petrobras appealed against this decision in the Superior court of rio de janeiro, since the parameters fixed in the decision are contrary to those already defined by the Superior court of rio de janeiro, itself. the appeal was accepted. on june 29, 2007, a decision was published by the First civil chamber of the Superior court of the State of rio de janeiro denying approval to the appeal by petrobras and granting approval to the appeal by FEpErj. Special appeals were lodged by petrobras against this decision, which in a decision handed down on november 19, 2009 by the Superior court of justice, were considered fit to annul the court decision of the First civil chamber of the Superior court of rio de janeiro.
publication of the court decision is being awaited in order to evaluate whether new appeals will be lodged by FEpErj, or whether they process will be returned to the Superior court of rio de janeiro for a new hearing.
based on the calculations prepared by the company’s experts, the amount of r$ 42,208, updated to december 31, 2009, was maintained as representing the amount that the company understand will be established at the end of the proceedings by the higher courts.
national agency of Petroleum, natural gas and Biofuel – anP special participation in the marlim field – campos basin
on july 18, 2007, petrobras was notified of the new resolution of the board of directors of anp, establishing the payment of new allocated amounts considered due in the calculation of the special participation in the marlin field, retroactively to 1998, annulling the previous resolution of the board, which determined that petrobras should make an additional payment of r$ 400,000 referring to the amounts that would have been underpaid, due to the use of a new calculation methodology initially defined by anp.
nOtes tO the Financial statements (cOnsOlidated and PaRent cOmPany)
(in thousand of reais)
petrobras filed for a Writ of Security and obtained an injunction suspending the collection of the differences of the Special participation mentioned in anp board resolution 400/2007. the administrative collection that had been stayed through an injunction granted in a Writ of Security was resumed due to the dismissal of the petrobras claim. the company filed an appeal with the civil appeals court and also filed for a temporary stay, both of which were awaiting a hearing by the court.
the judgment of the action in the lower court, which was unfavorable to the company, was confirmed by the regional federal court in a court decision published on September 30, 2009, against which petrobras has filed appeals to the higher courts in brasilia. however, on account of the following agreement that was announced, the parties (petrobras and anp) are drawing up a joint petition for the closing of the process.
For the purpose of resolving the conflict resulting from the additional collection for special participation of the marlim Field, petrobras, the
national agency of petroleum, natural gas and biofuels (anp) and the State of rio de janeiro, in the sphere of mediation with the chamber of conciliation and arbitration of the Federal public administration of the general advocacy of the union (ccaF/agu), reached an understanding for reviewing the calculation method adopted for restating the amount owed, as well as its settlement by the company.
the amount, after the due revisions, was a balance of r$ 2,065,360 on the date of the agreement.
in addition to the consensus that the parties reached with respect to the new calculation methodology for the debt, the proposal by petrobras sent to anp also considers its settlement in 08 (eight) consecutive, monthly payments, restated by the benchmark (SElic) rate, where 03 (three) payments have already been made, and there remains a balance payable on the total amount of r$ 1,321,702 as of december 31, 2009.
the payment in question definitively closes all and any legal and administrative litigation related to the issue.
135
Financial analysis And Financial statements 2009 | PetROBRas
136
on march 30, 2004 the Superior court of rio de janeiro unanimously granted the new appeal lodged by porto Seguro, ordering petrobras to indemnify the petroquisa an amount equal to uS$ 2,370 million, plus 5% as a premium and 20% as lawyers’ fees.
petrobras filed a special, extraordinary appeal before the Superior court of justice (Stj) and the Federal Supreme court (StF), which were rejected. petrobras then filed an interlocutory appeal against the decision before the Superior court of justice and the Federal Supreme court.
the Special appeal offered by porto Seguro, which sought to bar the processing of the Special appeal by petrobras was heard and dismissed in december 2009.
the publication of this decision and judgment of the aforementioned Special appeal through which petrobras seeks to totally reverse the sentence is being awaited.
based on the opinion of its legal counsel, the company does not expect an unfavorable outcome to these proceedings.
if the situation is not reversed, the estimated indemnity to petroquisa, including monetary correction and interest, would be r$ 16,026,052 as of december 31, 2009. as petrobras owns 100% of the capital of petroquisa, part of the indemnity to petroquisa, estimated at r$ 10,577,194, will not represent an actual disbursement from the petrobras System. additionally, petrobras would have to indemnify porto Seguro, the plaintive, r$ 801,303 as a premium and r$ 3,205,210 as lawyers’ fees to lobo & ibeas advogados.
petrobras submitted new administrative appeals to the higher chamber of tax appeals, the highest administrative level, which are awaiting a hearing.
maximum updated exposure: r$ 4,390,654.
descRiPtiOn cURRent sitUatiOn
PlaintiFF: PORtO segURO imóVeis ltda.
naturE: ciVil
porto Seguro, a minority shareholder of petroquisa, filed a lawsuit against petrobras, related to alleged losses arising from the sale of the shareholding interests of petroquisa in various petrochemical companies included in the national privatization program. the plaintiff filed the aforesaid lawsuit to obtain an order obliging petrobras, as the majority shareholder of petroquisa, to compensate for the “loss” inflicted on the equity of petroquisa, through the acts which approved the minimum sales price of its shareholding interest in the capital of the privatized companies.
PlaintiFF: FedeRal ReVenUe dePaRtment OF RiO de janeiRO
naturE: tax
tax deficiency notice related to withholding income tax (irrF) calculated on remittances of payments for affreightment of vessels referring to the period from 1999 to 2002.
lower court decision against petrobras.
a spontaneous appeal has been filed which is awaiting a hearing. petrobras filed a writ of security and obtained a favorable decision to stay any tax collections until the investigations determining the reasons that caused the platform to sink have been concluded. the Federal government/national treasury has filed an appeal which is awaiting a hearing.
With the decision of the maritime court, the company filed a tax debt annulment lawsuit and an injunction suspending collection of the tax.
maximum updated exposure: r$ 375,306.
PlaintiFF: FedeRal ReVenUe insPectORate in macaé
naturE: tax
interest and fines on import duty (ii) and excise tax (ipi) - Sinking of the p-36 platform.
23.2 legal PROceedings nOt PROVisiOned
We present below the updated situation of the main legal proceedings with chances of pos-sible loss:
nOtes tO the Financial statements (cOnsOlidated and PaRent cOmPany)
(in thousand of reais)
137
on august 15, 2006, termorio filed in the Federal revenue inspectorate of rio de janeiro a refutation of this notice of infraction as it considers that the tax collecting classifications that were made were supported by a technical report from a renowned institute. in a session on october 11, 2007, the First panel of judges considered the tax assessment as invalid, overcoming one judge who voted for partial validity. the Federal revenue inspectorate filed an ex-officio appeal to the taxpayers’ council and this request has not yet been heard.
maximum updated exposure: r$ 710,949.
of the amount the company disbursed to guarantee the filing of appeals and/or obtaining of the debt clearance certificate from the inSS, r$ 114,998 is recorded as deposited in court, which could be recovered in the proceedings in progress, related to 331 tax efficiency notices amounting to r$ 363,293 at december 31, 2009. the petrobras legal department classifies the chances of loss with respect to these deficiency notices as possible, as it considers the risk of future disbursement to be minimal.
the lower court considered the assessment to have grounds. the company filed a spontaneous appeal which is awaiting a hearing.
maximum updated exposure: r$ 1,149,354.
the lower court considered the assessment to be groundless. there was an appeal by the Federal revenue department to the taxpayers’ council that was approved. petrobras filed a spontaneous appeal which is awaiting a hearing.
maximum updated exposure: r$ 865,666.
descRiPtiOn cURRent sitUatiOn
PlaintiFF: FedeRal ReVenUe dePaRtment OF RiO de janeiRO
naturE: tax
tax deficiency notice referring to import duty (ii) and excise tax (ipi), contesting the tax classification as other Electricity generation groups for the importing of equipment belonging to the thermoelectric power station, termorio S.a.
PlaintiFF: sRP - sOcial secURity dePaRtment
naturE: tax
tax deficiency notices related to social security charges arising from administrative proceedings brought by the inSS which attributed joint liability to the company for the contracting of civil construction and other services.
PlaintiFF: FedeRal ReVenUe dePaRtment
naturE: tax
cidE – Fuels. non-payment in the period from march 2002 to october 2003, pursuant to court orders obtained by distributors and petrol stations protecting them from levying this charge.
PlaintiFF: FedeRal ReVenUe dePaRtment
naturE: tax
Withholding income tax (irrF) on remittances for payment of petroleum imports.
Financial analysis And Financial statements 2009 | PetROBRas
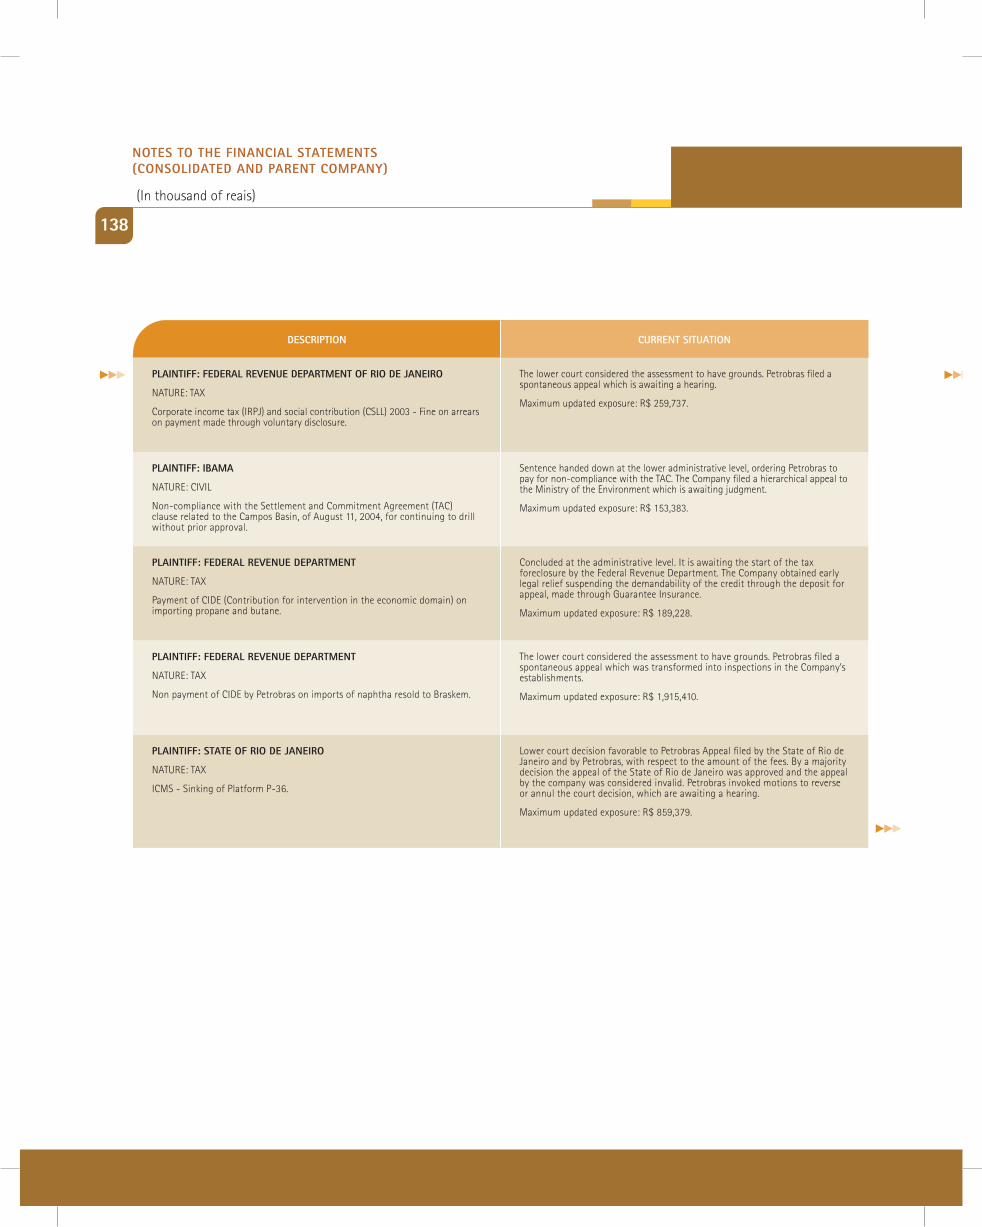
138
the lower court considered the assessment to have grounds. petrobras filed a spontaneous appeal which is awaiting a hearing.
maximum updated exposure: r$ 259,737.
Sentence handed down at the lower administrative level, ordering petrobras to pay for non-compliance with the tac. the company filed a hierarchical appeal to the ministry of the Environment which is awaiting judgment.
maximum updated exposure: r$ 153,383.
the lower court considered the assessment to have grounds. petrobras filed a spontaneous appeal which was transformed into inspections in the company’s establishments.
maximum updated exposure: r$ 1,915,410.
concluded at the administrative level. it is awaiting the start of the tax foreclosure by the Federal revenue department. the company obtained early legal relief suspending the demandability of the credit through the deposit for appeal, made through guarantee insurance.
maximum updated exposure: r$ 189,228.
lower court decision favorable to petrobras appeal filed by the State of rio de janeiro and by petrobras, with respect to the amount of the fees. by a majority decision the appeal of the State of rio de janeiro was approved and the appeal by the company was considered invalid. petrobras invoked motions to reverse or annul the court decision, which are awaiting a hearing.
maximum updated exposure: r$ 859,379.
descRiPtiOn cURRent sitUatiOn
PlaintiFF: FedeRal ReVenUe dePaRtment OF RiO de janeiRO
naturE: tax
corporate income tax (irpj) and social contribution (cSll) 2003 - Fine on arrears on payment made through voluntary disclosure.
PlaintiFF: iBama
naturE: ciVil
non-compliance with the Settlement and commitment agreement (tac) clause related to the campos basin, of august 11, 2004, for continuing to drill without prior approval.
PlaintiFF: FedeRal ReVenUe dePaRtment
naturE: tax
non payment of cidE by petrobras on imports of naphtha resold to braskem.
PlaintiFF: FedeRal ReVenUe dePaRtment
naturE: tax
payment of cidE (contribution for intervention in the economic domain) on importing propane and butane.
PlaintiFF: state OF RiO de janeiRO
naturE: tax
icmS - Sinking of platform p-36.
nOtes tO the Financial statements (cOnsOlidated and PaRent cOmPany)
(in thousand of reais)
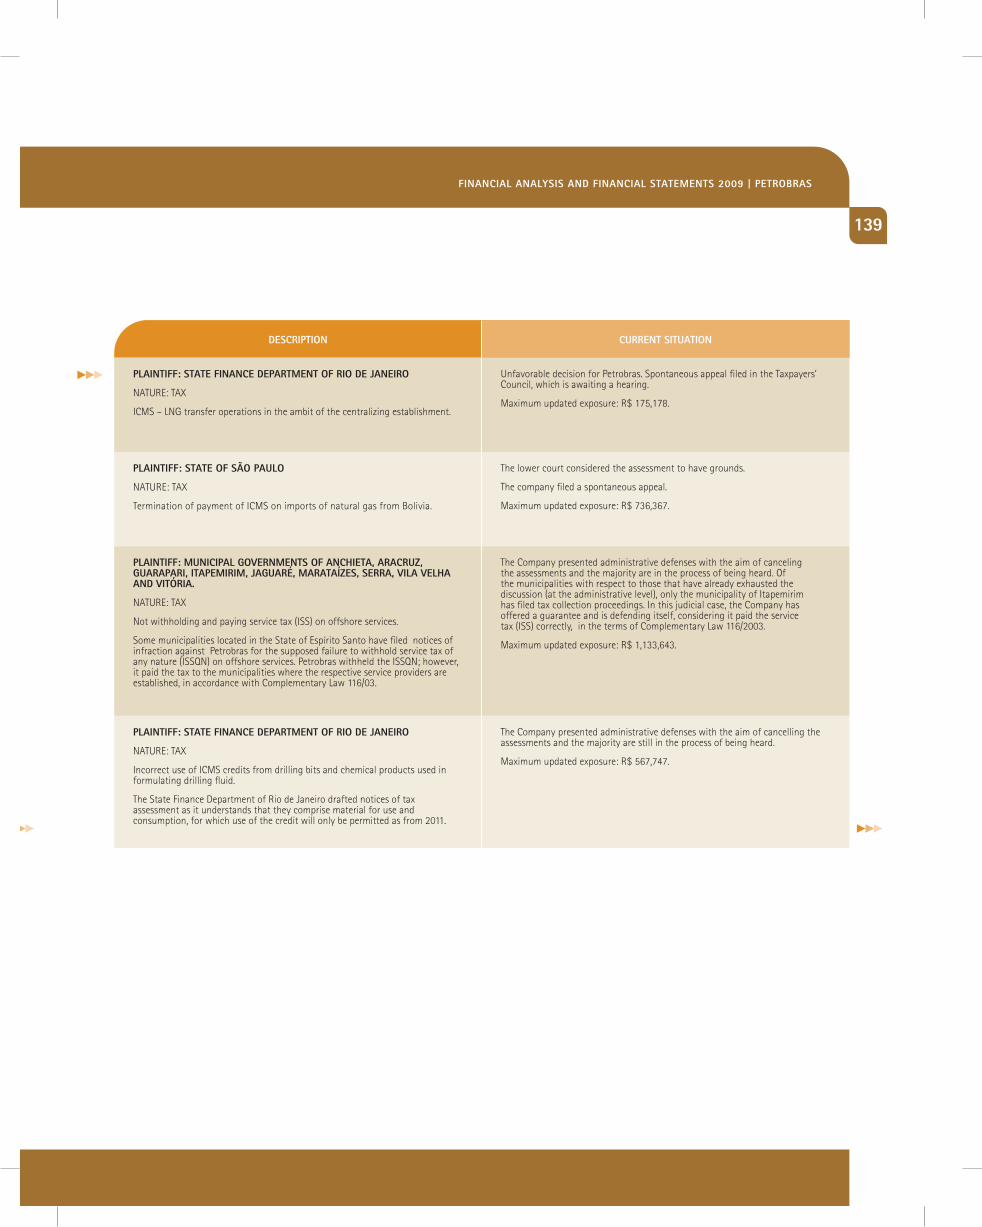
139
unfavorable decision for petrobras. Spontaneous appeal filed in the taxpayers’ council, which is awaiting a hearing.
maximum updated exposure: r$ 175,178.
the lower court considered the assessment to have grounds.
the company filed a spontaneous appeal.
maximum updated exposure: r$ 736,367.
the company presented administrative defenses with the aim of canceling the assessments and the majority are in the process of being heard. of the municipalities with respect to those that have already exhausted the discussion (at the administrative level), only the municipality of itapemirim has filed tax collection proceedings. in this judicial case, the company has offered a guarantee and is defending itself, considering it paid the service tax (iSS) correctly, in the terms of complementary law 116/2003.
maximum updated exposure: r$ 1,133,643.
the company presented administrative defenses with the aim of cancelling the assessments and the majority are still in the process of being heard.
maximum updated exposure: r$ 567,747.
descRiPtiOn cURRent sitUatiOn
PlaintiFF: state Finance dePaRtment OF RiO de janeiRO
naturE: tax
icmS – lng transfer operations in the ambit of the centralizing establishment.
PlaintiFF: state OF sãO PaUlO
naturE: tax
termination of payment of icmS on imports of natural gas from bolivia.
PlaintiFF: mUniciPal gOVeRnments OF anchieta, aRacRUz, gUaRaPaRi, itaPemiRim, jagUaRé, maRataízes, seRRa, Vila Velha and VitóRia.
naturE: tax
not withholding and paying service tax (iSS) on offshore services.
Some municipalities located in the State of Espírito Santo have filed notices of infraction against petrobras for the supposed failure to withhold service tax of any nature (iSSqn) on offshore services. petrobras withheld the iSSqn; however, it paid the tax to the municipalities where the respective service providers are established, in accordance with complementary law 116/03.
PlaintiFF: state Finance dePaRtment OF RiO de janeiRO
naturE: tax
incorrect use of icmS credits from drilling bits and chemical products used in formulating drilling fluid.
the State Finance department of rio de janeiro drafted notices of tax assessment as it understands that they comprise material for use and consumption, for which use of the credit will only be permitted as from 2011.
Financial analysis And Financial statements 2009 | PetROBRas
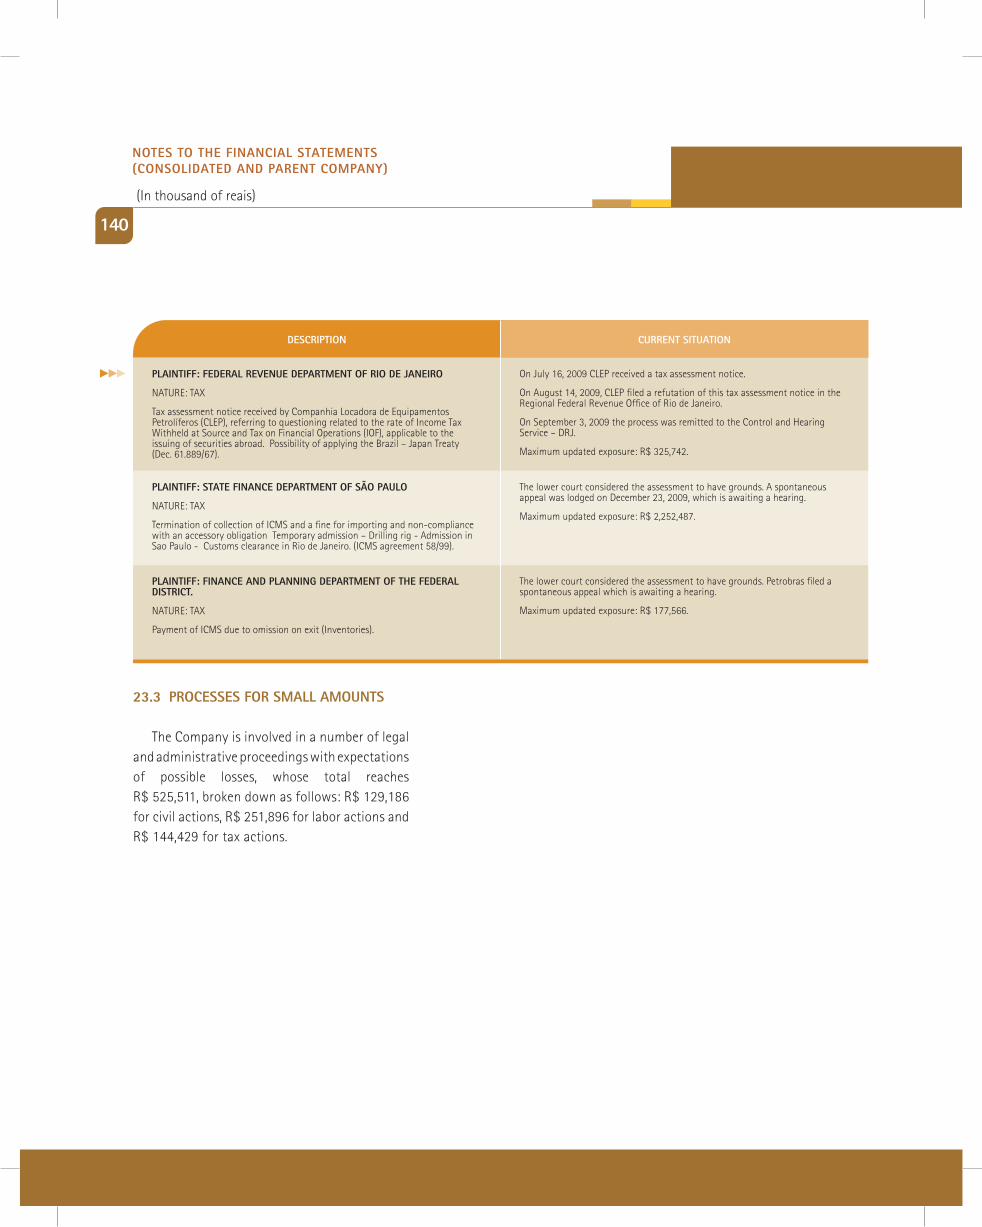
140
on july 16, 2009 clEp received a tax assessment notice.
on august 14, 2009, clEp filed a refutation of this tax assessment notice in the regional Federal revenue office of rio de janeiro.
on September 3, 2009 the process was remitted to the control and hearing Service – drj.
maximum updated exposure: r$ 325,742.
the lower court considered the assessment to have grounds. a spontaneous appeal was lodged on december 23, 2009, which is awaiting a hearing.
maximum updated exposure: r$ 2,252,487.
the lower court considered the assessment to have grounds. petrobras filed a spontaneous appeal which is awaiting a hearing.
maximum updated exposure: r$ 177,566.
descRiPtiOn cURRent sitUatiOn
PlaintiFF: FedeRal ReVenUe dePaRtment OF RiO de janeiRO
naturE: tax
tax assessment notice received by companhia locadora de Equipamentos petrolíferos (clEp), referring to questioning related to the rate of income tax Withheld at Source and tax on Financial operations (ioF), applicable to the issuing of securities abroad. possibility of applying the brazil – japan treaty (dec. 61.889/67).
PlaintiFF: state Finance dePaRtment OF sãO PaUlO
naturE: tax
termination of collection of icmS and a fine for importing and non-compliance with an accessory obligation temporary admission – drilling rig - admission in Sao paulo - customs clearance in rio de janeiro. (icmS agreement 58/99).
PlaintiFF: Finance and Planning dePaRtment OF the FedeRal distRict.
naturE: tax
payment of icmS due to omission on exit (inventories).
23.3 PROcesses FOR small amOUnts
the company is involved in a number of legal and administrative proceedings with expectations of possible losses, whose total reaches r$ 525,511, broken down as follows: r$ 129,186 for civil actions, r$ 251,896 for labor actions and r$ 144,429 for tax actions.
nOtes tO the Financial statements (cOnsOlidated and PaRent cOmPany)
(in thousand of reais)
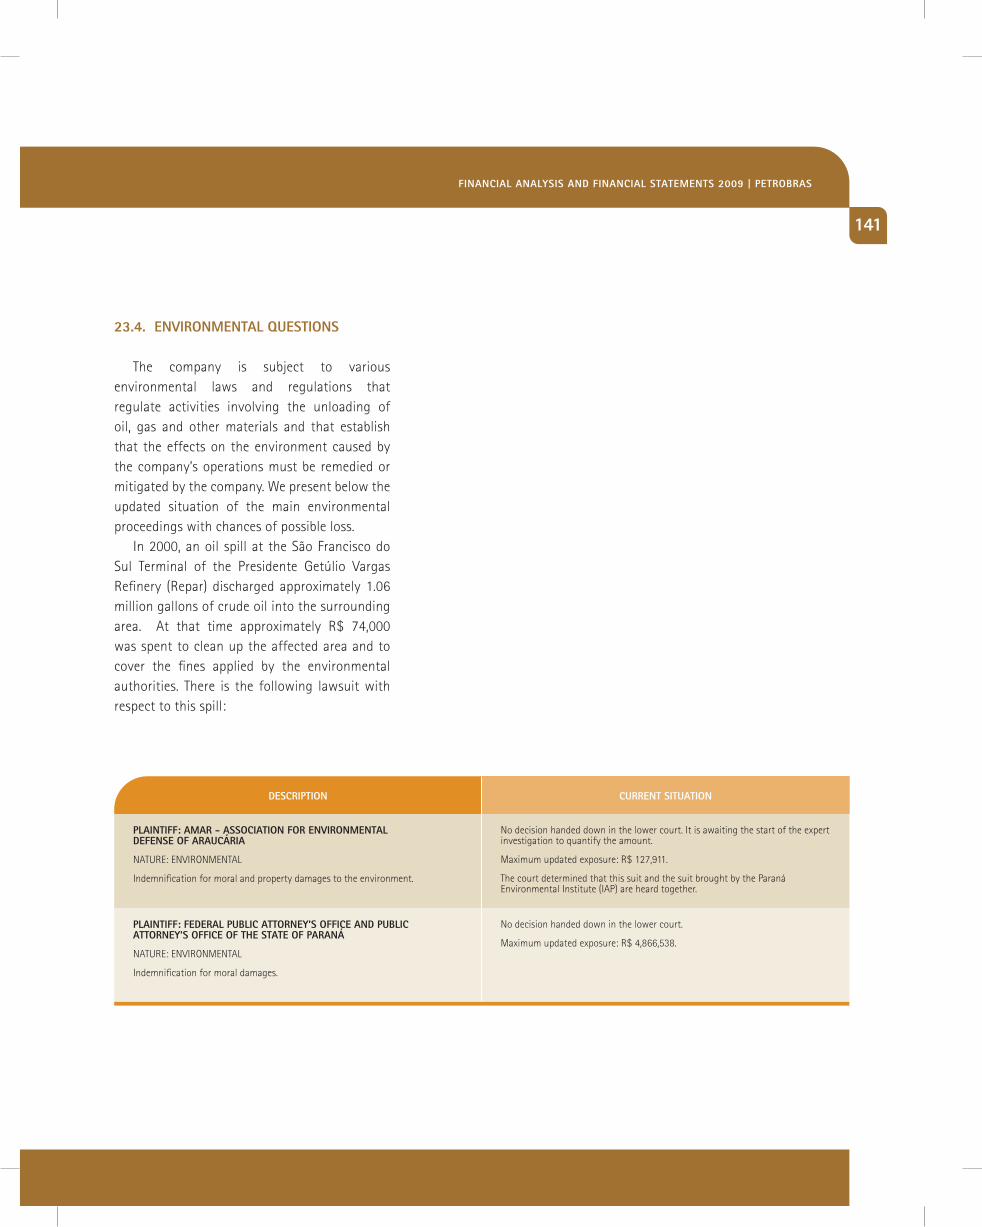
141
23.4. enViROnmental qUestiOns
the company is subject to various environmental laws and regulations that regulate activities involving the unloading of oil, gas and other materials and that establish that the effects on the environment caused by the company’s operations must be remedied or mitigated by the company. We present below the updated situation of the main environmental proceedings with chances of possible loss.
in 2000, an oil spill at the São Francisco do Sul terminal of the presidente getúlio Vargas refinery (repar) discharged approximately 1.06 million gallons of crude oil into the surrounding area. at that time approximately r$ 74,000 was spent to clean up the affected area and to cover the fines applied by the environmental authorities. there is the following lawsuit with respect to this spill:
no decision handed down in the lower court. it is awaiting the start of the expert investigation to quantify the amount.
maximum updated exposure: r$ 127,911.
the court determined that this suit and the suit brought by the paraná Environmental institute (iap) are heard together.
no decision handed down in the lower court.
maximum updated exposure: r$ 4,866,538.
descRiPtiOn cURRent sitUatiOn
PlaintiFF: amaR - assOciatiOn FOR enViROnmental deFense OF aRaUcÁRia
naturE: EnVironmEntal
indemnification for moral and property damages to the environment.
PlaintiFF: FedeRal PUBlic attORney’s OFFice and PUBlic attORney’s OFFice OF the state OF PaRanÁ
naturE: EnVironmEntal
indemnification for moral damages.
Financial analysis And Financial statements 2009 | PetROBRas
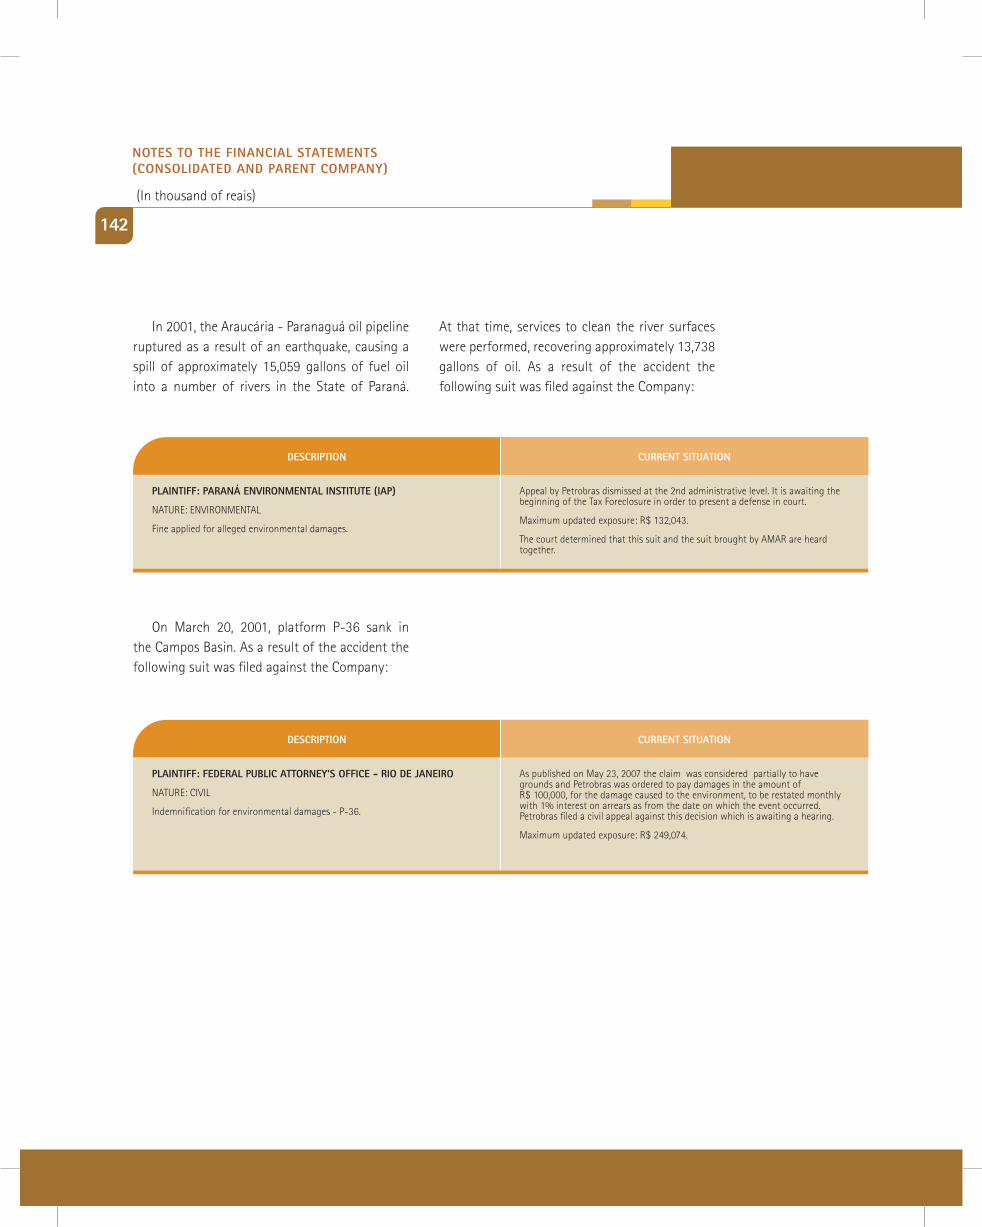
142
in 2001, the araucária - paranaguá oil pipeline ruptured as a result of an earthquake, causing a spill of approximately 15,059 gallons of fuel oil into a number of rivers in the State of paraná.
on march 20, 2001, platform p-36 sank in the campos basin. as a result of the accident the following suit was filed against the company:
at that time, services to clean the river surfaces were performed, recovering approximately 13,738 gallons of oil. as a result of the accident the following suit was filed against the company:
appeal by petrobras dismissed at the 2nd administrative level. it is awaiting the beginning of the tax Foreclosure in order to present a defense in court.
maximum updated exposure: r$ 132,043.
the court determined that this suit and the suit brought by amar are heard together.
descRiPtiOn cURRent sitUatiOn
PlaintiFF: PaRanÁ enViROnmental institUte (iaP)
naturE: EnVironmEntal
Fine applied for alleged environmental damages.
as published on may 23, 2007 the claim was considered partially to have grounds and petrobras was ordered to pay damages in the amount of r$ 100,000, for the damage caused to the environment, to be restated monthly with 1% interest on arrears as from the date on which the event occurred. petrobras filed a civil appeal against this decision which is awaiting a hearing.
maximum updated exposure: r$ 249,074.
descRiPtiOn cURRent sitUatiOn
PlaintiFF: FedeRal PUBlic attORney’s OFFice - RiO de janeiRO
naturE: ciVil
indemnification for environmental damages - p-36.
nOtes tO the Financial statements (cOnsOlidated and PaRent cOmPany)
(in thousand of reais)
143
23.5 asset cOntingencies
23.5.1 RecOVeRy OF Pis and cOFinspetrobras and its subsidiaries gaspetro,
transpetro and refap filed a civil suit against the Federal government before the judiciary of rio de janeiro, referring to recovery, through offsetting, of the amounts paid as piS on financial revenue and exchange gains in the period between February 1999 and november 2002 and coFinS between February 1999 and january 2004, in light of the ruling that paragraph 1 of article 3 of law 9.718/98 is unconstitutional.
on november 9, 2005, the Federal Supreme court considered that the aforementioned
paragraph 1 of article 3 of law 9.718/98 is unconstitutional. on january 9, 2006, in view of the final decision by the Federal Supreme court, petrobras filed a new suit aiming at recovering the coFinS related to the period from january 2003 to january 2004.
at december 31, 2009, the amounts of r$ 2,206,929 for petrobras, r$ 71,782 for gaspetro, r$ 27,481 for transpetro and r$ 13,718 for refap, with respect to the aforementioned suits, are not reflected in the financial statements due to the absence of a definitive favorable decision.
Financial analysis And Financial statements 2009 | PetROBRas
144
23.5.2 litigatiOns aBROad
a) in the United states - P-19 and P-31on july 25, 2002, braspetro oil Service company
(brasoil) and petrobras won related lawsuits filed with the uS lower courts by the insurance companies united States Fidelity & guaranty company and american home assurance company since 1997. a court decision by the Federal court of the Southern district of new york recognized the right of brasoil and petrobras to receive indemnity for losses and damages in the amount of uS$ 237 million, plus interest and reimbursement of legal expenses on the date of effective receipt related to the performance bond, totaling approximately uS$ 370 million. however, an appeal filed by the insurance companies removed the obligation by the insurance companies with respect to payment of the fine, legal fees and costs, thus reducing the amount of the indemnity to uS$ 245 million.
on july 21, 2006, the uS court handed down an executive decision, conditioning the payment of the amounts owed to brasoil to the permanent closing of legal proceedings involving identical claims in progress before the brazilian courts, which the parties proceeded to do.
b) in london - P-36in relation to the sinking of platform p-36 in
2001, in the contracts related to the building of the platform, brasoil and petrobras, in accordance with a mechanism agreed to contractually, were obliged to deposit the compensation, in the event of a claim, in favor of a security agent for payment to the creditors. litigation filed by creditors of part of these payments, which brasoil and petrobras
understand to be their rights, is in progress in the london courts.
at the current stage of the litigation, petromec, the contractual party involved, filed a claim against brasoil and petrobras on September 29, 2008 in the amount of uS$ 154 million, plus interest. the defense for brasoil and petrobras should be filed in the first quarter of 2010. the hearing of petromec’s claim should take place in the period between 2010 and 2011.
c) Other litigation for indemnificationin the construction/conversion of ships into
vessels for Floating production, Storage and offloading (FpSo) and Floating, Storage and offloading (FSo), brasoil transferred financial resources in the amount of uS$ 633 million, equivalent to r$ 1,102,929 at december 31, 2009 (r$ 1,460,583 at december 31, 2008) directly to its suppliers and subcontractors, with the aim of avoiding delays in the construction/conversion of vessels and, consequently, losses to brasoil.
based on the opinions of brasoil’s legal advisers, these expenditures are liable to reimbursement by the constructors, which is the reason why litigations for financial indemnification were filed in international courts. however, conservatively, the portion of this balance not covered by real guarantees, in the amount of uS$ 561 million, equivalent to r$ 977,490 at december 31, 2009 (r$ 1,292,222 at december 31, 2008) is recorded as an allowance for doubtful accounts.
nOtes tO the Financial statements (cOnsOlidated and PaRent cOmPany)
(in thousand of reais)
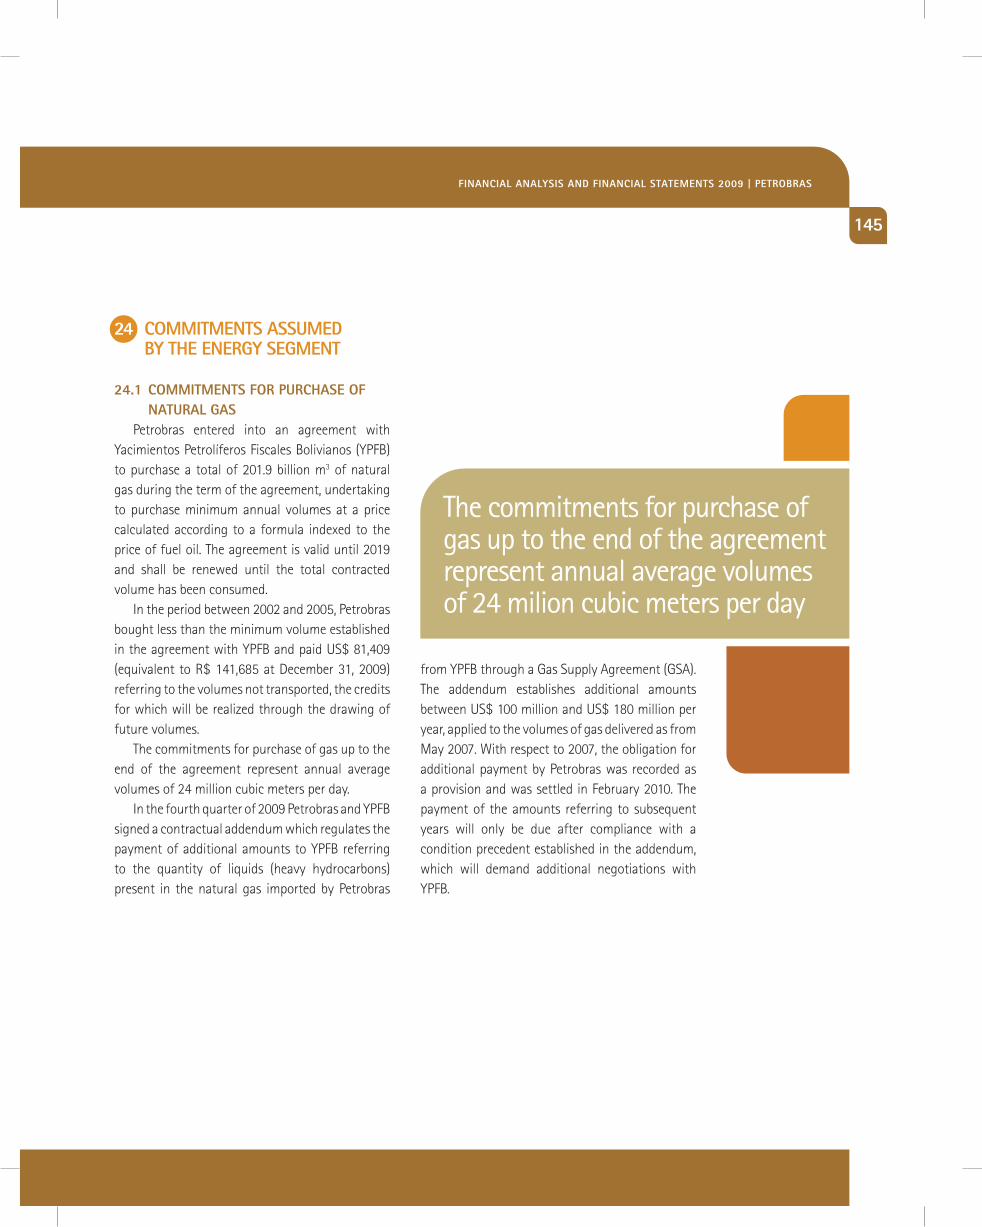
145
24 cOmmitments assUmed By the eneRgy segment
24.1 cOmmitments FOR PURchase OF natURal gas
petrobras entered into an agreement with yacimientos petrolíferos Fiscales bolivianos (ypFb) to purchase a total of 201.9 billion m3 of natural gas during the term of the agreement, undertaking to purchase minimum annual volumes at a price calculated according to a formula indexed to the price of fuel oil. the agreement is valid until 2019 and shall be renewed until the total contracted volume has been consumed.
in the period between 2002 and 2005, petrobras bought less than the minimum volume established in the agreement with ypFb and paid uS$ 81,409 (equivalent to r$ 141,685 at december 31, 2009) referring to the volumes not transported, the credits for which will be realized through the drawing of future volumes.
the commitments for purchase of gas up to the end of the agreement represent annual average volumes of 24 million cubic meters per day.
in the fourth quarter of 2009 petrobras and ypFb signed a contractual addendum which regulates the payment of additional amounts to ypFb referring to the quantity of liquids (heavy hydrocarbons) present in the natural gas imported by petrobras
from ypFb through a gas Supply agreement (gSa). the addendum establishes additional amounts between uS$ 100 million and uS$ 180 million per year, applied to the volumes of gas delivered as from may 2007. With respect to 2007, the obligation for additional payment by petrobras was recorded as a provision and was settled in February 2010. the payment of the amounts referring to subsequent years will only be due after compliance with a condition precedent established in the addendum, which will demand additional negotiations with ypFb.
The commitments for purchase of gas up to the end of the agreement represent annual average volumes of 24 milion cubic meters per day
Financial analysis And Financial statements 2009 | PetROBRas
25 gUaRantees FOR cOncessiOn agReements FOR PetROleUm exPlORatiOn
petrobras gave guarantees to the national petroleum agency (anp) in the total amount of r$ 4,100,403 for the minimum Exploration programs established in the concession agreements for exploration areas, with r$ 3,555,688, net of commitments already undertaken, remaining in force. of this amount, r$ 2,975,888 corresponds to a lien on the oil from previously identified fields already in production, and r$ 579,800 refers to bank guarantees.
26 segment RePORting
petrobras is an operationally integrated company and the major part of the production of petroleum and gas from the Exploration and production department is transferred to other departments of petrobras.
in the statements by business segment, the company’s operations are presented according to the new organization and management structure approved on october 23, 2000 by the board of directors of petrobras, comprising the following departments:
146
a) Exploration and production: this comprises, through petrobras, brasoil, pnbV, pifco, pib b.V., boc, the real Estate investment Fund and Special purpose Entities, the activities of exploration, production and development and production of oil, lng ( liquefied natural gas) and natural gas in brazil, for the purpose of supplying, as a priority, refineries in brazil and the selling of surplus petroleum and byproducts produced in their natural gas processing plants.b) Supply: this comprises, through petrobras, downstream (refap), transpetro, petroquisa, pifco, pib b.V., refinaria ipiranga, quattor participações and pnbV, refinaria abreu lima and Special purpose Entities, the activities of refining, logistics, transport and selling of oil products, petroleum and alcohol, as well as holding interests in petrochemical companies in brazil and in two fertilizer plants.c) gas and Energy: this comprises, through petrobras, gaspetro, petrobras comercializadora de Energia, petrobras distribuidora, pifco, gnl do nordeste, brasil pch, Specific purpose Entities and thermoelectric power Stations, the transport and trading of natural gas produced in brazil and imported, as well as the transport and trading of lng that is imported, the generation and trading of electric power, and holding interests in national gas transporters and distributors and in thermoelectric power stations.
nOtes tO the Financial statements (cOnsOlidated and PaRent cOmPany)
(in thousand of reais)
27 deRiVatiVe Financial instRUments, hedge and RisK management actiVities
the company is exposed to a series of market risks arising from its operations. these risks mainly involve the fact that eventual variations in the prices of oil and oil products, in exchange rates or in interest rates may negatively affect the value of the company’s financial assets and liabilities or future cash flows and profits.
147
d) distribution: it is responsible for the distribution of oil products, fuel alcohol and compressed natural gas in brazil, represented by the operations of petrobras distribuidora.e) international: it comprises, through pib b.V., pifco, 5283 participações, boc and petrobras, the activities of exploration and production of oil and gas, of supply, of gas and energy, and of distribution, carried out abroad in a number of countries in the americas, africa, Europe and asia.
the items that cannot be attributed to the other departments, notably those linked to corporate financial management, the overheads related to central administration and other expenses, including actuarial expenses related to the pension and health care plans for retired employees and pensioners, are allocated in the corporate agencies group. the business dealings with biofuels, represented mainly by the operations of petrobras biocombustível are also included in this group.
the accounting information per business segment was prepared based on the assumption of controllability, for the purpose of attributing to the business sectors only those items over which these segments have effective control.
Financial analysis And Financial statements 2009 | PetROBRas
148
27.1 RisK management OBjectiVes and stRategies
petrobras has a global risk management policy that it is being developed under the management of the company’s officers. in 2004, the Executive committee of petrobras set up the risk management committee composed of executive managers from all the business departments and from a number of corporate departments. this committee, as well as having the objective of assuring integrated management of exposures to risks and formalizing the main guidelines for the company’s operation, aims at concentrating information and discussing actions for risk management, facilitating communication with the executive offices and the board of directors in aspects related to best corporate governance practices.
the risk management policy of the petrobras System aims at contributing towards an appropriate balance between its objectives for growth and return and its level of risk exposure, whether inherent to the exercise of its activities or arising from the context within which it operates, so that, through effective allocation of its physical, financial and human resources the company may attain its strategic goals.
in addition to assuring adequate protection for its fixed assets, facilities, operations and officers and orientating financial, tax, regulatory, market and loan exposure evaluations, amongst others, the petrobras risk management policy seeks to make explicit its character of complementariness to its
27.2 maRKet RisK management OF Oil and Oil PROdUcts
a) hedge policyconsidering that the company’s business plan
uses conservative price assumptions and the fact that, in normal conditions, price fluctuations of commodities do not present a substantial risk to carrying out its strategic objectives, petrobras maintains exposure to the price cycle and does not use derivatives for hedging systemic operations, i.e. the purchase or sale of goods with the purpose of meeting the operating needs of the petrobras System.
nevertheless, the decisions referring to this issue are reviewed periodically and recommended to the risk management committee. if hedge is indicated, in scenarios with a significant probability of adverse events, the hedge strategy should be carried out with the aim of protecting
In 2004, the Executive Committee of Petrobras set up the Risk Management Committee composed of executive managers
structural actions, which will create solid economic and financial grounds, capable of assuring that the opportunities for growth will be taken advantage of, even in adverse external circumstances.
nOtes tO the Financial statements (cOnsOlidated and PaRent cOmPany)
(in thousand of reais)
149
the company’s solvency and liquidity, considering an integrated analysis of all the company’s risk exposures and assuring the execution of the corporate investment plan.
Following the assumption of considering only the consolidated net exposure of the price risk of oil and oil products, the operations with derivatives, generally, are limited to protecting the results of transactions carried out on the international market for physical goods, i.e. hedge operations are those where the positive and negative changes are totally or partially offset by the opposite result in the physical position.
b) main transactions and future commitments that are the object of hedge
the main hedge operations carried out by the companies of the petrobras System are intended to protect the expected results of the transactions performed abroad.
accordingly, the hedges are usually short-term operations and accompany the terms of the commercial transactions. the instruments used are futures, forward, swap and options contracts. the operations are carried out on the new york mercantile Exchange (nymEx) and the intercontinental Exchange (icE), as well as on the international over-the-counter market.
c) Parameters used for risk management and results obtained with respect to the proposed objectives
the main parameters used in risk management for variations of petrobras’ oil and oil product prices are the cash flow at risk (cFar) for medium-term assessments, and Value at risk (Var) and Stop loss for short-term assessments. corporate limits are defined for Var and Stop loss.
the hedges settled in 2009 corresponded to approximately 17% of the traded volume of imports and exports from brazil plus the total volume of the products traded abroad, opposite (40%) during the period from january to december 2008.
d) criteria for determining fair valuethe fair value of the derivatives for oil and oil
products is determined through prices quoted on the market (without adjustments) for similar assets or liabilities.
e) notional and fair values and values at risk of the portfolio
the main counterparties of operations for derivatives for oil and oil products are the new york Stock Exchange (nymEx), intercontinental Exchange, bp north america, chicago, morgan Stanley and total S.a.
Financial analysis And Financial statements 2009 | PetROBRas
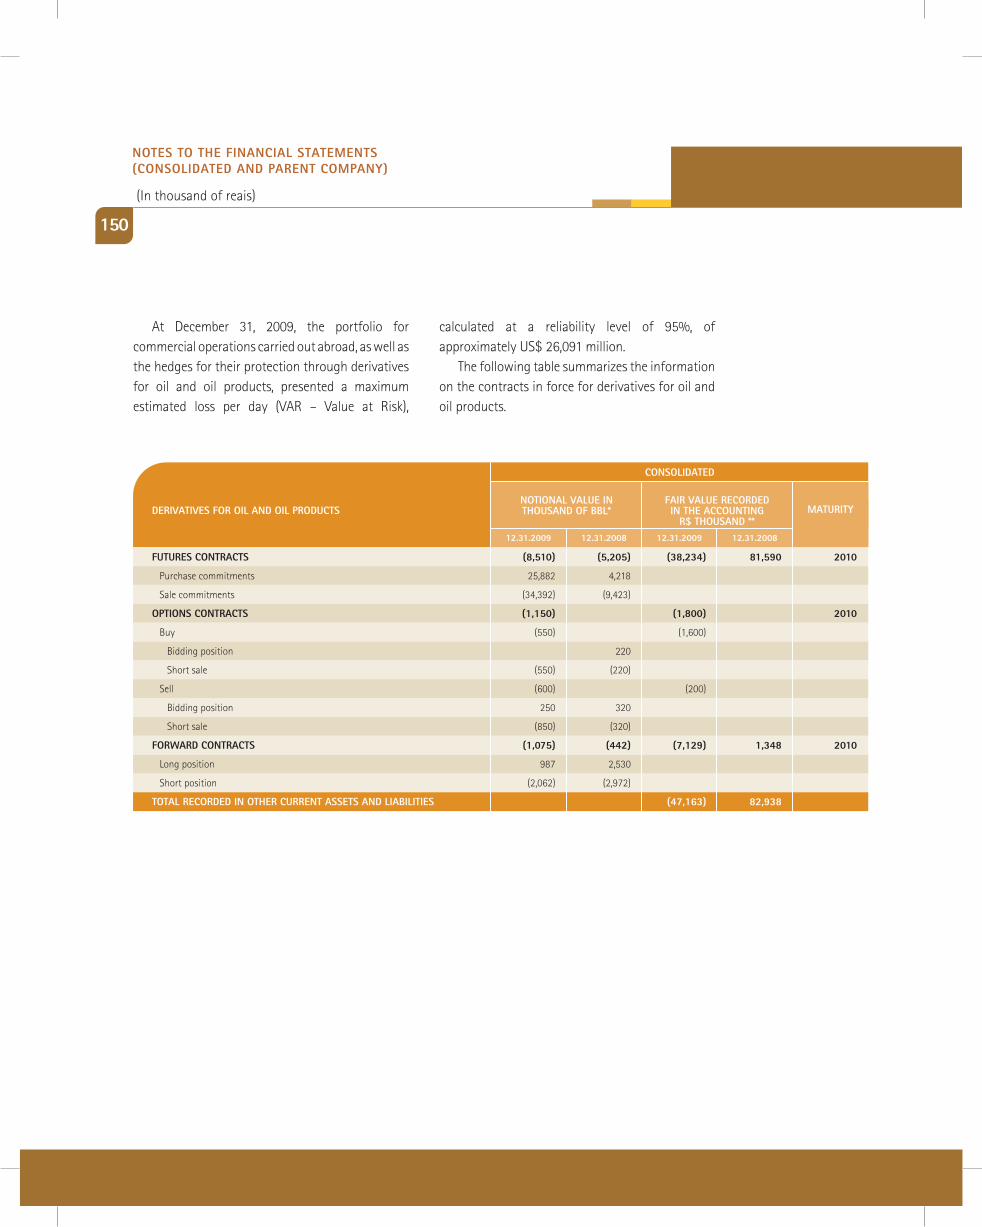
150
at december 31, 2009, the portfolio for commercial operations carried out abroad, as well as the hedges for their protection through derivatives for oil and oil products, presented a maximum estimated loss per day (Var – Value at risk),
calculated at a reliability level of 95%, of approximately uS$ 26,091 million.
the following table summarizes the information on the contracts in force for derivatives for oil and oil products.
cOnsOlidated
FUtURes cOntRacts (8,510) (5,205) (38,234) 81,590 2010
purchase commitments 25,882 4,218
Sale commitments (34,392) (9,423)
OPtiOns cOntRacts (1,150) (1,800) 2010
buy (550) (1,600)
bidding position 220
Short sale (550) (220)
Sell (600) (200)
bidding position 250 320
Short sale (850) (320)
FORwaRd cOntRacts (1,075) (442) (7,129) 1,348 2010
long position 987 2,530
Short position (2,062) (2,972)
tOtal RecORded in OtheR cURRent assets and liaBilities (47,163) 82,938
nOtiOnal ValUe in thOUsand OF BBl*
FaiR ValUe RecORded in the accOUnting
R$ thOUsand **matURity
12.31.2009 12.31.2008 12.31.2009 12.31.2008
deRiVatiVes FOR Oil and Oil PROdUcts
nOtes tO the Financial statements (cOnsOlidated and PaRent cOmPany)
(in thousand of reais)
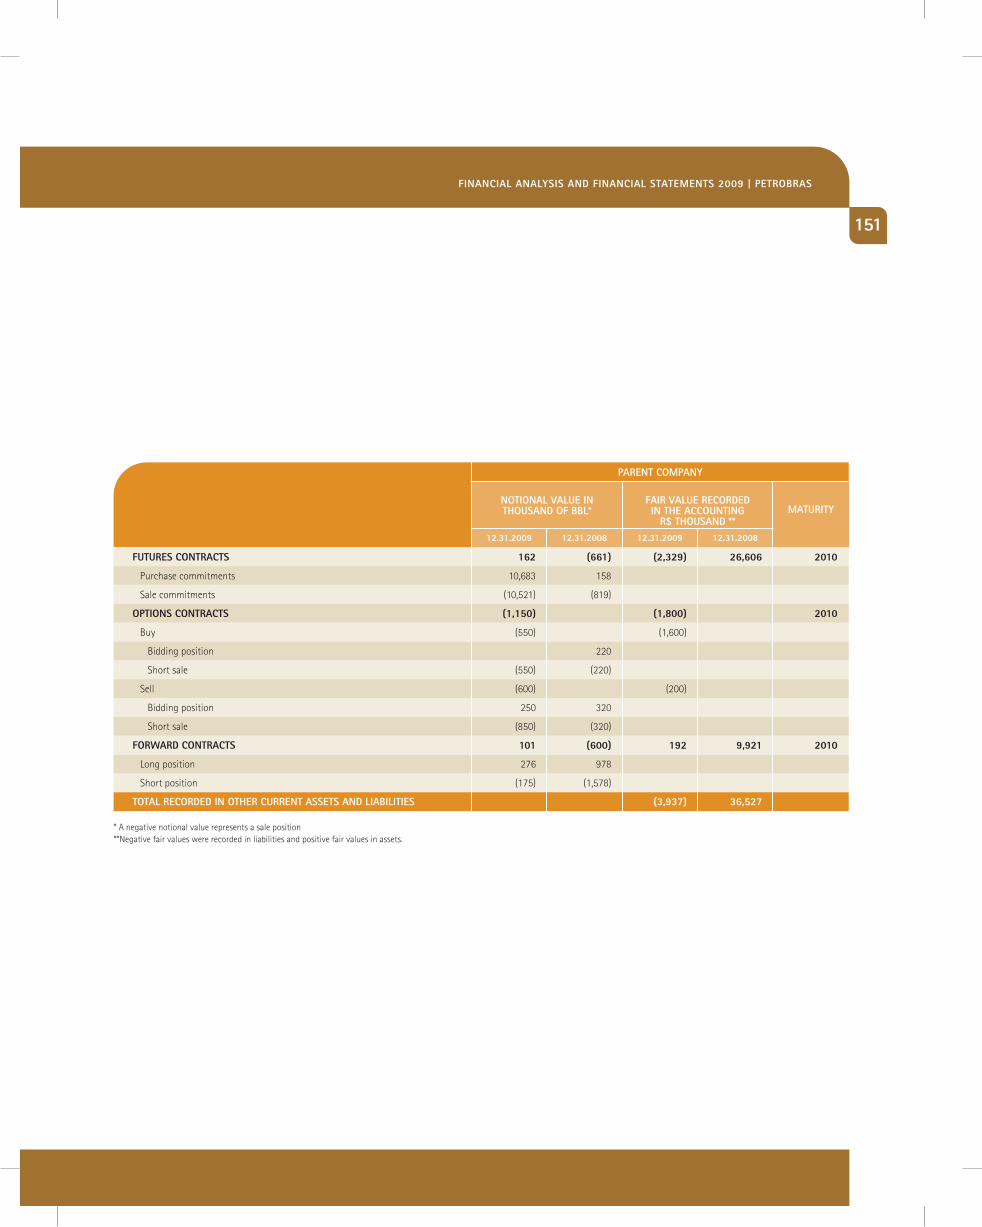
151
PaRent cOmPany
FUtURes cOntRacts 162 (661) (2,329) 26,606 2010
purchase commitments 10,683 158
Sale commitments (10,521) (819)
OPtiOns cOntRacts (1,150) (1,800) 2010
buy (550) (1,600)
bidding position 220
Short sale (550) (220)
Sell (600) (200)
bidding position 250 320
Short sale (850) (320)
FORwaRd cOntRacts 101 (600) 192 9,921 2010
long position 276 978
Short position (175) (1,578)
tOtal RecORded in OtheR cURRent assets and liaBilities (3,937) 36,527
nOtiOnal ValUe in thOUsand OF BBl*
FaiR ValUe RecORded in the accOUnting
R$ thOUsand **matURity
12.31.2009 12.31.2008 12.31.2009 12.31.2008
* a negative notional value represents a sale position**negative fair values were recorded in liabilities and positive fair values in assets.
Financial analysis And Financial statements 2009 | PetROBRas
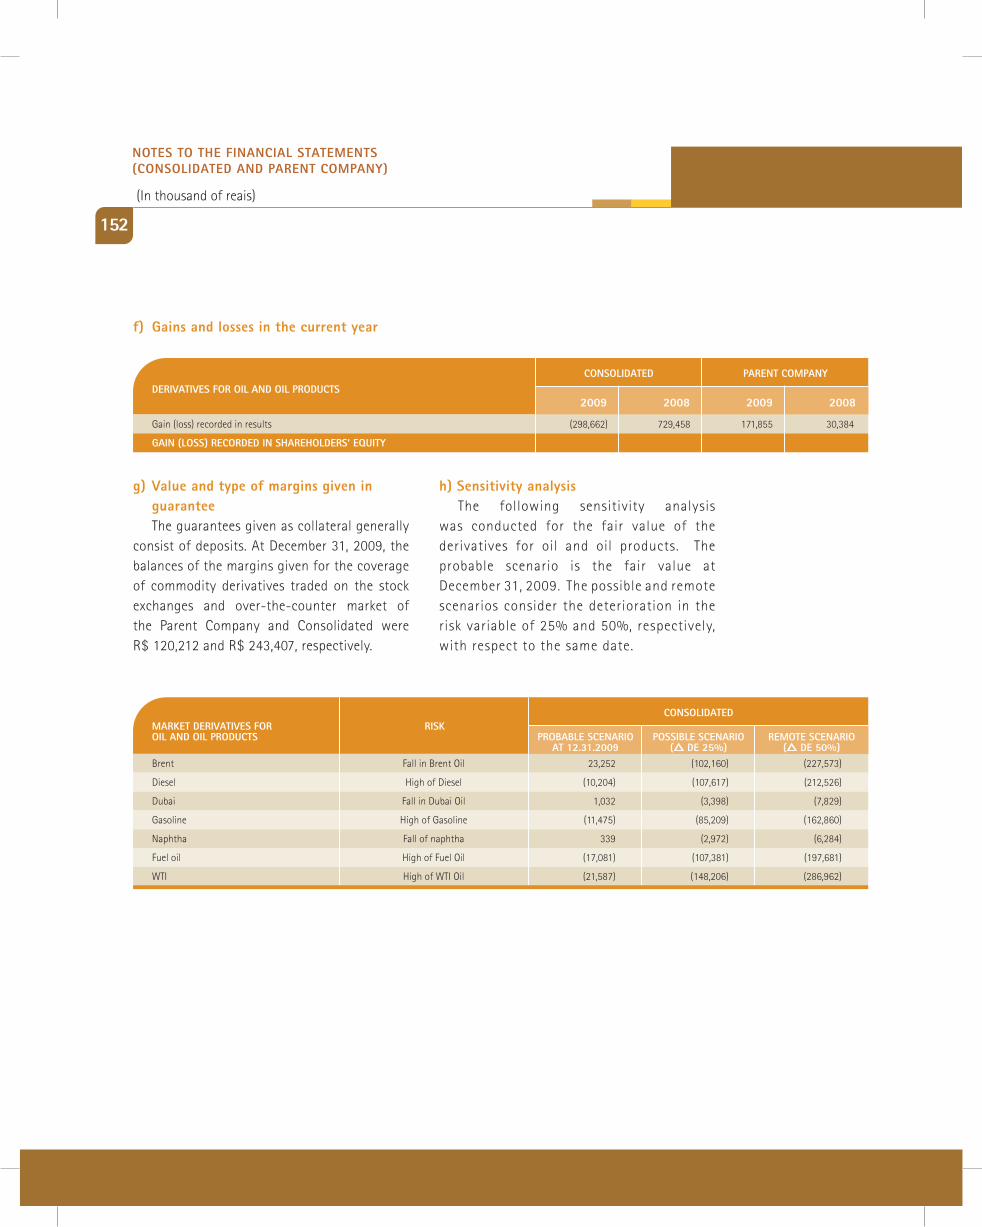
152
f) gains and losses in the current year
cOnsOlidated
gain (loss) recorded in results (298,662) 729,458 171,855 30,384
gain (lOss) RecORded in shaRehOldeRs’ eqUity
2009 2008 2009 2008
PaRent cOmPanydeRiVatiVes FOR Oil and Oil PROdUcts
g) Value and type of margins given in guarantee
the guarantees given as collateral generally consist of deposits. at december 31, 2009, the balances of the margins given for the coverage of commodity derivatives traded on the stock exchanges and over-the-counter market of the parent company and consolidated were r$ 120,212 and r$ 243,407, respectively.
h) sensitivity analysisthe following sensitivity analysis
was conducted for the fair value of the derivatives for oil and oil products. the probable scenario is the fair value at december 31, 2009. the possible and remote scenarios consider the deterioration in the risk variable of 25% and 50%, respectively, with respect to the same date.
cOnsOlidated
brent Fall in brent oil 23,252 (102,160) (227,573)
diesel high of diesel (10,204) (107,617) (212,526)
dubai Fall in dubai oil 1,032 (3,398) (7,829)
gasoline high of gasoline (11,475) (85,209) (162,860)
naphtha Fall of naphtha 339 (2,972) (6,284)
Fuel oil high of Fuel oil (17,081) (107,381) (197,681)
Wti high of Wti oil (21,587) (148,206) (286,962)
RemOte scenaRiO (r de 50%)
POssiBle scenaRiO (r de 25%)
PROBaBle scenaRiO at 12.31.2009
RisKmaRKet deRiVatiVes FOR Oil and Oil PROdUcts
nOtes tO the Financial statements (cOnsOlidated and PaRent cOmPany)
(in thousand of reais)
153
27.3 management OF exchange RisKsa) hedge policy
Exchange risk is one of the financial risks that the company is exposed to and it originates from changes in the levels or volatility of the exchange rate. With respect to the management of these risks, petrobras seeks to identify and address them in an integrated manner, seeking to assure efficient allocation of the resources earmarked for the hedge.
taking advantage of operating in an integrated manner in the energy segment, the company seeks, primarily, to identify or create natural hedges, i.e. to benefit from the correlation between its income and expenses. in the specific case of exchange variation inherent to contracts where the cost and remuneration involve different currencies, this hedge is provided through allocating the cash investments between the real and the uS dollar or another currency.
the management of risks is done for the net exposure. periodic analyses of the exchange risk are prepared, assisting the decisions of the executive committee. the exchange risk management strategy involves the use of derivative instruments to minimize the exchange exposure of certain obligations of the company.
the subsidiary petrobras distribuidora carries out exchange hedge operations for covering the trading margins inherent to exports (aviation segment) for foreign clients. the purpose of the operation, contracted concomitantly with the definition of the cost of the products exported, is to assure that the trading margins agreed to with the foreign clients are maintained during the period of validity of the negotiated prices, as well as during the commercial term for payment. the internal policy limits the volume of exchange hedge
operations to the volume of products exported.rEFap has a policy of using swaps (uS$ vs. cdi)
for reducing exchange exposure. the Exchange hedge committee evaluates the risks that the company is exposed to and recommends carrying out operations for contracting exchange hedge for future settlement at the cost of the interbank deposit certificate (cdi), plus the exchange coupon. the exclusive purpose of the policy is to reduce exchange exposure.
refinaria de petróleo riograndense uses an exchange hedge operation, through ndFs (non-deliverable forwards), to assure the margin in its refining activities. this occurs because the refinery makes oil purchases according to the quotation of the barrel on the international market, translated into reais based on the exchange rate of the uS dollar on the day of effective payment to the supplier, regardless of whether this oil is brazilian or imported. on the other hand, it sells the main quantities of its refining directly in reais, especially because of the market characteristics of diesel and gasoline. accordingly, the purpose of the hedge is to mitigate the risks of exchange volatility at the time of settlement of the purchase of petroleum.
b) main transactions and future commitments that are the object of hedge
in September 2006, the company, through its subsidiary pifco, contracted a hedge known as a cross currency swap for coverage of the bonds issued in yens in order to fix the company’s costs in this operation in dollars. in a cross currency swap there is an exchange of interest rates in different currencies. the exchange rate of the yen for the uS
Financial analysis And Financial statements 2009 | PetROBRas
dollar is fixed at the beginning of the transaction and remains fixed during its existence. the company does not intend to settle these contracts before the end of the term. For this relationship between the derivative and the loan, the company adopted hedge accounting.
petrobras distribuidora is in a short position in exchange futures rates through ndFs on the brazilian over-the-counter market. For the aviation segment, which represents 98% of the operations contracted for the period, the term of exposure is three months on average and the hedge is contracted concomitantly with the definition of the cost of the exported aviation kerosene, thus fixing and assuring the trading margin. in the period in question operations were contracted in the amount of uS$ 309.6 million.
at december 31, 2009, rEFap did not have any outstanding transactions with derivatives.
c) Parameters used for risk management and results obtained with respect to the proposed objectives
the hedge known as a cross currency swap complies with cVm resolution 566/08 which approved cpc 14 - Financial instruments: recognition, measurement and Evidence.
the company decided to qualify its cash flow cross currency hedging. upon the contracting of hedge and during its term, it is expected that
154
the cash flow hedge will be a highly effective in offsetting the cash flows attributable to the hedge risk during the term of the operation. the changes in the fair value, in the measure of the effectiveness of the hedge, tested quarterly, are stated in other comprehensive retained earnings, until the cash flow of the item subject to hedge is realized.
petrobras distribuidora is in a short position in exchange futures rates through ndFs on the brazilian over-the-counter market. the hedge is contracted concomitantly with the definition of the cost of the exported products, thus fixing and guaranteeing the trading margin. the company’s policy is to contract hedge up to the maximum of 100% of the volume exported.
the volume of hedge contracted for international billing in 2009 represented 66% of all the volume exported by the petrobras distribuidora in the year. the settlements of all the operations that matured between january 1 and december 31, 2009 generated a positive result for the company of r$ 38,088.
ipiranga asfaltos also contracted ndFs in the short position in dollars to guarantee revenues in reais from foreign clients with credit cards. in 2009 operations were contracted in the total amount of uS$ 3.9 million. in the same period, the settlements that occurred generated a positive result of r$ 365.
nOtes tO the Financial statements (cOnsOlidated and PaRent cOmPany)
(in thousand of reais)
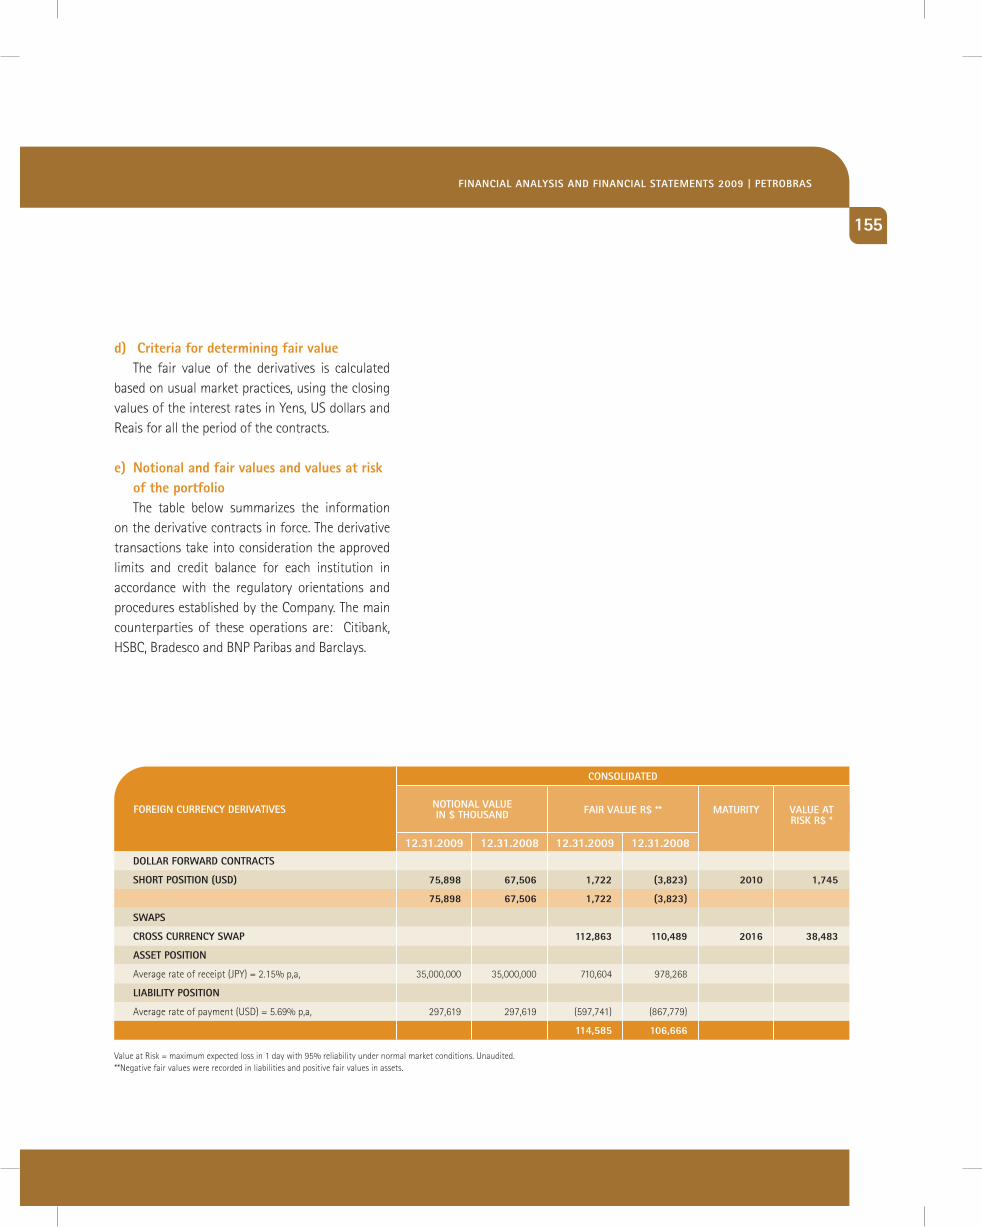
155
d) criteria for determining fair valuethe fair value of the derivatives is calculated
based on usual market practices, using the closing values of the interest rates in yens, uS dollars and reais for all the period of the contracts.
e) notional and fair values and values at risk of the portfolio
the table below summarizes the information on the derivative contracts in force. the derivative transactions take into consideration the approved limits and credit balance for each institution in accordance with the regulatory orientations and procedures established by the company. the main counterparties of these operations are: citibank, hSbc, bradesco and bnp paribas and barclays.
cOnsOlidated
dOllaR FORwaRd cOntRacts
shORt POsitiOn (Usd) 75,898 67,506 1,722 (3,823) 2010 1,745
75,898 67,506 1,722 (3,823)
swaPs
cROss cURRency swaP 112,863 110,489 2016 38,483
asset POsitiOn
average rate of receipt (jpy) = 2.15% p,a, 35,000,000 35,000,000 710,604 978,268
liaBility POsitiOn
average rate of payment (uSd) = 5.69% p,a, 297,619 297,619 (597,741) (867,779)
114,585 106,666
nOtiOnal ValUe in $ thOUsand FaiR ValUe R$ ** matURity ValUe at
RisK R$ *
12.31.2009 12.31.2008 12.31.2009 12.31.2008
Value at risk = maximum expected loss in 1 day with 95% reliability under normal market conditions. unaudited.**negative fair values were recorded in liabilities and positive fair values in assets.
FOReign cURRency deRiVatiVes
Financial analysis And Financial statements 2009 | PetROBRas
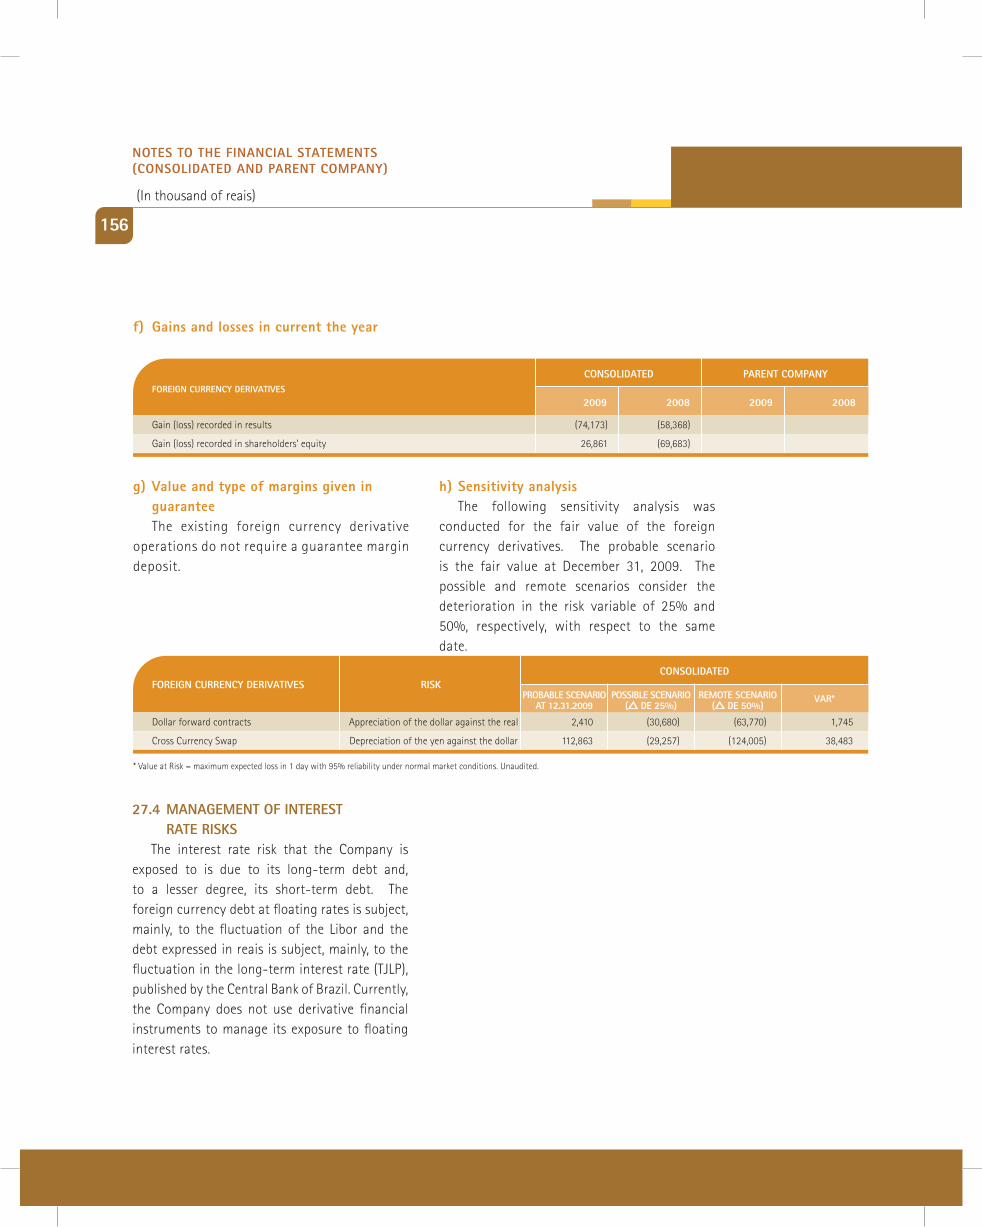
156
f) gains and losses in current the year
g) Value and type of margins given in guarantee
the existing foreign currency derivative operations do not require a guarantee margin deposit.
cOnsOlidated
gain (loss) recorded in results (74,173) (58,368)
gain (loss) recorded in shareholders’ equity 26,861 (69,683)
2009 2008 2009 2008
PaRent cOmPanyFOReign cURRency deRiVatiVes
h) sensitivity analysisthe following sensitivity analysis was
conducted for the fair value of the foreign currency derivatives. the probable scenario is the fair value at december 31, 2009. the possible and remote scenarios consider the deterioration in the risk variable of 25% and 50%, respectively, with respect to the same date.
cOnsOlidated
dollar forward contracts appreciation of the dollar against the real 2,410 (30,680) (63,770) 1,745
cross currency Swap depreciation of the yen against the dollar 112,863 (29,257) (124,005) 38,483
RemOte scenaRiO(r de 50%)
VaR*POssiBle scenaRiO(r de 25%)
PROBaBle scenaRiO at 12.31.2009
RisKFOReign cURRency deRiVatiVes
* Value at risk = maximum expected loss in 1 day with 95% reliability under normal market conditions. unaudited.
27.4 management OF inteRest Rate RisKs
the interest rate risk that the company is exposed to is due to its long-term debt and, to a lesser degree, its short-term debt. the foreign currency debt at floating rates is subject, mainly, to the fluctuation of the libor and the debt expressed in reais is subject, mainly, to the fluctuation in the long-term interest rate (tjlp), published by the central bank of brazil. currently, the company does not use derivative financial instruments to manage its exposure to floating interest rates.
nOtes tO the Financial statements (cOnsOlidated and PaRent cOmPany)
(in thousand of reais)
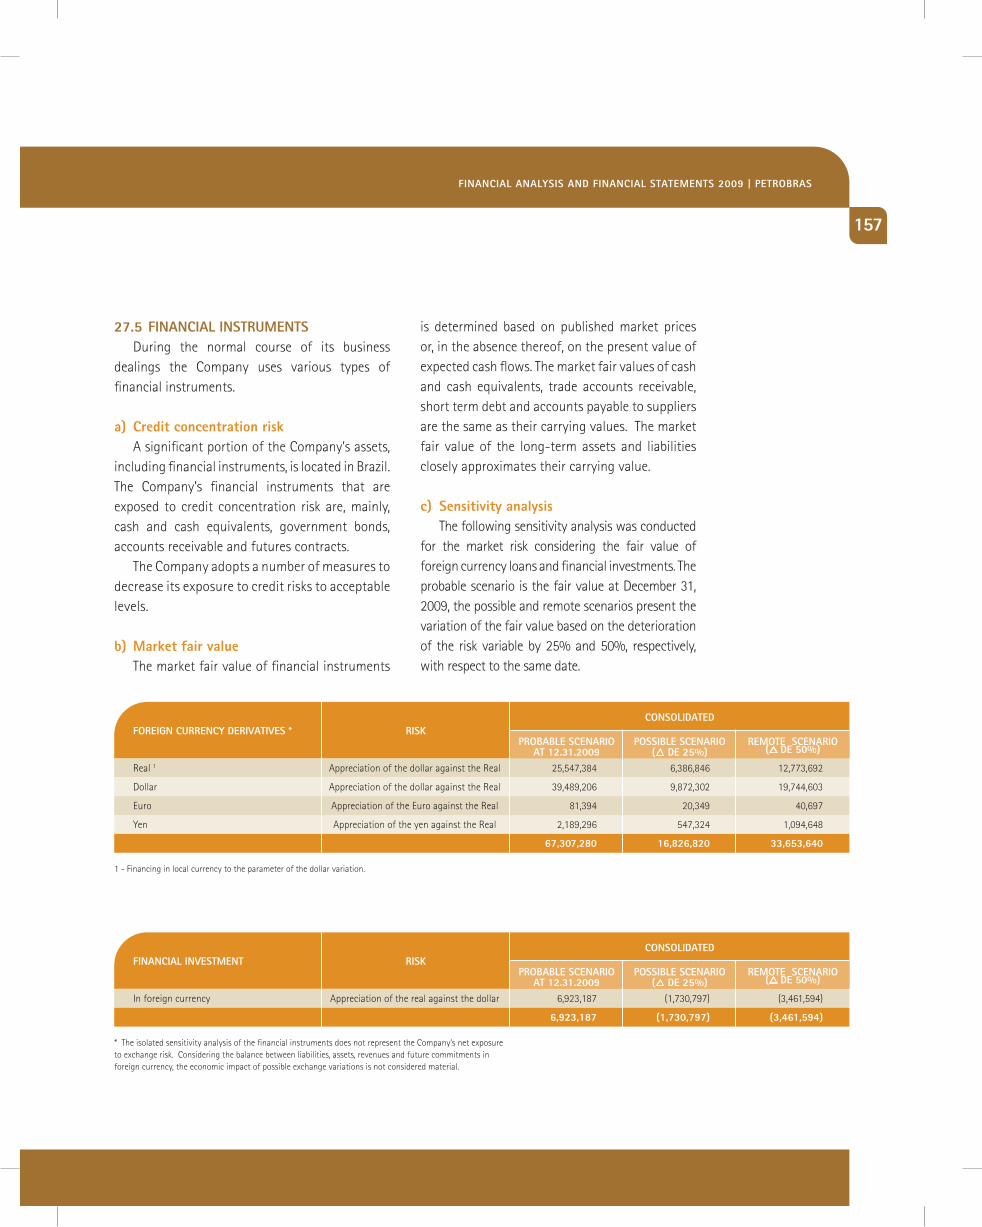
157
cOnsOlidated
real 1 appreciation of the dollar against the real 25,547,384 6,386,846 12,773,692
dollar appreciation of the dollar against the real 39,489,206 9,872,302 19,744,603
Euro appreciation of the Euro against the real 81,394 20,349 40,697
yen appreciation of the yen against the real 2,189,296 547,324 1,094,648
67,307,280 16,826,820 33,653,640
RemOte scenaRiO (r de 50%)
POssiBle scenaRiO(r de 25%)
PROBaBle scenaRiO at 12.31.2009
RisKFOReign cURRency deRiVatiVes *
1 - Financing in local currency to the parameter of the dollar variation.
Financial analysis And Financial statements 2009 | PetROBRas
is determined based on published market prices or, in the absence thereof, on the present value of expected cash flows. the market fair values of cash and cash equivalents, trade accounts receivable, short term debt and accounts payable to suppliers are the same as their carrying values. the market fair value of the long-term assets and liabilities closely approximates their carrying value.
c) sensitivity analysisthe following sensitivity analysis was conducted
for the market risk considering the fair value of foreign currency loans and financial investments. the probable scenario is the fair value at december 31, 2009, the possible and remote scenarios present the variation of the fair value based on the deterioration of the risk variable by 25% and 50%, respectively, with respect to the same date.
27.5 Financial instRUmentsduring the normal course of its business
dealings the company uses various types of financial instruments.
a) credit concentration risk a significant portion of the company’s assets,
including financial instruments, is located in brazil. the company’s financial instruments that are exposed to credit concentration risk are, mainly, cash and cash equivalents, government bonds, accounts receivable and futures contracts.
the company adopts a number of measures to decrease its exposure to credit risks to acceptable levels.
b) market fair valuethe market fair value of financial instruments
cOnsOlidated
in foreign currency appreciation of the real against the dollar 6,923,187 (1,730,797) (3,461,594)
6,923,187 (1,730,797) (3,461,594)
RemOte scenaRiO (r de 50%)
POssiBle scenaRiO(r de 25%)
PROBaBle scenaRiO at 12.31.2009
RisKFinancial inVestment
* the isolated sensitivity analysis of the financial instruments does not represent the company’s net exposure to exchange risk. considering the balance between liabilities, assets, revenues and future commitments in foreign currency, the economic impact of possible exchange variations is not considered material.
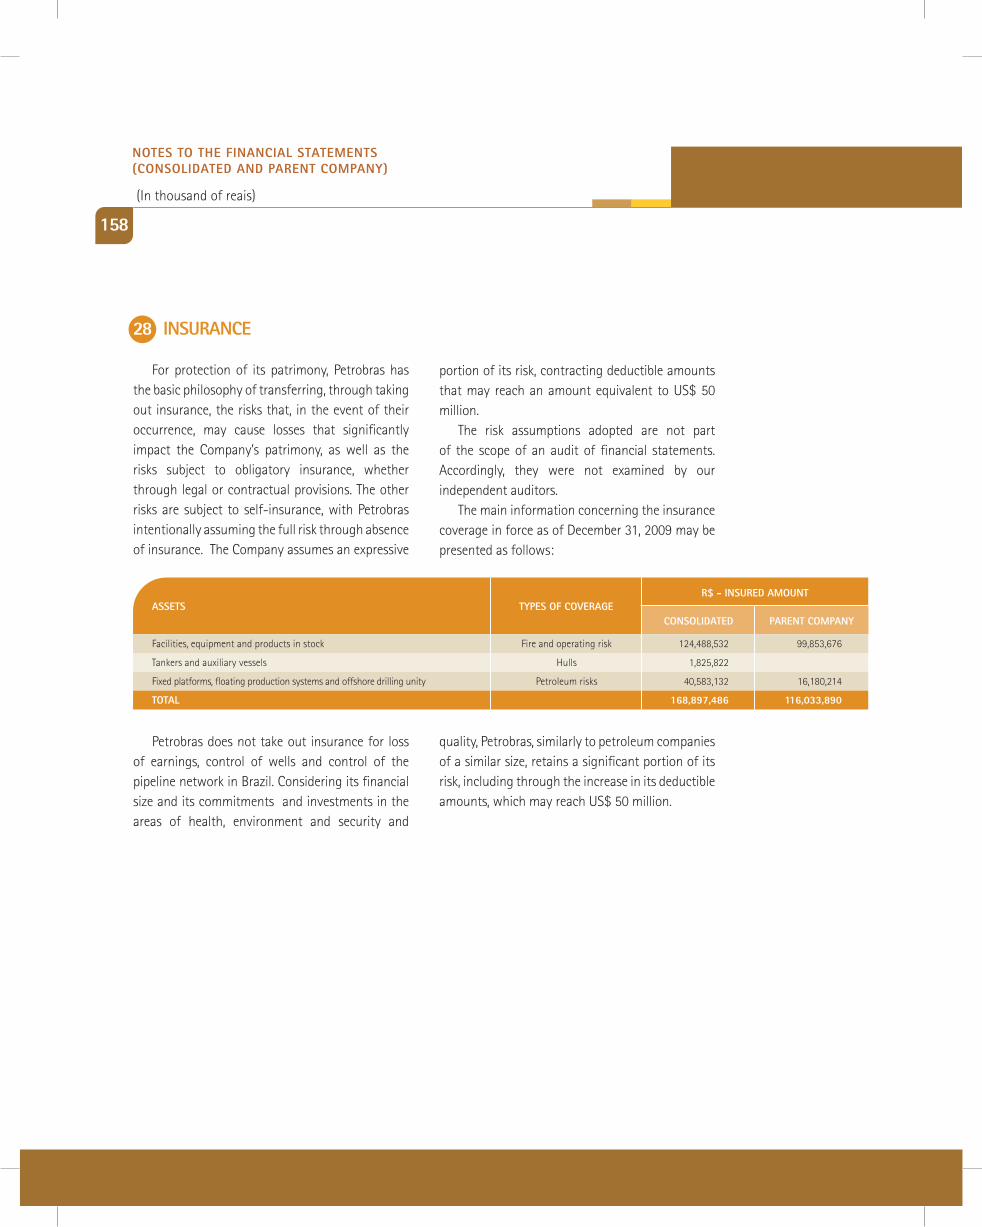
158
28 insURance
For protection of its patrimony, petrobras has the basic philosophy of transferring, through taking out insurance, the risks that, in the event of their occurrence, may cause losses that significantly impact the company’s patrimony, as well as the risks subject to obligatory insurance, whether through legal or contractual provisions. the other risks are subject to self-insurance, with petrobras intentionally assuming the full risk through absence of insurance. the company assumes an expressive
portion of its risk, contracting deductible amounts that may reach an amount equivalent to uS$ 50 million.
the risk assumptions adopted are not part of the scope of an audit of financial statements. accordingly, they were not examined by our independent auditors.
the main information concerning the insurance coverage in force as of december 31, 2009 may be presented as follows:
petrobras does not take out insurance for loss of earnings, control of wells and control of the pipeline network in brazil. considering its financial size and its commitments and investments in the areas of health, environment and security and
R$ - insURed amOUnt
Facilities, equipment and products in stock Fire and operating risk 124,488,532 99,853,676
tankers and auxiliary vessels hulls 1,825,822
Fixed platforms, floating production systems and offshore drilling unity petroleum risks 40,583,132 16,180,214
tOtal 168,897,486 116,033,890
PaRent cOmPanycOnsOlidatedtyPes OF cOVeRageassets
quality, petrobras, similarly to petroleum companies of a similar size, retains a significant portion of its risk, including through the increase in its deductible amounts, which may reach uS$ 50 million.
nOtes tO the Financial statements (cOnsOlidated and PaRent cOmPany)
(in thousand of reais)
159
29 secURity, enViROnment and health
in 2009, petrobras’ main security, environment and health indexes were compatible with the best companies in the sector worldwide and in the period it did not register any significant occurrence of oil spillage affecting the environment.
petrobras continually invests in training and development of new technologies aimed at accident prevention and the safety and health of its employees, which contributed to the fact the company continued for one more year – the fourth year in a row – to be among the companies that compose the dow jones Sustainability index (djSi).
the company’s total expenditure on security, environment and health (SmS), considering investments and operations, reached the amount of r$ 4,488,004 in 2009, of which r$ 2,238,734 was spent on security, r$ 1,875,065 was spent on the environment and r$ 374,203 was spent on health, where the expenses with multidisciplinary health assistance (amS) and support for outside environmental programs and/or projects are not included.
this total included the expenditures made through pEgaSo (program for Excellence in Environmental management and operating Security), which, between investments and operations, totaled r$ 598,577 in the year.
Financial analysis And Financial statements 2009 | PetROBRas
In the period it did not register any significant occurrence of oil spillage affecting the environment
160
30 PROnOUncements, inteRPRetatiOns and ORientatiOns that will cOme intO FORce in 2010
Within the process of convergence of accounting practices adopted in brazil with international standards (iFrS) 26 pronouncements, 12 interpretations and 1 orientation have been issued by the accounting pronouncements committee (cpc) and approved by the brazilian Securities commission (cVm) during 2009 to be applied as from fiscal year 2010, among which the following are highlighted:a) cPc 15 – Business combinations
it establishes that the acquiring company should recognize the acquired assets and liabilities resulting from a business combination at their respective fair values, valued on the date of acquisition.b) cPc 18 – investments in affiliated companies and subsidiaries
it specifies how the investments in affiliated companies should be recorded in the individual and consolidated financial statements of the investor and how investments in subsidiaries should be recorded in the financial statements of the parent company, where the innovation is the elimination on the part of the investor of profits and losses resulting from upstream and
downstream transactions between the investor (including its consolidated subsidiaries) and the affiliated company or subsidiary.c) cPc 19 – investment in joint-Ventures
it specifies how to record the interests in joint ventures and the disclosure of the assets, liabilities, revenues and expenses of these joint ventures in the financial statements of the investors, emphasizing that the investor only presents the gains and losses resulting from transactions with the joint venture that are attributable to the participation of the other entrepreneurs.d) cPc 20 – costs of loans
it defines which costs of loans are directly attributed to the acquisition, construction or production of qualifiable assets for their capitalization to form part of the cost of these assets. additionally, it permits capitalization of costs of loans without a specific destination, through an average weighted rate of the costs of the loans that were in effect in the period.e) cPc 26 – Presentation of the Financial statements
it defines the basis for presentation of the financial statements in order to ensure comparison
nOtes tO the Financial statements (cOnsOlidated and PaRent cOmPany)
(in thousand of reais)
161
with prior periods of the same entity, as well as the financial statements of other entities, introducing the comprehensive income statement as the main innovation.f) icPc 10 – interpretation of initial application to Property, Plant and equipment and to Property for investment of cPc technical Pronouncements 27, 28, 37 and 43
among the various explanations, it stresses the process for initial and periodic review of the depreciation rates for property, plant and equipment and the necessary requisites for this review.
in light of the above, the company is in the process of evaluating the potential effects with respect to these pronouncements and interpretation, as well and as the other pronouncements, interpretations and orientations issued during 2009 on the financial statements for the year ended december 31, 2009 to be presented for comparison purposes with the financial statements for the year ending december 31, 2010.
Financial analysis And Financial statements 2009 | PetROBRas
162
31 sUBseqUent eVents
31.1 inVestment agReement Between PetROBRas, PetROqUisa and OdeBRecht
on january 22, 2010 an investment agreement was entered into between petrobras, petroquisa and odebrecht, which establishes that the operation for integration of the petrochemical interests will be carried out through the following stages: (i) the formation of a holding company, brk investimentos petroquímicos S.a. (brk), which will hold all the common shares issued by braskem currently held by odebrecht, petroquisa and petrobras; (ii) financial resources allocated in brk, to be made in cash by odebrecht and petrobras; (iii) a capital increase from braskem to be made in the form of a private subscription by its shareholders; (iv) acquisition by braskem of the shares of quattor held by unipar; and (v) acquisition by braskem of 100% of the shares of unipar comercial e distribuidora S.a. (unipar comercial) and of 33.33% of the shares of polibutenos S.a. indústrias químicas (polibutenos); (vi) incorporation by braskem of the shares of quattor held by petrobras and petroquisa.
also on this date, odebrecht, petrobras, petroquisa and braskem executed an association agreement, the purpose of which is to regulate
its commercial and corporate relationship in the petrochemical complex of the State of rio de janeiro (compErj) and in the petrochemical complex of Suape (Suape complex). the joint-venture agreement establishes that braskem will assume the companies that develop the first and second petrochemical generations of compErj, and that it will also gradually acquire a share in the companies that develop the businesses of the Suape complex, in the terms and conditions agreed upon in the joint-venture agreement. these transactions are in harmony with the interests of odebrecht and petrobras to integrate their petrochemical interests in braskem.
in continuation of its restructuring operation, on February 11, 2010, W.b.W., a wholly owned subsidy of petroquisa, the holder of 31% of the voting capital of braskem, was taken over by brk. With this transaction, odebrecht and petrobras have begun the process for concentrating all their common shares issued by braskem in brk. as a result, brk is now the holder of common shares issued by braskem corresponding to 93.3% of its voting capital.
not later than april 5, 2010, petrobras will transfer r$ 2.5 billion to brk, which will participate with r$ 3.5 billion in the capital increase of braskem.
nOtes tO the Financial statements (cOnsOlidated and PaRent cOmPany)
(in thousand of reais)
163
31.2 PetROBRas BiOcOmBUstíVel acqUiRes an inteRest in an ethanOl ReFineRy
in january 2010, petrobras biocombustível paid r$ 65 million into the capital of total agroindústria canavieira S.a., in accordance with a commitment established in the minutes of the Special Shareholders’ general meeting of december 22, 2009, for paying in the amount of r$ 150 million until march 2011, when it will then hold 40.4% of the capital.
this initiative, in line with strategic planning for 2009-2013, inserts the company in the ethanol market. the partnership will make it viable to expand the refinery to a total capacity of 203 million liters per year, with surplus electric power of 38.5 mW for trading, generated through the use of sugar cane bagasse.
Financial analysis And Financial statements 2009 | PetROBRas
31.3 secOnd dRawdOwn OF Financing with the china deVelOPment BanK
on February 10, 2010, petrobras made the second drawdown in the amount of uS$ 2 billion with respect to the financing agreement entered into with the china development bank corporation (cdb) on november 3, 2009.
31.4 aUctiOns FOR sale OF natURal gas in shORt-teRm cOntRacts
on march 16, 2010 petrobras held the tenth electronic auction for natural gas, in which 16 natural gas distributors participated and bid for 6,87 million cubic meters per day. the sales were made in sub markets defined using the logistics characteristics of each region, where what is new is the gas interconnection of the Southeast and northeast regions through gasene, a gas pipeline which, according to management’s estimates, will enter into commercial operation in april 2010.
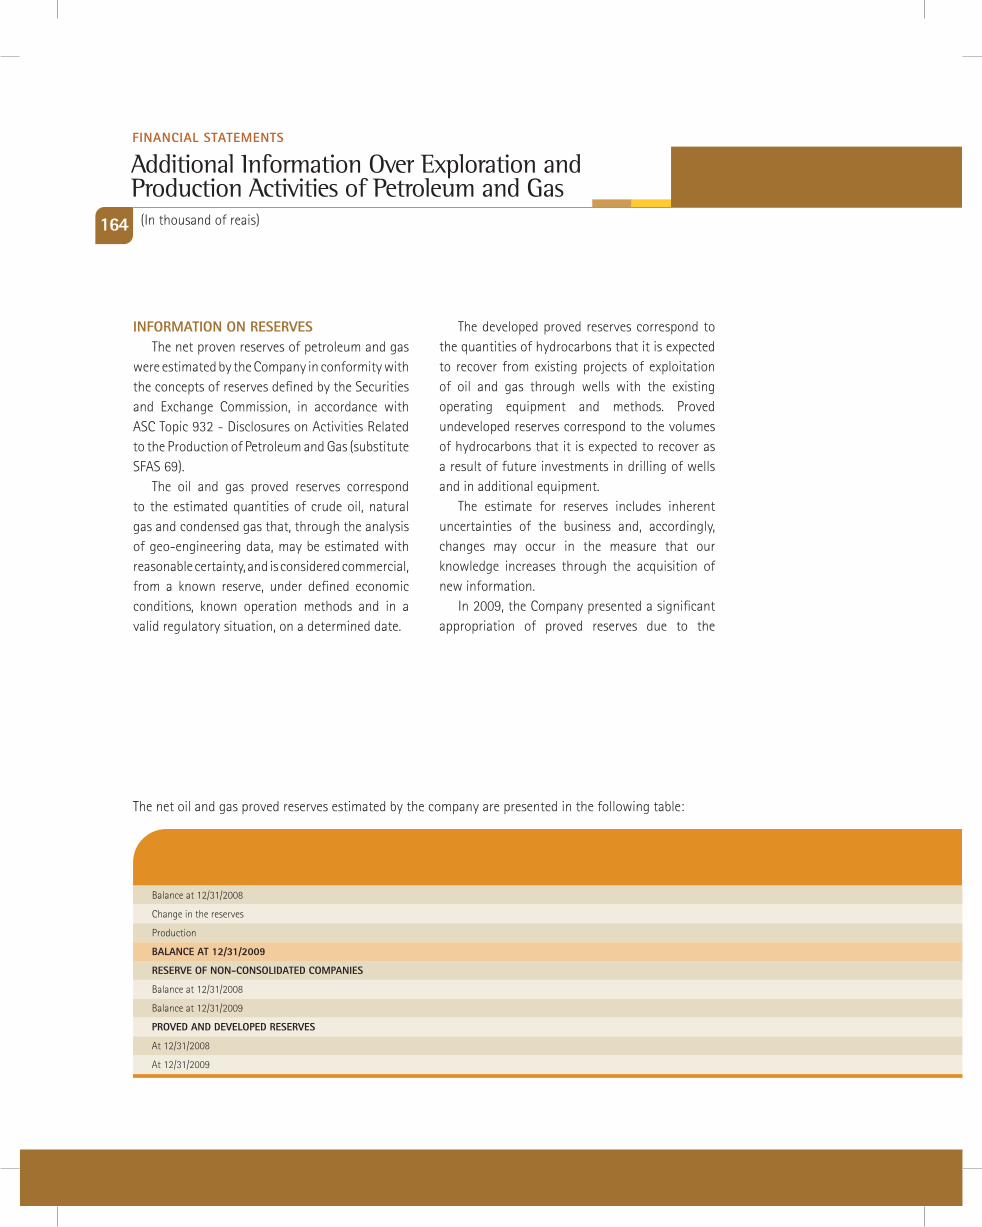
balance at 12/31/2008 8,716 0,390 9,106 247,643 79,100 326,743 10,274 0,856 11,130
change in the reserves 1,892 0,001 1,893 28,763 (41,251) (12,488) 2,074 (0,243) 1,831
production (0,689) (0,048) (0,737) (15,163) (6,041) (21,204) (0,785) (0,083) (0,868)
Balance at 12/31/2009 9,919 0,343 10,262 261,243 31,808 293,051 11,563 0,530 12,093
ReseRVe OF nOn-cOnsOlidated cOmPanies
balance at 12/31/2008 0,048 0,048 2,142 2,142 0,061 0,061
balance at 12/31/2009 0,040 0,040 1,787 1,787 0,051 0,051
PROVed and deVelOPed ReseRVes
at 12/31/2008 5,346 0,211 5,557 134,340 49,694 184,034 6,191 0,504 6,695
at 12/31/2009 6,121 0,202 6,323 142,627 15,709 158,336 7,019 0,295 7,314
164
inFORmatiOn On ReseRVesthe net proven reserves of petroleum and gas
were estimated by the company in conformity with the concepts of reserves defined by the Securities and Exchange commission, in accordance with aSc topic 932 - disclosures on activities related to the production of petroleum and gas (substitute SFaS 69).
the oil and gas proved reserves correspond to the estimated quantities of crude oil, natural gas and condensed gas that, through the analysis of geo-engineering data, may be estimated with reasonable certainty, and is considered commercial, from a known reserve, under defined economic conditions, known operation methods and in a valid regulatory situation, on a determined date.
the developed proved reserves correspond to the quantities of hydrocarbons that it is expected to recover from existing projects of exploitation of oil and gas through wells with the existing operating equipment and methods. proved undeveloped reserves correspond to the volumes of hydrocarbons that it is expected to recover as a result of future investments in drilling of wells and in additional equipment.
the estimate for reserves includes inherent uncertainties of the business and, accordingly, changes may occur in the measure that our knowledge increases through the acquisition of new information.
in 2009, the company presented a significant appropriation of proved reserves due to the
the net oil and gas proved reserves estimated by the company are presented in the following table:
(in thousand of reais)
Additional information over exploration and Production Activities of Petroleum and Gas
Financial statements
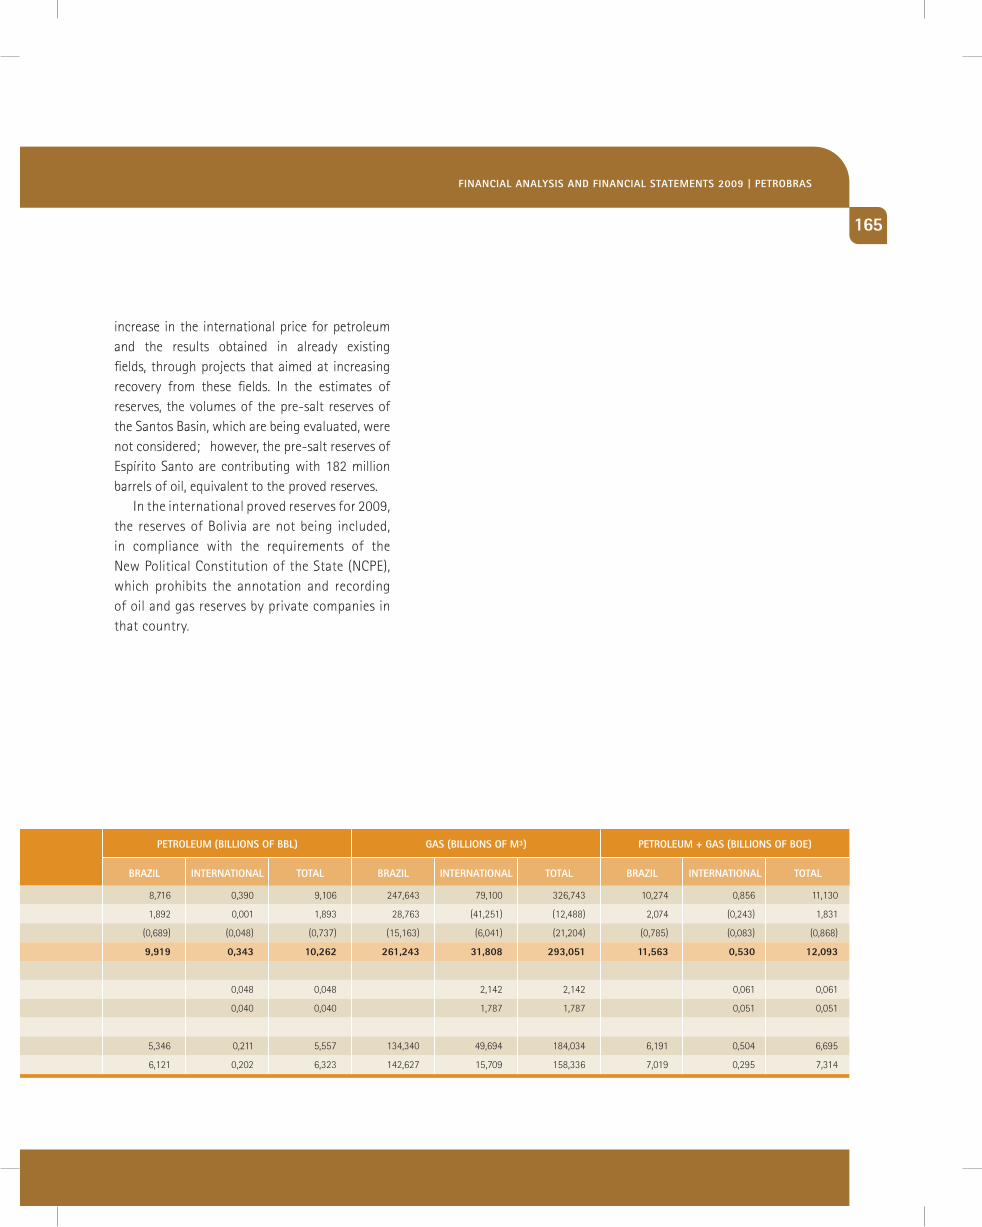
165
PetROleUm (BilliOns OF BBl) gas (BilliOns OF m³)
tOtal tOtal tOtalinteRnatiOnal inteRnatiOnal inteRnatiOnalBRazil BRazil BRazil
PetROleUm + gas (BilliOns OF BOe)
balance at 12/31/2008 8,716 0,390 9,106 247,643 79,100 326,743 10,274 0,856 11,130
change in the reserves 1,892 0,001 1,893 28,763 (41,251) (12,488) 2,074 (0,243) 1,831
production (0,689) (0,048) (0,737) (15,163) (6,041) (21,204) (0,785) (0,083) (0,868)
Balance at 12/31/2009 9,919 0,343 10,262 261,243 31,808 293,051 11,563 0,530 12,093
ReseRVe OF nOn-cOnsOlidated cOmPanies
balance at 12/31/2008 0,048 0,048 2,142 2,142 0,061 0,061
balance at 12/31/2009 0,040 0,040 1,787 1,787 0,051 0,051
PROVed and deVelOPed ReseRVes
at 12/31/2008 5,346 0,211 5,557 134,340 49,694 184,034 6,191 0,504 6,695
at 12/31/2009 6,121 0,202 6,323 142,627 15,709 158,336 7,019 0,295 7,314
increase in the international price for petroleum and the results obtained in already existing fields, through projects that aimed at increasing recovery from these fields. in the estimates of reserves, the volumes of the pre-salt reserves of the Santos basin, which are being evaluated, were not considered; however, the pre-salt reserves of Espírito Santo are contributing with 182 million barrels of oil, equivalent to the proved reserves.
in the international proved reserves for 2009, the reserves of bolivia are not being included, in compliance with the requirements of the new political constitution of the State (ncpE), which prohibits the annotation and recording of oil and gas reserves by private companies in that country.
Financial analysis And Financial statements 2009 | PetROBRas
BOaRd OF diRectORs
President dilma Vana rouSSEFF
membersFÁbio collEtti barboSaluciano galVÃo coutinhoFranciSco robErto dE albuquErquEjorgE gErdau johannpEtErSÉrgio Franklin quintEllaguido mantEgaJOSÉSERGIOGABRIELLIDEAZEVEDOSilaS rondEau caValcanti SilVa
execUtiVe cOmmittee
PresidentJOSÉSERGIOGABRIELLIDEAZEVEDO
chief Financial and investor Relations Officeralmir guilhErmE barbaSSa
director of gas and energy maria daS graÇaS SilVa FoStEr
director of exploration and Production guilhErmE dE oliVEira EStrElla
director of supplies paulo robErto coSta
international directorJORGELUIZZELADA
director of services RENATODESOUZADUQUE
accountantMARCOSMENEZEScrc-rj 35.286/o-1
166
RePORt OF Fiscal cOUncil
1. the Fiscal council of petróleo brasileiro S.a. - petrobras, in the exercise of their legal and statutory duties, during a meeting held on the date hereof, with justified absence of the councilor césar acosta rech, examined the management’s annual report, the Financial Statements, comprising the balance Sheet, Statement of income, Statement of changes in Stockholders’ Equity, Statement of cash Flows and Statement of added Value, the notes to the Financial Statements and independent auditors’ report for the Fiscal year ended on december 31, 2009.
2. the following proposals were verified, which are being submitted by petrobras management for approval by shareholders: a) submitted for deliberation in the general ordinary Shareholder’s meeting to be held on april 22, 2010: 1st) approval of the share to be paid to the company’s managers in the profits and results (plr) for the year 2009; 2nd) approval of the Financial Statements of petrobras (parent company and consolidated) for the fiscal year 2009; 3rd) approval of retained earnings under Shareholders’ Equity, in the retained Earnings reserve, in the amount of r$ 18,573 million, a portion of r$ 18,563 million derived from income for the financial year and r$ 10 million from the residual balance of retained earnings, partly intended to cover the annual investment program established in the 2010 capital budget, in the amount of r$ 58,031 million (r$ 47,919
million from own resources, and r$ 10,112 million of third party’s resources); and 4th) approval of allocation of net income, that considers a distribution of dividends for the 2009 fiscal year in the amount of r$ 8,335 million (corresponding to 30.53% of the basic profits - r$ 0.95 per both ordinary and preferred shares), that includes interest on shareholders equity, in the amount of r$ 7,195 million (equivalent to r$ 0.82 per share); and b) submitted for deliberation in the general Extraordinary Shareholder’s meeting, to be held on april 22, 2010: approval of a capital increase of part of the profit reserve in the amount of r$ 5,627 million, a portion of r$ 899 million derived from Statutory reserve, r$ 4,713 million derived from a profit retention reserve, r$ 15 million derived from part of a tax incentive reserve established in 2009, and capital reserve in the amount of r$ 515 million without the issuing of new shares.
3. based on the examinations performed and in view of the report of kpmg auditores independentes, dated march 19, 2010, which was unqualified, the Fiscal council is in favor of approving the said matters to be submitted for discussion and voting in the general ordinary and Extraordinary Shareholders’ meetings of petrobras.
rio de janeiro, march 19, 2010
marcus Pereira aucélio chairmanMaria Lúcia de Oliveira Falcón councilor
nelson Rocha augusto councilortúlio luiz zamincouncilor
167
Financial analysis And Financial statements 2009 | PetROBRas
2500
1100
editORial staFF
general coordination, Production, writing and editing accounting and institutional communications
graphic design and Productiontapioca comunicação
Revision murilo Souza de Sá e marly botelho de arruda lopes
translation kpmg auditores independentes
Printingipsis gráfica e Editora
Photographs – Petrobras image Bankbruno Veigageraldo Falcãohelmut otto
Financial analysis and Financial statements
6000
5200