Embed Size (px)
Citation preview
BT Group plc
Registered Office: 81 Newgate Street London EC1A 7AJ Registered in England and Wales no. 4190816
www.btplc.com
BT Group Communications BT Centre 81 Newgate Street London EC1A 7AJ
Financial results BT Group plc
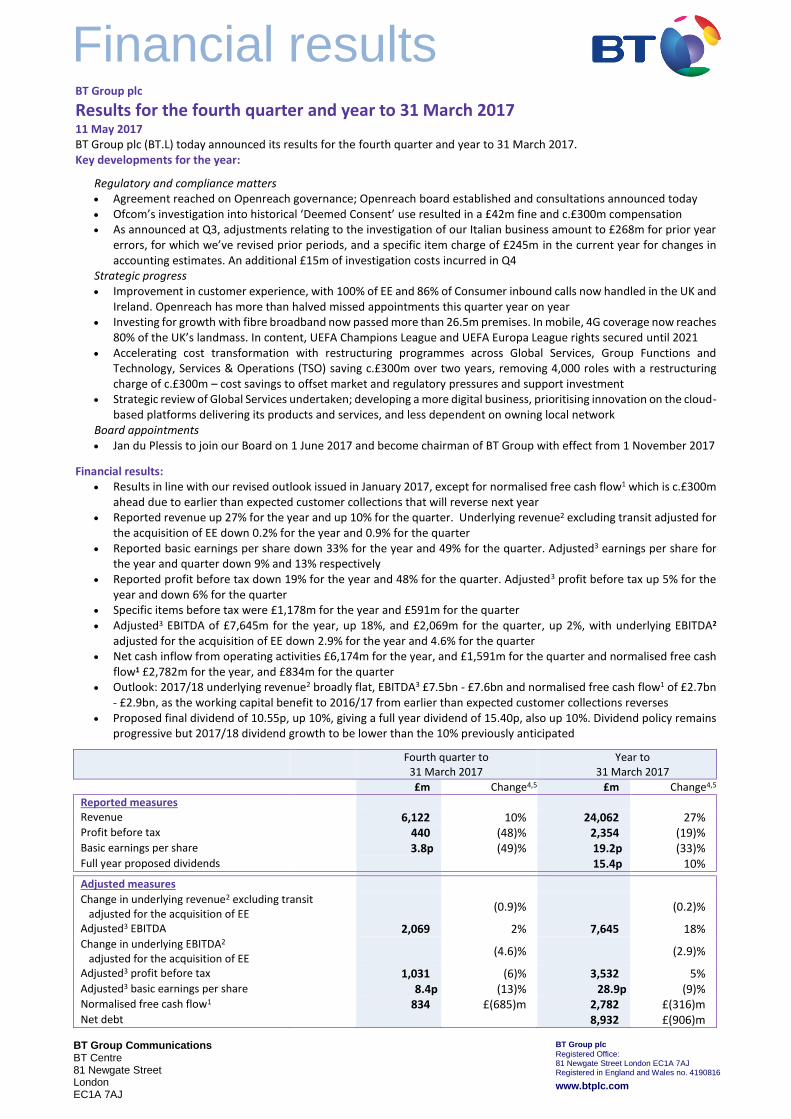
Results for the fourth quarter and year to 31 March 2017 11 May 2017 BT Group plc (BT.L) today announced its results for the fourth quarter and year to 31 March 2017. Key developments for the year:
Regulatory and compliance matters Agreement reached on Openreach governance; Openreach board established and consultations announced today Ofcom’s investigation into historical ‘Deemed Consent’ use resulted in a £42m fine and c.£300m compensation As announced at Q3, adjustments relating to the investigation of our Italian business amount to £268m for prior year
errors, for which we’ve revised prior periods, and a specific item charge of £245m in the current year for changes in accounting estimates. An additional £15m of investigation costs incurred in Q4
Strategic progress Improvement in customer experience, with 100% of EE and 86% of Consumer inbound calls now handled in the UK and
Ireland. Openreach has more than halved missed appointments this quarter year on year Investing for growth with fibre broadband now passed more than 26.5m premises. In mobile, 4G coverage now reaches
80% of the UK’s landmass. In content, UEFA Champions League and UEFA Europa League rights secured until 2021 Accelerating cost transformation with restructuring programmes across Global Services, Group Functions and
Technology, Services & Operations (TSO) saving c.£300m over two years, removing 4,000 roles with a restructuring charge of c.£300m – cost savings to offset market and regulatory pressures and support investment
Strategic review of Global Services undertaken; developing a more digital business, prioritising innovation on the cloud-based platforms delivering its products and services, and less dependent on owning local network
Board appointments Jan du Plessis to join our Board on 1 June 2017 and become chairman of BT Group with effect from 1 November 2017
Financial results: Results in line with our revised outlook issued in January 2017, except for normalised free cash flow1 which is c.£300m
ahead due to earlier than expected customer collections that will reverse next year Reported revenue up 27% for the year and up 10% for the quarter. Underlying revenue2 excluding transit adjusted for
the acquisition of EE down 0.2% for the year and 0.9% for the quarter Reported basic earnings per share down 33% for the year and 49% for the quarter. Adjusted3 earnings per share for
the year and quarter down 9% and 13% respectively Reported profit before tax down 19% for the year and 48% for the quarter. Adjusted3 profit before tax up 5% for the
year and down 6% for the quarter Specific items before tax were £1,178m for the year and £591m for the quarter Adjusted3 EBITDA of £7,645m for the year, up 18%, and £2,069m for the quarter, up 2%, with underlying EBITDA2
adjusted for the acquisition of EE down 2.9% for the year and 4.6% for the quarter Net cash inflow from operating activities £6,174m for the year, and £1,591m for the quarter and normalised free cash
flow1 £2,782m for the year, and £834m for the quarter Outlook: 2017/18 underlying revenue2 broadly flat, EBITDA3 £7.5bn - £7.6bn and normalised free cash flow1 of £2.7bn
- £2.9bn, as the working capital benefit to 2016/17 from earlier than expected customer collections reverses Proposed final dividend of 10.55p, up 10%, giving a full year dividend of 15.40p, also up 10%. Dividend policy remains
progressive but 2017/18 dividend growth to be lower than the 10% previously anticipated
Fourth quarter to 31 March 2017
Year to 31 March 2017
£m Change4,5 £m Change4,5
Reported measures Revenue 6,122 10% 24,062 27% Profit before tax 440 (48)% 2,354 (19)% Basic earnings per share 3.8p (49)% 19.2p (33)% Full year proposed dividends 15.4p 10% Adjusted measures Change in underlying revenue2 excluding transit adjusted for the acquisition of EE
(0.9)% (0.2)%
Adjusted3 EBITDA 2,069 2% 7,645 18% Change in underlying EBITDA2 adjusted for the acquisition of EE
(4.6)% (2.9)%
Adjusted3 profit before tax 1,031 (6)% 3,532 5% Adjusted3 basic earnings per share 8.4p (13)% 28.9p (9)% Normalised free cash flow1 834 £(685)m 2,782 £(316)m Net debt 8,932 £(906)m
2
Gavin Patterson, Chief Executive, commenting on the results, said:
“This has been a challenging year for BT. We’ve faced headwinds in the UK public sector and international corporate markets and must learn from what we found in our Italian business. Openreach also received a fine from Ofcom after an investigation into historical Deemed Consent practices revealed it fell short of the high standards we expect. We take these issues extremely seriously and are putting in place new measures, controls and people to prevent them happening again. Learning from the challenges of this year will make BT a stronger company for the future. “However, we’ve also made good progress in a number of areas. Our integration of EE is going well, our UK consumer, SME and corporate businesses are performing strongly, and we’ve made significant progress in improving customer experience across the group. Our agreement with Ofcom on Openreach governance brings to an end a period of uncertainty. And securing exclusive rights to top-flight European football until 2021 puts our consumer businesses in a strong position. “We’ve undertaken a strategic review of Global Services. Technology trends mean that we are now less dependent on owning physical local network assets around the world, creating the opportunity to reposition Global Services as a more focused digital business. We are therefore restructuring our Global Services organisation to enable this strategic refocusing. “We’re also accelerating and expanding our cost transformation programmes, most significantly in our central Group Functions, in Technology, Service and Operations, as well as in several other lines of business. This will help offset market and regulatory pressures and create the capacity for future investment. “We aspire to be the UK’s digital champion. To achieve this, we’re ready to invest in the UK’s digital infrastructure, in continued improvements in our customer service, and in new technologies to further enhance customer experience. To that end, Openreach has today announced that it’s consulting with customers and industry stakeholders on the business case that could support better rural broadband and a large scale Fibre-to-the-premises rollout across the UK.”
Performance against 2016/17 outlook: In January we revised our outlook as a result of the pressures in the UK public sector and international corporate markets and the outcome of the investigation into our Italian business.
2016/17 initial outlook
2016/17 revised outlook
2016/17 performance
Change in underlying revenue2 excluding transit Growth Broadly flat (0.2%) Adjusted3 EBITDA c.£7.9bn c.£7.6bn £7,645m
Normalised free cash flow1 £3.1bn - £3.2bn c.£2.5bn £2,782m
Dividend per share ≥10% growth ≥10% growth 15.40p, +10%
Share buyback c.£200m £206m £206m
Outlook: Our outlook for 2017/18 is now as follows:
2017/18
Change in underlying revenue2 excluding transit Broadly flat
Adjusted3 EBITDA £7.5bn - £7.6bn
Normalised free cash flow1 £2.7bn - £2.9bn
Dividend per share Progressive
Share buyback c.£100m
1 Before specific items, pension deficit payments and the cash tax benefit of pension deficit payments
2 Excludes specific items, foreign exchange movements and disposals and is calculated as though EE had been part of the group from 1 April 2015. This differs from how we usually adjust for acquisitions as explained on page 4
3 Before specific items, which are defined on page 4 4 The results for the period include EE which we acquired on 29 January 2016. Unless referred to as underlying adjusted for the acquisition of EE, comparatives only include EE from the date of acquisition 5 Certain prior year results have been revised to reflect the outcome of the investigation into our Italian business. See Note 1 to the condensed consolidated
financial statements
3
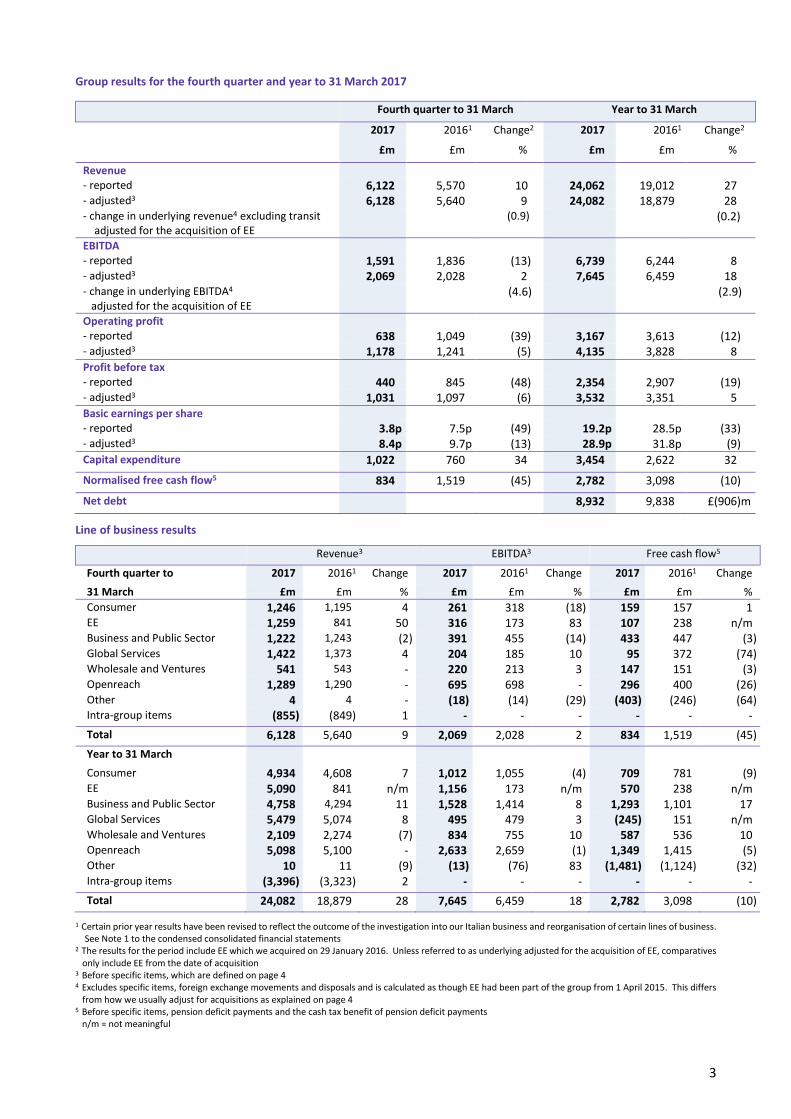
Group results for the fourth quarter and year to 31 March 2017
Fourth quarter to 31 March Year to 31 March
2017 20161 Change2 2017 20161 Change2
£m £m % £m £m %
Revenue
- reported 6,122 5,570 10 24,062 19,012 27 - adjusted3 6,128 5,640 9 24,082 18,879 28 - change in underlying revenue4 excluding transit
adjusted for the acquisition of EE
(0.9) (0.2)
EBITDA - reported 1,591 1,836 (13) 6,739 6,244 8 - adjusted3 2,069 2,028 2 7,645 6,459 18 - change in underlying EBITDA4 adjusted for the acquisition of EE
(4.6) (2.9)
Operating profit - reported 638 1,049 (39) 3,167 3,613 (12) - adjusted3 1,178 1,241 (5) 4,135 3,828 8
Profit before tax - reported 440 845 (48) 2,354 2,907 (19) - adjusted3 1,031 1,097 (6) 3,532 3,351 5
Basic earnings per share - reported 3.8p 7.5p (49) 19.2p 28.5p (33) - adjusted3 8.4p 9.7p (13) 28.9p 31.8p (9) Capital expenditure 1,022 760 34 3,454 2,622 32
Normalised free cash flow5 834 1,519 (45) 2,782 3,098 (10)
Net debt 8,932 9,838 £(906)m
Line of business results
Revenue3 EBITDA3 Free cash flow5
Fourth quarter to 2017 20161 Change 2017 20161 Change 2017 20161 Change
31 March £m £m % £m £m % £m £m %
Consumer 1,246 1,195 4 261 318 (18) 159 157 1 EE 1,259 841 50 316 173 83 107 238 n/m Business and Public Sector 1,222 1,243 (2) 391 455 (14) 433 447 (3) Global Services 1,422 1,373 4 204 185 10 95 372 (74) Wholesale and Ventures 541 543 - 220 213 3 147 151 (3) Openreach 1,289 1,290 - 695 698 - 296 400 (26) Other 4 4 - (18) (14) (29) (403) (246) (64) Intra-group items (855) (849) 1 - - - - - -
Total 6,128 5,640 9 2,069 2,028 2 834 1,519 (45)
Year to 31 March
Consumer 4,934 4,608 7 1,012 1,055 (4) 709 781 (9) EE 5,090 841 n/m 1,156 173 n/m 570 238 n/m Business and Public Sector 4,758 4,294 11 1,528 1,414 8 1,293 1,101 17 Global Services 5,479 5,074 8 495 479 3 (245) 151 n/m Wholesale and Ventures 2,109 2,274 (7) 834 755 10 587 536 10 Openreach 5,098 5,100 - 2,633 2,659 (1) 1,349 1,415 (5) Other 10 11 (9) (13) (76) 83 (1,481) (1,124) (32) Intra-group items (3,396) (3,323) 2 - - - - - -
Total 24,082 18,879 28 7,645 6,459 18 2,782 3,098 (10)
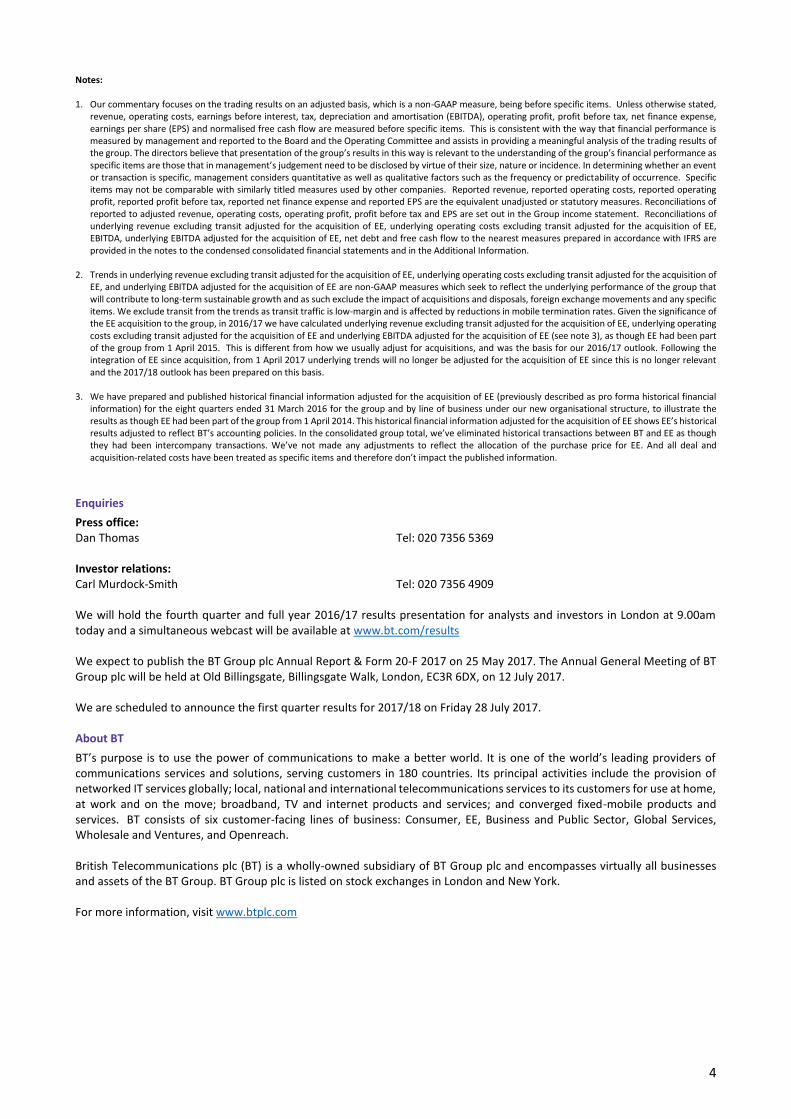
1 Certain prior year results have been revised to reflect the outcome of the investigation into our Italian business and reorganisation of certain lines of business. See Note 1 to the condensed consolidated financial statements
2 The results for the period include EE which we acquired on 29 January 2016. Unless referred to as underlying adjusted for the acquisition of EE, comparatives only include EE from the date of acquisition
3 Before specific items, which are defined on page 4 4 Excludes specific items, foreign exchange movements and disposals and is calculated as though EE had been part of the group from 1 April 2015. This differs
from how we usually adjust for acquisitions as explained on page 4 5 Before specific items, pension deficit payments and the cash tax benefit of pension deficit payments
n/m = not meaningful
4
Notes:
1. Our commentary focuses on the trading results on an adjusted basis, which is a non-GAAP measure, being before specific items. Unless otherwise stated, revenue, operating costs, earnings before interest, tax, depreciation and amortisation (EBITDA), operating profit, profit before tax, net finance expense, earnings per share (EPS) and normalised free cash flow are measured before specific items. This is consistent with the way that financial performance is measured by management and reported to the Board and the Operating Committee and assists in providing a meaningful analysis of the trading results of the group. The directors believe that presentation of the group’s results in this way is relevant to the understanding of the group’s financial performance as specific items are those that in management’s judgement need to be disclosed by virtue of their size, nature or incidence. In determining whether an event or transaction is specific, management considers quantitative as well as qualitative factors such as the frequency or predictability of occurrence. Specific items may not be comparable with similarly titled measures used by other companies. Reported revenue, reported operating costs, reported operating profit, reported profit before tax, reported net finance expense and reported EPS are the equivalent unadjusted or statutory measures. Reconciliations of reported to adjusted revenue, operating costs, operating profit, profit before tax and EPS are set out in the Group income statement. Reconciliations of underlying revenue excluding transit adjusted for the acquisition of EE, underlying operating costs excluding transit adjusted for the acquisition of EE, EBITDA, underlying EBITDA adjusted for the acquisition of EE, net debt and free cash flow to the nearest measures prepared in accordance with IFRS are provided in the notes to the condensed consolidated financial statements and in the Additional Information.
2. Trends in underlying revenue excluding transit adjusted for the acquisition of EE, underlying operating costs excluding transit adjusted for the acquisition of
EE, and underlying EBITDA adjusted for the acquisition of EE are non-GAAP measures which seek to reflect the underlying performance of the group that will contribute to long-term sustainable growth and as such exclude the impact of acquisitions and disposals, foreign exchange movements and any specific items. We exclude transit from the trends as transit traffic is low-margin and is affected by reductions in mobile termination rates. Given the significance of the EE acquisition to the group, in 2016/17 we have calculated underlying revenue excluding transit adjusted for the acquisition of EE, underlying operating costs excluding transit adjusted for the acquisition of EE and underlying EBITDA adjusted for the acquisition of EE (see note 3), as though EE had been part of the group from 1 April 2015. This is different from how we usually adjust for acquisitions, and was the basis for our 2016/17 outlook. Following the integration of EE since acquisition, from 1 April 2017 underlying trends will no longer be adjusted for the acquisition of EE since this is no longer relevant and the 2017/18 outlook has been prepared on this basis.
3. We have prepared and published historical financial information adjusted for the acquisition of EE (previously described as pro forma historical financial
information) for the eight quarters ended 31 March 2016 for the group and by line of business under our new organisational structure, to illustrate the results as though EE had been part of the group from 1 April 2014. This historical financial information adjusted for the acquisition of EE shows EE’s historical results adjusted to reflect BT’s accounting policies. In the consolidated group total, we’ve eliminated historical transactions between BT and EE as though they had been intercompany transactions. We’ve not made any adjustments to reflect the allocation of the purchase price for EE. And all deal and acquisition-related costs have been treated as specific items and therefore don’t impact the published information.
Enquiries
Press office: Dan Thomas Tel: 020 7356 5369 Investor relations: Carl Murdock-Smith Tel: 020 7356 4909 We will hold the fourth quarter and full year 2016/17 results presentation for analysts and investors in London at 9.00am today and a simultaneous webcast will be available at www.bt.com/results We expect to publish the BT Group plc Annual Report & Form 20-F 2017 on 25 May 2017. The Annual General Meeting of BT Group plc will be held at Old Billingsgate, Billingsgate Walk, London, EC3R 6DX, on 12 July 2017. We are scheduled to announce the first quarter results for 2017/18 on Friday 28 July 2017. About BT
BT’s purpose is to use the power of communications to make a better world. It is one of the world’s leading providers of communications services and solutions, serving customers in 180 countries. Its principal activities include the provision of networked IT services globally; local, national and international telecommunications services to its customers for use at home, at work and on the move; broadband, TV and internet products and services; and converged fixed-mobile products and services. BT consists of six customer-facing lines of business: Consumer, EE, Business and Public Sector, Global Services, Wholesale and Ventures, and Openreach. British Telecommunications plc (BT) is a wholly-owned subsidiary of BT Group plc and encompasses virtually all businesses and assets of the BT Group. BT Group plc is listed on stock exchanges in London and New York. For more information, visit www.btplc.com
5
BT Group plc
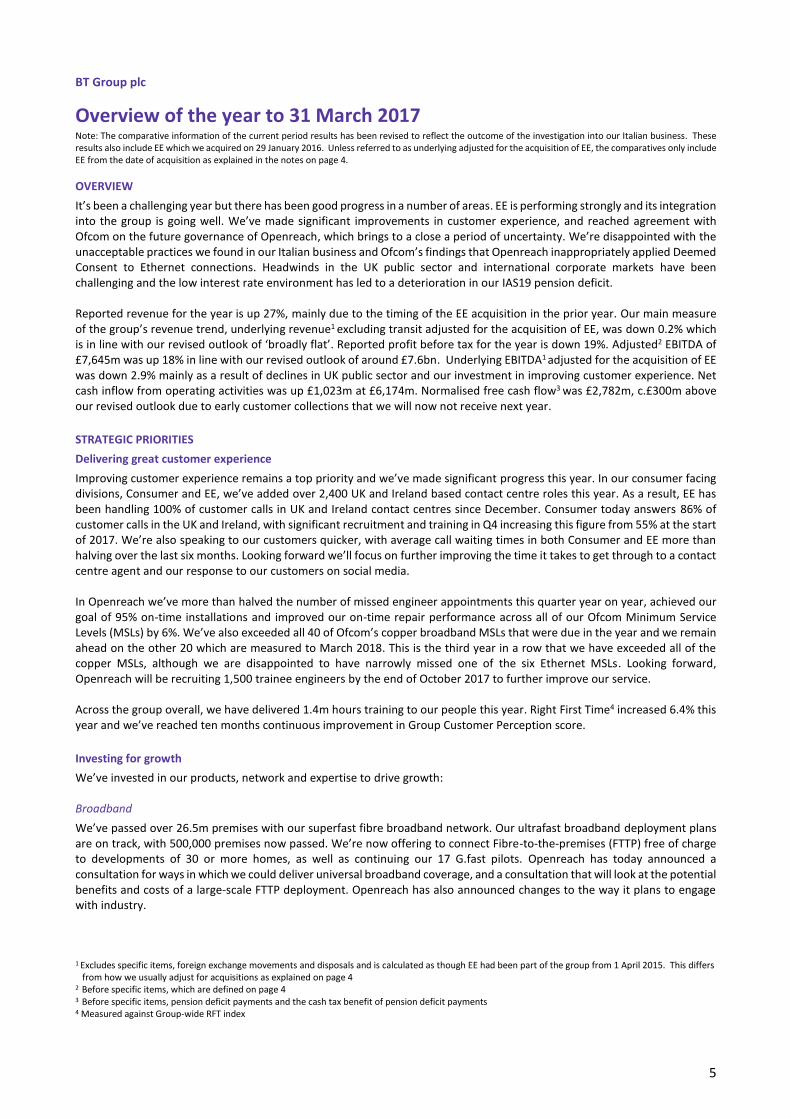
Overview of the year to 31 March 2017
Note: The comparative information of the current period results has been revised to reflect the outcome of the investigation into our Italian business. These results also include EE which we acquired on 29 January 2016. Unless referred to as underlying adjusted for the acquisition of EE, the comparatives only include EE from the date of acquisition as explained in the notes on page 4.
OVERVIEW
It’s been a challenging year but there has been good progress in a number of areas. EE is performing strongly and its integration into the group is going well. We’ve made significant improvements in customer experience, and reached agreement with Ofcom on the future governance of Openreach, which brings to a close a period of uncertainty. We’re disappointed with the unacceptable practices we found in our Italian business and Ofcom’s findings that Openreach inappropriately applied Deemed Consent to Ethernet connections. Headwinds in the UK public sector and international corporate markets have been challenging and the low interest rate environment has led to a deterioration in our IAS19 pension deficit. Reported revenue for the year is up 27%, mainly due to the timing of the EE acquisition in the prior year. Our main measure of the group’s revenue trend, underlying revenue1 excluding transit adjusted for the acquisition of EE, was down 0.2% which is in line with our revised outlook of ‘broadly flat’. Reported profit before tax for the year is down 19%. Adjusted2 EBITDA of £7,645m was up 18% in line with our revised outlook of around £7.6bn. Underlying EBITDA1 adjusted for the acquisition of EE was down 2.9% mainly as a result of declines in UK public sector and our investment in improving customer experience. Net cash inflow from operating activities was up £1,023m at £6,174m. Normalised free cash flow3 was £2,782m, c.£300m above our revised outlook due to early customer collections that we will now not receive next year.
STRATEGIC PRIORITIES
Delivering great customer experience
Improving customer experience remains a top priority and we’ve made significant progress this year. In our consumer facing divisions, Consumer and EE, we’ve added over 2,400 UK and Ireland based contact centre roles this year. As a result, EE has been handling 100% of customer calls in UK and Ireland contact centres since December. Consumer today answers 86% of customer calls in the UK and Ireland, with significant recruitment and training in Q4 increasing this figure from 55% at the start of 2017. We’re also speaking to our customers quicker, with average call waiting times in both Consumer and EE more than halving over the last six months. Looking forward we’ll focus on further improving the time it takes to get through to a contact centre agent and our response to our customers on social media. In Openreach we’ve more than halved the number of missed engineer appointments this quarter year on year, achieved our goal of 95% on-time installations and improved our on-time repair performance across all of our Ofcom Minimum Service Levels (MSLs) by 6%. We’ve also exceeded all 40 of Ofcom’s copper broadband MSLs that were due in the year and we remain ahead on the other 20 which are measured to March 2018. This is the third year in a row that we have exceeded all of the copper MSLs, although we are disappointed to have narrowly missed one of the six Ethernet MSLs. Looking forward, Openreach will be recruiting 1,500 trainee engineers by the end of October 2017 to further improve our service. Across the group overall, we have delivered 1.4m hours training to our people this year. Right First Time4 increased 6.4% this year and we’ve reached ten months continuous improvement in Group Customer Perception score.
Investing for growth
We’ve invested in our products, network and expertise to drive growth: Broadband
We’ve passed over 26.5m premises with our superfast fibre broadband network. Our ultrafast broadband deployment plans are on track, with 500,000 premises now passed. We’re now offering to connect Fibre-to-the-premises (FTTP) free of charge to developments of 30 or more homes, as well as continuing our 17 G.fast pilots. Openreach has today announced a consultation for ways in which we could deliver universal broadband coverage, and a consultation that will look at the potential benefits and costs of a large-scale FTTP deployment. Openreach has also announced changes to the way it plans to engage with industry. 1 Excludes specific items, foreign exchange movements and disposals and is calculated as though EE had been part of the group from 1 April 2015. This differs
from how we usually adjust for acquisitions as explained on page 4 2 Before specific items, which are defined on page 4 3 Before specific items, pension deficit payments and the cash tax benefit of pension deficit payments 4 Measured against Group-wide RFT index
6
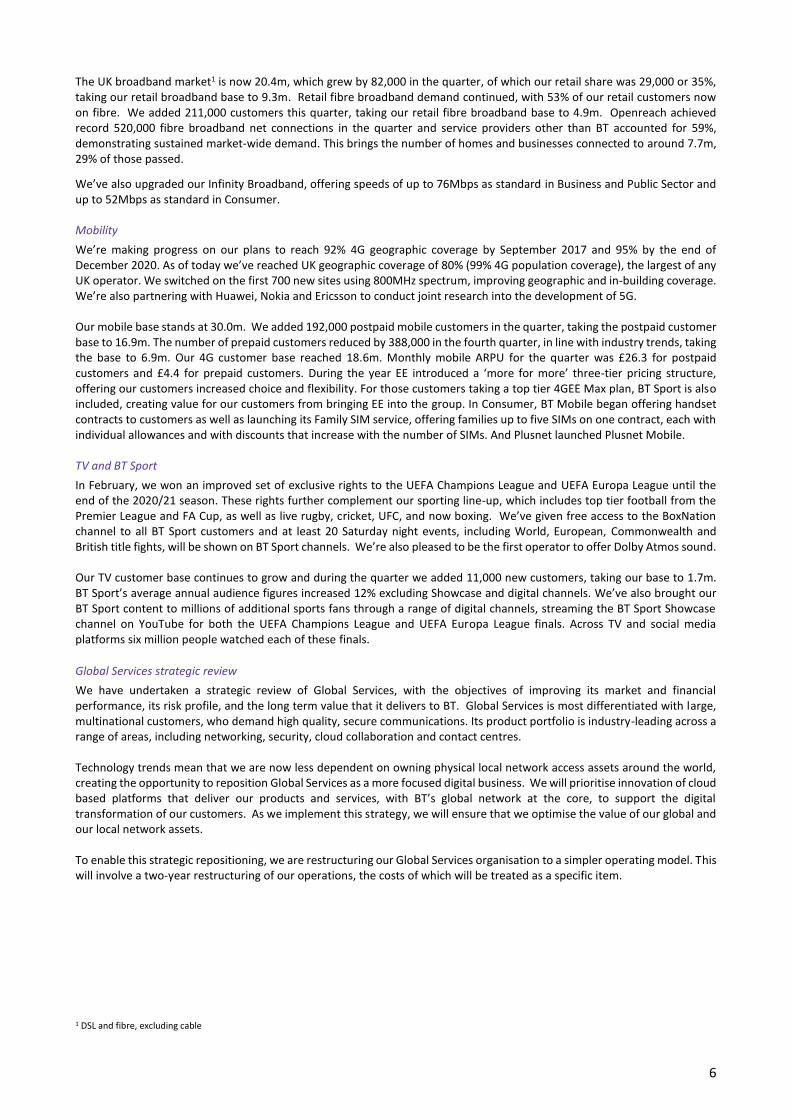
The UK broadband market1 is now 20.4m, which grew by 82,000 in the quarter, of which our retail share was 29,000 or 35%, taking our retail broadband base to 9.3m. Retail fibre broadband demand continued, with 53% of our retail customers now on fibre. We added 211,000 customers this quarter, taking our retail fibre broadband base to 4.9m. Openreach achieved record 520,000 fibre broadband net connections in the quarter and service providers other than BT accounted for 59%, demonstrating sustained market-wide demand. This brings the number of homes and businesses connected to around 7.7m, 29% of those passed.
We’ve also upgraded our Infinity Broadband, offering speeds of up to 76Mbps as standard in Business and Public Sector and up to 52Mbps as standard in Consumer. Mobility
We’re making progress on our plans to reach 92% 4G geographic coverage by September 2017 and 95% by the end of December 2020. As of today we’ve reached UK geographic coverage of 80% (99% 4G population coverage), the largest of any UK operator. We switched on the first 700 new sites using 800MHz spectrum, improving geographic and in-building coverage. We’re also partnering with Huawei, Nokia and Ericsson to conduct joint research into the development of 5G. Our mobile base stands at 30.0m. We added 192,000 postpaid mobile customers in the quarter, taking the postpaid customer base to 16.9m. The number of prepaid customers reduced by 388,000 in the fourth quarter, in line with industry trends, taking the base to 6.9m. Our 4G customer base reached 18.6m. Monthly mobile ARPU for the quarter was £26.3 for postpaid customers and £4.4 for prepaid customers. During the year EE introduced a ‘more for more’ three-tier pricing structure, offering our customers increased choice and flexibility. For those customers taking a top tier 4GEE Max plan, BT Sport is also included, creating value for our customers from bringing EE into the group. In Consumer, BT Mobile began offering handset contracts to customers as well as launching its Family SIM service, offering families up to five SIMs on one contract, each with individual allowances and with discounts that increase with the number of SIMs. And Plusnet launched Plusnet Mobile. TV and BT Sport
In February, we won an improved set of exclusive rights to the UEFA Champions League and UEFA Europa League until the end of the 2020/21 season. These rights further complement our sporting line-up, which includes top tier football from the Premier League and FA Cup, as well as live rugby, cricket, UFC, and now boxing. We’ve given free access to the BoxNation channel to all BT Sport customers and at least 20 Saturday night events, including World, European, Commonwealth and British title fights, will be shown on BT Sport channels. We’re also pleased to be the first operator to offer Dolby Atmos sound. Our TV customer base continues to grow and during the quarter we added 11,000 new customers, taking our base to 1.7m. BT Sport’s average annual audience figures increased 12% excluding Showcase and digital channels. We’ve also brought our BT Sport content to millions of additional sports fans through a range of digital channels, streaming the BT Sport Showcase channel on YouTube for both the UEFA Champions League and UEFA Europa League finals. Across TV and social media platforms six million people watched each of these finals.
Global Services strategic review
We have undertaken a strategic review of Global Services, with the objectives of improving its market and financial performance, its risk profile, and the long term value that it delivers to BT. Global Services is most differentiated with large, multinational customers, who demand high quality, secure communications. Its product portfolio is industry-leading across a range of areas, including networking, security, cloud collaboration and contact centres. Technology trends mean that we are now less dependent on owning physical local network access assets around the world, creating the opportunity to reposition Global Services as a more focused digital business. We will prioritise innovation of cloud based platforms that deliver our products and services, with BT’s global network at the core, to support the digital transformation of our customers. As we implement this strategy, we will ensure that we optimise the value of our global and our local network assets. To enable this strategic repositioning, we are restructuring our Global Services organisation to a simpler operating model. This will involve a two-year restructuring of our operations, the costs of which will be treated as a specific item.
1 DSL and fibre, excluding cable
7
Transforming our costs
Integration of EE
Our integration of EE is going well. We’ve achieved around £150m of run-rate cost synergies in our first year, exceeding our target of £100m, as we’ve been able to realise synergies earlier than originally planned. We continue to expect cost synergies to reach a run-rate of around £400m in the fourth year. We’ve delivered savings this year through renegotiating supplier terms and reducing the number of head office employees. We’ve also insourced a number of activities where possible, including roaming management, EE facilities management and core network engineering field operations. Restructuring
We are also expanding and accelerating areas of our cost transformation programme. We are simplifying our central Group Functions and our internal service unit, Technology, Service & Operations to improve the effectiveness and efficiency of the services and infrastructure delivered to our lines of business. We are also restructuring the Global Services organisation, as described above, and accelerating ongoing transformation programmes in other lines of business. We anticipate that these transformation programmes will save in total around £300m over two years, with a restructuring charge of around £300m over the next two years, with most of this being incurred in 2017/18. This restructuring cost will be treated as a specific item. These changes will clarify accountabilities, remove duplication and improve efficiencies, removing around 4,000 roles mainly from managerial and back office areas. The cost savings will provide headroom to offset market and regulatory pressures and support increased investment in delivering great customer experience and leading networks. OTHER KEY DEVELOPMENTS
Our investigation into our Italian business
What we found
In the summer of 2016 we received a whistle-blower report of inappropriate behaviours in our Italian business. We instigated an investigation, which included an independent review by KPMG LLP, with support and oversight from our Legal, Governance & Compliance function and Freshfields Bruckhaus Deringer, reporting directly to both the Chair of the Audit & Risk Committee and BT Group Chairman, and our own comprehensive balance sheet review, which revealed improper accounting practices and a complex set of improper sales, purchase, factoring and leasing transactions in our Italian business. The investigation identified collusion, circumvention and override of controls within our Italian business, that was not identified by our monitoring controls thereby resulting in the misstatement of results going undetected for a number of years. These activities resulted in the overstatement of profits amounting to £268m in our Italian business over a number of years. We concluded that the errors were not individually material to any of the group’s previously issued financial statements; however, we did conclude that the correction of the full £268m in the current year would materially misstate the current year. To avoid this we corrected the errors by revising prior year income statements, balance sheets and cash flow statements. The effect of these revisions is set out in Note 1 to the financial statements. The findings from the investigation in Italy led us to review the carrying value of the assets and liabilities on the balance sheet, taking into account changes in facts or circumstances since 31 March 2016 and whether additional exposures had arisen due to events in the current year. This exercise required a level of judgement, in many cases taking a more cautious view based on our current understanding of circumstances surrounding each item. This exercise concluded that it was appropriate to write-down the value of our balance sheet assets and increase our balance sheet liabilities. The resulting charge of £245m is presented as a specific item in the current year. Changes in facts or circumstance of items arising in the current year have been recorded in Global Services’ current year trading results.
How we responded
The inappropriate behaviour in our Italian business is an extremely serious matter. It has no place in BT and we took immediate steps to improve the financial processes and controls in that business. We suspended a number of BT Italy’s senior management team who have now left the business. The President of our European operations has also left the business. We have appointed a new President of our European operations and a new CEO and CFO of BT Italy, from outside the Italian executive management team, and they are working hard to re-position and restructure the business for the future including implementing improvements to the governance, compliance and control culture and the capabilities of our people in the organisation. To ensure independence, KPMG and our internal investigation team, with support and oversight from the Legal, Governance & Compliance function and Freshfields Bruckhaus Deringer, reporting directly to both the Chair of the Audit & Risk Committee and BT Group Chairman, conducted an investigation of the systems and controls relating to our Italian business. We also conducted a broader review of financial processes, systems and controls across the group. We are acting on both the
8
recommendations of KPMG and our own observations and have taken steps to improve our controls within Italy. We have also taken steps to enhance the wider controls that monitor our overseas operations in our shared service centres, Global Services and at a group level. Beyond Italy we have completed detailed balance sheet reviews in seven selected country operations in Global Services outside of the UK. These thorough reviews were supported by EY. Together with the investigation in Italy these covered around two thirds by asset value of our operations outside the UK, representing 4% of the group's total assets. Our review did not identify any similar issues or areas of concern elsewhere giving us comfort that the inappropriate behaviours were isolated to Italy. This along with other additional substantive assurance activities that we have undertaken enables us to conclude that the financial results and balance sheet position as of 31 March 2017 give a true and fair view of the group. As a result of our US listing we are required to make certain assessments of our controls as of 31 March 2017 for the purposes of the US Sarbanes-Oxley Act 2002 (“Sarbanes-Oxley”). Despite the remediation steps we took, the controls had not operated for sufficient time to allow assurance testing to confirm their effectiveness under Sarbanes-Oxley. We have therefore concluded for these purposes that our controls were ineffective as of 31 March 2017 due to a material weakness with regards to our Italian business. As announced separately today, the BT Group Remuneration Committee has also considered the wider implications of the BT Italy investigation.
What we will do going forward
While we have taken steps to improve our control environment, we recognise we have more to do. We will continue to take steps to improve further our control, governance and compliance environment. These steps include increasing the resources and improving the capabilities of the controlling function and the audit function outside the UK, and further developing our integrated risk and assurance reporting processes. We are also enhancing our controls and compliance programme to strengthen awareness of the standards we expect, the capabilities of our people, and to reinforce the importance of doing business in an ethical, disciplined and standardised way. The new CEO and CFO of BT Italy will continue to review the Italian management and finance teams and work with BT Group Ethics and Compliance to improve the governance, compliance and financial safeguards. Going forward, we will also continue to rotate senior management among countries to ensure an independently governed and rigorously controlled organisation throughout all parts of Global Services.
Deemed Consent
On 26 March 2017, Ofcom published the findings of its investigation into the historical use of ‘Deemed Consent’ by Openreach. Deemed Consent is an agreed process between Openreach and its communications provider (CP) customers, which allows Openreach to halt the installation and reschedule the delivery date for providing dedicated business services (known as Ethernet) in a number of specific circumstances which are beyond its control. Ofcom found that Openreach had breached its contractual and regulatory obligations by inadequately and retrospectively applying Deemed Consent to reduce compensation payments to CPs between January 2013 and December 2014. As a result of the findings, Openreach has agreed to compensate CPs and Ofcom has imposed a fine of £42m, reflecting the seriousness of the failings. This includes a 30 per cent maximum discount for BT admitting its liabilities and agreeing to compensate the affected CPs in full. The precise amount of these compensation payments will result from discussions with the affected parties and is currently estimated at £300m. The fine and associated compensation payments are treated as a specific item charge in this year’s income statement, with the cash expected to be paid in 2017/18. We take this matter very seriously and we’ve put in place additional controls to safeguard against this happening again and to make sure that we’re providing the highest standards in serving our customers The UK’s exit from the EU
The weakening of sterling has continued to impact our financial results, causing volatility in revenue and cost but with minimal EBITDA impact. In addition, following the result of the EU referendum and the formal notice of the UK’s intention to leave the EU, there remains significant uncertainty around the nature of the UK’s future trading relationship with the EU and globally. We continue to monitor the longer term impact of the UK’s decision to exit the EU.
9
Audit tender On the recommendation of the Audit & Risk Committee, the Board has initiated a tender process for the group statutory audit with a view to appointing new auditors for 2018/19. We expect the audit tender process to be completed by the time of the Annual General Meeting (AGM) in July, to enable an effective transition by the selected audit firm during 2017/18. A resolution proposing the appointment of the successful firm will be put to shareholders at the 2018 AGM.
REGULATION Digital Communications Review
In March 2015 Ofcom announced it would carry out a strategic review of the digital communications industry, looking at ways to improve investment, innovation and competition across fixed-line, broadband and mobile markets. In March 2017 we announced we had reached an agreement with Ofcom in respect of this review. This agreement will see Openreach become a distinct, legally separate company within the BT Group. Once the agreement is implemented:
around 32,000 employees will transfer to the new Openreach Limited following TUPE consultation and once pension
arrangements are in place;
Openreach Limited will have its own branding, which will not feature the BT logo; and
the Openreach CEO will report into the Openreach chairman, with accountability to the BT Group, as the CEO of a
wholly owned subsidiary. This includes accountability to the BT Group chief executive with regards to certain legal
and fiduciary duties that are consistent with BT’s responsibilities as a listed company.
The agreement is intended to be comprehensive and enduring. It will provide BT and other companies with greater regulatory certainty and clarity which is vital for investment. This will help the UK retain its position as a leading digital economy, with the largest superfast network among major European nations. Business Connectivity Market Review (BCMR)
In April 2016 Ofcom published its Final Statement on its BCMR, Leased Lines Charge Control and Cost Attribution Review, including:
the charge controls that apply from 1 May 2016 until 31 March 2019;
the introduction of Minimum Service Levels for Openreach relating to the installation and repair of Ethernet services;
and
a requirement on Openreach to provide access to its fibre network for providers of high speed services to businesses
(‘dark fibre’) from 1 October 2017.
Determination on Special Fault Investigation and Time Related Charges
In November 2016 Ofcom published its final determination on disputes relating to historical pricing of Special Fault Investigation (SFI) and Time Related Charges (TRCs). Ofcom found that certain prices between 1 January 2009 and 30 June 2014 were not cost oriented and that we should therefore make repayments of low tens of millions to the disputing parties. We have provided for these expected refunds. Also in November 2016, the Competition Appeal Tribunal handed down judgment dismissing our appeal against Ofcom’s November 2015 determination on Average Porting Conveyance Charges (APCCs). 2.3GHz and 3.4GHz spectrum auction Ofcom’s November 2016 spectrum auction consultation document proposes that 190MHz of mobile spectrum in the 2.3GHz and 3.4GHz bands be auctioned as early as summer 2017. Ofcom proposes to apply a cap, of 255MHz, on “immediately useable” spectrum that any one operator can buy. As a consequence of this proposed cap, BT/EE would not be able to bid for the 40MHz spectrum in the 2.3GHz band but would be able to bid for the remaining 150MHz of spectrum to be sold in the 3.4GHz band. Ofcom is expected to issue their statement in the coming months. Narrowband Market Review
In December 2016 Ofcom issued a consultation setting out proposals for how the Narrowband markets should be regulated during the three years from 1 October 2017 to 30 September 2020, including proposals to remove formal charge controls on some markets. We responded to these proposals in March 2017 and we expect Ofcom to issue their final statement later in 2017. Review of the market for standalone landline telephone services
On 28 February 2017 Ofcom proposed plans to cut BT’s line rental by at least £5 a month for BT customers that only have a landline. We estimate we have a declining base of around 2m residential lines included within the scope of the consultation. We have responded to Ofcom’s proposals as part of the consultation process.
10
Wholesale Local Access Market Review
On 31 March 2017 Ofcom published a consultation on the Wholesale Local Access market. Ofcom proposes to maintain its policy of pricing flexibility for Openreach’s fastest broadband products, including those based on BT’s own network investments in FTTP and G.fast technology. It proposes to introduce a charge control and cut the wholesale price that Openreach can charge CPs for its up to 40Mbps downstream, 10Mpbs upstream superfast broadband service. Ofcom also proposes:
standard broadband delivered over Openreach’s copper network will continue to be subject to a charge control;
tougher quality of service standards for broadband and phone products, with strict rules on Openreach repairs and
installations; and
removal of the formal margin squeeze test on high speed superfast broadband products.
Ofcom has also proposed to revise the existing charge control on the price of Openreach’s copper MPF line rental service. We are considering Ofcom’s proposals and will respond in the first quarter of 2017/18. We expect Ofcom to issue a final statement containing its proposals in early 2018, with those proposals to take effect from April 2018, and remain in place until March 2021. Duct and pole access remedies
On 20 April 2017 Ofcom published their second consultation covering proposals for new duct and pole access remedies. Ofcom intend these to support new fibre investment and provide a choice of network providers. The consultation focuses on defining changes to the products, and also indicates Ofcom’s intention to set a cap on duct and pole prices, on which they intend to consult in the summer. We will respond to Ofcom’s proposals in June. Ofcom’s proposals, if confirmed, would take effect from 1 April 2018 and Openreach would be required to issue a new product offering within 12 months. Court of Appeal judgement on Ethernet Dispute
On 20 December 2012 Ofcom made determinations resolving disputes between BT and five CPs (C&W Worldwide, Sky, TalkTalk, Virgin Media, and Verizon) concerning BT’s charges for certain Ethernet services. The Determinations found that BT had overcharged C&W Worldwide, Sky, TalkTalk, Virgin Media, and Verizon for certain Ethernet services for varying periods from April 2006 to March 2011. All parties appealed the determinations to the Competition Appeal Tribunal (CAT), which largely confirmed Ofcom’s assessment of overcharging, and ordered BT to pay interest on the amounts overcharged. BT and TalkTalk appealed the CAT’s judgment to the Court of Appeal, and the hearing took place in March 2017.
On 4 May 2017 the Court of Appeal handed down its judgment, dismissing TalkTalk’s appeal that Ofcom should have used a different cost standard in assessing cost orientation, which would have resulted in higher repayments to CPs. The Court of Appeal also dismissed BT’s appeal (which would have reduced the repayments). This confirmed our view that no additional amounts were payable in relation to TalkTalk’s appeal. Both BT and TalkTalk may appeal the Court of Appeal judgment to the Supreme Court. Impact of regulation in 2017/18 We expect a c.£120m impact on Openreach revenue and EBITDA from regulation. This includes a headwind from an MPF price cut, another year of BCMR price reductions and, from October, the introduction of ‘dark fibre’ access. Separately, we estimate that Openreach will face an additional headwind of around £60m from higher business rates which will not be immediately recoverable through regulated prices, as the current charge controls do not reflect this increase. Lastly, we expect the impact of EU roaming regulation on group revenue and EBITDA in 2017/18 will be in the mid-tens of millions of pounds.
11
OUTLOOK For 2017/18, we continue to expect underlying revenue excluding transit to be broadly flat year on year. Adjusted EBITDA is expected to be £7.5bn - £7.6bn. Our outlook for normalised free cash flow over the cumulative two year period 2016/17 and 2017/18 remains broadly unchanged. However, normalised free cash flow in 2016/17 of £2,782m was almost £300m above our outlook of around £2.5bn, due to early customer collections that will reverse in 2017/18. As such, normalised free cash flow in 2017/18 is now expected to be £2.7bn - £2.9bn, from £3.0bn - £3.2bn previously. This outlook is provided on the basis of our existing investment plans. However, we continue to evaluate a range of additional investment opportunities. Our decision on whether to move forward with these will be affected by a number of factors, including the outcome of Ofcom’s Wholesale Local Access Market Review, responses to Openreach’s consultations and the results of any future spectrum auctions. DIVIDENDS The Board is proposing a final dividend of 10.55p, up 10%, giving a full year dividend of 15.40p, up 10%. Subject to shareholder approval, this will be paid on 4 September 2017 to shareholders on the register at 11 August 2017. The ex-dividend date is 10 August 2017. The final dividend, amounting to approximately £1,050m (2015/16: £956m), will be recognised as an appropriation of retained earnings in the quarter to 30 September 2017. Our underlying dividend policy remains unchanged: to deliver progressive dividends while balancing the need to invest in the business, support the pension fund and maintain a strong balance sheet. The Board has concluded that a dividend increase of 10% in 2016/17 remains appropriate. However, given the importance of maintaining flexibility for additional investment and the range of potential outcomes, dividend growth in 2017/18 will be lower than the 10% previously anticipated. The rate of future dividend growth will reflect a number of factors, including underlying medium term earnings growth, the level of investment spending and other cash commitments. The Board believes that this dividend policy appropriately balances the interests of all stakeholders and provides a solid foundation for future growth, underpinned by an ongoing commitment to investment that delivers sustainable long-term value for customers and shareholders. We expect to buy back around £100m of shares in 2017/18 to help counteract the dilutive effect of all-employee share option plans maturing in the year. This is below the £206m buyback we completed in 2016/17 reflecting the lower number of shares that are expected to be required for our share option plans. PRINCIPAL RISKS AND UNCERTAINTIES The group’s principal risks and uncertainties are disclosed in Note 7.
12
BT Group plc
Group results for the fourth quarter to 31 March 2017 Note: The comparative information of the current period results has been revised to reflect the outcome of the investigation into our Italian business. These results also include EE which we acquired on 29 January 2016. Unless referred to as underlying adjusted for the acquisition of EE, the comparatives only include EE from the date of acquisition as explained in the notes on page 4.
Income statement
Reported revenue was £6,122m, up 10%, mainly as a result of the contribution of EE and foreign exchange. Adjusted2 revenue was £6,128m, up 9%. This includes a £132m favourable impact from foreign exchange movements and a £32m reduction in transit revenue. Underlying revenue1 excluding transit adjusted for the acquisition of EE was down 0.9%.
Reported operating costs of £5,484m were up 21% due mainly to EE and foreign exchange. Adjusted2 operating costs3 of £4,059m were up 12%. This includes £112m adverse impact from foreign exchange movements and a £31m decrease in transit costs. Underlying operating costs1,3 excluding transit adjusted for the acquisition of EE were up 1%. Net labour costs of £1,150m were up 6%, reflecting the additional EE employees that have joined the group and our investment in service in Consumer and Openreach. Property and energy costs were up 3%, network operating and IT costs up 42% and payments to telecommunications operators up 1%, driven primarily by EE. BT Sport programme rights charges were £187m, up £26m mainly as a result of the new Premier League rights contract. Other costs were up £263m or 21%, reflecting EE. Reported profit before tax was down 48% at £440m. Adjusted1 profit before tax decreased 6% to £1,031m. The effective tax rate on profit before specific items was 18.6% (Q4 2015/16: 15.8%). Adjusted2 EBITDA of £2,069m was up 2%. Underlying EBITDA1 adjusted for the acquisition of EE was down 4.6% mainly as a result of UK public sector decline and our investment in improving customer experience. Depreciation and amortisation of £891m was up 13% largely due to the impact of EE. Reported net finance expense was £196m while adjusted2 net finance expense was £145m. Reported EPS was 3.8p, down 49%. Adjusted1 EPS of 8.4p was down 13%. These are based on a weighted average number of shares in issue of 9,945m (Q4 2015/16: 9,457m), up 5%, mainly reflecting the additional shares we issued as part of our acquisition of EE.
Specific items (Note 4 to the condensed consolidated financial statements)
Specific items resulted in a net charge after tax of £459m (Q4 2015/16: £216m). This mainly reflects the following:
Investigation into our Italian business We incurred £15m (Q4 2015/16: £nil) of specific costs in undertaking our investigation into our Italian business. See page 7. Regulatory matters We’ve recognised £400m (Q4 2015/16: £nil) of net specific costs in relation to regulatory matters. These are made up of the following:
Deemed Consent - A charge of £342m was recognised in the quarter (Q4 2015/16: £nil) following Ofcom’s March 2017
finding in relation to its investigation into historical Deemed Consent practices. This represents a fine of £42m and an
estimate of £300m for amounts we will compensate Communication Providers. The precise amount of these
compensation payments will be determined from discussions with the affected parties. We expect to pay these
amounts in 2017/18.
Re-assessment of other regulatory provisions - We’ve re-assessed our regulatory risk position in relation to other
historical matters, and have increased our net provision by £58m (Q4 2015/16: £nil) in the quarter.
Out of period irrecoverable VAT We recognised £2m (Q4 2015/16: £nil) in the quarter as a true up to the out of period irrecoverable VAT charge we took in Q3.
1 Excludes specific items, foreign exchange movements and disposals and is calculated as though EE had been part of the group from 1 April 2015. This differs from how we usually adjust for acquisitions as explained on page 4
2 Before specific items, which are defined on page 4 3 Before depreciation and amortisation
13
EE acquisition and integration costs During the quarter, we incurred £123m (Q4 2015/16: £93m) of acquisition and integration related costs for EE. Included within this amount was £62m of specific depreciation and amortisation relating to the write-off of IT assets as we integrate BT and EE IT infrastructures. Net interest expense on pensions During the quarter, we incurred £51m (Q4 2015/16: £55m) of interest cost in relation to our defined benefit pension obligations. Prior year specific items The following specific items were also recognised only in the prior year:
Property rationalisation costs – In Q4 2015/16 we recognised £29m of charge in relation to the rationalisation of the
group’s property portfolio.
EE fair value adjustment – In Q4 2015/16, we recognised a fair value adjustment on the acquisition of EE which reduced
the amount of deferred income in relation to its prepaid subscriber base by £70m. This amount was released as a
reduction to revenue in the period between acquisition and 31 March 2016, reflecting the period over which EE provided
the related service.
Tax on specific items
A tax credit of £132m (Q4 2015/16: £36m) was recognised in relation to specific items and the re-measurement of deferred tax.
Capital expenditure
Capital expenditure was £1,022m (Q4 2015/16: £760m). This consists of gross expenditure of £943m (Q4 2015/16: £741m) which has been increased by net grant deferral of £79m (Q4 2015/16: £19m) mainly relating to our activity on the Broadband Delivery UK (BDUK) programme. Our base-case assumption for take-up in BDUK areas has been increased to 39% following our review of the level of customer take-up. Under the terms of the BDUK programme, we have a potential obligation to either re-invest or repay grant funding depending on factors including the level of customer take-up achieved. While we have recognised gross grant funding of £41m (Q4 2015/16: £60m) in line with network build in the quarter, we have also deferred £120m (Q4 2015/16: £79m) of the total grant funding to reflect higher take-up levels on a number of contracts. To date we have deferred £446m (Q4 2015/16: £258m). Free cash flow
Net cash inflow from operating activities was down £337m at £1,591m. Normalised free cash flow1 was down £685m at £834m. The decrease primarily reflects the impact of cash outflows in our Italian business as we unwound the full effect of the inappropriate working capital practices we identified at Q3, and higher capital expenditure in relation to the Emergency Services Network (ESN) and the integration of EE. The net cash cost of specific items was £59m (Q4 2015/16: £132m). This includes EE integration cost payments of £21m (Q4 2015/16: £86m EE acquisition-related cost payments). After specific items and a £11m (Q4 2015/16: £44m) cash tax benefit from pension deficit payments, free cash flow was an inflow of £786m (Q4 2015/16: £1,431m). 1 Before specific items, pension deficit payments and the cash tax benefit of pension deficit payments

14
Net debt and liquidity
Net debt was £8,932m at 31 March 2017, £906m lower than at 31 March 2016. The decrease in the year reflects free cash flow of £2.7bn, proceeds of £70m from the exercise of employee share options offset by dividends paid of £1.4bn, £206m for the buyback of c.47m shares and £274m of pension deficit payments. At 31 March 2017 the group held cash and current investment balances of £2.0bn. During the year to 31 March 2017 we repaid term debt of £1.8bn. Short term borrowings include term debt of £1.4bn repayable in 2017/18 and £0.7bn for the outstanding portion of our overdraft and collateral for open mark-to-market positions. Our £2.1bn committed credit facility, which matures in September 2021, remains undrawn as at 31 March 2017. A £1.5bn revolving committed credit facility was signed on 15 March 2017. This facility provides BT with a bridge to capital market issuance for 364 days with extension options to March 2019. The bridge facility contains mandatory prepayment and cancellation clauses in certain circumstances, such as the issuance of public debt securities. This facility was undrawn at 31 March 2017.
Pensions (Note 5 to the condensed consolidated financial statements)
The IAS 19 net pension position at 31 March 2017 was a deficit of £7.6bn net of tax (£9.1bn gross of tax), compared with £5.2bn net of tax (£6.4bn gross of tax) at 31 March 2016. The increase is predominantly due to the fall in the real IAS 19 discount rate. Based on the position at 31 March 2017, the 2017/18 operating charge is expected to increase by around £100m year on year, impacting EBITDA, primarily reflecting the decline in market conditions, our re-assessment of the demographic assumptions and the impact of membership experience adjustments. The higher deficit will also lead to an increase in the pension interest expense within specific items to c.£220m in 2017/18 from £209m this year.
15
BT Group plc
Group results for the year to 31 March 2017 1
Note: The comparative information of the current period results has been revised to reflect the outcome of the investigation into our Italian business. These results also include EE which we acquired on 29 January 2016. Unless referred to as underlying adjusted for the acquisition of EE, the comparatives only include EE from the date of acquisition as explained in the notes on page 4.
Income statement
Reported revenue was £24,062m, up 27%, mainly as a result of the contribution of EE and foreign exchange. Adjusted2 revenue was £24,082m, up 28%. This includes a £522m favourable impact from foreign exchange movements and a £64m reduction in transit revenue. Underlying revenue1 excluding transit adjusted for the acquisition of EE was down 0.2% in line with our revised outlook of broadly flat.
Reported operating costs of £20,895m were up 36%, due mainly to EE and foreign exchange. Adjusted3 operating costs were £16,437m, up 32%. This includes £469m adverse impact from foreign exchange movements and a £61m reduction in transit costs. Underlying operating costs2,3 excluding transit adjusted for the acquisition of EE were up 1%. Net labour costs of £4,775m were up 13%, reflecting the additional EE employees that have joined the group. Property and energy costs were up 17%, network operating and IT costs up 53% and payments to telecommunications operators up 22%, all primarily driven by EE. BT Sport programme rights charges were £714m, up £170m mainly as a result of additional UEFA rights costs and the new Premier League rights contract. Other costs of £6,110m were up 61%, reflecting EE. Reported profit before tax was £2,354m, down 19%. Adjusted2 profit before tax increased 5% to £3,532m. The effective tax rate on profit before specific items was 18.8% (2015/16: 18.1%). Adjusted2 EBITDA of £7,645m was up 18% in line with our revised outlook of around £7.6bn. Underlying EBITDA2 adjusted for the acquisition of EE was down 2.9% mainly as a result of the UK public sector and our investment in improving customer experience. Depreciation and amortisation of £3,510m was up 33% largely due to the impact of EE. Reported net finance expense was £804m while adjusted1 net finance expense was £594m, up £111m primarily due to higher net debt as a result of our acquisition of EE. Reported EPS was 19.2p, down 33%. Adjusted2 EPS of 28.9p was down 9%. These are based on a weighted average number of shares in issue of 9,938m (2015/16: 8,619m), up 15%, mainly reflecting the additional shares we issued as part of our acquisition of EE on 29 January 2016.
Specific items (Note 4 to the condensed consolidated financial statements)
Specific items resulted in a net charge after tax of £961m (2015/16: £278m). This reflects the following: Investigation into our Italian business We’ve recognised costs of £260m (2015/16: £nil) reflecting the £245m impact arising from current year changes in accounting estimates with respect to the value of the assets and liabilities of our Italian business held at 31 March 2016 and £15m of costs associated with the investigation. See page 7. Regulatory matters We’ve recognised £479m (2015/16: £nil) of net regulatory risk costs. These relate to Deemed Consent of £342m and the re-assessment of other regulatory provisions of £137m.
Re-assessment of other regulatory provisions – We’ve assessed the other regulatory risk provisions following
Ofcom’s publication of its final statement on its Business Connectivity Review, Leased Lines Charges Control and
Cost Attribution Review in April 2016 and its final determination on disputes in relation to the Special Fault
Investigation and Time Related Charges in November 2016, together with a review of our regulatory risk position in
relation to other historical matters.
Ladder settlement – During the year we recognised £8m (2015/16: £203m) of both transit revenue and costs, with
no EBITDA impact, being the effect of ladder pricing agreements relating to previous years.
1 Excludes specific items, foreign exchange movements and disposals and is calculated as though EE had been part of the group from 1 April 2015. This differs from how we usually adjust for acquisitions as explained on page 4
2 Before specific items, which are defined on page 4 3 Before depreciation and amortisation
16
Out of period irrecoverable VAT We recognised £30m (2015/16: £nil) for the year in relation to out of period irrecoverable VAT.
EE acquisition and integration costs
During the year, we incurred £215m (2015/16: £116m) of acquisition and integration related costs for EE.
Disposal of business A profit on disposal of a business was recognised of £16m (2015/16: £nil).
Net interest expense During the year, we incurred £210m (2015/16: £221m) of interest cost in relation to our defined benefit pension obligations and the out of period irrecoverable VAT claim. Prior year specific items The following specific items were also recognised in the prior year: Property rationalisation costs - In 2015/16 we recognised a charge of £29m in relation to the rationalisation of the
group’s property portfolio.
EE fair value adjustment - In 2015/16, we recognised a fair value adjustment on the acquisition of EE which reduced
the amount of deferred income in relation to its prepaid subscriber base by £70m. This amount was released as a
reduction to revenue in the period between acquisition and 31 March 2016, reflecting the period over which EE
provided the related service.
Net interest expense – In 2015/16 we recognised £8m of interest expense in relation to our acquisition of EE.
Tax on specific items A tax credit of £217m (2015/16: £166m) was recognised in relation to specific items and the re-measurement of deferred tax.
Capital expenditure
Capital expenditure was £3,454m (2015/16: £2,622m). This consists of gross expenditure of £3,426m (2015/16: £2,731m) which has been increased by net grant deferral of £28m (2015/16: £109m decreased by net grant funding) mainly relating to deferral of grant funding on the BDUK programme. Our base-case assumption for take-up in BDUK areas has been increased to 39% following our review of the level of customer take-up. Under the terms of the BDUK programme, we have a potential obligation to either re-invest or repay grant funding depending on factors including the level of customer take-up achieved. While we have recognised gross grant funding of £160m (2015/16: £338m) in line with network build in the year, we have also deferred £188m (2015/16: £229m) of the total grant funding to reflect higher take-up levels on a number of contracts. To date we have deferred £446m (Q4 2015/16: £258m) of grant funding. Free cash flow Net cash inflow from operating activities was up £1,023m at £6,174m. Normalised free cash flow1 was £2,782m, above our revised outlook due to early customer collections that we will now not receive next year. Normalised free cash flow1 was down £316m compared with prior year primarily due to the impact of the cash outflows in our Italian business as we unwound the full effects of inappropriate working capital practices, as well as higher capital expenditure relating to the ESN contract and EE integration, partially offset by the benefit of an additional 10 months of EE. The net cash cost of specific items was £205m (2015/16: £232m). This includes EE integration cost payments of £72m (2015/16: £114m EE acquisition-related cost payments). After specific items and a £110m (2015/16: £203m) cash tax benefit from pension deficit payments, free cash flow was an inflow of £2,687m (2015/16: £3,069m).
1 Before specific items, pension deficit payments and the cash tax benefit of pension deficit payments
17
Operating review
Consumer
Fourth quarter to 31 March Year to 31 March
2017 20161 Change 2017 20161 Change
£m £m £m % £m £m £m %
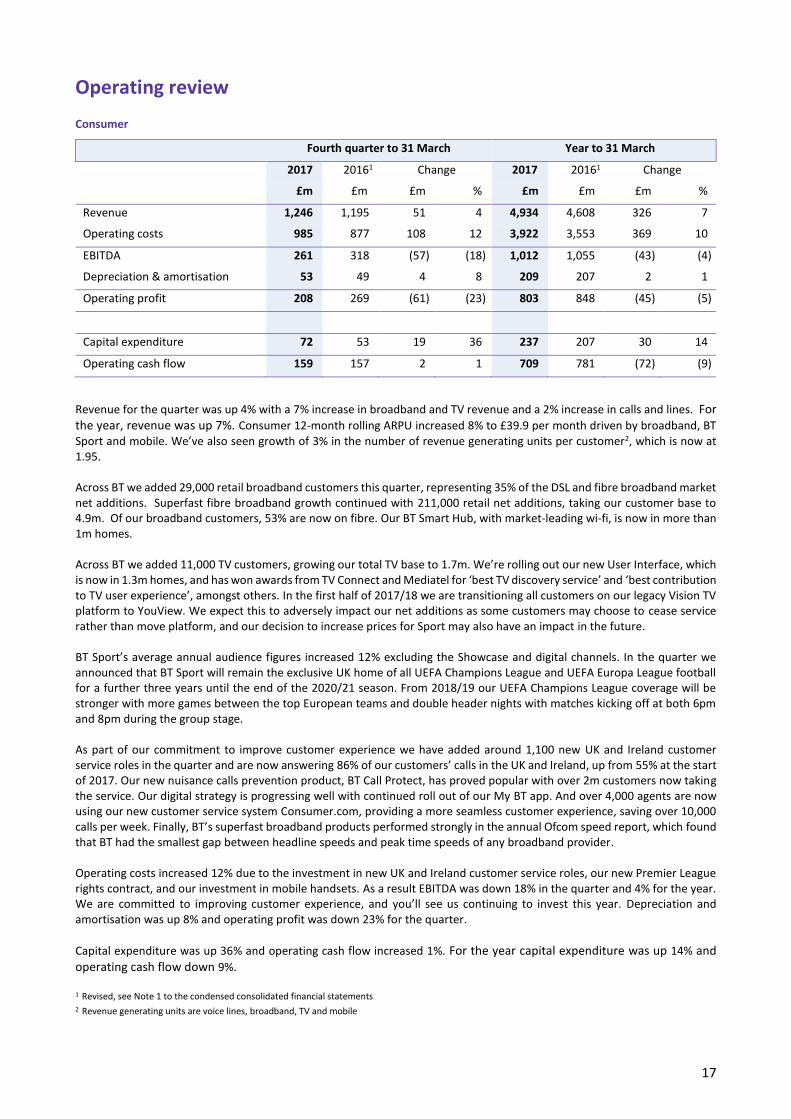
Revenue 1,246 1,195 51 4 4,934 4,608 326 7
Operating costs 985 877 108 12 3,922 3,553 369 10
EBITDA 261 318 (57) (18) 1,012 1,055 (43) (4)
Depreciation & amortisation 53 49 4 8 209 207 2 1
Operating profit 208 269 (61) (23) 803 848 (45) (5)
Capital expenditure 72 53 19 36 237 207 30 14
Operating cash flow 159 157 2 1 709 781 (72) (9)
Revenue for the quarter was up 4% with a 7% increase in broadband and TV revenue and a 2% increase in calls and lines. For the year, revenue was up 7%. Consumer 12-month rolling ARPU increased 8% to £39.9 per month driven by broadband, BT Sport and mobile. We’ve also seen growth of 3% in the number of revenue generating units per customer2, which is now at 1.95. Across BT we added 29,000 retail broadband customers this quarter, representing 35% of the DSL and fibre broadband market net additions. Superfast fibre broadband growth continued with 211,000 retail net additions, taking our customer base to 4.9m. Of our broadband customers, 53% are now on fibre. Our BT Smart Hub, with market-leading wi-fi, is now in more than 1m homes. Across BT we added 11,000 TV customers, growing our total TV base to 1.7m. We’re rolling out our new User Interface, which is now in 1.3m homes, and has won awards from TV Connect and Mediatel for ‘best TV discovery service’ and ‘best contribution to TV user experience’, amongst others. In the first half of 2017/18 we are transitioning all customers on our legacy Vision TV platform to YouView. We expect this to adversely impact our net additions as some customers may choose to cease service rather than move platform, and our decision to increase prices for Sport may also have an impact in the future. BT Sport’s average annual audience figures increased 12% excluding the Showcase and digital channels. In the quarter we announced that BT Sport will remain the exclusive UK home of all UEFA Champions League and UEFA Europa League football for a further three years until the end of the 2020/21 season. From 2018/19 our UEFA Champions League coverage will be stronger with more games between the top European teams and double header nights with matches kicking off at both 6pm and 8pm during the group stage. As part of our commitment to improve customer experience we have added around 1,100 new UK and Ireland customer service roles in the quarter and are now answering 86% of our customers’ calls in the UK and Ireland, up from 55% at the start of 2017. Our new nuisance calls prevention product, BT Call Protect, has proved popular with over 2m customers now taking the service. Our digital strategy is progressing well with continued roll out of our My BT app. And over 4,000 agents are now using our new customer service system Consumer.com, providing a more seamless customer experience, saving over 10,000 calls per week. Finally, BT’s superfast broadband products performed strongly in the annual Ofcom speed report, which found that BT had the smallest gap between headline speeds and peak time speeds of any broadband provider. Operating costs increased 12% due to the investment in new UK and Ireland customer service roles, our new Premier League rights contract, and our investment in mobile handsets. As a result EBITDA was down 18% in the quarter and 4% for the year. We are committed to improving customer experience, and you’ll see us continuing to invest this year. Depreciation and amortisation was up 8% and operating profit was down 23% for the quarter.
Capital expenditure was up 36% and operating cash flow increased 1%. For the year capital expenditure was up 14% and operating cash flow down 9%. 1 Revised, see Note 1 to the condensed consolidated financial statements 2 Revenue generating units are voice lines, broadband, TV and mobile
18
EE Fourth quarter to 31 March Year to 31 March
2017 20161 Change 2017 20161 Change
£m £m £m % £m £m £m %
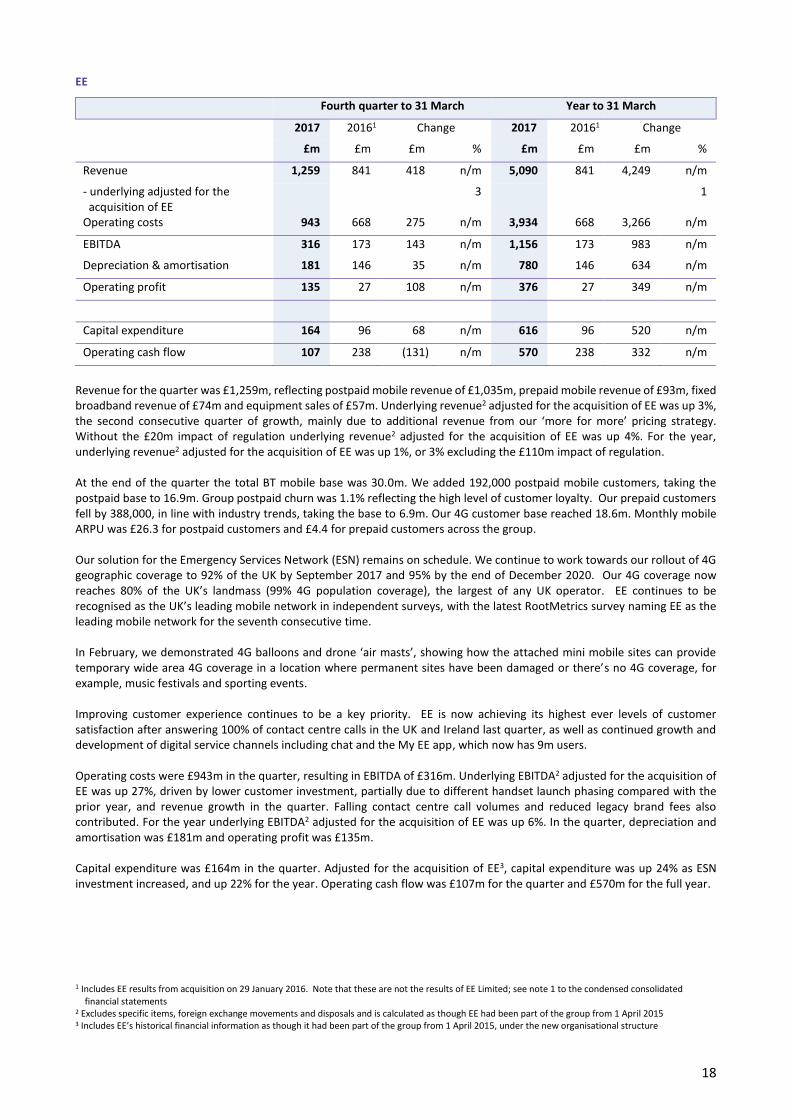
Revenue 1,259 841 418 n/m 5,090 841 4,249 n/m
- underlying adjusted for the acquisition of EE
3
1
Operating costs 943 668 275 n/m 3,934 668 3,266 n/m
EBITDA 316 173 143 n/m 1,156 173 983 n/m
Depreciation & amortisation 181 146 35 n/m 780 146 634 n/m
Operating profit 135 27 108 n/m 376 27 349 n/m
Capital expenditure 164 96 68 n/m 616 96 520 n/m
Operating cash flow 107 238 (131) n/m 570 238 332 n/m
Revenue for the quarter was £1,259m, reflecting postpaid mobile revenue of £1,035m, prepaid mobile revenue of £93m, fixed broadband revenue of £74m and equipment sales of £57m. Underlying revenue2 adjusted for the acquisition of EE was up 3%, the second consecutive quarter of growth, mainly due to additional revenue from our ‘more for more’ pricing strategy. Without the £20m impact of regulation underlying revenue2 adjusted for the acquisition of EE was up 4%. For the year, underlying revenue2 adjusted for the acquisition of EE was up 1%, or 3% excluding the £110m impact of regulation. At the end of the quarter the total BT mobile base was 30.0m. We added 192,000 postpaid mobile customers, taking the postpaid base to 16.9m. Group postpaid churn was 1.1% reflecting the high level of customer loyalty. Our prepaid customers fell by 388,000, in line with industry trends, taking the base to 6.9m. Our 4G customer base reached 18.6m. Monthly mobile ARPU was £26.3 for postpaid customers and £4.4 for prepaid customers across the group. Our solution for the Emergency Services Network (ESN) remains on schedule. We continue to work towards our rollout of 4G geographic coverage to 92% of the UK by September 2017 and 95% by the end of December 2020. Our 4G coverage now reaches 80% of the UK’s landmass (99% 4G population coverage), the largest of any UK operator. EE continues to be recognised as the UK’s leading mobile network in independent surveys, with the latest RootMetrics survey naming EE as the leading mobile network for the seventh consecutive time. In February, we demonstrated 4G balloons and drone ‘air masts’, showing how the attached mini mobile sites can provide temporary wide area 4G coverage in a location where permanent sites have been damaged or there’s no 4G coverage, for example, music festivals and sporting events. Improving customer experience continues to be a key priority. EE is now achieving its highest ever levels of customer satisfaction after answering 100% of contact centre calls in the UK and Ireland last quarter, as well as continued growth and development of digital service channels including chat and the My EE app, which now has 9m users. Operating costs were £943m in the quarter, resulting in EBITDA of £316m. Underlying EBITDA2 adjusted for the acquisition of EE was up 27%, driven by lower customer investment, partially due to different handset launch phasing compared with the prior year, and revenue growth in the quarter. Falling contact centre call volumes and reduced legacy brand fees also contributed. For the year underlying EBITDA2 adjusted for the acquisition of EE was up 6%. In the quarter, depreciation and amortisation was £181m and operating profit was £135m. Capital expenditure was £164m in the quarter. Adjusted for the acquisition of EE3, capital expenditure was up 24% as ESN investment increased, and up 22% for the year. Operating cash flow was £107m for the quarter and £570m for the full year.
1 Includes EE results from acquisition on 29 January 2016. Note that these are not the results of EE Limited; see note 1 to the condensed consolidated financial statements
2 Excludes specific items, foreign exchange movements and disposals and is calculated as though EE had been part of the group from 1 April 2015 3 Includes EE’s historical financial information as though it had been part of the group from 1 April 2015, under the new organisational structure
19
Business and Public Sector
Fourth quarter to 31 March Year to 31 March
2017 20161 Change 2017 20161 Change
£m £m £m % £m £m £m %
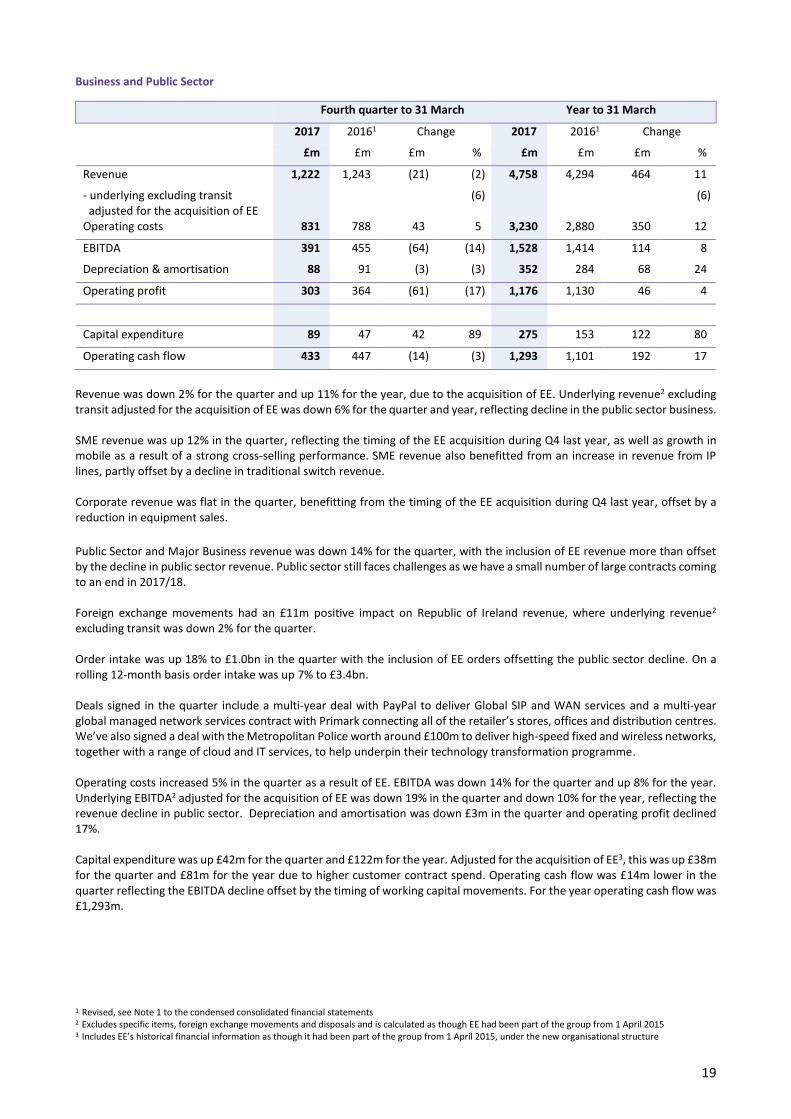
Revenue 1,222 1,243 (21) (2) 4,758 4,294 464 11
- underlying excluding transit adjusted for the acquisition of EE
(6)
(6)
Operating costs 831 788 43 5 3,230 2,880 350 12
EBITDA 391 455 (64) (14) 1,528 1,414 114 8
Depreciation & amortisation 88 91 (3) (3) 352 284 68 24
Operating profit 303 364 (61) (17) 1,176 1,130 46 4
Capital expenditure 89 47 42 89 275 153 122 80
Operating cash flow 433 447 (14) (3) 1,293 1,101 192 17
Revenue was down 2% for the quarter and up 11% for the year, due to the acquisition of EE. Underlying revenue2 excluding transit adjusted for the acquisition of EE was down 6% for the quarter and year, reflecting decline in the public sector business. SME revenue was up 12% in the quarter, reflecting the timing of the EE acquisition during Q4 last year, as well as growth in mobile as a result of a strong cross-selling performance. SME revenue also benefitted from an increase in revenue from IP lines, partly offset by a decline in traditional switch revenue. Corporate revenue was flat in the quarter, benefitting from the timing of the EE acquisition during Q4 last year, offset by a reduction in equipment sales.
Public Sector and Major Business revenue was down 14% for the quarter, with the inclusion of EE revenue more than offset by the decline in public sector revenue. Public sector still faces challenges as we have a small number of large contracts coming to an end in 2017/18. Foreign exchange movements had an £11m positive impact on Republic of Ireland revenue, where underlying revenue2 excluding transit was down 2% for the quarter. Order intake was up 18% to £1.0bn in the quarter with the inclusion of EE orders offsetting the public sector decline. On a rolling 12-month basis order intake was up 7% to £3.4bn. Deals signed in the quarter include a multi-year deal with PayPal to deliver Global SIP and WAN services and a multi-year global managed network services contract with Primark connecting all of the retailer’s stores, offices and distribution centres. We’ve also signed a deal with the Metropolitan Police worth around £100m to deliver high-speed fixed and wireless networks, together with a range of cloud and IT services, to help underpin their technology transformation programme. Operating costs increased 5% in the quarter as a result of EE. EBITDA was down 14% for the quarter and up 8% for the year. Underlying EBITDA2 adjusted for the acquisition of EE was down 19% in the quarter and down 10% for the year, reflecting the revenue decline in public sector. Depreciation and amortisation was down £3m in the quarter and operating profit declined 17%. Capital expenditure was up £42m for the quarter and £122m for the year. Adjusted for the acquisition of EE3, this was up £38m for the quarter and £81m for the year due to higher customer contract spend. Operating cash flow was £14m lower in the quarter reflecting the EBITDA decline offset by the timing of working capital movements. For the year operating cash flow was £1,293m. 1 Revised, see Note 1 to the condensed consolidated financial statements 2 Excludes specific items, foreign exchange movements and disposals and is calculated as though EE had been part of the group from 1 April 2015 3 Includes EE’s historical financial information as though it had been part of the group from 1 April 2015, under the new organisational structure
20
Global Services
Fourth quarter to 31 March Year to 31 March
2017 20161 Change 2017 20161 Change
£m £m £m % £m £m £m %
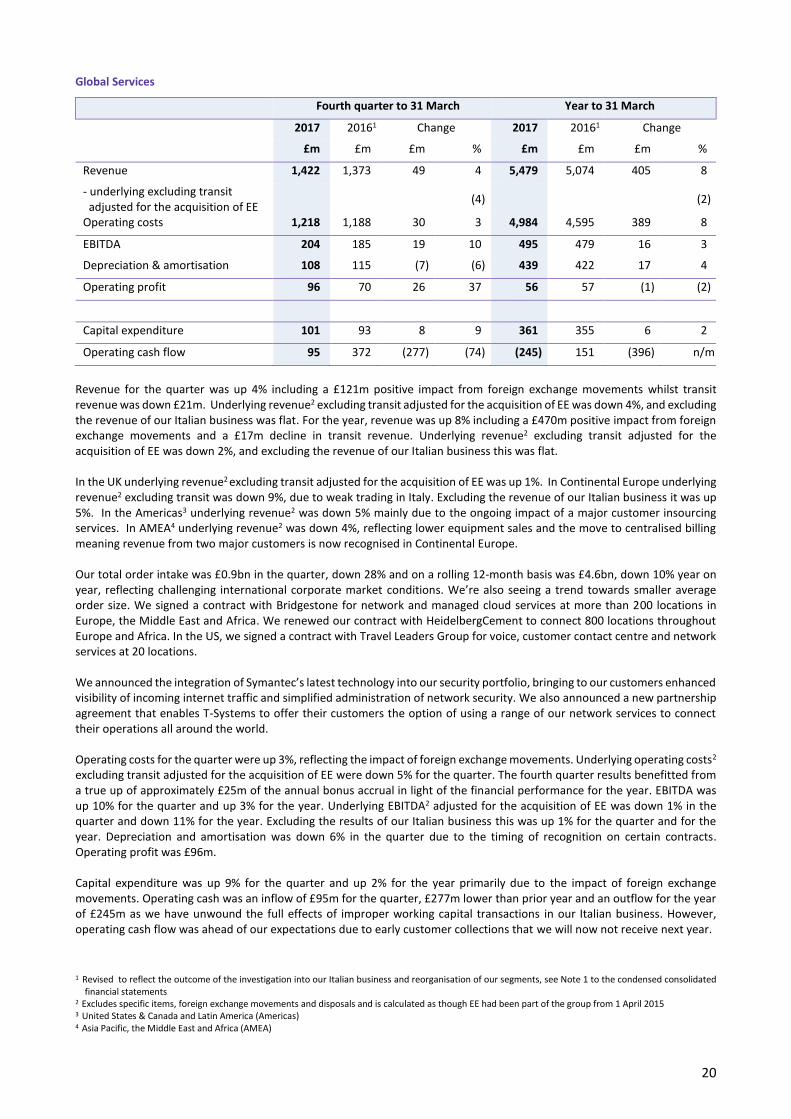
Revenue 1,422 1,373 49 4 5,479 5,074 405 8
- underlying excluding transit adjusted for the acquisition of EE
(4)
(2)
Operating costs 1,218 1,188 30 3 4,984 4,595 389 8
EBITDA 204 185 19 10 495 479 16 3
Depreciation & amortisation 108 115 (7) (6) 439 422 17 4
Operating profit 96 70 26 37 56 57 (1) (2)
Capital expenditure 101 93 8 9 361 355 6 2
Operating cash flow 95 372 (277) (74) (245) 151 (396) n/m
Revenue for the quarter was up 4% including a £121m positive impact from foreign exchange movements whilst transit revenue was down £21m. Underlying revenue2 excluding transit adjusted for the acquisition of EE was down 4%, and excluding the revenue of our Italian business was flat. For the year, revenue was up 8% including a £470m positive impact from foreign exchange movements and a £17m decline in transit revenue. Underlying revenue2 excluding transit adjusted for the acquisition of EE was down 2%, and excluding the revenue of our Italian business this was flat. In the UK underlying revenue2 excluding transit adjusted for the acquisition of EE was up 1%. In Continental Europe underlying revenue2 excluding transit was down 9%, due to weak trading in Italy. Excluding the revenue of our Italian business it was up 5%. In the Americas3 underlying revenue2 was down 5% mainly due to the ongoing impact of a major customer insourcing services. In AMEA4 underlying revenue2 was down 4%, reflecting lower equipment sales and the move to centralised billing meaning revenue from two major customers is now recognised in Continental Europe. Our total order intake was £0.9bn in the quarter, down 28% and on a rolling 12-month basis was £4.6bn, down 10% year on year, reflecting challenging international corporate market conditions. We’re also seeing a trend towards smaller average order size. We signed a contract with Bridgestone for network and managed cloud services at more than 200 locations in Europe, the Middle East and Africa. We renewed our contract with HeidelbergCement to connect 800 locations throughout Europe and Africa. In the US, we signed a contract with Travel Leaders Group for voice, customer contact centre and network services at 20 locations. We announced the integration of Symantec’s latest technology into our security portfolio, bringing to our customers enhanced visibility of incoming internet traffic and simplified administration of network security. We also announced a new partnership agreement that enables T-Systems to offer their customers the option of using a range of our network services to connect their operations all around the world. Operating costs for the quarter were up 3%, reflecting the impact of foreign exchange movements. Underlying operating costs2 excluding transit adjusted for the acquisition of EE were down 5% for the quarter. The fourth quarter results benefitted from a true up of approximately £25m of the annual bonus accrual in light of the financial performance for the year. EBITDA was up 10% for the quarter and up 3% for the year. Underlying EBITDA2 adjusted for the acquisition of EE was down 1% in the quarter and down 11% for the year. Excluding the results of our Italian business this was up 1% for the quarter and for the year. Depreciation and amortisation was down 6% in the quarter due to the timing of recognition on certain contracts. Operating profit was £96m. Capital expenditure was up 9% for the quarter and up 2% for the year primarily due to the impact of foreign exchange movements. Operating cash was an inflow of £95m for the quarter, £277m lower than prior year and an outflow for the year of £245m as we have unwound the full effects of improper working capital transactions in our Italian business. However, operating cash flow was ahead of our expectations due to early customer collections that we will now not receive next year.
1 Revised to reflect the outcome of the investigation into our Italian business and reorganisation of our segments, see Note 1 to the condensed consolidated financial statements
2 Excludes specific items, foreign exchange movements and disposals and is calculated as though EE had been part of the group from 1 April 2015 3 United States & Canada and Latin America (Americas) 4 Asia Pacific, the Middle East and Africa (AMEA)
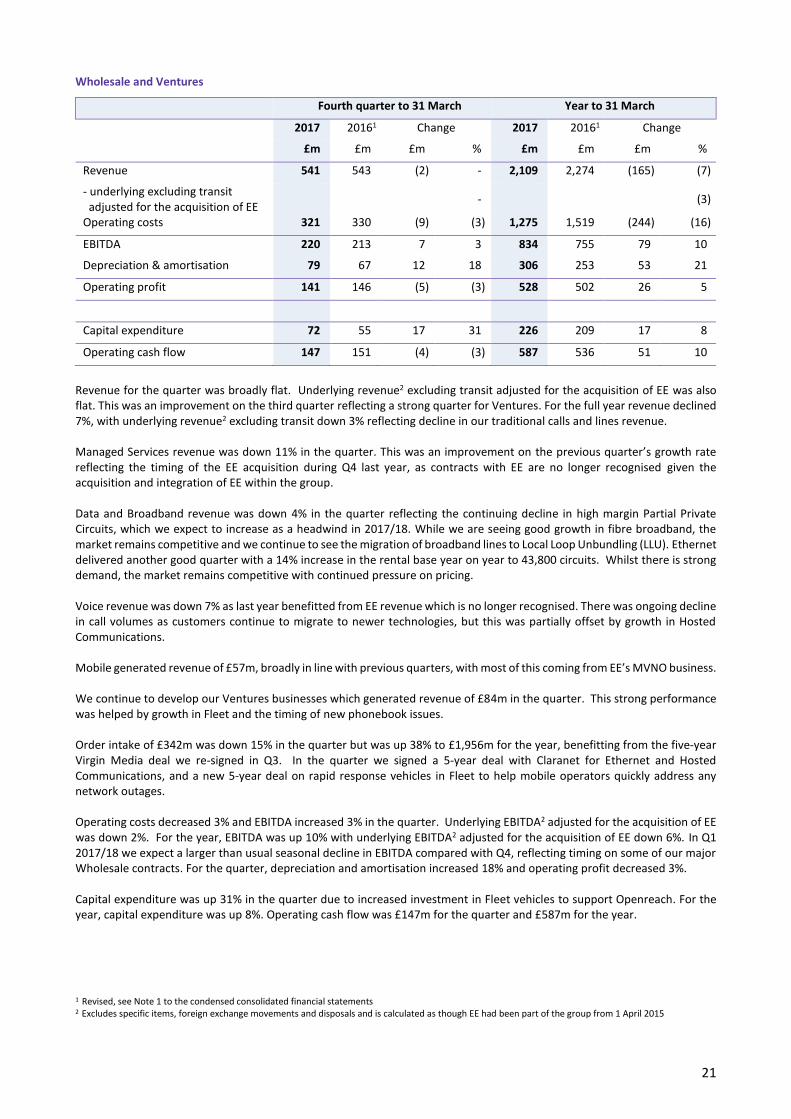
21
Wholesale and Ventures
Fourth quarter to 31 March Year to 31 March
2017 20161 Change 2017 20161 Change
£m £m £m % £m £m £m %
Revenue 541 543 (2) - 2,109 2,274 (165) (7)
- underlying excluding transit adjusted for the acquisition of EE
-
(3)
Operating costs 321 330 (9) (3) 1,275 1,519 (244) (16)
EBITDA 220 213 7 3 834 755 79 10
Depreciation & amortisation 79 67 12 18 306 253 53 21
Operating profit 141 146 (5) (3) 528 502 26 5
Capital expenditure 72 55 17 31 226 209 17 8
Operating cash flow 147 151 (4) (3) 587 536 51 10
Revenue for the quarter was broadly flat. Underlying revenue2 excluding transit adjusted for the acquisition of EE was also flat. This was an improvement on the third quarter reflecting a strong quarter for Ventures. For the full year revenue declined 7%, with underlying revenue2 excluding transit down 3% reflecting decline in our traditional calls and lines revenue. Managed Services revenue was down 11% in the quarter. This was an improvement on the previous quarter’s growth rate reflecting the timing of the EE acquisition during Q4 last year, as contracts with EE are no longer recognised given the acquisition and integration of EE within the group. Data and Broadband revenue was down 4% in the quarter reflecting the continuing decline in high margin Partial Private Circuits, which we expect to increase as a headwind in 2017/18. While we are seeing good growth in fibre broadband, the market remains competitive and we continue to see the migration of broadband lines to Local Loop Unbundling (LLU). Ethernet delivered another good quarter with a 14% increase in the rental base year on year to 43,800 circuits. Whilst there is strong demand, the market remains competitive with continued pressure on pricing. Voice revenue was down 7% as last year benefitted from EE revenue which is no longer recognised. There was ongoing decline in call volumes as customers continue to migrate to newer technologies, but this was partially offset by growth in Hosted Communications. Mobile generated revenue of £57m, broadly in line with previous quarters, with most of this coming from EE’s MVNO business. We continue to develop our Ventures businesses which generated revenue of £84m in the quarter. This strong performance was helped by growth in Fleet and the timing of new phonebook issues. Order intake of £342m was down 15% in the quarter but was up 38% to £1,956m for the year, benefitting from the five-year Virgin Media deal we re-signed in Q3. In the quarter we signed a 5-year deal with Claranet for Ethernet and Hosted Communications, and a new 5-year deal on rapid response vehicles in Fleet to help mobile operators quickly address any network outages. Operating costs decreased 3% and EBITDA increased 3% in the quarter. Underlying EBITDA2 adjusted for the acquisition of EE was down 2%. For the year, EBITDA was up 10% with underlying EBITDA2 adjusted for the acquisition of EE down 6%. In Q1 2017/18 we expect a larger than usual seasonal decline in EBITDA compared with Q4, reflecting timing on some of our major Wholesale contracts. For the quarter, depreciation and amortisation increased 18% and operating profit decreased 3%. Capital expenditure was up 31% in the quarter due to increased investment in Fleet vehicles to support Openreach. For the year, capital expenditure was up 8%. Operating cash flow was £147m for the quarter and £587m for the year.
1 Revised, see Note 1 to the condensed consolidated financial statements 2 Excludes specific items, foreign exchange movements and disposals and is calculated as though EE had been part of the group from 1 April 2015
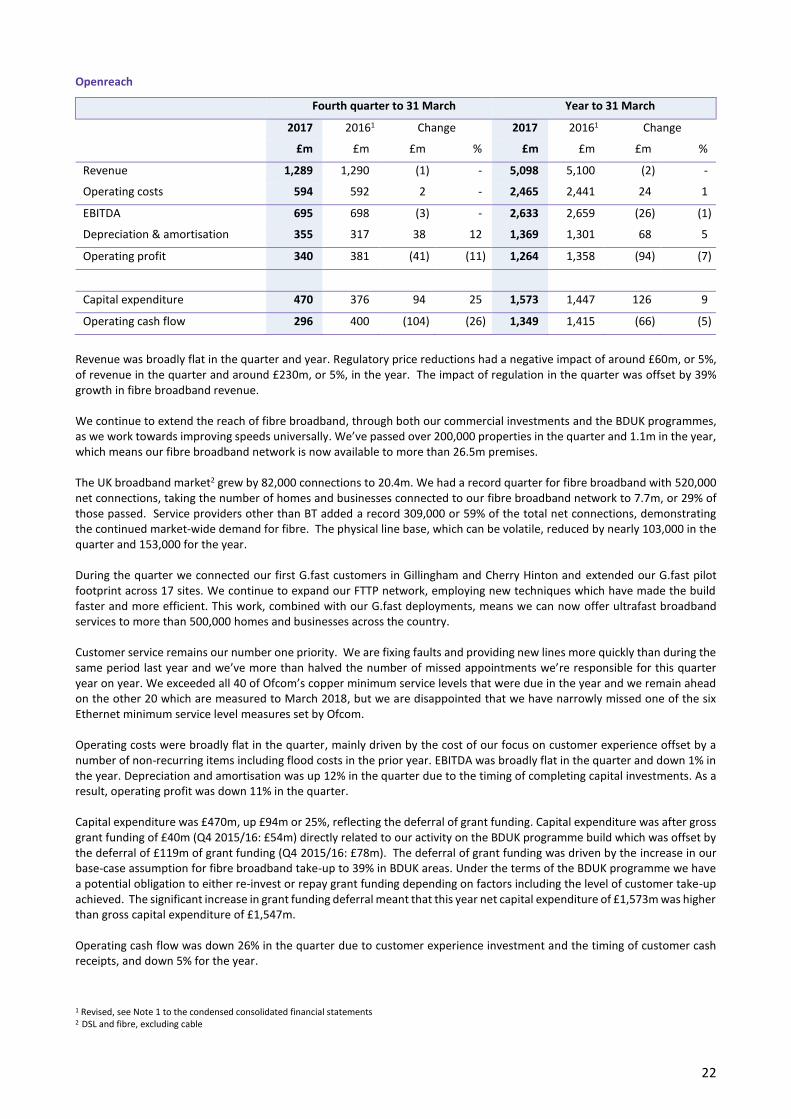
22
Openreach
Fourth quarter to 31 March Year to 31 March
2017 20161 Change 2017 20161 Change
£m £m £m % £m £m £m %
Revenue 1,289 1,290 (1) - 5,098 5,100 (2) -
Operating costs 594 592 2 - 2,465 2,441 24 1
EBITDA 695 698 (3) - 2,633 2,659 (26) (1)
Depreciation & amortisation 355 317 38 12 1,369 1,301 68 5
Operating profit 340 381 (41) (11) 1,264 1,358 (94) (7)
Capital expenditure 470 376 94 25 1,573 1,447 126 9
Operating cash flow 296 400 (104) (26) 1,349 1,415 (66) (5)
Revenue was broadly flat in the quarter and year. Regulatory price reductions had a negative impact of around £60m, or 5%, of revenue in the quarter and around £230m, or 5%, in the year. The impact of regulation in the quarter was offset by 39% growth in fibre broadband revenue. We continue to extend the reach of fibre broadband, through both our commercial investments and the BDUK programmes, as we work towards improving speeds universally. We’ve passed over 200,000 properties in the quarter and 1.1m in the year, which means our fibre broadband network is now available to more than 26.5m premises. The UK broadband market2 grew by 82,000 connections to 20.4m. We had a record quarter for fibre broadband with 520,000 net connections, taking the number of homes and businesses connected to our fibre broadband network to 7.7m, or 29% of those passed. Service providers other than BT added a record 309,000 or 59% of the total net connections, demonstrating the continued market-wide demand for fibre. The physical line base, which can be volatile, reduced by nearly 103,000 in the quarter and 153,000 for the year. During the quarter we connected our first G.fast customers in Gillingham and Cherry Hinton and extended our G.fast pilot footprint across 17 sites. We continue to expand our FTTP network, employing new techniques which have made the build faster and more efficient. This work, combined with our G.fast deployments, means we can now offer ultrafast broadband services to more than 500,000 homes and businesses across the country. Customer service remains our number one priority. We are fixing faults and providing new lines more quickly than during the same period last year and we’ve more than halved the number of missed appointments we’re responsible for this quarter year on year. We exceeded all 40 of Ofcom’s copper minimum service levels that were due in the year and we remain ahead on the other 20 which are measured to March 2018, but we are disappointed that we have narrowly missed one of the six Ethernet minimum service level measures set by Ofcom. Operating costs were broadly flat in the quarter, mainly driven by the cost of our focus on customer experience offset by a number of non-recurring items including flood costs in the prior year. EBITDA was broadly flat in the quarter and down 1% in the year. Depreciation and amortisation was up 12% in the quarter due to the timing of completing capital investments. As a result, operating profit was down 11% in the quarter. Capital expenditure was £470m, up £94m or 25%, reflecting the deferral of grant funding. Capital expenditure was after gross grant funding of £40m (Q4 2015/16: £54m) directly related to our activity on the BDUK programme build which was offset by the deferral of £119m of grant funding (Q4 2015/16: £78m). The deferral of grant funding was driven by the increase in our base-case assumption for fibre broadband take-up to 39% in BDUK areas. Under the terms of the BDUK programme we have a potential obligation to either re-invest or repay grant funding depending on factors including the level of customer take-up achieved. The significant increase in grant funding deferral meant that this year net capital expenditure of £1,573m was higher than gross capital expenditure of £1,547m. Operating cash flow was down 26% in the quarter due to customer experience investment and the timing of customer cash receipts, and down 5% for the year.
1 Revised, see Note 1 to the condensed consolidated financial statements 2 DSL and fibre, excluding cable
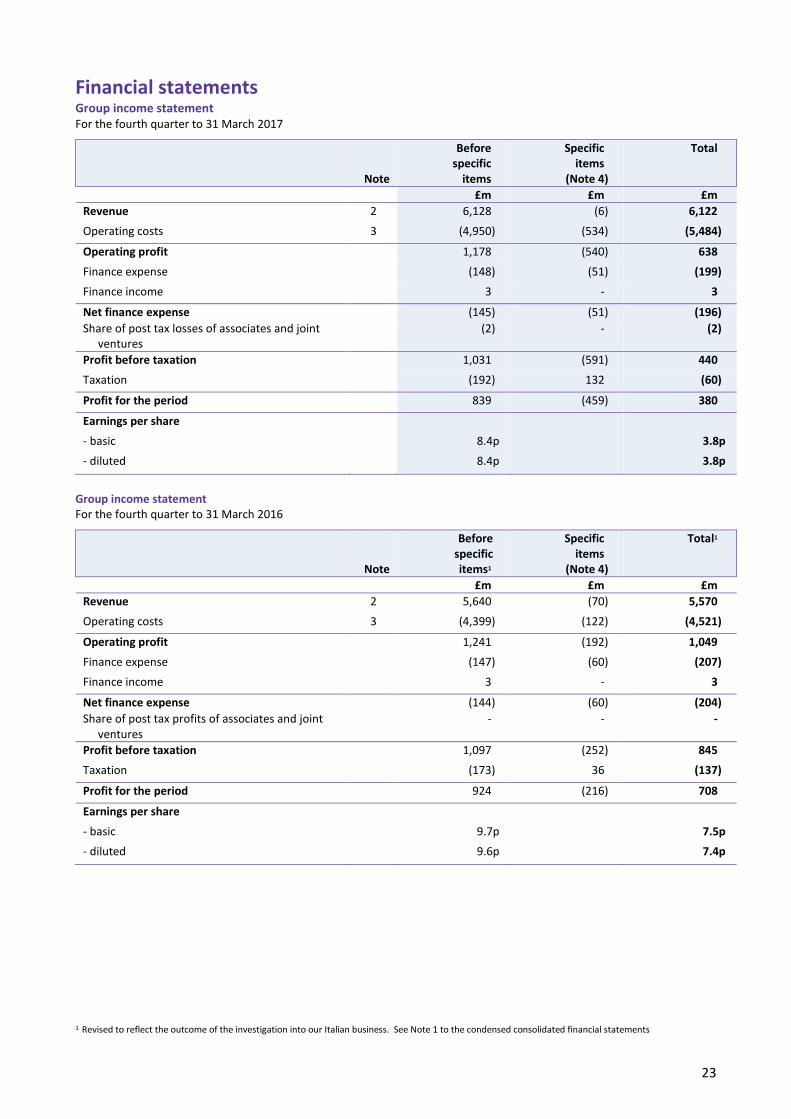
23
Financial statements Group income statement For the fourth quarter to 31 March 2017
Note
Before specific
items
Specific items
(Note 4)
Total
£m £m £m
Revenue 2 6,128 (6) 6,122
Operating costs 3 (4,950) (534) (5,484)
Operating profit 1,178 (540) 638
Finance expense (148) (51) (199)
Finance income 3 - 3
Net finance expense (145) (51) (196)
Share of post tax losses of associates and joint ventures
(2) - (2)
Profit before taxation 1,031 (591) 440
Taxation (192) 132 (60)
Profit for the period 839 (459) 380
Earnings per share
- basic 8.4p 3.8p
- diluted 8.4p 3.8p
Group income statement For the fourth quarter to 31 March 2016
Note
Before specific items1
Specific items
(Note 4)
Total1
£m £m £m
Revenue 2 5,640 (70) 5,570
Operating costs 3 (4,399) (122) (4,521)
Operating profit 1,241 (192) 1,049
Finance expense (147) (60) (207)
Finance income 3 - 3
Net finance expense (144) (60) (204)
Share of post tax profits of associates and joint ventures
- - -
Profit before taxation 1,097 (252) 845
Taxation (173) 36 (137)
Profit for the period 924 (216) 708
Earnings per share
- basic 9.7p 7.5p
- diluted 9.6p 7.4p
1 Revised to reflect the outcome of the investigation into our Italian business. See Note 1 to the condensed consolidated financial statements
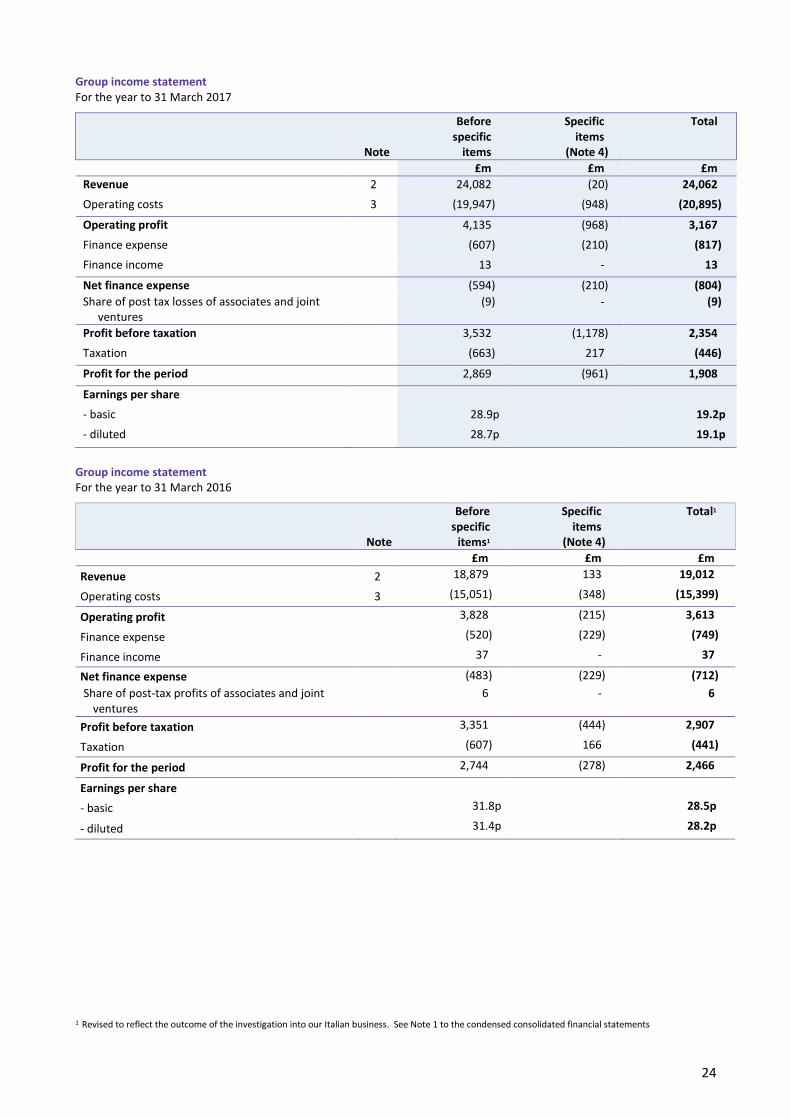
24
Group income statement For the year to 31 March 2017
Note
Before specific
items
Specific items
(Note 4)
Total
£m £m £m
Revenue 2 24,082 (20) 24,062
Operating costs 3 (19,947) (948) (20,895)
Operating profit 4,135 (968) 3,167
Finance expense (607) (210) (817)
Finance income 13 - 13
Net finance expense (594) (210) (804)
Share of post tax losses of associates and joint ventures
(9) - (9)
Profit before taxation 3,532 (1,178) 2,354
Taxation (663) 217 (446)
Profit for the period 2,869 (961) 1,908
Earnings per share
- basic 28.9p 19.2p
- diluted 28.7p 19.1p
Group income statement For the year to 31 March 2016
Note
Before specific
items1
Specific items
(Note 4)
Total1
£m £m £m
Revenue 2 18,879 133 19,012
Operating costs 3 (15,051) (348) (15,399)
Operating profit 3,828 (215) 3,613
Finance expense (520) (229) (749)
Finance income 37 - 37
Net finance expense (483) (229) (712)
Share of post-tax profits of associates and joint ventures
6 - 6
Profit before taxation 3,351 (444) 2,907
Taxation (607) 166 (441)
Profit for the period 2,744 (278) 2,466
Earnings per share
- basic 31.8p 28.5p
- diluted 31.4p 28.2p
1 Revised to reflect the outcome of the investigation into our Italian business. See Note 1 to the condensed consolidated financial statements
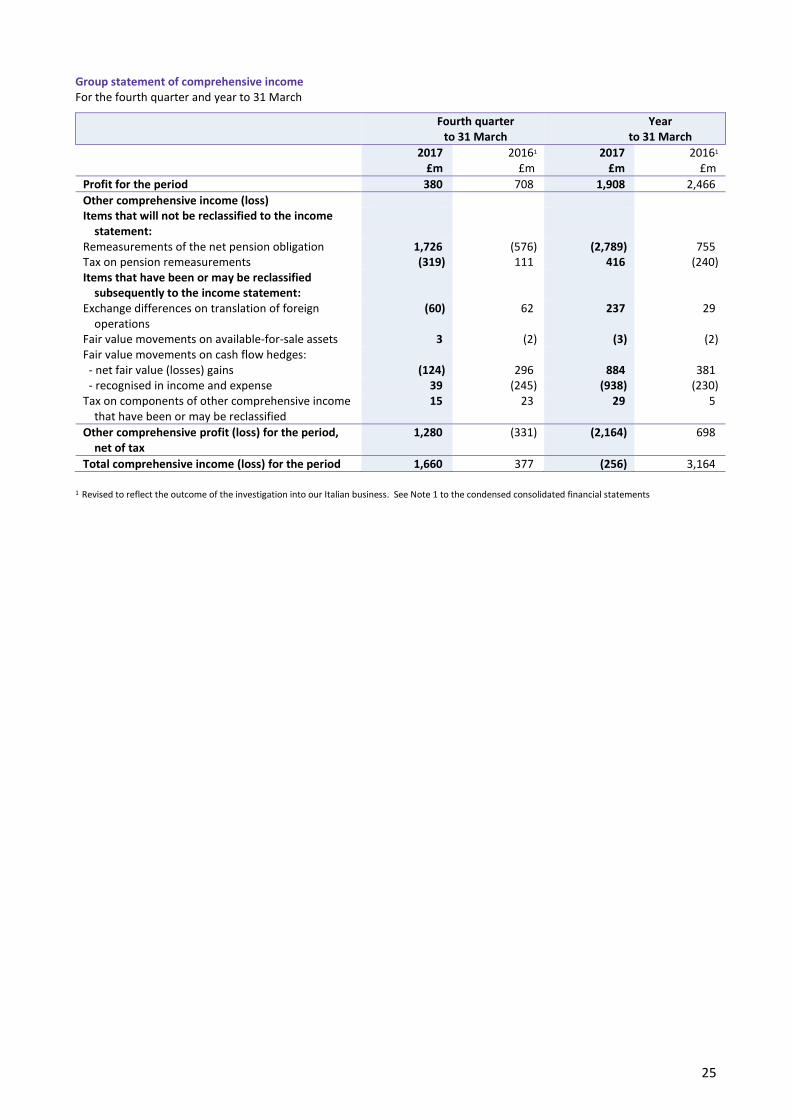
25
Group statement of comprehensive income For the fourth quarter and year to 31 March
Fourth quarter
to 31 March Year
to 31 March 2017 20161 2017 20161
£m £m £m £m
Profit for the period 380 708 1,908 2,466
Other comprehensive income (loss) Items that will not be reclassified to the income
statement:
Remeasurements of the net pension obligation 1,726 (576) (2,789) 755 Tax on pension remeasurements (319) 111 416 (240) Items that have been or may be reclassified
subsequently to the income statement:
Exchange differences on translation of foreign operations
(60) 62 237 29
Fair value movements on available-for-sale assets 3 (2) (3) (2) Fair value movements on cash flow hedges: - net fair value (losses) gains (124) 296 884 381 - recognised in income and expense 39 (245) (938) (230) Tax on components of other comprehensive income
that have been or may be reclassified 15 23 29 5
Other comprehensive profit (loss) for the period, net of tax
1,280 (331) (2,164) 698
Total comprehensive income (loss) for the period 1,660 377 (256) 3,164
1 Revised to reflect the outcome of the investigation into our Italian business. See Note 1 to the condensed consolidated financial statements
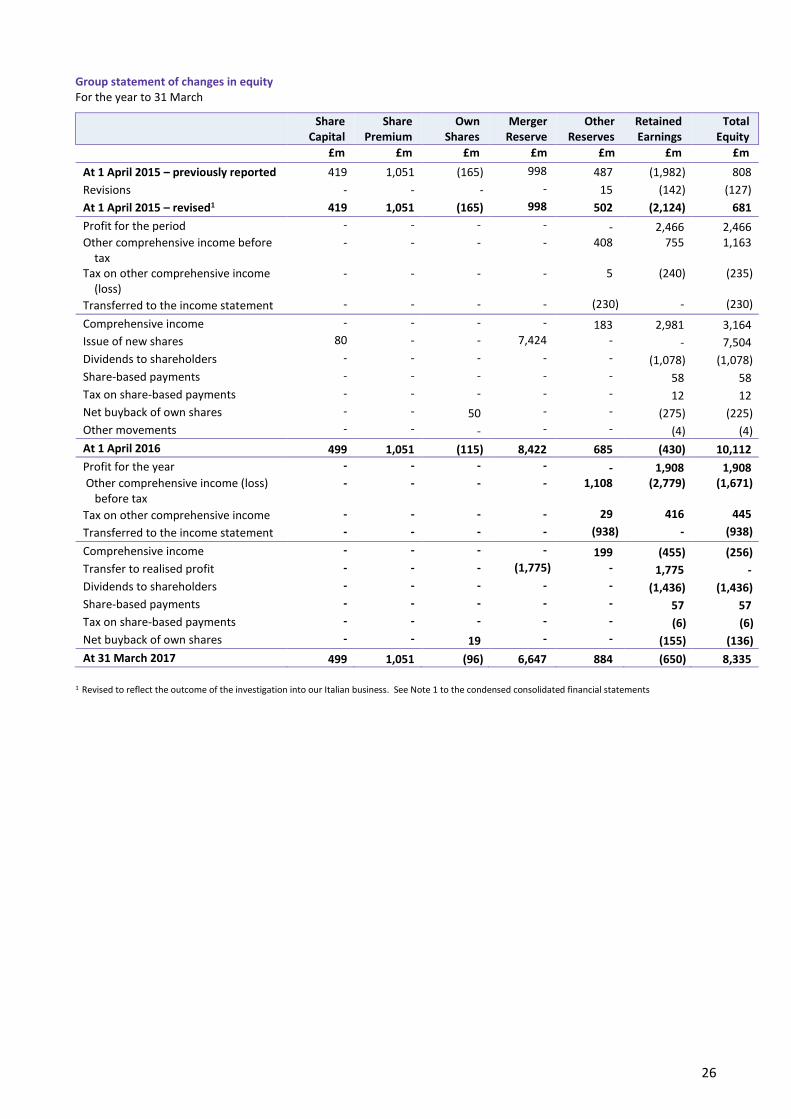
26
Group statement of changes in equity For the year to 31 March
Share
Capital Share
Premium Own
Shares Merger
Reserve Other
Reserves Retained Earnings
Total Equity
£m £m £m £m £m £m £m
At 1 April 2015 – previously reported 419 1,051 (165) 998 487 (1,982) 808
Revisions - - - - 15 (142) (127)
At 1 April 2015 – revised1 419 1,051 (165) 998 502 (2,124) 681
Profit for the period - - - - - 2,466 2,466 Other comprehensive income before
tax - - - - 408 755 1,163
Tax on other comprehensive income (loss)
- - - - 5 (240) (235)
Transferred to the income statement - - - - (230) - (230)
Comprehensive income - - - - 183 2,981 3,164
Issue of new shares 80 - - 7,424 - - 7,504
Dividends to shareholders - - - - - (1,078) (1,078)
Share-based payments - - - - - 58 58
Tax on share-based payments - - - - - 12 12
Net buyback of own shares - - 50 - - (275) (225)
Other movements - - - - - (4) (4)
At 1 April 2016 499 1,051 (115) 8,422 685 (430) 10,112
Profit for the year - - - - - 1,908 1,908 Other comprehensive income (loss)
before tax - - - - 1,108 (2,779) (1,671)
Tax on other comprehensive income - - - - 29 416 445
Transferred to the income statement - - - - (938) - (938)
Comprehensive income - - - - 199 (455) (256)
Transfer to realised profit - - - (1,775) - 1,775 -
Dividends to shareholders - - - - - (1,436) (1,436)
Share-based payments - - - - - 57 57
Tax on share-based payments - - - - - (6) (6)
Net buyback of own shares - - 19 - - (155) (136)
At 31 March 2017 499 1,051 (96) 6,647 884 (650) 8,335
1 Revised to reflect the outcome of the investigation into our Italian business. See Note 1 to the condensed consolidated financial statements
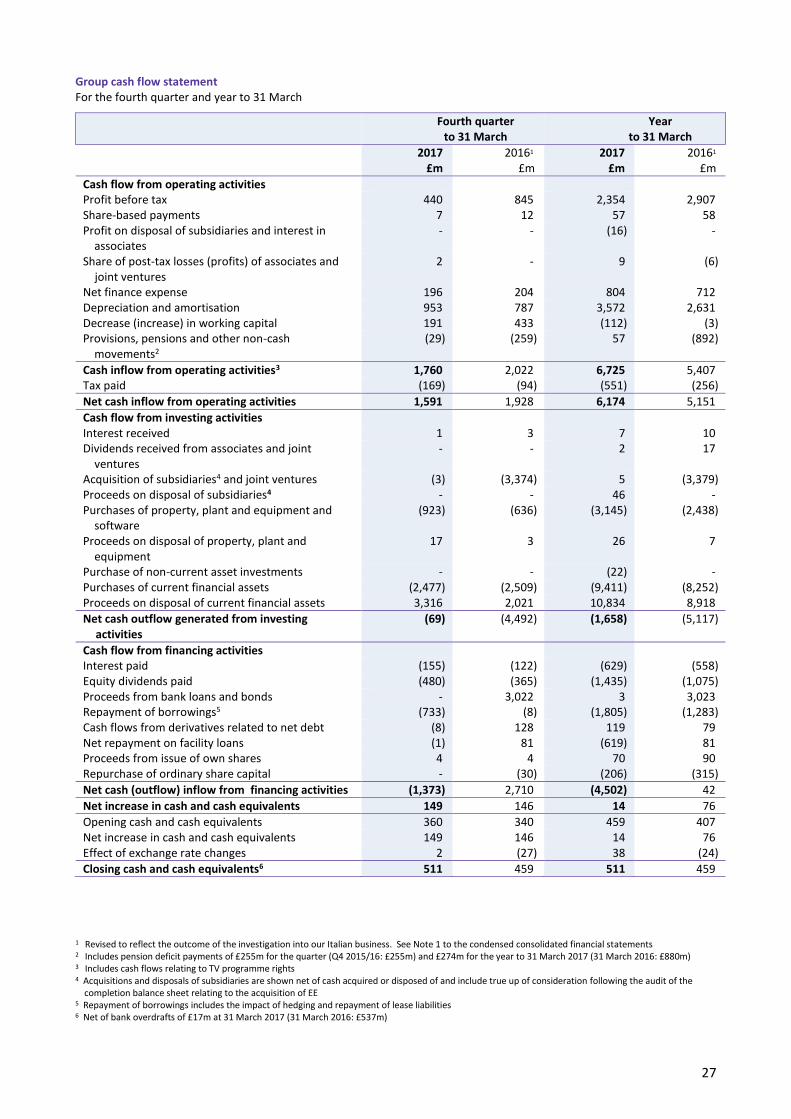
27
Group cash flow statement For the fourth quarter and year to 31 March
Fourth quarter
to 31 March Year
to 31 March 2017 20161 2017 20161
£m £m £m £m
Cash flow from operating activities Profit before tax 440 845 2,354 2,907 Share-based payments 7 12 57 58 Profit on disposal of subsidiaries and interest in
associates - - (16) -
Share of post-tax losses (profits) of associates and joint ventures
2 - 9 (6)
Net finance expense 196 204 804 712 Depreciation and amortisation 953 787 3,572 2,631 Decrease (increase) in working capital 191 433 (112) (3) Provisions, pensions and other non-cash
movements2
(29) (259) 57 (892)
Cash inflow from operating activities3 1,760 2,022 6,725 5,407 Tax paid (169) (94) (551) (256)
Net cash inflow from operating activities 1,591 1,928 6,174 5,151
Cash flow from investing activities Interest received 1 3 7 10 Dividends received from associates and joint
ventures - - 2 17
Acquisition of subsidiaries4 and joint ventures (3) (3,374) 5 (3,379) Proceeds on disposal of subsidiaries4 - - 46 - Purchases of property, plant and equipment and
software (923) (636) (3,145) (2,438)
Proceeds on disposal of property, plant and equipment
17 3 26 7
Purchase of non-current asset investments - - (22) - Purchases of current financial assets (2,477) (2,509) (9,411) (8,252) Proceeds on disposal of current financial assets 3,316 2,021 10,834 8,918
Net cash outflow generated from investing activities
(69) (4,492) (1,658) (5,117)
Cash flow from financing activities Interest paid (155) (122) (629) (558) Equity dividends paid (480) (365) (1,435) (1,075) Proceeds from bank loans and bonds - 3,022 3 3,023 Repayment of borrowings5 (733) (8) (1,805) (1,283) Cash flows from derivatives related to net debt (8) 128 119 79 Net repayment on facility loans (1) 81 (619) 81 Proceeds from issue of own shares 4 4 70 90 Repurchase of ordinary share capital - (30) (206) (315)
Net cash (outflow) inflow from financing activities (1,373) 2,710 (4,502) 42
Net increase in cash and cash equivalents 149 146 14 76
Opening cash and cash equivalents 360 340 459 407 Net increase in cash and cash equivalents 149 146 14 76 Effect of exchange rate changes 2 (27) 38 (24)
Closing cash and cash equivalents6 511 459 511 459
1 Revised to reflect the outcome of the investigation into our Italian business. See Note 1 to the condensed consolidated financial statements 2 Includes pension deficit payments of £255m for the quarter (Q4 2015/16: £255m) and £274m for the year to 31 March 2017 (31 March 2016: £880m) 3 Includes cash flows relating to TV programme rights 4 Acquisitions and disposals of subsidiaries are shown net of cash acquired or disposed of and include true up of consideration following the audit of the completion balance sheet relating to the acquisition of EE 5 Repayment of borrowings includes the impact of hedging and repayment of lease liabilities 6 Net of bank overdrafts of £17m at 31 March 2017 (31 March 2016: £537m)
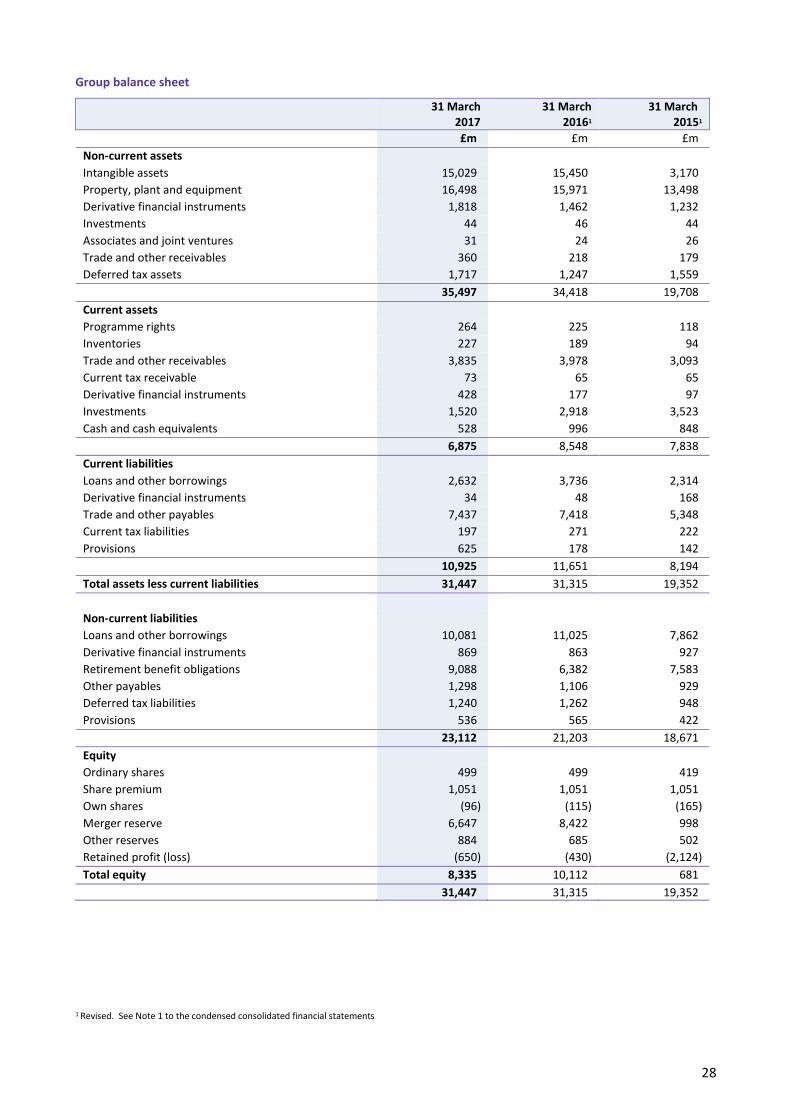
28
Group balance sheet
31 March 2017
31 March 20161
31 March 20151
£m £m £m
Non-current assets
Intangible assets 15,029 15,450 3,170
Property, plant and equipment 16,498 15,971 13,498
Derivative financial instruments 1,818 1,462 1,232
Investments 44 46 44
Associates and joint ventures 31 24 26
Trade and other receivables 360 218 179
Deferred tax assets 1,717 1,247 1,559
35,497 34,418 19,708
Current assets
Programme rights 264 225 118
Inventories 227 189 94
Trade and other receivables 3,835 3,978 3,093
Current tax receivable 73 65 65
Derivative financial instruments 428 177 97
Investments 1,520 2,918 3,523
Cash and cash equivalents 528 996 848
6,875 8,548 7,838
Current liabilities
Loans and other borrowings 2,632 3,736 2,314
Derivative financial instruments 34 48 168
Trade and other payables 7,437 7,418 5,348
Current tax liabilities 197 271 222
Provisions 625 178 142
10,925 11,651 8,194
Total assets less current liabilities 31,447 31,315 19,352
Non-current liabilities
Loans and other borrowings 10,081 11,025 7,862
Derivative financial instruments 869 863 927
Retirement benefit obligations 9,088 6,382 7,583
Other payables 1,298 1,106 929
Deferred tax liabilities 1,240 1,262 948
Provisions 536 565 422
23,112 21,203 18,671
Equity
Ordinary shares 499 499 419
Share premium 1,051 1,051 1,051
Own shares (96) (115) (165)
Merger reserve 6,647 8,422 998
Other reserves 884 685 502
Retained profit (loss) (650) (430) (2,124)
Total equity 8,335 10,112 681
31,447 31,315 19,352
1 Revised. See Note 1 to the condensed consolidated financial statements
29
Notes to the condensed consolidated financial statements 1 Basis of preparation and accounting policies
These condensed consolidated financial statements (‘the financial statements’) comprise the financial results of BT Group plc for the quarters and years to 31 March 2017 and 2016 together with the balance sheets at 31 March 2016 and 31 March 2015. The results for the year to 31 March 2017 have been extracted from the 31 March 2017 audited consolidated financial statements which have not yet been delivered to the Registrar of Companies but are expected to be published on 25 May 2017. The financial statements for the fourth quarter to 31 March 2017 are unaudited. Except as described below, the financial statements have been prepared in accordance with the accounting policies as set out in the financial statements for the year to 31 March 2016 and have been prepared under the historical cost convention as modified by the revaluation of financial assets and liabilities (including derivative financial instruments) at fair value. The financial information set out above does not constitute the company’s statutory accounts for the years to 31 March 2017 or 2016 but is derived from those accounts. The auditors have reported on those accounts; their reports (i) were unqualified, (ii) did not include a reference to any matters to which the auditors drew attention by way of emphasis without qualifying their report and (iii) did not contain a statement under section 498 (2) or (3) of the Companies Act 20016 in respect of the accounts for the year to 31 March 2017 or 31 March 2016. Statutory accounts for the year to 31 March 2016 were approved by the Board of Directors on 4 May 2016, published on 19 May 2016 and have been delivered to the Registrar of Companies. The EE line of business results do not constitute the entirety of EE Limited. Segment results
From 1 April 2016, the group has reorganised and the reporting segments have changed. The group has six customer-facing lines of business: BT Consumer remains a separate segment, renamed Consumer; EE’s consumer division is a separate segment; BT Business has become Business and Public Sector and includes the UK corporate and public sector operations from BT
Global Services as well as EE’s business division; BT Global Services has been renamed Global Services and is focused on multinational customers; BT Wholesale has become Wholesale and Ventures and includes EE’s MVNO operations and certain specialist businesses
that were previously in the BT Business segment; and Openreach remained unchanged.
In addition, EE’s technology team is now the mobile technology unit of our internal service unit, Technology, Service and Operations. Comparative results for all six customer-facing lines of business have been revised to be presented on a consistent basis. There is no impact on the total group results. More details are set out in our related press release published on 29 June 2016. Revisions on prior year financial statements
During the year, we have made several revisions to our prior year financial information as set out below. The effect of the revisions on the income statement, balance sheet and cash flow statements for the prior periods is set out in the revision to prior period statements section of the Additional Information.
Revision of cash pooling arrangements
An IFRIC clarification on IAS 32 Financial Instruments Presentation – Offsetting and cash pooling arrangements was released in April 2016. This clarifies a requirement to gross up cash and overdraft balances associated with notional cash pooling arrangements on the group balance sheet. As a result the group has revised the comparative balance sheets at 31 March 2015 and 31 March 2016. The impact is to increase cash and cash equivalents and short term loans and other borrowings by £414m at 31 March 2015 and £499m at 31 March 2016.

30
Investigation into our Italian business
During the year our investigations into our Italian business revealed inappropriate behaviour and improper accounting practices. The improper practices included a complex set of improper sales, purchase, factoring and leasing transactions. The effect of the prior year errors on the income statement, balance sheet and cash flow statements for the prior periods is set out in the additional information on pages 53 to 56. In total we identified prior period errors that amounted to a £268m reduction in total equity in our 31 March 2016 balance sheet. Prior year errors The prior year errors have resulted from profits, and therefore equity, being overstated for a number of years. These errors affected the Consolidated Group Balance Sheets and Consolidated Group Income Statements included in the Annual Report and Form 20-F for a number of years including the years ended 31 March 2016 and 31 March 2015, and in each of the quarterly results announcements of those years. We have concluded that errors were not material to these or any other of the Group’s previously issued financial statements. We have also assessed whether the correction of the cumulative effect of these errors in the current year would be material to the current year and concluded that correcting these in the current year would be material. Therefore we consider it appropriate to correct the errors by revising the prior years to avoid misstating the current year. Changes in estimates We also made changes in estimates resulting from the reassessment of the financial position and outlook for the Italian
business amounting to £245m. This is presented within specific items in the year given its size and one-off nature.
In Q4 we also recognised £15m of costs as a result of our investigations into our Italian business as a specific item.
Acquisition of EE
IFRS 3 ‘Business Combinations’ requires us to recognise provisional fair values if the initial accounting for the business combination is incomplete. In the period ended 31 March 2016, we reported that the fair values recognised for our 29 January 2016 acquisition of EE were provisional. During the year, we’ve finalised this assessment and have also received a purchase consideration refund from the previous owners of £20m following the finalisation of the audit of the completion balance sheet. This resulted in an amendment to values previously recognised in relation to brands, customer relationships and prepayments and the recognition of new receivables and provisions. The net impact of the adjustments including the deferred tax effect resulted in an increase in goodwill of £29m as of 31 March 2016. These had no material impact on the income statement.
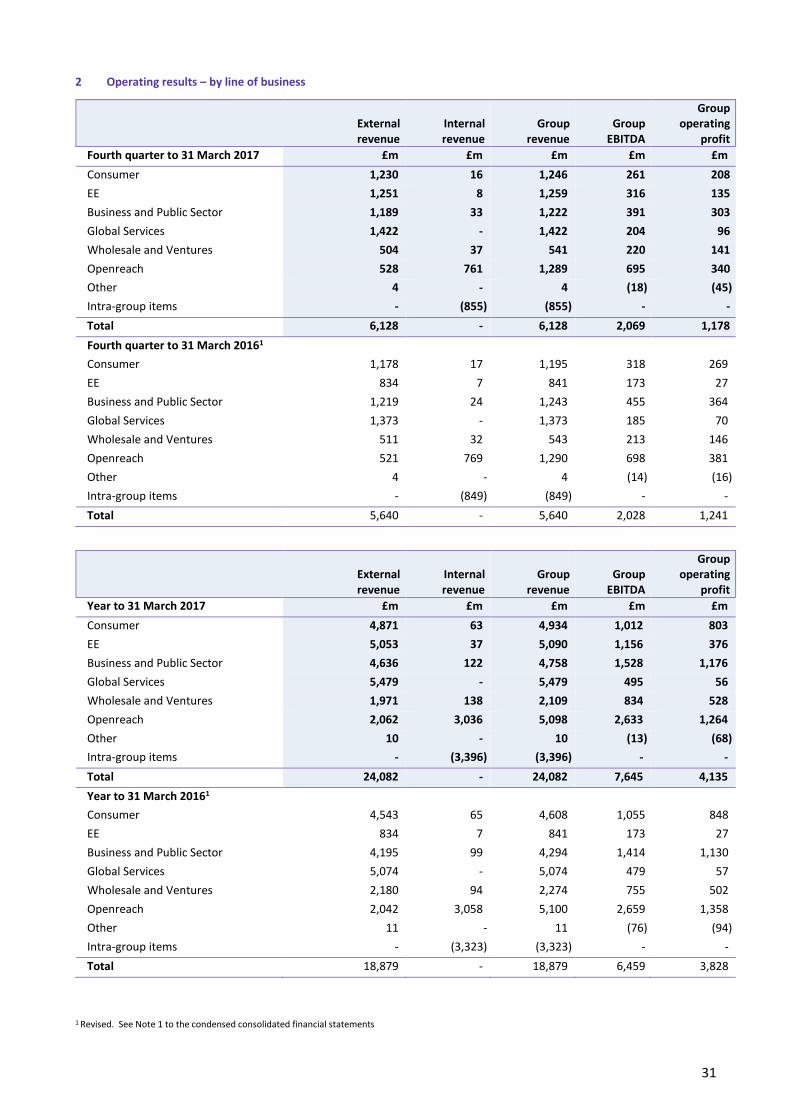
31
2 Operating results – by line of business
External revenue
Internal revenue
Group
revenue
Group
EBITDA
Group operating
profit
Fourth quarter to 31 March 2017 £m £m £m £m £m
Consumer 1,230 16 1,246 261 208
EE 1,251 8 1,259 316 135
Business and Public Sector 1,189 33 1,222 391 303
Global Services 1,422 - 1,422 204 96
Wholesale and Ventures 504 37 541 220 141
Openreach 528 761 1,289 695 340
Other 4 - 4 (18) (45)
Intra-group items - (855) (855) - -
Total 6,128 - 6,128 2,069 1,178
Fourth quarter to 31 March 20161
Consumer 1,178 17 1,195 318 269
EE 834 7 841 173 27
Business and Public Sector 1,219 24 1,243 455 364
Global Services 1,373 - 1,373 185 70
Wholesale and Ventures 511 32 543 213 146
Openreach 521 769 1,290 698 381
Other 4 - 4 (14) (16)
Intra-group items - (849) (849) - -
Total 5,640 - 5,640 2,028 1,241
External revenue
Internal revenue
Group
revenue
Group
EBITDA
Group operating
profit
Year to 31 March 2017 £m £m £m £m £m
Consumer 4,871 63 4,934 1,012 803
EE 5,053 37 5,090 1,156 376
Business and Public Sector 4,636 122 4,758 1,528 1,176
Global Services 5,479 - 5,479 495 56
Wholesale and Ventures 1,971 138 2,109 834 528
Openreach 2,062 3,036 5,098 2,633 1,264
Other 10 - 10 (13) (68)
Intra-group items - (3,396) (3,396) - -
Total 24,082 - 24,082 7,645 4,135
Year to 31 March 20161
Consumer 4,543 65 4,608 1,055 848
EE 834 7 841 173 27
Business and Public Sector 4,195 99 4,294 1,414 1,130
Global Services 5,074 - 5,074 479 57
Wholesale and Ventures 2,180 94 2,274 755 502
Openreach 2,042 3,058 5,100 2,659 1,358
Other 11 - 11 (76) (94)
Intra-group items - (3,323) (3,323) - -
Total 18,879 - 18,879 6,459 3,828
1 Revised. See Note 1 to the condensed consolidated financial statements
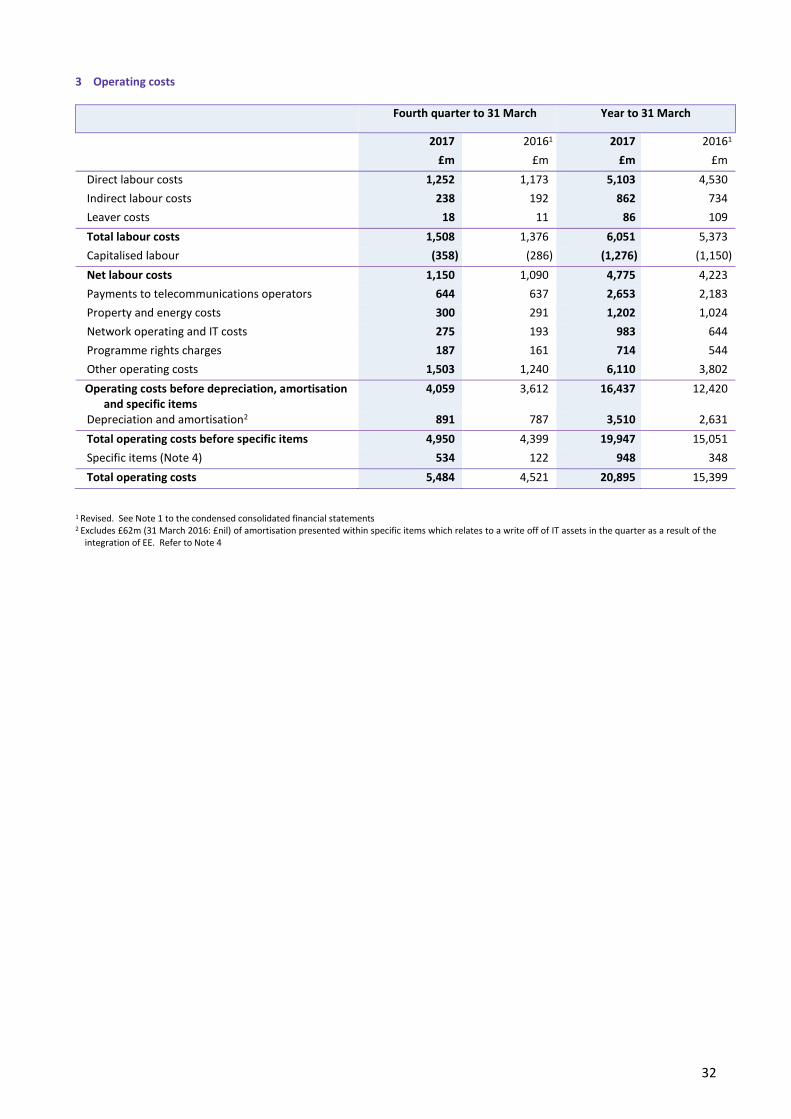
32
3 Operating costs
Fourth quarter to 31 March Year to 31 March
2017 20161 2017 20161
£m £m £m £m
Direct labour costs 1,252 1,173 5,103 4,530
Indirect labour costs 238 192 862 734
Leaver costs 18 11 86 109
Total labour costs 1,508 1,376 6,051 5,373
Capitalised labour (358) (286) (1,276) (1,150)
Net labour costs 1,150 1,090 4,775 4,223
Payments to telecommunications operators 644 637 2,653 2,183
Property and energy costs 300 291 1,202 1,024
Network operating and IT costs 275 193 983 644
Programme rights charges 187 161 714 544
Other operating costs 1,503 1,240 6,110 3,802
Operating costs before depreciation, amortisation and specific items
4,059 3,612 16,437 12,420
Depreciation and amortisation2 891 787 3,510 2,631
Total operating costs before specific items 4,950 4,399 19,947 15,051
Specific items (Note 4) 534 122 948 348
Total operating costs 5,484 4,521 20,895 15,399
1 Revised. See Note 1 to the condensed consolidated financial statements 2 Excludes £62m (31 March 2016: £nil) of amortisation presented within specific items which relates to a write off of IT assets in the quarter as a result of the
integration of EE. Refer to Note 4
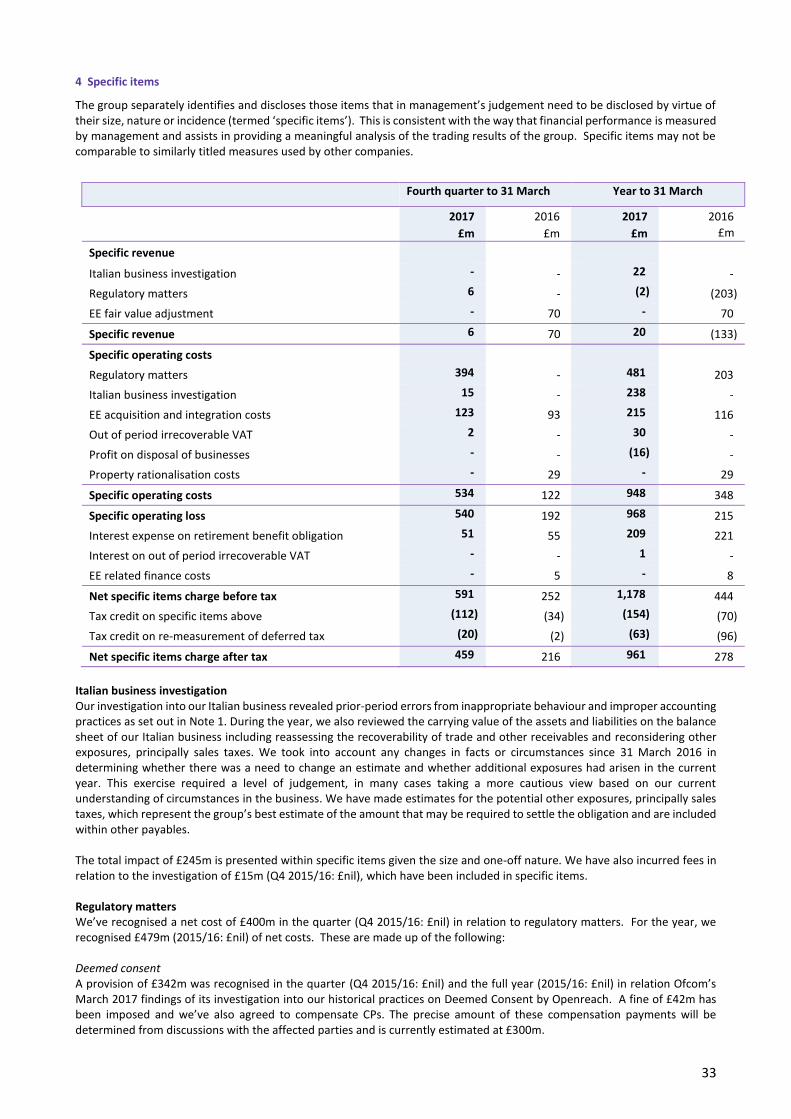
33
4 Specific items
The group separately identifies and discloses those items that in management’s judgement need to be disclosed by virtue of their size, nature or incidence (termed ‘specific items’). This is consistent with the way that financial performance is measured by management and assists in providing a meaningful analysis of the trading results of the group. Specific items may not be comparable to similarly titled measures used by other companies.
Fourth quarter to 31 March Year to 31 March
2017 2016 2017 2016
£m £m £m £m
Specific revenue
Italian business investigation - - 22 -
Regulatory matters 6 - (2) (203)
EE fair value adjustment - 70 - 70
Specific revenue 6 70 20 (133)
Specific operating costs
Regulatory matters 394 - 481 203
Italian business investigation 15 - 238 -
EE acquisition and integration costs 123 93 215 116
Out of period irrecoverable VAT 2 - 30 -
Profit on disposal of businesses - - (16) -
Property rationalisation costs - 29 - 29
Specific operating costs 534 122 948 348
Specific operating loss 540 192 968 215
Interest expense on retirement benefit obligation 51 55 209 221
Interest on out of period irrecoverable VAT - - 1 -
EE related finance costs - 5 - 8
Net specific items charge before tax 591 252 1,178 444
Tax credit on specific items above (112) (34) (154) (70)
Tax credit on re-measurement of deferred tax (20) (2) (63) (96)
Net specific items charge after tax 459 216 961 278
Italian business investigation Our investigation into our Italian business revealed prior-period errors from inappropriate behaviour and improper accounting practices as set out in Note 1. During the year, we also reviewed the carrying value of the assets and liabilities on the balance sheet of our Italian business including reassessing the recoverability of trade and other receivables and reconsidering other exposures, principally sales taxes. We took into account any changes in facts or circumstances since 31 March 2016 in determining whether there was a need to change an estimate and whether additional exposures had arisen in the current year. This exercise required a level of judgement, in many cases taking a more cautious view based on our current understanding of circumstances in the business. We have made estimates for the potential other exposures, principally sales taxes, which represent the group’s best estimate of the amount that may be required to settle the obligation and are included within other payables. The total impact of £245m is presented within specific items given the size and one-off nature. We have also incurred fees in relation to the investigation of £15m (Q4 2015/16: £nil), which have been included in specific items. Regulatory matters We’ve recognised a net cost of £400m in the quarter (Q4 2015/16: £nil) in relation to regulatory matters. For the year, we recognised £479m (2015/16: £nil) of net costs. These are made up of the following: Deemed consent A provision of £342m was recognised in the quarter (Q4 2015/16: £nil) and the full year (2015/16: £nil) in relation Ofcom’s March 2017 findings of its investigation into our historical practices on Deemed Consent by Openreach. A fine of £42m has been imposed and we’ve also agreed to compensate CPs. The precise amount of these compensation payments will be determined from discussions with the affected parties and is currently estimated at £300m.
34
Re-assessment of other regulatory provisions We’ve also re-assessed our regulatory risk position in light of recent regulatory decisions by Ofcom and by the Competition Appeal Tribunal. As a result we’ve increased our net provision by £58m (Q4 2015/16: £nil) in the quarter and £137m (2015/16: £nil) for the year. Ladder settlement During the year we recognised £8m (2015/16: £203m) of both transit revenue and costs, with no EBITDA impact, being the effect of ladder pricing agreements relating to previous years. No amounts were recognised in the quarter. Out of period irrecoverable VAT We recognised a £2m charge (Q4 2015/16: £nil) for the quarter and £30m (2015/16: £nil) for the year for out of period irrecoverable VAT and a further £1m related interest charge for the year. EE fair value adjustment In 2015/16, we recognised a fair value adjustment on the acquisition of EE which reduced the amount of deferred income in relation to its prepaid subscriber base by £70m, with no cash impact. This amount was released as a reduction to revenue in the period between acquisition and 31 March 2016, reflecting the period over which EE provided the related service. EE acquisition and integration costs
During the quarter, we incurred £123m (Q4 2015/16: £93m) of acquisition and integration related costs for EE. For the year, we incurred £215m (2015/16: £116m). Included within this amount was £62m of specific non cash amortisation recognised during the quarter relating to the write-off of IT assets as we integrate the EE and BT IT infrastructure. Property rationalisation costs In 2015/16 we recognised £29m of charge in relation to the rationalisation of the group’s property portfolio. Disposal of businesses A profit on disposal of non-core businesses of £16m (2015/16: £nil). Interest expense on retirement benefit obligation During the quarter, we incurred £51m (Q4 2015/16: £55m) of interest cost in relation to our defined benefit pension obligations. For the year, we incurred £210m (2015/16: £221m) in relation to defined benefit pension obligations and interest on out of period irrecoverable VAT. EE related finance costs In Q4 2015/16 and full year 2015/16 we incurred £5m and £8m respectively of interest in relation to our acquisition of EE. Tax on specific items A tax credit of £132m (Q4 2015/16: £36m) was recognised in relation to specific items and re-measurement of deferred tax.
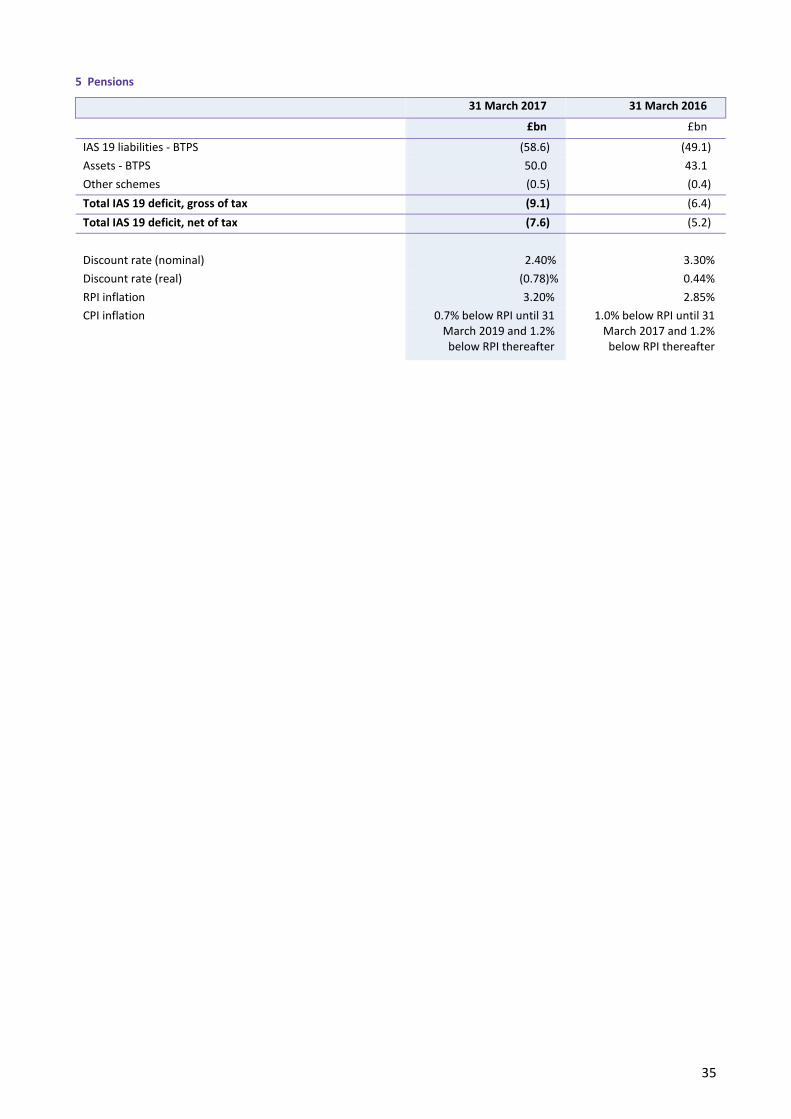
35
5 Pensions
31 March 2017 31 March 2016
£bn £bn
IAS 19 liabilities - BTPS (58.6) (49.1)
Assets - BTPS 50.0 43.1
Other schemes (0.5) (0.4)
Total IAS 19 deficit, gross of tax (9.1) (6.4)
Total IAS 19 deficit, net of tax (7.6) (5.2)
Discount rate (nominal) 2.40% 3.30%
Discount rate (real) (0.78)% 0.44%
RPI inflation 3.20% 2.85%
CPI inflation 0.7% below RPI until 31 March 2019 and 1.2% below RPI thereafter
1.0% below RPI until 31 March 2017 and 1.2% below RPI thereafter
36
6 Contingent liabilities
Other than as disclosed below, there were no contingent liabilities at 31 March 2017 other than those arising in the ordinary course of the groups business and on these no material losses are anticipated. We’ve insurance cover to certain limits for major risks on property and major claims in connection with legal liabilities arising in the course of our operations. Otherwise, the group generally carries its own risks. Legal proceedings The group is involved in various legal proceedings, including actual or threatened litigation, government or regulatory investigations. However, save as disclosed below, the group does not currently believe that there are any legal proceedings, government or regulatory investigations that may have a material adverse impact on the operations or financial condition of the group. In respect of each of the claims below, the nature and progression of such proceedings and investigations can make it difficult to predict the impact they will have on the group. There are many reasons why we cannot make these assessments with certainty, including, among others, that they are in early stages; no damages or remedies have been specified, and/or the often slow pace of litigation. Italian business Following the group’s announcement with respect to our investigation into our Italian business in January of this year, three purported securities class action complaints were filed against the company and certain current and former officers in United States courts. All three actions are purportedly brought on behalf of purchasers of BT Group ADRs between May 2012 or May 2013 and January 2017. The actions allege that the company made materially false and/or misleading statements between 2012 and 2016 regarding its internal controls, ethics and corporate governance, and financial outlook in its submissions to and filings with the US Securities and Exchange Commission and other public disclosure. Plaintiffs’ counsel have filed motions to appoint lead plaintiff and lead counsel, and decisions on these motions have not yet been made. We intend to defend these claims vigorously. The issues in Italy have also resulted in engagement with certain of our regulators and other authorities in the UK and elsewhere. As would be expected, we are cooperating fully with these bodies including the Italian authorities. Phones 4U In December 2016, the administrators of Phones 4U Limited (P4U) started legal proceedings in the High Court in the United Kingdom against EE, claiming £66m in payments under a retail trading agreement, which relate to a revenue share for certain customers prior to P4U’s insolvency. We are contesting these claims and have brought counter-claims against P4U, including damages arising from P4U ceasing trading. The administrators have also indicated an intention to start separate High Court proceedings, alleging that EE and other mobile network operators colluded to procure P4U’s insolvency. We also dispute these allegations vigorously.
Hutchison 3G Limited In May 2016, Hutchison 3G Limited (H3G) brought legal proceedings in the High Court in the United Kingdom against EE, alleging breach of contract relating to alleged delays in the roll out of certain free carrier coverage to H3G. H3G is entitled to this free carrier coverage under arrangements agreed following the merger of Orange and T-Mobile, predecessors of EE. The litigation is also at a relatively early stage and we are contesting the claims. H3G claims damages relating to loss of business of £167m, although we dispute that there is a basis for the claim and the substantiation of the claimed damages.
Brazilian tax claims The Brazilian state tax authorities have made tax demands against certain Brazilian subsidiaries relating to the Tax on Distribution of Goods and Services (ICMS), an indirect tax imposed on the provision of telecommunications services in Brazil. The state tax authorities are seeking to impose ICMS on revenues earned on activities that the company does not consider as being part of the provision of telecommunication services, such as equipment rental and managed services. We have disputed the basis on which ICMS is imposed and the rate which the tax authorities are seeking to apply. We are currently contesting 35 cases, eight of which are pending appeal to the Sao Paulo Court of Appeal; and the judicial process is likely to take many years. The current potential total of the claims is £232m. We are vigorously contesting these tax demands. Regulatory matters In respect of regulatory risks, the group provides for anticipated costs where an outflow of resources is considered probable and a reasonable estimate can be made of the likely outcome. Estimates are used in assessing the likely value of the regulatory risk. The ultimate liability may vary from the amounts provided and will be dependent upon the eventual outcome of any settlement.

37
We hold provisions for regulatory risks of £479m at 31 March 2017. These provisions cover the following issues: Deemed Consent Deemed Consent is an agreed process between Openreach and its CP customers, which allows Openreach to halt the installation and reschedule the delivery date for providing dedicated business services (known as Ethernet) in a number of specific circumstances where it is beyond its control. Ofcom found that Openreach had breached its contractual and regulatory obligations by inadequately and retrospectively applying Deemed Consent to reduce compensation payments to CPs between January 2013 and December 2014. We hold a provision of £300m for Deemed Consent relating to estimated compensation payments to CPs resulting from Ofcom’s deemed consent investigation. The precise amount will result from discussions with affected parties, and could result in lower or higher payments than the £300m provided. We also hold £42m within trade payables being the Ofcom fine in relation to their investigation into Ethernet deemed consent, and is therefore certain.
Court of Appeal judgment on Ethernet Dispute On 20 December 2012, Ofcom made determinations resolving disputes between BT and five communications providers (C&W Worldwide, Sky, TalkTalk, Virgin Media, and Verizon) concerning BT’s charges for certain Ethernet services. The Determinations found that BT had overcharged C&W Worldwide, Sky, TalkTalk, Virgin Media, and Verizon for certain Ethernet services for varying periods from April 2006 to March 2011. All parties appealed the determinations to the Competition Appeal Tribunal (CAT), which largely confirmed Ofcom’s assessment of overcharging, and ordered BT to pay interest on the amounts overcharged. BT and TalkTalk appealed the CAT’s judgment to the Court of Appeal, the hearing took place in March 2017.
On 4 May 2017, the Court of Appeal handed down its judgment, dismissing TalkTalk’s appeal that Ofcom should have used a different cost standard in assessing cost orientation, which would have resulted in higher repayments to CPs. The Court of Appeal also dismissed BT’s appeal (which would have reduced the repayments). This confirmed our view that no additional amounts were payable in relation to TalkTalk’s appeal. Both BT and TalkTalk may appeal the Court of Appeal judgment to the Supreme Court. Other regulatory matters The remaining provision reflects management’s estimates of regulatory risks across a range of issues, including price and service issues. The precise outcome of each matter depends on whether it becomes an active issue, and the extent to which negotiation or regulatory decision will result in financial settlement.
38
7 Principal risks and uncertainties (extracted from the BT Group plc Annual Report & Form 20-F 2017)
Principal risks and uncertainties
In this section we explain some of the principal risks and uncertainties affecting us. These risks have the potential to impact our business, brand, people, assets, revenue, profits, liquidity or capital resources. The principal risks we described last year have evolved, and so too has our response to them. Our Enterprise Risk Management framework provides reasonable (but cannot give absolute) assurance that significant risks are identified and addressed. There may be some risks which are unknown to us at present. And there may be some that we consider less significant now but become more important later. External factors can present both risks and opportunities, to our business and to others. We focus our efforts on predicting and mitigating the risks, while at the same time seeking to capitalise on opportunities that may emerge. We recognise the particular uncertainty that political and geo-political risks present, both in the UK and globally. We now monitor these through a separate sub-committee of our Group Risk Panel. In the principal risks section below, we talk about what we are doing to stop our main risks materialising, or to limit their impact. Our principal risks and uncertainties should be considered along with the risk management process, the forward-looking statements in this document and the cautionary statement regarding forward-looking statements, which you can read below. OUR PRINCIPAL RISKS
Compliance risks
Ethical culture and controls
It’s crucial that we maintain high ethical standards. We don’t tolerate fraud, bribery, any form of corruption or any illegal or unethical activity. We follow local and international law, including anti-corruption and bribery laws. The UK Bribery Act and US Foreign Corrupt Practices Act (FCPA) have extraterritorial reach, so cover our global operations. As we expand globally, we’re increasingly operating in countries seen as having a higher risk of bribery and corruption. We also have to make sure we follow trade sanctions and import and export controls. We also face the risks associated with inappropriate and unethical behaviour in local and other markets by our people or associates, such as suppliers or agents, which can be difficult to detect as well as facing the risks that our controls are designed to prevent, detect and correct such behaviour may be circumvented. Controls and procedures, no matter how well designed and operated, can provide only reasonable assurance of achieving their objectives and there can be no assurance that any design will succeed in achieving its stated goals under all potential conditions, regardless of how remote. Because of its inherent limitations, internal control over financial reporting may not prevent or detect misstatements. Therefore even those systems determined to be effective can provide only reasonable assurance with respect to financial statement preparation and presentation. Also, projections of any evaluation of effectiveness to future periods are subject to the risk that controls may become inadequate because of changes in conditions, or that the degree of compliance with the policies or procedures may deteriorate. Impact If our people, or associates like suppliers or agents, breach anti- corruption, bribery, sanctions or other legislation there could be significant penalties, criminal prosecution and damage to our brand. This could have an impact on future revenue and cash flow depending on the nature of the breach, the legislation concerned and any penalties. If we were accused of corruption, bribery, violating sanctions regulations or other laws, that could lead to reputational damage with investors, regulators and customers. If fraud is committed, there is a risk of financial misstatement which if undetected can have a material financial impact and potential litigation and regulatory consequences. Financial and other controls play an important part in our ability to prevent and detect inappropriate and unethical behaviour. This includes fraud, deliberate financial misstatement and improper accounting practices, as well as breaches of anti-corruption, bribery, or sanctions legislation. If the design, operation or the assurance over these controls is ineffective or they are circumvented, there is a greater risk that the impacts described above may materialise, as they did this year with respect to our Italian business.
39
What’s changed over the last year? During the year we identified inappropriate behaviour in our Italian business. Our investigation identified collusion and override of controls within our Italian business and that our monitoring controls did not identify the circumvention and override, resulting in the misstatement of results going undetected for a number of years. As a result of our US listing we are required to make certain assessments of our controls as of 31 March 2017 for the purposes of Sarbanes-Oxley. Despite the remediation steps we took, the controls had not operated for sufficient time to allow assurance testing to confirm their effectiveness under Sarbanes-Oxley. We have therefore concluded for these purposes that our controls were ineffective as of 31 March 2017 due to a material control weakness with regard to our Italian business. For further details of what we found, how we’ve responded, and what our ongoing plans are, see page 7. Our acquisition of EE has grown our UK business, and we’ve made EE a part of our ACB compliance programme and financial and disclosure control environment. In terms of ACB enforcement generally, we’ve seen the first significant cases stemming from the UK Bribery Act, and in the US 27 companies paid about $2.5 billion to resolve FCPA cases. 2016 was the biggest enforcement year in FCPA history – both the number of enforcement actions and the overall amounts paid to resolve them. How we’re mitigating the risks We’ve put a number of controls in place to address risk in this area. These include the steps we have taken to improve our controls within Italy. We have also taken steps to enhance our wider controls that monitor our overseas operations in our shared service centres, Global Services and at a group level. While we have taken steps to improve our control environment, we recognise we have more to do. Further activities will include increasing and improving the capabilities of the controlling function and the audit function outside the UK, and further developing our integrated risk and assurance reporting processes. We are also enhancing our controls and compliance programme to strengthen awareness of the standards we expect, the capabilities of our people, and to reinforce the importance of doing business in an ethical, disciplined and standardised way. Our relevant controls include an anti-corruption and bribery programme and ‘The Way We Work’, our ethical code, available in 14 languages. We ask all our people to complete training and sign up to The Way We Work which includes our zero tolerance to bribery and corruption. We have policies covering gifts, hospitality, charitable donations and sponsorship. We run tailored training for people in higher-risk roles like procurement and sales. We regularly weigh up our business integrity risks to make sure we’ve got the right mitigation in place. All ‘Speak Up’ reports are passed to the Director of Ethics and Compliance for action. Our confidential hotline is operated by a third party and is available to employees and third-party contractors who can remain anonymous if they choose to. Any reports received direct to BT are also dealt with in accordance with our Speak Up procedures. Our internal audit team regularly runs checks on our business. External providers also assess areas we think are higher risk (such as the use of agents), to make sure people understand our policies and that controls are working. We do due diligence checks on third parties like suppliers, agents, resellers and distributors. Our policy is that procurement contracts include anti-corruption and bribery clauses. Our sanctions policy helps us keep track of trade sanctions and export controls that apply to us. That means all bids involving a country with sanctions imposed by the EU and/or the US need approval. The policy also mandates everyone in BT must use our internal shipping system to arrange international exports, as it runs compliance checks and flags any orders which need an export licence. BT Italy – our response In response to the inappropriate behaviours we identified in our Italian business, we suspended a number of BT Italy’s senior management team who have now left the business. The president of our European operations has also left the business. We have appointed a new president of our European operations and a new CEO and CFO of BT Italy, from outside the Italian executive management team. We appointed KPMG, with support and oversight from our Legal, Governance and Compliance function and Freshfields Bruckhaus Deringer, reporting directly to both the Chair of the Audit & Risk Committee and BT Group Chairman, to perform an independent investigation of the systems and controls relating to our Italian business. We also conducted a broader review of financial processes, systems and controls across the group. We are acting on both the recommendations of KPMG and our own observations and have taken steps to improve our controls within Italy. We have also taken steps to enhance our wider controls that monitor our overseas operations in our shared service centres, Global Services and at a group level. As a result of our US llisting we are required to make certain assessments of our controls as of 31 March 2017 for the purposes of Sarbanes-Oxley. Despite the remediation steps we took, the controls had not operated for sufficient time to allow assurance testing to confirm their effectiveness under Sarbanes-Oxley. We have therefore concluded for these purposes that our controls were ineffective as of 31 March 2017 due to a material weakness with regards to our Italian business.
40
Beyond Italy, we have completed detailed balance sheet reviews in seven selected country operations in Global Services outside of the UK. These thorough reviews were supported by EY, and did not identify any similar issues or areas of concern elsewhere giving us comfort that the inappropriate behaviours were isolated to Italy. While we have taken steps to improve our control environment, we recognise we have more to do. Further activities will include increasing the resources and improving the capabilities of the controlling function and the audit function outside the UK, and further developing our integrated risk and assurance reporting processes. We are also enhancing our controls and compliance programme to strengthen awareness of the standards we expect, the capabilities of our people, and to reinforce the importance of doing business in an ethical, disciplined and standardised way. The new CEO and CFO of BT Italy will continue to review the Italian management and finance teams and work with BT Group Ethics and Compliance to improve the governance, compliance and financial safeguards. Going forward, we will also continue to rotate senior management among countries to ensure an independently governed and rigorously controlled organisation throughout all parts of Global Services. Please see page 7 for a full description of what we found, how we responded and what we will do going forward. Processing our customers’ data
We control and process huge quantities of customer data around the world, so observing data privacy laws is something we take extremely seriously. It’s essential that individuals and businesses can trust us to do the right thing with their data.
Firstly, we must make sure our customers’ data is secure, and protected against both internal and external threats (eg cyber attacks). Being trusted with our customers’ data goes further than that though. It means preserving the integrity of the personal data we process, and only keeping the things we need to provide customers with the services they’ve signed up for. It also means being transparent around how we use that data, making sure the way we process personal data is legal, fair and in line with customers’ rights and wishes. As a communications provider we operate under a stringent 24-hour reporting regime to tell the UK Information Commissioner’s Office (ICO) if we become aware of a personal data security breach. We must also tell any affected individuals as quickly as possible. Different parts of the world approach privacy and data protection differently. An individual’s fundamental right to privacy is reflected in the fact that data privacy laws are in force in over 100 countries. More and more we (and other multinationals) have to show that we’re handling personal data in line with a complex web of national data laws and society’s ethical expectations. Impact Failing to stick to data protection and privacy laws could result in regulatory enforcement action, fines, class-action, prison sentences and the regulator telling us to stop processing data. On top of that, we could see huge reputational damage and big financial losses. Those losses could come from fines and damages if we fail to meet our legal requirements, as well as costs resulting from having to close customer contracts and the subsequent customer churn. Companies who’ve had high profile ‘data incidents’ have seen their share price hit hard, and suffered ongoing costs from their non-compliance. What’s changed over the last year? National regulators are more aggressively protecting their citizens’ privacy and data protection rights. They’re especially targeting companies that fail to do due diligence, or who knowingly accept (or ignore) a related risk for too long. This has been brought into sharp focus by the growth of data threats, with several big organisations suffering incidents. There’s been a general trend toward bigger financial penalties and more frequent public shamings for organisations who break global privacy and data protection laws. How we’re mitigating the risks We’ve introduced governance to clarify responsibilities for data activities across our whole business. People, processes and technology have been our core areas of focus. By embedding this governance, we’re reinforcing our expectations around personal data with our people, our partners and third parties. The cornerstone of our education and training programme is making sure our people understand our data governance culture and the impact of data risks on our business. Our mandatory data privacy training focuses on the individual’s role, and uses relevant scenarios to highlight the varying data risks of different BT job families. By educating our technical and commercial units we’ve made a step change in understanding data risks across BT Group.
41
We want to give our people the tools they need to make everyday risk-based decisions around privacy and data protection without it being a burden or making their job more complicated. If we do that, there’s a much better chance of data compliance becoming ‘business as usual’. For example, using Privacy Impact Assessments when we develop new products and services makes sure everyone understands privacy issues from the start and builds in the right controls, without any operational impact. Supporting the third-line assurance of our Internal Audit team, the Chief Privacy Officer and his team are a second line of defence. They undertake an annual cycle of audit and monitoring. Our mitigations against cyber attacks are described in our Security and resilience risk (page 46). Health and safety Our business – and in particular our UK engineering workforce – does a lot of work where our people could be injured or their health could be damaged. It’s essential we do all we can to keep our people safe; not only is it the law but it also means they’ll be better at their jobs. Acquiring EE has also raised the exposure of our customers and staff to radio frequency emissions from wireless mobile devices and mobile telecoms sites. Media reports have suggested these emissions may cause health issues, including cancer, and may interfere with some electronic medical devices, including hearing aids and pacemakers. Research and studies are ongoing. According to the World Health Organisation’s Fact Sheet Number 193, last reviewed in October 2014, there are no known adverse effects on health from emissions at levels below internationally recognised health and safety standards. Even so, we can’t provide absolute assurance that research in the future won’t establish links between radio frequency emissions and health risks. Impact Failure to implement and maintain effective health and safety management could have a huge impact on our people and our finances. It could lead to people getting injured, work-related sickness and service disruption for customers. It could also result in our people and third parties making compensation claims against us, and fines or other sanctions being issued by regulators. There could even be criminal prosecutions against us, our directors and our people – all of which would harm our brand and business. And of course an unhappy or unhealthy workforce also leads to higher work absence rates and lower performance levels. What’s changed over the last year? The range and complexity of risks has gone up as we’ve offered new services to our customers. Those risks include us doing more construction and electrical engineering work on our own network, as well as new contracts requiring us to maintain and extend the UK’s mobile network. We’ve taken a lot of steps to mitigate these risks – especially around how our people work with electricity or at height. The integration of EE has introduced new elements such as high street retail and an expansion of existing risks such as operating customer contact centres. We’re continuing to implement a strategy which embeds effective management of health and safety into all our operations and promotes health and wellbeing to help improve business performance. Two prosecutions against us for past incidents concluded in 2016 resulting in guilty verdicts and fines. Levels of sickness absence rose in the first part of the year but this trend reversed in the second half. Our workforce has also lost less time from injuries as a result of accidents. How we’re mitigating the risks We’re implementing the next stage of a Board-endorsed health, safety and wellbeing strategy. As part of this, each year every line of business produces its own health and safety plan with its own targets and programmes. Our people managers take responsibility for making sure their teams know how to comply with health and safety standards. We monitor compliance using annual licensing, scheduled refresher training, competency assessments and accreditation processes for higher risk groups. All our people undertake training in basic health and safety. Wherever we do business around the world, we put in place policies and programmes to make sure we adhere to our own standards and that those standards meet or exceed minimum legal requirements. We also work to make sure our products comply with safety regulations, including meeting industry standards for radio frequency emissions. We provide advice to help management teams understand and control health and safety risks and help everyone feel involved in health, safety and wellbeing. We’ve created interventions to help promote good mental health and physical wellbeing. We
42
also provide support and rehabilitation services for people who have mental or physical health issues. And we complement these measures with strong attendance management processes. Strategic and financial risks
Growth in a competitive market
Our markets are characterised by: – constant, rapid change;
– strong, new competition;
– falling prices and (in some markets) falling revenues;
– technology changes;
– market and product convergence;
– customers moving between providers; and
– regulation to promote competition and cut wholesale prices.
Potential impact It’s important we grow our revenue profitably and sustainably to protect our cash flow. Failure to do so could limit our ability to invest in the business or pay dividends. It’s also important that we manage our cost base to be able to invest in growth opportunities. What’s changed over the last year? We’ve been executing our strategy by:
– extending our 4G and fibre broadband coverage;
– making good progress on integrating EE and hitting our synergy targets; and
– investing to improve customer experience and the products we offer.
Our leading competitors have also been very active. Important developments included: – Virgin Media expanding its UK network;
– Sky and Gamma launching new mobile services;
– 21st Century Fox’s bidding for the share in Sky it didn’t already own;
– Sky launching a Now-TV branded triple-play bundle without a contract; and
– TalkTalk’s continued success at growing its data revenues.
The level of competitive risk facing the business has worsened over the last 12 months. Some of our leading telecoms competitors have taken important steps to grow their revenues. In addition the threat from new competitors, enabled by disruptive technologies, continues to increase. Leading players, operating in adjacent markets, still view telecoms services as an attractive growth opportunity. In particular OTT providers, who already dominate messaging, are now increasingly turning their attention to voice. There are also economic risks that could threaten revenue growth:
– Downside risks to the UK and global economy are bigger than they were 12 months ago.
– It’s unclear how much the UK economy will be impacted by the vote to leave the European Union, nor is it clear what
trade arrangements will be agreed after the UK leaves.
How we’re mitigating the risks We stick to our strategy, which means:
– broadening and deepening our customer relationships;
– providing a great customer experience; and
– investing for growth.
It also means transforming our costs. We take a forensic approach, supported by a team of specialists, to identifying opportunities to better manage our cost base and maximise our ability to invest in customer experience and growth. However, these opportunities are becoming more challenging to identify and deliver as our cost transformation programme matures. If we do all this, we’ll grow our revenue profitably and sustainably. We’ve been investing in five key areas: providing differentiated content, services and applications, making our UK network the best in the country, becoming a fully converged service provider, securing market leadership in all our UK segments and meeting the needs of multinational customers. Our transformation programmes continue to drive service and productivity improvement. We can also seek changes in regulation to make things fairer.

43
Communications industry regulation Regulation affects much of what we do. In the UK, where Ofcom identifies concerns with the competitiveness of markets, it can set regulatory rules that require us to provide certain services on specified terms to our customers. The rules it imposes are assessed every three years via a series of market reviews focused on the supply of network access services to wholesale customers (for example, the supply of fixed access lines to support the provision of phone or broadband services, or the supply of business connectivity services). Ofcom can extend or remove rules as a result of its findings in a market review. Where controls are placed on our prices, these can be tightened or relaxed following a review of the expected costs of future supply. Ofcom will investigate our compliance with any regulatory rules in place and can impose fines and restitution on us if we don’t comply. Ofcom also has powers to regulate the terms on which we get supplied with certain services by others – for instance, mobile call termination and wholesale access to certain pay-TV channels. This can increase our costs and affect the scope of services we can provide to customers. Ofcom can also sort out disputes between us and other communications providers about the terms on which services are supplied. Outside the UK, general licensing requirements can make it tough for us to enter markets and compete. Regulation will also define the terms on which we can buy wholesale services from others. Potential Impact Certain of our revenues come from supplying wholesale services to markets where Ofcom has found us to have significant market power. Most of these revenues relate to services where regulatory rules require us to cut average prices each year by a specific, real-term percentage for a three-year period. Where other telecoms providers ask Ofcom to resolve disputes with us, there’s a risk that Ofcom may set the prices at which we supply services, and/or make us provide additional services. In some circumstances, Ofcom can adjust past prices and make us pay back amounts to wholesale customers. Regulation outside the UK can hit our revenue too. For example, overly-restrictive licensing requirements or ineffective regulation of access to other networks mean we might not be able to compete fairly. Regulation can also define and control the terms of access to necessary regulated inputs, which raises our costs. What’s changed over the last year? There’s been a lot of regulatory activity in different areas over the last year. Ofcom has started market reviews in relation to wholesale narrowband access, wholesale local access and wholesale broadband access. We’ve summarised this in the Regulation section on page 9. In March 2017 Ofcom found that Openreach had breached its contractual and regulatory obligations by inadequately and retrospectively applying Deemed Consent between January 2013 and December 2014; and that Openreach then failed to compensate communications providers fully. As a result of the findings, Ofcom imposed a fine on BT and Openreach agreed to compensate communications providers outside of BT in full. See page 8 for further information. Alongside the standard cycle of market reviews, in March 2015 Ofcom announced an overarching strategic review of the digital communications market. In March 2017 we reached agreement with Ofcom on the legal separation of Openreach, subject to consultation by Ofcom and changes to legislation to retain the Crown Guarantee on Openreach employees. Under this arrangement Openreach will have its own board and make its own investment decisions, within an overall budget set by BT. Although we believe that this is a good solution for BT and the UK communications market, we will face the risks and challenges that come with operating an independent business within BT. How we’re mitigating the risks Our team of regulatory specialists includes economists, accountants and lawyers. Together with legal experts and external advisers they check for potential disputes with other CPs and look for opportunities to change regulatory rules. They talk regularly with regulators and other key influencers to understand their outlook and to make our position clear. Their insight also helps us to forecast future regulatory outcomes. We can then build sensible expectations into our financial plans and investment decisions. We push for fair, proportionate, consistent and evidenced-based regulation everywhere we do business. Whenever there are market reviews, charge controls and disputes or investigations we put forward evidence and analysis. This helps us manage the risks around decisions in any particular year. We can appeal any regulatory decisions we think are wrong, albeit the basis upon which these appeals are judged in the UK has changed under the Digital Economy Act. We can also raise disputes or complain (under the relevant regulatory framework
44
or competition law) where we have problems getting access to wholesale services – such as wholesale pay-TV channels or to other access networks. We’re also working hard to deliver a great customer experience, going beyond our minimum regulatory obligations. Pensions We have a large funding obligation to our defined benefit (“DB”) pension schemes. The largest of these, the BT Pension Scheme (BTPS or Scheme), represents over 97% of our pension obligations. The BTPS faces similar risks to other UK DB schemes: things like future low investment returns, high inflation, longer life expectancy and regulatory changes may all mean the BTPS becomes more of a financial burden. Potential impact The last funding valuation of the BTPS, as at 30 June 2014, provides certainty over scheme funding until the forthcoming valuation, due to start in June 2017, is concluded. If there’s an increase in the pension deficit at the next valuation date, we may have to increase deficit payments into the Scheme. Higher deficit payments could mean less money available to invest, pay out as dividends or repay debt as it matures, which could in turn affect our share price and credit rating. We’re considering a number of options for funding the deficit after the next valuation, as at 30 June 2017. These options include considering whether there are alternative approaches to only making cash payments, including arrangements that would give the BTPS a prior claim over certain BT assets. What’s changed over the last year? The pension deficit of the BTPS is calculated as the value of the assets less the value of the liabilities. The deficit at the valuation date will influence the deficit payments we agree. A number of things affect the liabilities, including expected future investment returns at the valuation date. When considering expected future returns, we review different factors including yields (or returns) on government bonds, which have fallen in the year and have dropped significantly since 30 June 2014. If a lower future investment return is assumed at the next valuation our liabilities would likely go up. Asset returns have been positive over the year with strong returns from equities and government bonds. How we’re mitigating the risks The investment performance and liability experience are regularly reviewed by both us and the Trustee of the BTPS. We also consider the associated risks and possible mitigations. The investment strategy aims to mitigate the impact of increases in the liabilities, for example by investing in assets that will increase in value if future inflation expectations rise. The assets held are also well diversified, softening the impact of sharp drops in the value of individual asset classes. This helps us maintain a reasonable balance of risk and return. Our financial strength and cash generation provide a level of protection against the impact of changes in the funding position of the BTPS. The funding liabilities also include a buffer against future negative experience, as legislation requires that we calculate liabilities on a prudent basis. Political risk Across our operations we are exposed to the effects of political and geopolitical risks, in particular:
– In the UK, internet access is increasingly seen as an essential part of people’s lives. As a result, the level of political
debate and focus on issues such as quality and speed of service has increased. As well as providing a critical element
of the UK’s national infrastructure, we are also engaged in supporting high profile programmes such as BDUK and
the Emergency Services Network.
– The result of the UK referendum to leave the European Union (‘Brexit’) has significantly increased political
uncertainty. This has been exacerbated by the possibility of further political change across the United Kingdom, most
notably a second referendum that may be held on Scottish independence.
– Outside the UK, political and geopolitical risk can impact our business through changes in the regulatory and
competitive landscape, but also as a direct threat to our people and assets as a result of social unrest or a break
down in the rule of law.

45
Potential impact Political uncertainty can have direct financial consequences across the economy, impacting for example foreign exchange rates, the availability and cost of capital, interest rates and also resulting in changes in the tax regime. For BT specifically, the most significant impact of political risk is its potential interaction with some of our other Principal Risks. In the UK, we are seeing an increasing overlap between political debate and the regulatory environment, with the potential that our Communications Industry Regulation risk increases as a result. The impacts of Brexit are still uncertain while the UK’s future relationship with the EU is determined. However, there is the potential for our costs to increase (for example through any changes required to our systems to reflect new taxes or customs duties); regulatory risk to increase as a result of any future divergence with the EU regime, including on data flows; supplier disruption to occur as a result of challenges in suppliers’ own organisations and supply chains; and for delivery of a great customer experience to become more challenging if it becomes harder for us to recruit and retain talent. Geopolitical risk outside the UK can most clearly impact our Communications Industry Regulation risk, but also our Security and Resilience risks where it poses a threat to the continuity of our operations. What’s changed over the last year? The most significant development was the referendum on 23 June 2016 by which the UK voted to leave the EU. That was immediately followed by political change, a fall in sterling, UK bond credit rating downgrades and uncertainty for business and foreign direct investment. On 29 March 2017, Article 50 was triggered initiating a two-year period of negotiation for the UK to leave the EU. In the same month, Scottish First Minister Nicola Sturgeon confirmed she would seek the approval of the Scottish Parliament to open discussions with the UK Government on legislating for a second Scottish independence referendum. UK Prime Minister Theresa May has said that permission would not be forthcoming during Brexit negotiations, potentially opening the possibility of a referendum in 2019 or 2020. Further change may also now follow as a result of the General Election called for 8 June 2017. From a telecoms perspective, this has been played out against the backdrop of the progression of the Digital Economy Act and in particular debate around Ofcom’s Digital Communications Review, and of dialogue on the European Electronic Communications Code revisions. How we’re mitigating the risks We maintain strong engagement with the UK Government, key departments such as DCMS and BDUK, MPs, peers, the media and with consumer bodies; and with Governments and politicians in Brussels and in our key markets around the world. We seek to inform public debate around telecommunications through fact-based evidence concerning the market and BT’s role within it. We have set up a programme across the business to help us understand and manage the risks associated with Brexit. This will also consider other potential impacts such as those associated with a second Scottish Independence referendum, and is led by a steering group chaired by the Group Finance Director. We’ve also offered our views to Government and business groups on related policy areas, including responding to Parliamentary inquiries. Outside the UK, our Public Affairs and regulatory teams work to help support governments and regulators in ensuring that markets work in an open and fair way for the benefit of customers and competition. Geopolitical risks are tracked by a committee, with our security and business continuity teams particularly focussed on protecting our people and our assets. Financial Risk In common with other major international businesses, we are exposed to a variety of financial risks. These include treasury risks, which arise principally from market risk (including interest rate risk and foreign exchange risk), credit risk, and liquidity risk. They also include tax risk, principally that we need to understand fully the current and future tax consequences of business decisions to comply with tax rules and avoid financial and reputational damage. Potential impact If there is an adverse movement in foreign exchange and interest rates there could be a negative impact on the group’s profitability, cash flow, and balance sheet. The failure of Treasury counterparties to honour financial obligations could have an adverse impact on the group’s liquidity (for example from the loss of cash deposits) and profitability (for example from increased finance expenses). A deterioration in liquidity could have an adverse impact on the Board’s assessment of going concern, particularly if combined with an inability to refinance maturing debt. If we fail to comply with tax rules then we could face financial penalties and reputational damage. Beyond compliance, if we don’t adequately reflect the current and future tax consequences in our business decisions, we might make bad decisions resulting in financial loss and potentially financial misstatements, as well as reputational damage.
46
What’s changed over the last year? Following the UK referendum to leave the European Union, we saw increased volatility in foreign exchange rates. However, we continue to face the same treasury risks as in financial year 2015/16. From a taxation perspective, BTs business continues to evolve rapidly, creating different tax consequences, for example the acquisition of EE and the DCR. Global tax rules also continue to evolve, for example the OECD’s Base Erosion and Profit Shifting project and the prospect of US tax reform, changing the current and future tax consequences of business decisions. How we’re mitigating the risks We have a centralised treasury function whose primary role is to manage liquidity and funding requirements as well as our exposure to associated financial and market risks, including credit risk, interest rate risk and foreign exchange risk in-line with Board approved policies. These risk management policies are described in detail in note 27 to the Consolidated Financial Statements. The Board reviews liquidity and funding requirements of the group on an ongoing basis. A strong governance framework is also at the heart of our mitigation approach to tax risk. We’ve a framework for managing taxes that is set centrally and agreed by the Board. We employ specialist teams to manage and assure the operation of this framework. We pay tax in accordance with the laws of the countries where we do business. However, in some areas these laws aren’t clear, and it can take many years to agree an outcome with a tax authority or through litigation. Nevertheless, we always seek to deal with tax authorities in an open and constructive manner, engaging specialist external advise where required. Operational risks
Security and resilience
The security and continuity of our services are critical factors in our commercial success. Our networks and systems are constantly exposed to many different threats, and our customers expect the highest standards of protection and recovery planning to minimise any impact on our services. Cyber-attacks on our own IT systems and those of our customers are becoming more frequent and sophisticated, and we’re investing heavily to keep pace with this growing threat to steal data or equipment or damage our infrastructure. However, service interruption can result from many other sources. These include physical threats like fire, explosion, flooding, overheating, extreme cold or power failure; logical threats such as equipment failure or problems encountered with software upgrades or major changes; or disruptions in our supply chain. Potential impact In the event that our protective measures fail to prevent or contain a major security or continuity incident we might incur major financial loss, long-term damage to reputation and loss of market share. Regulatory sanctions, fines and contract penalties might be applied, contracts might be terminated, and costly concessions might be needed, together with unplanned and rapid improvements to retain business and rebuild trust. We might also miss opportunities to grow revenue and launch new services ahead of the competition. What’s changed over the last year? The acquisition of EE has substantially changed our security risk, adding large volumes of bank account and credit card data which are attractive to hackers. The rapidly escalating cyber threat is recognised as a major risk faced by organisations across the world, and we’re clearly seen as a legitimate target for cyber-incidents. We’re also exposed to collateral damage from attacks on our suppliers and customers by highly motivated and well-resourced nation state actors and criminal gangs. We responded to several potentially serious cyber-attacks during the year, and attempts to compromise our systems using known hacking tools have repeatedly failed. We’ve made real progress on improving risk controls, but more needs to be done to make sure we can keep up with the growing threat. The two major data breaches announced by Yahoo in September and December 2016 both included BT mail account records dating from 2013 and 2014. Some of these accounts are still vulnerable because their owners have never changed their passwords. The customers affected were quickly advised to reset their passwords, and forced resetting of passwords will be applied where necessary. Following the impacts of the winter storms of 2016/2017, and the publication of the UK National Flood Resilience Review, it’s clear that the risk of extreme weather events is increasing. In response, our flood preparedness programme has seen major enhancements in our defence and response capabilities. How we’re mitigating the risks We’re investing in improvements across the full range of technology, processes and people for both security and continuity risks.
47
Our cyber defence programme is focused on segmenting our IT estate to enhance access control and limit the spread of attacks. We’ve improved our strategic defences against Denial of Service (DoS) attacks in order to limit the disruption from high volumes of malicious traffic and from slower, more sophisticated attacks that mimic legitimate data flow. We’ve deployed more scanning, monitoring and logging tools to identify intrusions and to detect anomalous data traffic as early as possible. We’ve also invested in the development of cyber security skills that are deployed around the clock to apply threat intelligence to our defences and manage live incidents. We’ve completely revised the frequency and scope of our vulnerability testing using a risk-based approach to setting priorities, and we’ve increased resources for proactive penetration testing and ethical hacking. We’re adopting a more rigorous approach to auditing our suppliers’ security and are increasingly asking suppliers to substantiate their responses with evidence of compliance with our security policies and contract terms. Our flood preparedness programme has seen us double the size of our Emergency Response Team and their associated capabilities. We’ve enhanced our extreme weather monitoring processes and our ability to map warnings to specific assets. This, together with the production of specific flood defence plans for our critical sites, allows us to respond more rapidly and appropriately to fast-changing weather-related risks. We’ve also enhanced our ability to provide emergency communications support to local communities should these become isolated following storm damage. We continue to invest in resilience and recovery capabilities in response to a range of threats. Major contracts
We have a number of complex and high-value national and multinational customer contracts. The revenue and profitability of these contracts are affected by things like: variation in cost; achieving cost savings anticipated in contract pricing (both in terms of scale and time); delays in achieving agreed milestones owing to factors either in or out of our control; changes in customers’ needs, their budgets, strategies or businesses; and our suppliers’ performance. Any of these factors could make a contract less profitable or even loss-making.
The degree of risk varies with the scope and life of the contract and is typically higher in the early stages. Some customer contracts need investment in the early stages, which we then expect to recover over the life of the contract. Major contracts often involve implementing new systems and communications networks, transforming legacy networks and developing new technologies. Delays or missed milestones might have an impact on us recovering these upfront costs. There’s a substantial performance risk in some of these highly-complex contracts. Potential impact If we don’t manage to meet our commitments under these contracts – or if customers’ needs, budgets, strategies or businesses change – then our expected future revenue, profitability and cash generation may go down. Unexpectedly high costs associated with fulfilling particular transformational contracts could also hit profitability. Earnings may drop. Contracts may even become loss-making through loss of revenue, changes to customers’ businesses (due to, for example, mergers or acquisitions), business failure or contract termination. One of our largest and highest risk contracts is the delivery of a key element of the UK Emergency Services Network (ESN) on our EE mobile network. The complexities described above all apply to this programme. So far delivery has gone well, but there are still plenty of challenging parts of the programme to be delivered including aspects of the contract that are not in our control. We’re still delivering contracts with local authorities through regional fibre deployment programmes, including the Broadband Delivery UK programme (BDUK). As with our other major contracts, if we fail to deliver these contracts successfully it might lead to reduced future revenue, profitability and cash generation. As well as carrying a higher reputational risk, these contracts present specific risks around deployment, delivery and our ability to recover public funding. We also have an obligation to potentially either reinvest or repay grant funding depending on lots of different factors – including how many customers take up a new service. What’s changed over the last year? We’ve acquired EE and with it the Emergency Services Network (ESN) programme, which is a high-profile contract delivered with several partners and managed by the Home Office. To date we’ve delivered on our commitments but it’s still a high-risk programme and is being managed as such. Tough market conditions continue and the impact of the UK voting to leave the EU has meant some customer programmes have been delayed, which has had an impact on the business. Customers are requiring more flexibility in their contracts.
48
The majority of our first phase of BDUK contracts have now completed deployment, with the remainder closing in 2017/18. We’re now mid-delivery of the second phase of contracts (SEP). Whilst these contracts are smaller in scale and coverage, the deployment challenges are significantly greater in terms of the geography encountered as we reach further into the final 5%. While our broadband contracts and ESN carry a different risk profile to other major corporate contracts, we apply our governance and reporting processes to make sure we identify risks and mitigation activities and report them to management. How we’re mitigating the risks At both group and line of business-level we have governance, risk management and reporting processes in place. Independent audits and the checks and balances in individual contracts provide assurance through an independent review programme. To track progress, we monitor how we’re doing on these risks and mitigation actions, and report the result to senior management. A separate, dedicated team provides assurance for our BDUK and ESN projects. The BT Academy helps support skills development and learning initiatives. These help our Contract Management Profession to better identify and manage risk. We also update new training collateral whenever we learn something new. The scope and availability of training options continues to improve through BT-wide learning and development initiatives. In fact we’ve invested in risk training, and assess the management of our contracts against a best practice framework we’ve developed based on our knowledge of running and managing major programmes. Supply chain We operate in a global supply market, with a variety of supply chains ranging from simple to very complex. Guaranteeing their integrity and continuity is critical to our operations. Global markets expose us to global risks, including different standards in labour, environmental and climate change practices. We weigh up the impact and likelihood of external market forces on our suppliers’ ability to support us. A global supply market means better sourcing opportunities, but brings challenges if suppliers become more geographically and culturally remote from our customers – or if governments put barriers in the way of doing business to protect national economic interests. Our dealings with suppliers – from the way we choose them, to the contracts we sign and how we pay them – follow our trading and ethical policies. Impact If something goes wrong in our supply chain, the speed and scale of impact can vary. We need to determine the potential damage to customer experience, the likelihood of higher costs and the potential damage to our brand. If losing an important supplier meant that we had to change technologies, it could cost us a lot of money. If we couldn’t find an alternative supplier, it might compromise the commitments we make to our customers, which could in turn lead to breach of contract, lost revenue or penalties. If any link in our supply chain falls foul of the law, or fails to meet our ethical expectations, that could damage our reputation – possibly leading to legal action and lost revenue. What’s changed over the last year? We dedicate time to assessing emerging geo-political threats and the impact they could have on our supply chain. These include the impacts of the UK leaving the EU; economic problems in countries like Venezuela; increasing regulation over the privacy of personal data; and the growing threat of cyber-attacks on networked ICT systems. We note the continuing trend of mergers and acquisitions in some of the global markets in which we source products and services. It highlights the risk of us becoming too dependent on single or monopolistic suppliers – particularly those less constrained by regulation and who might charge us more than their domestic customers. How we’re mitigating the risks We have a few really critical suppliers. We keep a close watch on their performance and ability to meet their obligations. We tell the business when to prepare for the risk of a supplier failing, and our senior leaders continually review how ready we are for such events. We make sure we exercise the right due diligence when it comes to introducing new suppliers and continuing to do business with existing ones. That includes checks on company finances, business systems, accreditations, media reputation and ethical practices. We manage our top suppliers according to the contracts they’ve signed. We work with them to find better ways of working, reducing our exposure to risks around poor supplier practices in the process.

49
The increasing focus on human rights, following legislation like the Modern Slavery Act 2015, means that we must keep examining the potential risk of both modern slavery and human trafficking in our supply chain. We must also ensure that our products are free of components that could be sourced from areas of armed conflict, or sourced using methods that are unsustainable or ethically questionable. Employee engagement Our people are a vital part of our ambition to deliver a positive customer experience and sustainable, profitable revenue growth. Our people strategy supports this ambition by creating an environment where people can thrive as part of a dynamic business. Great employee engagement is necessary to ensure we meet our strategic aims. Potential impact If we fail to recruit, retain and engage our workforce it could impact our ability to deliver a great customer experience and continue to grow the business. Furthermore, a failure to develop and retain talent could result in a greater need for external recruitment, which would add cost to the business. Poor engagement also raises the risk of general industrial unrest and action. What’s changed over the last year? Following the acquisition of EE we’re working to bring these two businesses together into a truly integrated company. We’ve identified examples of best practice from both organisations that will act as building blocks for our ‘better than both’ ambition. We’ve launched a new set of values to reflect this. We’ve launched a new employee survey and approach which make it easier for managers and their teams to see the key things they need to do to improve levels of engagement and better serve our customers. How we’re mitigating the risks We provide comprehensive support and training to help our people deliver to the best of their ability. We regularly review our pay and benefits to make sure our remuneration is competitive when compared to other companies of a similar size and complexity. We seek a positive and enduring relationship with our people and their representatives. We have a very comprehensive global engagement strategy in pursuit of that aim. This involves both our employees and their representatives (Unions, Works Councils and Employee Fora). We also have a comprehensive business continuity function.
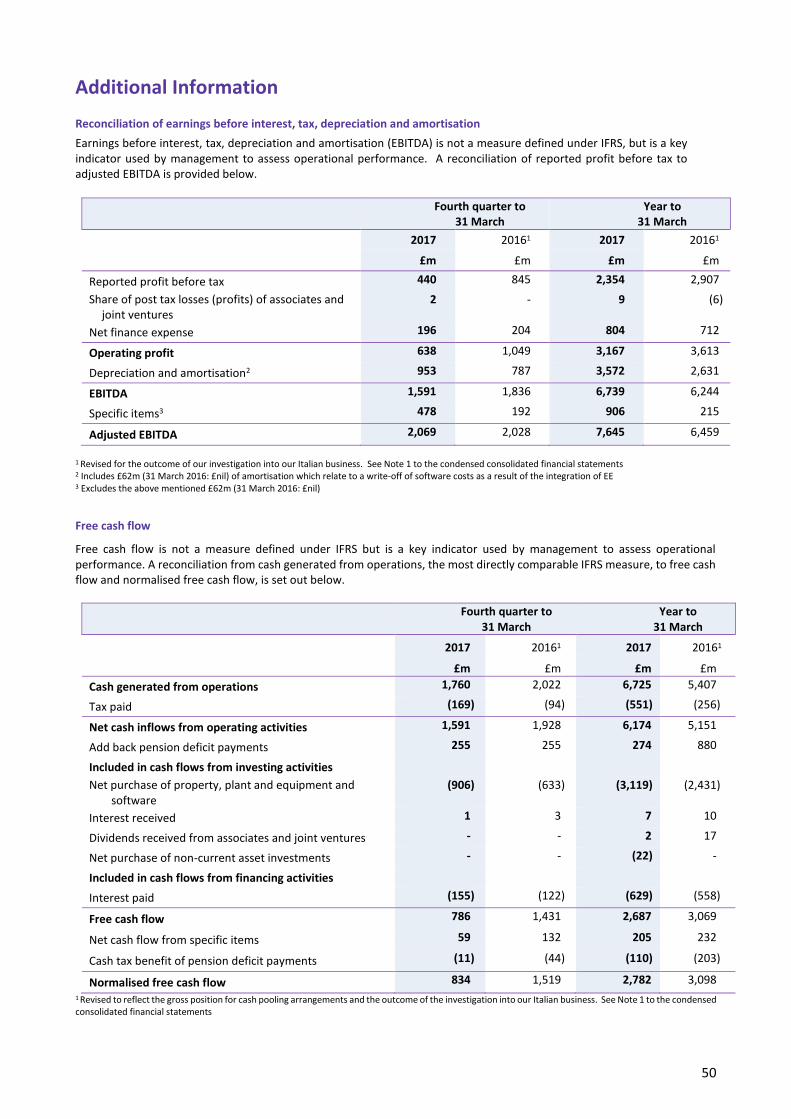
50
Additional Information
Reconciliation of earnings before interest, tax, depreciation and amortisation
Earnings before interest, tax, depreciation and amortisation (EBITDA) is not a measure defined under IFRS, but is a key indicator used by management to assess operational performance. A reconciliation of reported profit before tax to adjusted EBITDA is provided below.
Fourth quarter to 31 March
Year to 31 March
2017 20161 2017 20161
£m £m £m £m
Reported profit before tax 440 845 2,354 2,907
Share of post tax losses (profits) of associates and joint ventures
2 - 9 (6)
Net finance expense 196 204 804 712
Operating profit 638 1,049 3,167 3,613
Depreciation and amortisation2 953 787 3,572 2,631
EBITDA 1,591 1,836 6,739 6,244
Specific items3 478 192 906 215
Adjusted EBITDA 2,069 2,028 7,645 6,459
1 Revised for the outcome of our investigation into our Italian business. See Note 1 to the condensed consolidated financial statements 2 Includes £62m (31 March 2016: £nil) of amortisation which relate to a write-off of software costs as a result of the integration of EE 3 Excludes the above mentioned £62m (31 March 2016: £nil)
Free cash flow
Free cash flow is not a measure defined under IFRS but is a key indicator used by management to assess operational performance. A reconciliation from cash generated from operations, the most directly comparable IFRS measure, to free cash flow and normalised free cash flow, is set out below.
Fourth quarter to 31 March
Year to 31 March
2017 20161 2017 20161
£m £m £m £m
Cash generated from operations 1,760 2,022 6,725 5,407
Tax paid (169) (94) (551) (256)
Net cash inflows from operating activities 1,591 1,928 6,174 5,151
Add back pension deficit payments 255 255 274 880
Included in cash flows from investing activities
Net purchase of property, plant and equipment and software
(906) (633) (3,119) (2,431)
Interest received 1 3 7 10
Dividends received from associates and joint ventures - - 2 17
Net purchase of non-current asset investments - - (22) -
Included in cash flows from financing activities
Interest paid (155) (122) (629) (558)
Free cash flow 786 1,431 2,687 3,069
Net cash flow from specific items 59 132 205 232
Cash tax benefit of pension deficit payments (11) (44) (110) (203)
Normalised free cash flow 834 1,519 2,782 3,098
1 Revised to reflect the gross position for cash pooling arrangements and the outcome of the investigation into our Italian business. See Note 1 to the condensed consolidated financial statements
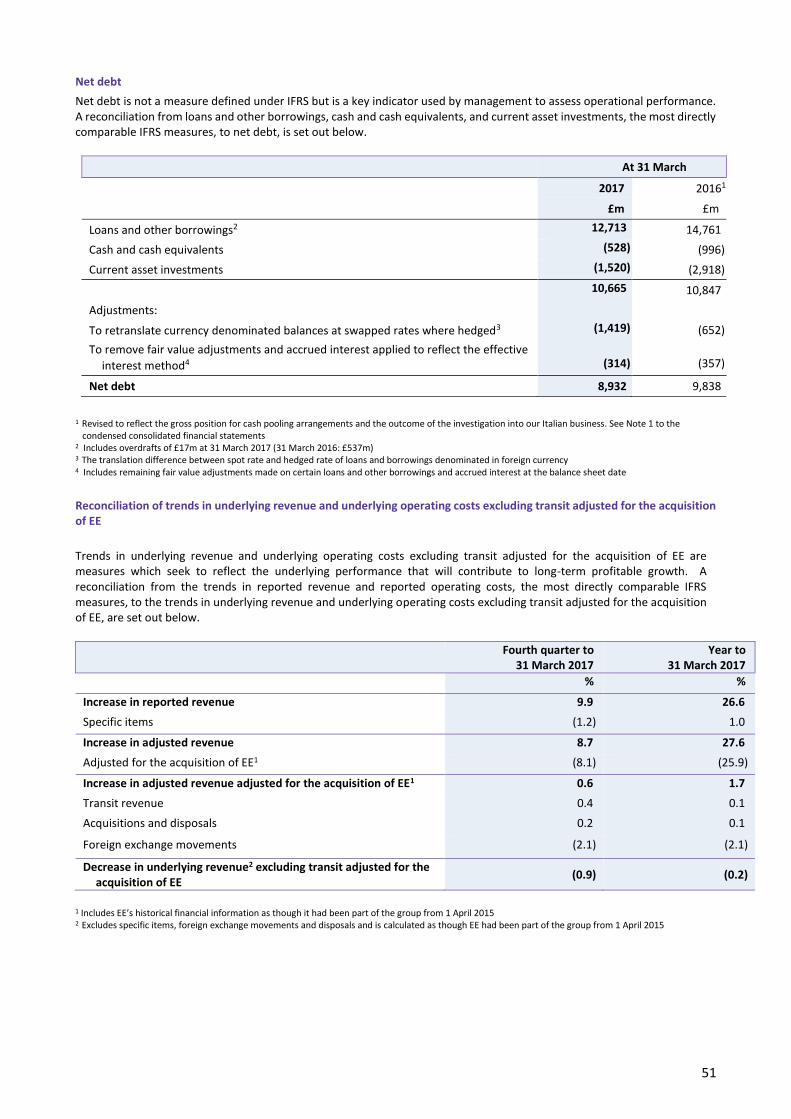
51
Net debt
Net debt is not a measure defined under IFRS but is a key indicator used by management to assess operational performance. A reconciliation from loans and other borrowings, cash and cash equivalents, and current asset investments, the most directly comparable IFRS measures, to net debt, is set out below.
At 31 March
2017 20161 £m £m
Loans and other borrowings2 12,713 14,761
Cash and cash equivalents (528) (996)
Current asset investments (1,520) (2,918)
10,665 10,847
Adjustments:
To retranslate currency denominated balances at swapped rates where hedged3 (1,419) (652)
To remove fair value adjustments and accrued interest applied to reflect the effective
interest method4
(314)
(357)
Net debt 8,932 9,838
1 Revised to reflect the gross position for cash pooling arrangements and the outcome of the investigation into our Italian business. See Note 1 to the condensed consolidated financial statements
2 Includes overdrafts of £17m at 31 March 2017 (31 March 2016: £537m) 3 The translation difference between spot rate and hedged rate of loans and borrowings denominated in foreign currency 4 Includes remaining fair value adjustments made on certain loans and other borrowings and accrued interest at the balance sheet date
Reconciliation of trends in underlying revenue and underlying operating costs excluding transit adjusted for the acquisition of EE
Trends in underlying revenue and underlying operating costs excluding transit adjusted for the acquisition of EE are measures which seek to reflect the underlying performance that will contribute to long-term profitable growth. A reconciliation from the trends in reported revenue and reported operating costs, the most directly comparable IFRS measures, to the trends in underlying revenue and underlying operating costs excluding transit adjusted for the acquisition of EE, are set out below.
Fourth quarter to
31 March 2017 Year to
31 March 2017 % %
Increase in reported revenue 9.9 26.6
Specific items (1.2) 1.0
Increase in adjusted revenue 8.7 27.6
Adjusted for the acquisition of EE1 (8.1) (25.9)
Increase in adjusted revenue adjusted for the acquisition of EE1 0.6 1.7
Transit revenue 0.4 0.1
Acquisitions and disposals 0.2 0.1
Foreign exchange movements (2.1) (2.1)
Decrease in underlying revenue2 excluding transit adjusted for the acquisition of EE
(0.9) (0.2)
1 Includes EE’s historical financial information as though it had been part of the group from 1 April 2015 2 Excludes specific items, foreign exchange movements and disposals and is calculated as though EE had been part of the group from 1 April 2015
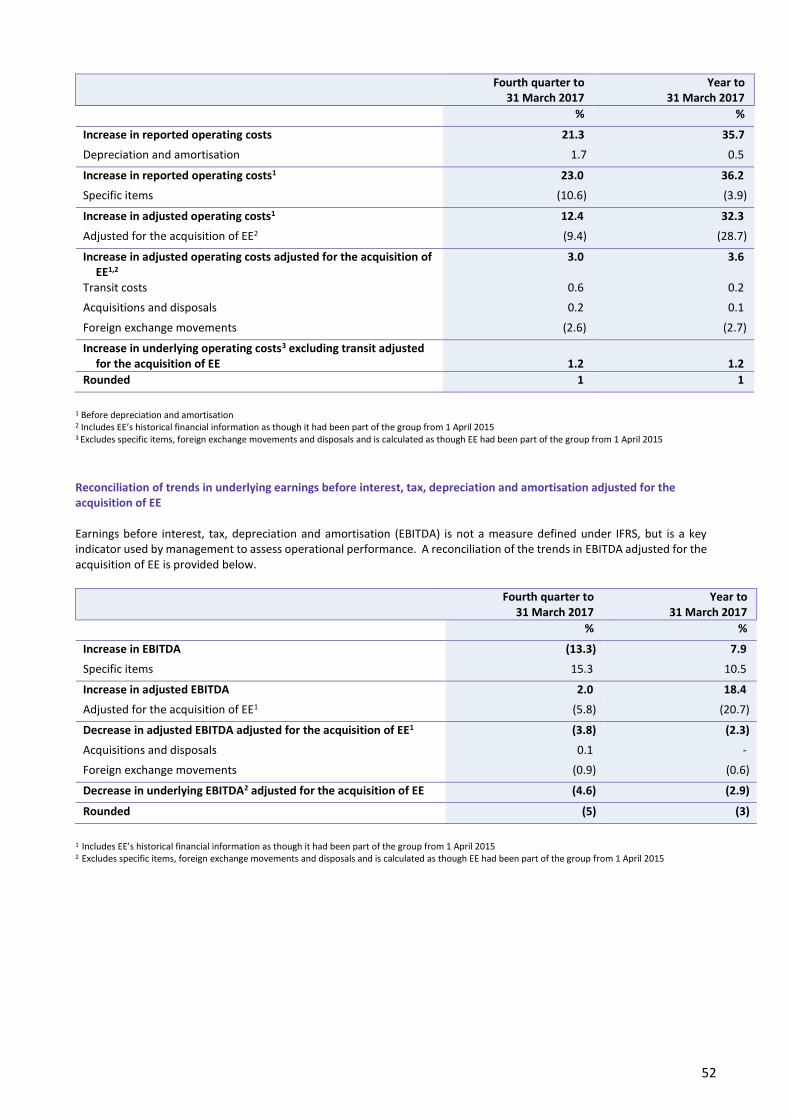
52
Fourth quarter to
31 March 2017 Year to
31 March 2017 % %
Increase in reported operating costs 21.3 35.7
Depreciation and amortisation 1.7 0.5
Increase in reported operating costs1 23.0 36.2
Specific items (10.6) (3.9)
Increase in adjusted operating costs1 12.4 32.3
Adjusted for the acquisition of EE2 (9.4) (28.7)
Increase in adjusted operating costs adjusted for the acquisition of EE1,2
3.0 3.6
Transit costs 0.6 0.2
Acquisitions and disposals 0.2 0.1
Foreign exchange movements (2.6) (2.7)
Increase in underlying operating costs3 excluding transit adjusted for the acquisition of EE
1.2
1.2
Rounded 1 1
1 Before depreciation and amortisation 2 Includes EE’s historical financial information as though it had been part of the group from 1 April 2015 3 Excludes specific items, foreign exchange movements and disposals and is calculated as though EE had been part of the group from 1 April 2015
Reconciliation of trends in underlying earnings before interest, tax, depreciation and amortisation adjusted for the acquisition of EE Earnings before interest, tax, depreciation and amortisation (EBITDA) is not a measure defined under IFRS, but is a key indicator used by management to assess operational performance. A reconciliation of the trends in EBITDA adjusted for the acquisition of EE is provided below.
Fourth quarter to
31 March 2017 Year to
31 March 2017 % %
Increase in EBITDA (13.3) 7.9
Specific items 15.3 10.5
Increase in adjusted EBITDA 2.0 18.4
Adjusted for the acquisition of EE1 (5.8) (20.7)
Decrease in adjusted EBITDA adjusted for the acquisition of EE1 (3.8) (2.3)
Acquisitions and disposals 0.1 -
Foreign exchange movements (0.9) (0.6)
Decrease in underlying EBITDA2 adjusted for the acquisition of EE (4.6) (2.9)
Rounded (5) (3)
1 Includes EE’s historical financial information as though it had been part of the group from 1 April 2015 2 Excludes specific items, foreign exchange movements and disposals and is calculated as though EE had been part of the group from 1 April 2015
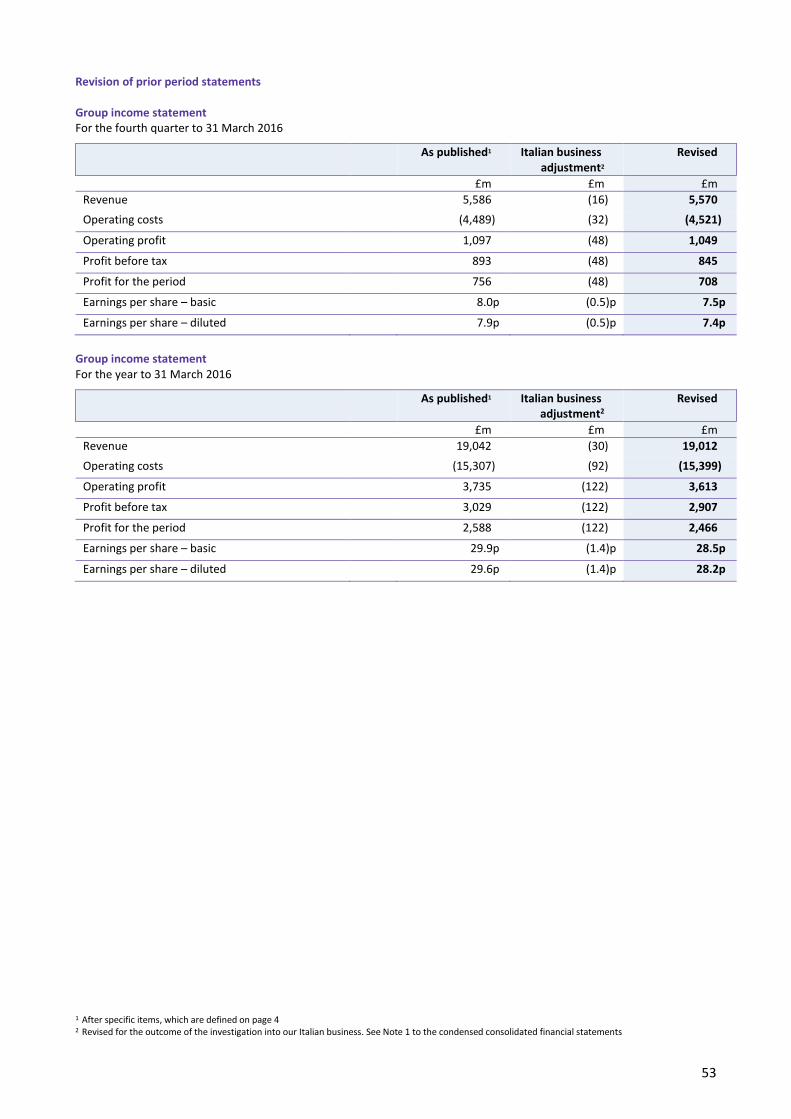
53
Revision of prior period statements Group income statement For the fourth quarter to 31 March 2016
As published1 Italian business adjustment2
Revised
£m £m £m
Revenue 5,586 (16) 5,570
Operating costs (4,489) (32) (4,521)
Operating profit 1,097 (48) 1,049
Profit before tax 893 (48) 845
Profit for the period 756 (48) 708
Earnings per share – basic 8.0p (0.5)p 7.5p
Earnings per share – diluted 7.9p (0.5)p 7.4p
Group income statement For the year to 31 March 2016
As published1 Italian business adjustment2
Revised
£m £m £m
Revenue 19,042 (30) 19,012
Operating costs (15,307) (92) (15,399)
Operating profit 3,735 (122) 3,613
Profit before tax 3,029 (122) 2,907
Profit for the period 2,588 (122) 2,466
Earnings per share – basic 29.9p (1.4)p 28.5p
Earnings per share – diluted 29.6p (1.4)p 28.2p
1 After specific items, which are defined on page 4 2 Revised for the outcome of the investigation into our Italian business. See Note 1 to the condensed consolidated financial statements
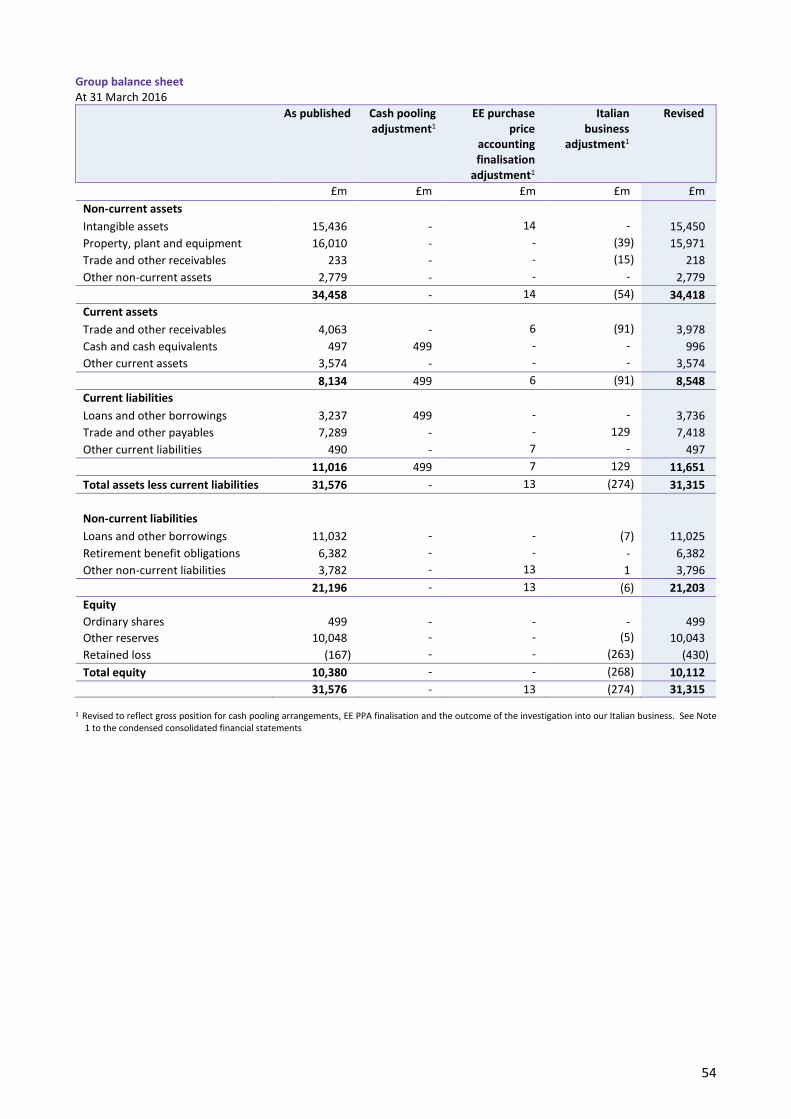
54
Group balance sheet At 31 March 2016
As published Cash pooling adjustment1
EE purchase price
accounting finalisation
adjustment1
Italian business
adjustment1
Revised
£m £m £m £m £m
Non-current assets
Intangible assets 15,436 - 14 - 15,450
Property, plant and equipment 16,010 - - (39) 15,971
Trade and other receivables 233 - - (15) 218
Other non-current assets 2,779 - - - 2,779
34,458 - 14 (54) 34,418
Current assets
Trade and other receivables 4,063 - 6 (91) 3,978
Cash and cash equivalents 497 499 - - 996
Other current assets 3,574 - - - 3,574
8,134 499 6 (91) 8,548
Current liabilities
Loans and other borrowings 3,237 499 - - 3,736
Trade and other payables 7,289 - - 129 7,418
Other current liabilities 490 - 7 - 497
11,016 499 7 129 11,651
Total assets less current liabilities 31,576 - 13 (274) 31,315
Non-current liabilities
Loans and other borrowings 11,032 - - (7) 11,025
Retirement benefit obligations 6,382 - - - 6,382
Other non-current liabilities 3,782 - 13 1 3,796
21,196 - 13 (6) 21,203
Equity
Ordinary shares 499 - - - 499
Other reserves 10,048 - - (5) 10,043
Retained loss (167) - - (263) (430)
Total equity 10,380 - - (268) 10,112
31,576 - 13 (274) 31,315
1 Revised to reflect gross position for cash pooling arrangements, EE PPA finalisation and the outcome of the investigation into our Italian business. See Note 1 to the condensed consolidated financial statements
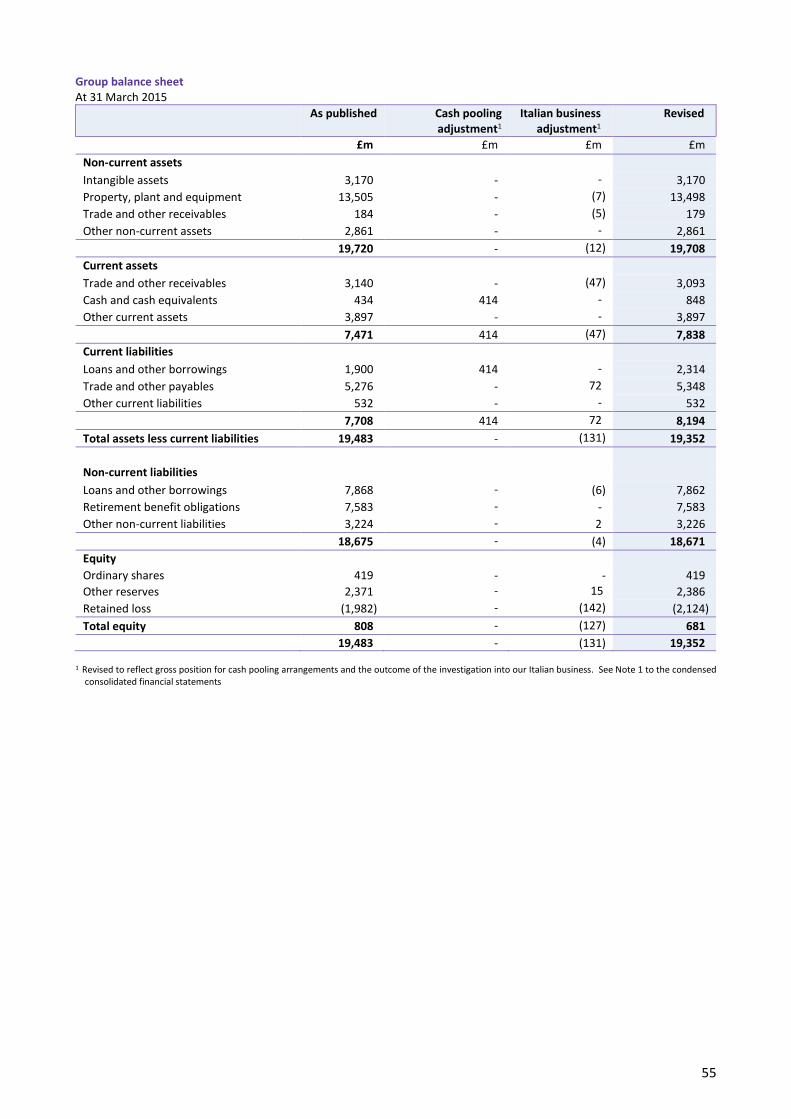
55
Group balance sheet At 31 March 2015
As published Cash pooling adjustment1
Italian business adjustment1
Revised
£m £m £m £m
Non-current assets
Intangible assets 3,170 - - 3,170
Property, plant and equipment 13,505 - (7) 13,498
Trade and other receivables 184 - (5) 179
Other non-current assets 2,861 - - 2,861
19,720 - (12) 19,708
Current assets
Trade and other receivables 3,140 - (47) 3,093
Cash and cash equivalents 434 414 - 848
Other current assets 3,897 - - 3,897
7,471 414 (47) 7,838
Current liabilities
Loans and other borrowings 1,900 414 - 2,314
Trade and other payables 5,276 - 72 5,348
Other current liabilities 532 - - 532
7,708 414 72 8,194
Total assets less current liabilities 19,483 - (131) 19,352
Non-current liabilities
Loans and other borrowings 7,868 - (6) 7,862
Retirement benefit obligations 7,583 - - 7,583
Other non-current liabilities 3,224 - 2 3,226
18,675 - (4) 18,671
Equity
Ordinary shares 419 - - 419
Other reserves 2,371 - 15 2,386
Retained loss (1,982) - (142) (2,124)
Total equity 808 - (127) 681
19,483 - (131) 19,352
1 Revised to reflect gross position for cash pooling arrangements and the outcome of the investigation into our Italian business. See Note 1 to the condensed consolidated financial statements
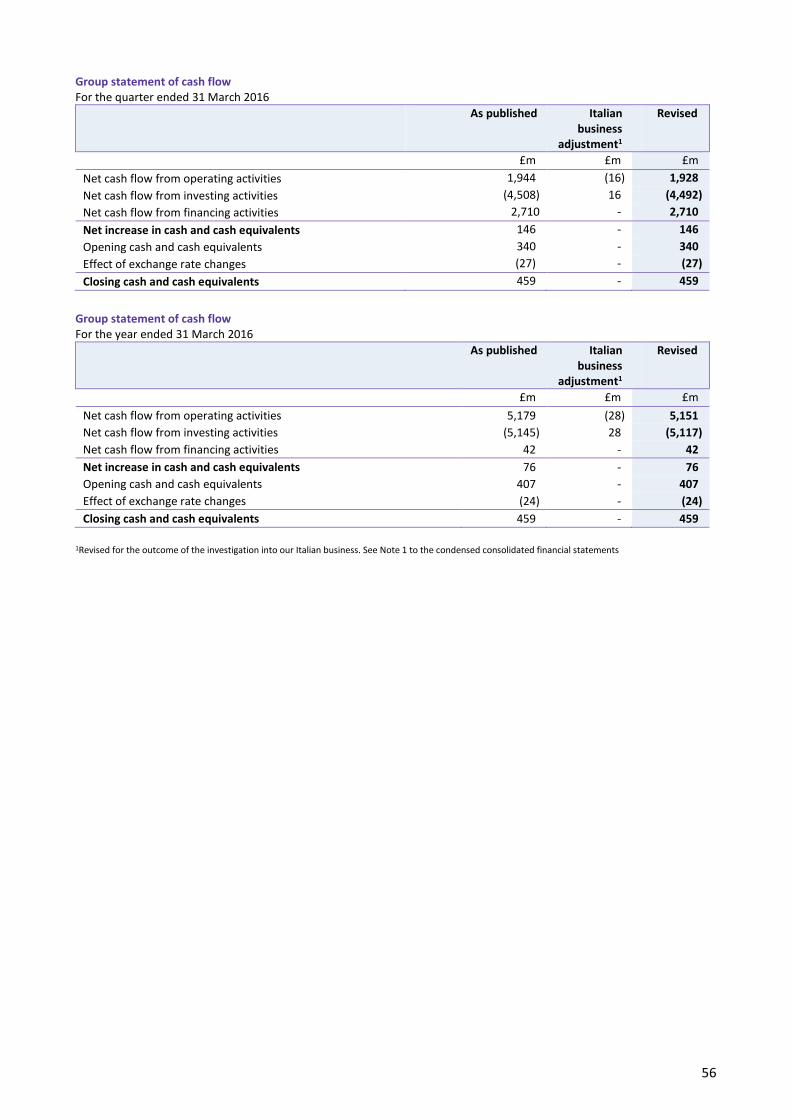
56
Group statement of cash flow For the quarter ended 31 March 2016
As published Italian business
adjustment1
Revised
£m £m £m
Net cash flow from operating activities 1,944 (16) 1,928
Net cash flow from investing activities (4,508) 16 (4,492)
Net cash flow from financing activities 2,710 - 2,710
Net increase in cash and cash equivalents 146 - 146
Opening cash and cash equivalents 340 - 340
Effect of exchange rate changes (27) - (27)
Closing cash and cash equivalents 459 - 459
Group statement of cash flow For the year ended 31 March 2016
As published Italian business
adjustment1
Revised
£m £m £m
Net cash flow from operating activities 5,179 (28) 5,151
Net cash flow from investing activities (5,145) 28 (5,117)
Net cash flow from financing activities 42 - 42
Net increase in cash and cash equivalents 76 - 76
Opening cash and cash equivalents 407 - 407
Effect of exchange rate changes (24) - (24)
Closing cash and cash equivalents 459 - 459
1Revised for the outcome of the investigation into our Italian business. See Note 1 to the condensed consolidated financial statements
57
Forward-looking statements – caution advised Certain statements in this results release are forward-looking and are made in reliance on the safe harbour provisions of the US Private Securities Litigation Reform Act of 1995. These statements include, without limitation, those concerning: our outlook for 2016/17 and 2017/18 including revenue, EBITDA and free cash flow; dividend growth and share buyback; group restructuring; accelerating cost transformation; investment in customer experience; 4G network coverage; and fibre broadband roll out. Although BT believes that the expectations reflected in these forward-looking statements are reasonable, it can give no assurance that these expectations will prove to have been correct. Because these statements involve risks and uncertainties, actual results may differ materially from those expressed or implied by these forward-looking statements. Factors that could cause differences between actual results and those implied by the forward-looking statements include, but are not limited to: material adverse changes in economic conditions in the markets served by BT whether as a result of the uncertainties arising from the UK’s exit from the EU or otherwise; future regulatory and legal actions, decisions, outcomes of appeal and conditions or requirements in BT’s operating areas, including the outcome of OFCOM’s strategic review of digital communications in the UK, as well as competition from others; the outcome of Ofcom’s Wholesale Local Access Market Review; responses to Openreach consultations and the results of any future spectrum auctions; selection by BT and its lines of business of the appropriate trading and marketing models for its products and services; fluctuations in foreign currency exchange rates and interest rates; technological innovations, including the cost of developing new products, networks and solutions and the need to increase expenditures for improving the quality of service; prolonged adverse weather conditions resulting in a material increase in overtime, staff or other costs, or impact on customer service; developments in the convergence of technologies; external threats to cyber security, data or resilience; political and geo-political risks; the anticipated benefits and advantages of new technologies, products and services not being realised; the timing of entry and profitability of BT in certain markets; significant changes in market shares for BT and its principal products and services; the underlying assumptions and estimates made in respect of major customer contracts proving unreliable; the anticipated benefits and synergies of the EE integration not being delivered; the aims of and anticipated savings from the group’s restructuring programmes not being delivered; the improvements to the control environment proposed following the investigations into BT’s Italian business not being implemented successfully or effectively; and general financial market conditions affecting BT’s performance and ability to raise finance. BT undertakes no obligation to update any forward-looking statements whether as a result of new information, future events or otherwise.