Embed Size (px)
Citation preview

Q3 2012 Financial Presentation
DOF Subsea Group

Agenda
Highlights
Recent events
Group overview
Projects
Contract coverage
Financials
Outlook
Appendix

DOF Subsea Group – Highlights
Fleet One of the largest subsea vessel owners in the world Operates a fleet of 25 vessels with a total market value of NOK16 447 million Operates 52 ROVs Value adjusted fleet age of 4.1 years
Global organization Head office in Bergen Regional offices in Australia, Singapore, Norway, UK, Angola, US, Canada and
Brazil
Total of 2 343 employees Subsea employees: 1 370 Of which offshore engineers and project staff: 973 Marine crew: 1 000
DOF Subsea 3
Norway Brazil Canada US UK Asia Pacific Angola
244 311 35 66 337 359 18
* As pr 30th September 2012

DOF Subsea Group – Highlights
Strong back-log and rising market values of vessels
DOF Subsea 4
Key Figures
27.9 % CAGR
22.1 % CAGR
* All numbers excluding gain on sale of assets.
Back-log incl. options NOK 15 907 million
Market value of fleet NOK 16 447 million
Number of shares 119 733 714
Total Per share
Book equity NOK 5 060 million NOK 42.27
Value adj. equity NOK 7 673 million NOK 64.09
Book equity ratio 27 %
Value adj. equity ratio 36 %
NOK million Q3 2009 Q3 2010 Q3 2011 Q3 2012Operating revenue 743 851 1 152 1 354 EBITDA 234 282 370 489 EBITDA margin 31.4% 33.2% 32.1% 36.1%
Total assets 12 530 16 517 19 117 18 760 Equity 3 860 4 466 4 782 5 061
29 %
30 %
31 %
32 %
33 %
34 %
35 %
36 %
37 %
-
200
400
600
800
1 000
1 200
1 400
1 600
Q3 2009 Q3 2010 Q3 2011 Q3 2012
NO
K m
illio
n
Operating revenue EBITDA EBITDA margin

Recent events
Contracts Chevron extended contract on Skandi Salvador – firm until September 2013 New contract on Skandi Constructor with Helix – 3 years with options Several subsea contracts in the Far East region
Skandi Hercules, Skandi Hawk and Geobay Master Service Agreement with Eni Skandi Singapore - 4 month New Zealand campaign in 2013
Several subsea contracts in the Atlantic region Geoholm, Geosund and Skandi Skolten Tordis Flex Jumper Replacement contract awarded by Statoil
Several subsea contracts in the Gulf of Mexico Geoholm, Skandi Constructor
Finance Sold NOK 200 million of own holding in bond DOFSUB06
DOF Subsea 5

Group overview

Ownership structure
DOF Subsea 7
Modern high-end fleet and equipment
25 subsea and AHTS vessels in operation
Delivery of newbuild TBN in May 2013
50 ROVs, 1 ROTV and 1 AUV in operation
Leading subsea contractor
51% 49%
100%
DOF ASA FIRST RESERVE CORPORATION
DOF SUBSEA HOLDING AS
DOF SUBSEA AS
DOF Subsea AS
DOF Subsea Asia Pacific
Singapore
Australia
Indonesia
Malaysia
Mashhor DOF Subsea (50%)
Brunei
DOF Subsea Atlantic
UK
US
Angola
Norway
Arctic (49%) Russia
DOF Subsea Brazil
Survey & Positioning
UK
US
Canada
Management Companies
DOF Management
(34 %)
Marin IT (35 %)
Engineering Companies
CSL
Semar (50%)
Ship/Asset Owning
Companies
DOF Subsea Rederi
DOF Subsea Rederi II
DOF Installer (83.66 %)
DOFTECH (50 %)
TECHDOF (50 %)
DOF Subsea ROV
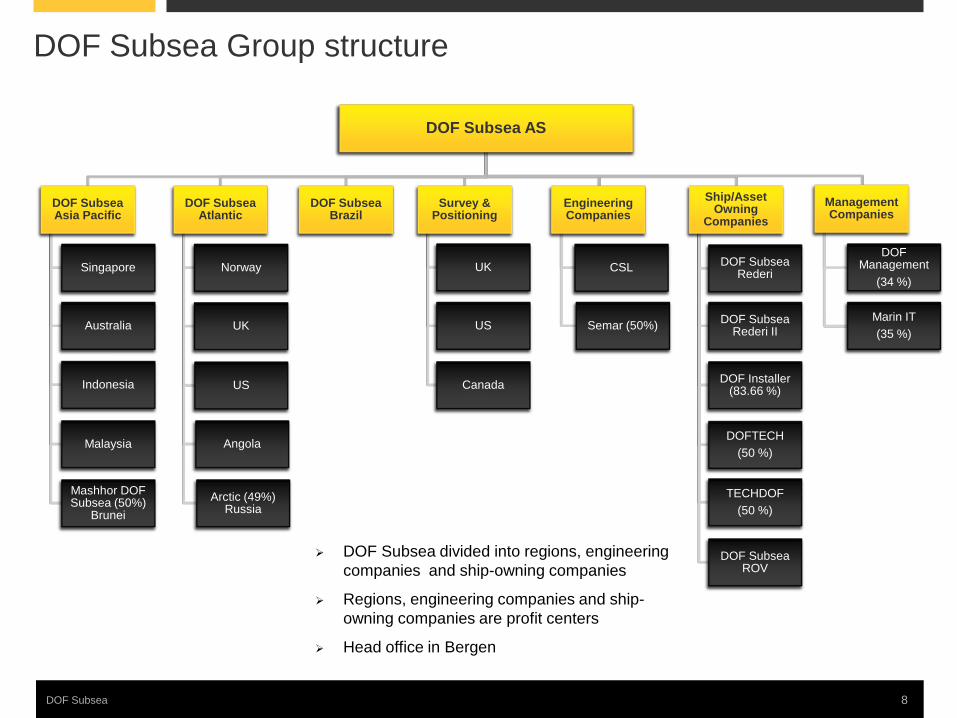
DOF Subsea Group structure
DOF Subsea 8
DOF Subsea divided into regions, engineering companies and ship-owning companies
Regions, engineering companies and ship-owning companies are profit centers
Head office in Bergen

GEOGRAPHICAL FOCUS AREAS
Perth Rio de Janeiro
Buenos Aires
Singapore
Houston
St. Johns Aberdeen
Cairo
Brunei
Macaé
Jakarta
Manila
Angola
Moscow
Bergen
(66)
(311)
(18)
(221)
(129)
(6)
(244)
(337) (35)
A Global Subsea Player
DOF Subsea 9
Malaysia

DOF Subsea – Company history
2005 2006 2007
Fleet: 11 vessels May: DOF acquired Geoconsult and established GEO (now DOF Subsea) May: Private placement of shares of NOK 715 mill Nov: Listed on Oslo Stock Exchange Nov: Acquisition of Century Subsea
Fleet: 11 vessels Feb: Acquisition of Covus Corp May: Set up of Geo do Brazil Aug: Established 50/50 JV in Brunei
Fleet: 13 vessels Jan: Acquired 50% of SEMAR Jan: Acquired 100% of DOFCON Mar: Establishment of Aker Oilfield Services Mar: Name change to DOF Subsea Apr: Acquisition of CSL Aug: Merger of Mgmt company with DOF Management AS
2008
Fleet: 16 vessels Feb: Delivery of Geograph Jul: Delivery of Skandi Acergy Nov: Delivery of Skandi Seven and sale of Geofjord Dec: DOF Subsea acquired by DOF ASA and First Reserve JV with Technip
2009 2010
Fleet: 18 vessels Feb: Delivery of Skandi Salvador Mar: Delivery of Skandi Arctic Dec: Delivery of Skandi Santos
Fleet: 21 vessels Jan: Delivery of Skandi Aker Feb: Sale of Geo Challenger Jun: Acquisition of SWG Jul: Delivery of Skandi Vitoria and Skandi Skolten Dec: Delivery of Skandi Hercules JV with Technip
2011
Fleet: 24 vessels Feb: Delivery of Skandi Niteroi May: Sale of Geosounder Jun: Acqusition Skandi Constructor Jul: Delivery of Skandi Skansen Sep: Delivery of Skandi Singapore
Incorporated on 24th of May 2005 after DOF ASA acquired GEO Group AS and its subsidiary Geoconsult AS
DOF Subsea was established by DOF ASA in order to create a more effective organization with the aim of establishing a leading subsea services company DOF ASA transferred its multipurpose/ROV vessels to
DOF Subsea, constituting four vessels and one newbuild
DOF Subsea is headquartered in Bergen, Norway
DOF Subsea fleet evolution
-
2
4
6
8
10
12
14
16
18
0
4
8
12
16
20
24
28
2005 2006 2007 2008 2009 2010 2011 2012
MV
fleet
in B
n N
OK
Num
ber o
f ves
sels
MV of fleet
2012
Fleet: 25 vessels Mar: Sale of OSCV newbuild. Mar: Signed OSCV newbuild contract with delivery May 2013
DOF Subsea 10

Level of industry barriers to entry
DOF Subsea’s main presence is in segments with medium to high barriers to entry and high complexity of operations
Higher margins and earnings beyond the time charter rates DOF Subsea is gradually building engineering capabilities
Leve
l of b
arrie
rs to
ent
ry
Incr
ease
d en
gine
erin
g re
quire
men
t
Complex subsea operations
Marine transport/ services
Com
plex
ity a
nd s
ize
of o
pera
tions
In
crea
sed
syst
em re
quire
men
t
DSV
OSCV
ROV
AHTS
PSV
11 DOF Subsea
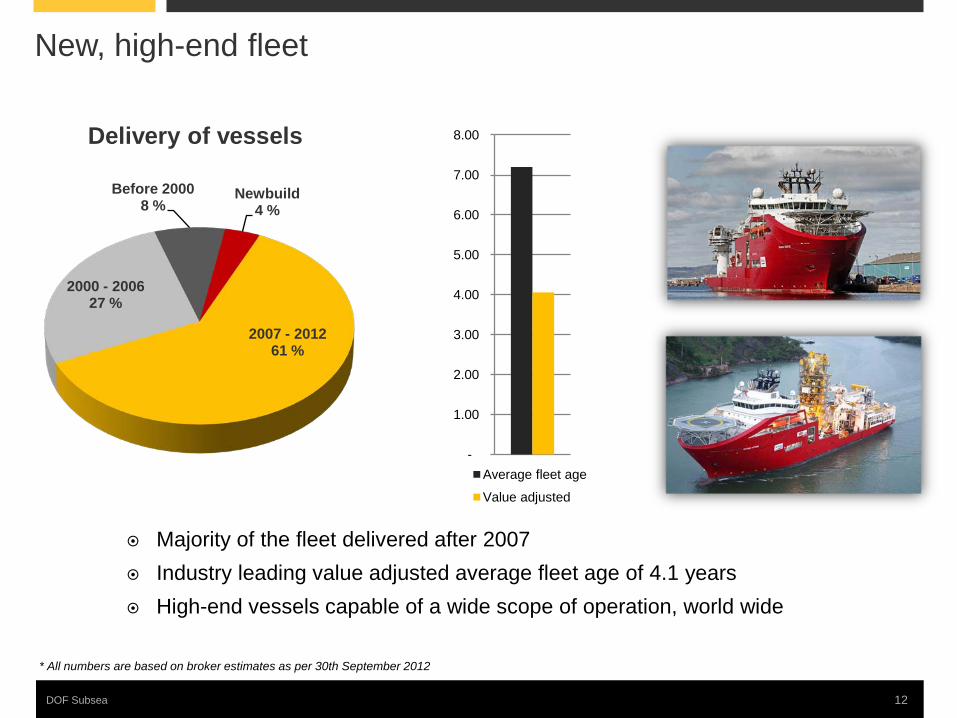
New, high-end fleet
Majority of the fleet delivered after 2007 Industry leading value adjusted average fleet age of 4.1 years High-end vessels capable of a wide scope of operation, world wide
12 DOF Subsea
Newbuild 4 %
2007 - 2012 61 %
2000 - 2006 27 %
Before 2000 8 %
Delivery of vessels
* All numbers are based on broker estimates as per 30th September 2012
-
1.00
2.00
3.00
4.00
5.00
6.00
7.00
8.00
Average fleet age
Value adjusted
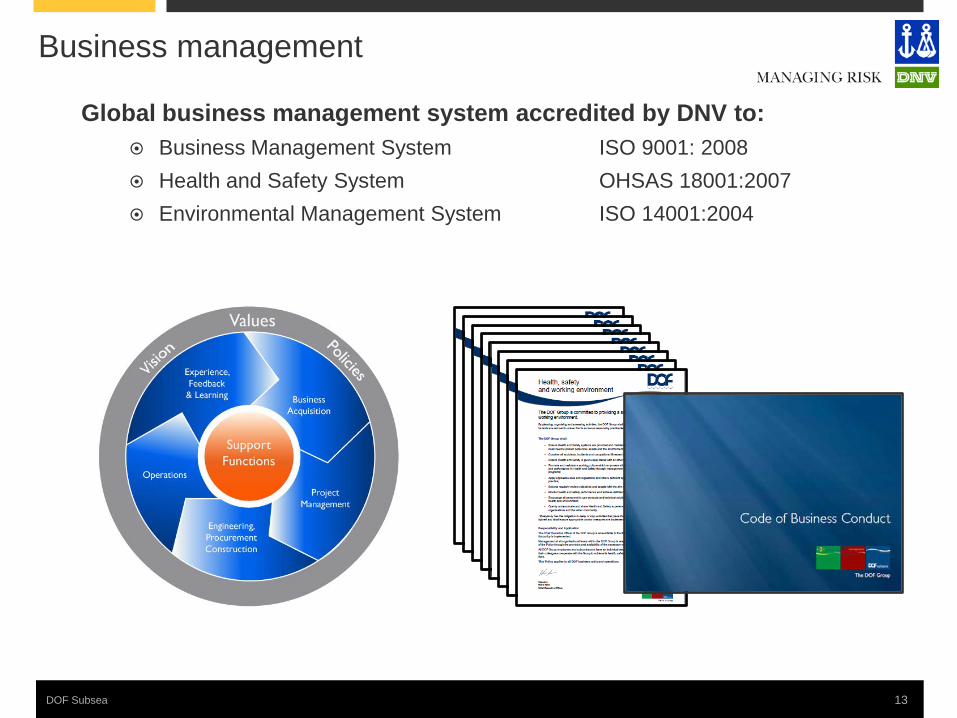
Business management
Global business management system accredited by DNV to: Business Management System ISO 9001: 2008 Health and Safety System OHSAS 18001:2007 Environmental Management System ISO 14001:2004
2009
DOF Subsea 13

HSEQ
LTI frequencies for 2011 was 0.9 and for YTD 2012 it has been 0
High reporting of safety operations shows commitment to HSEQ
DOF Subsea 14
2011 2012
Safety Observations last 12 months
0
500
1000
1500
2000
2500
Oct Nov Dec Jan Feb Mar Apr May Jun July Aug Sep
0.00
2.00
4.00
6.00
8.00
10.00
12.00
2005 2006 2007 2008 2009 2010 2011 2012
DOF Subsea - LTI frequency
IMCA - LTI frequency
DOF Subsea - recordable Incident frequency
IMCA - Recordable ferquency
DOF Subsea
Projects
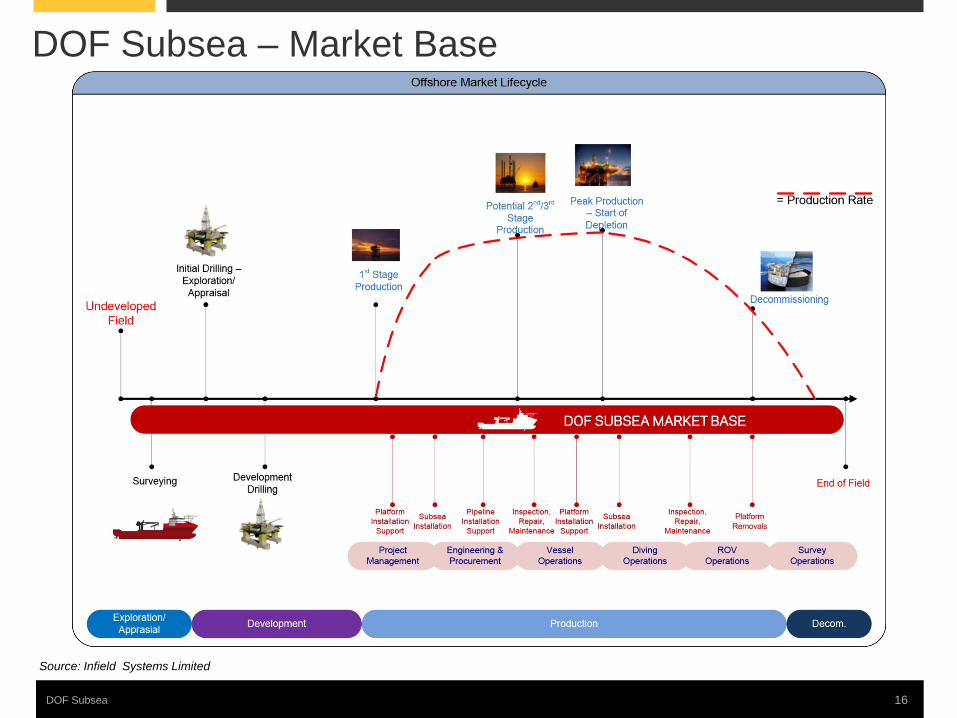
DOF Subsea – Market Base
DOF Subsea 16
Source: Infield Systems Limited
DOF Subsea – Projects
DOF Subsea 17
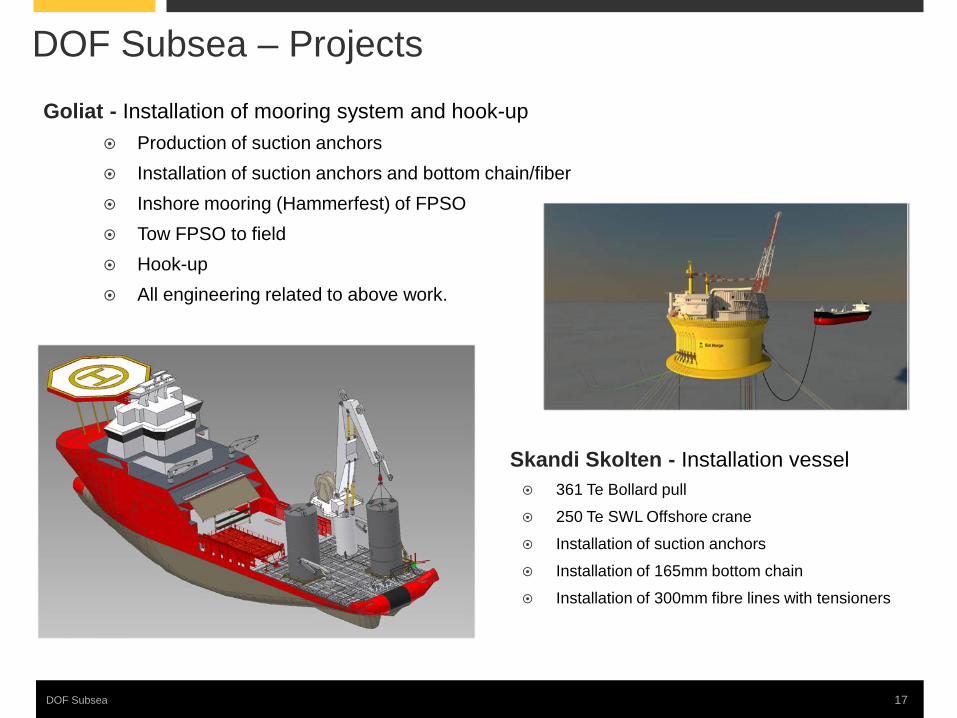
Goliat - Installation of mooring system and hook-up Production of suction anchors Installation of suction anchors and bottom chain/fiber Inshore mooring (Hammerfest) of FPSO Tow FPSO to field Hook-up All engineering related to above work.
Skandi Skolten - Installation vessel 361 Te Bollard pull
250 Te SWL Offshore crane
Installation of suction anchors
Installation of 165mm bottom chain
Installation of 300mm fibre lines with tensioners
DOF Subsea – Projects
DOF Subsea 18
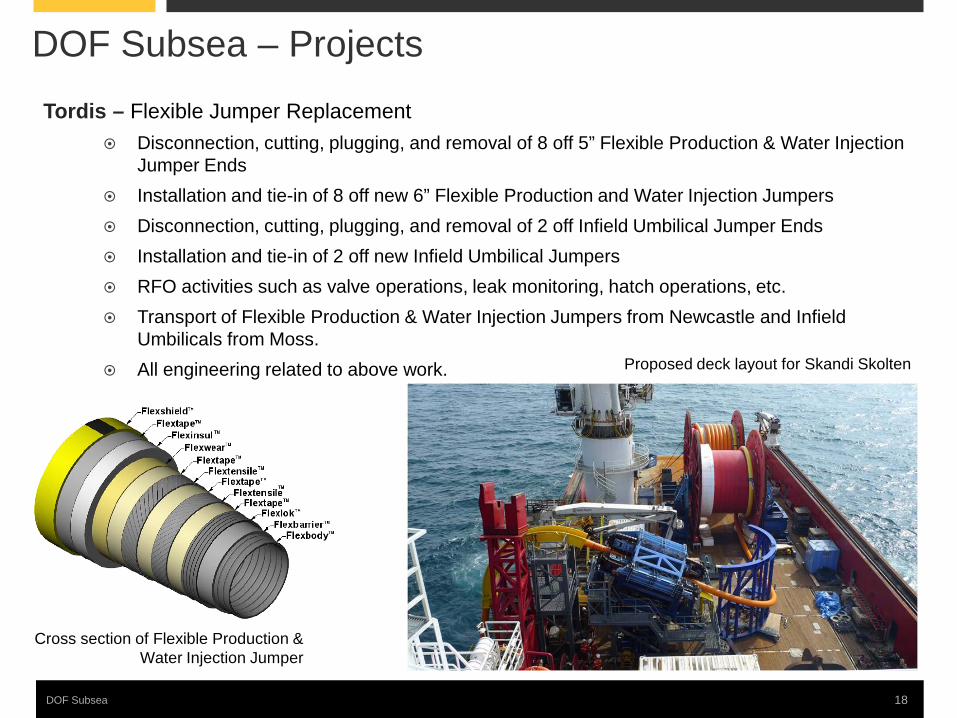
Tordis – Flexible Jumper Replacement Disconnection, cutting, plugging, and removal of 8 off 5” Flexible Production & Water Injection
Jumper Ends Installation and tie-in of 8 off new 6” Flexible Production and Water Injection Jumpers Disconnection, cutting, plugging, and removal of 2 off Infield Umbilical Jumper Ends Installation and tie-in of 2 off new Infield Umbilical Jumpers RFO activities such as valve operations, leak monitoring, hatch operations, etc. Transport of Flexible Production & Water Injection Jumpers from Newcastle and Infield
Umbilicals from Moss. All engineering related to above work.
Cross section of Flexible Production & Water Injection Jumper
Proposed deck layout for Skandi Skolten
DOF Subsea – Projects
DOF Subsea 19
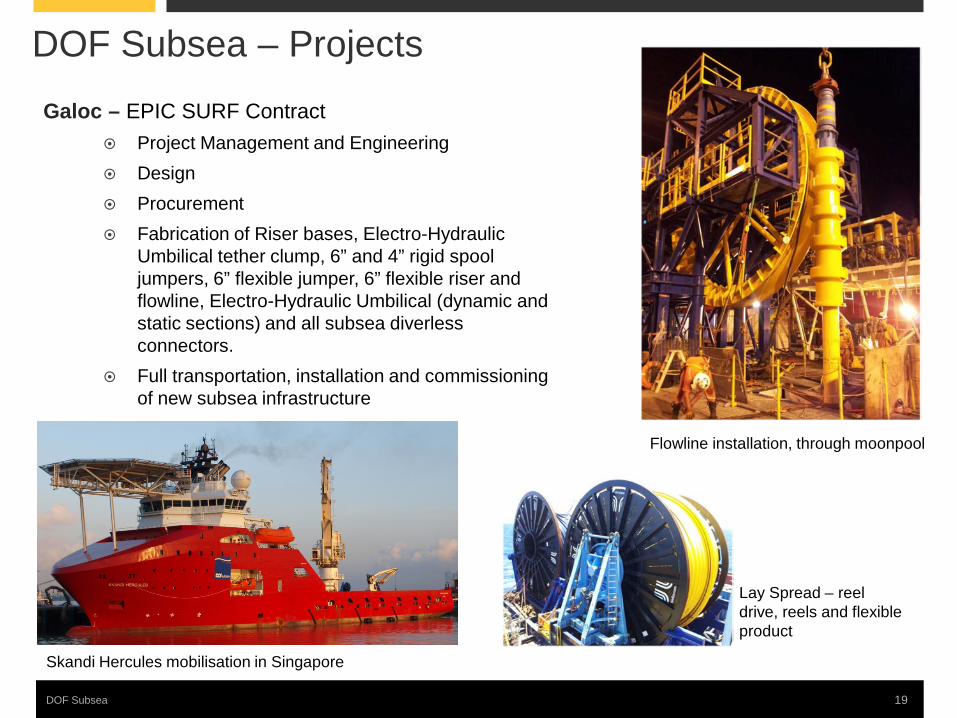
Galoc – EPIC SURF Contract Project Management and Engineering Design Procurement Fabrication of Riser bases, Electro-Hydraulic
Umbilical tether clump, 6” and 4” rigid spool jumpers, 6” flexible jumper, 6” flexible riser and flowline, Electro-Hydraulic Umbilical (dynamic and static sections) and all subsea diverless connectors.
Full transportation, installation and commissioning of new subsea infrastructure
Flowline installation, through moonpool
Skandi Hercules mobilisation in Singapore
Lay Spread – reel drive, reels and flexible product
DOF Subsea 20
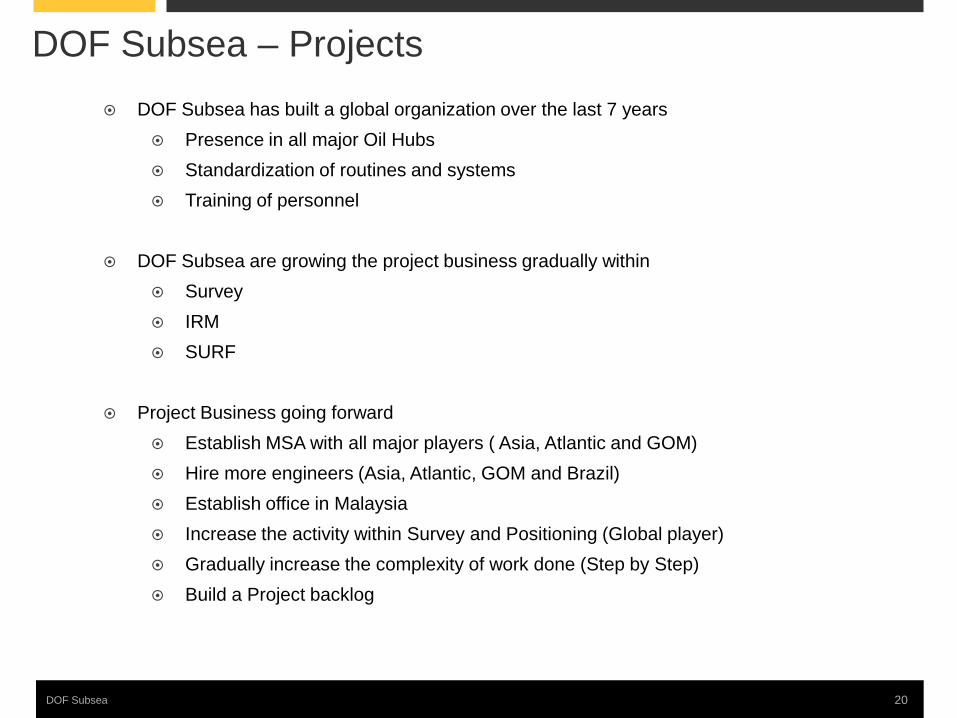
DOF Subsea – Projects DOF Subsea has built a global organization over the last 7 years
Presence in all major Oil Hubs Standardization of routines and systems Training of personnel
DOF Subsea are growing the project business gradually within Survey IRM SURF
Project Business going forward Establish MSA with all major players ( Asia, Atlantic and GOM) Hire more engineers (Asia, Atlantic, GOM and Brazil) Establish office in Malaysia Increase the activity within Survey and Positioning (Global player) Gradually increase the complexity of work done (Step by Step) Build a Project backlog

Contract status

DOF Subsea 22 DOF Subsea
Contract coverage (vessels)
FIRM CONTRACTS
UNDER CONSTRUCTION
OPTIONAL PERIOD
O N D J F M A M J J A S O N D J F M A M J J A S O N D J F M A M J J A S O N D J F M A M J J A S O N D
Geograph 1 1 1 1 1 1 1 1 1 1 1 1 1 1 1 1 1 1 1 1 1 1 1 1 1 1 1 1 1 1 1 1 1 1 1 1 1 1 1 1 1 1 2 2 2 2 2 2 2 2 2
Ocean Protector 1 1 1 1 1 1 1 1 1 1 1 1 1 1 1 1 1 1 1 1 1 1 1 1 2 2 2 2 2 2 2 2 2 2 2 2 2 2 2 2 2 2 2 2 2 2 2 2 0 0 0
Skandi Seven 1 1 1 1 1 1 1 1 1 1 1 1 1 1 1 1 1 1 2 2 2 2 2 2 2 2 2 2 2 2 2 2 2 2 2 2 2 2 2 2 2 2 2 2 2 2 2 2 2 2 2
Skandi Salvadore 1 1 1 1 1 1 1 1 1 1 1 1 0 0 0 0 0 0 0 0 0 0 0 0 0 0 0 0 0 0 0 0 0 0 0 0 0 0 0 0 0 0 0 0 0 0 0 0 0 0
Skandi Vitoria 1 1 1 1 1 1 1 1 1 1 1 1 1 2 2 2 2 2 2 2 2 2 2 2 2 2 2 2 2 2 2 2 2 2 2 2 2 2 2 2 2 2 2 2 2 2 2 2 2 2 2
Skandi Aker 1 1 1 1 1 1 1 1 1 1 1 1 1 1 1 1 1 1 1 1 1 1 1 1 1 1 1 1 2 2 2 2 2 2 2 2 2 2 2 2 2 2 2 2 2 2 2 2 2 2 2
Skandi Santos 1 1 1 1 1 1 1 1 1 1 1 1 1 1 1 1 1 1 1 1 1 1 1 1 1 1 1 1 2 2 2 2 2 2 2 2 2 2 2 2 2 2 2 2 2 2 2 2 2 2 2
Skandi Patagonia 1 1 1 1 1 1 1 1 1 1 1 1 1 1 1 1 1 1 1 1 1 1 1 1 1 1 1 1 1 1 1 1 1 1 1 1 1 1 1 1 1 1 1 1 1 1 1 1 1 1 1
Skandi Carla 1 1 1 1 1 1 1 1 1 1 1 1 1 1 1 1 1 1 1 1 1 1 1 1 1 1 1 1 1 1 1 1 1 1 1 1 1 1 1 1 1 1 1 1 1 1 1 1 1 1 1
Skandi Neptune 1 1 1 1 1 1 1 1 1 1 1 1 1 1 1 1 1 1 2 2 2 2 2 2 2 2 2 2 2 2 2 2 2 2 2 2 2 2 2 2 2 2 2 2 2 2 2 2 2 2 2
Skandi Achiever 1 1 1 1 1 1 1 1 1 1 1 1 1 1 1 1 1 1 1 1 1 1 1 1 1 1 1 1 1 1 1 1 1 1 1 2 2 2 2 2 2 2 2 2 2 2 2 2 2 2 2
Skandi Acergy 1 1 1 1 1 1 1 1 1 1 1 1 1 1 1 1 1 1 1 1 1 1 1 1 1 1 1 1 1 1 1 1 1 1 1 1 1 1 1 1 1 1 1 1 1 1 1 2 2 2 2
Skandi Arctic 1 1 1 1 1 1 1 1 1 1 1 1 1 1 1 1 1 1 1 1 1 1 1 1 1 1 1 1 1 1 1 1 1 1 1 1 1 1 1 1 1 1 1 1 1 1 1 1 1 1 1
Skandi Niteroi 1 1 1 1 1 1 1 1 1 1 1 1 1 1 1 1 1 1 1 1 1 1 1 1 1 1 1 1 1 1 1 1 1 1 1 1 2 2 2 2 2 2 2 2 2 2 2 2 2 2 2
Geosea 1 1 1 1 1 1 1 1 1 1 1 1 1 1 1 1 1 1 1 1 1 1 1 1 1 1 1 1 1 1 1 1 1 1 1 1 1 1 1 1 1 1 1 1 1 1 1 1 1 1 1
Skandi Skansen 1 1 1 1 1 1 1 1 1 2 2 2 2 0 0 0 0 0 1 1 1 2 2 2 2 0 0 0 0 0 1 1 1 2 2 2 2 0 0 0 0 0 2 2 2 2 2 2 0 0 0
Skandi Inspector 1 1 1 1 1 1 2 2 2 2 2 2 2 2 2 2 2 2 2 2 2 2 2 2 2 2 2 2 2 2 0 0 0 0 0 0 0 0 0 0 0 0 0 0 0 0 0 0 0 0 0
Sk Constructor 1 0 1 0 0 0 1 1 1 1 1 1 1 1 1 1 1 1 1 1 1 1 1 1 1 1 1 1 1 1 1 1 1 1 1 1 1 1 1 1 1 1 2 2 2 2 2 2 2 2 2
Skandi Singapore 1 1 1 1 1 1 1 0 0 0 0 0 0 0 0 0 0 0 0 0 0 0 0 0 0 0 0 0 0 0 0 0 0 0 0 0 0 0 0 0 0 0 0 0 0 0 0 0 0 0 0
Skandi Hercules 1 1 1 1 0 1 1 2 0 0 1 1
Skandi Skolten 1 1 1 1 1 1 0
Geobay 1 1 1 1
Geosund 1 1 1 1 2 1 1
Geoholm 1 0 1 1 1 1 1 1 1 1 1 1 1 2 1 1 1 1 2
Skandi Hawk 1 1 1 2 2 2 2 1 1
NB 776 3 3 3 3 3 3 2 2 2 2 2 2 2 2 2 2 2 2
2013 2014 2015 20162012Q1Q4 Q1 Q2 Q3 Q4Q3 Q4Q2Q1 Q2 Q3 Q4 Q1 Q2 Q3 Q4

DOF Subsea group has solid cash flow visibility over the next 3-5 years
By 30th September 2012 the total back-log (incl. options) was approx NOK 15 907 million Firm contract counts for NOK 7 680 million Options count for NOK 8 227 million
Note: Includes extension options on long-term contracts.
Backlog development DOF Subsea
DOF Subsea 23
* As per 30th September 2012.
15 907 14 717
11 585
9 408
7 479
5 699
4 224 3 026
-
2 000
4 000
6 000
8 000
10 000
12 000
14 000
16 000
18 000
2012 2013 2014 2015 2016 2017 2018 2019
NO
K m
illio
n
Financials
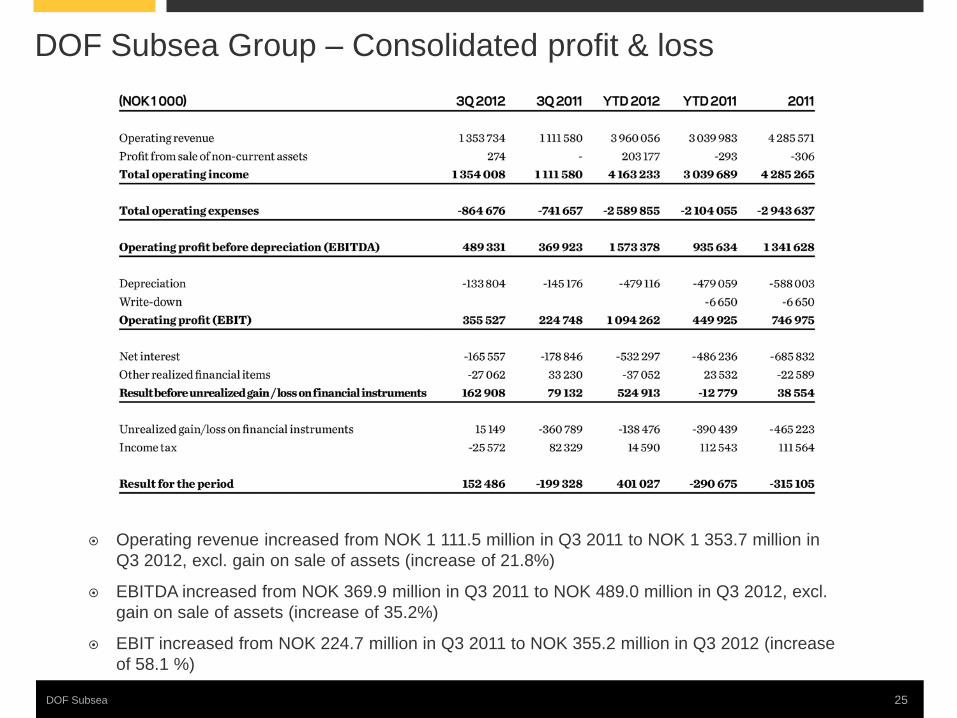
DOF Subsea Group – Consolidated profit & loss
Operating revenue increased from NOK 1 111.5 million in Q3 2011 to NOK 1 353.7 million in Q3 2012, excl. gain on sale of assets (increase of 21.8%)
EBITDA increased from NOK 369.9 million in Q3 2011 to NOK 489.0 million in Q3 2012, excl. gain on sale of assets (increase of 35.2%)
EBIT increased from NOK 224.7 million in Q3 2011 to NOK 355.2 million in Q3 2012 (increase of 58.1 %)
DOF Subsea 25

DOF Subsea Group – Consolidated balance sheet
YTD 2012 total fixed assets has decreased from NOK 16 409 million to NOK 16 056 million.
YTD 2012 cash and cash equivalents has decreased from NOK 1 362 million to NOK 1 288 million.
Total liabilities as per end of Q3 2012 of NOK 13 699 million.
Net interest bearing debt of NOK 10 956 million as per 30th September 2012.
Book Equity of NOK 5 060 million giving a ratio of 27.0 % to total assets as per 30th September 2012.
Value Adjusted Equity of NOK 7 673 million giving a ratio of 35.9 % as per 30th September 2012.
DOF Subsea 26

DOF Subsea 27
26.6 % CAGR
51.3 % CAGR
Quarterly Performance (excl. Asset Sales)
NOK million Q1 2009 Q2 2009 Q3 2009 Q4 2009 Q1 2010 Q2 2010 Q3 2010 Q4 2010 Q1 2011 Q2 2011 Q3 2011 Q4 2011 Q1 2012 Q2 2012 Q3 2012Operating revenue 593 735 743 754 730 944 851 1 080 900 1 028 1 152 1 246 1 223 1 384 1 354 EBITDA 115 215 234 171 186 306 282 320 241 325 370 406 411 470 489 EBITDA margin 19.4% 29.2% 31.4% 22.6% 25.4% 32.4% 33.2% 29.7% 26.8% 31.6% 32.1% 32.6% 33.6% 34.0% 36.1%
Current assets 2 194 2 492 2 380 2 670 2 467 2 919 3 192 3 366 2 829 3 003 2 938 2 923 2 782 2 962 2 704 Fixed assets 9 727 10 106 10 149 10 933 11 738 12 499 13 325 14 179 14 520 15 089 16 178 16 305 16 455 16 230 16 056
Total assets 11 922 12 598 12 530 13 603 14 205 15 418 16 517 17 545 17 349 18 092 19 117 19 228 19 238 19 192 18 760
Short term liability 2 240 1 618 1 286 1 489 2 035 2 496 2 942 2 167 2 311 2 458 2 640 2 637 2 543 2 495 2 260 Long term liability 6 236 7 251 7 383 8 279 8 350 8 867 9 109 10 154 9 946 10 542 11 694 11 759 11 723 11 735 11 439 Equity 3 418 3 728 3 860 3 833 3 819 4 054 4 466 5 224 5 091 5 092 4 782 4 832 4 970 4 963 5 061
0 %
5 %
10 %
15 %
20 %
25 %
30 %
35 %
40 %
-
200
400
600
800
1 000
1 200
1 400
1 600
Q1 2009
Q2 2009
Q3 2009
Q4 2009
Q1 2010
Q2 2010
Q3 2010
Q4 2010
Q1 2011
Q2 2011
Q3 2011
Q4 2011
Q1 2012
Q2 2012
Q3 2012
NO
K m
illio
n
Operating revenue EBITDA EBITDA margin

-
500
1 000
1 500
2 000
2 500
3 000
3 500
2012E 2013E 2014E 2015E 2016E 2017E After
Bond Loan Bank Debt Balloons
DOF Subsea AS – Debt maturity profile
• The figures reflects amortization and balloon payments on debt drawn as pr 30th September 2012
• Debt maturity profile excludes approx NOK 0.6 billion in payments to Eksportfinans which is serviced by corresponding amount of restricted cash.
• Events after balance date: sale of NOK 200 million of own holding in DOFSUB06 early November, outstanding NOK 700 million after transaction.
DO
FSU
B 0
4
DO
FSU
B06
DO
FSU
B05
DOFSUB04 - NOK 750 million - Maturity April 2014 - Net NOK 601 million
DOFSUB05 - NOK 750 million - Maturity April 2016
DOFSUB06 - NOK 700 million - Maturity Oct 2015 - Net NOK 500 million
DOF Subsea
Debt maturity profile DOF Subsea AS Level 2012E–2017E (NOK million)*
28

Stable asset values over the last year
Fair market values of DOF Subsea fleet have been stable in 2011 and increased by 2.3 % YTD 2012
All vessels are currently valued higher than the original capex
200
300
400
500
600
700
800
2002 2003 2004 2005 2006 2007 2008 2009 2010 2011 YTD 2012
NO
K m
illio
n
Skandi Seven Ocean Protector Geoholm Skandi Patagonia
Market value development
DOF Subsea 29
* As pr 30th September 2012

DOF Subsea Group – Asset coverage
Combined market value DOF Subsea’s fleet is NOK 16 447 million
Asset-level gearing on the existing fleet is 56%, decreasing to 43% in 2014
Provides a significant equity cushion on top of the existing vessel-level financing
Significant gearing reduction in the years to come
Gearing forecast – summary Total Fleet (NOK million) Market value
Vessels 16 447
Other Equipment (a) 1 304
Total Fleet 17 751
Note: Vessel values as pr 30th September 2012 (a) Includes ROVs, AUV, diving systems, other equipment
* The figure reflects amortization and balloon payments on debt drawn as pr 30th September 2012
DOF Subsea 30
0 %
20 %
40 %
60 %
80 %
100 %
2012E 2013E 2014E 2015E 2016E
56 % 50 % 43 % 30 % 21 %
44 % 50 % 57 % 70 % 79 %
Loan to value Market Value Cushion
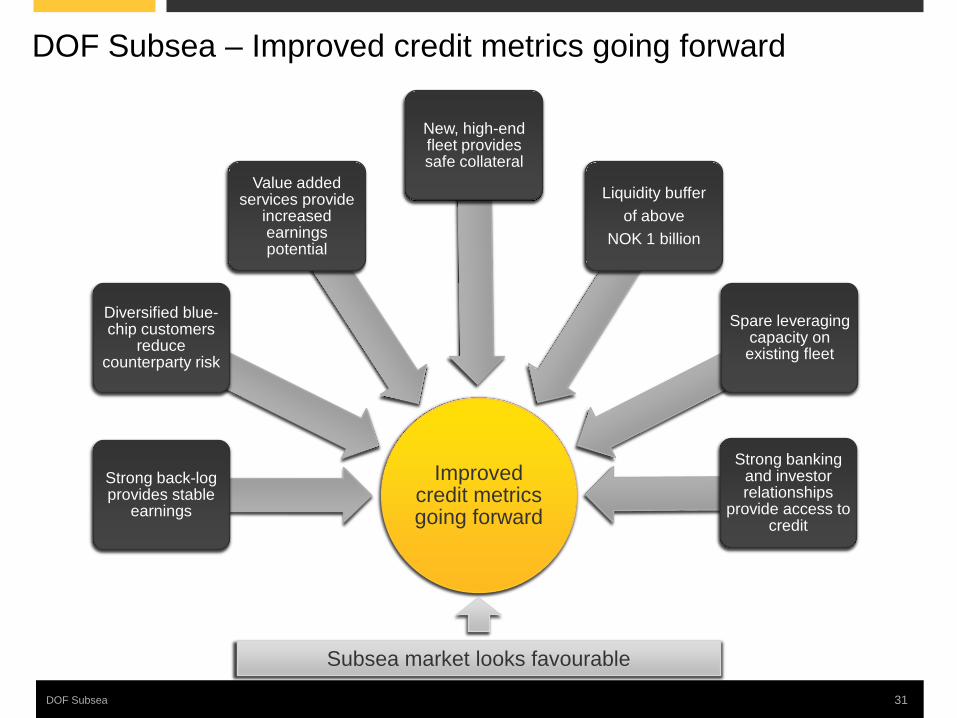
Improved credit metrics going forward
Strong back-log provides stable
earnings
Diversified blue-chip customers
reduce counterparty risk
Value added services provide
increased earnings potential
New, high-end fleet provides safe collateral
Strong banking and investor relationships
provide access to credit
Spare leveraging capacity on existing fleet
Liquidity buffer of above
NOK 1 billion
DOF Subsea – Improved credit metrics going forward
DOF Subsea 31
Subsea market looks favourable
Outlook

Outlook
Skandi Skansen
Healthy fundamentals for offshore activity Demand High oil price Increased E&P spending Increased deep water spending Increased infrastructure spending High tendering activity Strong growth expected in Brazil, North
Sea, Gulf of Mexico and Asia Pacific Increased focus on newer, larger and
more technologically advanced vessels DOF Subsea owns the world’s most
sophisticated fleet
33 DOF Subsea

Outlook
Skandi Skansen
Healthy fundamentals for offshore activity Supply Limited number of high-end newbuilds
20% of the total subsea fleet >25 years old
Improved market
conditions
Increased demand
Stable supply
34 DOF Subsea

Thank you
DOF Subsea
Appendix

NB 776 – to be delivered in May 2013
High end OSCV vessel ROV UHD62 & ROV HD05, rated for
3000/4000 m ROV and WORK Moonpool LOA: 120,8 m Beam: 22 m Deck area: 1100 m2 250 t Crane Suitable for Arctic operations, DNV
ICE-1B & DEICE notation Accommodation: 100 persons Helideck
DOF Subsea 37
All specifications are subject to changes without prior notice. Please contact us for details and verifications.
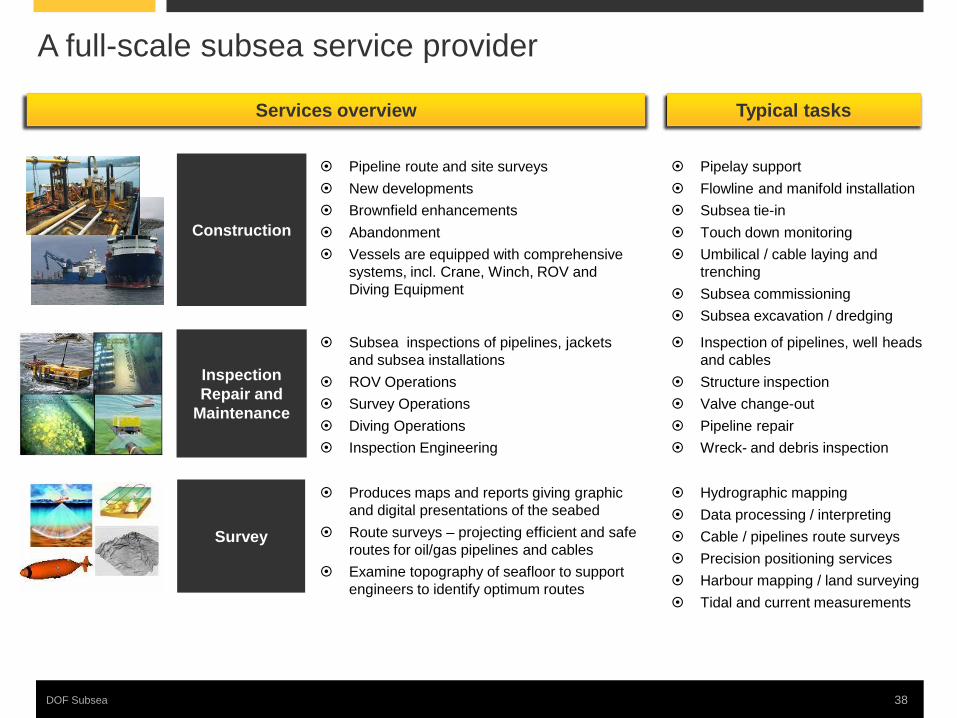
Produces maps and reports giving graphic and digital presentations of the seabed
Route surveys – projecting efficient and safe routes for oil/gas pipelines and cables
Examine topography of seafloor to support engineers to identify optimum routes
Hydrographic mapping Data processing / interpreting Cable / pipelines route surveys Precision positioning services Harbour mapping / land surveying Tidal and current measurements
Subsea inspections of pipelines, jackets and subsea installations
ROV Operations Survey Operations Diving Operations Inspection Engineering
Inspection of pipelines, well heads and cables
Structure inspection Valve change-out Pipeline repair Wreck- and debris inspection
Pipeline route and site surveys New developments Brownfield enhancements Abandonment Vessels are equipped with comprehensive
systems, incl. Crane, Winch, ROV and Diving Equipment
Pipelay support Flowline and manifold installation Subsea tie-in Touch down monitoring Umbilical / cable laying and
trenching Subsea commissioning Subsea excavation / dredging
Construction
Survey
Inspection Repair and
Maintenance
Services overview Typical tasks
A full-scale subsea service provider
38 DOF Subsea

Disclaimer This presentation by DOF Subsea AS (“DOF Subsea” or the “Company”) is designed to provide a high level overview of aspects of the operations of DOF Subsea and the DOF Subsea group. The material set out in the presentation is current as at 30th September 2012. This presentation contains forward looking statements relating to operations of DOF Subsea and the DOF Subsea Group that are based on management’s own current expectations, estimates and projections about matters relevant to DOF Subsea‘s future financial performance. Words such as “likely”, “aims”, “looking forward”, “potential”, “anticipates”, “expects”, “predicts”, “plans”, “targets”, “believes” and “estimates” and similar expressions are intended to identify forward looking statements. References in the presentation to assumptions, estimates and outcomes and forward looking statements about assumptions, estimates and outcomes, which are based on internal business data and external sources, are uncertain given the nature of the industry, business risks, and other factors. Also, they may be affected by internal and external factors that may have a material effect on future business performance and results. No assurance or guarantee is, or should be taken to be, given in relation to the future business performance or results of DOF Subsea or the DOF Subsea Group or the likelihood that the assumptions, estimates or outcomes will be achieved. While management has taken every effort to ensure the accuracy of the material in the presentation, the presentation is provided for information only. DOF Subsea, its officers and management exclude and disclaim any liability in respect of anything done in reliance on the presentation. All forward looking statements made in this presentation are based on information presently available to management and DOF Subsea assumes no obligation to update any forward looking statements. Nothing in this presentation constitutes investment advice and this presentation shall not constitute an offer to sell or the solicitation of any offer to buy any securities or otherwise engage in any investment activity.
DOF Subsea