Embed Size (px)
Citation preview

Financial Market Regulation,Imperfect Capital Markets,and Industrial Concentration:Mexico in ComparativePerspective, 1830-1930
Stephen Haber*
Abstract: This article argues that there is a strong relationship betweenthe efficiency with which a country mobilized capital for industrial development and the industrial structure that country developed. Differences incapital market development were a function of government regulatorypolicies and the costs of obtaining information. The analysis suggests thatthe development of financial institutions was not endogenous to the processof economic growth. In the case of Mexico, tight government regulatorypolicies coupled with high information costs gaye rise to highly imperfectcapital markets, which in turn were transmuted into imperfections inproduct markets.
Resumen: Este artículo demuestra que hay una fuerte relación entre laeficiencia de la movilización de capitales y la estructura industrial de unpaís. Las diferencias en el desarrollo de mercados de capitales eran resultado de las políticas regulatorias y los costos de información. El análisissugiere que el desarrollo de instituciones financieras no fue endógeno en elproceso de desarrollo económico. En lo que respecta a México, las regulaciones gubernamentales restrictivas, aunadas a los costos de informaciónsuperiores, dieron como resultado mercados de capitales sumamente imperfectos, que a su vez transmitieron imperfecciones en los mercados deproductos.
Michael Postan, the economic historian of the middle ages, onceremarked that the entire English industrial revolution of the
eighteenth and early nineteenth centuries could have been financedsingle-handedly by any one of Europe’s medieval millionaires. The
Social Science History Institute, Stanford University. Financial support for this researchwas generously provided by the Institutional Reform and the Informal Sector (irus) Center atthe University of Maryland, the Center for U.S.-Mexican Studies at the Universitv of California,San Diego, and the Social Science Research Council.
Economía Mexicana. Nueva Época, vol. VII, núm. 1, primer semestre de 1998 5
Stephen Haber Financial Market Regulation
problem of finance during the early stages of industrialization, asPostan correctly pointed out, was not one of the accumulation of capitalso much as the mobilization ofcapital — moving capital from the peoplewho had (and often hoarded) it to those who needed to borrow it forindustrial investment.
The problem posed by Postan — the effect of capital immobilitieson industrial development — has received considerable attention fromeconomic historians.’ Surprisingly, almost all of the empirical researchto date has focused on countries that had, by world standards, fairlywell developed capital markets. Little work has been done on therelationship between capital market integration and the degree ofindustry concentration in economies with truly imperfect capital markets, such as Mexico. Moreover, because of the absence of data, thestudies on developed economies have not developed cross-nationalestimates of industrial concentration that would allow researchers tomeasure systematically the impact of access to institutional sources ofcapital on the structure of industry. Researchers have largely relied onqualitative information or on data from the very recent past (almost allof it of post-1950 vintage) to make cross-national comparisons.2Thesefeatures of the available data (its recent vintage and its focus oneconomies with well developed capital markets) have made the testingof hypotheses about the long term relationship between the maturation of capital markets and the growth and structure of industryproblematic, if not impossible. Indeed, given the nature of the data, itis little wonder that the extant literature suggests that levels ofindustrial concentration do not vary significantly across economies.Smaller economies simply have smaller firms.
This paper proposes to move beyond the literature on the economies of Western Europe and the United States through an historicalanalysis of the impact of access to impersonal sources of capital on thedevelopment of the cotton textile manufacture during the early stagesof industrialization (1830-1930) in two less developed economies withdifferent histories of financial market regulation: Mexico and Brazil. Itcontrasts their experience with that of the United States during asimilar period in its industrial development.
1lnterest among economic historians began with the seminal articles by Lance Davis andAlexander Gerschenkron in the 1960s. See Davis, “Capital Markets”; Davis, “Capital Immobilities”; and Gerschenkron, Economic Backwardness, chap. 1.
2 See, for example, Davis, “Capital Markets,” p. 271; Pryor, “An International Comparison,” p. 136; Adelman, “Monopoly and Concentration,” p. 19; Bain, International Differences;Atack, “Firm Size and Industrial Structure,” p. 465.
1 focus on the cotton textile industry for two reasons. First, thecotton goods manufacture was the most important industry in the underdeveloped economies under study. It surpassed ah other industriesin terms of capital invested, size of the work force, or percentage ofvalue-added it contributed to total industrial output.3Second, there arecompelling theoretical reasons to focus on cotton textiles. In underdeveloped economies numerous factors, such as large economies ofscaleor technological barriers to entry, can condition the development ofmany industries. Separating the effects of access to impersonal sourcesof capital from among these other factors is difficult across the entireindustrial sector. In the cotton textile industry, however, these otherfactors did not come into play: the capital equipment was easilydivisible, the minimum efficient scale of production was small, andnon-financial barriers to entry were largely absent. The only importantbarrier to entry was access to finance. The textile industry thereforeprovides an excellent test case of the relationship between the development of the financial markets that provide capital to an industry,and the development of the industry itself.5
The cases selected for study were chosen in order to test thehypotheses that the regulatory environment has a profound effect onthe structure and size of financial markets, and that the structureand size of financial markets has a significant effect on the size andstructure of industry. 1 therefore searched for cases which had notablydifferent histories of financial market regulation.
The United States was chosen because it is the touchstone case: itwas an international leader in financial market development andindustrial growth during the period under study.6 Brazil and Mexicowere chosen because they were the most industrialized countries in
As Kuznets pointed out, textiles tend to be the first manufacturing industry to developas economies modernize. The countries under study here therefore conform to this generalpattern. See Kuznets, Economic Growth ofNations, pp. 111-113.
For a discussion of these other factors in Mexico see Haber, Industry and Underdevelopment, especially chapters 4, 5, 6.
This does not mean that scale economies were insignificant in cotton textile production.Indeed, had economies of scale been negligible, access to capital could not have served as a barrierto entry. It does mean, however, that scale economies were exhausted in textiles at relativelysmall firm sizes compared to such industries as steel, cement, and chemicais.
6 This is not to suggest that problems of capital mobilization did not exist in the UnitedStates. The market for industrial securities was regional in nature until the late nineteenthcentury. Similarly, banks tended not to make loans outside their region. It is to suggest, however,that capital mobilization problems were significantly less severe in the United States than inthe underdeveloped world and that the regulation of financial markets was far less repressivein the U.S. case than in the underdeveloped world.
6 7

Stephen Haber Financial Market Regulation
Latin America. More importantiy, these two cases provide a counterfactual test of the hypotheses central to this study. Throughout thenineteenth century, Mexico and Brazil both followed highiy repressiveregulatory policies. In 1889, however, Brazil drasticaily changed itsfinancial market regulations to a liberal, relativeiy non-repressiveenvironment, while Mexico held on to its oid repressive policies. Moreover, the costs of obtaining information were iowered in Brazil becauseits financial market regulations required ah publiciy heid joint stockcompanies to publish balance sheets and iists of shareholders two timeseach year. Brazil thus provides a relevant test for understanding theopportunity iost by Mexico when it faiied to enact iess repressivepoiicies and faiied to iower the costs of obtaining information.
The argument advanced runs in the foiiowing terms. The size andstructure of capital markets piayed a crucial role in determining thesize and structure of the textiie industry. In Mexico, where the bankingsystem was smail and concentrated, the distribution of bank loansamong potentiai textile industrialists was narrow. Differential accessto ioans from banks or from the informal network of large, Mexico Citymerchants, in turn, gaye rise to differential access to equity capital:entrepreneurs with the proven ability to obtain loans for workingcapital had a significant advantage over their competitors when it cameto sehhing equity in the securities markets. In short, a small group ofpowerful financiers was able to obtain all the capital they needed, whileeveryone else was starved for funds.
The results were two-fold. First, the textile industry was highlyconcentrated, because access to impersonal sources of capital served asa barrier to entry. Second, since the abihity to mobilize capital frombanks and the securities markets was a scarce talent, financial capitalists played an important role in the development of the cotton textileindustry.
In countries where the institutional rules of the game createdlarger and less concentrated capital markets, such as the United Statesor post-1889 Brazil, the distribution of funds among potential textileindustrialists was broader. Access to institutional sources of financedid not, therefore, serve as a barrier to entry, which in turn meant thatthe textile industry in those countries tended to be relatively lessconcentrated. Moreover, in these cases, industry tended to becomeincreasingly less concentrated over time. This was precisely the opposite outcome that obtained in countries where access to institutionalsources of capital served as a barrier to entry. In the Mexican case, for
example, differential access to capital created by the limited openingof the capital markets &uring the 1880s and 1890s actually gaye riseto an increase in concentration.
The persistence of capital market imperfections in countries likeMexico or pre-1889 Brazil can basically be tied to two factors. The firstwas the high costs of information and monitoring. In Mexico, the laxenforcement ofreporting requirements made it extraordinarily difficultto obtain information about the financial state of firms. Investorstherefore made investment decisions based on the personal reputationsof promoters. This meant that individuals with established reputations had a significant advantage over other potential industrialistsin raising capital.
The second factor in limiting the maturation of capital markets inMexico were repressive government regulatory policies. These includedrestrictions on the chartering of joint stock enterprises, complicatedprovisions for obtaining a bank charter, high minimum capital requirements for banks, and restrictions on bank operations. These repressivepolicies were enacted to favor small groups of pohitically weli connectedfinancial capitalists by giving their banks special rights and privileges.In return, their banks dedicated a significant part of their portfolios togovernment loans, providing a stable and secure source ofstate finance.The Mexican government was able to erect these kinds of barriers toentry into banking because Mexico had very different legal traditionsthan the United States. In fact, the legal tradition in Mexico wascharacterized by the official promotion of monopoiy, legal decision byfiat, and the centralization of political power.7
The argument developed in this paper runs counter to the dominant view of how financiah systems develop. According to that view,financial markets grow up more or less automaticaliy in response tothe growth in demand for financial services.8The argument advancedhere holds that the historical development of financial intermediariesis not flexible or automatic. In underdeveloped economies the demandfor finance may exceed the growth of institutions designed to mobihizecapital for considerable periods of time. Obviously, some capital market
These characteristics were exactly the opposite of those that prevailed in the UnitedStates, where the legal tradition of state’s rights and a distrust of monopoly gaye rise to a muchmore open banking structure. For a discussion of the U.S. case see: Smith and Sylla, “TheTransformation.”
8 For a more complete discussion see Patrick, “Financjal Development,” p. 175.
8 9

Stephen Haber Financial Market Regulation
development is endogenous, but government policies and the legaltradition have strong independent effects.
The first section of this paper compares the institutional historyof financial intermediaries and textile mili financing in the threecountries over the period 1830 to 1930. The second section thenassesses changes in the size and structure of each country’s textileindustry in light of their histories of industrial finance. The thirdsection concludes.
1. Capital Markets and Textile Finance
The United States
Unlike the vast majority of American manufacturing companies of thenineteenth century, which were organized as sole proprietorships orpartnerships, the large, verticaily integrated cotton textile producersof New England were organizel as publicly-held, joint stock corporations from their very beginnings in the 1820s. The market for thesesecurities was rudimentary during most of the century; the shares ofmost companies were very closely heid, and their often high par values(frequently $1 000) meant they couid not be bought by the typical smallinvestor. In addition, these companies appear to have been able to raisecapital on a regional scale only; out-of-state sharehoiders were so scarceas to be virtually nonexistent. Yet these stocks were deemed of investment quaiity, and their holders knew that a market, however circumscribed, did exist for their sale. As early as 1835, 14 textile issues weretraded on the Boston Stock Exchange. This grew to 32 by 1850 and to40 in 1865. This was not yet a well-developed securities market, but it didprovide for a wider distribution ofownership than more traditional formsofbusiness organization would have. Indeed, one ofthe striking aspects ofthe large, Massachusetts-type companies was the pattern of wideiydispersed ownership of shares among individuals and institutions.’°
As important as the sale of equity in the capitalization of the earlytextile milis was the ability of manufacturers, especially smaii and
mid-sized ones, to obtain Ioans from banks and other institutions. Thiskind of institutional 1eiding to manufacturers appears to have beenconfined to the northeast, which quickly developed a large bankingsystem. As early as 1819 New England had 84 banks with a capital of$16.5 million. By 1860 the region boasted 505 banks with $123.6 millionin capital.h1
The large number of bank loans to textile manufacturers is notsurprising when you consider that the owners of milis tended to be thesame people that owned the banks. New England’s banks, as NaomiLamoreaux has shown, were not the independent credit intermediariesof economic theory.’2Rather, they were the financial arms of kinshipgroups whose investments spread across a wide number of economicsectors and a wide number of enterprises. Basically, kinship groupstapped the local supply of investable funds by founding a bank andselling its equity to both individual and institutional investors. Thefounding kinship groups then lent those funds to the various enterprises under their control, including their own textiie milis. Insiderlending was the rule rather than the exception. Bank resources weretherefore monopolized by the families that founded them, leaving littleinthe way of credit for applicants outside of the kinship group.
Had legal restrictions been placed on the founding of banks, theseinsider arrangements would have concentrated capital in the hands ofa small number of kinship groups, which, in turn would have led toconcentration in textile manufacturing. The fact that entry into banking was essentially free, however, meant that it was difficult to restrictentry into the textile industry by controlling access to capital. The U.S.system did not provide for a completely equal distribution of investablefunds, but it did allow a large number of players to enter the game.
This regionally based capital market was gradually transformedinto a national capital market in the second half of the century, thanksto the passage of the National Banking Act, which created a networkof nationally chartered banks, and the widespread sale of governmentbonds to the public. The practical effects of these institutional developments were far-reaching. In the first place, the number of banksmushroomed throughout the second half of the century. Second, be-cause of a peculiarity of the Civil War banking iaws prohibiting nation
9For reasons of space, this discussion is brief. A book length work in progress by the authortreats the cases in considerably more detail.
° Davis, “Stock Ownership,” pp. 207-214; Martin, A Century ofFinance, pp. 126-13 1; andNavin and Sears, “Rise of a Market,” p. 110.
“ Davis, “New England Textile Milis,” pp. 2, 5; Davis, “Sources of Industrial Finance,”p. 192; and Lamoreaux, “Banks, Kinship, and Economic Development,” p. 651.
12 Lamoreaux, op. cit.
10 11

Stephen Haber Financial Market Regulation
ally chartered banks from making loans on the basis of real estatecollateral, national banks in rural areas of the country deposited theirfunds in the reserve city and central reserve city banks in urban areas.This not only directly increased the supply of funds for industrial loans,but also increased the supply of funds available for stock marketspeculation. Finally, the public’s experience with canal company, rail
road, and government securities slowly convinced small investors that
paper securities were “as secure an investment as a house, a farm, or
a factory.” By the end of World War 1 the textile industry was awash
in finance and many companies took advantage of the swollen creditmarkets to float numerous securities issues.’4
In short, it was not the case that ah American textile industrialists
had equal access to impersonal sources of capital. Indeed, one of theprimary reasons that the textile industry concentrated for so long in
New England was because of inter-regional capital immobilities. But
relative to the underdeveloped countries discussed below, large numbers of U.S. industrialists were able to tap into the capital marketsquite early in the country’s industrial history.
Mexico
Mexico’s experience stands in stark contrast to that of the UnitedStates. While Mexico began the transition to a mechanized textile in
dustry as early as the 1830s, it was not until the 1890s that the industryunderwent sustained growth. By this point, however, technologicalchanges had raised the cost of entry into textile manufacturing. Thus,unlike U.S. textile manufacturers, who were able to finance a significant part of their expansion and modernization through an extendedprocess of the reinvestment of profits, most Mexican textile firms had
to purchase their equipment ah at once, increasing the importance of
impersonal sources of capital.’5The institutions that could mobilize impersonal sources of capital,
however, were very poorly developed in Mexico. Even after an expan
sion of the banking sector and the stock market in the 1880s and 1890s,the vast majority ofmanufacturers were unable to utilize these avenuestc mobilize capital.
Institutional lending to industry was largely absent in Mexicountil the 1880s. As late as 1884 there were only eight banks inoperation, and as late as 1911 Mexico had but 47 banks, only 10 ofwhichwere legally able to lend for terms of more than a year.’6The few banksable to make long-term loans existed primarily to finance urban andrural real estate transactions; in fact, they had a great deal ofdifficultygenerating their own capital.’
Not only were there few banks, but the level ofconcentration withinthis small sector was very high. In 1895, three banks — the BancoInternacional Hipotecario, the Banco de Londres y México, and theBanco Nacional de México — accounted for two-thirds of the capitalinvested in the banking system. The first two banks issued 80% of thebank notes in circulation. Even as late as 1910 the same two banksdominated the credit market, accounting for 75% of the deposits inMexico’s fine largest banks and roughly one-half of ah bank notes in cir-culation.’8If anything, the years after 1910 saw an increase in concentration, as the Mexican Revolution in that year threw capital marketsinto disarray, destroyed the public’s faith in paper money, and put abrake on the development of the banking sector until the late 192Os.’9
The result of Mexico’s slow and unequal development of creditintermediaries was that most manufacturers could not obtain bankfinancing. Even those that could only succeeded in getting short-termloans to cover working capital costs. Thus, Mexico’s largest bank, theBanco Nacional de México provided credit to a number of large industrial establishments in which its directors had interests. These included five of the nation’s largest cotton textile producers, its largestwool textile mili, and the two firms that heid monopolies on theproduction of newsprint and explosives. Most of this capital went to asingle firm: the Compañía Industrial Manufacturera (cIMsA). But eventhese insider loans constituted a small part of the total capital of those
Davis, “Capital Imrnobilities,” p. 96; and Sylla, American Capital Market, pp. 12, 14,
26, 52, 209.14 Tmporary National Economic Committee, Investigation of Concentration, p. 255; and
Kenned, Profits and Losses, chaps. 2 and 10.For a discussion of the role played by retained earnings in the finance of the U.S. textile
industry, seo McGouldrick, The New England Textile Manufacture.
12
16 By 1910 the United States had sorne 25 000 commercial banks alone. This does notinclude the thousands of trust companies, savings banks, and savings and loan associations.
17 Marichal, “El nacimiento,” p. 251; Sánchez Martínez, “El sistema monetario,” pp. 60,76-77; Haber, Industry and Underdevelopment, p. 65.
18 Sánchez Martínez, “El sistema monetario,” pp. 81-82; and Marichal, “El nacimiento,”p. 258.
19 Cárdenas and Manns, “Inflación y estabilización.”
13
I1.LLIÁ..
Stephen Haber Financial Market Regulation
manufacturing firms. An analysis of the balance sheets of three of thecountry’s largest cotton textile producers during the period from 1907to 1913 indicates debt—equity ratios averaging 0.20:1.00. Virtually allof this debt was short term, most of it consisting of trade creditsprovided by suppliers.2°
Equity financing through the creation of a publicly-held, jointstock company was also unknown in the Mexican textile industry untilthe late 1880s. Even after the first industrial companies appearedon the Mexico City Stock Exchange, however, the use of the exchangeto raise equity capital remained limited. By 1908 only 14 industrialswere traded on the exchange: no new firms joined their ranks until thelate 1930s. Of those industrial companies only four were cotton manufacturers. Thus, of Mexico’s 100 cotton textile firms in 1912 (controlling148 milis), only 4% represented publiciy traded joint stock companies.21These four firms, however, took a disproportionate share of total capitalinvested in the industry, accounting for 27% of ah active spindles.
The reason that capital markets were so late in developing inMexico and then grew in such a limited way was iargely owing to fourfactors. The first was the fact that through much of the nineteenthcentury the Mexican government did not repay its debts to its bondholders. This delayed the widespread holding ofpaper securities by thepublic, and hence, the development of securities markets. Simply put,the Mexican public learned precisely the opposite lesson that U.S.government bondholders did: a piece of paper was not as secure aninvestment in Mexico as a house, farm, or bag of coins.22
The second factor was the politicized nature of defending propertyrights and enforcing contracts. Personal ties to members of the government were essential for entrepreneurs to obtain the rights to officialmonopolies, trade protection, government subsidies, or favorable judicial rulings. Indeed, it was almost impossible to do business withoutresorting to poiitical machinations.23Thus, only well-established finan-
20 Sánchez Martínez, “El sistema monetario”; Haber, Industiy and Underdevelopment,pp. 65-67.
21 The activity ofthe Mexico City Stock Exchange was followed by Mexico’s major financialweeklies: La Semana Mercantil, 1894-1914; El Economista Mexicano, 1896-1914; Boletín Financiero y Minero, 1916-1938. The behavior of the shares of these firms is analyzed in Haber,Industry and Underdevelopment, chap. 7. The total number of firms is from textile manuscriptcensuses in Archivo General de la Nación, Ramo de Trabajo, caja 5, legajo 4 (also see caja 31,legajo 2.
2 Marichal, “Obstacles.”23 Coatsworth, “Obstacles,” p. 98. For a discussion of the politicized nature of the legal
system see Walker, Business, Kinship, chaps. 1, 4-5, 7-8.
ciers with clear ties to the Díaz regime appear to have been successfulin floating equity issuesThe inclusion of important political actors onthe boards of the major joint stock industrial companies (including thebrother of the treasury secretary, the minister of war, the president ofcongress, the undersecretary of the treasury, and even the son of thepresident) suggests the importance of those ties to the investmentcommunity. Further cementing (and demonstrating) those ties was thefact that many of Mexico’s most successfui financial capitalists not onlyserved on various government commissions and represented the government in international financial markets, but also organized raihiesfor Porfirio Díaz’s (aiways successful) election campaigns.24
The third factor impeding the growth of capital markets was thebose enforcement of financial reporting requirements. In fact, publiclytraded manufacturing companies often failed to pubhish balance sheetsin public documents (such as the Diario Oficial or the financial press) inmany years, even though the law required them to do so. The resultwas that individuals tended to invest only in those enterprises controlled by important financial capitahists. In this sense, Mexico’s majorfinanciers piayed the same role as individuais like J.P. Morgan inthe financing of U.S. heavy industry. Their presence on the boards ofcompanies signaled the investment community that a particular enterprise was a safe bet.25 Two characteristics of theMexico City StockExchange are particularly striking in this regard. First, almost ah ofthe publicly traded industrials had well known, pohiticaily well connected financial capitalists hike Antonio Basagoiti, Hugo Scherer, orLeón Signoret as directors. Second, there was very little entry and exitin the stock exchange. It was not the case that smail firms tried to floatissues and failed, or that smaii firms succeeded in selhing equity andthen went out of business. Rather, the pattern was for a few large firmstobe capitahized through the sale ofequity. These firms then dominatedtheir respective product lines well into the 1920s and 19308.26
The fourth factor slowing the devebopment of impersonal sourcesof finance was Mexico’s regulatory environment. Throughout the early
24 For a discussion of the activities of these entrepreneurs see Haber, Indust,y andUnderdevelopment, chaps. 5, 6.
25 On the U.S. case see Davis, “Capital Immobilities”; De Long, “Did J.P. Morgan’s MenAdd Value?”
26 Examples can be found in the steel, beer, soap, dynamite, cigarette, wool textile, andpaper industries, in addition to cotton textiles. See Haber, Industry and Underdevelopment,chaps. 4, 5.
14 15

Stephen Haber Financial Market Regulation
and mid-nineteenth century, the lack of modern commercial and incorporation laws retarded the development of banks and joint stockcompanies. No body of mortgage credit laws was written until 1884,and it was not until 1889 that a general incorporation law was established. Thus, for most of the century it was extremely difficult to enforceloan contracts and establish joint stock companies.
Even when those laws were in place, however, new restrictivebanking regulations prevented the widespread development of creditinstitutions. The Mexican government favored the nation’s largestbank, the Banco Nacional de México, with ah kinds of special rightsand privileges. These included reserve requirements that were halfthat demanded of other banks, the sole right to serve as the government’s intermediary in all its financial transactions, a monopoly for itsnotes for the payment of taxes or other fees to the government, anexemption from taxes, and the sole right to establish branch banks. Atthe same time that the government created this privileged, semiofficialinstitution, it erected significant barriers to entry for competing banks,including extremely high minimum capital requirements (originally500 000 pesos, later raised to 1 000 000), high reserve requirements(banks were required to hold one-third the value of their bank notes inmetallic currency in their vults and an additional third in the treasury), a prohibition on creating new banks without the authorizationof the secretary of the treasury and the Congress, a prohibition onforeign branch banks from issuing bank notes, a 5% tax on the issueof bank notes, and the restriction of bank notes to the region in whichthe bank operated.27Making the situation even more problematic wasthe revision of these banking laws every few years. The result was alegal environment that was not only restrictive but arbitrary as well.
The motivation behind these restrictive banking policies wasessentially twofold. First, the Mexican government was more con-cerned about establishing a secure, stable source of finance for itselfthan it was in creating large numbers of institutions designed to funnelcredit to manufacturers. Second, the group of financiers that controlledthe Banco Nacional de México also happened to belong to the inner
27 When the first minimum was established in 1897, it was equal to $233 973 U.S. Theincrease in 1908 brought the minimum capital requirement up to $497 265, roughly five timesthe minimum for nationally chartered banks in the United States. For a discussion of thesevarious privileges and barriers to entry, as well as changes in banking Iaws, see SánchezMartínez, ‘El sistema,” pp. 43, 61-62, 67; Ludlow, “La construcción,” pp. 334-336; Bátiz V.,“Trayectoria de la banca,” pp. 286, 287, 293.
dique of the Díaz regime and had used their political influence to obtaina special concession thatrestricted market entry.
The tight regulation of banking had two important ramifications.The first was that the number of banks and the extent of theiroperations remained srnahl: industrial companies could not thereforegenerally rely on them as a source of finance. The second was that thecredit market could not serve as a source of finance for speculation onthe Stock Exchange as it had in the United States (and as it would inBrazil). This served to further impede the growth of the Mexico CityStock Exchange.
One might think that foreign capital would have made up for thelack of a well developed Mexican capital market. After ah, foreigninvestors were pumping billions ofdohlars into Mexican oil wells, mines,railroads, utilities, and export agriculture. There was in fact sorneforeign portfolio investment in Mexico’s cotton textile industry, but thephenomenon was not widespread. In any event, to the extent thatforeigners invested in the textile industry they invested in the large,well established firms that already had privileged access to the MexicoCity Stock Exchange, thereby reinforcing the problem of differentialaccess to capital. The reason for this lack of foreign investrnent intextiles was that manufacturing enterprises sold their output domestically, and thus earned their incomes in Mexican silver pesos. Silver,unfortunatehy, lost 50% of its value against gold during the period 1890to 1902, meaning that the rate of return in foreign, gold-backed currency, was halved once an investor converted his Mexican dividendpayments back into sterling, dollars, or francs. In fact, the one foreigncompany that speciahized in Mexican manufacturing investrnents, theSociété Financiére pour l’industrie au Mexique fared very poorly forprecisely this reason. Its franc-denominated rates of return were embarrassingly low, and its annuah reports read like an apologia to itsshareholders for the depreciation of the Mexican peso.28 It was largelyfor this reason that foreign investors tended to focus on enterprises inwhich incorne was earned in foreign, gold-backed currencies, hike oilextraction, mining, and export agriculture, or where the Mexicangovernment offered sizable subsidies, like railroading.
In short, throughout its first 100 years of existence, the Mexican
28 The annual reports of the Société Financiére pour l’industrie au Mexique can be foundin La Semana Mercantil, 8 Aug. 1903; El Economista Mexicano, 11 Oct. 1902,6 JuIy 1904,4 Aug.1904, 21 Oct. 1905, 18 Aug. 1906.
16 17
Brazil
Stephen Haber Financial Market Regulation
cotton textile industry had to rely on informal networks for its financing. When institutional innovations in the capital market created newopportunities for flrms to obtain impersonal sources of finance, only asmall group of entrepreneurs was able to benefit.
Until the last decade of the nineteenth century, Brazilian textileentrepreneurs faced a capital market similar to their Mexican counterparts. Beginning in the 1890s, however, Brazil’s capital markets,prompted by government regulatory reforms, underwent a long processof expansion and maturation. The result was that impersonalsources of finance became widely available to Brazilian textile manufacturers.
Throughout most of the nineteenth century, institutions designedto mobilize impersonal sources of capital were largely absent in Brazil.An organized stock exchange had functioned in Rio de Janeiro sinceearly in the century, but it was seldom used to finance industrialcompanies. During the period from 1850 to 1885 only one manufacturing company was usted on the exchange, and its shares traded handsin only 3 of those 36 years. Neither could Brazil’s mili owners appealto the banking system to provide them with capital. In fact, formalbanks were so scarce as to be virtually nonexistent. As late as 1888Brazil had but 26 banks, whose combined capital totaled only 145 000contos — roughly $48 million U.S. Only 7 of the country’s 20 states hadany banks at ah, and haif of ah deposits were heid by a few banks inRio de Janeiro.
The slow development of these institutions can be traced in largepart to public policies designed to restrict entry into banking. Theimperial government, which held the right to charter banks, wasprimarily concerned with creating a small number oflarge super-banksthat could serve as a source of government finance and that wouldprevent financial panics. The absence of banks not only restricted theamount of credit available to textile entrepreneurs, but it also meantthat banks could not underwrite securities trading or finance securities
speculation, the way they did in the United States and WesternEurope.3°Finally, restrictive policies discouraged the spread of thecorporate form of ownership: Founding ajoint stock company requiredspecial government permission; shareholder liability was not limited;investors were not allowed to purchase stocks on margin; and bankswere restricted from investing in corporate securities.3’
The last decade of the nineteenth century, however, witnessed adramatie and sustained transformation of Brazil’s capital markets. Inthe wake of the Revolution of 1889 that deposed the rnonarchy andestablished Brazil’s First Republic carne public policies that deregulated the banking industry and securities markets. These policies hadtwo goals: appease Brazil’s siave owning classes for the loss of theirsiaves in 1888 by increasing the supply of credit; speed Brazil’s transition from an agrarian economy run with siave labor to a modernindustrial and comrnercial econorny. As of 1889, legal barriers to entryinto banking were removed and banks could engage in whatever kindof financial transactions they wished. Other reforms eased the formation oflimited-liabilityjoint stock companies and encouraged securitiestrading by permitting purchases on margin. Finally, new industrialventures were exernpted from taxes and customs duties.
Also of importance were mandatory disclosure laws that mademanagers more accountabie to stockhoiders. Brazil’s publicly tradedcorporations were required to produce financial staternents twice a yearand reprint them in public documents (such as the Diario Oficial or theJornal do Commercio). In addition, their biannual reports had to listthe names of ah stockholders and the numbers of shares they controlled. Investors could thus obtain reasonably good information on thehealth of firrns and the identities of their major shareholders.32
For textile industrialists these reforms produced dramatic resu1ts.Over the short terrn, the Encilharnento, as the investrnent boom carne tobe called, created large nurnbers ofbanks, which both directly lent fundsto manufacturers as well as financed stock market specu1ation.’ Thesecond and more important effect of the Encilhamento was that it
29 Topik, Folitical Economy, p. 28; Peláez and Suzigan, História monetária, chaps. 2-5;
Saes, Crédito e bancos, p. 73; Levy, História da bolsa, pp. 109-112; Stein, The Brazilian Cotton
Textile Manufacture, pp. 25-27.
° Sylla, American Capital Market, pp. 52, 209.‘ Levy, História da bolsa, p. 117; Peláez and Suzigan, História monetária, pp. 78-83,
96-97; Saes, Crédito e bancos, pp. 22, 86.32 Shareholder lists were not pubhshed in the abbreviated reports reprinted in the Jornal
do Commercio or the Diario Ofuial, but they were published in the original armual reports.Topik, Folitical Economy, pp. 28-31; Peláez and Suzigan, História monetária, p. 143;
Stein, The Brazilian Cotton Textile Manufacture, p. 86; Crédito e bancos.34Levy, História da bolsa, pp. 117, 245.
18 19
Stephen Haber Financial Market Regulation
financed the creation of large numbers of joint stock manufacturingcompanies. In 1881 there were only two joint publically owned cottontextile enterprises; by 1898 there were 14, which grew to 25 in 1905, to66 in 1914, and to 94 by 1927. Thus, as early as 1914, 66 of Brazil’s 205cotton textile companies (32%) were publicly traded, limited liabilityjointstock corporations.35These firms with access to the equities marketsaccounted for 60% of ah invested capital in the mdustry. Recali that ata similar date in Mexico only 4% of cotton textile flrms were publiclytraded, and that these firms took up 27% of invested capital.
The Encilhamento also created a market for publicly traded corporate debt. This bond market, hike the market for stocks, was locatedin Rio de Janeiro and Sao Paulo and primarily served firms in thosestates.36 As early as 1905, 31 of Brazil’s 98 textile firms were raisingcapital through the sale of debt. By 1915, 50 of the country’s 174 firmsreported bond debt in their census returns. In fact, a comparison of the1905 and 1915 censuses indicates that new debt issues accounted for29% of all new investment during that ten year period (see table 1). Forthe large-scale, Rio de Janeiro and Distrito Federal firrns, which wereable to easily tap into the bond markets, new debt issues accounted for69% of ah new investment from 1905 to 1915. Thus, from 1905 to 1915,the average debt-equity ratio grew from 0.16:1.00 to 0.27:1.00 forBraziljan cotton textile firms as a whole and from 0. 14:1.00 to 0.43:1.00for firms in the Federal District and Rio de Janeiro.37 Recali thatMexico’s large, publicly traded, vertically integrated firms had debtequity ratio’s roughly half that of their Rio and Distrito Federalcounterparts, almost none of which was long term bond debt. In fact,ifwe were to include the types of trade credits from suppliers and othershort term loans that made up the liabilities of Mexican firms (theseare not enumerated in the Brazilian censuses), the differences betweenBrazil and Mexico would be even larger.
The development of the bond market appears to have been slowedby the First World War.Between 1915 and 1925, new long term bondissues accounted for only 4% of net new additions to invested capital.Thus, by 1925 debt-equity ratios feil to 0.13:1, less than halftheir 1915levels (see tables 1 and 2). The most important source of new investment capital was retained earnings, which accounted for 58% of newadditions to capital. The remainder of new capital spending was madeup of new equity issues by already established companies and thefounding of new firms, particularly in the state of Sao Paulo.38 Inthe latter part of the 1920s the debt market began to recover, thoughit appears that much of the debt issued was used to fund operatinglosses during the Great Depression. As table 2 indicates, the increasein debt almost exactly matches the contraction of retained earningsduring the period 1927 to 1934.
These patterns are mirrored by a micro-level analysis of 15 Rio deJaneiro and Distrito Federal firms that 1 have traced across the 1905,1915, 1925, and 1934 censuses (table 3). This study of same-firmfinancing controls for the possible effects of the entry and exit of firmsin the aggregate analysis. In these 15 large scale, publicly tradedfirms, new long term debt issues accounted for 29% of net new investment between 1905 and 1910, and 45% between 1910 and 1915. By1915, 11 of the 15 firms had gone to the bond market, producing anaverage debt-equity ratio of 0.57:1.00, up from 0.26:1.00 in 1905.Between 1915 and 1920, however, only 15% of these firms’ new additions to capital were financed by new bond debt. From 1920 to 1925,new debt issues accounted for none of the growth of these firms. Mostof their expansion was financed out of retained earnings. Thus, theiraverage debt-equity ratio feil to 0.35:1.00 in 1925, roughly 60% of its1915 level.3
Calculated from: Centro Industrial do Brasil, O Centro Industrial; Levy, História dabolsa, pp. 245, 385. The peak number of publicly traded textile firms was reached in 1922, when64 textile issues traded on the Rio exchange. By 1927 this had fallen to 52 firms, as the slowgrowth of the Brazilian economy in the early 1920s forced out weak firms.
36 Duringthe penod under study, Rio de Janeiro was Brazil’s capital. The Distrito Federalcomprised the area immediately around the city ofRio de Janeiro, much the way that the DistritoFederal endoses the city of México. Surrounding the Distrito Federal was the state of Rio deJaneiro.
The averages reported are weighted by the size of each firm’s total capital investment.These debt-equity ratios do not include short term bank debt or accounts payable, which wouldhave raised the ratios even higher. The censuses did not report these other sources of debt.Estimates of new investment and its sources computed from Vasco, A indu.stria; CentroIndustrial, O centro industrial.
38 Calculated from Vasco, A industria; Centro Industrial, O centro industrial; CentroIndustrial de Fiaçao e Tecelagem, Relatorio, 1924. All averages are weighted by the value ofcapital.
Calculated from Vasco, A industria; Centro Industrial, O centro industrial; CentroIndustrial de Fiaçéo e Tecelagem, Relatorio 1924; Centro Industrial de Fiaço e Tecelagem,Fiaçéo e Tecelagem. Ml averages are weighted by the value ofcapital. Rio de Janeiro and DistritoFederal firms were chosen for study because the county’s stock and bond markets were locatedthere. The firms are the Companhia Petropolitana, Companhia Magéense, Companhia Manufactora Fluminense, Companhia Corcovado, Companhia Brasil Industrial, Companhia Confiança Industrial, Companhia Corneta, Companhia Sao Pedro de Alcantara, Companhia Dona Izabel,Companhia Alliança, Companhia Progreso Industrial do Brasil, Companhia Industrial Campista, and the Companhia America Fabril.
20 21

Tab
le1.
Sou
rces
ofne
wca
pita
lfo
rB
razi
lian
cott
onte
xtil
efi
rms,
1905
-193
4(D
oes
not
incl
ude
shor
tte
rmde
bt)
Shar
eS
har
eof
Gro
wth
ofS
hare
ofne
wof
lon
gte
rmS
hare
ofne
wca
pit
alplu
sto
tal
capi
tal
pai
dca
pit
alde
btre
serv
esre
serv
esP
erio
dL
ocat
ion
Fir
ms
(%)
(%)
(%)
(%)
(%)
1905
-191
5M
IB
razi
l17
488
29.2
70.8
Fir
ms
loca
ted
inR
Jor
DF
3045
68.9
31.1
Fir
ms
loca
ted
inS
P43
272
14.4
85.6
Join
tS
tock
Fir
ms
inR
l25
5553
.646
.4
Join
tS
tock
Fir
ms
inS
P25
834
13.5
86.5
Join
tS
tock
Fir
ms
inot
her
Sta
tes
1220
831
.168
.9
Tot
alJo
int
Sto
ckF
irm
s62
135
29.1
70.9
Tot
alP
riv
ate
Fir
ms
112
3529
.870
.2
1915
-192
5M
lB
rasi
l18
913
737
.54.
258
.3
Fir
msl
oca
tedin
RJo
rDF
2811
836
.13.
560
.4
Fir
ms
loca
ted
inS
P53
244
39.2
6.9
53.9
Join
tS
tock
Fir
ms
inlI
d25
136
35.9
6.5
57.6
,Joi
ntS
tock
Fin
asin
SP
3327
037
.97.
055
.1
Join
tS
tock
Fir
ms
inot
her
Sta
tes
2010
933
.91.
165
.0
Tot
alJo
int
Sto
ckF
irm
s78
181
36.9
6.4
56.7
Tot
alP
riv
ate
Fin
as11
154
41.3
—10
.268
.9
1925
-193
4M
lB
razi
l24
419
80.3
64.7
—45
.1
Fir
ms
loca
ted
inM
or
DF
357
67.4
89.6
—56
.9
F’ir
ms
loca
ted
inS
P98
1312
7.1
147.
7—
174.
7
Join
tS
tock
Fin
asin
lId
252
18.2
243.
9—
162.
1
Join
tS
tock
Fir
ms
inS
P31
157
8.4
2215
.3—
2693
.7
Join
tS
tock
Fin
asin
oth
erS
tate
s25
102
65.9
26.5
7.6
Tot
alJo
int
Sto
ckF
irm
s81
984
.015
8.7
—14
2.7
Tot
alP
riv
ate
Fin
as16
356
78.3
12.2
9.5
Sou
rces
:E
stim
ated
from
:B
orja
Cas
tro,
“Rel
ator
io,”
pp.
3-73
;Com
mis
sáo
deIn
quer
ito
Ind
ust
rial
,Rel
ator
io;B
ran
ner
, Cot
ton
inth
eE
mpi
reof
Br’
azil;
Min
iste
rio
daIn
dust
ria
Via
çáo
eO
bras
Pub
lica
s,R
elat
orio
; Vas
co, “
Indust
ria
deA
lgod
áo;”
Cen
tro
Ind
ust
rial
doB
rasi
l,O
Bra
sil;
Cen
tro
Ind
ust
rial
doB
rasi
l,R
elat
orio
,19
15;
Cen
tro
Indust
rial
doB
rasi
l,O
Cen
tro
Indu
stri
al;
Cen
tro
Indust
rial
deF
iaçá
oe
Tec
elag
em,R
elat
oric
,19
24,
1925
,19
26;
Cen
tro
Indust
rial
deF
iaçá
oe
Tec
elag
emde
Alg
odáo
, Est
atís
ticas
daIn
dust
ria;
Cen
tro
Indust
rial
deF
iaçá
oe
Tec
elag
em, F
iaÇ
ÜO
eTe
cela
gem
;Ste
in,
Bra
zilia
riC
otto
n,A
ppen
dix
1.

Tab
le2.
Fin
anci
alst
ruct
ure
ofB
razi
lian
cott
onte
xti
lefi
rms,
1905
-193
4(D
oes
not
incl
ude
short
term
debt
)
(mil
lion
sof
curr
ent
mil
reis
)
Cap
ital
Pai
dL
ong
term
plu
sT
otal
Deb
teq
uity
Yea
rL
ocat
ion
Fir
ms
capi
tal
debt
Res
erve
sre
serv
esca
pita
lra
tio
1905
Ml
Bra
zil
9028
177
205
0.16
Fir
ms
loca
ted
inR
Jor
DF
1913
9310
60.
14
Fir
msl
ocate
din
SP
174
2428
0.16
Join
tS
tock
Fir
ms
inR
J17
1377
910.
17
Join
tS
tock
Fir
ms
inS
P3
46
100.
68
Join
tS
tock
Fir
ms
ino
ther
Sta
tes
47
80.
06
Tot
alJo
int
Sto
ckF
irm
s24
1890
108
0.20
Tot
alP
rivat
eF
irm
s66
1187
970.
12
Join
tS
tock
Fir
ms
as%
Bra
zil
62.8
%5
1.1%
52.7
%
1915
Ml
Bra
zil
174
264
8141
305
386
0.27
Fir
ms
loca
ted
inR
Jor
DF
3087
4621
108
154
0.43
Fir
msl
ocate
din
SP
4379
158
8810
30.
17
Join
tS
tock
Fir
ms
inR
J25
7940
2110
014
00.
40
Join
tS
tock
Fir
ms
inS
P25
6715
875
900.
20
Join
tS
tock
Fir
ms
ino
ther
Sta
tes
1217
62
1924
0.30
Tot
alJo
int
Sto
ckF
irm
s62
163
6031
194
255
0.31
Tot
alP
riv
ate
Fir
nis
112
101
219
111
131
0.19
Join
tS
tock
Fir
ms
as%
Bra
zil
61.6
%74
.5%
76.8
%63
.7%
65.9
%
1925
Ml
Bra
zil
189
463
103
350
813
916
0.13
Fin
ns
loca
ted
inR
Jor
DF
2815
252
131
284
336
0.18
Fir
ms
loca
ted
inS
P53
178
3214
332
135
30.
10Jo
int
Sto
ckF
irm
sin
RJ
2514
852
131
279
331
0.19
Join
tS
tock
Fir
ms
inS
P33
159
3214
230
033
20.
11Jo
intS
tock
Fir
msi
no
therS
tate
s20
266
1945
510.
13T
otal
Join
tS
tock
Fir
ms
7833
290
292
624
714
0.14
Tot
alP
riv
ate
Fir
ms
111
130
1458
188
202
0.07
Join
tS
tock
Fir
ms
as%
Bra
zil
71.8
%86
.9%
83.4
%76
.8%
78.0
%
1
1934
Ml
Bra
zil
244
605
218
271
875
1093
0.25
Fir
ms
loca
ted
inR
Jor
DF
3516
873
118
286
359
0.25
Fir
ms
loca
ted
inS
P98
235
9865
300
398
0.33
Join
tSto
ckF
irm
sjnR
J25
149
7311
826
734
00.
27Jo
int
Sto
ckF
irin
sin
SP
3117
698
6123
733
50.
42Jo
int
Sto
ckF
irrn
sin
oth
erS
tate
s25
6020
2384
103
0.24
Tot
alJo
int
Sto
ckF
irm
s81
385
191
202
587
778
0.32
Tot
alP
riv
ate
Fir
ms
163
219
2769
288
315
0.10
Join
tS
tock
Fir
ms
as%
Bra
zil
63.7
%87
.4%
74.5
%67
.1%
71.1
%
Sou
rce:
Sam
eas
table
1.

Tab
le3.
Deb
teq
uit
yra
tio
san
dso
urce
sof
new
capit
alfo
r15
-fir
msa
mpl
e,18
95-1
940
(Est
imat
edfr
om
bal
ance
shee
ts,
incl
udes
short
-ter
md
ebt)
Lia
bili
ties
Com
posi
tede
bteq
uity
rati
osP
anel
1(m
illi
ons
ofm
ilre
is)
(Wei
ghte
dby
tota
lli
abil
itie
s)
Ret
aine
dP
aid
Bon
dd.
ebt/
earn
ings
/ca
pita
l/P
aid
Ret
aine
dS
hort
term
Tot
alD
ebt
Sho
rtde
bt+
debt
+de
bt+
Yea
rca
pit
alea
rnin
gsde
btB
ond
debt
liab
ilit
ies
equi
tyra
tio
term
/deb
teq
uity
equi
tyeq
uity
1895
101
25
190.
680.
290.
290.
060.
53
1900
5316
919
960.
390.
310.
190.
160.
55
1905
6130
716
115
0.26
0.31
0.14
0.26
0.53
1910
7628
1926
149
0.43
0.42
0.18
0.19
0.51
1915
8130
2638
175
0.57
0.41
0.22
0.17
0.46
1920
115
4321
4522
40.
410.
320.
200.
190.
51
1925
145
118
5439
357
0.35
0.58
0.11
0.33
0.41
1930
137
100
6578
380
0.60
0.45
0.21
0.26
0.36
1935
135
124
6664
389
0.50
0.51
0.17
0.32
0.35
1940
145
143
7446
409
0.42
0.62
0.11
0.35
0.36
Sou
rces
of n
ewca
pita
l(W
eigh
ted
byto
tal
liab
ilit
ies)
Shar
eof
Shar
eof
Shar
eof
Gro
wth
ofsh
ort-
term
Shar
eof
reta
ined
pai
dP
erio
dde
bt-i
-equ
ityde
btbo
ndde
btea
rnin
gsca
pit
al
1895
-190
041
0.8%
8.1%
17.1
%18
.9%
55.9
%
1900
-190
519
.3%
—6.
2%—
13.0
%77
.5%
41.8
%
1905
-191
030
.3%
33.2
%28
.8%
—5.
0%43
.0%
1910
-191
516
.9%
28.8
%45
.2%
5.9%
20.1
%
1915
-192
028
.1%
—11
.3%
14.8
%27
.5%
69.0
%
1920
-192
559
.4%
25.1
%—
4.2%
56.3
%22
.8%
1925
-193
06.
5%46
.1%
170.
1%—
78.8
%—
37.3
%
1930
-193
52.
5%13
.5%
—14
5.2%
251.
0%—
19.3
%
1935
-194
04.
9%41
.3%
—96
.0%
100.
9%53
.8%
1
Pan
el11
1
Sou
rce:
See
note
39in
the
text
.
Stephea Haber Financial Market Regulation
249 561a
277 784
370 570
411 090
430 868
588 474
591 506
595 728
632 601
635 940
678 058
688217
613 548
732 876
726 278
702 874
725 297
762 149
752 804
14 87545 830
84 956
78 908
In short, Brazilian textile industrialists were limited in their
sources of finance throughout most of the nineteenth century. Begin
ning in the late 1880s, however, regulatory reforms brought about
important innovations in financial intermediation that made access to
institutional sources of finance relatively easy for many entrepreneurs.
Even though the development of these new sources of finance was
slowed by the First World War, it still produced an extraordinar’ily large
and well integrated capital market by the standards of developing
economies at the time.
USA
323 176
285 524
886 098
10653435
2 145 646
II. Finance and the Structure and Growth
of the Textile Industry
What effects did these differences in the development of capital have
on the development of the textile industry in the countries under study?
One would expect at Ieast three. First, Mexico’s textile industry should
have grown much more slowly than that of Brazil. Second, privileged
access to capital should have served as a barrier to entry: capital
immobilities should have resulted in high levels of industrial concen
tration. Industry should have been most concentrated in Mexico and
least concentrated in the United States, with Brazil falling between the
two. Third, we would expect different trajectories of concentration.
Concentration should have fallen the fastest in Brazil, after the opening
of its capital markets in the 1890s, and most slowly in Mexico.
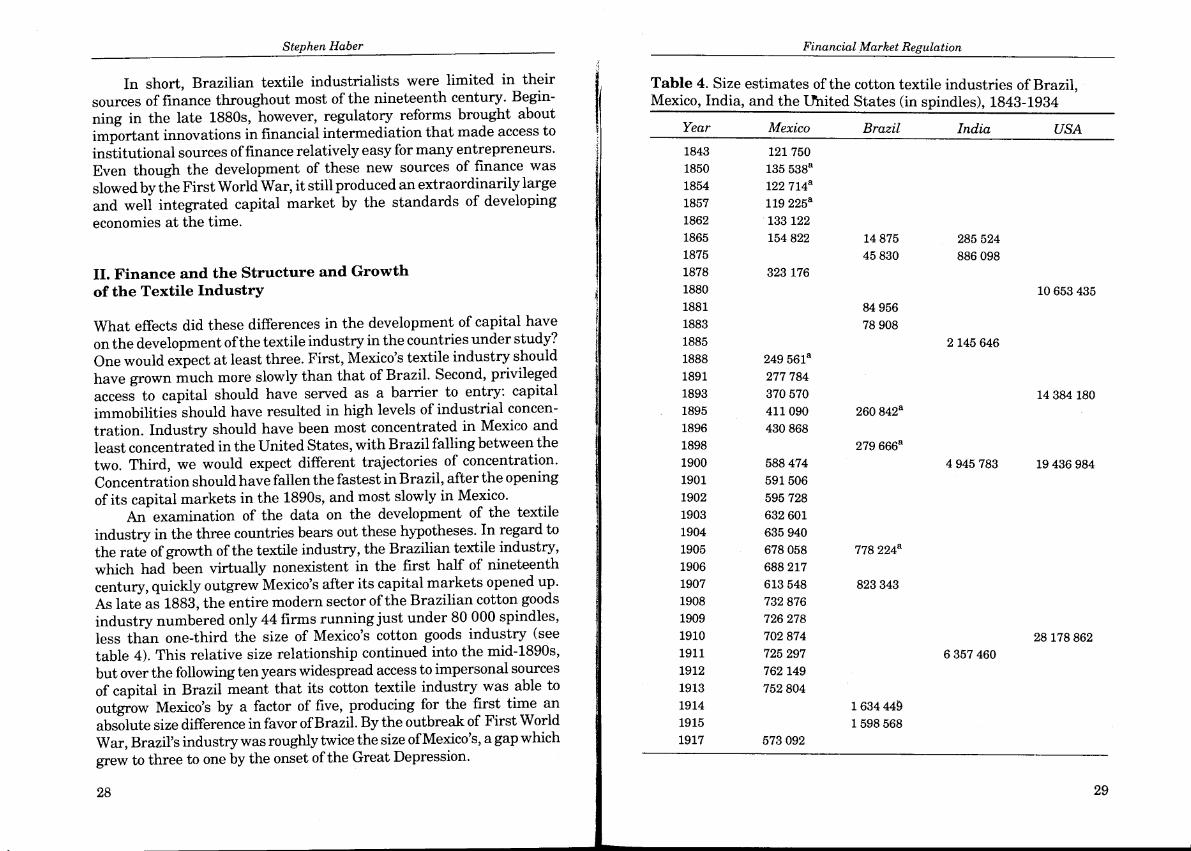
An examination of the data on the development of the textile
industry in the three countries bears out these hypotheses. In regard to
the rate of growth of the textile industry, the Brazilian textile industry,
which had been virtually nonexistent in the first half of nineteenth
century, quickly outgrew Mexico’s after its capital markets opened up.
As late as 1883, the entire modern sector of the Brazilian cotton goods
industry numbered only 44 firms runningjust under 80 000 spindles,
less than one-third the size of Mexico’s cotton goods industry (see
table 4). This relative size relationship continued into the mid-1890s,
but over the following ten years widespread access to impersonal sources
of capital in Brazil meant that its cotton textile industry was able to
outgrow Mexico’s by a factor of five, producing for the first time an
absolute size difference in favor ofBrazil. By the outbreak of First World
War, Brazil’s industry was roughly twice the size ofMexico’s, a gap which
grew to three to one by the onset of the Great Depression.
Table 4. Size estimates of the cotton textile industries of Brazil,Mexico, India, and the [Ínited States (in spindles), 1843-1934
Year Mexico Brazil India
1843 121 750
1850 135 538a
1854 122 714a
1857 119 225a
1862 133 122
1865 154 8221875
1878
1880
1881
1883
1885
1888
1891
1893
1895
1896
1898
1900
1901
1902
1903
1904
1905
1906
1907
1908
1909
1910
1911
1912
1913
1914
1915
1917
260 842a14 384 180
279 666a
4 945 783 19436 984
778 224a
823 343
6 357 460
28 178 862
1 634 441 598 568
573 092
28 29

Stephen Haber Financial Market Regulation
Table 4 (continue)
Year Mexico Brazil India USA
1918 689 173
1919 735308
1920 753837 6763036 34603471
1921 770945 1621 300a
1922 803 230
1923 802363 1700 000a
1924 812165 2200612
1925 840 890 2 397 380
1926 832 193 2 558 433
1927 821211 2692077
1928 823 862
1929 839 100
1930 803 873 9 124 768 33 009 323
1931 838223
1932 851 163
1933 862 303
1934 2 507 126
Sources:Mexico: Razo and Haber, “The Rate of Growth of Productivity in Mexico.”India: Reports of the Bombay Millowner’s Association, 1900, 1911, 1920, 1930.USA: Haber, “Industrial Concentration and the Capital Markets.”
Brazil: Boija Castro, “Relatorio,” pp. 3-73.Commissáo (para) Exposiçáo Universal (em) Philadelphia, The Empire of Brazil,
pp. 285-287 and statistical tables.Commisso de Inquerito Nacional, Relatorio, p. 15.Branner, Cotton in the Empire ofBrazil.Consul Ricketts, Report, C4657, lxv(1886), pp. 187-188, as cited by Stein, The BrazilianCotton, Appendix 1.Dos Santos Pires, Relato,-io, pp. 24-25.De Carvalho, “0 Cafe.” Also, De Carvalho, “O AlgodAo.”Cunha Vasco, “Industria do algodAo.”Censo Industrial do Brasil, “Industria de Transportes.”Graham Clark, “Cotton Goods;” Cunha Vasco, “Fabrica de FiacAo;” Bandeira Junior,“Industria no Estado de SAo Paulo.»Centro Industrial do Brasil, Relatorio, 1915.Centro Industrial do Brasil, Centro na Conferencia Algodeira.Centro Industrial de FiaçAo e Tecelagem de Algodáo, Relatorio, 1921-1922, 1923, 1924,1925, 1927.CIFrA, Fabricas Filiadas.CIFrA, FiaçAo e Tecelagem.a Estimate based on particial census information.
30
4 1 --
This is not to argue that access to capital was the only factorinfluencing the rate of growth of the textile industry. There werenumerous other constraints to the development of industry.° The datasuggest, however, that problems of capital mobilization played animportant role in the slow development of industry in both countriesduring the nineteenth century. First, the fact that the textile industries in both Mexico and Brazil underwent a spurt of growth afterimpersonal sources of finance became available indicates that theirlack was a constraint prior to that. Second, the fact that Brazil’s textileindustry rapidly outgrew Mexican industry after its capital marketsopened up suggests an important role for impersonal sources of financein a country’s rate of industrial growth.
One might argue that capital immobilities had little to do with therate of growth of the textile industry: Demand factors were far moreimportant in influencing industry growth. Mexico’s industry wassmaller and grew less quickly than that of Brazil because it hada smaller, poorer population. A comparison of Brazil and Mexico mdicates, however, that demand factors cannot explain differences inobserved industry size. True, Brazil’s population, which was roughlyequal to that of Mexico in the early 1870s (9.9 million and 9.1 million,respectively) grew at almost twice Mexico’s rate up to 1910 because ofBrazil’s policy of subsidizing European immigration. Mexican nationalincome, however, outgrew Brazilian national income at a similar rateduring this same period. Circa 1877, Mexican national income was only55% that of Brazil. By 1910 it was within 6% of Brazil’s. More importantly, Mexican income per capita outgrew that of Brazil by a factor of10. In 1877, Mexican per capita income was 75% that of Brazil. By 1910Mexican per capita income was 40% higher than Brazil’s.4’Given thatthe income elasticity ofdemand for textiles was very high, Mexico likelyhad a much higher per capita demand for textile products than thedifferences in per capita income would indicate.42 In short, it is hard toreconcile a demand side story with Brazil’s lower absolute levels of per
40 For a discussion of these constraints in Mexico see Haber, Industry and Underdevelopment, chaps. 3-5; for a discussion of the Brazilian case see: Stein, Brazilian Cotton TextileManufacture; Suzigan, Industria Brasileira.
41 National income data from Coatsworth, “Obstacles,” p. 82. Population data fromInstituto Nacional de Estadística, Geografía, e Informática, Estadísticas, p. 9; Instituto Brasileiro de Geografia e Estatística, Estatísticas, p. 33.
42 Contemporary observers noted this high income elasticity of demand for textileproducts. Their observations can be found in Haber, Industry and Underdeuelopment, pp. 28-29.
31

Stephen Haber Financial Market Regulation
capita income and lower rates of growth of both per capita and national
income.43As for the effects of capital immobilities on industrial concentra
tion, the data are unequivocal: access to capital had a significant effect
on the level of concentration. Table 5 presents estimates of four-firm
concentration ratios (the percent of the market controlled by the four
largest firms) and Herfindahi indices (the sum of the squares of the
market shares of ah firms in an industry) for Mexico, Brazil, India, and
the United States.44There are a number of striking features ofthe data.
The first is the low, and continually declining, level of concentra
tion in the United States. The average four-firm ratio during the period
1850-1930 was 0.089. The trend over time was for concentration to
decline at 0.5% per year. From 1860 to 1920, the four-firm ratio dropped
from 0.126 to 0.066. The Great Depression temporarily reversed the
trend, the result of several merger attempts designed to bring the in
dustry’s excess capacity under control and end a period of cutthroat
competition. Within a few years, however, most of those mergers had
failed. Post-1930 evidence indicates that concentration had returned to
its 1920 level by 1937. This is precisely the kind of pattern that would
be expected in a rapidly growing industry characterized by constant
returns to scale technology and insignificant barriers to entry.
The second is that the opening of Mexico’s capital markets actually
produced an increase in concentration. The trend in Mexico from the
1840s to the early 1880s was a gradual decrease in concentration:
exactly the trend that one would expect in an expanding industry
characterized by constant returns to scale technology. As table 6
Table 5. Indices of concentration in the cotton textile industriesof Brazil, Mexico, India,nd the United States, 1840-1934
Four firm ratio Herfindahi index
Year México India Brazil Mexico India
1840 0.579 0.1141843 0.346 0.0431844 0.344 0.0541845 0.292 0.0381850 0.270 0.0401854 0.318 0.0401857 0.32 1 0.0401860
1862
1865
1866
1870
1875
1878
1880
1882
1883
18881889
1891
1893
1895
1896
1898
1900
1902
1904
1905
1906
1907
1909
1910
1911
1912
1913
1914
19150.154
0.157
0.190
0.190
0.015
0.016
0.018
0.018
Brazil
0.729
0.756
0.509
0.483
0.215
0.217
0.273
0.278
0.168
0.158
0.174
0.180
0.1880.200
0.371
0.297
0.394
0.316
0.381
0.328
0.315
0.338
0.337
0.255
0.328
0.286
0.298
0.384
0.348
USA
0.100
0.126
0.107
0.087
0.077
0.070
0.075
0.167
0.238
0.115
0.099
0.027
0.027
0.041
0.029
0.021
0.019
0.0210.022
0.023
0.022
0.040
0.039
0.055
0.036
0.063
0.041
0.041
0.048
0.047
0.028
0.049
0.036
0.069
0.055
0.043
Accounting for imports would not overturn these results. Both countries were highiy
protectionist, with tariffs oflen equal to 300% of the value of goods abroad. Imports by 1910
therefore accounted for only 20 of consumption. This was almost entirely high value, fine weave
goods.These estimates of concentration are ah calculated at the firm level. For the U.S.,
Mexican, and Brazihian data, this invoived combining the market shares of ah milis heid by a
single corporation, partnership, or sole proprietor. Market shares for Mexico and Brazil were
calculated from estimates of the actual sales or value of output of milis. Market shares for the
United States had to be estimated from information on installed spindles. Econometric work on
the United States indicates that there was a 25% difference in output per spindle between
average and best practice techniques. 1 therefore assumed that the iargest firms in the United
States were 25% more productive than the average, and adjusted their market shares upwards
accordingly. Qn average and best practice techniques see Davis and Stettler, “The New England
Textile Industry,” p. 231.Temporary National Economic Committee, Investigation of Concentration, pp. 253-254;
Reynolds, “Cut Throat Competition,” pp. 740-742; Kennedy, Profits and Losses, chaps. 2-6;
Wright, “Cheap Labor,” p. 106.
32 33

Stephen Haber Financial Market Regulation
Table 5 (continue)
Four firm ratio Herfindahi index
Year Brazil México India USA Brazil Mexico India
1916 0.297 0.042
1917 0.385 0.059
1918 0.330 0.047
1919 0.375 0.059
1920 0.286 0.206 0.066 0.036
1924 0.233 0.331 0.028 0.043
1925 0.237 0.297 0.027 0.038
1926 0.209 0.023
1927 0.195 0.022
1929 0.281 0.034
1930 0.189 0.095
1932 0.256 0.029
1934 0.176 0.017
Sources:Brazil: Table 4.Mexico: sncp, Estudio de la industrialización.
Barau Martínez, «Estadísticas económicas,” table 13; SHCP, Estudio de la industriali
zación.SHCP, Estudio de la industrialización.Barjau Martínez, “Estadísticas económicas,” tables 17-21.
Secretaría de Fomento, Colonización e Industria, Memoria 1852.
Gobierno del Estado de México, Departamento de México.
Secretaría del Estado, Memoria de la Secretaría del Estado.
Pérez Hernández, Estadística de la República Mexicana.
Ministerio de Fomento, Memoria 1865.García Cubas, Cuadro geográfico.Secretaría de Fomento, Boletín semestral.García Cubas, Mexico Trade.Dirección General de Estadística, Anuario estadístico, 1893-1894.
Secretaría de Hacienda, Memoria.Estadística de la república mexicana.
Semana mercantil.Archivo General de la Nación, “Extracto de hilados y tejidos, 1912.”
“Extracto de hilados y tejidos, 1913.”El Economista Mexicano.SHCP, Boletín.
India: See table 4.USA: See table 4.
a Concentration by estimated capacity, measured at the firm level. A detailed discussion
of the estimation procedures is available from the author.
34
indicates, Mexico’s four-firm ratio feli from a high of 0.579 in 1840 to alow of0.158 in 1883, whi1 the Herfindahi dropped from a 0.114 to 0.019over the same period. Beginning in the 1880s, the trend reversed, eventhough the industry was witnessing rapid growth. By 1902, both thefour-firm ratio and the Herfindahi had surpassed their 1843 leveis,standing at 0.381 and 0.063, respectively. Concentration then began todecrease again to 1912, when the Revolution interceded and againreversed the trend.
The final striking feature of the data is that it indicates that themore profound opening of Brazil’s capital markets produced exactlythe opposite result than that obtained in Mexico.46Compared to Mexico,Brazil’s textile industry was surprisingly unconcentrated, and becameincreasingly less so over time. Prior to the 1890s, Brazil’s relativelysmall textile industry displayed higher levels of concentration, asmeasured by the four-firm ratio, than Mexico’s. By 1905, however,relatively widespread access to institutional sources of capital droveBrazil’s four-firm ratio down to two-thirds of Mexico’s, a ratio that wasthen maintained through the 1930s. The drop in the Herfindahi Indexwas even more pronounced. During the period 1875-1878, the Herfindahi Index for Brazil was more than ten times that of Mexico. By1905-1906, Brazil’s Herfindahl was 34% lower than Mexico’s, and by1912-1914 it was 69% lower.
One might argue that Mexico’s higher concentration ratios hadlittle to do with capital immobilities: High leveis of concentration wereproduced by demand, not supply factors. Mexico had higher levels ofconcentration and a different trajectory ofconcentration because it hada smaller textile industry than Brazil or the United States. There arefour problems with this une of argument.
The first is that this argument assumes that there is a direct linkbetween industry size and industry structure: The larger a country’sindustry, the less concentrated it should be. In order to test this notion,1 estimated four firm concentration ratios and Herfindahl indices forthe Indian cotton textile industry. Since India’s industry was roughlythree times the size of Brazil’s we should observe a lower level ofconcentration there. In fact, India’s average level of concentration
46 One might argue that these differences in concentration would disappear if importa offoreign textiles were accounted for, but that argument does not stand up to the empirical evidenceon textile imports. Indeed, both Brazil and Mexico followed highly protectionist policies after1890, virtually eliminating imported cloth except for fine weave, high value goods.
35

Stephen Haber Financial Market Regulation
during the first three decades of the twentieth century was very closeto that of Brazil, and during the 1920s exceeded Brazilian concentration (see table 5).
The second is that Mexico’s industry leaders were tremendousoperations in an absolute sense. Mexico’s leading firms were not simplylarge relative to the small Mexican market, they were enormousoperations, even by U.S. and Indian standards. Mexico’s largest firmin 1912, for example, the Compañía Industrial de Orizaba (cruosA), wasa four-mill operation employing 4284 workers running 92 708 spindlesand 3 899 looms. Had it been located in the United States, it wouldhave ranked among the 25 largest cotton textile enterprises. Had itbeen located in India it would have been among the top 12 textileenterprises. Significantly, in the country with the market size closestto that of Mexico, Brazil, the largest firm was actually smaller thanCIDOSA. Brazil’s largest producer, the Companhia Arnerica Fabril, controlled 6 mills in 1915, employing 3 100 workers running 85 286spindles and 2 170 looms.
The third problem with this argument is that it does not stand upto empirical evidence on the relationship between total factor productivity (‘ri’p) and firm size. 1 have estimated Cobb Douglas ProductionFunctions for both the Mexican and Brazilian cotton industries, andthese do not reveal positive scale economies. In fact, in the Mexican case,for the census years 1895, 1896, 1912, and 1913 the scale coefficient isnegative, indicating that firms were suboptimally large.47These production function results are buttressed by survivor analysis, which indicatesthat in both Brazil and Mexico the minimum efficient scale ofproductionwas a firrn size that corresponded to less than a 1% market share.
The fourth problem with this hypothesis is that it cannot explainwhy Mexican concentration increased during a period when the industry was experiencing rapid growth, the years 1878-1902. Without sornesupply factor intervening during this period, Mexican concentration should have continued to decline, instead ofjumping back up to its1843 level.
In order to test this hypothesis in a formal manner, 1 estimatedan OLS regression that measures the elasticity of concentration withrespect to industry size. The logic behind the estimation is the following: In an industry characterized by modest returns to scale, with no
‘ Armando Razo and Stephen Haber, “The Rate of Growth of Productivity in Mexico:Evidence from the Cotton Textile Industry,” Journal ofLatin American Studies (forthcoming).
significant technological changes that would raise the minirnum efficient scale of productionin a discontinuous way, we should be able topredict the level of concentration simply by knowing the size of theindustry. Similar regression results for Brazil and Mexico would mdi-cate that concentration was simply a function of industry size. If,however, similar specifications of the regression for each country yielddifferent results, then sorne intervening variable (like an imperfectionin a factor market) must have been at work.8
Table 6 presents various regression specifications. All values areconverted to natural logs in order to capture how changes in the size ofthe industry affect the change in concentration. Industry size is measured by the number of spindles.
The first panel of table 6 measures concentration by the Herfindahi Index. For Brazil we obtain unambiguous results: The parameterestimate for (ln)spindles is — 0.447 with an R2 of 0.89. The estimate isstatistically significant at the 1% level ofconfidence. In short, in Brazil,the elasticity of concentration with respect to size was 44.7% (asindustry size doubles concentration decreased by 44.7%). For Mexico,however, the results are much less robust: the parameter estimate for(ln)firms is significantly lower (0.046), has the wrong sign (as industrysize doubles, concentration increases by 4.6%), and is not statistically significant. Moreover, the R2 is only 0.04, indicating that there isno correlation between industry structure and industry size.
Perhaps it is the case that these results are driven by differencesin the distribution of observations over time. One rnight argue, forexample, that technological change might have had an effect Qn therelationship between industry size and industry structure, and the firstspecification does not account for these changes because of differencesin the frequency of the observations. 1 therefore added a time durnmy tothe regression in specification 2. The addition of this dummy, however,strengthens the qualitative results. As specification 2 of panel 1 mdi-
48 The model makes the reasonable assumption that there were no discontinuous jumpsin minimum efficient scales in either country, though it does allow for a gradual increase inminimum efficient scales. For this reason, it is unlikely that the elasticities of the size variableswill sum to unity. Observations by contemporaries indicate that there were no discontinuousjumps in textile manufacturing technology during the period that affected the Brazilian ocMexican industries. The only major innovation was the Northrup automatic loom, which wasdeveloped in the l890s. But the Northrup loom was not widely adopted in either country (therewere only 25 ofthem in service in Mexico as late as 1910). Moreover, to the extent that there weretechnological jumps, these would be more pronounced in the Brazilian regressions than in thosefor Mexico, because of Brazil’s faster purchase of new capacity. This wouid tend to bias the resultsagainst the hypothesis advanced here.
36 37

Stephen Haber Financial Market Regulation
Table 6. Alternate Specifications of Industrial ConcentrationRegressions
-- --______________________________
Panel 1Dependent variable: ln(Herfindahl Index)t statistics in parentheses
Mexico Brazil
Spec. 1 Spec. 2 Spec. 1 Spec. 2
Intercept —3.933 —10.667 2.623 4.887
(—3.332) (—2.477) (4.021) (2.547)
Ln(spindles) proxy 0.046 0.637 —0.447 —0.733for industry size (.502) (1.699) (—9.288) (—3.136)
Time —0.017 0.0237
(—1.621) (1.250)
DW 0.82 1.11 0.07 0.13
Adjusted R2 0.04 0.04 0.89 0.89
N 22 22 12 12
Panel IIDependent variable: ln(four-firm ratio)t statistics in parentheses
Mexico Brazil
Spec. 1 Spec. 2 Spec. 1 Spec. 2
Intercept —1.603 —5.349 2.295 4.346
(—1.874) (—1.667) (5.318) (3.716)
Ln(spindles) proxy for 0.024 0.353 —0.272 —0.531industry size (.365) (1.264) (—8.538) (—3.727)
Time —0.009 0.021
(—1.210) (1.858)
DW 0.85 1.03 0.06 0.14
Adjusted R2 —0.04 —0.02 0.87 0.89
N 22 22 12 12
Source: Calculated from data in tables 4 and 5.
cates, in Brazil, as industry size doubled, concentration decreased by73%, whereas in Mexico as industry size doubled, concentration increased by 64%. The adjusted R2 for Brazil is 0.89 and for Mexico 0.04,indicating no correlation in Mexico between the two variables.
Panel II repeats the procedures ofpanel 1, but substitutes the fourfirm concentration ratio for the Herfindahi Index as the dependentvariable. The qualitative results are similar to those of panel 1. InBrazil, the relationship between industry size and industry structureis exactly what one would expect from an industry characterized bymodest returns to scale: As the industry grows, concentration decreases. In Mexico, however, the expected relationship between industry size and industry structure, even accounting for technologicalchange over time, does not hold: As the industry grew, concentrationincreased, suggesting that in Mexico an industry that was characterized by constant returns to scale was behaving like an industrycharacterized by sizable increasing returns to scale.
What mechanisms were at work causing Mexico’s level of industrial concentration to increase during a period of rapid expansion? Whydid the trajectory of concentration in Mexico reverse in the 1890s, andwhy did it resume its fail after 1902?
The answer to these questions basically turns on the effects of thelimited opening of Mexico’s capital markets. In the years after 1889Mexico’s big, multi-plant, industry leaders (the Compañía Industrialde Orizaba, Compañía Industrial Veracruzana, Compañía Industrial de Atlixco, and Compañía Industrial de San Antonio Abad) werefounded with capital provided by the Mexico City Stock Exchange.These firms were able to purchase newer, more efficient equipmentfaster than their smaller competitors who did not have recourse to thesale of equity. The result was increasing leveis of concentration.
Why then did concentration drop in the years from 1902 to 1912?Why did the industry leaders not continue to exercise market dominance? The answer is that after they achieved control of the market,Mexico’s industry leaders dramatically slowed their rate ofnew investment. A comparison of the 1895 and 1912 censuses indicates that firmsthat had access to the capital market did not purchase new machineryat a faster rate than did non-capital market firms. In fact, a comparisonof firms extant in both censuses indicates that, if anything, firms thatdid not have access to impersonal sources of capital purchased newmachinery at a faster rate than firms that had access to the capitalmarket. Under a set of assumptions that minimizes the replacement
38 39
Stephen Haber Financial Market Regulation
of oid equipment by new equipment (thereby biasing downward thetotal addition of new machinery), the non-capital market firms purchased new looms at a rate roughly equal to that of the capital marketfirms and purchased new spindles at a rate more than 50% faster.Under a set of assumptions that maximizes the repiacement of oidmachinery by new machinery (thereby biasing upwards the totaladdition of new machinery), the non-capital market firms purchasednew looms at a 13% faster rate than capital market firms and newspindles at a 35% faster rate.
In short, the data suggest that the handful of firms that were ableto mobilize capital through institutional sources gained a one-timeadvantage over their competitors. They then sat back and watchedtheir rents dissipate as their smaller competitors gradually closed thesize gap through the reinvestment of retained earnings. Why theypursued this strategy is somewhat of a mystery at this point. Itmay have been that their managers perceived (incorrectly) that theirability to mobilize institutional sources of capital would have served asa disincentive to new entrants. Potential new entrants would, according to this rationaie, have seen that the industry leaders could rapidlyinstali excess capacity, thereby increasing production and loweringprices below the potential entrant’s long run average cost curve. Or itmay have been that stockholders did not trust the management of theenterprises or were operating with a short time horizon. They thereforedemanded that all profits be paid out as dividends. It might also havebeen that the rates of return available from the big, rnulti-plant millswere disappointing to the investment community. New infusions ofequity capital may therefore have dried up after 1902. Evidence fromthe Mexican financial press lends considerable support to this lastinterpretation. Of the four firms that were able to raise capital throughthe securities markets (cIDosA, CIVSA, CIASA, and San Antonio Abad),two paid dividends on an extremely irregular basis. One of them, SanAntonio Abad, failed to pay anything from 1899 to 1906. When itresumed paying in 1906 and 1907 the real value of its dividends pershare were less than 20% of the average dividend per share prior to1899. Though the two industry leaders, CIDOSA and CIVSA paid steadydividends, the real value of CIDOSA’S dividends feil by two-thirds after1900 and stayed at this lower leve! for the rest of the decade.49Work inprogress hopes to shed additional light on this issue.
Haber, Industry and Underdeveloprnent, p. 115.
Whatever the source of this peculiar behavior by the industryleaders, the lack of new’investment on their part, coupled with thérelatively slow rate of growth of new investment implied by the needto finance new plant and equipment purchases out ofretained earningsby their competitors, suggests that the overail rate ofgrowth ofproductivity in Mexico must have been low relative to Brazil and the UnitedStates.
III. Conclusions
What lessons are there to be drawn from this story about governmentregulation, capital market development, and the growth and structureof industry?
The first is that government regulatory policies had a significanteffect on the growth of capital markets. Capital market developmentin the three countries studied here was not completely endogenous tothe process of economic growth: Different histories of governmentregulation in each of the cases gaye rise to very different sizes andstructures of capital markets.
Second, capital immobilities appear to have been in large part theproduct of the inability of investors to obtain information and monitormanagers. In Mexico, information was difficult to obtain. This gaye wellknown financiers with established reputations privileged access to thecapital markets. This was a very different outcome than that whichobtained in Brazil, where the costs of information appear to have beenmuch lower.
Third, differences in capital market development had a significantimpact on the rate of growth of industry. Mexico’s financial system, inwhich a small group of entrepreneurs could get access to impersonalsources of capital while most entrepreneurs could not, gaye rise to asmall textile industry relative to Brazil. The rapid expansion of theBrazilian textile industry after the opening up of the capital marketsin the late 1880s underlines the important role played by access tofinance in industrial growth. In sum, lack of access to institutionalsources of capital because of poorly developed capital markets was anon-negligible obstacle to industrial development in the nineteenthcentury.
Fourth, imperfections in capital markets also had a significanteffect on the structure of industry. The much more limited opening of
40 41

Stephen Haber Financial Market Regulation
the capital markets in Mexico gaye rise to higher leveis of concentration than in Brazil and the United States. Analysis ofthe data indicatesthat these differences existed independent of industry size.
Fifth, the data analyzed to date suggest that Mexico’s peculiarlyuncompetitive structure of industry may have created disincentives tonew investment by its industry leaders. In addition, the need to rely onretained earnings to finance most new investment would suggest thatin general Mexico’s rate of growth of investment was much slowerthan in countries that had more open capital markets. The result maywell have been much slower rates of growth of productivity, meaningthat Mexican industry may have become increasingly less competitiveover time. Work in progress hopes to shed light on this issue.
Bibliography
Adelman, Morris A. (1966), “Monopoly and Concentration: Comparisons inTime and Space,” in Tullio Bagiotti (ed.), Essays in Honor ofMarco Fanno,vol. 2: Investigations in Economic Theory and Methodology, Padua, pp. 1-24.
Archivo General de la Nación (n.d), “Extracto de las manifestaciones presentadas por los fabricantes de hilados y tejidos de algodón para el semestrede enero a junio de 1912,” caja 5, exp. 4, Mexico.
(n.d), “Extracto de las manifestaciones presentadas por los fabricantsde hilados y tejidos de algodón para el semestre de enero a junio de 1913,”caja 31, exp. 2, Mexico.
Atack, Jeremy (1986), “Firm Size and Industrial Structure in the UnitedStates During the Nineteenth Century,” Journal of Economie History 46,
pp. 463-475.Bain, Joe S. (1966), International Differences in Industrial Structure, New
Haven.Barjau Martínez, L. et al. (1976), “Estadísticas económicas del siglo xix,”
Cuadernos de Trabajo del Departamento de Investigaciones Históricas,INAJI, núm. 14, Mexico City.
Bátiz V., José Antonio (1986), “Trayectoria de la banca en México hasta 1910,”in Leonor Ludlow and Carlos Marichal (eds.), Banca y poder en M&cico,1800-1925, Mexico, pp. 267-298.
Bombay Millowners Association (1900, 1911, 1920, 1930), Reports of theBombay Millowners Association.
Borja Castro, Agostino Vioto de (1869), “Relatorio do segundo grupo,” inAntonio José de Souza Rego (ed.), Relatorio da segunda exposiço nacionalde 1866 (Rio de Janeiro), pp. 3-73.
Branner, John C. (1885), Cotton in the Empire ofBrctzil, Washington.
Cárdenas, Enrique and Carlos Manns (1989), “Inflación y estabilización monetaria en México durate la Revolución,” El Trimestre Económico, 56,Jan.-Mar., pp. 57-80.
Carvalho, José Carlos de (1900), “0 Cafe: sua historia,” in Sociedade Nacionalde Agricultura, Fasciculo No. 7, Rio de Janeiro.
(1900), “0 Algodáo: sua historia,” in Sociedade Nacional de Agricultura,Fasciculo No. 7, Rio de Janeiro.
Centro Industrial de Fiaço e Tecelagem de Algodáo (1928), Estatísticas daindustria, commercio e lavoura de algodáo relativos ao anno de 1927, Riode Janeiro.
(circa 1926), Fabricas filiadas, Rio de Janeiro.(1935), Fiaçáo e Tecelagem: Censo Organizado pelo Centro Industrial
de Fiaçáo e Tecelagem de Algodáo, Rio de Janeiro.(1921-1922, 1923, 1924, 1925, 1926, 1928), Relatorio ao diretoria, Rio
de Jane{ro.Centro Industrial do Brasil (1909), 0 Brasil: suas riquezas naturaes, suas
industrias vol. 3: industria de transportes, industria fabril, Rio de Janeiro.(1917), 0 Centro Industrial na conferencia algodoeira, Rio de Janeiro.(1915), Relatorio.
Coatsworth, John H. (1978), “Obstacles to Economic Growth in NineteenthCentury Mexico,”American Historical Review, 83, Feb., pp. 80-101.
Commissáo de Inquerito Industrial (1882), Relcitorio ao Ministerio da Fazenda, Rio de Janeiro.
Commisso [para] Exposico Universal [emi Philadelphia (1876), The EmpireofBrazil at the Universal Exhibition of1876 in Philadelphia, Rio de Janeiro:Typ. e Lithographia do Imperial Instituto Artistico.
Consul Ricketts (1986), Report, C4657, lxv, pp. 187-188.Davis, Lance E. (1957), “Sources of Industrial Fmance: The American Textile
Industry, A Case Study,” Explorations in Entrepreneurial History, 9,Apr., pp. 189-203.
(1963), “Capital Immobilities and Finance Capitalism: A Study ofEconomic Evolution in the United States, 1820-1920,” Explorations inEconomic History, 1, Fall, pp. 88-105.
(1966), “The Capital Markets and Industrial Concentration: The U.S.and U.K., A Comparative Study,” The Economic History Review, 19, pp.255-272.
Davis, Lance E. and H. Louis Stettler III (1966), “The New England TextileIndustry, 1825-1860: Trends and Fluctuations,” in Conference on Researchon Income and Wealth, Output, Employment, and Productivity in the UnitedStates afler 1800, New York.
Davison’s Textile Blue Book, 1890-1930, New York, various years.Dockham’s American Report and Directory ofthe Textile Manufacture and Dry
Goods Trade, 1880-1900, various years, Boston.
42 43

Stephen Haber Financial Market Regulation
Dirección de Colonización e Industria (1851), Memoria 1850, Mexico.Dirección General de Estadística (1894), Anuario Estadístico de la República
Mexicana, 1893-1894, Mexico.Dos Santos Pires, Antonio Olyntho (1896), Relatorio apresentado ao Presidente
da Republica dos Estados Unidos do Brasil pelo Ministerio de Estado dosNegocios da Industria, Viacáo e Obras Publicas, Rio de Janeiro.
El Economista Mexicano, 1896-1914.García Cubas, Antonio (1885), Cuadro geográfico, estadístico, descriptivo e
histórico de los Estados Unidos Mexicanos, Mexico.(1893), Mexico: Its Trade, Industries, and Resources, Mexico.
Gobierno del Estado de México (1980), Estadística del Departamento deMéxico, Mexico.
Haber, Stephen H. (1989), Industry and Underdevelopment: The Industrialization ofMexico, 1890-1940, Stanford.
(1991), “Industrial Concentration and the Capital Markets: A Comparative Study of Brazil, Mexico, and the United States, 1830-1930,” TheJournal ofEconomic History, 51:3, Sept., pp. 559-580.
Instituto Brasileiro de Geografia e Estatística (1990), Estatísticas Históricasdo Brasil, Rio de Janeiro.
Instituto Nacional de Estadística, Geografía e Informática (1985), Estadísticashistóricas de México, Mexico, INEGI.
Kennedy, Stephen J. (1940), Profits and Losses in Textiles: Cotton TextileFinancing Since the War, New York.
Kuznets, Simon (1971), Economic Growth of Nations: Total Output andProduction Structure, Cambridge.
La Semana Mercantil, 1902 to 1914.Lamoreaux, Naomi (1986), “Banks, Kinship, and Economic Development: The
New England Case,” The Journal ofEconomic Histoy, 46, Sept., pp. 647-667.Levy, Maria Bárbara (1977), História da Bolsa de Valores do Rio de Janeiro,
Rio de Janeiro.Long, J. Bradford de (1991), “Did J.P. Morgan’s Men Add Value? An Econo
mists Perspective on Financial Capitalism,” in Peter Temin (ed.), Inside theBusiness Enterprise: Historical Perspectives on the Use of Information,Chicago, pp. 205-236.
Ludlow, Leonor (1986), “La construcción de un banco: el Banco Nacional deMéxico, 1881-1884,” in Leonor Ludlow and Carlos Marichal (eds.), Banca ypoder en México, 1800-1925, Mexico, pp. 299-346.
Marichal, Carlos (1986), “El nacimiento de la banca mexicana en el contextolatinoamericano: problemas de periodización,” in Leonor Ludlow and CarlosMarichal (eds.), Banca y poder en México, 1800-1925, Mexico, pp. 231-266.
(1992), “Obstacles to the Development of Capital Markets in Nineteenth Century Mexico,” unpublished paper presented at Stanford University, January 12.
44
McKinnon, Ronald 1. (1973), Money and Capital in Economic Development,Washington.
Ministerio da Industria, Viaç.o e Obras Públicas (1896), Rekztorio, 1896, Riode Janeiro.
Ministerio de Fomento (1854), Estadística del Departamento de México,Mexico.
(1857), Memoria del Ministerio de Fomento, Mexico.(1865), Memoria del Ministerio de Fomento, Mexico.
Neuhaus, Paulo (1975), História monetária do Brasil, 1900-1945, Rio deJaneiro.
Patrick, Hugh (1966), “Financial Development and Economic Growth inUnderdeveloped Countries,” Economic Development and Cultural Chan-ge, 14.
Peláez, Carlos Manuel and Wilson Suzigan (1976), História monetária do Brasil: análise da política, comportamento e institucóes monetárias, Brasilia.
Pérez Hernández, José María (1862), Estadística de la república mexicana,Guadalajara.
Pryor, Frederick L. (1972), “An International Comparison of ConcentrationRatios,” Review ofEconomics and Statistics, 54, pp. 130-140.
Razo, Armando and Stephen H. Haber, “The Rate of Growth of Productivityin Mexico, 1850-1933: Evidence From the Cotton Textile Industry,”JournalofLatin American Studies (forthcoming).
Retrospecto Commercial do Jornal do Comercio (1911-1930), Rio de Janeiro.Saes, Flávio Azevedo Marques de (1986), Crédito e bancos no desenvolvimento
da economia paulista, 1850-1930, Sao Paulo.Sánchez Martínez, Hilda (1983), “El sistema monetario y financiero mexicano
bajo una perspectiva histórica: el Porfiriato,” in José Manuel Quijano (ed.),La banca, pasado y presente: problemas financieros mexicanos, Mexico,pp. 15-94.
Secretaría de Fomento (1852), “Colonización e industria,” Memoria que la Dirección de Colonización e Industria presentó al Ministerio de Reláciones en 17 deenero de 1852, sobre el estado de estos ramos en el año anterior, Mexico.
(1890), Boletín semestral de la república mexicana, 1889, Mexico.(1894), Anuario estadístico de la república ,nexicana, 1893.1894, Mexico.(1896), Anuario estadístico de la república mexicana, 1895, Mexico.
Secretaría de Hacienda (1880), Estadística de la república mexicana, Mexico.(1896), Estadística de la república mexicana, Mexico.(1896), Memoria, 1895, Mexico.
Secretaría de Hacienda y Crédito Público (1917-1932), Boletín de la Secretaríade Hacienda y Crédito Público, Mexico City.
(1977), Documentos para el estudio de la industrialización en México,183 7-1845, Mexico.
Secretaría del Estado (1857), Memoria de la Secretaría del Estado y del
45
a

Stephen Haber
Despacho de Fomento, Colonización, Industria y Comercio de la repúblicamexicana, Mexico.
Semana Mercantil.Smith, George David and Richard Sylla (1993), “The Transformation of
Financial Capitalism: An Essay on the History of American Capital Markets,” Financial Markets, Institutions and Instruments, 2:2.
Stein, Stanley J. (1957), The Brazilian Cotton Textile Manufacture: TextileEnterprise in an Underdeveloped Area, Cambridge, MA.
Suzigan, Wilson (1986), Indústria brasileira: origem e desenvolvimento, SáoPaulo.
Sylla, Richard (1975), The American Capital Market, 1846-1914: A Study ofthe Effects ofPublic Policy on Economic Development, New York.
Temporary National Economic Committee (1941), Investigation of Concentration of Economic Power: Monograph 27, The Structure of Industry, 76thCongress, 3rd Session, Washington.
Topik, Steven (1987), The Political Economy ofthe Brazilian State, 1889-1930,Austin, TX.
Triner, Gail D. (1990), “Brazilian Banks and the Economy, 1906-1918,” MA
thesis, Columbia University.Vasco, Cunha (1905), “A industria do algodo,” Boletim do Centro Industrial
do Brasil, Dec. 30.Walker, David W. (1986), Kinship, Business, and Politics: The Martínez del
Río Family in Mexico, 1824-1867, Austin, TX.
Wright, Gavin (1981), “Cheap Labor and Southern Textiles, 1880-1930,”Quarterly Journal ofEconomics, 96, pp. 605-629.
David Alan Aschauer*
Abstract: This paper develops and empirically implements a neoclassicalgrowth model in which output depends on private capital and humancapital as well as the quantity, means of financing, and efficiency of use ofpublic capital. The empirical analysis is based on a cross section of 46developing countries over the period from 1970 to 1990. In general, thepaper finds empirical support for the importance of each of the threedimensions ofpublic capital —quantity, financing, and efficiency— for longrun standards of living and for transitional growth rates. The empiricalresults are applied to the recent performance of the Mexican economy.
Resumen: En este artículo se elabora y pone en práctica empíricamente unmodelo neoclásico de desarrollo en el cual el producto depende tanto delcapital privado y del capital humano como de la cantidad, los medios definanciamiento y la eficiencia del uso del capital público. El análisisempírico se basa en un estudio comparativo de 46 países en desarrollo a lolargo de un periodo que va de 1970 a 1990. En general, los resultadosempíricos del modelo apoyan la importancia que tienen para el nivel devida en el largo plazo y las tasas de crecimiento del periodo de transicióntodas y cada una de las tres dimensiones del capital público: magnitud,financiamiento y eficiencia. Los resultados empíricos se aplican al desempeño reciente de la economía mexicana.
Mexico, like nearly ah countries, invests heavily in its stock of publicinfrastructure capital —transportation systems, water supply
and water treatment plants, electrical supply, and communications. Ata basic level, such investment is needed for a strong, flexible, andvibrant economy. Workers need to be able to use transport to get to theirworkplaces; companies need to use fresh water and dispose of waste aswell as to have access to electrical power and communication facilities.
El autor es Etmer W. Carnpbell Professor of Economics en Bates College.
The Roleof Public Infrastructure Capitalin Mexican Economic Growth
46 Economía Mexicana. Nueva Época, vol. VII, núm. 1, primer semestre de 1998 47