Embed Size (px)
Citation preview

FINANCIAL
ANALYSTS
MEETING
Mr. Jochen Zaumseil Executive Vice-President
Western Europe Zone
September 17th, 2013

2
1. COSMETICS MARKET IN WESTERN EUROPE

3 * L’Oréal / BMS - Excluding soaps, razors and toothpastes. Sell-in.
Western Europe
Asia-Pacific excl. Japan
North America
=
Cosmetics Market in 2012*
Size by region
Capital Market Days - September 17th, 2013

4 * L’Oréal / BMS - Excluding soaps, razors and toothpastes. Sell-in.
3%
5%
6%
7%
11%
23%
12%
15%
18%
3%
5%
7%
8%
11%
14%
15%
18%
19%
SunCare
Styling
HairColor
BodyCare
HairCare
MakeUp
Hygiene
Fragrances
Face Care
Western Europe
North America
Cosmetics Market in 2012*
Weight by category in Western Europe and North America
Capital Market Days - September 17th, 2013

5
13%
8%
2%
27%
51%
8%
11%
11%
26%
45%
Direct Sales
Professional
Dermocosmetics
Luxury
Mass
Western Europe
North America
* L’Oréal / BMS - Excluding soaps, razors and toothpastes. Sell-in.
Cosmetics Market in 2012*
Weight by channel in Western Europe and North America
Capital Market Days - September 17th, 2013

6
France
111 USA
108
Brazil
61
China
11
India
3
Russia
52
Japan
195
South Africa
26
Mexico
26
UK
98
Spain
88
Italy
93
Germany
80
World
31 * L’Oréal / BMS - Excluding soaps, razors and toothpastes. Sell-in.
Cosmetics Market in 2012*
Beauty Consumption by Capita (in euros – excluding Travel Retail)
Capital Market Days - September 17th, 2013

7
* L’Oréal / BMS - Excluding soaps, razors and toothpastes. Sell-in.
2 JAPAN
6 FRANCE
1 UNITED STATES
5 RUSSIA
4 BRAZIL
3 CHINA
7 GERMANY
10 SPAIN
9 ITALY
8 UNITED KINGDOM
Cosmetics Market in 2012*
TOP 10 Markets (Bn euros/sell-in)
39
25
15
12
7
7
7
6
4
6
Capital Market Days - September 17th, 2013

8
* L’Oréal / BMS - Excluding soaps, razors and toothpastes.Sell-in, H1-2013 provisional estimate
South Europe = Italy, Spain, Portugal & Greece North Europe = France, Germany, UK, Switzerland, Belgium, Netherlands, Austria, Sweden, Norway, Denmark & Finland
2010 2011 2012 H1-2013
Western Europe + 0,8% + 0,7% + 0,0% - 0,9%
North Europe + 1,1% + 0,8% + 0,7% + 0,0%
South Europe -1,1% -0,7% -3,1% -3,6%
Western Europe Beauty Market Growth*
2010/H1-2013
Capital Market Days - September 17th, 2013

9
2. KEY PLAYERS

10
* Euromonitor Sell-out – Beauty & Personal Care excluding soaps, oral care and razors & blades
2%
2%
3%
3%
4%
4%
6%
7%
8%
19%
Johnson & Johnson
Chanel
Estée Lauder
LVMH
Coty
Henkel
Unilever
Beiersdorf
Procter & Gamble
L'Oréal
TOP 10 Players of the Cosmetics Market
in Western Europe in 2012* (market share, %)
Capital Market Days - September 17th, 2013

11
*Euromonitor Sell-out – Beauty & Personal Care excluding soaps, oral care and razors & blades
**Panel IRI/Nielsen Europe 14 sell-out
***Internal Estimate
****Kline sell-in
*****IMS Europe 8 Panel sell-out
TOTAL* Mass** Luxury*** Salons**** Dermocosmetics*****
#1 L'Oréal L'Oréal L'Oréal L'Oréal L'Oréal
#2 P&G P&G Estee Lauder P&G Pierre Fabre
#3 Beiersdorf Beiersdorf LVMH Henkel Beiersdorf
TOP 3 Players of the Cosmetics Market
in Western Europe in 2012 by Channel
Capital Market Days - September 17th, 2013

12
*Euromonitor Sell-out – Beauty & Personal Care excluding soaps, oral care and razors & blades
Skincare = Face + Body + Sun care
Hygiene = Shower Gel + Intimate Hygiene + Bath Additives + Talcum Powder + Deodorants + Shaving
TOTAL* Hair Care* Skincare* Make-Up* Fragrances* Hygiene*
#1 L'Oréal L'Oréal L'Oréal L'Oréal Coty Unilever
#2 P&G P&G Beiersdorf Coty L'Oréal Beiersdorf
#3 Beiersdorf Henkel Estee Lauder P&G LVMH Colgate
L'Oréal
TOP 3 Players of the Cosmetics Market
in Western Europe in 2012 by Category
Capital Market Days - September 17th, 2013

13
* L’Oréal / BMS - Excluding soaps, razors and toothpastes.Sell-in.
14%
15%
28%
19%
North America
Europe 4 (UK/GER/IT/SP)
France
Western Europe
= 60% of the Beauty Market
in Western Europe
L’Oréal Market Shares
in 2012*
Capital Market Days - September 17th, 2013

14
3. L’OREAL
15
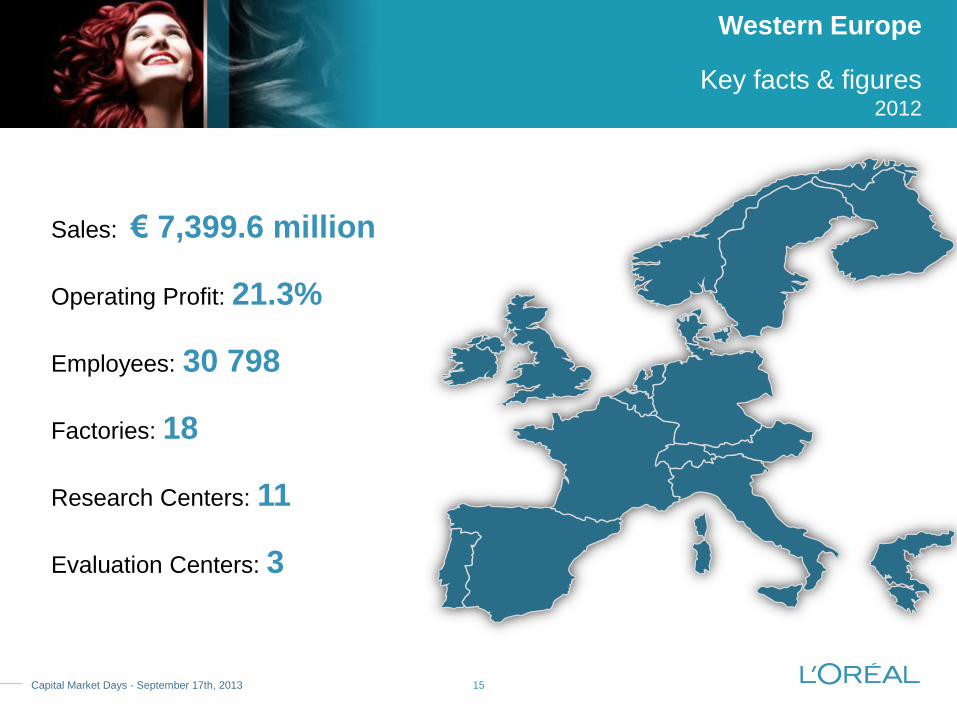
Sales: € 7,399.6 million
Operating Profit: 21.3%
Employees: 30 798
Factories: 18
Research Centers: 11
Evaluation Centers: 3
Western Europe
Key facts & figures 2012
Capital Market Days - September 17th, 2013
16
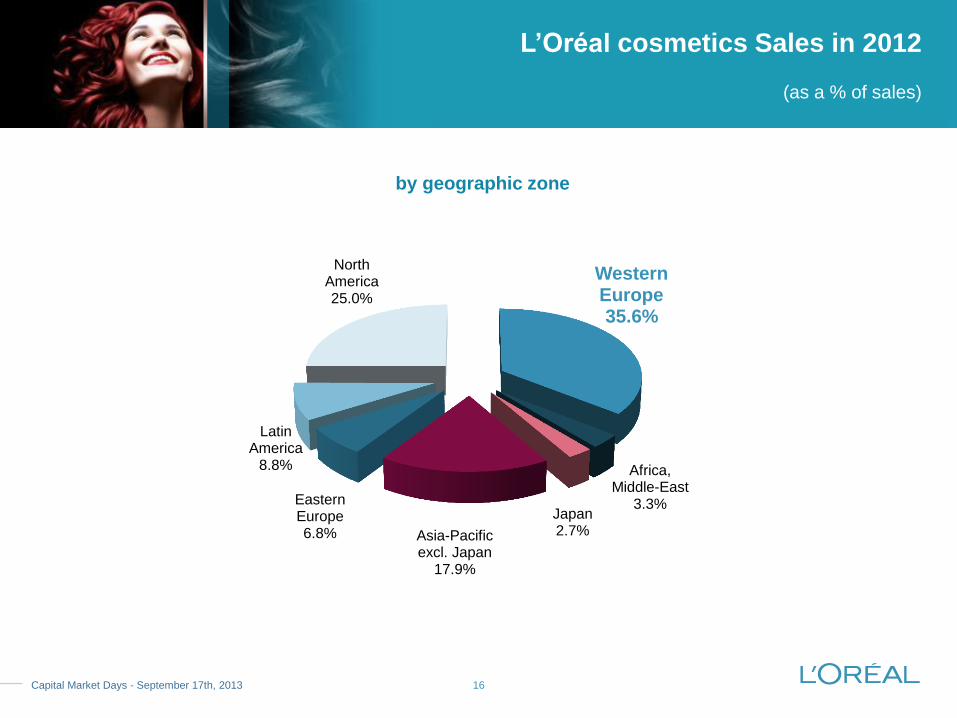
by geographic zone
Western Europe 35.6%
Africa, Middle-East
3.3% Japan 2.7% Asia-Pacific
excl. Japan 17.9%
Eastern Europe 6.8%
Latin America
8.8%
North America 25.0%
L’Oréal cosmetics Sales in 2012
(as a % of sales)
Capital Market Days - September 17th, 2013

17
Western Europe North America New Markets
21.3%
18.4% 18.5%
* Before central group expenses, fundamental research expenses, stock-option & free grant of shares expenses and miscellaneous items – as a % of total cosmetics sales
Cosmetics operating profit
by geographic zone* (as a % of sales)
Operating profit by region in 2012
(as a % of sales)
Capital Market Days - September 17th, 2013

18
L’Oréal Market Share
in Western Europe from 2009 to 2012
•L’Oréal / BMS - Excluding soaps, razors and toothpastes.Sell-in.
2009 2010 2011 2012
L'Oréal Western Europe 18.6% 18.8% 18.8% 18.9%
Capital Market Days - September 17th, 2013

19
28.4 28.9 29.4
11.6 10.8 10.2
10.1 9.7 9.7
0
2
4
6
8
10
12
14
16
18
20
22
24
26
28
30
2011 2012 2013 YTD
L'Oréal CPD
Competitor n.1
Competitor n.2
Market Share in value %
* source : NIELSEN/IRI panel / Total Beauty = Hair + Skincare + Make-Up + Deodorant
Hair = 14 Countries, Skincare = 14 Countries (9 in Bodycare, 9 in Suncare), Make-Up = 12 Countries, Deodorant = 5 Countries
Europe 14 = Germany, Austria, Belgium, Denmark, Spain, France, United-Kingdom, Greece, Italy, Norway, Netherlands, Portugal, Sweden and Switzerland
Total Beauty Mass Market Western Europe*
2011-YTD July 2013
Capital Market Days - September 17th, 2013

20
Years
50.0 50.6 52.8
27.3 28.0 27.2
0
10
20
30
40
50
60
2011 2012 2013 YTD
L'Oréal CPD
Competitor n.1
* source : NIELSEN/IRI panel
Hair = 14 Countries
Europe 14 = Germany, Austria, Belgium, Denmark, Spain, France, United-Kingdom, Greece, Italy, Norway, Netherlands, Portugal, Sweden and Switzerland
Market Share in value %
Hair Color Mass Market Western Europe*
2011-YTD July 2013
Capital Market Days - September 17th, 2013

21
24.8 26.0 26.8
20.7 20.5 20.7
8.9 7.8 7.0
0
5
10
15
20
25
30
2011 2012 2013 YTD
L'Oréal CPD
Competitor n.1
Competitor n.2
Market Share in value %
Years
* source : NIELSEN/IRI panel
Skincare = 14 Countries (9 in Bodycare, 9 in Suncare)
Europe 14 = Germany, Austria, Belgium, Denmark, Spain, France, United-Kingdom, Greece, Italy, Norway, Netherlands, Portugal, Sweden and Switzerland
Face Care Mass Market Western Europe*
2011-YTD July 2013
Capital Market Days - September 17th, 2013

22
4. OPPORTUNITIES
23
One Ambition +70 million consumers
One Strategy Universalization
One Objective Outperform the market
and deliver growth
L’Oréal in Western Europe
Capital Market Days - September 17th, 2013

24
Strategic Categories Modern Targets
Distribution Extension
New Brands
• Skin Care
• Make Up
• Hair Care
• Seniors
• The «New Smart»
• Clarisonic
• Urban Decay
• Essie…
Many Opportunities to Grow in Western Europe
Capital Market Days - September 17th, 2013

25
WE North WE South WE
Hair
Hair Density
Hair Diameter
Hair Nature
Hair Length
Hair Color
Hair problems
Medium
Thin
Straight to wavy
Shorter
Lighter from Blonde to brown
Flat
Without volume
Stressed hair
Weak
Perceptions enhanced by cold – heating
inside buildings
Very High
Medium to thin
Straight to curly
Longer
Darker from darker brown to black
Unruly (wavy factor)
Oily hair
Damaged hair
(straightening/curl control desire -> high usage of
diffusing dryers and straighteining irons)
Perceptions enhanced by heat and sun creating
bothersome scalp perspiration
Face
Skin Density
Skin Diameter
Skin Nature
SkinColor
Skin problems
Sensitive skin
Thin
- Pores
- Sebum
1-2
Dry skin
Average 40%
Perceptions enhanced by cold weather
Medium
++ Pores
++ Sebum
1-2-4
Skin marks/spots (more ‘olive skin’)
Oily skin related problems
Average 60%
Perceptions enhanced by heat and sun creating
bothersome face perspiration R&I CMI Country Clustering 2013
Beauty Track France/UK/It/Spain Women 15-75
There is a North and a South Consumer
Capital Market Days - September 17th, 2013

26
SOURCE: Eurostat; L'Oréal data from UK
38 28 23 36
55+ women account for a growing share of European
potential women consumers
The new generation of elder 55-65 spend more
than the average female population
172
83
143
176
214
179
191
113
171
205 222
190
0
50
100
150
200
250
TOTALACHÈTEUSES
MOINS DE 25ANS
DE 25 À 34ANS
DE 35 À 49ANS
DE 50 À 64ANS
65 +
TAM 10 2012
TAM13 2008
Index 120 versus total population
And this will continue 65+ later
Elder Consumers Opportunities
Capital Market Days - September 17th, 2013

27
WELCOME TO FRANCE