Embed Size (px)
Citation preview
8 February 2019
2018 Annual Results
Mr Christian Mulliez
Chief Financial Officer
8 February 20192
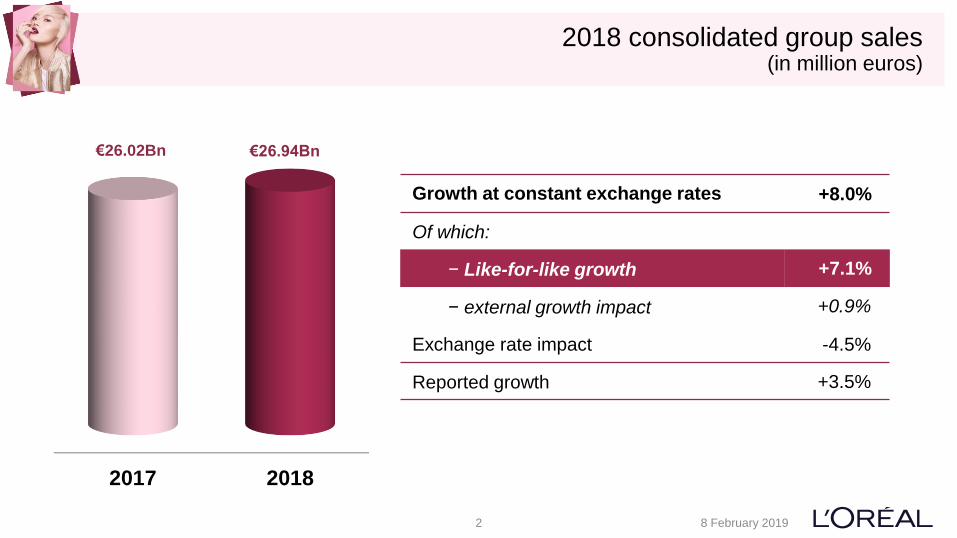
2018 consolidated group sales(in million euros)
Growth at constant exchange rates +8.0%
Of which:
− Like-for-like growth +7.1%
− external growth impact +0.9%
Exchange rate impact -4.5%
Reported growth +3.5%
2017 2018
€26.02Bn €26.94Bn
8 February 20193
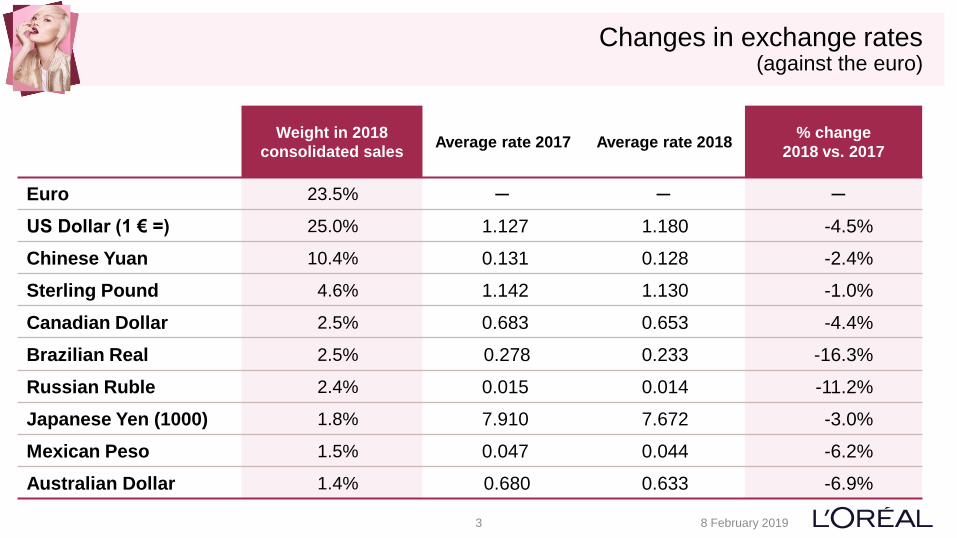
Changes in exchange rates(against the euro)
Weight in 2018
consolidated salesAverage rate 2017 Average rate 2018
% change
2018 vs. 2017
Euro 23.5% ─ ─ ─
US Dollar (1 € =) 25.0% 1.127 1.180 -4.5%
Chinese Yuan 10.4% 0.131 0.128 -2.4%
Sterling Pound 4.6% 1.142 1.130 -1.0%
Canadian Dollar 2.5% 0.683 0.653 -4.4%
Brazilian Real 2.5% 0.278 0.233 -16.3%
Russian Ruble 2.4% 0.015 0.014 -11.2%
Japanese Yen (1000) 1.8% 7.910 7.672 -3.0%
Mexican Peso 1.5% 0.047 0.044 -6.2%
Australian Dollar 1.4% 0.680 0.633 -6.9%
8 February 20194
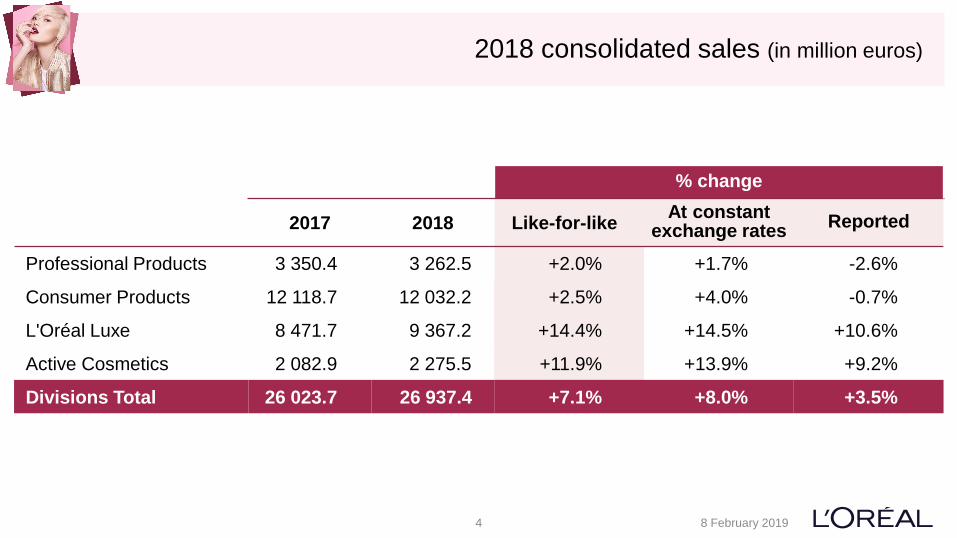
2018 consolidated sales (in million euros)
% change
2017 2018 Like-for-likeAt constant
exchange ratesReported
Professional Products 3 350.4 3 262.5 +2.0% +1.7% -2.6%
Consumer Products 12 118.7 12 032.2 +2.5% +4.0% -0.7%
L'Oréal Luxe 8 471.7 9 367.2 +14.4% +14.5% +10.6%
Active Cosmetics 2 082.9 2 275.5 +11.9% +13.9% +9.2%
Divisions Total 26 023.7 26 937.4 +7.1% +8.0% +3.5%
8 February 20195
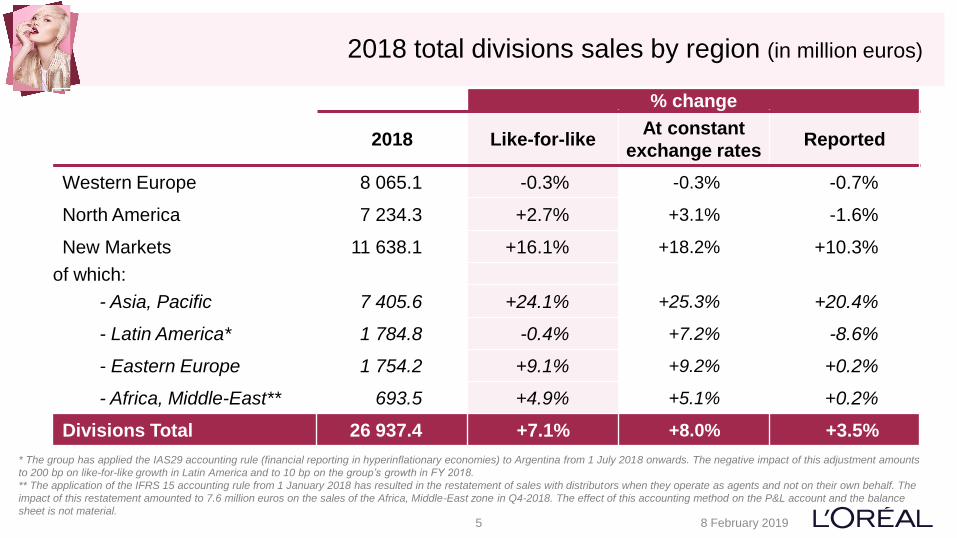
2018 total divisions sales by region (in million euros)
% change
2018 Like-for-likeAt constant
exchange ratesReported
Western Europe 8 065.1 -0.3% -0.3% -0.7%
North America 7 234.3 +2.7% +3.1% -1.6%
New Markets 11 638.1 +16.1% +18.2% +10.3%
of which:
- Asia, Pacific 7 405.6 +24.1% +25.3% +20.4%
- Latin America* 1 784.8 -0.4% +7.2% -8.6%
- Eastern Europe 1 754.2 +9.1% +9.2% +0.2%
- Africa, Middle-East** 693.5 +4.9% +5.1% +0.2%
Divisions Total 26 937.4 +7.1% +8.0% +3.5%
* The group has applied the IAS29 accounting rule (financial reporting in hyperinflationary economies) to Argentina from 1 July 2018 onwards. The negative impact of this adjustment amounts
to 200 bp on like-for-like growth in Latin America and to 10 bp on the group’s growth in FY 2018.
** The application of the IFRS 15 accounting rule from 1 January 2018 has resulted in the restatement of sales with distributors when they operate as agents and not on their own behalf. The
impact of this restatement amounted to 7.6 million euros on the sales of the Africa, Middle-East zone in Q4-2018. The effect of this accounting method on the P&L account and the balance
sheet is not material.
8 February 20196
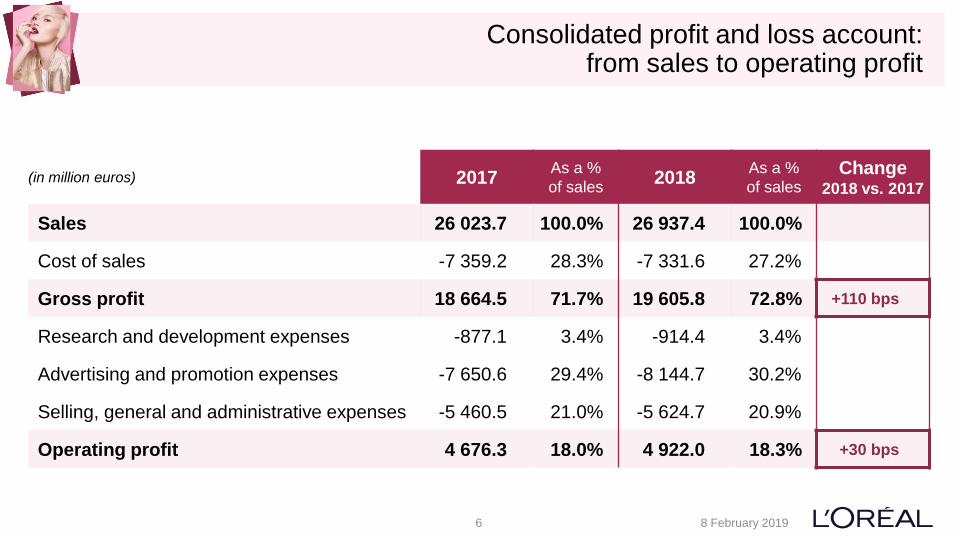
Consolidated profit and loss account:from sales to operating profit
(in million euros) 2017As a %
of sales2018
As a %
of salesChange
2018 vs. 2017
Sales 26 023.7 100.0% 26 937.4 100.0%
Cost of sales -7 359.2 28.3% -7 331.6 27.2%
Gross profit 18 664.5 71.7% 19 605.8 72.8% +110 bps
Research and development expenses -877.1 3.4% -914.4 3.4%
Advertising and promotion expenses -7 650.6 29.4% -8 144.7 30.2%
Selling, general and administrative expenses -5 460.5 21.0% -5 624.7 20.9%
Operating profit 4 676.3 18.0% 4 922.0 18.3% +30 bps
8 February 20197
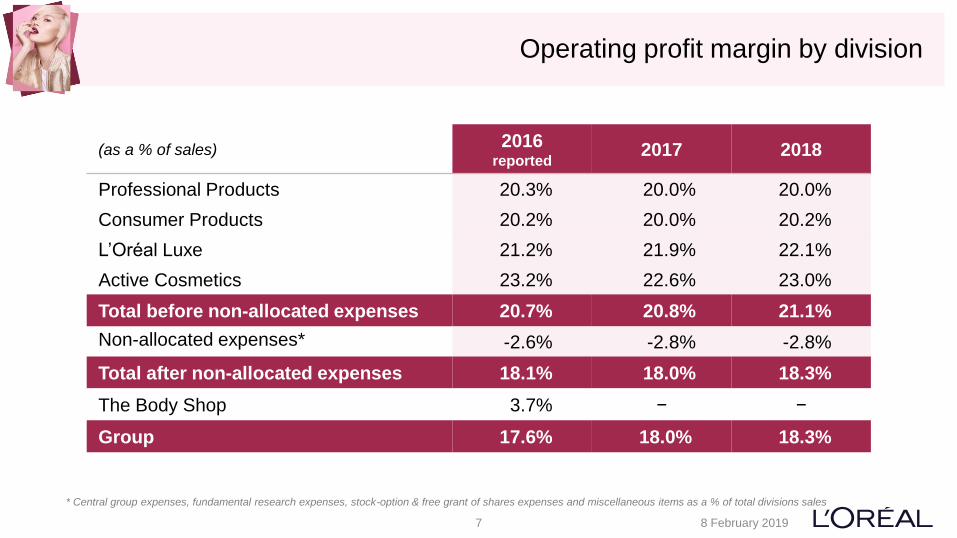
Operating profit margin by division
(as a % of sales)2016
reported2017 2018
Professional Products 20.3% 20.0% 20.0%
Consumer Products 20.2% 20.0% 20.2%
L’Oréal Luxe 21.2% 21.9% 22.1%
Active Cosmetics 23.2% 22.6% 23.0%
Total before non-allocated expenses 20.7% 20.8% 21.1%
Non-allocated expenses* -2.6% -2.8% -2.8%
Total after non-allocated expenses 18.1% 18.0% 18.3%
The Body Shop 3.7% − −
Group 17.6% 18.0% 18.3%
* Central group expenses, fundamental research expenses, stock-option & free grant of shares expenses and miscellaneous items as a % of total divisions sales
8 February 20198
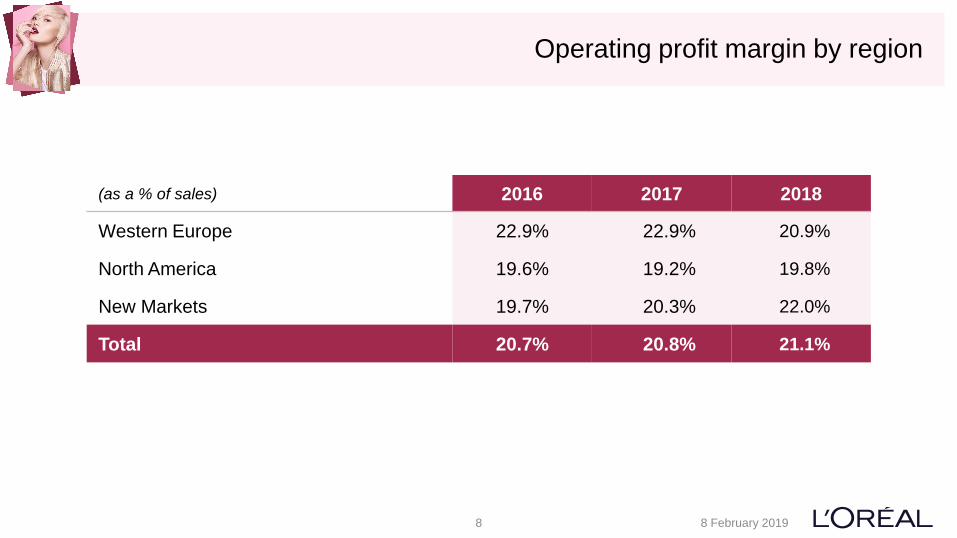
Operating profit margin by region
(as a % of sales) 2016 2017 2018
Western Europe 22.9% 22.9% 20.9%
North America 19.6% 19.2% 19.8%
New Markets 19.7% 20.3% 22.0%
Total 20.7% 20.8% 21.1%
8 February 20199
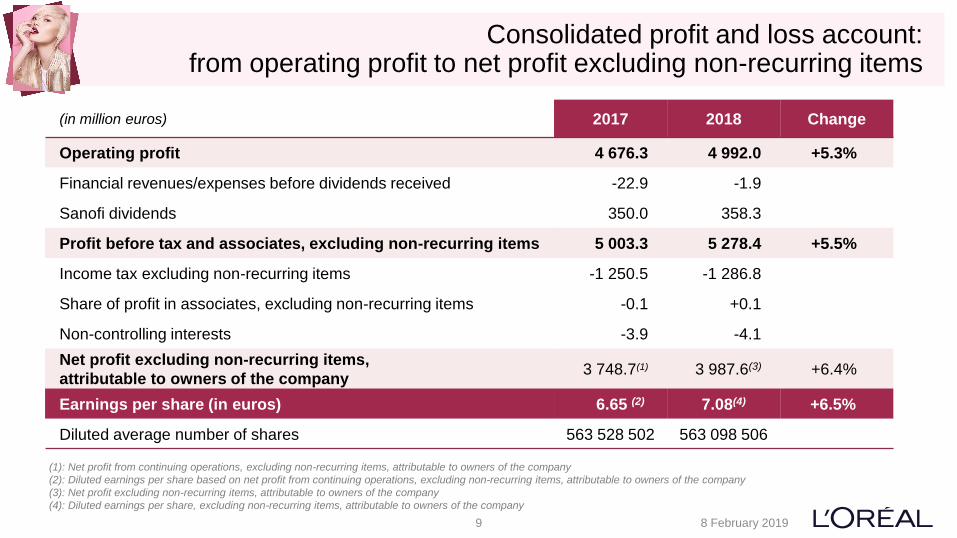
Consolidated profit and loss account:from operating profit to net profit excluding non-recurring items
(in million euros) 2017 2018 Change
Operating profit 4 676.3 4 992.0 +5.3%
Financial revenues/expenses before dividends received -22.9 -1.9
Sanofi dividends 350.0 358.3
Profit before tax and associates, excluding non-recurring items 5 003.3 5 278.4 +5.5%
Income tax excluding non-recurring items -1 250.5 -1 286.8
Share of profit in associates, excluding non-recurring items -0.1 +0.1
Non-controlling interests -3.9 -4.1
Net profit excluding non-recurring items,
attributable to owners of the company3 748.7(1) 3 987.6(3) +6.4%
Earnings per share (in euros) 6.65 (2) 7.08(4) +6.5%
Diluted average number of shares 563 528 502 563 098 506
(1): Net profit from continuing operations, excluding non-recurring items, attributable to owners of the company
(2): Diluted earnings per share based on net profit from continuing operations, excluding non-recurring items, attributable to owners of the company
(3): Net profit excluding non-recurring items, attributable to owners of the company
(4): Diluted earnings per share, excluding non-recurring items, attributable to owners of the company
8 February 201910
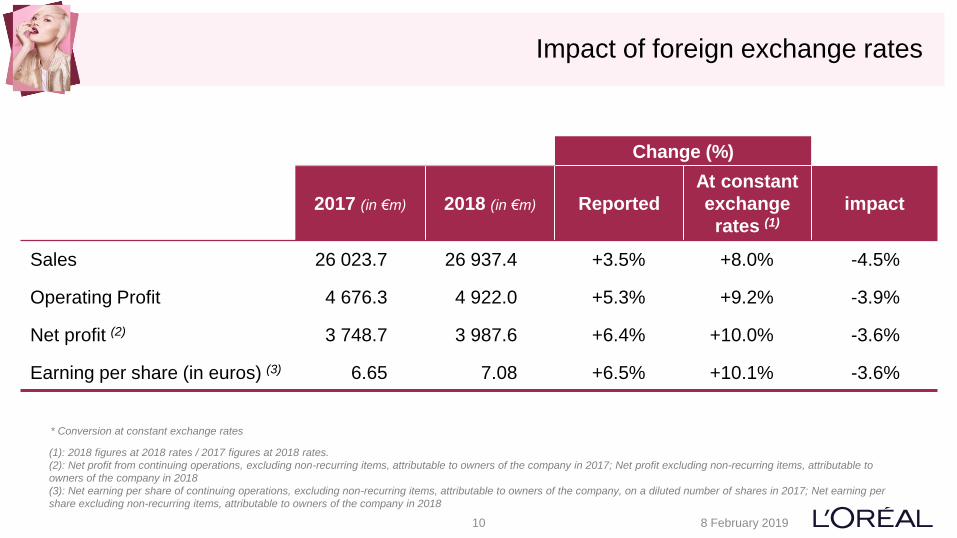
Impact of foreign exchange rates
Change (%)
2017 (in €m) 2018 (in €m) Reported
At constant
exchange
rates (1)
impact
Sales 26 023.7 26 937.4 +3.5% +8.0% -4.5%
Operating Profit 4 676.3 4 922.0 +5.3% +9.2% -3.9%
Net profit (2) 3 748.7 3 987.6 +6.4% +10.0% -3.6%
Earning per share (in euros) (3) 6.65 7.08 +6.5% +10.1% -3.6%
(1): 2018 figures at 2018 rates / 2017 figures at 2018 rates.
(2): Net profit from continuing operations, excluding non-recurring items, attributable to owners of the company in 2017; Net profit excluding non-recurring items, attributable to
owners of the company in 2018
(3): Net earning per share of continuing operations, excluding non-recurring items, attributable to owners of the company, on a diluted number of shares in 2017; Net earning per
share excluding non-recurring items, attributable to owners of the company in 2018
* Conversion at constant exchange rates
8 February 201911
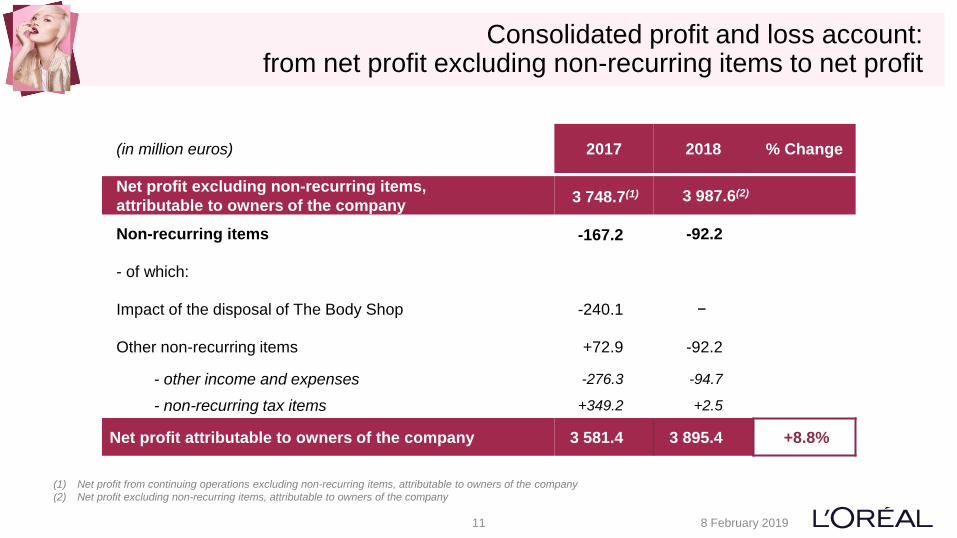
Consolidated profit and loss account:from net profit excluding non-recurring items to net profit
(in million euros) 2017 2018 % Change
Net profit excluding non-recurring items,
attributable to owners of the company3 748.7(1) 3 987.6(2)
Non-recurring items -167.2 -92.2
- of which:
Impact of the disposal of The Body Shop -240.1 −
Other non-recurring items +72.9 -92.2
- other income and expenses -276.3 -94.7
- non-recurring tax items +349.2 +2.5
Net profit attributable to owners of the company 3 581.4 3 895.4 +8.8%
(1) Net profit from continuing operations excluding non-recurring items, attributable to owners of the company
(2) Net profit excluding non-recurring items, attributable to owners of the company
8 February 201912
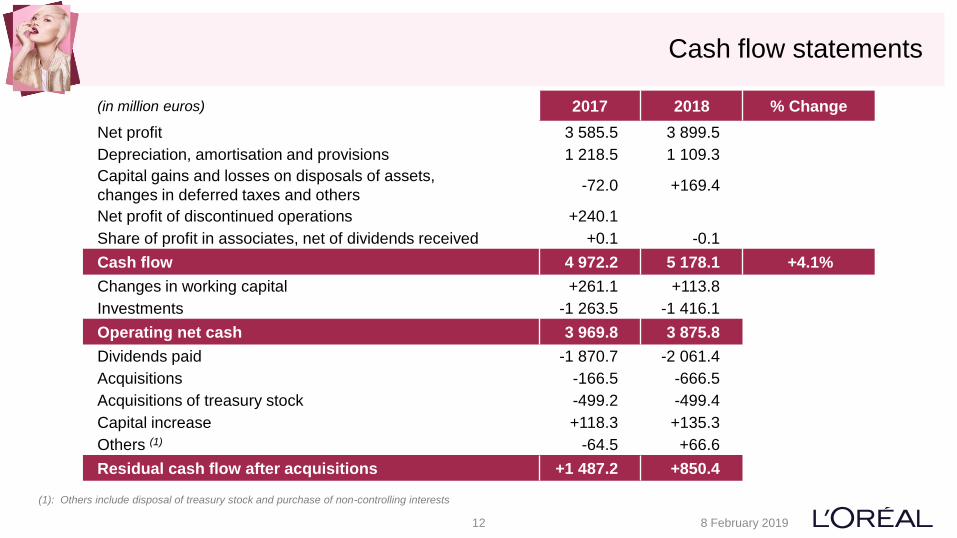
Cash flow statements
(in million euros) 2017 2018 % Change
Net profit 3 585.5 3 899.5
Depreciation, amortisation and provisions 1 218.5 1 109.3
Capital gains and losses on disposals of assets,
changes in deferred taxes and others-72.0 +169.4
Net profit of discontinued operations +240.1
Share of profit in associates, net of dividends received +0.1 -0.1
Cash flow 4 972.2 5 178.1 +4.1%
Changes in working capital +261.1 +113.8
Investments -1 263.5 -1 416.1
Operating net cash 3 969.8 3 875.8
Dividends paid -1 870.7 -2 061.4
Acquisitions -166.5 -666.5
Acquisitions of treasury stock -499.2 -499.4
Capital increase +118.3 +135.3
Others (1) -64.5 +66.6
Residual cash flow after acquisitions +1 487.2 +850.4
(1): Others include disposal of treasury stock and purchase of non-controlling interests
8 February 201913
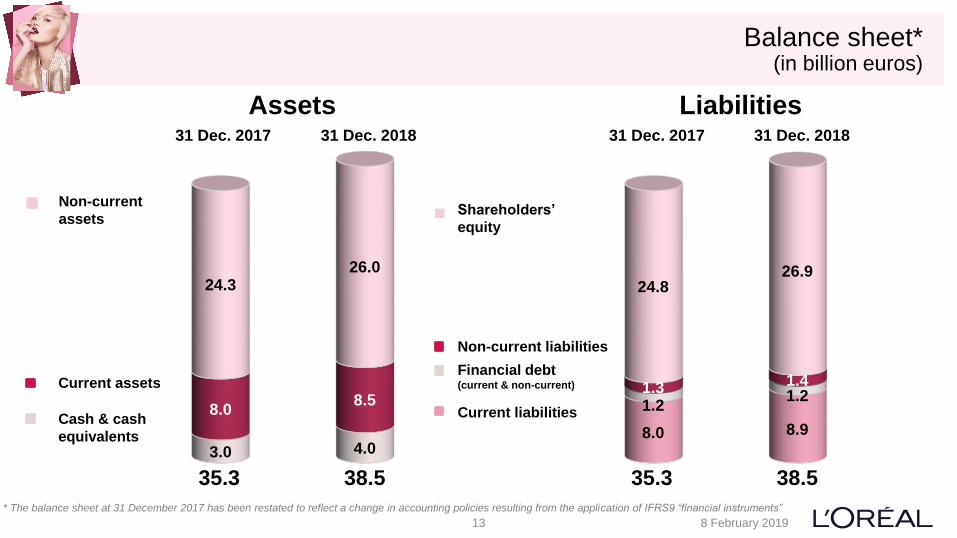
Balance sheet*(in billion euros)
35.3 38.5 35.3 38.5
8.0 8.9
3.0 4.0
1.21.2
8.08.5
1.3 1.4
24.326.0
24.826.9
Assets Liabilities31 Dec. 201731 Dec. 201831 Dec. 2017 31 Dec. 2018
Non-current
assetsShareholders’
equity
Non-current liabilities
Current assetsFinancial debt(current & non-current)
Cash & cash
equivalents
Current liabilities
* The balance sheet at 31 December 2017 has been restated to reflect a change in accounting policies resulting from the application of IFRS9 “financial instruments”
8 February 201914
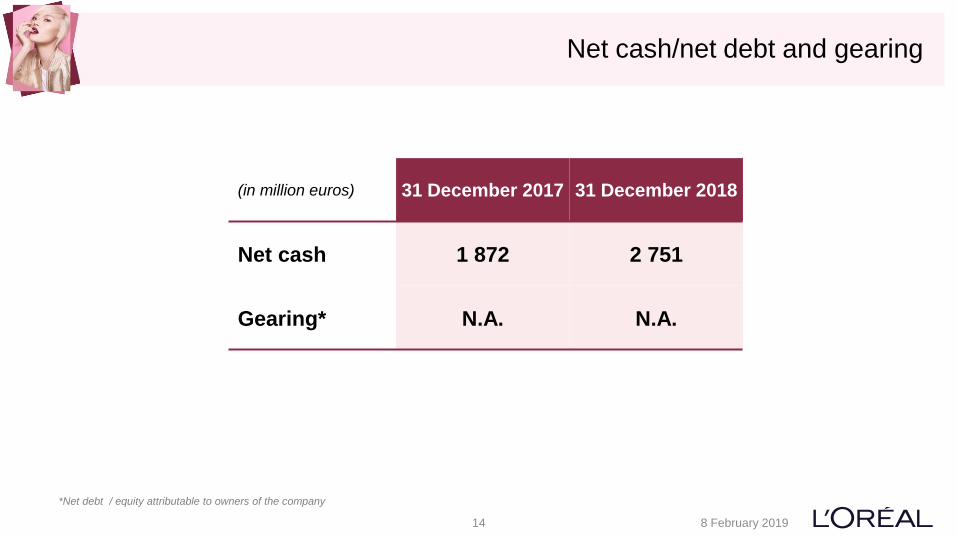
Net cash/net debt and gearing
*Net debt / equity attributable to owners of the company
(in million euros) 31 December 2017 31 December 2018
Net cash 1 872 2 751
Gearing* N.A. N.A.
8 February 201915
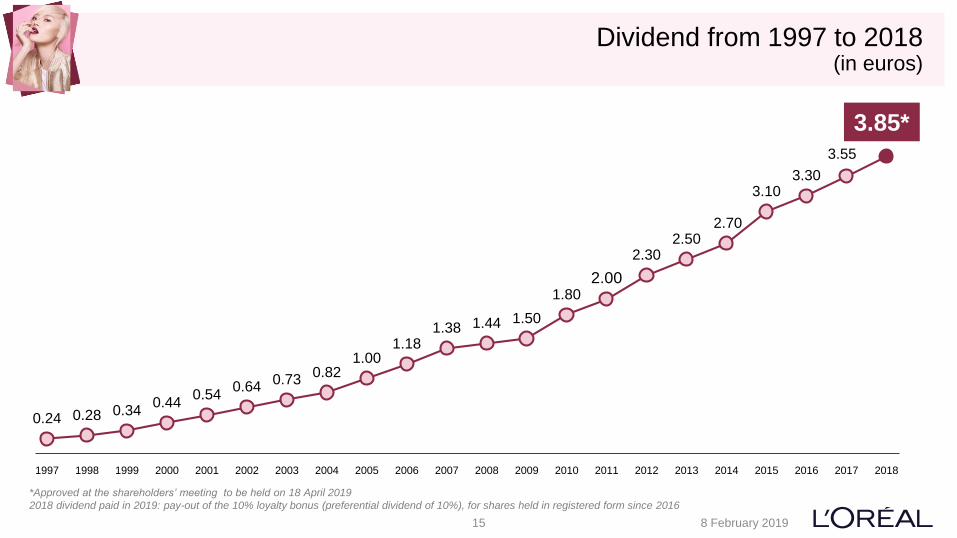
Dividend from 1997 to 2018(in euros)
0.24 0.28 0.340.44
0.540.64
0.730.82
1.001.18
1.38 1.44 1.50
1.802.00
2.302.50
2.70
3.103.30
3.55
1997 1998 1999 2000 2001 2002 2003 2004 2005 2006 2007 2008 2009 2010 2011 2012 2013 2014 2015 2016 2017 2018
3.85*
*Approved at the shareholders’ meeting to be held on 18 April 2019
2018 dividend paid in 2019: pay-out of the 10% loyalty bonus (preferential dividend of 10%), for shares held in registered form since 2016
8 February 201916
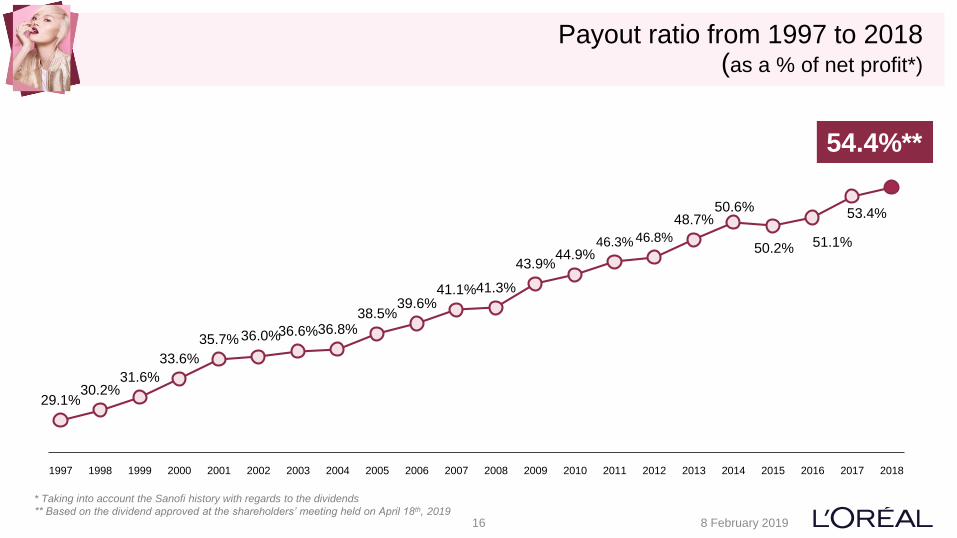
Payout ratio from 1997 to 2018(as a % of net profit*)
29.1%30.2%
31.6%
33.6%
35.7% 36.0%36.6%36.8%38.5%
39.6%41.1%41.3%
43.9%44.9%
46.3% 46.8%
48.7%50.6%
50.2% 51.1%
53.4%
1997 1998 1999 2000 2001 2002 2003 2004 2005 2006 2007 2008 2009 2010 2011 2012 2013 2014 2015 2016 2017 2018
54.4%**
* Taking into account the Sanofi history with regards to the dividends
** Based on the dividend approved at the shareholders’ meeting held on April 18th, 2019
-------------------------Avertissement / Disclaimer -------------------------« Ce document ne constitue pas une offre de vente ou la sollicitation d’une offre d’achat de titres L’Oréal. Si vous souhaitez obtenir des informations plus complètes concernant L’Oréal,
nous vous invitons à vous reporter aux documents publics déposés en France auprès de l’Autorité des Marchés Financiers (également disponibles en version anglaise sur notre site Internet
www.loreal-finance.com).Ce document peut contenir certaines déclarations de nature prévisionnelle. Bien que la Société estime que ces déclarations reposent sur des hypothèses
raisonnables à la date de publication du présent communiqué, elles sont par nature soumises à des risques et incertitudes pouvant donner lieu à un écart entre les chiffres réels et ceux
indiqués ou induits dans ces déclarations.»
"This document does not constitute an offer to sell, or a solicitation of an offer to buy, L’Oréal shares. If you wish to obtain more comprehensive information about L’Oréal, please refer to the
public documents registered in France with the Autorité des Marchés Financiers (which are also available in English on our Internet site: www.loreal-finance.com).This document may contain
some forward-looking statements. Although the Company considers that these statements are based on reasonable hypotheses at the date of publication of this release, they are by their
nature subject to risks and uncertainties which could cause actual results to differ materially from those indicated or projected in these statements."
8 February 201917


![Sample Exercise 14.1 Calculating an Average Rate of … average rate of reaction over this time interval. Plan: The average rate is given by the change in concentration, Δ[A], divided](https://img.pdfslide.us/doc/110x75/5afeed9a7f8b9a994d8facbb/sample-exercise-141-calculating-an-average-rate-of-average-rate-of-reaction.jpg)

![2 Average Rate of Change of f over [a, b]: Difference Quotient The average rate of change of the function f over the interval [a, b] is Average rate of](https://img.pdfslide.us/doc/110x75/56649d6d5503460f94a4cf3b/2-average-rate-of-change-of-f-over-a-b-difference-quotient-the-average.jpg)