Embed Size (px)
Citation preview

HALF-YEAR FINANCIAL REPORT - L’ORÉAL 30TH JUNE, 2016 - 2
Contents
1/ ACTIVITY REPORT . . . . . . . . . . . . . . . . . . . . . . . . . . . . . . . . . . . . . . . . . . . . . . . . . . . 4
1.1. The Group consolidated . . . . . . . . . . . . . . . . . . . . . . . . . . . . . . . . . . . . . . . . . . . . . . . 4 1.2. Segment information . . . . . . . . . . . . . . . . . . . . . . . . . . . . . . . . . . . . . . . . . . . . . . . . . 5 1.3. Important events during the period. . . . . . . . . . . . . . . . . . . . . . . . . . . . . . . . . . . . . . . . . . 7 1.4. Risk factors and transactions between related parties . . . . . . . . . . . . . . . . . . . . . . . . . . . . . . . . 8 1.5. Prospects . . . . . . . . . . . . . . . . . . . . . . . . . . . . . . . . . . . . . . . . . . . . . . . . . . . . . . 8 1.6. Subsequent events . . . . . . . . . . . . . . . . . . . . . . . . . . . . . . . . . . . . . . . . . . . . . . . . . . 8
2/ 2016 CONDENSED CONSOLIDATED FINANCIAL STATEMENTS . . . . . . . . . . . . . . . . . . . . . . . . . . 9
1. Compared Consolidated Income Statements . . . . . . . . . . . . . . . . . . . . . . . . . . . . . . . . . . . . . 9 2. Consolidated Statement of Comprehensive Income . . . . . . . . . . . . . . . . . . . . . . . . . . . . . . . . 11 3. Compared Consolidated Balance Sheets . . . . . . . . . . . . . . . . . . . . . . . . . . . . . . . . . . . . . . 12 4. Consolidated Statements of Changes in Equity . . . . . . . . . . . . . . . . . . . . . . . . . . . . . . . . . . 13 5. Compared Consolidated Statements of Cash Flows . . . . . . . . . . . . . . . . . . . . . . . . . . . . . . . . 15 6. Notes to the Condensed Consolidated Financial Statements. . . . . . . . . . . . . . . . . . . . . . . . . . . . 16
3/ STATUTORY AUDITORS’ REVIEW REPORT ON THE 2016 HALF-YEAR FINANCIAL INFORMATION . . . . 31
4/ DECLARATION BY THE PERSON RESPONSIBLE FOR THE 2016 HALF-YEAR FINANCIAL REPORT . . . . 32
HALF-YEAR FINANCIAL REPORT - L’ORÉAL 30TH JUNE, 2016 - 3
HALF-YEAR FINANCIAL REPORT
_______________
AT JUNE 30TH, 2016
Half-year situation at June 30th, 2016
The following statements have been examined by the Board of Directors of July 28th, 2016 and have been the object of a limited review by the Statutory Auditors.
This is a free translation into English of the L’Oréal 2016 Half-year Financial Report issued in the French language and is provided solely for the convenience of English speaking readers. In case of discrepancy the French version prevails.

HALF-YEAR FINANCIAL REPORT - L’ORÉAL 30TH JUNE, 2016 - 4
1/
ACTIVITY REPORT
It should be noted that L’Oréal’s half-year results are not representative of the full-year results.
1.1. THE GROUP CONSOLIDATED
Like-for-like, i.e. based on a comparable structure and identical
exchange rates, sales growth was +4.2%.
The net impact of changes in the scope of consolidation was +0.3%.
Growth at constant exchange rates was +4.5%. Currency
fluctuations had a negative impact of -3.9%. If the exchange rates
at June 30, 2016, i.e. €1 = $1.1102, are extrapolated until
December 31, 2016 the impact of currency fluctuations on sales
would be approximately -2.9% for the whole of 2016.
Based on reported figures, the Group's sales at June 30, 2016
amounted to 12.89 billion euros, up by +0.6%.
Income tax excluding non-recurring items amounted to 684 million euros, i.e. a tax rate of 25.2%, slightly below that of the first half of 2015, which was 26.1%.
Net profit excluding non-recurring items, after non-controlling interests, amounted to 2,025 million euros, up by +3.5% compared with June 30, 2015. The non-recurring items consist primarily of the goodwill impairment for the Clarisonic and Magic brands, with respective amounts of 234 million and 213 million euros. The recent performances of these two brands have been below expectations, resulting in these accounting entries which have no impact on the cash situation. The strategic relevance of these two brands remains unchanged.
Net EPS, at 3.59 euros, has risen by +3.4% compared with the first half of 2015.
Net profit after non-controlling interests amounted to 1,479 million euros.
1.1.1. CONSOLIDATED INCOME STATEMENTS
Gross profit, at 9,333 million euros, has come out at 72.4% of sales, representing an improvement of 70 basis points compared with the first half of 2015.
Research and Development expenses, at 414 million euros, have risen by +9.1%, representing 3.2% of sales.
Advertising and promotion expenses have come out at 29.4% of sales, a level slightly above the first half of 2015.
Selling, general and administrative expenses are at a slightly higher level, by 10 basis points, compared with the first half of 2015.
Overall, operating profit, at 2,364 million euros, increased by 20 basis points and amounted to 18.3% of sales.
Overall finance costs were close to zero.
Sanofi dividends amounted to 346 million euros.
1.1.2. CASH FLOW STATEMENTS/BALANCE SHEET
Gross cash flow amounted to 2,467 million euros, up by +4.1% compared with the first half of 2015.
The change in working capital amounted to 545 million euros. As is the case in the first half every year, it increased markedly, particularly because of the impact of the seasonality of part of our business on trade receivables.
Investments, at 596 million euros, represented 4.6% of sales.
Operating cash flow, at 1,325 million euros, was up by +27.2%.
After payment of the dividend and share buybacks, the residual cash flow has come out at -923 million euros.
At June 30, 2016, net debt amounted to 344 million euros, compared with a debt of 1,394 million at June 30, 2015 and net cash of 618 million euros at December 31, 2015.
Shareholders' equity amounted to 22 billion euros.
Activity Report
HALF-YEAR FINANCIAL REPORT - L’ORÉAL 30TH JUNE, 2016 - 5
1.2. SEGMENT INFORMATION
1.2.1. TURNOVER BY OPERATIONAL DIVISION
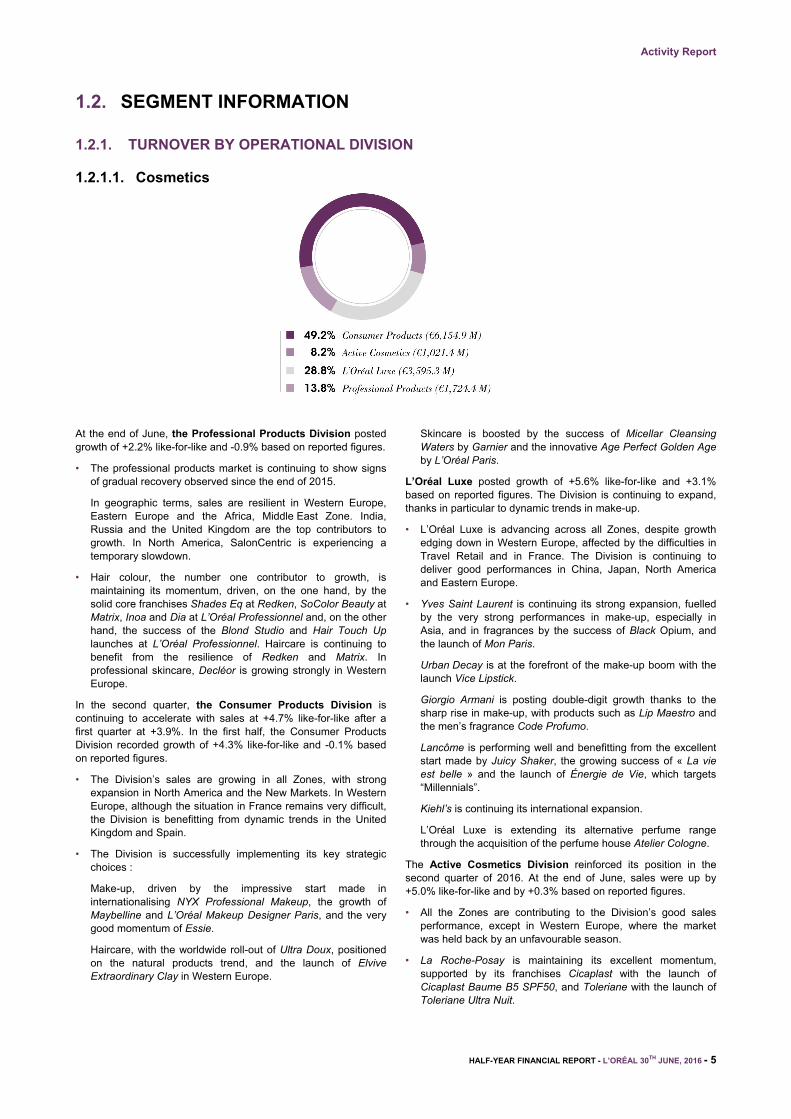
1.2.1.1. Cosmetics
At the end of June, the Professional Products Division posted growth of +2.2% like-for-like and -0.9% based on reported figures.
• The professional products market is continuing to show signs of gradual recovery observed since the end of 2015.
In geographic terms, sales are resilient in Western Europe, Eastern Europe and the Africa, Middle East Zone. India, Russia and the United Kingdom are the top contributors to growth. In North America, SalonCentric is experiencing a temporary slowdown.
• Hair colour, the number one contributor to growth, is maintaining its momentum, driven, on the one hand, by the solid core franchises Shades Eq at Redken, SoColor Beauty at Matrix, Inoa and Dia at L’Oréal Professionnel and, on the other hand, the success of the Blond Studio and Hair Touch Up launches at L’Oréal Professionnel. Haircare is continuing to benefit from the resilience of Redken and Matrix. In professional skincare, Decléor is growing strongly in Western Europe.
In the second quarter, the Consumer Products Division is continuing to accelerate with sales at +4.7% like-for-like after a first quarter at +3.9%. In the first half, the Consumer Products Division recorded growth of +4.3% like-for-like and -0.1% based on reported figures.
• The Division’s sales are growing in all Zones, with strong expansion in North America and the New Markets. In Western Europe, although the situation in France remains very difficult, the Division is benefitting from dynamic trends in the United Kingdom and Spain.
• The Division is successfully implementing its key strategic choices :
Make-up, driven by the impressive start made in internationalising NYX Professional Makeup, the growth of Maybelline and L’Oréal Makeup Designer Paris, and the very good momentum of Essie.
Haircare, with the worldwide roll-out of Ultra Doux, positioned on the natural products trend, and the launch of Elvive Extraordinary Clay in Western Europe.
Skincare is boosted by the success of Micellar Cleansing Waters by Garnier and the innovative Age Perfect Golden Age by L’Oréal Paris.
L’Oréal Luxe posted growth of +5.6% like-for-like and +3.1% based on reported figures. The Division is continuing to expand, thanks in particular to dynamic trends in make-up.
• L’Oréal Luxe is advancing across all Zones, despite growth edging down in Western Europe, affected by the difficulties in Travel Retail and in France. The Division is continuing to deliver good performances in China, Japan, North America and Eastern Europe.
• Yves Saint Laurent is continuing its strong expansion, fuelled by the very strong performances in make-up, especially in Asia, and in fragrances by the success of Black Opium, and the launch of Mon Paris.
Urban Decay is at the forefront of the make-up boom with the launch Vice Lipstick.
Giorgio Armani is posting double-digit growth thanks to the sharp rise in make-up, with products such as Lip Maestro and the men’s fragrance Code Profumo.
Lancôme is performing well and benefitting from the excellent start made by Juicy Shaker, the growing success of « La vie est belle » and the launch of Énergie de Vie, which targets “Millennials”.
Kiehl’s is continuing its international expansion.
L’Oréal Luxe is extending its alternative perfume range through the acquisition of the perfume house Atelier Cologne.
The Active Cosmetics Division reinforced its position in the second quarter of 2016. At the end of June, sales were up by +5.0% like-for-like and by +0.3% based on reported figures.
• All the Zones are contributing to the Division’s good sales performance, except in Western Europe, where the market was held back by an unfavourable season.
• La Roche-Posay is maintaining its excellent momentum, supported by its franchises Cicaplast with the launch of Cicaplast Baume B5 SPF50, and Toleriane with the launch of Toleriane Ultra Nuit.
Activity Report
HALF-YEAR FINANCIAL REPORT - L’ORÉAL 30TH JUNE, 2016 - 6
Vichy is benefitting from its Neovadiol franchise and its spa waters.
SkinCeuticals is posting outstanding performances, particularly in Asia and Eastern Europe, and the success of its Triple Lipid Restore launch is continuing.
1.2.1.2. The Body Shop
At the end of June 2016, The Body Shop recorded sales growth of -0.6% like-for-like and -3.2% based on reported figures. Expansion is continuing in the main markets, such as the United Kingdom, Australia and Canada, while the economic slowdown in Hong Kong and Saudi Arabia is having an impact on business. At June 30, 2016, the brand is available in 3,047 sales outlets.
1.2.2. OPERATING PROFIT BY OPERATIONAL DIVISION
06/30/15 12/31/15 06/30/16
€m % of sales €m % of sales €m % of sales
By operational Division
Professional Products 332.0 19.1% 678.5 20.0% 338.2 19.6%
Consumer Products 1,313.1 21.3% 2,385.8 20.1% 1,306.8 21.2%
L’Oréal Luxe 716.0 20.5% 1,497.5 20.7% 767.3 21.3%
Active Cosmetics 280.2 27.5% 414.7 22.8% 283.3 27.7%
Total Divisions before non-allocated 2,641.3 21.3% 4,976.4 20.5% 2,695.5 21.6%
Non-allocated(1) -311.1 -2.5% -643.6 -2.6% -309.8 -2.5%
Total Divisions after non-allocated 2,330.2 18.8% 4,332.8 17.8% 2,385.7 19.1%
The Body Shop -7.2 -1.8% +54.8 5.7% -22.2 -5.6%
Group 2,323.0 18.1% 4,387.7 17.4% 2,363.6 18.3%
(1) Non-allocated expenses = Central Group expenses, fundamental research expenses, stock options and free grant of shares expenses and
miscellaneous items. As a % of total Division sales.
The profitability of the Professional Products Division has improved by 50 basis points, from 19.1% to 19.6%.
The Consumer Products Division’s profitability slipped from 21.3% to 21.2%.
L’Oréal Luxe was the Division with the strongest profitability improvement, with an increase of 80 basis points to 21.3%.
The Active Cosmetics Division, with a profitability of 27.7%, achieved an improvement of 20 basis points.
As for The Body Shop, the first half is never significant in profitability terms. The negative figure in the first half reflects difficulties in certain major markets, such as Hong Kong and Saudi Arabia, along with the investment efforts made to reaccelerate the brand.
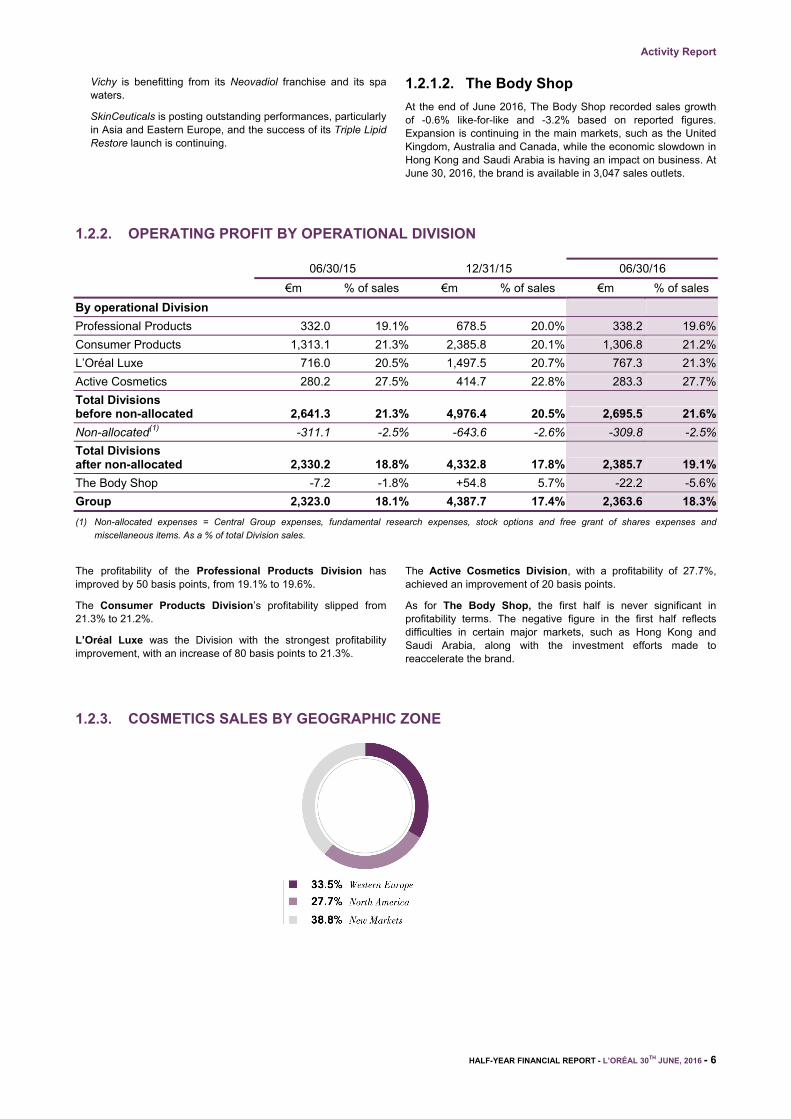
1.2.3. COSMETICS SALES BY GEOGRAPHIC ZONE
Activity Report
HALF-YEAR FINANCIAL REPORT - L’ORÉAL 30TH JUNE, 2016 - 7
1.2.3.1. Western Europe
At the end of June, the Zone posted growth of +1.7% like-for-like and +0.6% based on reported figures. Business showed mixed momentum, both in terms of the markets and sales figures: performance is good in all markets except France, which remains difficult in all distribution channels.
In the highly dynamic make-up category, NYX Professional Makeup is making a very promising start.
E-commerce sales are continuing to grow very quickly.
1.2.3.2. North America
L’Oréal recorded growth of +4.6% like-for-like and +4.0% based on reported figures. The Consumer Products Division is outperforming the market with strong increases for NYX Professional Makeup, Maybelline and Garnier, whose Whole Blends (Ultra Doux) launch is making a good start. Despite difficulties at Clarisonic, L’Oréal Luxe is posting good performances, driven by the quality of its brand portfolio: Urban Decay, Yves Saint Laurent and Kiehl’s are invigorating their respective categories.
1.2.3.3. New Markets
• Asia, Pacific: L'Oréal’s growth amounted to +4.6% like-for-like and +1.0% based on reported figures. Thanks to growth, which remains strong, particularly in China, L’Oréal Luxe is maintaining its momentum, supported by the good performances of the Yves Saint Laurent and Giorgio Armani brands. The Consumer Products Division is being driven by the launch of Ultra Doux in China and India, and by the roll-out
of the Garnier brand in Southern Asia. Growth is being fuelled by the vitality of Southern Asia; Northern Asia however is still being held back by a less dynamic market, particularly in Hong Kong, and by the difficulties of the Magic brand in China. The Active Cosmetics Division is growing strongly thanks to the expansion of La Roche-Posay.
• Latin America: The Zone recorded double-digit growth, at +10.8% like-for-like and -9.1% based on reported figures. Growth was double-digit in Spanish-speaking America, boosted by good performances from all the Consumer Products Division brands, especially Maybelline, L’Oréal Paris and Vogue. Brazil is overcoming the effects of the IPI fiscal reform in 2015, and is returning to growth with accelerating sales for the Niely and La Roche-Posay brands.
• Eastern Europe: The Zone posted growth of +8.9% like-for-like and -3.7% based on reported figures. The Professional Products and L’Oréal Luxe Divisions are continuing to record strong growth, while the Consumer Products Division is continuing to grow, particularly in Russia, but is slowing in Turkey. Overall, these three Divisions are gaining market share across the whole Zone. Russia, Ukraine and Kazakhstan are the growth drivers. Business is also sustained in Poland, the Czech Republic and Hungary.
• Africa, Middle East: Growth amounted to +9.7% like-for-like and +5.3% based on reported figures. In a slowing market, the Middle East is posting solid growth, driven by Egypt, Pakistan and to a lesser extent the Gulf states. All the Divisions are winning market share.
Meanwhile in South Africa, the launch of Ultimate Blends (Ultra Doux) by Garnier has led to promising initial results.
1.3. IMPORTANT EVENTS DURING THE PERIOD
• On January 4th, 2016, L’Oréal USA announced the acquisition of Raylon Corporation, a full-service wholesale distributor of salon professional products. The acquisition expands the SalonCentric distribution network and extends coverage of American hair salons.
• Between February 15th and March 18th, 2016, L’Oréal purchased 3,202,500 of its own shares for the purpose of their cancellation, in accordance with the authorisation approved by the Annual General Meeting of April 22nd, 2015, and with the decision of the Board of Directors of February 11th, 2016.
• On April 18, 2016, L’Oréal announced the appointment of Mr Alexis Perakis-Valat as President Consumer Products Division, to replace Mr Marc Menesguen who is to retire at the start of 2017. Mr Jochen Zaumseil will replace Mr Perakis-Valat as Executive Vice-President Asia, Pacific Zone. Mr Vianney Derville will replace Mr Zaumseil as Executive Vice-President Western Europe Zone. The appointments are effective from September 1, 2016.
• On April 20, 2016, the Annual General Meeting of L’Oréal shareholders appointed two new Directors: Mrs Béatrice Guillaume-Grabisch and Mrs Eileen Naughton; and renewed the tenure as Director of Mr Jean-Pierre Meyers, Mr Jean-Victor Meyers and Mr Bernard Kasriel.
• On April 20, 2016, the Board of Directors’ meeting, held at the close of the Annual General Meeting, decided, pursuant to the authorisation voted by the Annual General Meeting on the same day, on the cancellation of 3,202,500 shares acquired within the scope of the share buyback programme decided by the Board of Directors on February 11, 2016. The shares were cancelled on June 30, 2016. The share capital of L’Oréal as of June 30, 2016, amounted to 112,182,708 euros, divided into 560,913,540 shares with a par value of 0.2 euro each.
• On June 30, 2016, L’Oréal announced the signing of an agreement to acquire Atelier Cologne, which specialises in niche perfumery and is sold in selected retailers. This brand will complement the L’Oréal Luxe brand portfolio. This acquisition was completed on July 25, 2016.

Activity Report
HALF-YEAR FINANCIAL REPORT - L’ORÉAL 30TH JUNE, 2016 - 8
1.4. RISK FACTORS AND TRANSACTIONS BETWEEN RELATED PARTIES
1.4.1. RISK FACTORS
Risk factors are similar to those presented in the volume 1.9 of the 2015 Registration Document (pages 40 to 48) and did not change significantly during the first half-year of 2016. The amounts relating to market and financial risks at June 30th, 2016 are described in the note 8 in section “Notes to financial statements” of this Half-year Report.
1.4.2. TRANSACTIONS BETWEEN RELATED PARTIES
Transactions between the companies consolidated under the equity method do not represent a significant amount at June 30th, 2016. Furthermore, during the first six months of 2016, there was no significant transaction concluded with a member of the senior management or with a shareholder having a material influence on the Group.
1.5. PROSPECTS
At the end of June, the Group is confirming its growth momentum, with an increase in sales across all Divisions and all geographic Zones.
As announced, the Consumer Products Division is accelerating, and outperforming its market, driven by its conquest initiatives in make-up and haircare.
L’Oréal Luxe, in a market that remains solid, is continuing to deliver sustained growth by capitalising on its unique brand portfolio and by maintaining its innovation drive. The Active Cosmetics Division, in a dermocosmetics market that has slowed due to an unfavourable season, is developing its major product ranges and continues to increase its market share. The Professional Products Division is pursuing its initiatives to actively promote all professional beauty segments, in a sector that is gradually improving.
As for the geographic Zones, North America is accelerating as expected and robust growth in the New Markets is enabling us to strengthen our positions. Western Europe is being held back by a very difficult market in France.
In the first half, e-commerce sales(1) rose by +33%, accounting for some 6% of total sales. The Group is at the cutting edge of online
beauty, and is accentuating its digital leadership, particularly in make-up, a category that is accelerating strongly, driven worldwide by the “Millennials” generation.
The results are of good quality, with a significant improvement in gross profit and sustained investments in both Research and Innovation and business drivers, supporting the Universalisation of the brands.
The outstanding performances of recent acquisitions, NYX Professional Makeup, Urban Decay and Niely, are making a very positive contribution to the Group’s growth. On the other hand, the results of Magic and Clarisonic were below expectations, and have led L’Oréal to record a goodwill impairment of 213 million and 234 million euros respectively, on June 30, 2016. The impairment is a non-recurring charge and has no impact on the cash situation. The strategic relevance of these two brands remains unchanged.
In an environment that is still volatile and uncertain, particularly on the monetary front, L’Oréal’s strength, today more than ever, lies in its balanced business model. The first half reinforces our confidence in the Group’s ability to outperform its market, and to achieve another year of sales and profit growth in 2016.
1.6. SUBSEQUENT EVENTS
On July 13, 2016, L’Oréal made a firm offer to the Rivadis group for the acquisition of Société des Thermes de Saint-Gervais-les-Bains and the licence of the Saint-Gervais Mont Blanc brand. Saint-Gervais Mont Blanc products, with Mont-Blanc spa water, cover a wide range of face and body care and protection needs.
On July 22, 2016, L’Oréal announced the signing of a definitive agreement to acquire IT Cosmetics, one of the fastest growing prestige beauty brands in the United States.
(1) Sales achieved on our brands’ own websites + estimated sales achieved by our brands corresponding to sales through our retailers’ websites (non-
audited data); like-for-like growth.
HALF-YEAR FINANCIAL REPORT - L’ORÉAL 30TH JUNE, 2016 - 9
2/
2016 CONDENSED CONSOLIDATED FINANCIAL STATEMENTS
1. Compared consolidated Income Statements . . . . . . . . . . . . . . . . . . . . . . . . . . . . . . . . . . . . . . . 10
2. Consolidated Statement of Comprehensive Income . . . . . . . . . . . . . . . . . . . . . . . . . . . . . . . . . . . . 11
3. Compared Consolidated Balance Sheets . . . . . . . . . . . . . . . . . . . . . . . . . . . . . . . . . . . . . . . . . 12
4. Consolidated Statements of Changes in Equity . . . . . . . . . . . . . . . . . . . . . . . . . . . . . . . . . . . . . . 13
5. Compared Consolidated Statements of Cash Flows . . . . . . . . . . . . . . . . . . . . . . . . . . . . . . . . . . . . 15
6. Notes to the Condensed Consolidated Financial Statements . . . . . . . . . . . . . . . . . . . . . . . . . . . . . . . 16

2016 Condensed Consolidated Financial Statement
HALF-YEAR FINANCIAL REPORT - L’ORÉAL 30TH JUNE, 2016 - 10
1. COMPARED CONSOLIDATED INCOME STATEMENTS
€ millions Notes 1st half 2016 1st half 2015 2015
Net sales 3.1 12,894.6 12,818.9 25,257.4
Cost of sales -3,561.2 -3,630.3 -7,277.4
Gross profit 9,333.4 9,188.6 17,980.0
Research and development -414.2 -379.7 -794.1
Advertising and promotion -3,790.9 -3,753.3 -7,359.6
Selling, general and administrative expenses -2,764.7 -2,732.6 -5,438.6
Operating profit 3.1 2,363.6 2,323.0 4,387.7
Other income and expenses 4.1 -522.5 -47.9 -193.4
Operational profit 1,841.1 2,275.1 4,194.3
Finance costs on gross debt -6.5 -13.6 -23.7
Finance income on cash and cash equivalents 22.0 27.6 55.6
Finance costs, net 15.5 14.0 31.9
Other financial income (expenses) -13.7 -23.8 -45.7
Sanofi dividends 346.5 336.9 336.9
Profit before tax and associates 2,189.4 2,602.2 4,517.4
Income tax -707.6 -721.7 -1,222.9
Share of profit in associates - 2.7 4.0
Net profit 1,481.8 1,883.2 3,298.5
Attributable to:
• owners of the company 1,479.5 1,882.6 3,297.4
• non-controlling interests 2.3 0.6 1.1
Earnings per share attributable to owners of the company (euros) 9.3 2.65 3.39 5.92
Diluted earnings per share attributable to owners of the company (euros) 9.3 2.62 3.34 5.84
Earnings per share attributable to owners of the company, excluding non-recurring items (euros) 9.3 3.62 3.52 6.26
Diluted earnings per share attributable to owners of the company, excluding non-recurring items (euros) 9.3 3.59 3.47 6.18

2016 Condensed Consolidated Financial Statement
HALF-YEAR FINANCIAL REPORT - L’ORÉAL 30TH JUNE, 2016 - 11
2. CONSOLIDATED STATEMENT OF COMPREHENSIVE INCOME
€ millions Notes 1st half 2016 1st half 2015 2015
Consolidated net profit for the period 1,481.8 1,883.2 3,298.5
Financial assets available-for-sale 7.3 -435.1 1,487.3 347.6
Cash flow hedges -96.8 -80.0 60.1
Cumulative translation adjustments -188.7 507.8 373.7
Income tax on items that may be reclassified to profit or loss (1) 50.3 -35.7 -28.9
Items that may be reclassified to profit or loss -670.3 1,879.4 752.5
Actuarial gains and losses 5.1 -514.1 345.7 598.1
Income tax on items that may not be reclassified to profit or loss (1) 164.1 -119.4 -205.3
Items that may not be reclassified to profit or loss -350.0 226.3 392.8
Other comprehensive income -1,020.3 2,105.7 1,145.3
Consolidated comprehensive income 461.5 3,988.9 4,443.8
Attributable to:
• owners of the company 458.7 3,988.7 4,443.1
• non-controlling interests 2.8 0.2 0.7
(1) The tax effect is as follows:
€ millions 1st half 2016 1st half 2015 2015
Financial assets available-for-sale 18.0 -61.5 -14.4
Cash flow hedges 32.3 25.8 -14.4
Items that may be reclassified to profit or loss 50.3 -35.7 -28.9
Actuarial gains and losses 164.1 -119.4 -205.3
Items that may not be reclassified to profit or loss 164.1 -119.4 -205.3
TOTAL 214.4 -155.1 -234.1
2016 Condensed Consolidated Financial Statement
HALF-YEAR FINANCIAL REPORT - L’ORÉAL 30TH JUNE, 2016 - 12
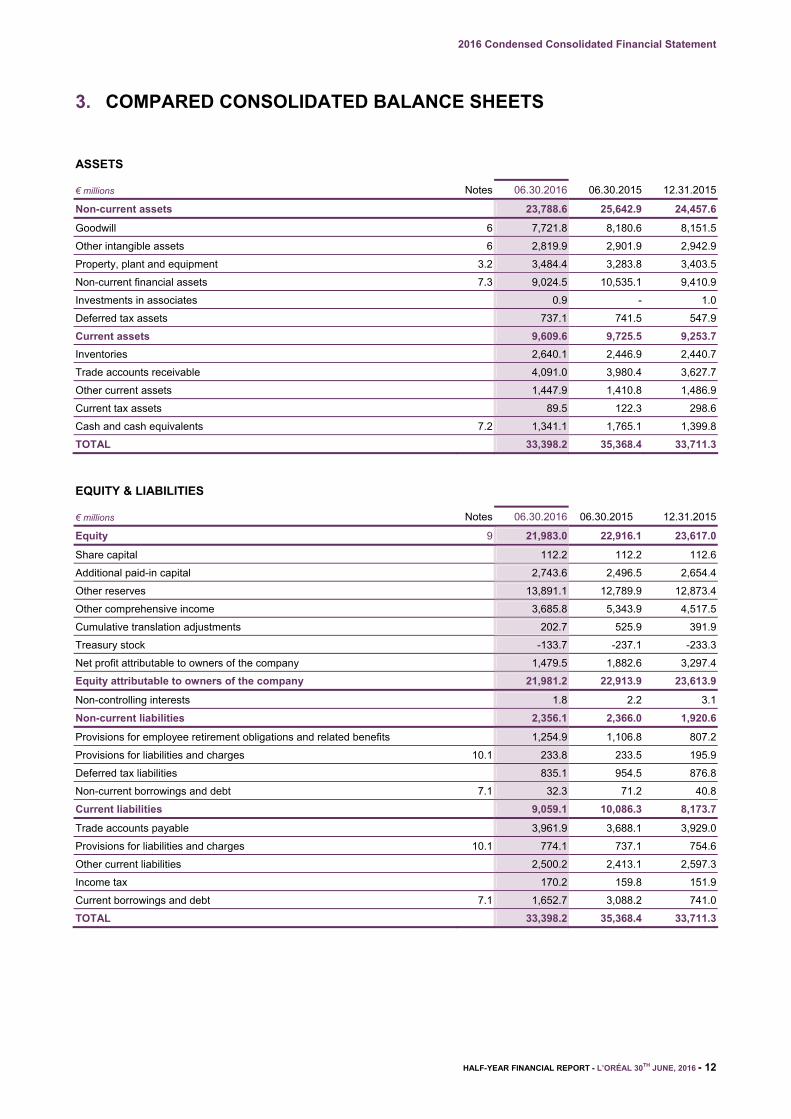
3. COMPARED CONSOLIDATED BALANCE SHEETS
ASSETS
€ millions Notes 06.30.2016 06.30.2015 12.31.2015
Non-current assets 23,788.6 25,642.9 24,457.6
Goodwill 6 7,721.8 8,180.6 8,151.5
Other intangible assets 6 2,819.9 2,901.9 2,942.9
Property, plant and equipment 3.2 3,484.4 3,283.8 3,403.5
Non-current financial assets 7.3 9,024.5 10,535.1 9,410.9
Investments in associates 0.9 - 1.0
Deferred tax assets 737.1 741.5 547.9
Current assets 9,609.6 9,725.5 9,253.7
Inventories 2,640.1 2,446.9 2,440.7
Trade accounts receivable 4,091.0 3,980.4 3,627.7
Other current assets 1,447.9 1,410.8 1,486.9
Current tax assets 89.5 122.3 298.6
Cash and cash equivalents 7.2 1,341.1 1,765.1 1,399.8
TOTAL 33,398.2 35,368.4 33,711.3
EQUITY & LIABILITIES
€ millions Notes 06.30.2016 06.30.2015 12.31.2015
Equity 9 21,983.0 22,916.1 23,617.0
Share capital 112.2 112.2 112.6
Additional paid-in capital 2,743.6 2,496.5 2,654.4
Other reserves 13,891.1 12,789.9 12,873.4
Other comprehensive income 3,685.8 5,343.9 4,517.5
Cumulative translation adjustments 202.7 525.9 391.9
Treasury stock -133.7 -237.1 -233.3
Net profit attributable to owners of the company 1,479.5 1,882.6 3,297.4
Equity attributable to owners of the company 21,981.2 22,913.9 23,613.9
Non-controlling interests 1.8 2.2 3.1
Non-current liabilities 2,356.1 2,366.0 1,920.6
Provisions for employee retirement obligations and related benefits 1,254.9 1,106.8 807.2
Provisions for liabilities and charges 10.1 233.8 233.5 195.9
Deferred tax liabilities 835.1 954.5 876.8
Non-current borrowings and debt 7.1 32.3 71.2 40.8
Current liabilities 9,059.1 10,086.3 8,173.7
Trade accounts payable 3,961.9 3,688.1 3,929.0
Provisions for liabilities and charges 10.1 774.1 737.1 754.6
Other current liabilities 2,500.2 2,413.1 2,597.3
Income tax 170.2 159.8 151.9
Current borrowings and debt 7.1 1,652.7 3,088.2 741.0
TOTAL 33,398.2 35,368.4 33,711.3

2016 Condensed Consolidated Financial Statement
HALF-YEAR FINANCIAL REPORT - L’ORÉAL 30TH JUNE, 2016 - 13
4. CONSOLIDATED STATEMENTS OF CHANGES IN EQUITY
€ millions
Common
shares
outstanding
Share
capital
Additional
paid-in
capital
Retained
earnings
and net
profit
Other
comprehensive
income
Treasury
stock
Cumulative
translation
adjustments
Equity
attributable to
owners of the
company
Non-
control-
ling
interests
Total
equity
At 12.31.2014 554,241,878 112.3 2,316.8 14,683.5 3,745.9 -683.0 17.8 20,193.3 3.6 20,196.9
Consolidated net profit for the period 3,297.4 3,297.4 1.1 3,298.5
Financial assets available-for-sale 333.2 333.2 333.2
Cash flow hedges 45.6 45.6 45.6
Cumulative translation adjustments 374.1 374.1 -0.4 373.7
Other comprehensive income that
may be reclassified to profit and
loss 378.8 374.1 752.9 -0.4 752.5
Actuarial gains and losses 392.8 392.8 392.8
Other comprehensive income that
may not be reclassified to profit
and loss 392.8 392.8 - 392.8
Consolidated
comprehensive income 3,297.4 771.6 374.1 4,443.1 0.7 4,443.8
Capital increase 4,657,959 0.9 337.6 338.5 338.5
Cancellation of Treasury stock -0.6 -362.8 363.4 - -
Dividends paid
(not paid on Treasury stock) -1,511.4 -1,511.4 -2.6 -1,514.0
Share-based payment 117.6 117.6 117.6
Net changes in Treasury stock 1,088,341 -77.1 86.3 9.2 9.2
Purchase commitments for non-
controlling interests 23.5 23.5 1.5 25.0
Changes in scope of consolidation - -
Other movements 0.1 0.1 -0.1 -
At 12.31.2015 559,988,178 112.6 2,654.4 16,170.8 4,517.5 -233.3 391.9 23,613.9 3.1 23,617.0
Consolidated net profit for the period 1,479.5 1,479.5 2.3 1,481.8
Financial assets available-for-sale -417.1 -417.1 -417.1
Cash flow hedges -64.5 -64.5 -64.5
Cumulative translation adjustments -189.2 -189.2 0.5 -188.7
Other comprehensive income that
may be reclassified to profit and loss -481.6 -189.2 -670.8 0.5 -670.3
Actuarial gains and losses -350.0 -350.0 -350.0
Other comprehensive income that
may not be reclassified to profit
and loss -350.0 -350.0 - -350.0
Consolidated
comprehensive income 1,479.5 -831.6 -189.2 458.7 2.8 461.5
Capital increase 1,132,692 0.2 89.2 89.3 89.3
Cancellation of Treasury stock -3,202,500 -0.6 -498.9 499.5 - -
Dividends paid
(not paid on Treasury stock) -1,741.9 -1,741.9 -3.3 -1,745.2
Share-based payment 61.2 61.2 61.2
Net changes in Treasury stock 1,237,285 -99.2 -399.9 -499.1 -499.1
Purchase commitments
for non-controlling interests - 0.1 0.1
Changes in scope of consolidation -1.1 -1.1 -0.9 -2.0
Other movements 0.2 0.2 0.2
AT 06.30.2016 559,155,655 112.2 2,743.6 15,370.6 3,685.8 -133.7 202.7 21,981.2 1.8 21,983.0
2016 Condensed Consolidated Financial Statement
HALF-YEAR FINANCIAL REPORT - L’ORÉAL 30TH JUNE, 2016 - 14
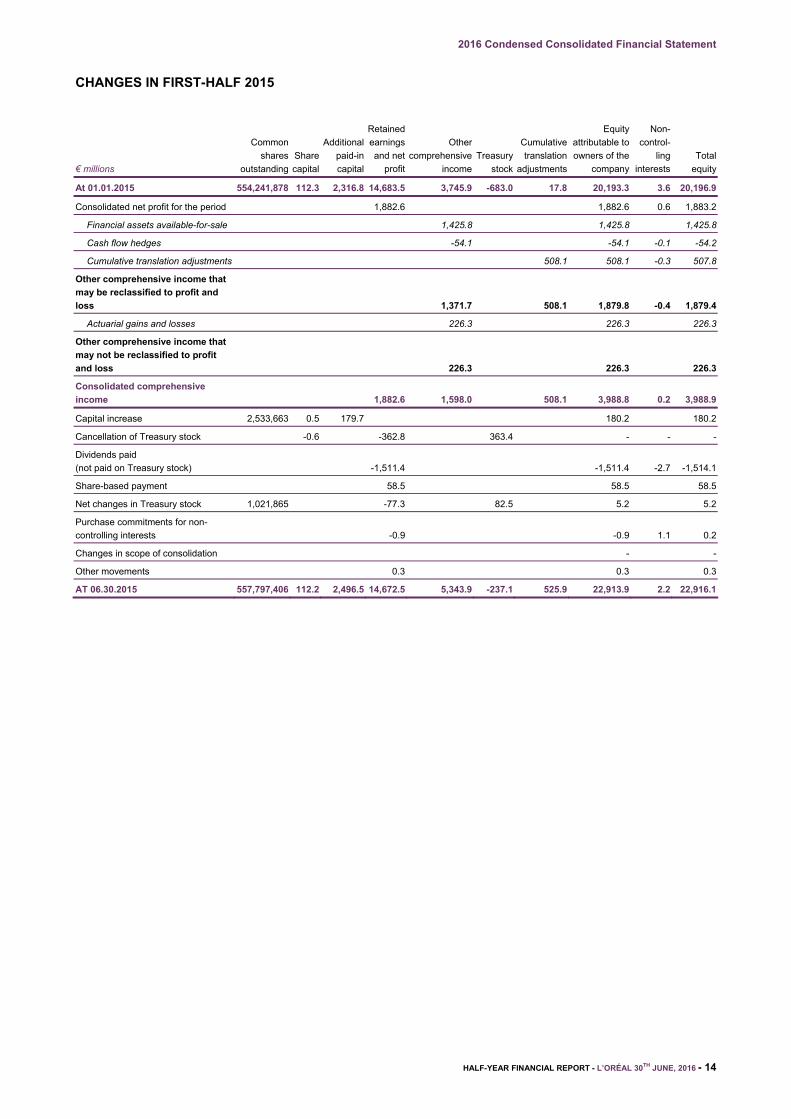
CHANGES IN FIRST-HALF 2015
€ millions
Common
shares
outstanding
Share
capital
Additional
paid-in
capital
Retained
earnings
and net
profit
Other
comprehensive
income
Treasury
stock
Cumulative
translation
adjustments
Equity
attributable to
owners of the
company
Non-
control-
ling
interests
Total
equity
At 01.01.2015 554,241,878 112.3 2,316.8 14,683.5 3,745.9 -683.0 17.8 20,193.3 3.6 20,196.9
Consolidated net profit for the period 1,882.6 1,882.6 0.6 1,883.2
Financial assets available-for-sale 1,425.8 1,425.8 1,425.8
Cash flow hedges -54.1 -54.1 -0.1 -54.2
Cumulative translation adjustments 508.1 508.1 -0.3 507.8
Other comprehensive income that
may be reclassified to profit and
loss 1,371.7 508.1 1,879.8 -0.4 1,879.4
Actuarial gains and losses 226.3 226.3 226.3
Other comprehensive income that
may not be reclassified to profit
and loss 226.3 226.3 226.3
Consolidated comprehensive
income 1,882.6 1,598.0 508.1 3,988.8 0.2 3,988.9
Capital increase 2,533,663 0.5 179.7 180.2 180.2
Cancellation of Treasury stock -0.6 -362.8 363.4 - - -
Dividends paid
(not paid on Treasury stock) -1,511.4 -1,511.4 -2.7 -1,514.1
Share-based payment 58.5 58.5 58.5
Net changes in Treasury stock 1,021,865 -77.3 82.5 5.2 5.2
Purchase commitments for non-
controlling interests -0.9 -0.9 1.1 0.2
Changes in scope of consolidation - -
Other movements 0.3 0.3 0.3
AT 06.30.2015 557,797,406 112.2 2,496.5 14,672.5 5,343.9 -237.1 525.9 22,913.9 2.2 22,916.1

2016 Condensed Consolidated Financial Statement
HALF-YEAR FINANCIAL REPORT - L’ORÉAL 30TH JUNE, 2016 - 15
5. COMPARED CONSOLIDATED STATEMENTS OF CASH FLOWS
€ millions Notes 1st half 2016 1st half 2015 2015
Cash flows from operating activities
Net profit attributable to owners of the company 1,479.5 1,882.6 3,297.4
Non-controlling interests 2.3 0.6 1.1
Elimination of expenses and income with no impact on cash flows:
• depreciation, amortisation and provisions 888.2 410.2 933.8
• changes in deferred taxes 35.2 20.6 53.4
• share-based payment (including free shares) 61.2 58.5 117.6
• capital gains and losses on disposals of assets 1.3 0.2 0.2
Share of profit in associates net of dividends received - -2.7 -4.0
Gross cash flow 2,467.7 2,370.0 4,399.5
Changes in working capital -545.6 -815.9 -196.4
Net cash provided by operating activities (A) 1,922.1 1,554.1 4,203.1
Cash flows from investing activities
Purchases of property, plant and equipment and intangible assets -596.7 -512.0 -1,172.1
Disposals of property, plant and equipment and intangible assets 6.3 5.7 6.5
Changes in other financial assets (including investments in non-consolidated companies) -21.8 13.2 -35.2
Effect of changes in the scope of consolidation -20.7 -412.8 -435.3
Net cash (used in) from investing activities (B) -632.9 -905.9 -1,636.1
Cash flows from financing activities
Dividends paid -1,796.6 -1,535.0 -1,534.8
Capital increase of the parent company 89.4 180.2 338.6
Disposal (acquisition) of Treasury stock -499.1 5.2 9.2
Purchase of non-controlling interests -6.4 - -
Issuance (repayment) of short-term loans 897.5 553.7 -1,832.4
Issuance of long-term borrowings 0.6 - 1.1
Repayment of long-term borrowings -4.2 -5.9 -5.8
Net cash (used in) from financing activities (C) -1,318.8 -801.8 -3,024.1
Net effect of changes in exchange rates and fair value (D) -29.1 1.7 -60.1
Change in cash and cash equivalents (A+B+C+D) -58.7 -151.9 -517.2
Cash and cash equivalents at beginning of the year (E) 1,399.8 1,917.0 1,917.0
CASH AND CASH EQUIVALENTS AT THE END OF THE PERIOD (A+B+C+D+E) 7.2 1,341.1 1,765.1 1,399.8
Income taxes paid amount to €439.6 million, €693.6 million and €1,398.9 million, respectively for first-half 2016, first-half 2015 and year 2015.
Interests paid amount to €6.8 million, €13.8 million and €23.9 million, respectively for for first-half 2016, first-half 2015 and year 2015.
Dividends received amount to €346.5 million, €336.9 million and €336.9 million respectively for first-half 2016, first-half 2015 and year 2015, and are included within gross cash flow.

2016 Condensed Consolidated Financial Statement
HALF-YEAR FINANCIAL REPORT - L’ORÉAL 30TH JUNE, 2016 - 16
6. NOTES TO THE CONDENSED CONSOLIDATED FINANCIAL STATEMENTS
Notes contents
Note 1 Accounting principles . . . . . . . . . . . . . . . . . . . . . . . . . . . . . . . . . . . . . . . . . . . . . . . . 17
Note 2 Main events of the period . . . . . . . . . . . . . . . . . . . . . . . . . . . . . . . . . . . . . . . . . . . . . . 17
Note 3 Operating items - Segment information . . . . . . . . . . . . . . . . . . . . . . . . . . . . . . . . . . . . . . . 18
Note 4 Other operational income and expenses. . . . . . . . . . . . . . . . . . . . . . . . . . . . . . . . . . . . . . . 20
Note 5 Employee benefits - Free shares . . . . . . . . . . . . . . . . . . . . . . . . . . . . . . . . . . . . . . . . . . . 20
Note 6 Intangible assets . . . . . . . . . . . . . . . . . . . . . . . . . . . . . . . . . . . . . . . . . . . . . . . . . . . 21
Note 7 Financial assets and liabilities – Cost of debt . . . . . . . . . . . . . . . . . . . . . . . . . . . . . . . . . . . . 22
Note 8 Derivatives and exposure to market risks . . . . . . . . . . . . . . . . . . . . . . . . . . . . . . . . . . . . . . 24
Note 9 Equity – Earnings per share . . . . . . . . . . . . . . . . . . . . . . . . . . . . . . . . . . . . . . . . . . . . . 26
Note 10 Provisions for liabilities and charges - Contingent liabilities and material ongoing disputes . . . . . . . . . . . . 28
Note 11 Acquisitions in progress . . . . . . . . . . . . . . . . . . . . . . . . . . . . . . . . . . . . . . . . . . . . . . . 30
Note 12 Subsequent events. . . . . . . . . . . . . . . . . . . . . . . . . . . . . . . . . . . . . . . . . . . . . . . . . . 30
2016 Condensed Consolidated Financial Statement
HALF-YEAR FINANCIAL REPORT - L’ORÉAL 30TH JUNE, 2016 - 17
NOTE 1 Accounting principles
The condensed half-year consolidated financial statements of L’Oréal and its subsidiaries (“the Group”) have been prepared in accordance with the international accounting standard IAS 34.
As condensed financial statements, they do not include all the information required by IFRS for the preparation of the annual financial statements and must therefore be read in conjunction with the Group consolidated financial statements prepared in accordance with IFRS as adopted in the European Union for the year ending at December 31st, 2015.
The Board of Directors reviewed the condensed half-year consolidated financial statements as at June 30th, 2016, on July 28th, 2016.
The accounting methods applied are identical to those applied when preparing the consolidated financial statements for the year ended December 31st, 2015, except as regards income tax.
The tax charge (current and deferred) is calculated for the half-year financial statements by applying to the profit for the period the estimated annual tax rate for the current tax year for each entity or tax group.
The Group did not early adopt any standards or interpretations not mandatorily applicable in 2016.
The Group may be concerned by the following standards not yet adopted by the European Union:
• IFRS 15 “Revenue from Contracts with Customers” applicable as of January 1st, 2018;
• IFRS 9 “Financial Instruments” applicable as of January 1st, 2018;
• IFRS 16 “Leases” applicable as of January 1st, 2019.
The Group is not concerned by the standards and amendments to standards published and effective as of January 1st, 2016.
NOTE 2 Main events of the period
2.1. Changes in the scope of consolidation
2.1.1. First-half 2016
Acquisitions
On January 4th, 2016, L’Oréal USA announced the signing of an agreement to acquire key assets from Raylon Corporation, a full-service wholesale distributor of salon professional products.
The acquisition will expand SalonCentric’s distribution coverage of salon professional products in Pennsylvania, New Jersey, Delaware, and portions of Maryland, West Virginia and New York, representing approximately 3,500 salons. This acquisition has been fully consolidated since February 26th, 2016.
The cost of this new acquisition represents €16.4 million. The total amount of goodwill and other intangible assets resulting from this acquisition has been provisionally estimated respectively at €7.7 million and €6.0 million. The allocation of the purchase price to the identifiable intangible assets of this acquisition had not been finalised at June 30th, 2016. This acquisition represents €7.2 million in half-year net sales.
2.1.2. Year 2015
a) Acquisitions
On September 8th, 2014, L’Oréal announced that it has signed an agreement to acquire Niely Cosméticos. Founded in 1981 by Daniel Fonseca de Jesus, Niely Cosméticos is the largest independent hair coloration and hair care company in Brazil, one of the world’s largest hair colour and hair care markets. With a net revenue of 406 million Brazilian Reals (€130 million) in 2014, the Niely Cosméticos group has two main brands: Cor & Ton for hair
coloration and Niely Gold for shampoos and care. Furthermore, Niely Cosméticos has industrial and logistical facilities in Nova Iguaçu, in the State of Rio. The approval granted by the local regulatory authorities was confirmed in early January 2015. On March 31st, 2015, L’Oréal finalised the acquisition of Niely Cosméticos. This acquisition has been fully consolidated since April 1st, 2015.
On February 3rd, 2015, The Body Shop announced the completion of the deal to acquire the assets of Adidem Pty Limited, the company operating The Body Shop Australia since 1983. This acquisition will move the fifth biggest The Body Shop market’s retail sales from a Franchise operation to a Company-Owned market. This acquisition has been fully consolidated since February 2nd, 2015.
The cost of these new acquisitions represents €380.5 million. The total amount of goodwill and other intangible assets resulting from these acquisitions has been estimated respectively at €348.0 million and €24.5 million. These acquisitions represent around €183.1 million in full-year net sales and €0.9 million in full-year net operating profit.
b) Other operations
In late November 2014, L’Oréal and Nestlé announced their intention to end the operations of their joint venture Innéov. On April 24th, 2015, Nestlé Skin Health announced that Galderma, its company focused on medical solutions, would acquire certain assets of Innéov Group to serve as the foundation for its entry into the nutraceutical market. This operation was finalised on June 30th, 2015.
2016 Condensed Consolidated Financial Statement
HALF-YEAR FINANCIAL REPORT - L’ORÉAL 30TH JUNE, 2016 - 18
2.2. Situation in Venezuela
Our subsidiaries in Venezuela were deconsolidated at December 31st, 2015 for the following reasons:
• an increasingly difficult economic situation in the country;
• constraints imposed by the government restricting our operations and limiting our scope for taking and implementing operational decisions;
• currency fluctuations making the operations of our subsidiaries no longer material.
The deconsolidation of our Venezuelan subsidiaries is reflected by a negative €107.2 million impact shown in Other non-recurring income and expenses in our 2015 consolidated financial statements.
The situation did not improve in first-half 2016 and our Venezuelan subsidiaries are currently accounted for using the cost model.
NOTE 3 Operating items - Segment information
3.1. Segment information
3.1.1. Segment information
The Cosmetics Divisions are organised into four sectors, each operating with specific distribution channels:
• Professional Products Division: products used and sold in hair salons and beauty institutes;
• Consumer Products Division: products sold in mass-market retail channels;
• L’Oréal Luxe Division: products sold in selective retail outlets, i.e. department stores, perfumeries, travel retail, the Group’s own boutiques and certain online sites;
• Active Cosmetics Division: dermocosmetics products sold through all health channels such as pharmacies, parapharmacies, drugstores and medispas.
The non-allocated item includes expenses incurred by the Functional Divisions, fundamental research and the costs of stock
options not allocated to the Cosmetics Divisions. It also includes activities that are auxiliary to the Group’s core businesses, such as insurance, reinsurance and banking.
The Body Shop offers a wide range of naturally inspired cosmetics and toiletry products. The brand, originally created in the United Kingdom, distributes its products and expresses its values through a large multi-channel network of exclusive retail shops (in more than 60 countries), as well as through home and online sales. The Body Shop net sales and operating profit are characterised by strong seasonal fluctuations due to a high level of activity during the last few months of the year.
Data by operational Division are prepared using the same accounting principles as those used for the preparation of the consolidated financial statements.
The performance of each operational Division is measured on the basis of operating profit.
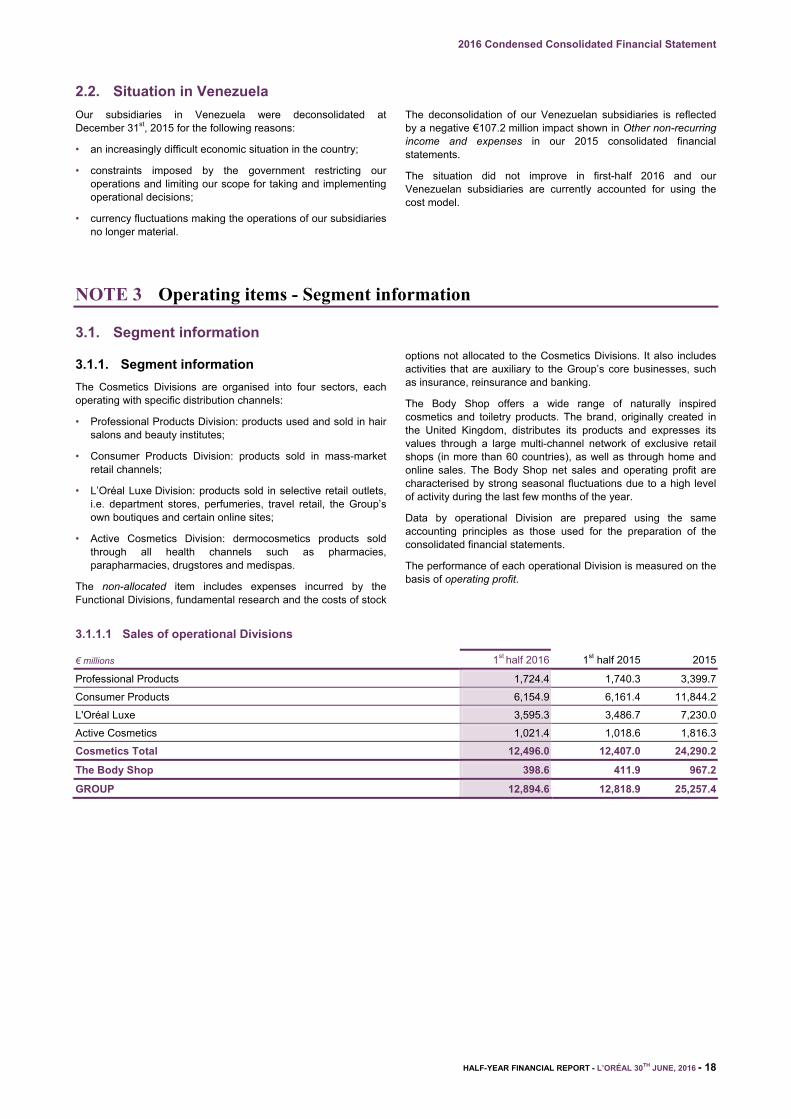
3.1.1.1 Sales of operational Divisions
€ millions 1st half 2016 1st half 2015 2015
Professional Products 1,724.4 1,740.3 3,399.7
Consumer Products 6,154.9 6,161.4 11,844.2
L'Oréal Luxe 3,595.3 3,486.7 7,230.0
Active Cosmetics 1,021.4 1,018.6 1,816.3
Cosmetics Total 12,496.0 12,407.0 24,290.2
The Body Shop 398.6 411.9 967.2
GROUP 12,894.6 12,818.9 25,257.4

2016 Condensed Consolidated Financial Statement
HALF-YEAR FINANCIAL REPORT - L’ORÉAL 30TH JUNE, 2016 - 19
3.1.1.2 Operating profit of operational Divisions
€ millions 1st half 2016 1st half 2015 2015
Professional Products 338.2 332.0 678.5
Consumer Products 1,306.8 1,313.1 2,385.8
L'Oréal Luxe 767.3 716.0 1,497.5
Active Cosmetics 283.3 280.2 414.7
Cosmetics Divisions Total 2,695.5 2,641.3 4,976.4
Non-allocated -309.8 -311.1 -643.6
The Body Shop -22.2 -7.2 54.8
GROUP 2,363.6 2,323.0 4,387.7
3.1.2. Information by geographic zone
All information is presented on the basis of geographic location of the subsidiaries.
3.1.2.1. Consolidated net sales by geographic zone
1st half 2016 Growth (%) 1st half 2015 2015
€ millions % of totalPublished
data
Excluding exchange
effect € millions % of total € millions % of total
Western Europe 4,436.6 34.4% 0.3% 1.5% 4,425.4 34.5% 8,647.1 34.2%
of which France 1,379.1 10.7% -2.5% -2.5% 1,414.6 11.0% 2,656.4 10.5%
North America 3,536.4 27.4% 3.8% 4.5% 3,408.4 26.6% 6,848.4 27.1%
New Markets 4,921.6 38.2% -1.3% 7.3% 4,985.1 38.9% 9,761.9 38.6%
GROUP 12,894.6 100.0% 0.6% 4.5% 12,818.9 100.0% 25,257.4 100.0%
3.1.2.2. Cosmetics net sales by geographic zone
1st half 2016 Growth (%) 1st half 2015 2015
€ millions % of totalPublished
data
Excluding exchange
effect € millions % of total € millions % of total
Western Europe 4,184.4 33.5% 0.6% 1.7% 4,160.9 33.5% 8,042.7 33.1%
of which France 1,365.9 10.9% -2.6% -2.6% 1,401.9 11.3% 2,627.0 10.8%
North America 3,460.0 27.7% 4.0% 4.7% 3,326.3 26.8% 6,654.4 27.4%
New Markets 4,851.6 38.8% -1.4% 7.2% 4,919.9 39.7% 9,593.0 39.5%
Asia, Pacific 2,815.8 22.5% 1.0% 4.7% 2,787.9 22.5% 5,463.5 22.5%
Latin America 863.3 6.9% -9.1% 13.2% 950.1 7.7% 1,871.3 7.7%
Eastern Europe 773.7 6.2% -3.7% 8.9% 803.2 6.5% 1,530.4 6.3%
Africa, Middle East 398.8 3.2% 5.3% 9.7% 378.8 3.1% 727.9 3.0%
COSMETICS ZONES TOTAL 12,496.0 100.0% 0.7% 4.6% 12,407.0 100.0% 24,290.2 100.0%
3.2. Depreciation and amortisation expense and Property, plant and equipment
3.2.1. Depreciation and amortisation expense
Depreciation and amortisation of property, plant and equipment and intangible assets included in operating expenses amount to €480.6 million; €458.7 million and €963.0 million respectively for first-half 2016, first-half 2015 and year 2015.
3.2.2. Property, plant and equipment
Investments for the first-half 2016 amount to €508.5 million compared with €404.1 million and €996.6 million respectively for the first-half 2015 and year 2015.
The depreciation and provisions for the first-half 2016 amount to €394.7 million compared with €375.6 million and €786.2 million respectively for the first-half 2015 and year 2015.
2016 Condensed Consolidated Financial Statement
HALF-YEAR FINANCIAL REPORT - L’ORÉAL 30TH JUNE, 2016 - 20
NOTE 4 Other operational income and expenses
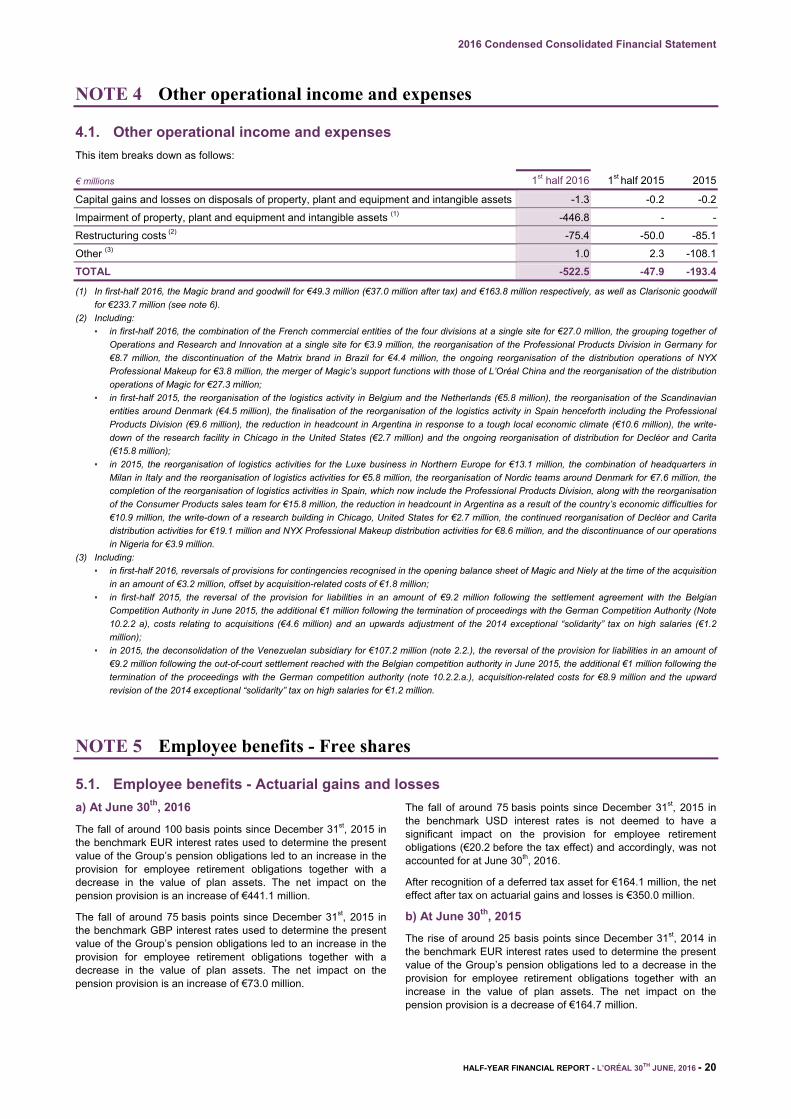
4.1. Other operational income and expenses
This item breaks down as follows:
€ millions 1st half 2016 1st half 2015 2015
Capital gains and losses on disposals of property, plant and equipment and intangible assets -1.3 -0.2 -0.2
Impairment of property, plant and equipment and intangible assets (1) -446.8 - -
Restructuring costs (2) -75.4 -50.0 -85.1
Other (3) 1.0 2.3 -108.1
TOTAL -522.5 -47.9 -193.4
(1) In first-half 2016, the Magic brand and goodwill for €49.3 million (€37.0 million after tax) and €163.8 million respectively, as well as Clarisonic goodwill
for €233.7 million (see note 6).
(2) Including:
▪ in first-half 2016, the combination of the French commercial entities of the four divisions at a single site for €27.0 million, the grouping together of
Operations and Research and Innovation at a single site for €3.9 million, the reorganisation of the Professional Products Division in Germany for
€8.7 million, the discontinuation of the Matrix brand in Brazil for €4.4 million, the ongoing reorganisation of the distribution operations of NYX
Professional Makeup for €3.8 million, the merger of Magic’s support functions with those of L’Oréal China and the reorganisation of the distribution
operations of Magic for €27.3 million;
▪ in first-half 2015, the reorganisation of the logistics activity in Belgium and the Netherlands (€5.8 million), the reorganisation of the Scandinavian
entities around Denmark (€4.5 million), the finalisation of the reorganisation of the logistics activity in Spain henceforth including the Professional
Products Division (€9.6 million), the reduction in headcount in Argentina in response to a tough local economic climate (€10.6 million), the write-
down of the research facility in Chicago in the United States (€2.7 million) and the ongoing reorganisation of distribution for Decléor and Carita
(€15.8 million);
▪ in 2015, the reorganisation of logistics activities for the Luxe business in Northern Europe for €13.1 million, the combination of headquarters in
Milan in Italy and the reorganisation of logistics activities for €5.8 million, the reorganisation of Nordic teams around Denmark for €7.6 million, the
completion of the reorganisation of logistics activities in Spain, which now include the Professional Products Division, along with the reorganisation
of the Consumer Products sales team for €15.8 million, the reduction in headcount in Argentina as a result of the country’s economic difficulties for
€10.9 million, the write-down of a research building in Chicago, United States for €2.7 million, the continued reorganisation of Decléor and Carita
distribution activities for €19.1 million and NYX Professional Makeup distribution activities for €8.6 million, and the discontinuance of our operations
in Nigeria for €3.9 million.
(3) Including:
▪ in first-half 2016, reversals of provisions for contingencies recognised in the opening balance sheet of Magic and Niely at the time of the acquisition
in an amount of €3.2 million, offset by acquisition-related costs of €1.8 million;
▪ in first-half 2015, the reversal of the provision for liabilities in an amount of €9.2 million following the settlement agreement with the Belgian
Competition Authority in June 2015, the additional €1 million following the termination of proceedings with the German Competition Authority (Note
10.2.2 a), costs relating to acquisitions (€4.6 million) and an upwards adjustment of the 2014 exceptional “solidarity” tax on high salaries (€1.2
million);
▪ in 2015, the deconsolidation of the Venezuelan subsidiary for €107.2 million (note 2.2.), the reversal of the provision for liabilities in an amount of
€9.2 million following the out-of-court settlement reached with the Belgian competition authority in June 2015, the additional €1 million following the
termination of the proceedings with the German competition authority (note 10.2.2.a.), acquisition-related costs for €8.9 million and the upward
revision of the 2014 exceptional “solidarity” tax on high salaries for €1.2 million.
NOTE 5 Employee benefits - Free shares
5.1. Employee benefits - Actuarial gains and losses
a) At June 30th, 2016
The fall of around 100 basis points since December 31st, 2015 in the benchmark EUR interest rates used to determine the present value of the Group’s pension obligations led to an increase in the provision for employee retirement obligations together with a decrease in the value of plan assets. The net impact on the pension provision is an increase of €441.1 million.
The fall of around 75 basis points since December 31st, 2015 in the benchmark GBP interest rates used to determine the present value of the Group’s pension obligations led to an increase in the provision for employee retirement obligations together with a decrease in the value of plan assets. The net impact on the pension provision is an increase of €73.0 million.
The fall of around 75 basis points since December 31st, 2015 in the benchmark USD interest rates is not deemed to have a significant impact on the provision for employee retirement obligations (€20.2 before the tax effect) and accordingly, was not accounted for at June 30th, 2016.
After recognition of a deferred tax asset for €164.1 million, the net effect after tax on actuarial gains and losses is €350.0 million.
b) At June 30th, 2015
The rise of around 25 basis points since December 31st, 2014 in the benchmark EUR interest rates used to determine the present value of the Group’s pension obligations led to a decrease in the provision for employee retirement obligations together with an increase in the value of plan assets. The net impact on the pension provision is a decrease of €164.7 million.
2016 Condensed Consolidated Financial Statement
HALF-YEAR FINANCIAL REPORT - L’ORÉAL 30TH JUNE, 2016 - 21
The rise of around 25 basis points since December 31st, 2014 in the benchmark USD interest rates is not deemed to have a significant impact on the provision for employee retirement obligations (€35 million before the tax effect) and accordingly, was not accounted for at June 30th, 2015.
The adoption of a more restrictive definition of a senior manager led to a change in the assumptions used to calculate the
obligations relating to the defined benefit pension scheme “Retirement Income Guarantee for former Senior Managers” at January 1st, 2015, resulting in a decrease of €180.9 million in the provision for employee retirement obligations.
After recognition of a deferred tax asset for €119.0 million, the net effect after tax on actuarial gains and losses is €226.6 million.
5.2. Free shares
On April 20th, 2016, the Board of Directors decided to conditionally grant 906,100 free shares.
a) Vesting conditions
For the conditional grant of shares, the plan provides for a 4-year vesting period after which vesting is effective and final, subject to meeting the conditions of the plan.
The performance conditions, under the April 20th, 2016 plan, concern:
• for 50% of shares granted, the increase in comparable Cosmetic revenues for the 2017, 2018 and 2019 fiscal years in relation to the growth in revenues for a panel of competitors;
• for 50% of shares granted, the increase over the same period in Group consolidated operating profit.
The calculation will be based on the arithmetic average of the performance in the 2017, 2018 and 2019 fiscal and will use a predefined allocation scale based on the performance percentage achieved. No performance condition applies below a block of 200 shares.
A total of 936,300 shares and 1,230,850 shares were definitively granted, respectively, on April 23rd, 2015 under the April 22nd, 2011 plan and on April 18th, 2016 under the April 17th, 2012 plan.
At June 30th, 2016, the performance conditions were deemed to have been met.
b) Fair value of free shares granted
The fair value corresponds to the value of the share at the grant date, less dividends expected to be paid during the vesting period.
On the basis of these assumptions, the fair values amount to €154.32 compared to a share price of €168.10.
NOTE 6 Intangible assets
The two Cash-Generating Units (Clarisonic and Magic) were tested for impairment and impairment losses were recognised as a result of adverse events (worse-than-forecast performance). This mainly reflects the increasing number of players in these two businesses and greater pressure on profitability.
At June 30th, 2016, the recoverable amount of CGUs Magic and Clarisonic stood at €412 million and €194 million, respectively.
The €429.8 million decrease in the Goodwill line primarily results from changes in the scope of consolidation and acquisitions in the
period amounting to €7.8 million, negative changes in exchange rates amounting to €48.2 million and the recognition of impairment losses against Clarisonic (€233.7 million) and against Magic (€163.8 million).
The €123.0 million decrease in the Other intangible assets line results primarily from negative changes in exchange rates amounting to €78.5 million, depreciation and amortisation expense charged in the period for €85.9 million and the write-down taken against brand Magic for €49.3 million, partly offset by acquisitions in the six-month period representing €85.5 million.

2016 Condensed Consolidated Financial Statement
HALF-YEAR FINANCIAL REPORT - L’ORÉAL 30TH JUNE, 2016 - 22
NOTE 7 Financial assets and liabilities – Cost of debt
7.1. Borrowings and debt
The Group uses bank loans for its medium-term financing needs and commercial paper issues in France and in the United States for its short-term financing needs. None of these loans contain an early repayment clause linked to financial ratios (covenants).
7.1.1. Debt by type
06.30.2016 06.30.2015 12.31.2015
€ millions Non-current Current Non-current Current Non-current Current
Short-term paper - 1,339.4 - 2,772.3 - 505.4
MLT bank loans 2.7 0.2 1.4 0.1 1.6 0.4
Debt on capital lease contracts 21.1 5.6 25.4 5.6 24.3 5.8
Overdrafts - 97.0 - 49.1 - 57.3
Other borrowings and debt 8.5 210.5 44.4 261.1 14.9 172.1
TOTAL 32.3 1,652.7 71.2 3,088.2 40.8 741.0
7.1.2. Debt by maturity date
€ millions 06.30.2016 06.30.2015 12.31.2015
Under 1 year (1) 1,652.7 3,088.2 741.0
1 to 5 years 17.9 54.7 24.7
Over 5 years 14.3 16.5 16.1
TOTAL 1,684.9 3,159.4 781.8
(1) At June 30th, 2016, the Group had confirmed undrawn credit lines for €3,705.3 million compared with €3,523.4 million at June 30th, 2015 and
€3,813.3 million at December 31st, 2015. These lines were not subject to any covenants.
7.1.3. Debt by currency
€ millions 06.30.2016 06.30.2015 12.31.2015
Euro (EUR) 781.4 2,526.4 127.2
US Dollar (USD) 628.7 282.1 415.5
Brazilian Real (BRL) (1) 71.3 113.4 41.6
Chinese Yuan Renminbi (CNY) 38.8 46.1 55.4
British Pound (GBP) 26.4 22.3 18.7
Indonesian Rupiah (IDR) 24.9 23.1 21.8
Turkish Lira (TRY) 24.4 6.4 3.0
Egyptian Pound (EGP) 23.3 21.8 24.4
Taiwan Dollar (TWD) 12.9 6.8 -
Kenyan Shilling (KES) 9.0 2.8 6.5
Other 43.9 108.3 67.7
TOTAL 1,684.9 3,159.4 781.8
(1) Including €31.4 million and €5.1 million in amounts due to non-controlling interests respectively at June 30th, 2015 and December 31st, 2015, in
respect of the Emporio Body Store acquisition.
7.1.4. Breakdown of fixed rate and floating rate debt (after allowing for interest rate hedging instruments)
€ millions 06.30.2016 06.30.2015 12.31.2015
Floating rate 1,639.6 3,125.5 748.9
Fixed rate 45.3 33.9 32.9
TOTAL 1,684.9 3,159.4 781.8

2016 Condensed Consolidated Financial Statement
HALF-YEAR FINANCIAL REPORT - L’ORÉAL 30TH JUNE, 2016 - 23
7.1.5. Effective interest rates
Effective interest rates on Group debt after allowing for hedging instruments are 0.00% at June 30th, 2016 compared with 0.01% at June 30th, 2015 and 0.22% at December 31st, 2015 for short-term paper.
Bank loans amounted to €2.9 million at June 30th, 2016 compared with €2.0 million at December 31st, 2015. The Group did not hold bank loans at June 30th, 2015.
7.1.6. Average debt interest rates
Average debt interest rates after allowing for hedging instruments break down as follows:
06.30.2016 06.30.2015 12.31.2015
Euro (EUR) (1) -0.30% 0.11% 0.04%
US Dollar (USD) 0.38% 0.15% 0.15%
(1) The fall in euro interest rates is now reflected by drawdowns of commercial paper with negative interest rates.
7.1.7. Fair value of borrowings and debt
The fair value of fixed-rate debt is determined for each loan by discounting future cash flows, based on bond yield curves at the balance sheet date, after allowing for the spread corresponding to the Group’s risk rating.
The net carrying amount of outstanding bank loans and other floating-rate loans is a reasonable approximation of their fair value.
The fair value of borrowings and debt amounted to €1,685.7 million at June 30th, 2016 compared with €3,160.1 million and €782.5 million respectively a June 30th, 2015 and December 31st, 2015.
7.2. Cash and cash equivalents
06.30.2016 06.30.2015 12.31.2015
€ millions Carrying amount
Acquisition cost
Carrying amount
Acquisition cost
Carrying amount
Acquisition cost
Marketable securities 354.8 354.8 443.9 443.8 335.3 335.3
Bank accounts and other cash and cash equivalents 986.3 986.3 1,321.2 1,321.2 1,064.5 1,064.5
TOTAL 1,341.1 1,341.1 1,765.1 1,765.1 1,399.8 1,399.8
Marketable securities consist mainly of SICAV money-market funds and unit trusts (on which the return is based on EONIA). Marketable securities are considered as Financial assets available-for-sale.
There is no unrealised loss at June 30th, 2016.
Term accounts with a maturity of less than 3 months at inception are shown on the Bank accounts and other cash and cash equivalents line.
7.3. Non-current financial assets
06.30.2016 06.30.2015 12.31.2015
€ millions Carrying amount
Acquisition cost
Carrying amount
Acquisition cost
Carrying amount
Acquisition cost
Financial assets available-for-sale
• Sanofi (1) 8,857.6 4,033.5 10,432.4 4,033.5 9,292.7 4,033.5
• Unlisted securities (2) 16.0 110.9 4.3 4.8 4.1 99.0
Financial assets at amortised cost
• Non-current loans and receivables 151.0 154.7 98.5 102.9 114.1 118.3
TOTAL 9,024.5 4,299.1 10,535.1 4,141.2 9,410.9 4,250.8
(1) L’Oréal’s stake in Sanofi was 9.19% at June 30th, 2016. The carrying amount at June 30th, 2016, June 30th, 2015 and December 31st, 2015,
(€8,857.6 million, €10,432.4 million and €9,292.7 million respectively) corresponds to the market value of the shares based on the closing price at each
of these dates (€74.92, €88.24 and €78.60 respectively). The acquisition cost of €4,033.5 million corresponds to an entry cost of €34.12.
(2) As the fair value of unlisted securities cannot be reliably determined, they are stated at cost less any impairment losses. Changes in “Acquisition cost”
chiefly concern the value of L’Oréal Venezuela which was deconsolidated at December 31st, 2015 (note 2.2.) and written down in full.
2016 Condensed Consolidated Financial Statement
HALF-YEAR FINANCIAL REPORT - L’ORÉAL 30TH JUNE, 2016 - 24
NOTE 8 Derivatives and exposure to market risks
To manage its exposure to currency and interest rate risks arising in the course of its normal operations, the Group uses derivatives negotiated with counterparties rated investment grade.
In accordance with Group rules, currency and interest rate derivatives are set up exclusively for hedging purposes.
8.1. Hedging of currency risk
The Group is exposed to currency risk on commercial transactions recorded on the balance sheet and on highly probable future transactions.
Based on information supplied by the subsidiaries, future operating transactions are covered by exchange rate hedges, either by options, or by purchases or sales of forward contracts.
At June 30th, 2016, the change in the mark to market value of the hedging instruments allocated to future transactions and deferred through equity amounts to +€51.9 million compared with +€8.8 million and +€148.8 million respectively at June 30th, 2015 and December 31st, 2015.
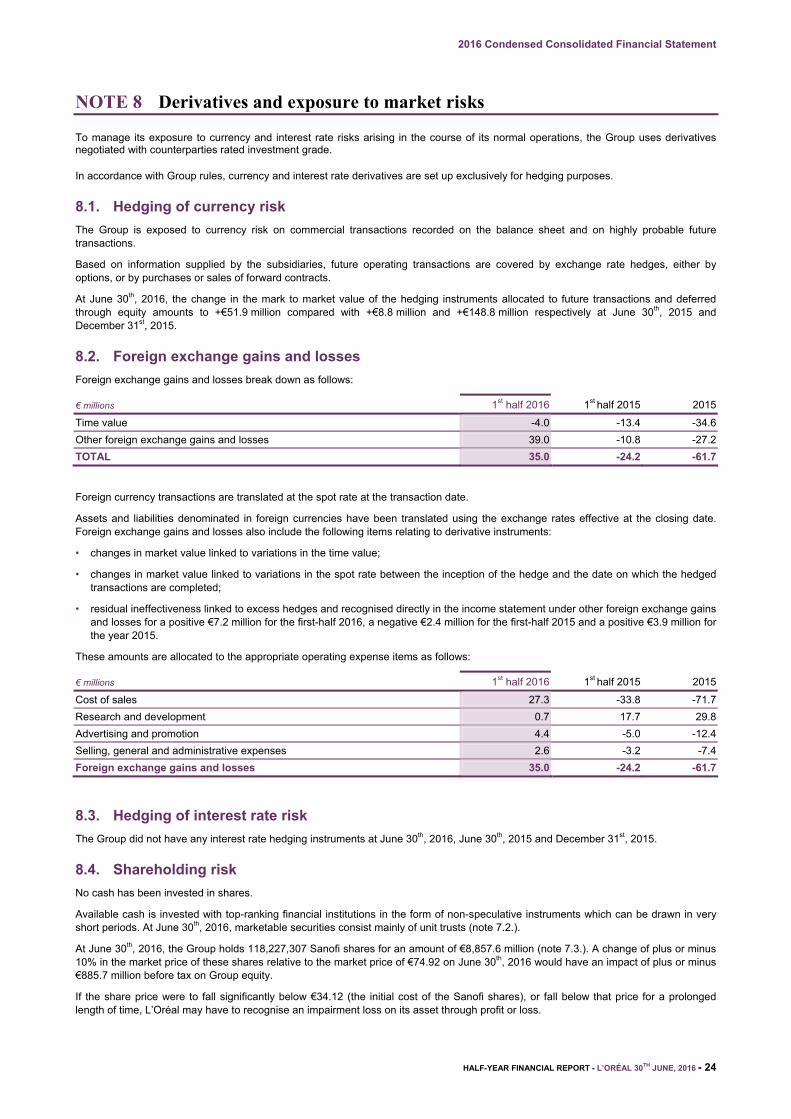
8.2. Foreign exchange gains and losses
Foreign exchange gains and losses break down as follows:
€ millions 1st half 2016 1st half 2015 2015
Time value -4.0 -13.4 -34.6
Other foreign exchange gains and losses 39.0 -10.8 -27.2
TOTAL 35.0 -24.2 -61.7
Foreign currency transactions are translated at the spot rate at the transaction date.
Assets and liabilities denominated in foreign currencies have been translated using the exchange rates effective at the closing date. Foreign exchange gains and losses also include the following items relating to derivative instruments:
• changes in market value linked to variations in the time value;
• changes in market value linked to variations in the spot rate between the inception of the hedge and the date on which the hedged transactions are completed;
• residual ineffectiveness linked to excess hedges and recognised directly in the income statement under other foreign exchange gains and losses for a positive €7.2 million for the first-half 2016, a negative €2.4 million for the first-half 2015 and a positive €3.9 million for the year 2015.
These amounts are allocated to the appropriate operating expense items as follows:
€ millions 1st half 2016 1st half 2015 2015
Cost of sales 27.3 -33.8 -71.7
Research and development 0.7 17.7 29.8
Advertising and promotion 4.4 -5.0 -12.4
Selling, general and administrative expenses 2.6 -3.2 -7.4
Foreign exchange gains and losses 35.0 -24.2 -61.7
8.3. Hedging of interest rate risk
The Group did not have any interest rate hedging instruments at June 30th, 2016, June 30th, 2015 and December 31st, 2015.
8.4. Shareholding risk
No cash has been invested in shares.
Available cash is invested with top-ranking financial institutions in the form of non-speculative instruments which can be drawn in very short periods. At June 30th, 2016, marketable securities consist mainly of unit trusts (note 7.2.).
At June 30th, 2016, the Group holds 118,227,307 Sanofi shares for an amount of €8,857.6 million (note 7.3.). A change of plus or minus 10% in the market price of these shares relative to the market price of €74.92 on June 30th, 2016 would have an impact of plus or minus €885.7 million before tax on Group equity.
If the share price were to fall significantly below €34.12 (the initial cost of the Sanofi shares), or fall below that price for a prolonged length of time, L’Oréal may have to recognise an impairment loss on its asset through profit or loss.

2016 Condensed Consolidated Financial Statement
HALF-YEAR FINANCIAL REPORT - L’ORÉAL 30TH JUNE, 2016 - 25
8.5. Fair value hierarchy
IFRS 7 as amended in 2009 requires financial assets and liabilities recognised at fair value in the balance sheet to be classified according to three levels:
• level 1: quoted prices on an active market;
• level 2: valuation techniques using observable inputs;
• level 3: valuation techniques using unobservable inputs.
The following table provides an analysis of financial instruments recorded at fair value by level of the fair value hierarchy.
€ millions June 30th, 2016 level 1 level 2 level 3
Total fair value
Assets at fair value
Foreign exchange derivatives 232.5 232.5
Sanofi shares 8,857.6 8,857.6
Marketable securities 354.8 354.8
TOTAL ASSETS AT FAIR VALUE 9,212.4 232.5 - 9,444.9
Liabilities at fair value
Foreign exchange derivatives 255.8 255.8
TOTAL LIABILITIES AT FAIR VALUE - 255.8 - 255.8
€ millions June 30th, 2015 level 1 level 2 level 3
Total fair value
Assets at fair value
Foreign exchange derivatives 245.6 245.6
Sanofi shares 10,432.4 10,432.4
Marketable securities 443.9 443.9
TOTAL ASSETS AT FAIR VALUE 10,876.3 245.6 - 11,121.9
Liabilities at fair value
Foreign exchange derivatives 299.6 299.6
TOTAL LIABILITIES AT FAIR VALUE - 299.6 - 299.6
€ millions December 31st, 2015 level 1 level 2 level 3
Total fair value
Assets at fair value
Foreign exchange derivatives 283.0 283.0
Sanofi shares 9,292.7 9,292.7
Marketable securities 335.3 335.3
TOTAL ASSETS AT FAIR VALUE 9,628.0 283.0 - 9,911.0
Liabilities at fair value
Foreign exchange derivatives 205.4 205.4
TOTAL LIABILITIES AT FAIR VALUE - 205.4 - 205.4
2016 Condensed Consolidated Financial Statement
HALF-YEAR FINANCIAL REPORT - L’ORÉAL 30TH JUNE, 2016 - 26
NOTE 9 Equity – Earnings per share
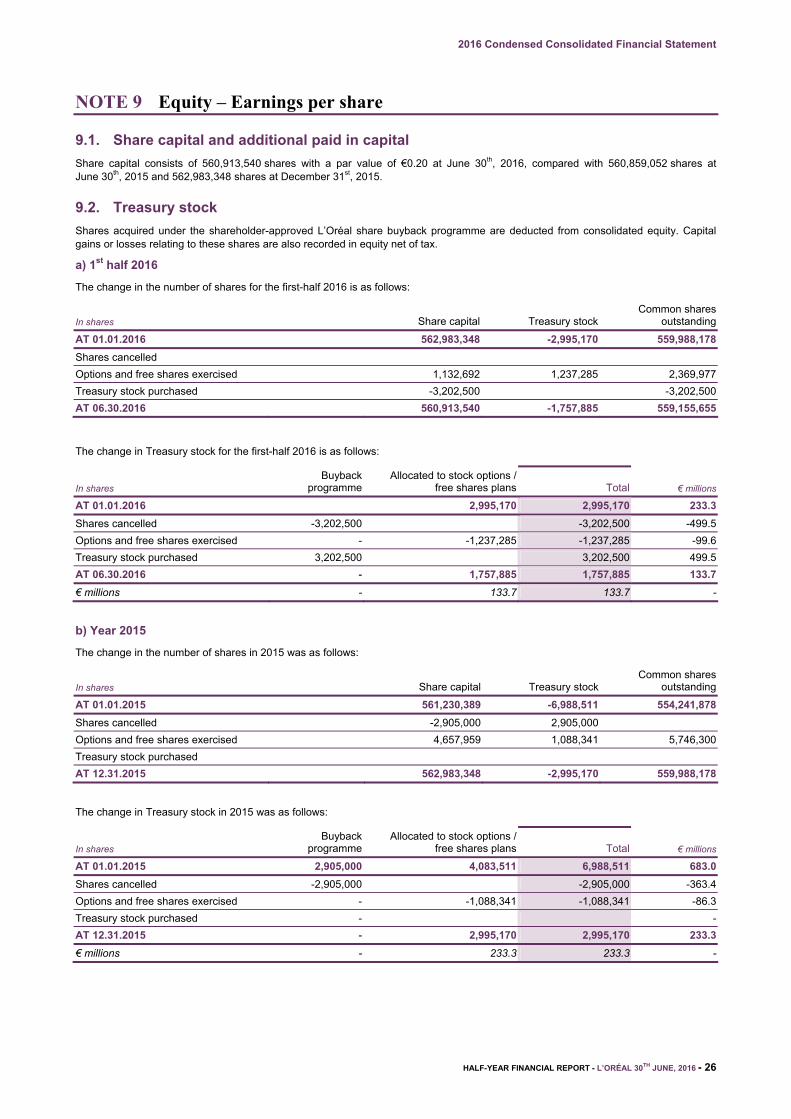
9.1. Share capital and additional paid in capital
Share capital consists of 560,913,540 shares with a par value of €0.20 at June 30th, 2016, compared with 560,859,052 shares at June 30th, 2015 and 562,983,348 shares at December 31st, 2015.
9.2. Treasury stock
Shares acquired under the shareholder-approved L’Oréal share buyback programme are deducted from consolidated equity. Capital gains or losses relating to these shares are also recorded in equity net of tax.
a) 1st half 2016
The change in the number of shares for the first-half 2016 is as follows:
In shares Share capital Treasury stock Common shares
outstanding
AT 01.01.2016 562,983,348 -2,995,170 559,988,178
Shares cancelled
Options and free shares exercised 1,132,692 1,237,285 2,369,977
Treasury stock purchased -3,202,500 -3,202,500
AT 06.30.2016 560,913,540 -1,757,885 559,155,655
The change in Treasury stock for the first-half 2016 is as follows:
In shares Buyback
programmeAllocated to stock options /
free shares plans Total € millions
AT 01.01.2016 2,995,170 2,995,170 233.3
Shares cancelled -3,202,500 -3,202,500 -499.5
Options and free shares exercised - -1,237,285 -1,237,285 -99.6
Treasury stock purchased 3,202,500 3,202,500 499.5
AT 06.30.2016 - 1,757,885 1,757,885 133.7
€ millions - 133.7 133.7 -
b) Year 2015
The change in the number of shares in 2015 was as follows:
In shares Share capital Treasury stock Common shares
outstanding
AT 01.01.2015 561,230,389 -6,988,511 554,241,878
Shares cancelled -2,905,000 2,905,000
Options and free shares exercised 4,657,959 1,088,341 5,746,300
Treasury stock purchased
AT 12.31.2015 562,983,348 -2,995,170 559,988,178
The change in Treasury stock in 2015 was as follows:
In shares Buyback
programmeAllocated to stock options /
free shares plans Total € millions
AT 01.01.2015 2,905,000 4,083,511 6,988,511 683.0
Shares cancelled -2,905,000 -2,905,000 -363.4
Options and free shares exercised - -1,088,341 -1,088,341 -86.3
Treasury stock purchased - -
AT 12.31.2015 - 2,995,170 2,995,170 233.3
€ millions - 233.3 233.3 -

2016 Condensed Consolidated Financial Statement
HALF-YEAR FINANCIAL REPORT - L’ORÉAL 30TH JUNE, 2016 - 27
9.3. Net profit attributable to owners of the company excluding non-recurring items - Earnings per share
9.3.1. Reconciliation with net profit
Net profit attributable to owners of the company excluding non-recurring items reconciles as follows with net profit attributable to owners of the company:
€ millions 1st half 2016 1st half 2015 2015
Net profit attributable to owners of the company 1,479.5 1,882.6 3,297.4
Capital gains and losses on property, plant and equipment and intangible assets 1.3 0.2 0.2
Impairment of property, plant and equipment and intangible assets 446.8 - -
Restructuring costs 75.4 50.0 85.1
Other (1) -1.0 -2.3 108.1
Tax effect on non-recurring items -28.7 -16.6 -29.3
Non-controlling interests on non-recurring items -0.1 -0.1 -0.2
Tax effect on acquisitions - - -13.4
3% additional levy on paid dividends (2) 52.3 45.3 45.3
Costs net of tax of the discontinuation of the Innéov operation by L'Oréal and disposal of a part of its assets (note 2.1.2.b) -0.1 -1.8 -3.4
NET PROFIT ATTRIBUTABLE TO OWNERS OF THE COMPANY EXCLUDING NON-RECURRING ITEMS 2,025.4 1,957.3 3,489.8
(1) Including €107.2 million relating to the deconsolidation of our subsidiaries in Venezuela at December 31st, 2015 (note 2.2.).
(2) The 3% additional levy on the amount of dividends paid by L’Oréal represents an additional tax payment on past profit distributions and depending on
decisions made at the Annual General Meeting. So as not to distort the presentation of the Group’s operational performance in the period, this surtax is
recognised on the Income tax line of the income statement as a non-recurring item.
9.3.2. Earnings per share
The tables below set out earnings per share attributable to owners of the company (excluding the dilutive impact of shares carrying preferential dividend rights):
1st half 2016
Net profit attributable to owners of the company
(€ millions) Number of shares
Earnings per shareattributable to owners
of the company(€)
Earnings per share 1,479.5 558,768,811 2.65
Stock options - 2,897,010 -
Free shares - 2,592,405 -
DILUTED EARNINGS PER SHARE 1,479.5 564,258,226 2.62
1st half 2015
Net profit attributable to owners of the company
(€ millions) Number of shares
Earnings per shareattributable to owners
of the company(€)
Earnings per share 1,882.6 555,961,408 3.39
Stock options - 5,104,297 -
Free shares - 3,028,983 -
DILUTED EARNINGS PER SHARE 1,882.6 564,094,688 3.34
2015
Net profit attributable to owners of the company
(€ millions) Number of shares
Earnings per shareattributable to owners
of the company(€)
Earnings per share 3,297.4 557,351,236 5.92
Stock options - 4,480,499 -
Free shares - 3,059,653 -
DILUTED EARNINGS PER SHARE 3,297.4 564,891,388 5.84
2016 Condensed Consolidated Financial Statement
HALF-YEAR FINANCIAL REPORT - L’ORÉAL 30TH JUNE, 2016 - 28
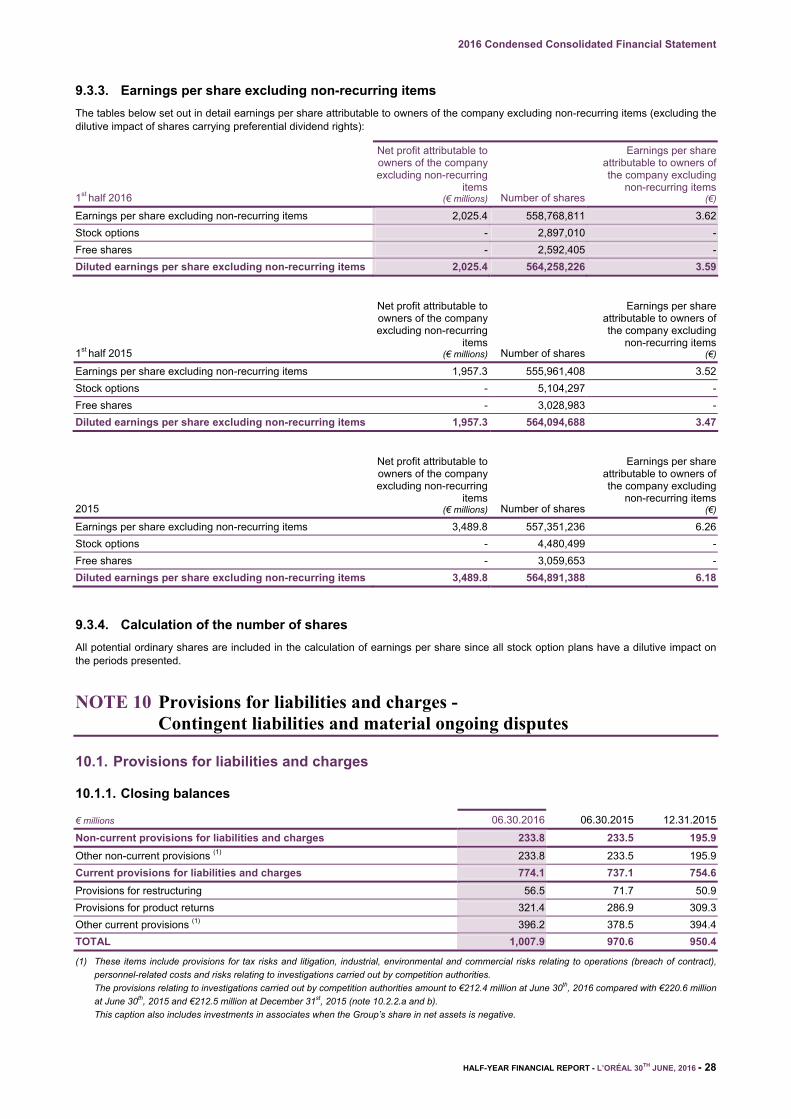
9.3.3. Earnings per share excluding non-recurring items
The tables below set out in detail earnings per share attributable to owners of the company excluding non-recurring items (excluding the dilutive impact of shares carrying preferential dividend rights):
1st half 2016
Net profit attributable to owners of the company excluding non-recurring
items(€ millions) Number of shares
Earnings per shareattributable to owners ofthe company excluding
non-recurring items(€)
Earnings per share excluding non-recurring items 2,025.4 558,768,811 3.62
Stock options - 2,897,010 -
Free shares - 2,592,405 -
Diluted earnings per share excluding non-recurring items 2,025.4 564,258,226 3.59
1st half 2015
Net profit attributable to owners of the company excluding non-recurring
items(€ millions) Number of shares
Earnings per shareattributable to owners ofthe company excluding
non-recurring items(€)
Earnings per share excluding non-recurring items 1,957.3 555,961,408 3.52
Stock options - 5,104,297 -
Free shares - 3,028,983 -
Diluted earnings per share excluding non-recurring items 1,957.3 564,094,688 3.47
2015
Net profit attributable to owners of the company excluding non-recurring
items(€ millions) Number of shares
Earnings per shareattributable to owners ofthe company excluding
non-recurring items(€)
Earnings per share excluding non-recurring items 3,489.8 557,351,236 6.26
Stock options - 4,480,499 -
Free shares - 3,059,653 -
Diluted earnings per share excluding non-recurring items 3,489.8 564,891,388 6.18
9.3.4. Calculation of the number of shares
All potential ordinary shares are included in the calculation of earnings per share since all stock option plans have a dilutive impact on the periods presented.
NOTE 10 Provisions for liabilities and charges - Contingent liabilities and material ongoing disputes
10.1. Provisions for liabilities and charges
10.1.1. Closing balances
€ millions 06.30.2016 06.30.2015 12.31.2015
Non-current provisions for liabilities and charges 233.8 233.5 195.9
Other non-current provisions (1) 233.8 233.5 195.9
Current provisions for liabilities and charges 774.1 737.1 754.6
Provisions for restructuring 56.5 71.7 50.9
Provisions for product returns 321.4 286.9 309.3
Other current provisions (1) 396.2 378.5 394.4
TOTAL 1,007.9 970.6 950.4
(1) These items include provisions for tax risks and litigation, industrial, environmental and commercial risks relating to operations (breach of contract),
personnel-related costs and risks relating to investigations carried out by competition authorities.
The provisions relating to investigations carried out by competition authorities amount to €212.4 million at June 30th, 2016 compared with €220.6 million
at June 30th, 2015 and €212.5 million at December 31st, 2015 (note 10.2.2.a and b).
This caption also includes investments in associates when the Group’s share in net assets is negative.
2016 Condensed Consolidated Financial Statement
HALF-YEAR FINANCIAL REPORT - L’ORÉAL 30TH JUNE, 2016 - 29
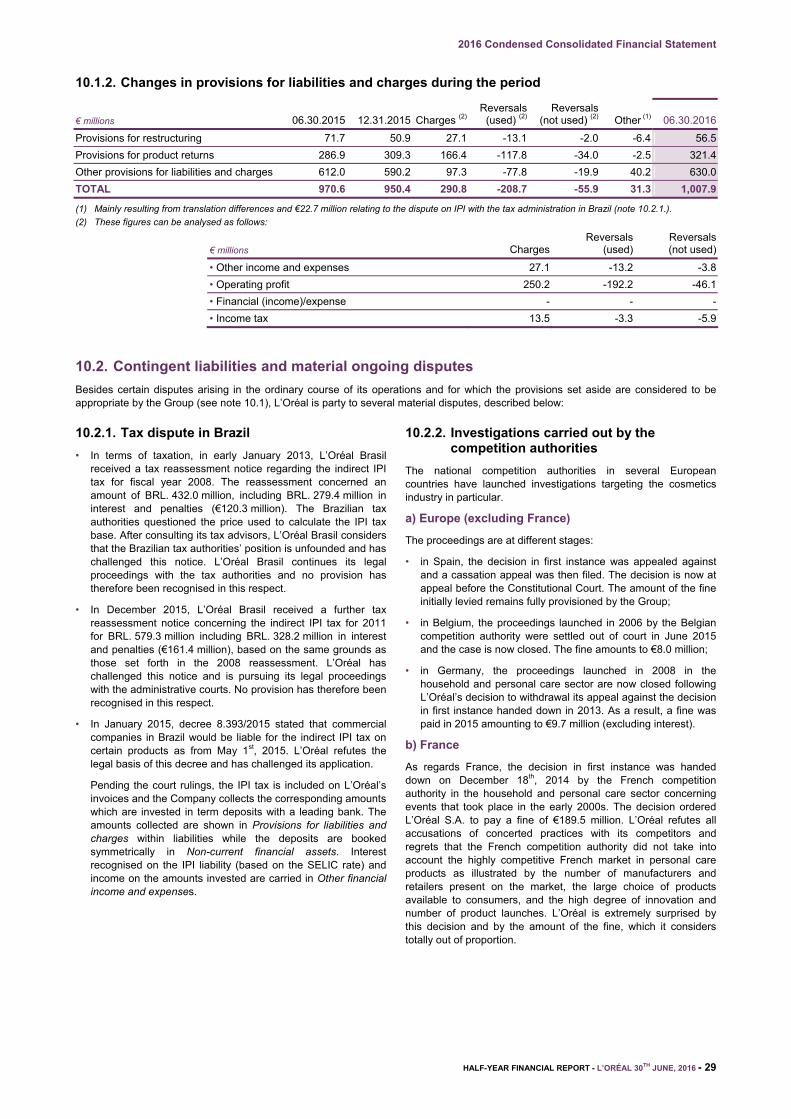
10.1.2. Changes in provisions for liabilities and charges during the period
€ millions 06.30.2015 12.31.2015 Charges (2)Reversals
(used) (2)Reversals
(not used) (2) Other (1) 06.30.2016
Provisions for restructuring 71.7 50.9 27.1 -13.1 -2.0 -6.4 56.5
Provisions for product returns 286.9 309.3 166.4 -117.8 -34.0 -2.5 321.4
Other provisions for liabilities and charges 612.0 590.2 97.3 -77.8 -19.9 40.2 630.0
TOTAL 970.6 950.4 290.8 -208.7 -55.9 31.3 1,007.9
(1) Mainly resulting from translation differences and €22.7 million relating to the dispute on IPI with the tax administration in Brazil (note 10.2.1.).
(2) These figures can be analysed as follows:
€ millions Charges
Reversals (used)
Reversals (not used)
• Other income and expenses 27.1 -13.2 -3.8
• Operating profit 250.2 -192.2 -46.1
• Financial (income)/expense - - -
• Income tax 13.5 -3.3 -5.9
10.2. Contingent liabilities and material ongoing disputes
Besides certain disputes arising in the ordinary course of its operations and for which the provisions set aside are considered to be appropriate by the Group (see note 10.1), L’Oréal is party to several material disputes, described below:
10.2.1. Tax dispute in Brazil
• In terms of taxation, in early January 2013, L’Oréal Brasil received a tax reassessment notice regarding the indirect IPI tax for fiscal year 2008. The reassessment concerned an amount of BRL. 432.0 million, including BRL. 279.4 million in interest and penalties (€120.3 million). The Brazilian tax authorities questioned the price used to calculate the IPI tax base. After consulting its tax advisors, L’Oréal Brasil considers that the Brazilian tax authorities’ position is unfounded and has challenged this notice. L’Oréal Brasil continues its legal proceedings with the tax authorities and no provision has therefore been recognised in this respect.
• In December 2015, L’Oréal Brasil received a further tax reassessment notice concerning the indirect IPI tax for 2011 for BRL. 579.3 million including BRL. 328.2 million in interest and penalties (€161.4 million), based on the same grounds as those set forth in the 2008 reassessment. L’Oréal has challenged this notice and is pursuing its legal proceedings with the administrative courts. No provision has therefore been recognised in this respect.
• In January 2015, decree 8.393/2015 stated that commercial companies in Brazil would be liable for the indirect IPI tax on certain products as from May 1st, 2015. L’Oréal refutes the legal basis of this decree and has challenged its application.
Pending the court rulings, the IPI tax is included on L’Oréal’s invoices and the Company collects the corresponding amounts which are invested in term deposits with a leading bank. The amounts collected are shown in Provisions for liabilities and charges within liabilities while the deposits are booked symmetrically in Non-current financial assets. Interest recognised on the IPI liability (based on the SELIC rate) and income on the amounts invested are carried in Other financial income and expenses.
10.2.2. Investigations carried out by the competition authorities
The national competition authorities in several European countries have launched investigations targeting the cosmetics industry in particular.
a) Europe (excluding France)
The proceedings are at different stages:
• in Spain, the decision in first instance was appealed against and a cassation appeal was then filed. The decision is now at appeal before the Constitutional Court. The amount of the fine initially levied remains fully provisioned by the Group;
• in Belgium, the proceedings launched in 2006 by the Belgian competition authority were settled out of court in June 2015 and the case is now closed. The fine amounts to €8.0 million;
• in Germany, the proceedings launched in 2008 in the household and personal care sector are now closed following L’Oréal’s decision to withdrawal its appeal against the decision in first instance handed down in 2013. As a result, a fine was paid in 2015 amounting to €9.7 million (excluding interest).
b) France
As regards France, the decision in first instance was handed down on December 18th, 2014 by the French competition authority in the household and personal care sector concerning events that took place in the early 2000s. The decision ordered L’Oréal S.A. to pay a fine of €189.5 million. L’Oréal refutes all accusations of concerted practices with its competitors and regrets that the French competition authority did not take into account the highly competitive French market in personal care products as illustrated by the number of manufacturers and retailers present on the market, the large choice of products available to consumers, and the high degree of innovation and number of product launches. L’Oréal is extremely surprised by this decision and by the amount of the fine, which it considers totally out of proportion.
2016 Condensed Consolidated Financial Statement
HALF-YEAR FINANCIAL REPORT - L’ORÉAL 30TH JUNE, 2016 - 30
L’Oréal has filed an appeal against this decision and oral pleadings were heard by the Paris Court of Appeal in April 2016. The Court of Appeal is expected to issue its decision by the end of 2016. As the appeal does not stay the judgement, the fine provisioned at December 31st, 2014 was paid on April 28th, 2015.
At June 30th, 2016, the provision continues to be recorded in liabilities and the payment of the fine is shown in Other current assets.
A provision has been set aside for all disputes still in progress at June 30th, 2016 amounting to €212.4 million at June 30th, 2016 versus €220.6 million at June 30th, 2015 and €212.5 million at end-2015.
At the present time, no other exceptional events or disputes are highly likely to have a material impact on the earnings, financial position, assets or operations of the Company or the L’Oréal Group.
NOTE 11 Acquisitions in progress
On June 30th, 2016, L'Oréal announced the signature of an agreement to acquire Atelier Cologne.
Launched in 2009, Atelier Cologne specialised in niche perfumery sold in selected retailers.
This operation was finalised on July 25th, 2016.
On July 13th, 2016, L'Oréal has submitted a firm offer to Rivadis Group for the acquisition of the Société des Thermes de Saint-Gervais-les-Bains and licence to use the Saint-Gervais Mont-Blanc brand.
Based on this offer, the Rivadis Group has granted exclusive negotiation rights to L'Oréal.
The acquisition should be completed in the next few months, after approval by the municipality of Saint-Gervais-les-Bains and consultation of Rivadis Group employees.
On July 22nd, 2016, L’Oréal announced the signing of a definitive agreement to acquire IT Cosmetics, one of the fastest growing prestige beauty brands in the United States for a cash purchase price of 1.2 billion US dollars.
Founded by Jamie Kern Lima and Paulo Lima and co-owned by TSG Consumer Partners, IT Cosmetics was developed with leading plastic surgeons to provide women with innovative, problem-solving skincare and makeup products that empower them to feel confident and beautiful.
The closing is subject to the standard regulatory approvals and other customary conditions.
NOTE 12 Subsequent events
No significant events occurred between the balance sheet date and the date when the Board of Directors authorised the condensed half-year consolidated financial statements for issue, except for the acquisitions in progress.

2016 Condensed Consolidated Financial Statement
HALF-YEAR FINANCIAL REPORT - L’ORÉAL 30TH JUNE, 2016 - 31
3/ STATUTORY AUDITORS’ REVIEW REPORT
ON THE 2016 HALF-YEAR FINANCIAL INFORMATION
To the Shareholders,
(Six months ended June 30, 2016)
This is a free translation into English of the Statutory Auditors’ review report issued in French and is provided solely for the convenience of English speaking readers. This report should be read in conjunction with, and construed in accordance with, French law and professional auditing standards applicable in France.
In compliance with the assignment entrusted to us by your Shareholders’ Annual General Meeting and in accordance with the requirements of article L. 451-1-2 III of the French Monetary and Financial Code ("Code monétaire et financier"), we hereby report to you on:
• the review of the accompanying condensed half-year consolidated financial statements of L’Oréal, for the six months ended June 30, 2016 ;
• the verification of the information contained in the half-year management report.
These condensed half-year consolidated financial statements are the responsibility of the Board of Directors. Our role is to express a conclusion on these financial statements based on our review.
I. CONCLUSION ON THE FINANCIAL STATEMENTS
We conducted our review in accordance with professional standards applicable in France. A review of half-year financial information consists of making inquiries, primarily of persons responsible for financial and accounting matters, and applying analytical and other review procedures. A review is substantially less in scope than an audit conducted in accordance with professional standards applicable in France and consequently does not enable us to obtain assurance that we would become aware of all significant matters that might be identified in an audit. Accordingly, we do not express an audit opinion.
Based on our review, nothing has come to our attention that causes us to believe that the accompanying condensed half-year consolidated financial statements are not prepared, in all material respects, in accordance with IAS 34 - standard of the IFRSs as adopted by the European Union applicable to interim financial information.
II. SPECIFIC VERIFICATION
We have also verified the information given in the half-year management report on the condensed half-year consolidated financial statements subject to our review.
We have no matters to report as to its fair presentation and consistency with the condensed half-year consolidated financial statements.
Neuilly-sur-Seine, July 29th, 2016 The Statutory Auditors
French original signed by
PricewaterhouseCoopers Audit Gérard Morin
Deloitte & Associés Frédéric Moulin

2016 Condensed Consolidated Financial Statement
HALF-YEAR FINANCIAL REPORT - L’ORÉAL 30TH JUNE, 2016 - 32
4/ DECLARATION BY THE PERSON
RESPONSIBLE FOR THE 2016 HALF-YEAR FINANCIAL REPORT
I declare that, to the best of my knowledge, the summary consolidated financial statements for the ending semester have been prepared in accordance with applicable accounting standards and give a true and fair view of the assets and liabilities, financial position and profit and loss of the Company and all the other companies included in the scope of consolidation, and that this Half-year Activity Report includes a fair review of the important events which occurred during the first six months of the year, their impact on the half-year financial statements and the main transactions between related parties, together with a description of the principal risks and uncertainties that they face in the remaining six months of the year.
Clichy, July 29th, 2016
On the authority of the Chairman and Executive Officer
Christian Mulliez
Executive Vice-President, Administration and Finance

Photo credits/ copyright (from top left to right): Row 1: @nathaliemunozx3, @wickedbeautifi cation, @livingdeadmakeup, @mico2014, @_akfreestyle; Row 2: @babsbeauty, @marioncameleon, @ssssamanthaa, @lilacbat, @_akfreestyle; Row 3: @makeupshayla, @tenipanosian, @lindasteph, @dlishhhhh, @colour_obsession; Row 4: @kimthainguyen, @colour_obsession, @iamamypham, @rebeccaseals, @ssssamanthaa; Row 5: @sultrysuburbia, @babsbeauty; Row 6: @reta_ag, @diamondmakeupgal, @lilacbat, @sonjdradeluxe, @mariamglambeauty; Row 7: @makeupbyjenny, @dirtymelodies, @jerliciadotcom, @sonjdra, @mdotmakeup.