Embed Size (px)
Citation preview
Wind energy
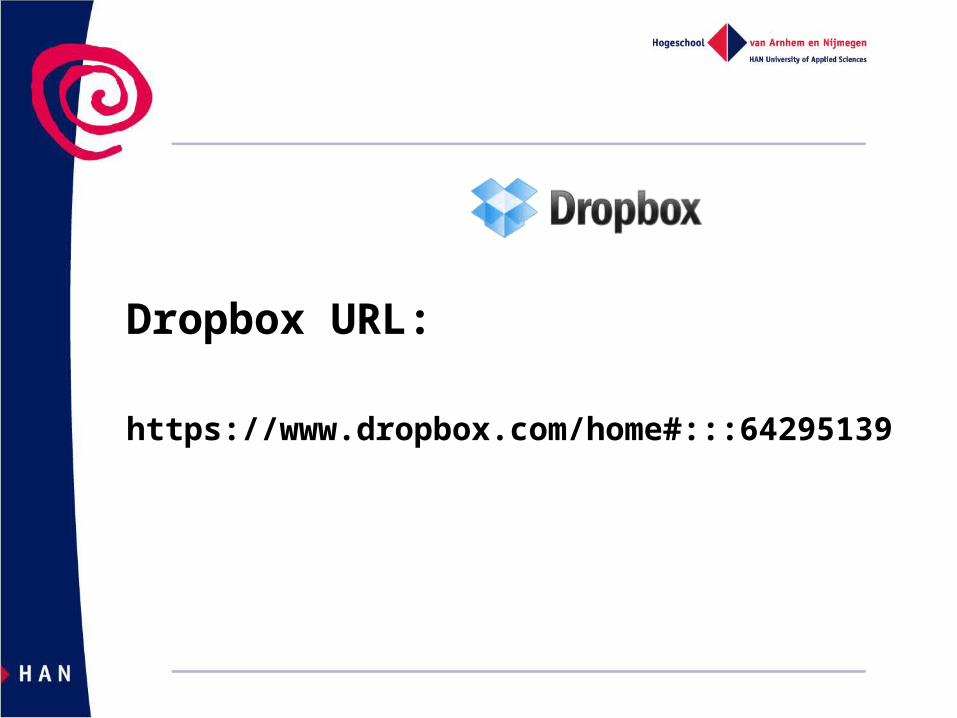
Dropbox URL:
https://www.dropbox.com/home#:::64295139
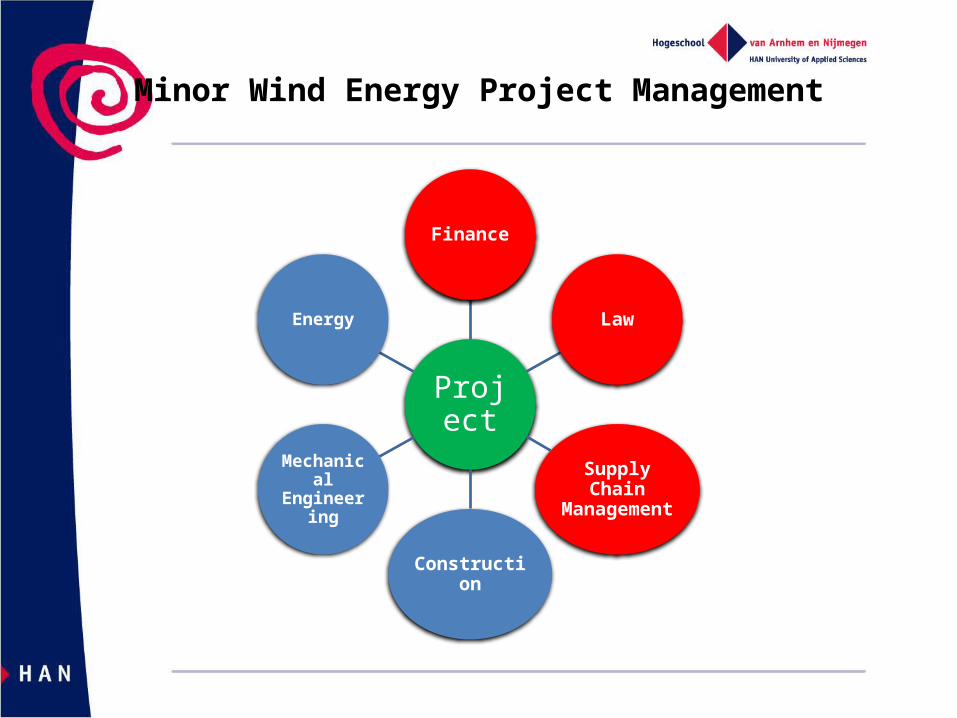
Minor Wind Energy Project Management
Project
Finance
Law
Supply Chain Management
Construction
Mechanical Engineering
Energy
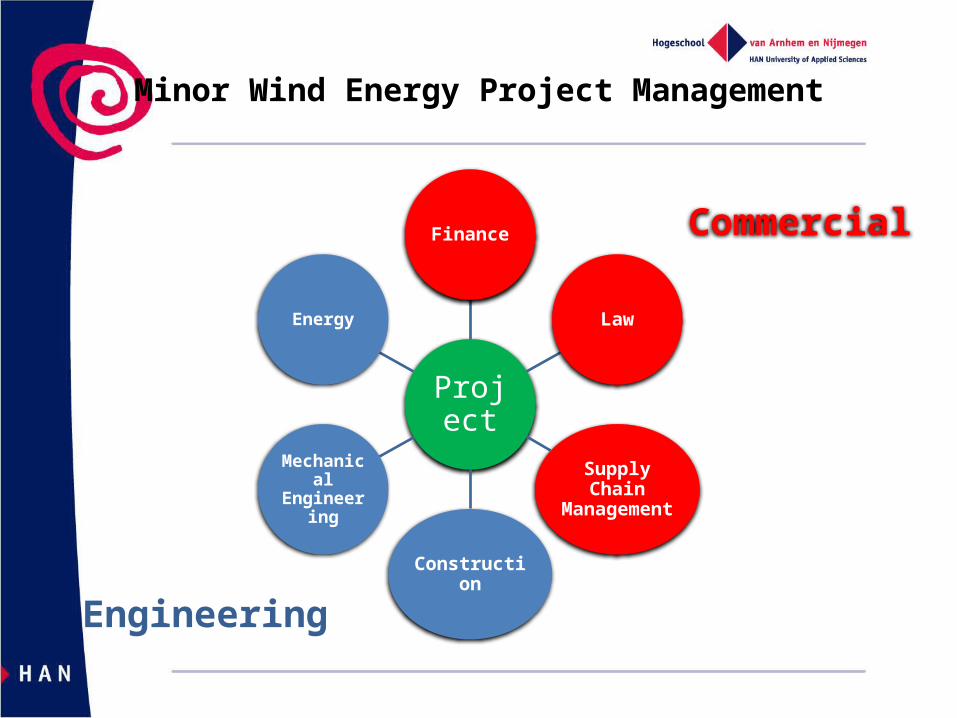
Minor Wind Energy Project Management
Project
Finance
Law
Supply Chain Management
Construction
Mechanical Engineering
Energy
Commercial
Engineering
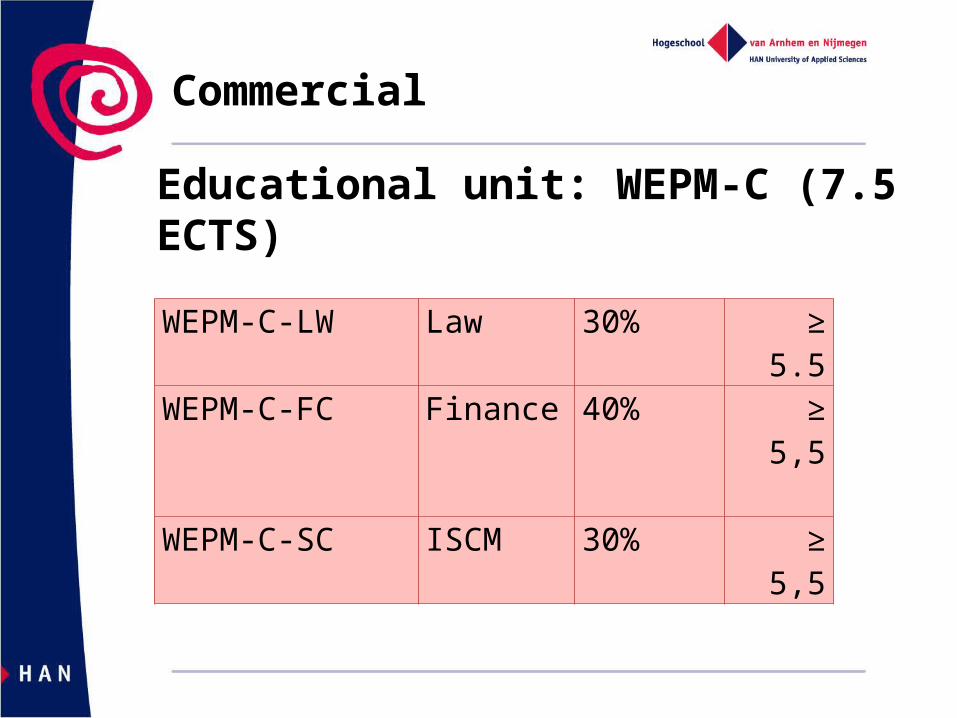
Commercial
WEPM-C-LW Law 30% ≥ 5.5
WEPM-C-FC Finance 40% ≥ 5,5
WEPM-C-SC ISCM 30% ≥ 5,5
Educational unit: WEPM-C (7.5 ECTS)
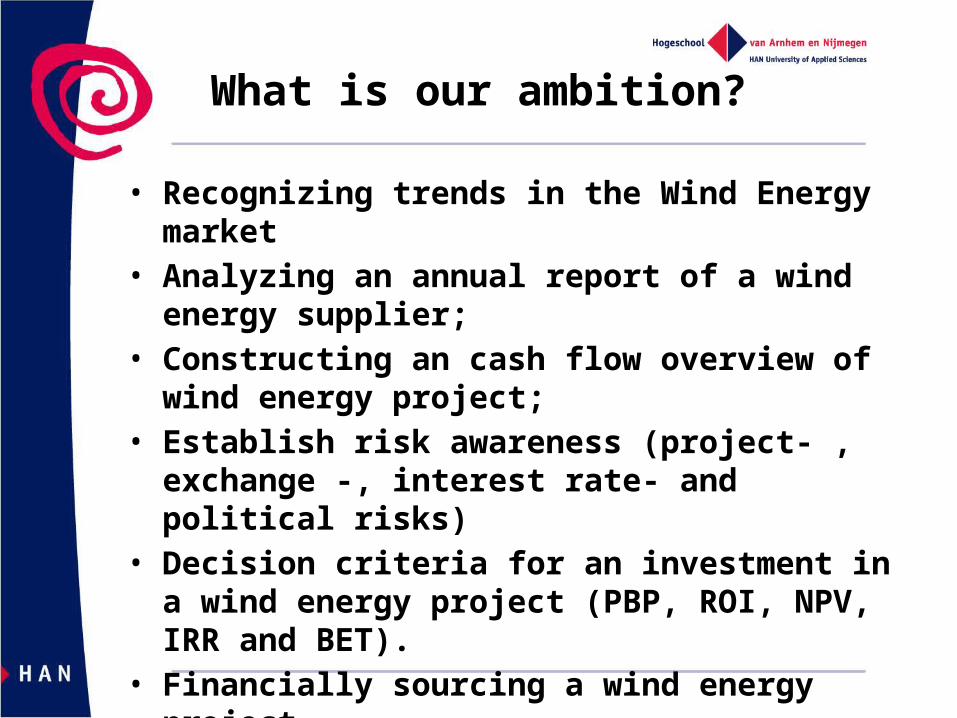
What is our ambition?
• Recognizing trends in the Wind Energy market• Analyzing an annual report of a wind energy
supplier;• Constructing an cash flow overview of wind
energy project;• Establish risk awareness (project- , exchange -,
interest rate- and political risks)• Decision criteria for an investment in a wind
energy project (PBP, ROI, NPV, IRR and BET).• Financially sourcing a wind energy project.
Assessment
• WEPM-C-FC– Written exam of 120 minutes (PW8)
• WEPM-P-FR– Finance will also be assed in the final
report and presentation of the project of this minor
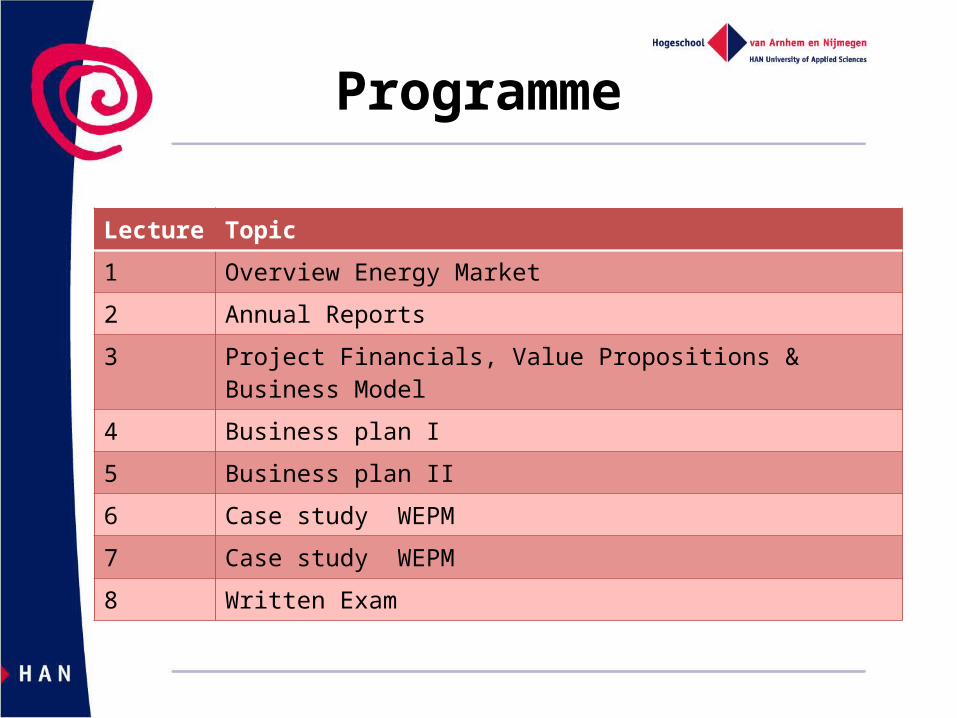
Programme
Lecture Topic
1 Overview Energy Market
2 Annual Reports
3 Project Financials, Value Propositions & Business Model
4 Business plan I
5 Business plan II
6 Case study WEPM
7 Case study WEPM
8 Written Exam
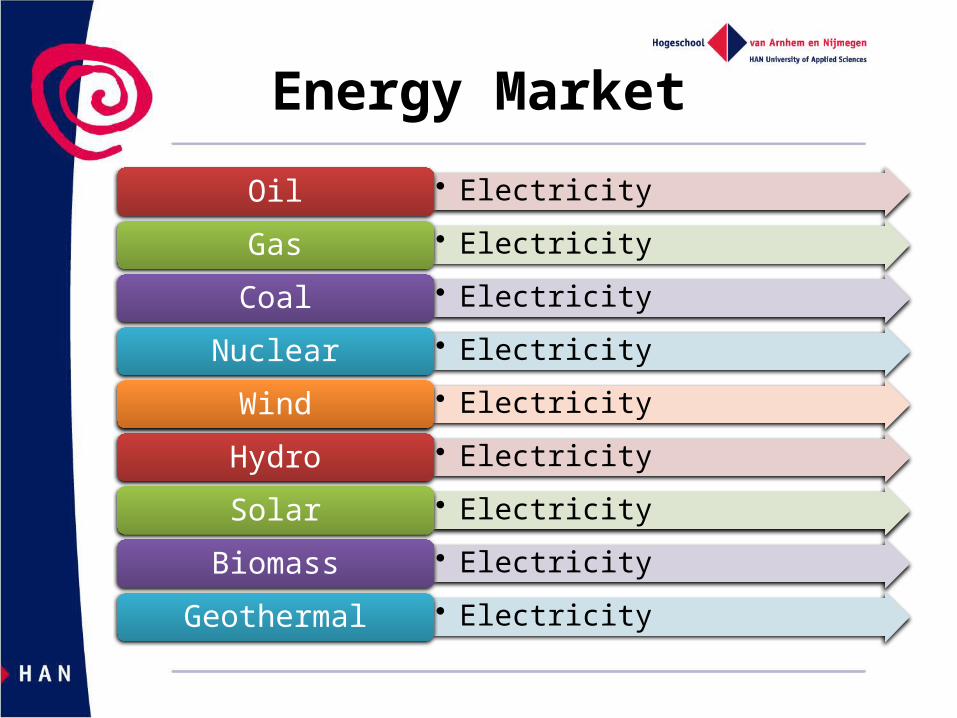
Energy Market
• ElectricityOil• ElectricityGas• ElectricityCoal• ElectricityNuclear• ElectricityWind• ElectricityHydro• ElectricitySolar• ElectricityBiomass• ElectricityGeothermal
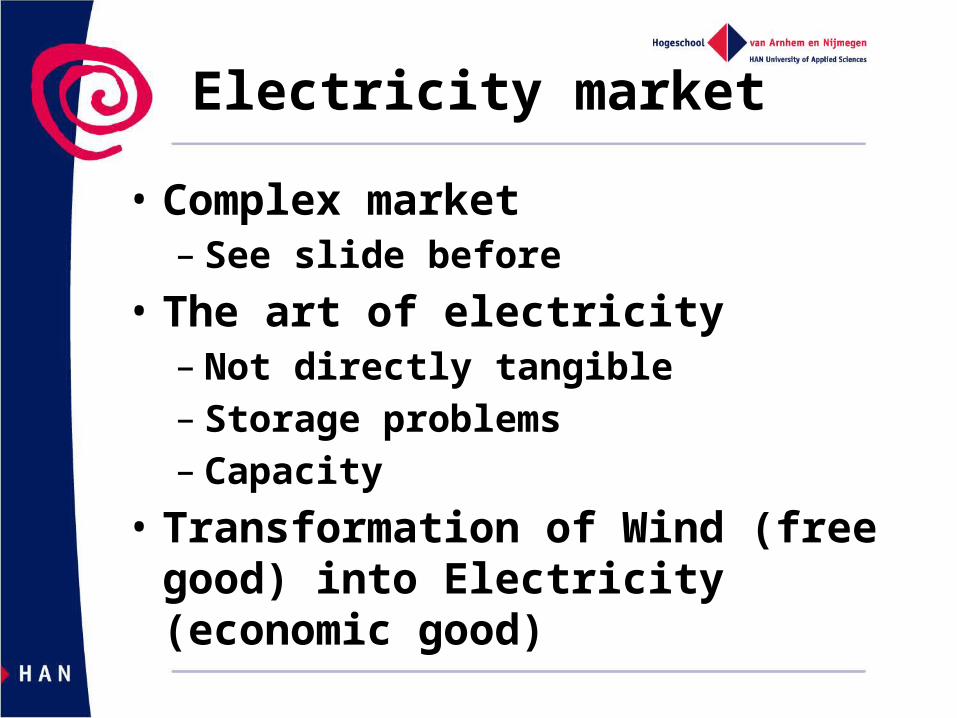
Electricity market
• Complex market– See slide before
• The art of electricity– Not directly tangible– Storage problems– Capacity
• Transformation of Wind (free good) into Electricity (economic good)
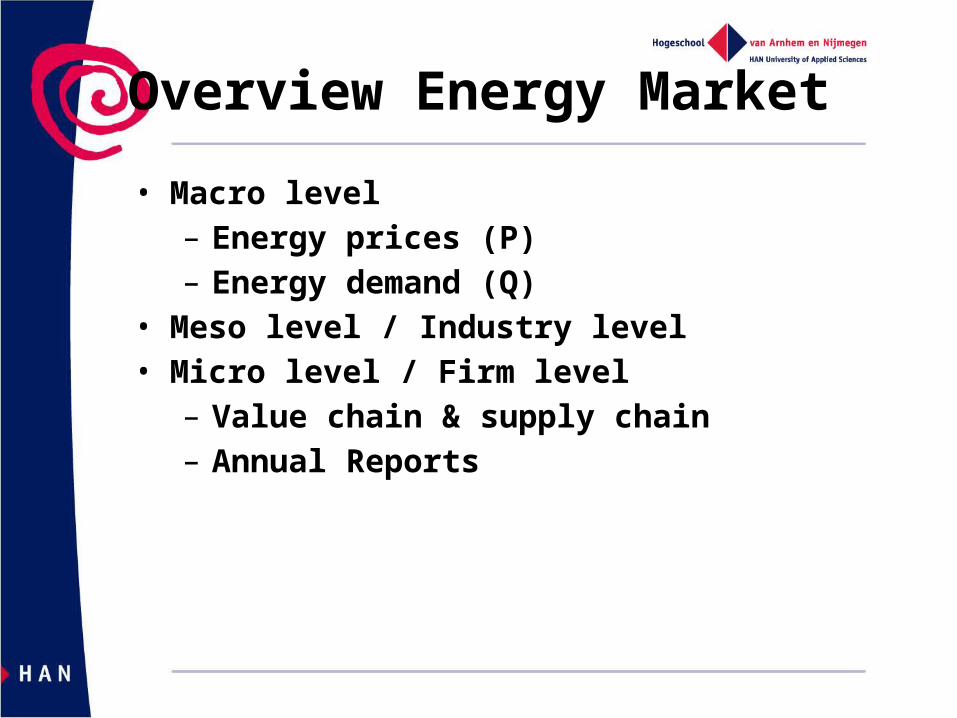
Overview Energy Market
• Macro level– Energy prices (P)– Energy demand (Q)
• Meso level / Industry level• Micro level / Firm level
– Value chain & supply chain– Annual Reports
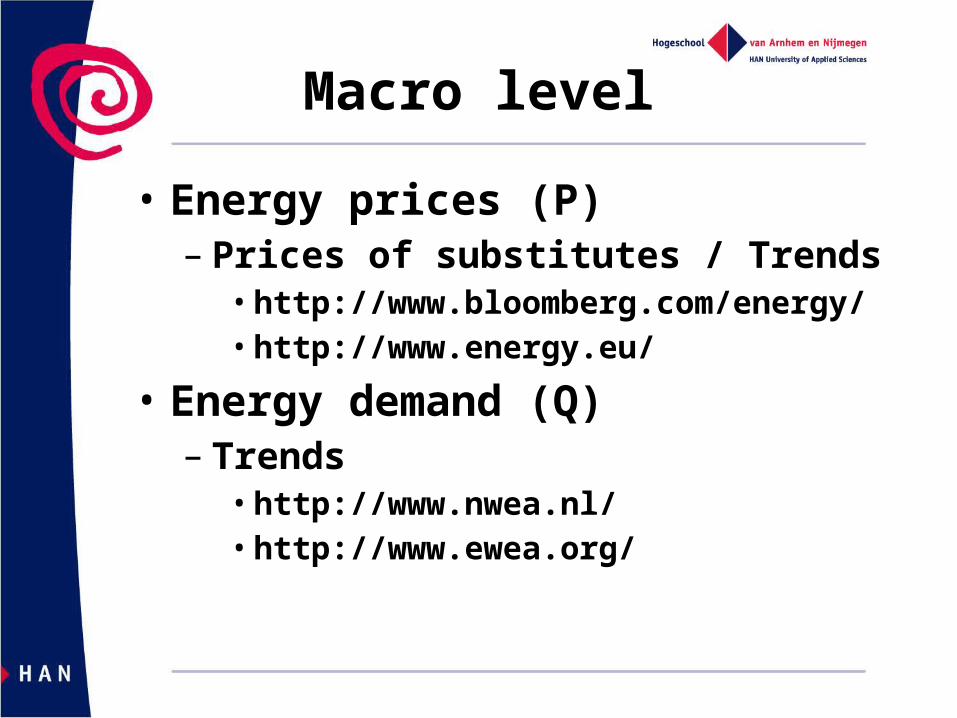
Macro level
• Energy prices (P)– Prices of substitutes / Trends
• http://www.bloomberg.com/energy/• http://www.energy.eu/
• Energy demand (Q)– Trends
• http://www.nwea.nl/• http://www.ewea.org/
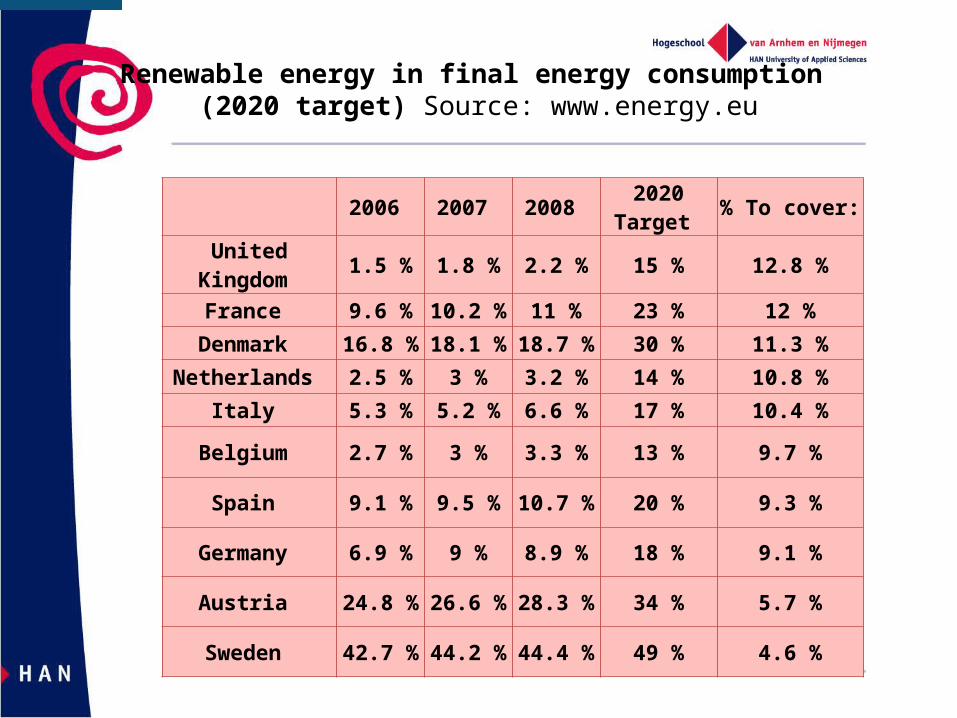
Renewable energy in final energy consumption (2020 target) Source: www.energy.eu
2006 2007 2008 2020 Target % To cover:
United Kingdom 1.5 % 1.8 % 2.2 % 15 % 12.8 %
France 9.6 % 10.2 % 11 % 23 % 12 %
Denmark 16.8 % 18.1 % 18.7 % 30 % 11.3 %
Netherlands 2.5 % 3 % 3.2 % 14 % 10.8 %
Italy 5.3 % 5.2 % 6.6 % 17 % 10.4 %
Belgium 2.7 % 3 % 3.3 % 13 % 9.7 %
Spain 9.1 % 9.5 % 10.7 % 20 % 9.3 %
Germany 6.9 % 9 % 8.9 % 18 % 9.1 %
Austria 24.8 % 26.6 % 28.3 % 34 % 5.7 %
Sweden 42.7 % 44.2 % 44.4 % 49 % 4.6 %
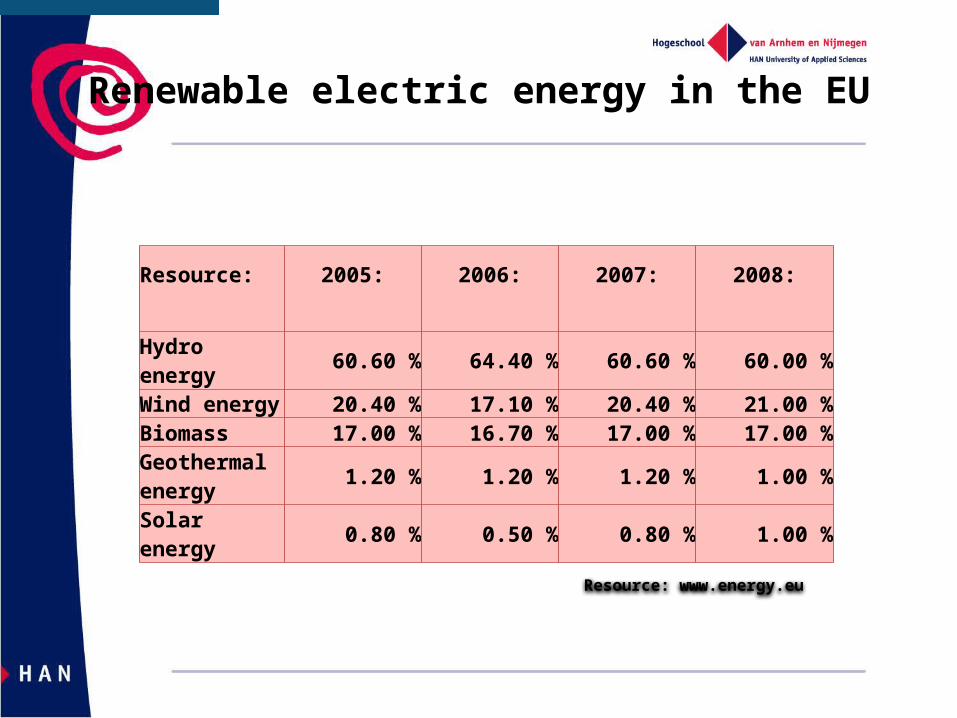
Renewable electric energy in the EU
Resource: 2005: 2006: 2007: 2008:
Hydro energy 60.60 % 64.40 % 60.60 % 60.00 %Wind energy 20.40 % 17.10 % 20.40 % 21.00 %Biomass 17.00 % 16.70 % 17.00 % 17.00 %Geothermal energy 1.20 % 1.20 % 1.20 % 1.00 %Solar energy 0.80 % 0.50 % 0.80 % 1.00 %
Resource: www.energy.eu
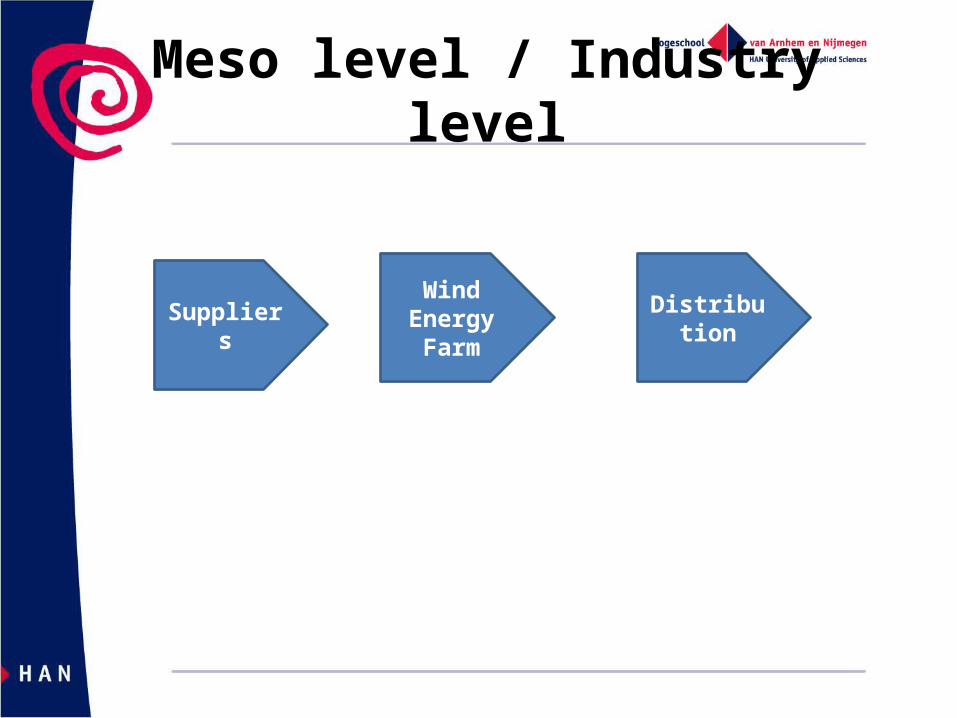
Meso level / Industry level
Wind Energy Farm
DistributionSuppliers
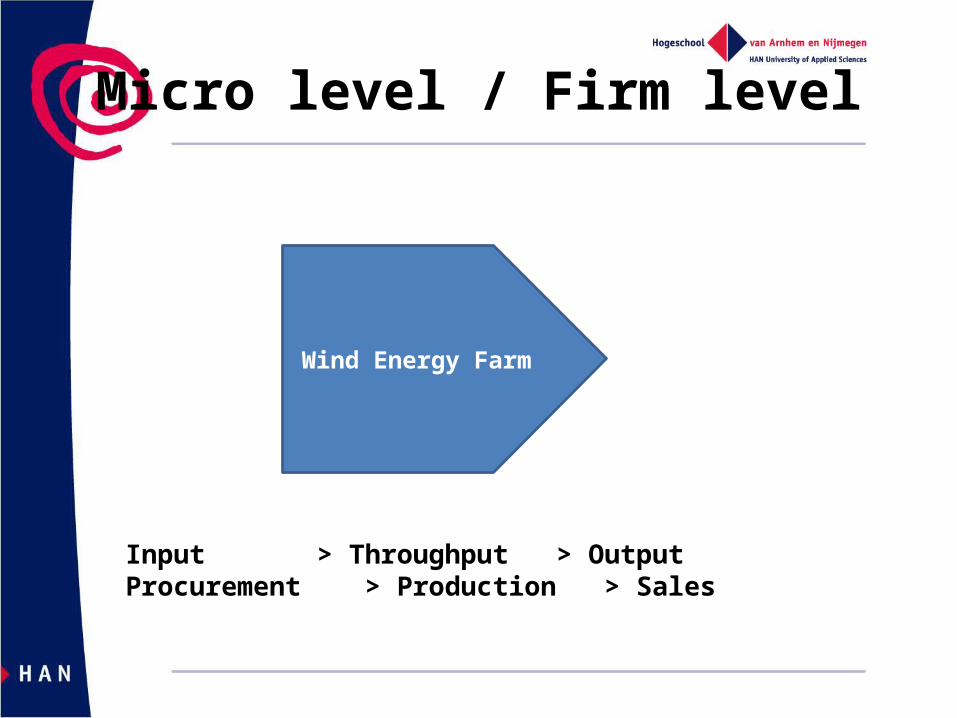
Micro level / Firm level
Wind Energy Farm
Input > Throughput > OutputProcurement > Production > Sales
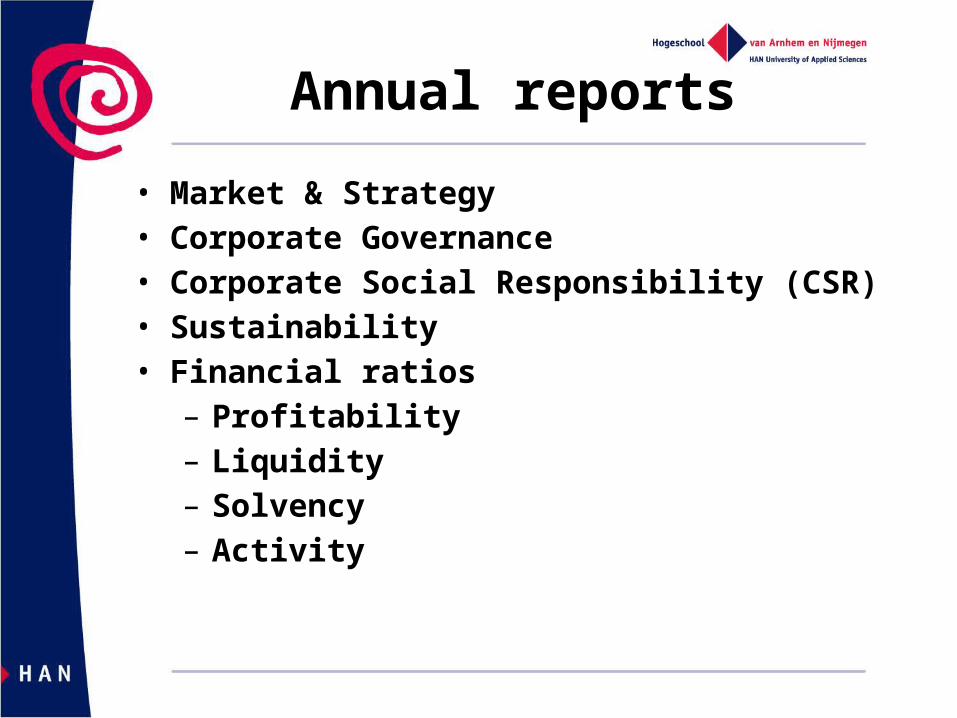
Annual reports
• Market & Strategy• Corporate Governance• Corporate Social Responsibility (CSR)• Sustainability• Financial ratios
– Profitability– Liquidity– Solvency– Activity
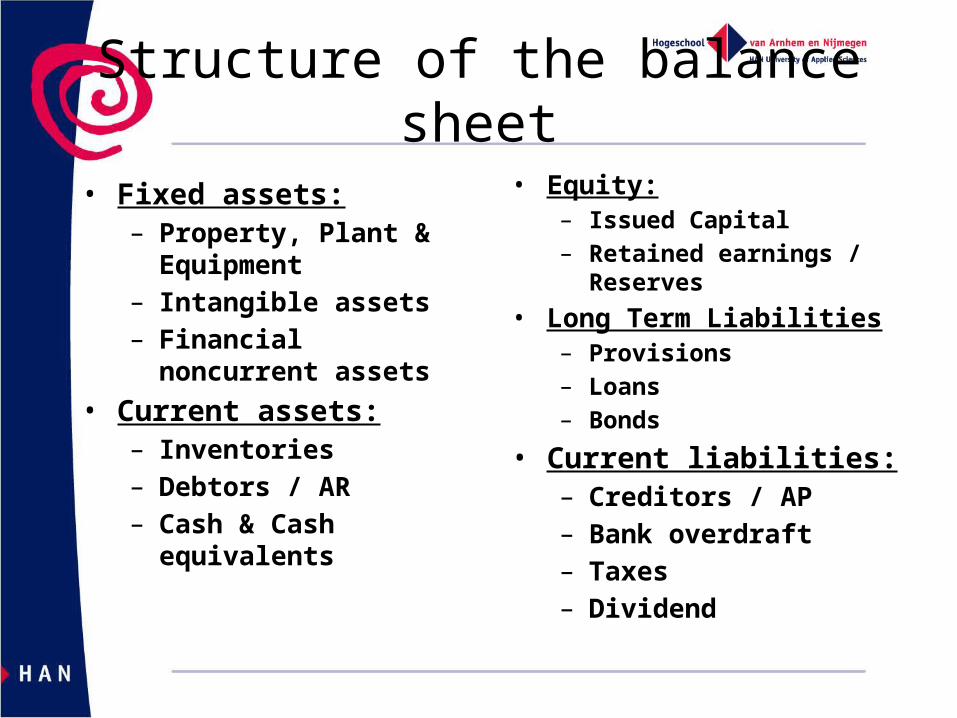
Structure of the balance sheet
• Fixed assets:– Property, Plant &
Equipment– Intangible assets– Financial noncurrent
assets
• Current assets:– Inventories – Debtors / AR– Cash & Cash
equivalents
• Equity:– Issued Capital – Retained earnings /
Reserves
• Long Term Liabilities– Provisions– Loans– Bonds
• Current liabilities:– Creditors / AP– Bank overdraft– Taxes– Dividend
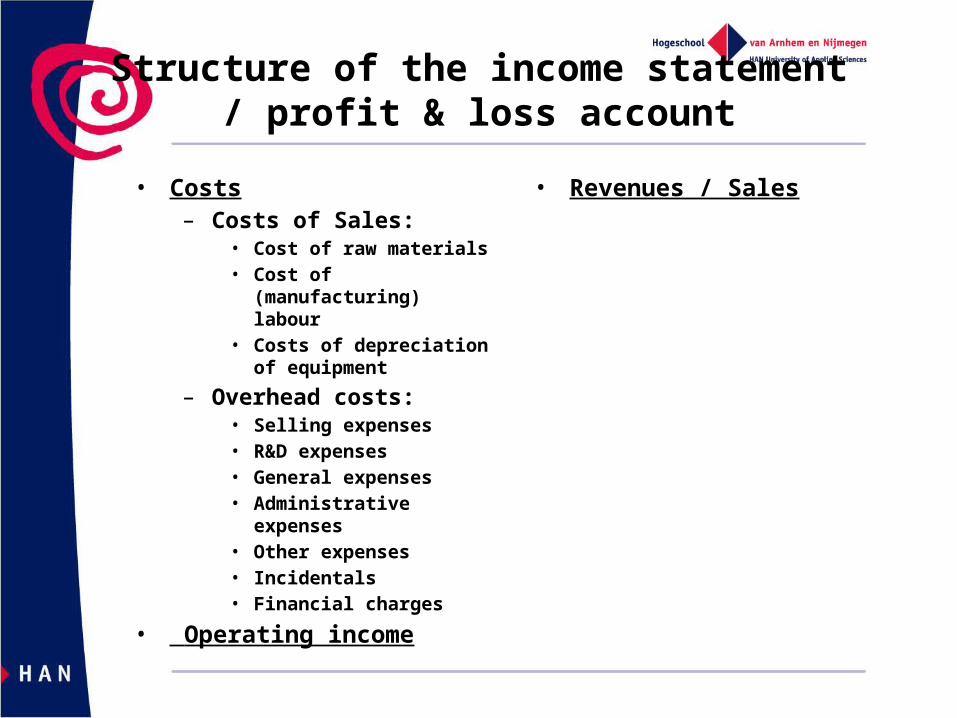
Structure of the income statement/ profit & loss account
• Costs– Costs of Sales:
• Cost of raw materials• Cost of (manufacturing)
labour• Costs of depreciation of
equipment
– Overhead costs:• Selling expenses• R&D expenses• General expenses• Administrative expenses• Other expenses• Incidentals• Financial charges
• Operating income
• Revenues / Sales
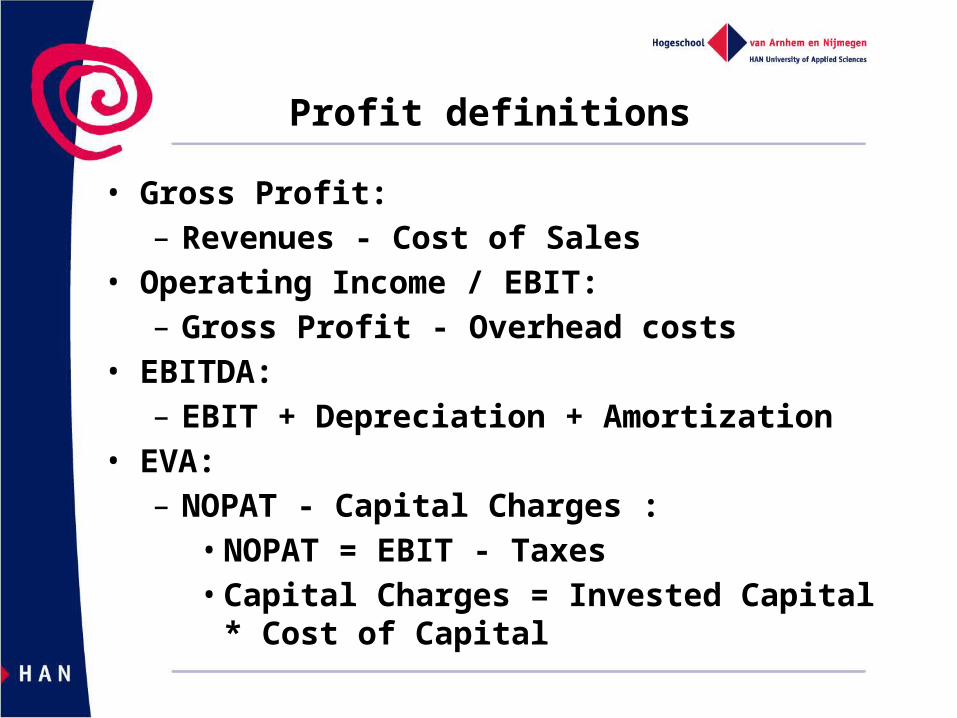
• Gross Profit:– Revenues - Cost of Sales
• Operating Income / EBIT:– Gross Profit - Overhead costs
• EBITDA:– EBIT + Depreciation + Amortization
• EVA:– NOPAT - Capital Charges :
• NOPAT = EBIT - Taxes• Capital Charges = Invested Capital * Cost of
Capital
Profit definitions
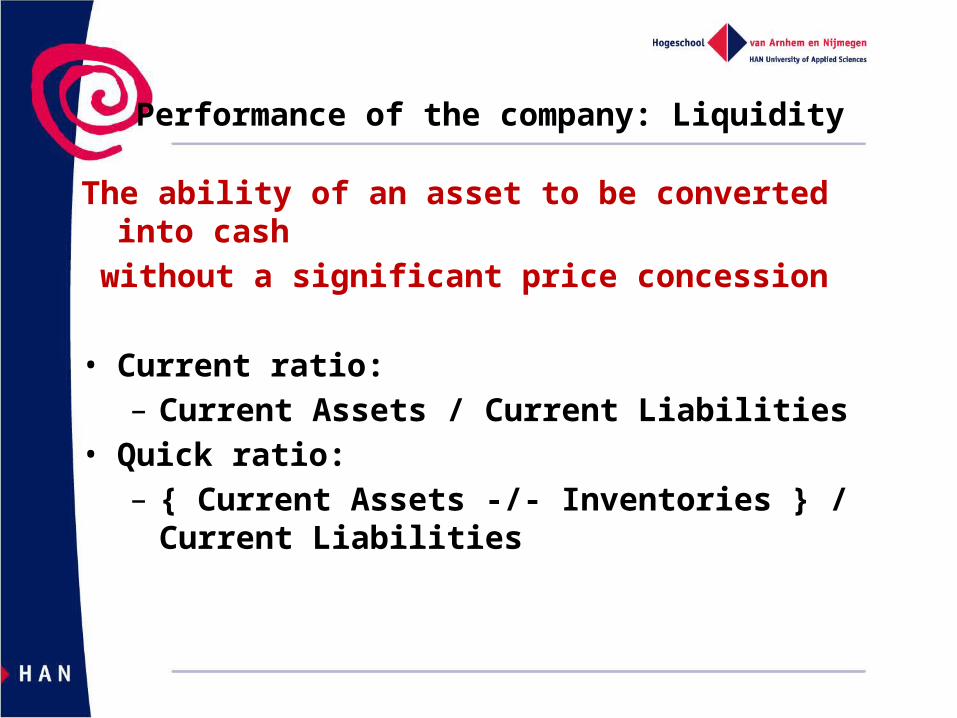
The ability of an asset to be converted into cash
without a significant price concession
• Current ratio:– Current Assets / Current Liabilities
• Quick ratio:– { Current Assets -/- Inventories } / Current
Liabilities
Performance of the company: Liquidity
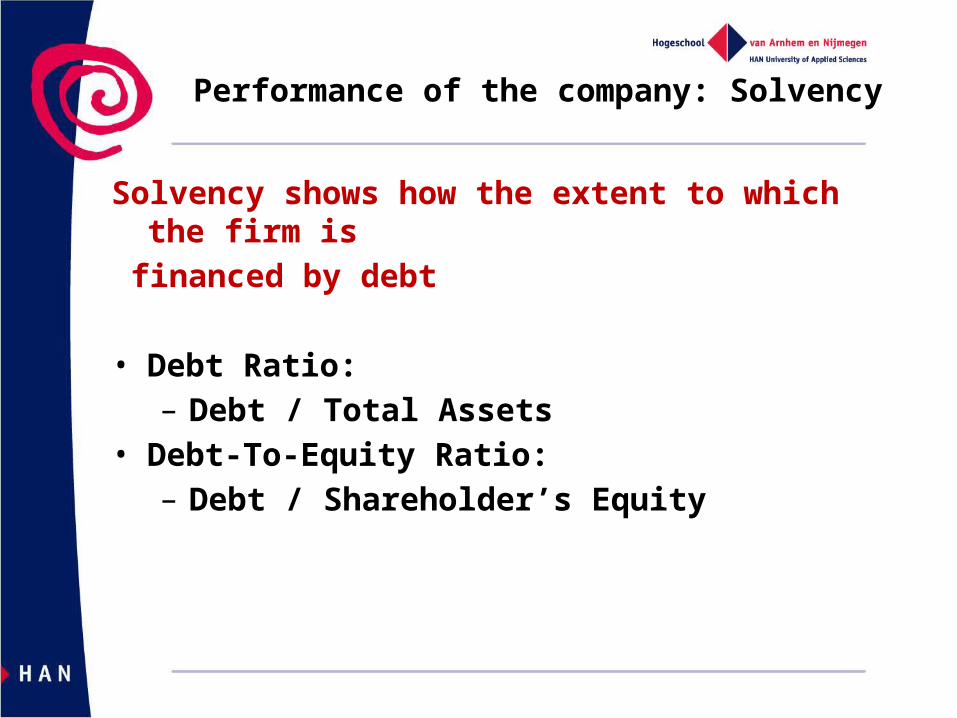
Solvency shows how the extent to which the firm is
financed by debt
• Debt Ratio:– Debt / Total Assets
• Debt-To-Equity Ratio:– Debt / Shareholder’s Equity
Performance of the company: Solvency
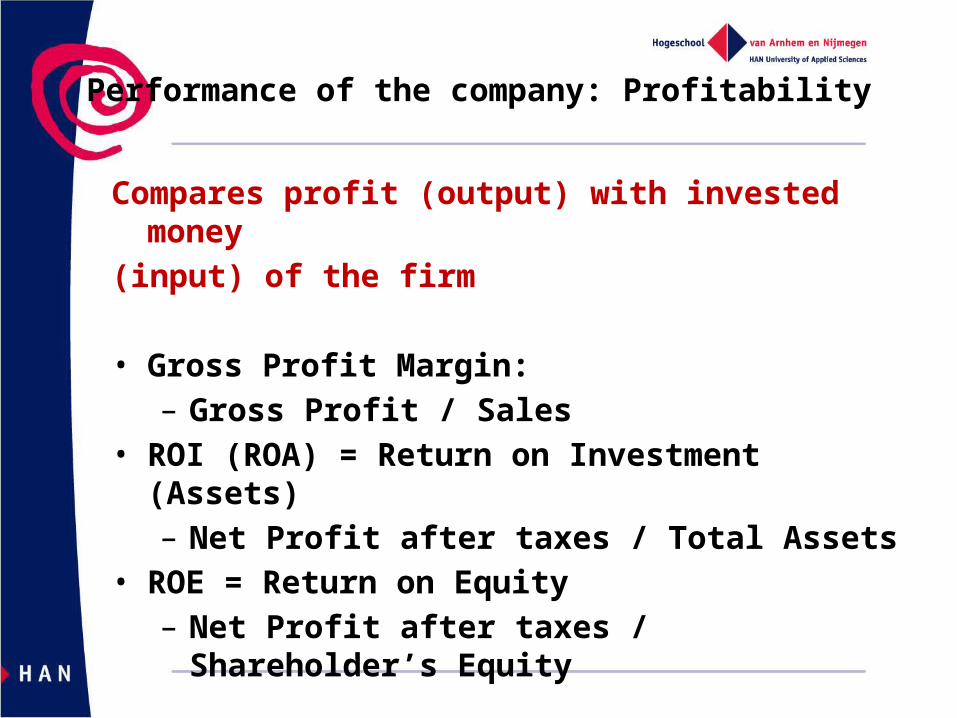
Compares profit (output) with invested money
(input) of the firm
• Gross Profit Margin:– Gross Profit / Sales
• ROI (ROA) = Return on Investment (Assets)– Net Profit after taxes / Total Assets
• ROE = Return on Equity– Net Profit after taxes / Shareholder’s Equity
Performance of the company: Profitability
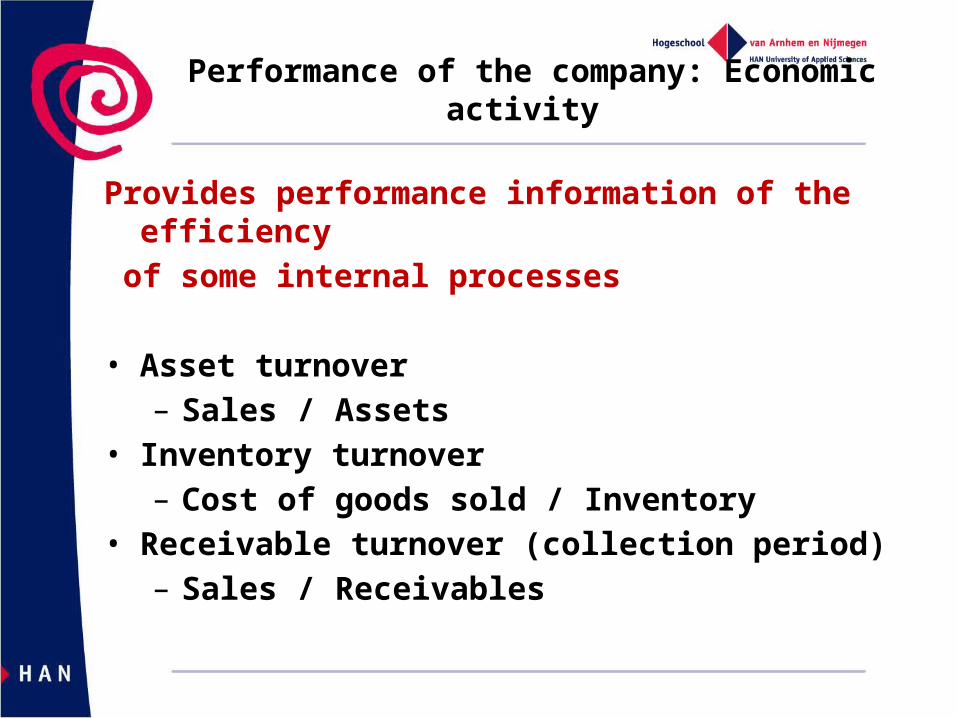
Provides performance information of the efficiency
of some internal processes
• Asset turnover– Sales / Assets
• Inventory turnover– Cost of goods sold / Inventory
• Receivable turnover (collection period)– Sales / Receivables
Performance of the company: Economic activity
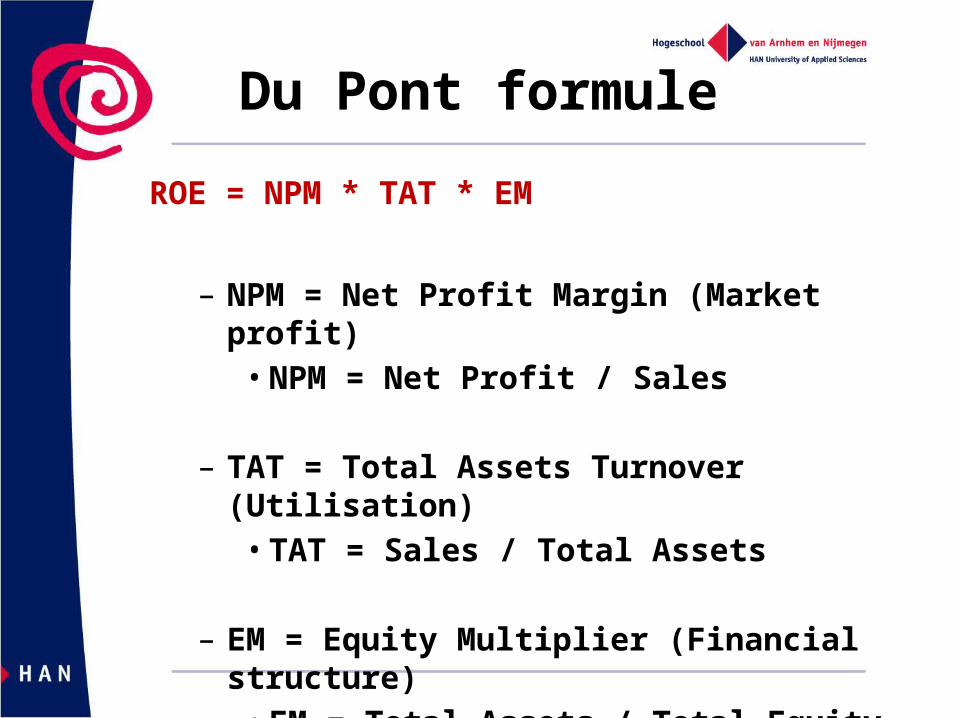
Du Pont formule
ROE = NPM * TAT * EM
– NPM = Net Profit Margin (Market profit)• NPM = Net Profit / Sales
– TAT = Total Assets Turnover (Utilisation)• TAT = Sales / Total Assets
– EM = Equity Multiplier (Financial structure)• EM = Total Assets / Total Equity
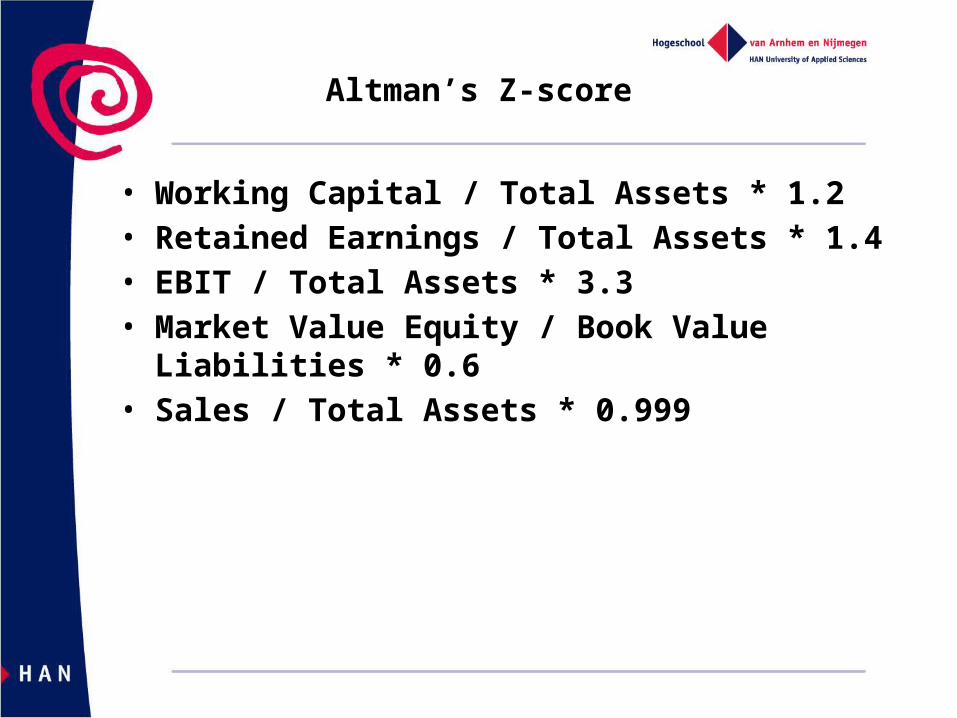
Altman’s Z-score
• Working Capital / Total Assets * 1.2• Retained Earnings / Total Assets * 1.4• EBIT / Total Assets * 3.3• Market Value Equity / Book Value Liabilities * 0.6• Sales / Total Assets * 0.999
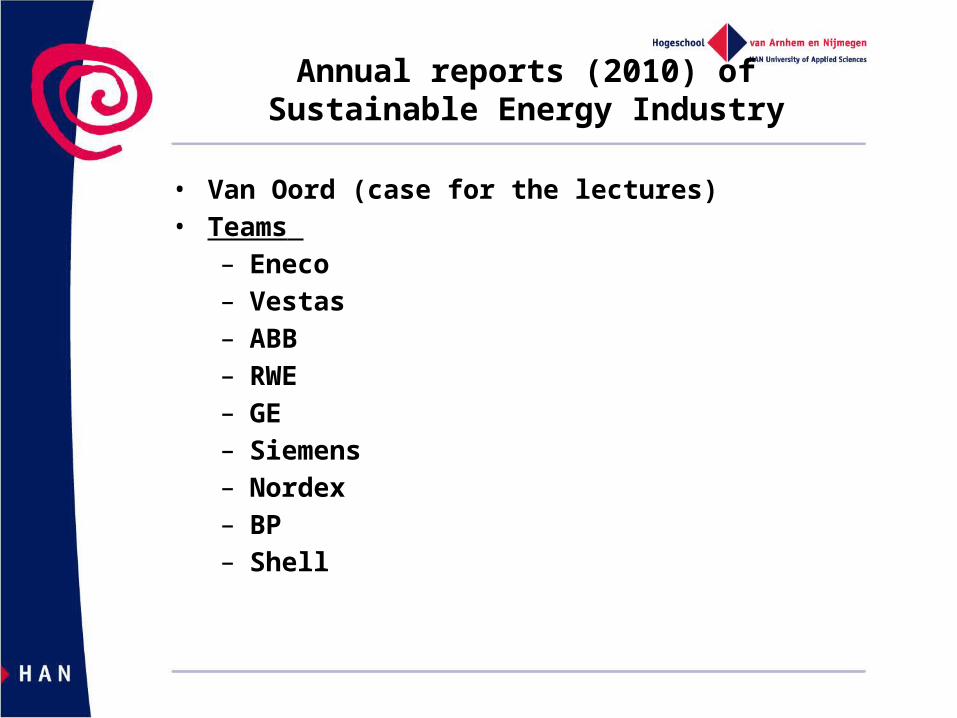
Annual reports (2010) of Sustainable Energy Industry
• Van Oord (case for the lectures)• Teams
– Eneco– Vestas– ABB– RWE– GE– Siemens– Nordex– BP– Shell
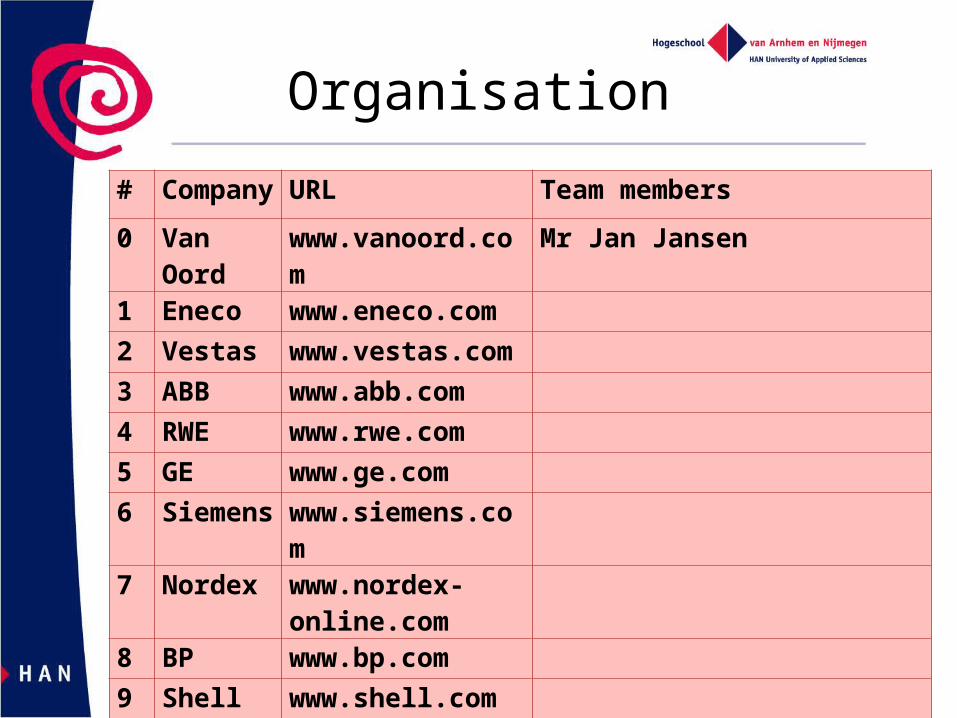
Organisation
# Company URL Team members
0 Van Oord www.vanoord.com Mr Jan Jansen1 Eneco www.eneco.com2 Vestas www.vestas.com3 ABB www.abb.com4 RWE www.rwe.com5 GE www.ge.com6 Siemens www.siemens.com7 Nordex www.nordex-
online.com8 BP www.bp.com9 Shell www.shell.com