Embed Size (px)
Citation preview
1
Characterization and Sustainability Assessment of
Pineapple‐based Cropping Systems in Costa Rica: A
baseline study for sustainable sourcing of organic
pineapple
Namestudent:MariaPiaGamboa Period:2013‐2014
FarmingSystemsEcologyGroupDroevendaalsesteeg1–6708PBWageningen‐TheNetherlands________________________________________________________________________
___

2
3
(title page)
Characterization and Sustainability
Assessment of Pineapple‐based
Cropping Systems in Costa Rica: A
baseline study for sustainable sourcing
of organic pineapple Namestudent(s):MariaPiaGamboaRegistrationnumberstudent:870821‐249‐090Credits:Codenumber:FSENamecourse:Period:Supervisor(s):Dr.JohannesScholbergandWalterRossingProfessor/Examiner:Dr.PabloTittonell
4
Preface ThestartingpointforthisthesiswasaninternshipatEOSTAthelargestimporteroffreshorganicproduce inEurope that is located in theNetherlands.Aspartof thisinternship I was asked by Henk Zoutwelle, pineapple buyer from EOSTA and amember of the Sustainable Pineapple Alliance (SPA), to engage in a desk studyaiming to research and design more sustainable and diverse pineapple‐basedcropping systems in Costa Rica. Upon the completion of this internship it wasdecided that an additional in‐country farm and production chain characterizationwaswarrantedtobetterassessthecurrentsituation.ThethesiswassupervisedbyJohannes Scholberg and Walter Rossing (WUR‐FSE), the latter being alsoinstrumentalinstructuringfollow‐upprojectactivities.ThesubjectofthisthesiswasveryrelevanttomebecauseasaCostaricancitizenIam concerned about the current production practices in pineapple and organicagriculture.Workingseveralyears inorganiccertificationasan inspector inCostaRica, Ivisitedseveralorganicagriculturalprojects.Eventhoughregulationsexist Ihadmydoubtsofthelong‐termsustainabilityofthesefarmingsystems.AcroplikepineappleinCostaRicahascausedconsiderableenvironmentaldamageintheareasand communities where they are being cultivated. Moreover, most of theconventional producers, which transitioned into organic, did not have a trulyorganic production philosophy. Rather they tended to simply take conventionalpracticesandadaptedthemtocomplywithlocalcertificationstandards.Asaresult,there are many technical gaps for organic plant production in several crops,especiallyforacropthatisintenselyproducedlikepineapple.Besidesmyinterestinimprovingagriculturalpractices,Iwanttosupportsmallfamilyfarmsandprovidedthem with alternative business models that will enable them to enhance foodsecurity and for their organic farms to be economically to be more viable.Throughoutthisstudy,differentactorshaveexpresseddoubtsofsmallholdersbeingable to organize themselves and to be successful as an export business of highqualityproduce.However,Ibelievethisispossiblebutthereistheneedtoprovideadequatetechnicalduringtheinitialtransition.Basedonlocalresearchinordertoimprovepracticesandorganizationalschemesforproducers.Duringmy thesis research I observed that there are very pronounced differencesbetween thepracticesof producerswhichexport andproducerswhich sell in thelocal market. It appears that the differences and diversity in product qualitystandardsandcorrespondingskillsofdifferenttypesofproducersmaybeusedtosupport a co‐innovation process. This may entail effective exchange of different
5
farmingpracticestostructurebestfittechnologiestoenhancemoresustainableandefficient systems. Even though some producers reject the concept of workingtogether, specially the larger farms, an exchangeof information among themmaysupport development ofmore sustainable cropping systems. Through this study Ihopetoprovideabasistoinspirefuturedevelopments.Therebyhopetocontributeto the development of a more sustainable value chain for pineapple during asubsequentstageofthisongoinginitiativeandconsolidatetheseeffortsinalargerinternationalsupportedproject.
6
AcronymsAF(AgroecologicalFarm)CANAPEP(CámaraNacionaldeproductoresyexportadoresdepiña/NationalAssociationofPineappleproducersandexporters)CF(ConventionalFarm)MAG(MinistryofAgricultureandLivestock)MESMIS(SpanishacronymforIndicator‐basedSustainabilityAssessmentFramework)MM(MountainMicroorganisms)OA(OrganicAgriculture)OF(OrganicFarm)PROCOMER(PromotoradelcomercioexteriordeCostaRica/ForeigntradePromotorofCostaRica)RHN(RegiónHuétarNorte)UNA(NationalUniversityofCostaRica)UCR(UniversityofCostaRica)WUR‐FSE(WageningenUniversity_FarmingSystemsEcologygroup

7
Abstract ‐Executive Summary Sustainabilityassessmentasbasis fordevelopmentofsoundfarmingpracticeshasbecomeakeyfocusformanyresearchers,policymakersanddevelopmentstudiesthroughout the world. There is increased interest in creating multifunctionalsystems. Such systems can enhance farmer’s livelihoods, reinforce local foodsecurity, preserve natural resources, improve (bio)diversity, among many moresocio‐ecological functions and services, which is essential in the context ofstructuringsustainablefarmingsystems.As mentioned above this paper examines overall sustainability of existingpineapple‐based systems in Costa Rica, comparing different farming systems,conventional aswell as organic. The sustainability assessment is basedmainly onthe MESMIS framework as well as other methodological approaches. The DEED(Giller et al., 2008) conceptual frameworkwas used to guide the overall farmingsystem analysis and data collection was structured such to facilitate farmcharacterization. This information was also linked to the entire value chain anddifferent actors and stakeholders were engaged throughout the whole analysisprocess.Theoverallaimwastogeneratechangeinthesesystemsbasedoneffectiveuse of participatory approach and co‐innovations techniques thereby providing abroadbasisforasubsequentre‐designphase.Existing tools anddiverse activities such as farm surveys, expert interviews, farmtypology; problem trees, workshops and were used to develop a method tocharacterize farms and their sustainability. As part of this process the in‐depthcharacterizationwas linkedwith thedecisionmakingprocessof farmerstargetingimprovement of their livelihood via initial assessment of viable farming designsalternatives. A guideline documenting this entire process is presented in thedifferentchaptersofthisthesis.These guidelines aimed to define the necessary steps, best methods to gatherrequired information necessary as a prerequisite of the re‐designing of localsystems.Thisofcoursebasedontheexplicitneedsof farmers,government,policymakers,importers,andbuyersamongotherstakeholders.InthecaseofRHNthemultivariateanalysisrevealedtheexistenceof7farmtypesinthenorthernregionofCostaRica,small:macro/micromixedfarmingsystemsandmicro/macromonoculturesystems,medium,bigandorganic farms. Thetypologyobtainedfromthisresearchexposedvitalinformation,makingtheacknowledgmentthat thereare stillmixed farming systemsamongpineapplegrowers.Theneed tostudytheresourceuseefficiencyandfarmperformanceshouldbeexploredfurther.The wide variety of farmers presented in the study might have differences inresourceuse efficiency and farmperformancenot identifiedwith thequantitativedata gathered during this research study. The farmers do not collect or annotate
8
certain information of importance for this study. The data missing includesinformation on soil samples, rotation schemes, input use and costs, applicationrates,amongmorevariables.Thelackofdatafromthefarmersmadethisanalysisnotpossible.Eventhoughduringthisresearchthecomparisonofonlythreefarms:bigconventional,bigorganic forexportmarketandsmallorganic for localmarketwascompleted inmoredetail.Bigorganic farmswere found tobemore intensivethan conventional farms by using more resources, labor and obtaining similaryields. An interesting finding from the producers of this region is that theiragriculturalpracticesvarywidelydependingof themarketorientation,weather islocal or for export as well as their farm size. Identification of characteristics offarmer is essential in order to developing suitable strategies for agriculturalplanning at different levels like policymaking, individual farm strategies, ororganizationalschemesfordifferentsizedproducersInconclusionhowcanthisfindingshelpdesignnewstrategiesforfarmersaccordingtotheirneedsanddifferences?Isthisthecaseforallmedium,smallfarmsorientedtoexportsmarkets?Oraretheirfurtherdifferencesdependingonsize/market?Canalternativemore sustainable farming practices be implemented inmore intensivebigorganicfarms?Cansmallandbigfarmsexchangepracticestohavebetterfarmperformances and become sustainable throughout time? Many more questionsarousedafterthisresearchproject.
9
Table of Contents
1. INTRODUCTION............................................................................................................................151.1GLOBALTRENDSANDDEVELOPMENTS......................................................................................................151.2 HISTORYANDBACKGROUND...................................................................................................................161.3PROBLEMSTATEMENT..................................................................................................................................171.4KNOWLEDGEGAPS........................................................................................................................................211.5RESEARCHOBJECTIVES.................................................................................................................................211.5.1MainObjective............................................................................................................................................211.5.2SpecificObjectives.....................................................................................................................................22
1.6RESEARCHQUESTIONS..................................................................................................................................221.6.1Mainresearchquestion..........................................................................................................................221.6.2SpecificQuestions......................................................................................................................................22
1.7THESISSCOPE.................................................................................................................................................24
2.MATERIALSANDMETHODS..........................................................................................................252.1PROFILINGOFTHEPINEAPPLEINDUSTRY.................................................................................................252.2DIVERSITYOFFARMINGSYSTEMS...............................................................................................................262.2.1Farmtypology.............................................................................................................................................262.2.2SustainabilityAssessment(MESMISAnalysis)............................................................................31
2.3GLOBALSYSTEMPERFORMANCEANDPARTICIPATORYMETHODS.........................................................352.3.1SWOTAnalysis............................................................................................................................................352.3.2ParticipatorySystemEvaluationTechniques..............................................................................35
3.RESULTS..............................................................................................................................................403.1PROFILINGOFTHEPINEAPPLEINDUSTRY.................................................................................................403.1.1GovernmentalPoliciesandtraditionalcropshiftingfromthe1950’s‐1980’s.............403.1.2EvolutionofMarketOrientedfruitproductioninCostaRica..............................................413.1.3ProfilingoftheagriculturalindustryinRHN..............................................................................423.1.4EvolutionofpineapplefarmsinCostaRica..................................................................................483.1.5Marketrequirements,sustainableproductionandmarketniches....................................53
3.2DIVERSITYOFPINEAPPLEGROWERSINRHN...........................................................................................553.2.1Existingfarmtypologies........................................................................................................................553.2.2FarmTypology‐MultipleCorrespondenceAnalysis.................................................................55
3.4DETAILEDCHARACTERIZATIONOFFARMTYPESINRHNREGION........................................................613.3SUSTAINABILITYASSESSMENTOFDIFFERENTFARMOPERATIONS.......................................................653.3.1MESMISAnalysis........................................................................................................................................65
3.4SWOTANALYSIS............................................................................................................................................703.6DIFFERENCESINCONSTRAINTSANDMANAGEMENTSTRATEGIESAMONGFARMTYPES....................713.6.1PerceivedproblemsofdifferentfarmgroupsinRHN..............................................................723.6.2Farmpractices,markets,andinnovations....................................................................................74Localmarkets.........................................................................................................................................................74
4.DISCUSSION.........................................................................................................................................78
5.CONCLUSIONS....................................................................................................................................82
6.RECOMMENDATIONS......................................................................................................................83
10
6.1FUTURESOLUTIONS‐PROJECTCONCEPTUALIZATION.............................................................................836.2KEYFOCALPOINTSFORDESIGNINGPILOTSTUDIES.................................................................................84New Design ..........................................................................................................................................................86
6.3RESEARCH‐OPPORTUNITIESFORIMPROVINGPRODUCTIONSYSTEMS................................................87
7.REFERENCES......................................................................................................................................89
8.ANNEXES.............................................................................................................................................95ANNEX1.QUESTIONNAIRESFORSMALLPRODUCERS.....................................................................................95ANNEX2.PROBLEMTREES..............................................................................................................................102ANNEX3.WORKSHOPAGENDA......................................................................................................................105ANNEX4.WORKSHOPATTENDANTS.............................................................................................................106ANNEX5.RESULTSFROMRPROGRAM‐BOXPLOTSANDFACTORIALMAPS...........................................107
11
Index of Tables
Table1.LinkageofresearchQuestionstomethodology,informationsources,
deliverablesandrelevantcitations.......................................................................................23Table2.Producersvisitedforrespondingfarmsurveysandinterviews.......................28Table3.RankingofQualitativeandQuantitativedatatosortvariablestoincludein
MCAAnalysis...................................................................................................................................29Table4.Descriptionofthevariablesandclassescreatedforthetypologyandfarms
distribution......................................................................................................................................30Table5.SustainabilityIndicatorsforassessingthreeselectedfarmsinRHNregion
basedonsustainabilityattributes,diagnosticcriteriaandcorrespondingindicators,methodsandcriticalpointsthatwereusedtogeneratespiderdiagramstovisuallydepictsystemperformancefordifferentfarmtypes(adaptedfromDogliottietal,2013).....................................................................................33
Table6.OutlineofscoringgraduationemployedwhileassessingsustainabilityIndicatorsforsocialandenvironmentalfactors,whichcouldnotbequantifieddirectly(AdaptedfromWaney,etal.,2014)....................................................................34
Table7.Farmsselectedforassessmentoffarmperformanceanalysis..........................35Table8.Methodologyusedduringtheworkshopthatelucidatedtheopinionofthe
differentstakeholderswithintheorganicpineapplesectorandotherkeyinformantsandactors(conventionalproducers,governmentalrepresentatives).(Serna,.2013).............................................................................................38
Table9.CostaRica:BasicGrainsexteriorcommercein100TM(annualmeanduringperiod1960‐1970)Source:Cartin,1980............................................................................40
Table10.CultivatedAreaofthemaintropicalfruitsduring2000‐2008inCostaRica.(MAG,2010).....................................................................................................................................41
Table11.DistributionofhaforthedifferentagriculturalindustriesidentifiedinCostaRica.(MAG,2010)............................................................................................................42
Table12.CharacterizationoffarmsintheRHNinrelationtotheirstrategy.Source:Faure,2004......................................................................................................................................45
Table14.Surface(ha)ofnewexportcropsin5municipalitiesofRHNin2000.(Source:Faure,2004)..................................................................................................................46
Table13.Summaryofpineappledata.Useofenergyinputs(pesticides,fertilizersandfuelconsumption).Source:Ingswere,2012.............................................................45
Table15.Distributionofcultivatedlandbetweenfamiliesbasedsystemsandcompaniesin2004.(Source:SEPSA,RegionalSurveyoffruitsandtropicalroots,2005,UNICERSE2004)..................................................................................................47
Table16.Shareofdifferentcropsonfamilyandindustrializedfarmstotalcropland................................................................................................................................................................47
12
Table17.Examplesoftheraiseofpricesofdifferentactivitiesorinputsinthepineappleindustry.Source:ElFinancieroNewspaper,CostaRica........................50
Table18.Outlineofkeyagronomicpractices,productionsystemfeaturesandproducertraitsfordifferentperiodsinCostaRicabasedondifferentliteraturesourcesandstakeholderinterviews.....................................................................................52
Table19.BasiccostofproductionforconventionalandorganicpineappleMD‐2.(Kellon,D.,R.León,andR.Marsh.2011.)...........................................................................54
Table20CharacteristicsProducersinCostaRica.(Source:Aravena.2005,Kellon.2011andMAG2007)...................................................................................................................55
Table21.Modalitiesforthedifferentvariables,andthepercentageeachclassrepresentsfromthetotalsample...........................................................................................57
Table23.SummaryofCharacteristicsofthe7farmtypesresultingfromtheMultipleCorrespondenceAnalysisandtheHierarchicalClusteringperformedon28farmsfromtheRHN.....................................................................................................................64
Table24.SustainabilityIndicatorScoresforthreepineapplesystems:LargeConventional(C)andOrganic(O)Farm(bothandanAF(AgroecologicalFarm)inoriginalunitsandaspercentages(inparenthesis)ofreferencevalues(TableadaptedfromS.Lopez‐Ridauraetal.2002).......................................................................65
Table25.ComparisonProductionCosts/haofCFandOF2012.......................................66Table26.Comparisonbetweenfertilizerandmachineryinputuseand
correspondingyieldoftheorganicvs.conventionalpineapple...............................67Table27.ScoringofproblemsidentifiedbythefarmersoftheRHN,separatedby
sizeandnotfarmertypesobtainedduringtheMCA.....................................................72
Index of Figures
Figure1.Theglobalmarketfororganicfoodanddrink:Marketgrowthfrom1999‐
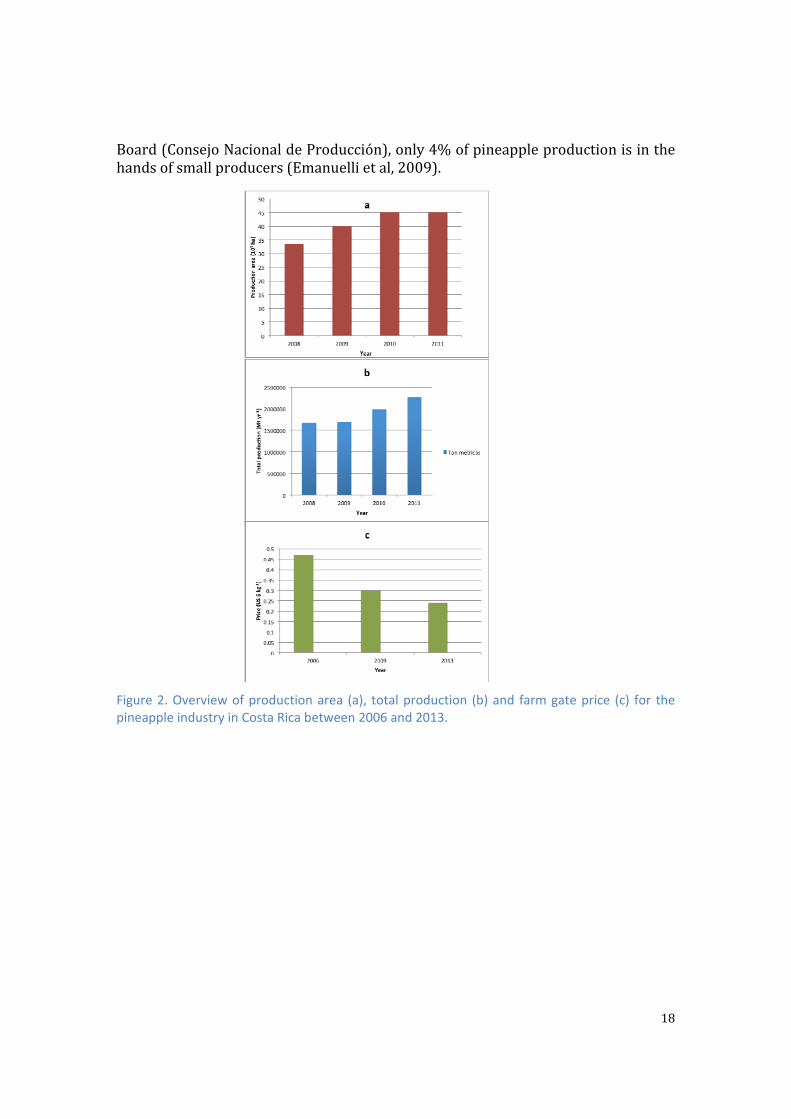
2011.Source:Willeretal.2009..............................................................................................14Figure2.Overviewofproductionarea(a),totalproduction(b)andfarmgateprice
(c)forthepineappleindustryinCostaRicabetween2006and2013..................18Figure3.CostaRicannewspaperLaNaciónpg20A.Publishedonthe20thofJune
2013.Thenewspapershowsatimelinefrom2001,whentherapidexpansionofthepineappleindustrytookplace,until2012.Translationinwhite....................19
Figure4.Pineapplegrower’sopinionabouttheexchangeoftechnicalinformationwithinthesector.(Kellonetal,2011)..................................................................................20
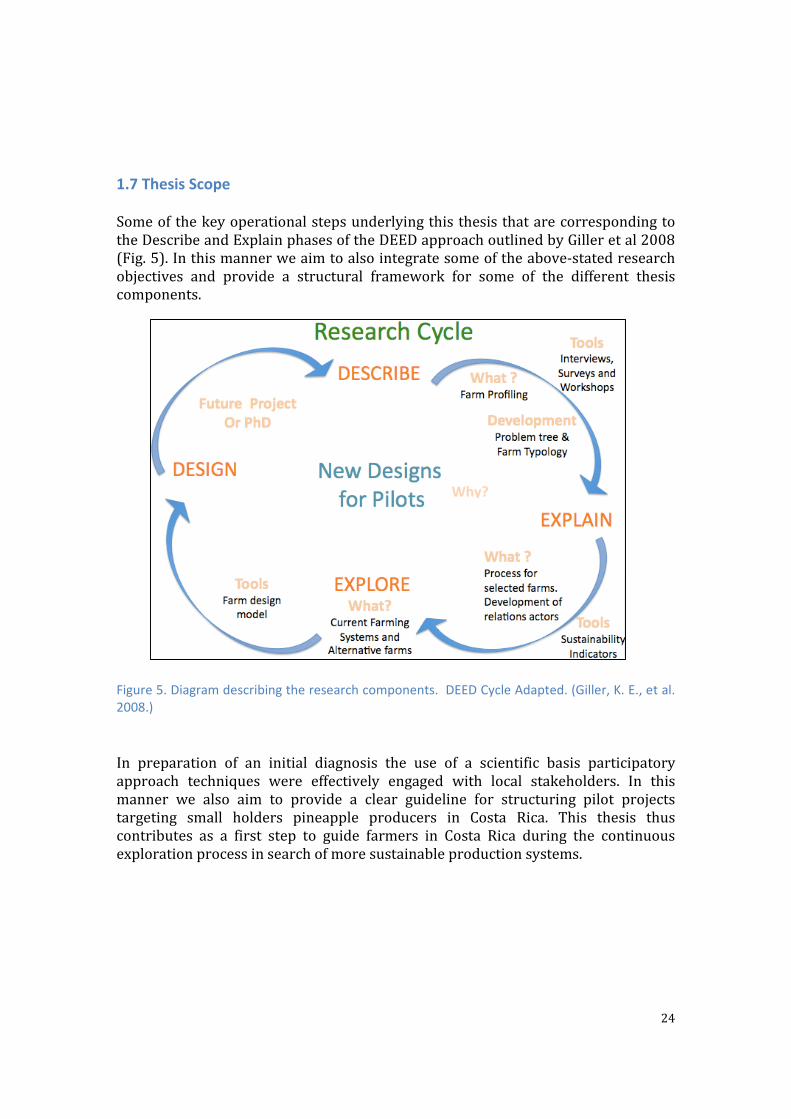
Figure5.Diagramdescribingtheresearchcomponents.DEEDCycleAdapted.(Giller,K.E.,etal.2008.)............................................................................................................23
Figure6.ProblemTreeDiagramMethodology..........................................................................37Figure7.RegionaldistributionofpineappleinCostaRica,theproposedcasestudyis
locatedinZonaHuetarNorte(redcircle)Source:Aravena,J.2005.......................43
13
Figure8.CBIMarketInformationDatabase:EUbuyerrequirementsforfreshfruitandvegetables.(http://www.cbi.eu/marketintel_platform/fresh‐fruit‐vegetables/136122/buyerrequirements)..........................................................................53
Figure9.Boxplotshowingthevalueofeachclassforthevariableofplantingdensity................................................................................................................................................55
Figure10..Factorialplanes1‐2and1‐3fromMCAwithonlythemodalities/classeshavingthehighestcontributionsbeingpresented.Thebluemodalitiesrefertothehorizontalaxis(Axis1),theredandthegreenmodalitiestoAxis2and3,respectivelywhilethepurpleshadedmodalitiesareinterpretationsofbothhorizontalandverticalaxesintermsofgeneralfarmcharacteristics...................58
Figure11.RepresentationofsixtypesofpineapplefarmsfromtheMCAfactorialplanesdefinedbythefirstthreefactors(Axis1,Axis2andAxis3).......................59
Figure12.ClusterDendrogramobtainedfromtheHierarchicalClusteringshowingaclassificationof28pineapplefarmsselectedfortheanalysis.EachnumberrepresentsafarmfromtheRHN.Eachcolorrepresentsadifferentclusterorfarmtype.A7thfarmtypewasdistinguishedbutisnotshowninthisDendrogramanditrelatestothetwoverylargefarms(>250ha)..........................59
Figure14.SustainabilityIndicatorsfortwopineapplesystemsfromRHNusinganAMOEBAdiagram(adaptedfromS.Lopez‐Ridauraetal.2002).Indicatorsandoptimumvalueswerederivedfromthefarmers,literatureandevaluationteam................................................................................................................................................................67
Figure15.Performanceofconventional,organicandagroecologicalmanagedpineapplesystemsforselectedsustainabilityindicatorsinRHN(adaptedfromS.Lopez‐Ridauraetal.2002).Indicatorsandoptimumvalueswerederivedfromthefarmers,literatureandevaluationteam......................................................................68
Figure15.SWOTAnalysisforBigorganicpineappleproducersandsmallholders..............................................................................................................................................71
Figure17.FruitNurseryField:lemons,starfruits,bananas,andlegumeshedgerows................................................................................................................................................................74
Figure18.Intercroppingwithbasil,lemongrass,turmericandpapayaplants.Irrigationforcashcrops(greens).Mulchwithlemongrass......................................74
Figure20.DehydrationPlantforprocessingdifferentproducts.......................................75Figure21.DehydratedPineappleandPlantainfromAlbertoChinchillasfarm..........75Figure22.Lombricompostandotherliquidfertilizers,MM,(mountain
microorganisms)amongothermixtures............................................................................75Figure23.Compostpilefromcowmanureandcropresidues...........................................75Figure24.Biofermentproductionin12haorganicfarmofLuisFernandofrom
CooperativeCoopepiagua..........................................................................................................76Figure25.Problemtreesummarizingmainproblemsdefinedbysmallpineapple
producersoftheRHN.Theboxeswithlightergreyrepresentthemainproblemsofthefarmersidentifiedintheinterviews.....................................................................102
Figure26.Problemtreesummarizingmainproblemsidentifiedbyorganicpineappleproducers(mediumtobig)oftheRHN.Lightgreyboxesrepresentthemainproblemsofthefarmers.......................................................................................103
14
Figure27.Problemtreesummarizingmainproblemsdefinedbyconventionalpineappleproducers(mediumtobig)oftheRHN.Lightgreyboxesrepresentthemainproblemsofthefarmers.......................................................................................104
Figure28.BoxPlotformodalitiesofthevariableCattle....................................................106Figure29.BoxPlotformodalitiesofthevariableCultivatedRatio..............................107Figure30.BoxPlotformodalitiesofthevariableFamratio.............................................108Figure31.BoxPlotformodalitiesofthevariableTotFixLabor.......................................108Figure32.BoxPlotformodalitiesofthevariableTotLand..............................................109Figure33.Figure34.BoxPlotformodalitiesofthevariablePlantingDensity.........109Figure35.ScatterPlotsforkeyvariables.................................................................................110Figure36.FactorialMapsof1‐2Axis,1‐3Axis,1‐4Axisand1‐5Axis........................111
15
1. Introduction
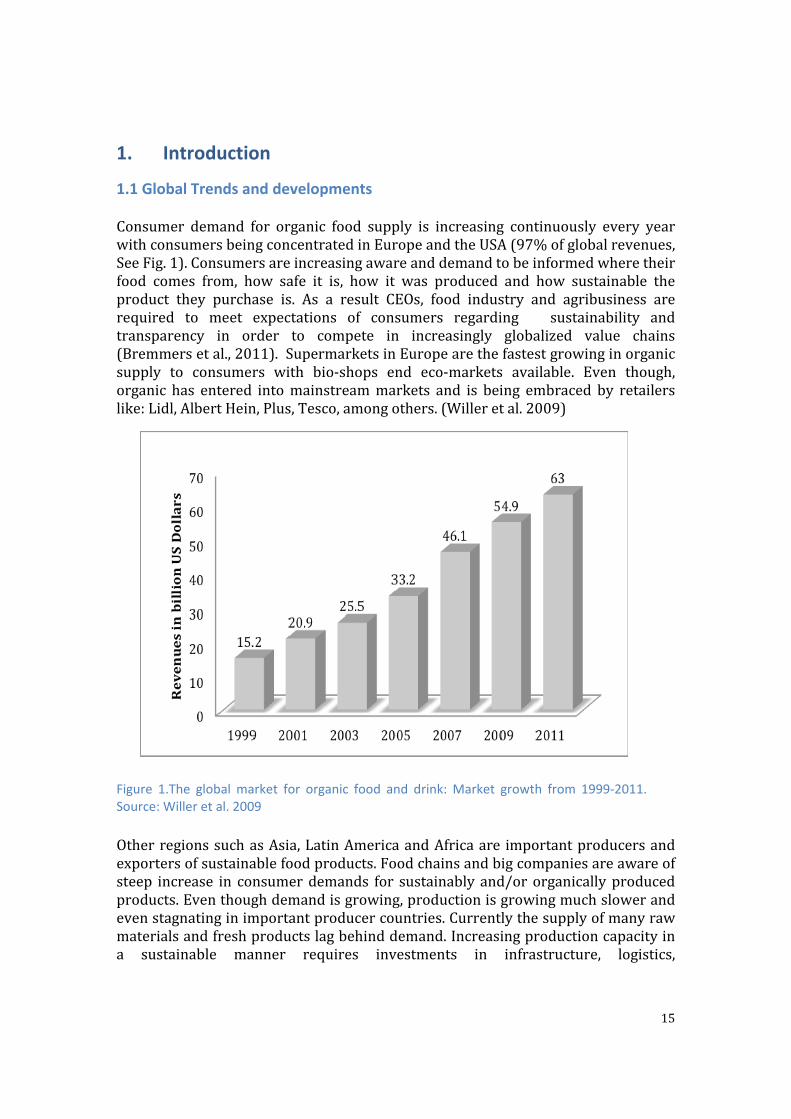
1.1 Global Trends and developments Consumer demand for organic food supply is increasing continuously every yearwithconsumersbeingconcentratedinEuropeandtheUSA(97%ofglobalrevenues,SeeFig.1).Consumersareincreasingawareanddemandtobeinformedwheretheirfood comes from, how safe it is, how it was produced and how sustainable theproduct they purchase is. As a result CEOs, food industry and agribusiness arerequired to meet expectations of consumers regarding sustainability andtransparency in order to compete in increasingly globalized value chains(Bremmersetal.,2011).SupermarketsinEuropearethefastestgrowinginorganicsupply to consumers with bio‐shops end eco‐markets available. Even though,organic has entered intomainstreammarkets and is being embraced by retailerslike:Lidl,AlbertHein,Plus,Tesco,amongothers.(Willeretal.2009)
OtherregionssuchasAsia,LatinAmericaandAfricaare importantproducersandexportersofsustainablefoodproducts.Foodchainsandbigcompaniesareawareofsteep increase in consumerdemands for sustainably and/ororganicallyproducedproducts.Eventhoughdemandisgrowing,productionisgrowingmuchslowerandevenstagnatinginimportantproducercountries.Currentlythesupplyofmanyrawmaterialsandfreshproductslagbehinddemand.Increasingproductioncapacityina sustainable manner requires investments in infrastructure, logistics,
Figure 1.The global market for organic food and drink: Market growth from 1999‐2011.Source: Willer et al. 2009
16
storage/package/processing facilities and development of technical skills andproducernetworks.(Willeretal.2009)Largecompaniesareincreasinglyawareofthebottlenecksandattimesarerequiredto invest in research, capacity building, and local infrastructure to secure futuresupplies.Thisprocessisreferredtoassustainablesourcing.Inthiscontext,EOSTA,one of the largest traders in organic produce inWestern Europe aims to furtherevaluatenewbusinessmodels toassurea constant supplyofhighqualityorganicpineapple.Theyareespeciallyconcernedaboutthefutureoftheirmainsupplieroforganicpineapple(CostaRica).Forthisreasonthereisamayorinterestincreatingnew business models, which can lead eventually to a broader supply of organicproducts (tropical fruits and tubers)(Interview Henk Zoutwelle, pineapple buyerEOSTA,2013)Toidentifyviableoptionsforamoresustainableagricultureproduction,proposeddevelopment strategies should be focused on the optimization of the entire farmandincludetheassessmentofdifferentfarmcomponents(Dogliottietal2013).Thisprocessmay involve farm characterization, farmer interviews, andmore detailedstudies of selected farms for sustainability assessments. Change should revolvearound the context of identifying steps and features to design and develop viableintegratedmanagementpracticesandproductionstrategies,basedonkeyproblemsidentifiedbyfarmersandresearchersduringaco‐innovationprocess(Rossingetal.2010).Partofthechallengeofthisprocessistodevelopstandardsandmethodstomonitor and compare changes in sustainability parameters between productionsystemsand/orpracticesinatransparentandconsistentmanner.
1.2 History and Background CostaRicahasbecometheworld’snumberoneexporteroffreshpineapple.Large‐scaleproductionstartedinthe1980safterPINEDCOS.A.,asubsidiaryofDelMonte,started theiroperation in the southern regionofCostaRica. (Aravena,2005).Theintroduction of new varieties, which are more suitable for export like the whiteHawaiian pineapple, governed drastic changes within the sector, which onlycomprised 3400 hectares in 1986. After the introduction of MD2 by Del Monteduring the mid‐90s, the production area grew to 45.000 hectares by 2010(Quijandría,1997).Theexponential growthof surfaceusedby the industry led tospecializationofproduction,whichimpliedthatstandardtechnologicalproductionpackage were being promoted and adapted to ensure uniform quality and thehighestpossibleyields(Maglianesi,2013).Currently,thebiggestimporterofCostaRicanpineapplesisEurope(50%)followedby theUS (43%).Moreover, exports toEurope increasedbetween2000and2008from0.16 to0.67million tons,while themarket share increased from36 to73%(EOSTA‐ICCO, 2010). Thereby Costa Rica is dominating the global pineapplemarkets. However, the scaling of production is associated with appreciable
17
environmental costs including excessive soil erosion, pesticide contamination ofwaterways,andincreasedworkersexposuretoagrochemicals,whichposeaserioushealthrisk(Acuña,2004).In terms of farm operations, the production chains and export market are beingdominatedbyTransnationalcompanieslikeDelMonte,DoleandChiquitaandlargeproducers,whiletheenvironmentalcostsareposingamajorthreatintermsoflong‐termsustainability (Emanuellietal,2009).Currently,35%of the totalproductionareabelongstotradingcompanieswhile65%areindependentproducersthatmaybelinkedtolocalcooperativesandassociationsofsmallandmediumproducers.Interms of farm size distribution, there is an estimated of 1200 small (below 50hectares)andmedium‐scaleproducers(50‐250hectares)thataccountfor5to10%ofthetotalproductionofthecountry.(Kellonetal,2011).CurrentlytheMinistryofAgriculture (MAG) is re‐assessing thesenumberssince itappears thatmostof thepineappleproductionhasbeencontrolledby large transnationalcompanies;whilesmallproducersarelosingtheirfarmsduetodebtsandincreasedproductioncosts(PersonalCommunicationsJairoSernaonOctober,2013).
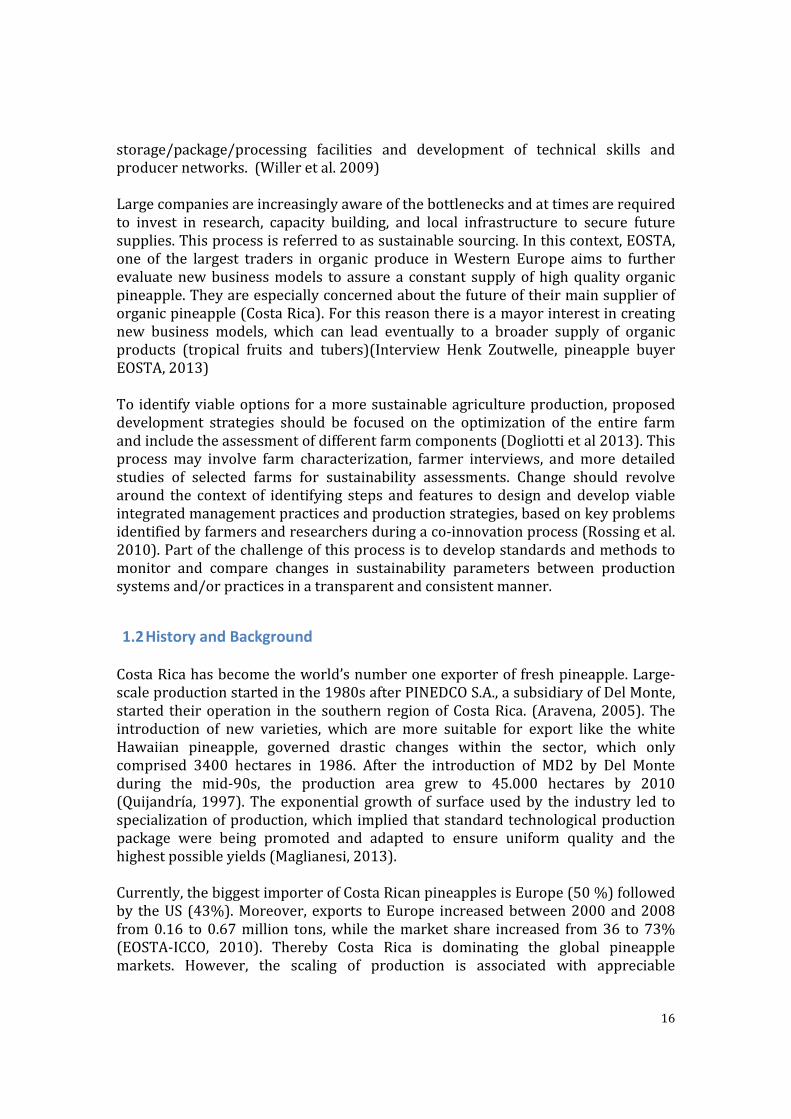
1.3 Problem Statement Asadevelopingcountry,CostaRicaisfocusedoneconomicgrowthandshiftfromagrowthmodel focusing on localmarkets to a developmentmodel targeting globaleconomy and international markets (Acuña, 2004). Thereby it relies greatly onagriculturalexportstosupporteconomicdevelopmentandinternationaltrade.Theexpansion of pineapple was accelerated via governmental policies and subsidiesaimingtosupportnewagro‐exportproductslikepineapple(Richardsonetal,2013).However,thispolicyalsojeopardizedthelivelihoodsofsmallandmediumfarmers,which arevulnerable anddidnotbenefit from thisdevelopment. Policymeasuresstimulatedtheproductionofuntraditionalcropswhiledisplacingtraditionalcropsincluding cassava, sweet potato, and dairy production, among other activities.Ultimately this led to the increased imports of food and loss of local foodsovereignty, a decline in many food crops, abandonment of family farms andmigration of “Campesinos” to urban areas. (Maglianesi, 2013 andEmanuelli et al,2009). Around 2006 the business was very profitable with payments up to 0.47$/kgforconventionalpineapple(Fig.2).Duringthistimemanyproducersshiftedalltheircultivationareastopineapple.Family‐basedfarmshadtoadapttotheexternalforces governing the sector in order to specialize (Emanuelli et al., 2009). Thisimplied increased dependence on agrochemicals, external labor and machinery.(Richardsonetal.,2013andAcuña,2004).Therapidexpansionoflandplantedwithpineapple led to overproduction and a price decrease (Fig. 2). This especiallyaffectedsmallproducers,duetopooraccesstoglobalmarketingnetworks, lackofbargainingpowers,financialbuffersandinfrastructuretocommercializepineapple.Their only optionwas to rent out land or sell their farms altogether. As a result,large companies and intermediaries increasingly controlled external distributionmarkets, which further undermined the existent of small family‐based farms.(Faure,2002andAravena,2005).According to figuresof theNationalProduction
18
Board(ConsejoNacionaldeProducción),only4%ofpineappleproductionisinthehandsofsmallproducers(Emanuellietal,2009).
Figure 2. Overview of production area (a), total production (b) and farm gate price (c) for the pineapple industry in Costa Rica between 2006 and 2013.

19
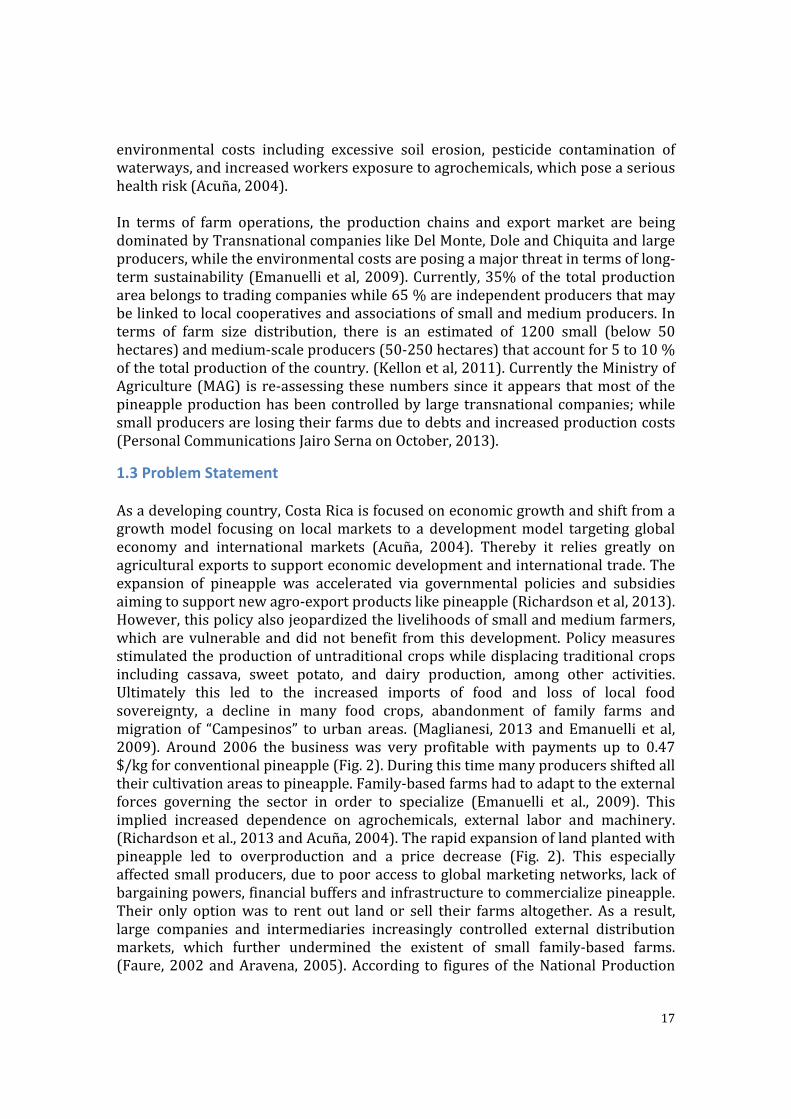
Figure 3. Costa Rican newspaper La Nación pg 20A. Published on the 20 th of June 2013. The newspaper shows a timeline from 2001, when the rapid expansion of the pineapple industry took place, until 2012. Translation in white.
In figure 3 the national news of Costa Rica (La Nación) illustrates a time lineintroducingtherapidriseofthepineapplebusinessandtheconsecutivedecreaseinprice($/kg)(Figure1and2).ThisisacommonsituationformanyoftheproducersofRHN(RegionHuetarNorte)wherethemajorityofprivateproducersarelocated.According to thisarticle themostaffectedcommunities fromRHNarePital,UpalaandGuatuso.A studyconductedbyMAG indicated thereare about350pineapplefarms that are having bank loans, of which around 200 are up to date withpayments,100arefacingfinancialproblemsand50havenolongeranyoptionbuttopaythedebtwiththeirlands(LaNación,2013).Besides market and management issues, producers and local communities arefacingmanyotherproblems(Emanuellietal2009).AstudyconductedbyEARTHUniversityinCostaRicahighlightedthemostimportantconcernsofsmallfarmers:“i)soilerosion,lossofinherentsoilfertilityandreducedcropproductivityii)Deforestationiii)Poorresiduemanagementresulting inswarmsofStomoxyscalcitrans flies thatattackcattleonlargebeefcattlefarmsandreduceweightgainsiv)Sedimentationandcloggingofwaterbasinsv) Contamination and degradation of water resources by high use of pesticides"(Kellonetal,2011).
2001Thisyearmarkstheinitiationofpineappleexpansion.11000ha
2003Inbetween2003&2006theincomeforexportationgrows24‐32%.Thebusinessflourishes.
2005WaterLaboratoriesfromA&AdetectedBromacilinpublicaqueductsnearpineapplefarms.Localandinternationalcomplaints.
2006Fruitispaidtoproducersapproximatelyat0.47$/kg
2011Producer’scrisis.Fruitispaidtoproducersapproximatelyat0.30$/kg
2012Manyproducersenteredintheactivity.Leadingto42000haplantedinthecountry.
PineappleProducersloosetheirlandsbecauseofdelayonpayingbankloans.

20
Besidestheissuespresentedabove,farmersdonotseeorrecognizetheeffecttheseplantations are having on their farms and surrounding communities. Prevailingissues, are related to social and environmental problems including low workstability, immigration from urban areas to cities, loss of crop diversity and foodsecurity, dependency on supply companies and crop resistance to pesticides(Acuña,2009).IntheresearchbyKellonetal in2011, itwasconcludedthat large–mediumscaleproducers have highly skilled personnel (agronomic engineers) to manageproductionand logistics.Small‐scaleproducers,on theotherhand,usuallyreceivetechnicalsupportfromrepresentativesofagrochemicalretailerswhichadvicethemonpest control and fertilization issues.However, these representatives are rarelyagronomistsandmayhaveconflictinginterests,sothesmall‐scaleproducersdonottrust theiradvice,butstillhavenoothertechnicalsupport.Someproducersarguethatthereisa lackofassistancefromthelocalauthorities(MAG).Therefore,somegrowershavedevelopedtheirownproductionschemesbasedonexperimentation,butitappearsthatthereisaverylimitedcommunicationandtransferoftechnologyamonggrowers(Fig.4).
Figure 4. Pineapple grower’s opinion about the exchange of technical information within the sector. (Kellon et al, 2011)
Basedontheproblemspresentedabove,someoftheactorsinthepineapplesectorinCostaRicaperceivedthatcurrentproductionpracticesarenotsustainable.Giventhe competing costs and benefits of pineapple production,many Costa Ricans arebeginning to request for more stringent regulation of crop production practices.Policyoptionsbeingdiscussed includemoresevere regulationsandmonitoringofthe existing pineapple industry (Richardson et al 2013). This can eventuallyjeopardize family‐based and private commercial farms in Costa Rica. Theinformation presented above and throughout the thesis highlights farmer’sperceptionsofprevailingissuesunderminingthesustainabilityoftheirlivelyhoodsandtheglobalvaluechain.Thisstudyprovidesabaselineandclearjustificationfora large internationally supported project aiming to provide information andtechnical support during development of an alternative business model forpineappleand/orothertropicalcrops.
21
1.4 Knowledge Gaps When reviewing the general literature on production trends in pineapple‐basedproduction systems as related to global value chains reveals a large variety ofcovered themes. The existing literature focused mainly on analyzing theenvironmental impact of pineapple, defined sound agricultural practices, soilconservationmeasures, residuemanagement etc.However, there is a tendency togeneralize production practices across farms without considering differencebetween farms as related to inherent diversitywithin the farmpopulation. In theliterature the farm typologies were based on variables such as farm size (ha),ownership of a packing station,market orientation, adoption of good agriculturalpracticesandaccesstofinancialresources(Piñeiro,2007).However,therewasnoor little information on variables like crop diversity, planting densities, type ofproduction (organic or conventional), and use of family labor, amongothers. It isarguedthatsuchvariablesmightleadtoanimprovedassessmentofthediversityofpractices among producers and the impact of current farming systems1of overallsystem performance (sustainability indicators). Moreover, most of the previousefforts tended to use either a top‐bottom approach with little or no informationbeingpresented to the farmers.Furthermore, therewasnodialoguewith farmersregarding viable alternatives and/or guidelines how to structure and implementnewbusinessmodels thatcanhelpthemtodiversify theiroperationsandbecomemore competitive. Although small‐ and medium‐sized farms have formedcooperatives (e.g. Coopepiña and Coopepiagua which were visited during fieldvisits) to facilitate the production and marketing, these cooperatives still facelogistical and organizational difficulties, financial problems that jeopardize theexistence of their members (Interview Leonidas Chaves, President Coopepiagua,October2013).
1.5 Research Objectives
1.5.1 Main Objective The sustainability of prevailing and alternative pineapple‐based farms should beassessedbecausethelong‐termsustainabilityofthesectorisquestionable.Todosocharacterizingfarmersaccordingtosizeandresourceendowmentisafirststepthatis essential to find out how different farms types farms may differentially bedeveloped.
1Populationofindividualfarmsystemsthathavesimilarresources,patterns,householdlivelihoodsandconstraintsIncludescropchoicesandanimals.(Madryetal.2013)
22
The overall aim of thesis is to characterize current pineapple‐based farmingsystemsandtoevaluatetheirperformanceintermsofaselectsetofsustainabilityindicators,therebyidentifyviableoptionsduringasubsequentredesignphase.
1.5.2 Specific Objectives ‐Develop a farm typology in order to identify different clusters of existing farmtypes in RHN, the case study area in Costa Rica. During this characterization,participatoryapproachtechniqueswereused,suchas:interviewsandworkshops.‐In‐depthanalysisofselectedfarmsintermsoffarmstructure,productionpractices,prices and profitability for farms contrasting in market outlets (global vs. localmarkets and/or size of their operation (large vs. small). This in order to gain abetterinsightintoresourceallocationandproductmanagementincludinginputuse,productionefficienciesandyieldsforfarmsrepresentativeofthedifferentclustersofproducers.Thesemethodsallowedforimprovedassessmentoffarmperformanceintermsofenvironmentalandsocio‐economicindicatorswithspecialreferencetosoilquality,whichhadbeenidentifiedasbeingoneofthemayorissues.
1.6 Research Questions
1.6.1 Main research question Howcanthesustainabilityofthepineapplefarmingsystemsbeimprovedbasedonfarm size, resource endowment and external forces shaping the agriculturallandscapeinCostaRica?
1.6.2 Specific Questions Themainresearchquestionsincludedthefollowing:
1) What are themain characteristics of thepineapple industry andwhich arethe main internal and external forces shaping the Costa Rican pineappleindustry?
2) WhatisthediversityofpineapplefarmingsystemsinCostaRicaanddoesfarmsize andmarket orientation affect sustainability of farm, resource use andproductivity?
3) What are perceived production and marketing constraints of pineapple
producersofdifferentsizeand/orresourceendowment?These research questions also provide a structural framework for subsequentmethodology,resultsanddiscussionsectionsasshowninTable1.

23
Table 1. Linkage of research Questions to methodology, information sources, deliverables and relevant citations
ResearchQuestion MethodologyUsed/Tools
Informationsources
Targeteddeliverables
Keycitations
What are the maincharacteristics ofthe pineappleindustry and whichare the maininternal andexternal forcesshaping the CostaRican pineappleindustry?
LiteratureReviewProblemTrees
Journals/ArticleBooksInterviews/Meetingswithactors/Interviews/LiteratureReview
Profiling ofpineapple industryinCostaRicainthecontext of globaldevelopmentsduring the past 15years.Problemtreesfor3types of clusters.Material for theworkshop.
Dogliotti,S.etal2013
What is thediversityofpineapplefarmingsystemsinCostaRicaand does farm sizeand marketorientation affectsustainability offarm, resource useandproductivity?
FarmTypologySWOTAnalysisClusterAnalysisMCA(MultipleCorrespondenceAnalysis)SustainabilityIndicatorsISAP(IndicatorsSustainableAgriculturalPractices)MESMESISAnalysis
AnswersSurveys/FarmVisitsWorkshopLiteratureReviewInterviews withstakeholders andfarmmanagers.
Main differencesamong farmgroups.Strongerknowledge andanalysis for adesign phase ofnew businessmodels andorganizationalskills.
G.Faure,2002RDevelopmentCoreTeam,2013Dogliotti,S.etal2013Lopez‐Ridaura,S.etal,2002.
What are perceivedproduction andmarketingconstraints ofpineapple producersof different size and/or resourceendowment?
ParticipatoryApproachTechniques
LiteratureReviewInterviewsKnowledgeonthesectorandshareholders.Workshop
Clearunderstanding ofvariances of thepineapple farmingsystems dependingon their size andresources.
Rigby,D.etal.2001.Dogliotti,S.etal2013
24
1.7 Thesis Scope SomeofthekeyoperationalstepsunderlyingthisthesisthatarecorrespondingtotheDescribeandExplainphasesoftheDEEDapproachoutlinedbyGilleretal2008(Fig.5).Inthismannerweaimtoalsointegratesomeoftheabove‐statedresearchobjectives and provide a structural framework for some of the different thesiscomponents.
In preparation of an initial diagnosis the use of a scientific basis participatoryapproach techniques were effectively engaged with local stakeholders. In thismanner we also aim to provide a clear guideline for structuring pilot projectstargeting small holders pineapple producers in Costa Rica. This thesis thuscontributes as a first step to guide farmers in Costa Rica during the continuousexplorationprocessinsearchofmoresustainableproductionsystems.
Why?
Figure 5. Diagram describing the research components. DEED Cycle Adapted. (Giller, K. E., et al.2008.)

25
2.Materials and Methods Thefollowingsectionscorrespondtothemethodologyimplementedtoanswerthemain research questions. The first main section is related to methodologicalapproachesemployedduringtheoverallcharacterizationofthepineappleindustryalongwithabiophysicalandsocio‐economicdescriptionof theproductionregion.The last is including main internal and external forces shaping the pineappleindustry. The second section refers to methods used to characterize existingpineapple‐based farming systems and to evaluate the sustainability of selectedfarms based on theMESMISmethodology; The third section pertains tomethodsused to capture farmer’s perceptions (e.g. problem trees) and to evaluate overallsystemperformance(SWOTanalysis).
2.1 Profiling of the pineapple Industry As mentioned in the introduction the emphasis of the research is in the NorthHuetar Region (RHN) of Costa Rica. The profiling of the industrywas based on acompilationofdifferentliteraturesourcesincludingseveralarticlesandjournals.Inaddition during the period July 2013 throughout May 2014 I engaged in acontinuous dialogue with different actors during meetings, interviews andgatherings.Theseincludedthefollowingevents:
I) ParticipatedintheSymposia“PineappleactivityinCostaRica:anintegratedapproach”SymposiumfacilitatedbyUTN(UniversidadTécnicaNacional)on the 6 th of September 2013. Several actors of the pineapple sectorincluding producers, governmental agencies, universities, communitymembers near pineapple plantations and private enterprises attendedthesymposium.ThemaintopicsaddressedduringthemeetingincludingthecurrentsituationofpineappleinCostaRica,EnvironmentalandSocialproblems associated with pineapple systems, and visions of localUniversitiesonthisindustry.
II) Attended monthly meetings of the National Platform of ResponsiblePineappleproductionofCostaRica. ThisplatformisasubsidiaryoftheMAG and aims to promote the participation of actors linked to thepineapple production in a continuous dialogue. They seek to buildproposals towards improving production schemes, relationships withcommunities, workers and the environment. This actor played anessential role in guidance through the implementation of themethodologyandactivitiesincludedmonthlymeetingswithJairoSerna.
III) Engaged in meetings with Cooperatives members of Coopepiagua andCoopepiña among which administrators and producers gathered todiscusscurrentevents.

26
IV) Coordinated and attended the “”Sustainable Pineapple sourcingworkshop”heldon30thofApril2014at the Instituto tecnológicodeCostaRica, inSantaClara.
Through attending these activities and meetings allowed me to have manyconversationswith key actors within the sector. This helpedme to gain a betterunderstanding of underlying processes and obtain invaluable insights that wereusedfortheprofilingofthepineapplesector.
2.2 Diversity of farming systems
2.2.1 Farm typology Thetermfarmtypologyreferstoamethodologyfordefiningkeycharacteristicsofaselect group of producers from a same region. In the case of this study themethodology implemented is “experts knowledge” by which can define concreteareasandarebasedonskillknowledgebyagriculturalexperts, localgovernmentsandthestate.(Madry,2013)Thishelpstoanalyzeacomplexrealitysuchasdiverseproducer communities by grouping farmers into clusters of farms that resembleeachother in termsofkeydifferentiating traits. These typologies canbeausefultool for advisors or projectmanagers, which need to diagnose farm functions, totrain and advise farmers in terms of technical, environmental and economicalchoices. However, in this context it is important that recommendations may befarm‐type specific for different types of farms. So in order to better address theneeds of specific groups certain variables should be chosen to differentiate thesegroupsbydevelopingsurveystogathersuchinformation(Landais, 1998).
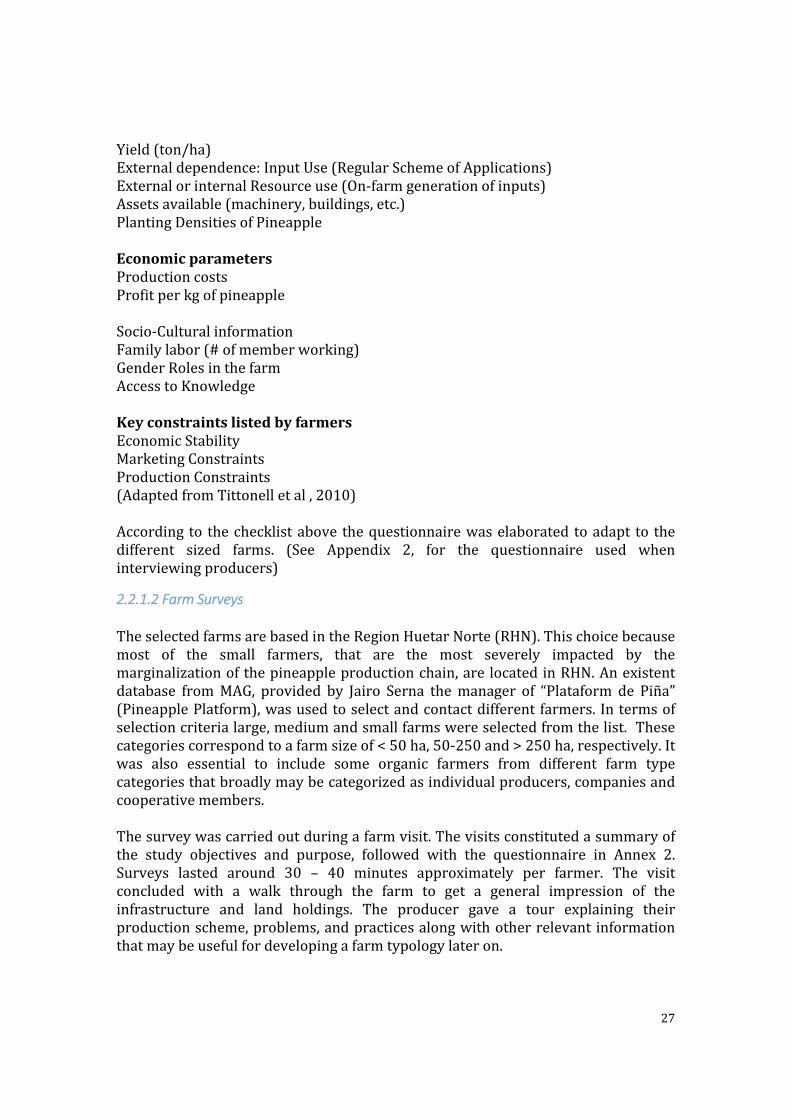
2.2.1.1 Questionnaire used to develop farm typology BasedonapaperbyTittonelletal(2010)thefollowingchecklistwaselaboratedtohave a guideline to generate the surveys in order to collect the informationregarding the farming system and farmer characteristics. From this, thequestionnaire was elaborated, and from the questionnaire results variables werechosentodevelopthefarmtypologywiththislistbeingshowninTable3.GeneralInformationRegionTotalfarmsizeownedbythehousehold(ha)Totalareawithcashcrops(ha)AgeofhouseholdheadNameofhouseholdheadFarmingSystemKeyactivities(animalandcrop)TotalnumberoflivestockTypeofproduction(Organic/Conventional)Cropdiversification(#ofCrops)
27
Yield(ton/ha)Externaldependence:InputUse(RegularSchemeofApplications)ExternalorinternalResourceuse(On‐farmgenerationofinputs)Assetsavailable(machinery,buildings,etc.)PlantingDensitiesofPineappleEconomicparametersProductioncostsProfitperkgofpineappleSocio‐CulturalinformationFamilylabor(#ofmemberworking)GenderRolesinthefarmAccesstoKnowledgeKeyconstraintslistedbyfarmersEconomicStabilityMarketingConstraintsProductionConstraints(AdaptedfromTittonelletal,2010)According to thechecklistabovethequestionnairewaselaborated toadapt to thedifferent sized farms. (See Appendix 2, for the questionnaire used wheninterviewingproducers)
2.2.1.2 Farm Surveys TheselectedfarmsarebasedintheRegionHuetarNorte(RHN).Thischoicebecausemost of the small farmers, that are the most severely impacted by themarginalizationofthepineappleproductionchain,are locatedinRHN.Anexistentdatabase fromMAG, provided by Jairo Serna themanager of “Plataform de Piña”(PineapplePlatform),wasusedtoselectandcontactdifferent farmers.Intermsofselectioncriterialarge,mediumandsmallfarmswereselectedfromthelist.Thesecategoriescorrespondtoafarmsizeof<50ha,50‐250and>250ha,respectively.Itwas also essential to include some organic farmers from different farm typecategoriesthatbroadlymaybecategorizedasindividualproducers,companiesandcooperativemembers.Thesurveywascarriedoutduringafarmvisit.Thevisitsconstitutedasummaryofthe study objectives and purpose, followed with the questionnaire in Annex 2.Surveys lasted around 30 – 40 minutes approximately per farmer. The visitconcluded with a walk through the farm to get a general impression of theinfrastructure and land holdings. The producer gave a tour explaining theirproductionscheme,problems,andpracticesalongwithotherrelevantinformationthatmaybeusefulfordevelopingafarmtypologylateron.

28
Thirty‐six farmers were interviewed and the distribution of the types of farmersinterviewedispresentedinTable2.Intotal6farmerswereorganicwhile30wereconventional.Table 2. Producers visited for responding farm surveys and interviews.
Producers Organic Conventional TotalSmall(1‐50ha) 4 25 29Medium(50‐250ha) 1 4 5Big(>250ha)Total
16
130
236
2.2.1.3 Multivariate Correspondence Analysis (MCA) For the statistical analysis of the variables program R version 3.03 and packageADE4(RDevelopmentCoreTeam,2012)wereused.Becauseofthelargenumberofqualitative variables, which prevented use of standard Principal ComponentAnalysis, therefore anMCA (MultipleCorrespondenceAnalysis)wasused instead.This method constructs axes of principal components summarizing the variablesused intoasetofcategoricalvariables.MCAallowsanalyzing thecorrelationsandassociations between farmer’s characteristics to be displaced graphically in theresults (Factorial Correspondence Analysis). It uses two‐ dimensional graphs,plotting components against one other within a set of axes; categories of thevariablesarelocatedinthecenteroftheaxes(Guinotetal,2001).Duringthedataanalysis,collectedinformationhadtobeprocessedindistinctsubsequentstepstowarrantahomogeneousdataset.
2.2.1.4 Data compilation Entering values into Excel sheets proceeded the questionnaires, and a total of 25quantitative and qualitative variableswere generated. However, certain variableswereleftoutoftheanalysis,andarankingofthedatawaspremeditatedaccordingtotheobjectives(Table3).Thedatahadtobesortedoutinordertobetransferredtotheprogram.Combinationofcertainvariableswascreated,afterwhichoriginalvariables were dropped to make data comparable resulting in a total of ninequantitative and ten qualitative parameters. Thesewere then ranked in terms oftheirrelativeimportanceasrelatedtoperspectivefarmtypes(Table3).Totalfixedlabor=Familylabor+fixedlaborCultivatedratio=cultivatedpineapplearea/totalfarmarea
29
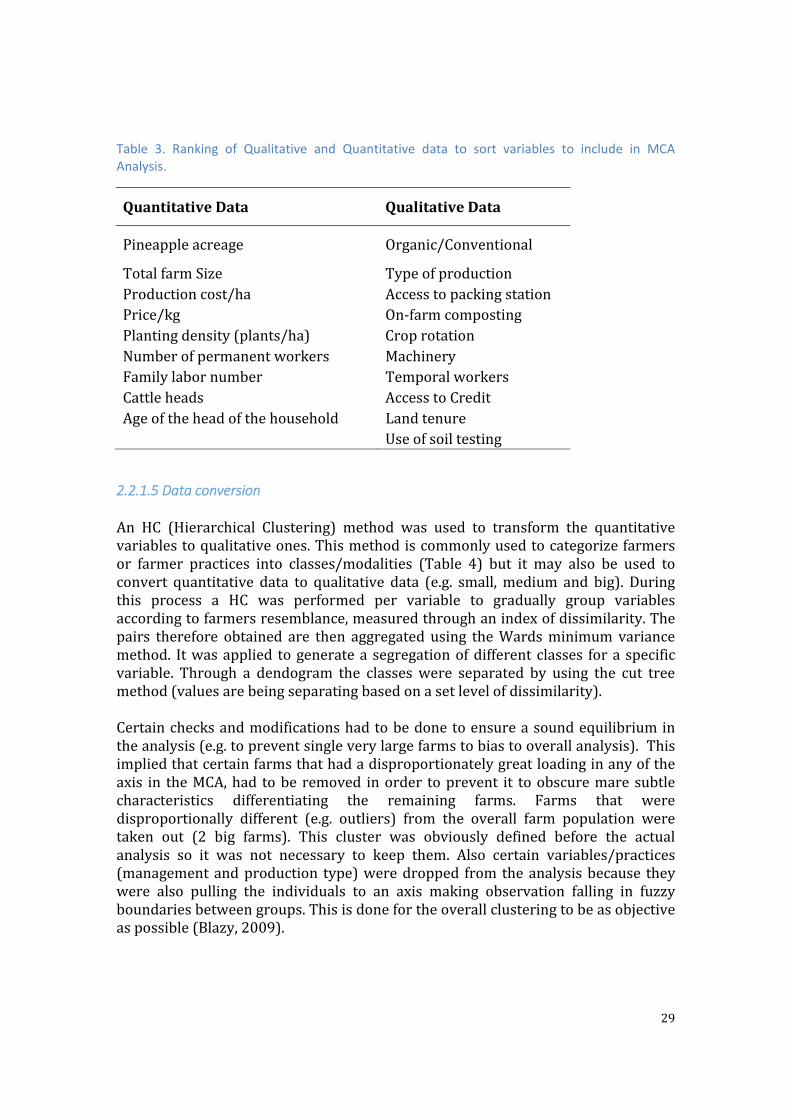
Table 3. Ranking of Qualitative and Quantitative data to sort variables to include in MCA Analysis.
QuantitativeData QualitativeData
Pineappleacreage Organic/Conventional
TotalfarmSize TypeofproductionProductioncost/ha AccesstopackingstationPrice/kg On‐farmcompostingPlantingdensity(plants/ha) CroprotationNumberofpermanentworkers MachineryFamilylabornumber TemporalworkersCattleheads AccesstoCreditAgeoftheheadofthehousehold Landtenure Useofsoiltesting
2.2.1.5 Data conversion An HC (Hierarchical Clustering) method was used to transform the quantitativevariablestoqualitativeones.Thismethodiscommonlyusedtocategorizefarmersor farmer practices into classes/modalities (Table 4) but it may also be used toconvert quantitative data to qualitative data (e.g. small,medium and big). Duringthis process a HC was performed per variable to gradually group variablesaccordingtofarmersresemblance,measuredthroughanindexofdissimilarity.Thepairs therefore obtained are then aggregated using theWardsminimumvariancemethod. Itwasapplied togeneratea segregationofdifferentclasses foraspecificvariable. Through a dendogram the classeswere separated by using the cut treemethod(valuesarebeingseparatingbasedonasetlevelofdissimilarity).Certainchecksandmodificationshadtobedonetoensureasoundequilibriumintheanalysis(e.g.topreventsingleverylargefarmstobiastooverallanalysis).Thisimpliedthatcertainfarmsthathadadisproportionatelygreatloadinginanyoftheaxis in theMCA,had tobe removed inorder toprevent it toobscuremare subtlecharacteristics differentiating the remaining farms. Farms that weredisproportionally different (e.g. outliers) from the overall farm population weretaken out (2 big farms). This cluster was obviously defined before the actualanalysis so it was not necessary to keep them. Also certain variables/practices(managementandproduction type)weredropped from theanalysisbecause theywere also pulling the individuals to an axis making observation falling in fuzzyboundariesbetweengroups.Thisisdonefortheoverallclusteringtobeasobjectiveaspossible(Blazy,2009).
30
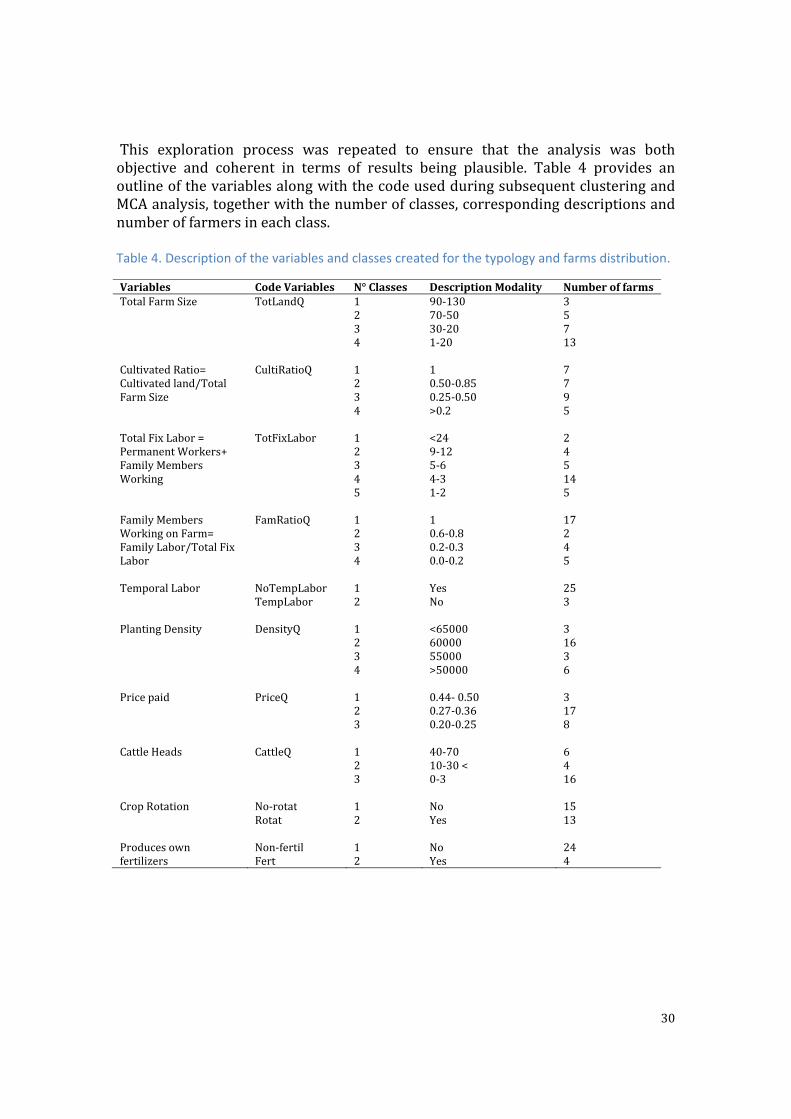
This exploration process was repeated to ensure that the analysis was bothobjective and coherent in terms of results being plausible. Table 4 provides anoutlineofthevariablesalongwiththecodeusedduringsubsequentclusteringandMCAanalysis,togetherwiththenumberofclasses,correspondingdescriptionsandnumberoffarmersineachclass.Table 4. Description of the variables and classes created for the typology and farms distribution.
Variables CodeVariables N° Classes DescriptionModality NumberoffarmsTotalFarmSize TotLandQ 1
234
90‐13070‐5030‐201‐20
35713
CultivatedRatio=Cultivatedland/TotalFarmSize
CultiRatioQ 1234
10.50‐0.850.25‐0.50>0.2
7795
TotalFixLabor=PermanentWorkers+FamilyMembersWorking
TotFixLabor 12345
<249‐125‐64‐31‐2
245145
FamilyMembersWorkingonFarm=FamilyLabor/TotalFixLabor
FamRatioQ 1234
10.6‐0.80.2‐0.30.0‐0.2
17245
TemporalLabor NoTempLaborTempLabor
12
YesNo
253
PlantingDensity DensityQ 1234
<650006000055000>50000
31636
Pricepaid PriceQ 123
0.44‐ 0.500.27‐0.360.20‐0.25
3178
CattleHeads CattleQ 123
40‐7010‐30<0‐3
6416
CropRotation No‐rotatRotat
12
NoYes
1513
Producesownfertilizers
Non‐fertilFert
12
NoYes
244
31
2.2.1.6 Cluster analysis After the successful transformation of variables and data‐screening, individualfarmsarethengrouped into farmtypesusingAgglomerativeHierarchalclustering(AHC) algorithm, in which the MCA is being used as input variable. The HC wasconducted with the first factors obtained from the MCA. This procedure is tocalculate the level of similarity between producers of RHN in order to generateclusters based on their shared characteristics. TheHCused theWardmethod forlinkagecalculation.Some farms were identified in order to make a comparison of different systems(organic vs. conventional and organic big vs. small). These farms were takenthroughtherestofthemethodology(sustainabilityindicatorsandSWOTanalysis)tomakeanindepthanalysisoftheirfarmperformance.
2.2.2 Sustainability Assessment (MESMIS Analysis) During the last decades increased emphasis has been placed on enhancing thesustainabilityofagriculturalsystems.Thereisaneedfordevelopingtoolsthatallowassessment of sustainability via quantitative approaches so systems can becompared and overall systems performance be monitored over time. Eventuallyleadingtoare‐designofthesystems. Assessmentoffarmperformanceintermsof relevant sustainability indicators often is ill defined since it is a very complexconcept.Thereforethereisnoclearconsensusamongresearchersondefinitionsofsustainability in general and there is a lack of universally accepted methods forassessing sustainability (Hayati et al 2011)A sustainability evaluation frameworkfacilitates the formulation of actions plans for improving the management ofdifferent systems as part of an exploration of viable alternatives during the re‐designingoffarmingsystems(Lopez‐Ridauraetal2000).The Indicator‐based Framework for Evaluating the Sustainability of NaturalResourceManagementSystems (MESMIS, theSpanishacronym)wasdeveloped toassess sustainability in specific agricultural and forestry systems, by integratingenvironmental,economicandsocialaspects,inaparticipatoryandinterdisciplinaryway, through comparison of systems at one point in time or over time (López‐Ridaura et al., 2002). TheMESMIS frameworkwasdeveloped inMexico and laterused in other parts of the world. This is a methodological tool to evaluate thesustainability of NRM systems. It is a methodology that integrates key conceptstowardsassessing concepts like including sustainability ofNRM (natural resourcemanagement) defined by 7 attributes: productivity, stability, reliability, resilience,adaptability, equity and self‐reliance. The assessment is valid for managementsystemsinagivengeographicallocationanditisaparticipatoryprocessrequiringaninterdisciplinaryevaluationteam.Sustainabilityisnotnumericallymeasuredperse,butitdoessobycomparingtwoormoresystems(Lopez‐Ridauraetal2000).
32
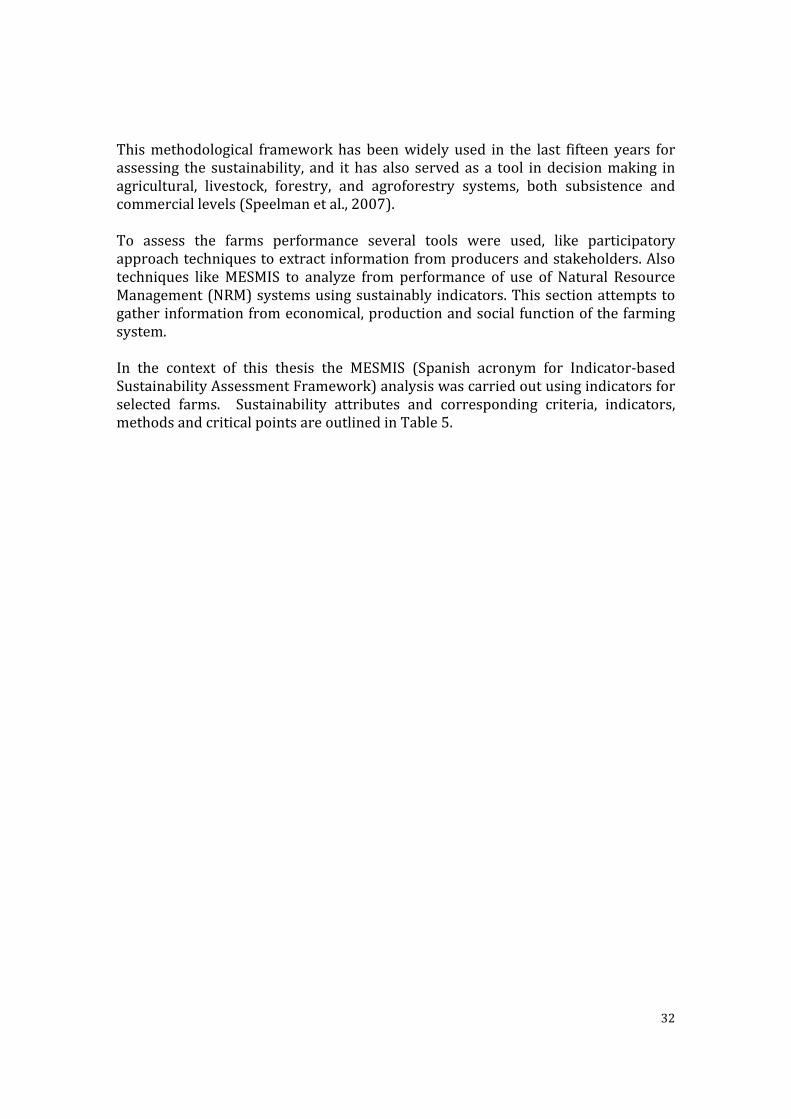
Thismethodological frameworkhas beenwidely used in the last fifteen years forassessing the sustainability, and it has also servedas a tool indecisionmaking inagricultural, livestock, forestry, and agroforestry systems, both subsistence andcommerciallevels(Speelmanetal.,2007).To assess the farms performance several tools were used, like participatoryapproachtechniquestoextractinformationfromproducersandstakeholders.Alsotechniques likeMESMIS to analyze from performance of use of Natural ResourceManagement(NRM)systemsusingsustainablyindicators.Thissectionattemptstogatherinformationfromeconomical,productionandsocialfunctionofthefarmingsystem.In the context of this thesis the MESMIS (Spanish acronym for Indicator‐basedSustainabilityAssessmentFramework)analysiswascarriedoutusingindicatorsforselected farms. Sustainability attributes and corresponding criteria, indicators,methodsandcriticalpointsareoutlinedinTable5.
33
Table 5. Sustainability Indicators for assessing three selected farms in RHN region based on sustainability attributes, diagnostic criteria and corresponding indicators, methods and critical points that were used to generate spider diagrams to visually depict system performance for different farm types (adapted from Dogliotti et al, 2013).
aTheattainableyieldswasdefinedbythefarmsmanagersbasedonexpertknowledgeonyieldsbasedonedaclimaticconditionsandprevailingproductionpractices.bEachorganicfarmerappliesorganicmatter(OM)eitherascompost,legumeresidueorotherorganicformstoeachfield.Thefarmersexpressedvaluesasquintal(46kg)whichwerethenconvertedtoton/ha.cLinkertscale:assessmentofeitherpositiveornegativeresponsetoastatement(Linkert,1932)
SustainabilityAttribute
DiagnosisticCriterion
Indicator CalculationMethod
SustainabilityDimension
CriticalPoints
Productivity Productionandeconomicefficiency
YieldofmaincropsProductionCost
ActualYield/AttainableyieldaTotalCost=labor+input+materials+activities+others
Bio‐physicalEconomic
LowcropyieldsHighcostsforcommercialsystemadoption
Stability SoilQualityNaturalResourcePreservation
pHOMbaggregatedErosionLevel
SoilAnalysisRUSLEModel
Bio‐physicalBio‐physicalBio‐physical
SoilDegradationHighriskoferosion
ResilienceAdaptabilityandreliability
SystemDiversityProfitShare
CropDiversificationSocialProgramsandworkerbenefits.
LinkertScalec
Bio‐physicalSocial
MonocroppingdominanceLowsocialequity
Self‐Reliance
Inputdependency
ExternalDependenceExternal/totalinputs
LinkertScale EconomicEconomic
Failureoftechnologicalpackages

34
CertainfarmingpracticesweremeasuredusingtheLikertScaleasshowninTable6.It includes crop rotation/diversity, profit share (worker rights) and externaldependence (commercial companies, nutrient exportation from other farms), tomake them comparable for the analysis. Standard literature sources and expertknowledge (stakeholders) were used to adopt a scoring table for differentagriculturalpractices(AdaptedfromWaney,etal.,2013)The aimwas to select key criteria and develop a simple scoringmethodology toassess the impact of these different farming practices on specific sustainabilityattributes. A score of 1 to 5wasbeingused to assess different practices asbeingmoreorlesssustainable.Averylowscore(1)isassociatedwithpracticesthatresultinpoorperformancewhile5beingthehighestpossiblescore,whichisindicativeofoptimal farmperformance for a specific sustainability indicator. Amore detaileddescriptionofratingsisprovidedinTable6.Table 6. Outline of scoring graduation employed while assessing sustainability Indicators for social and environmental factors, which could not be quantified directly (Adapted from Waney, et al., 2014)
Indicators
Score1 Score2 Score3 Score4 Score5
CropRotation
No croprotation at all.Monoculturewithnorest.
Rotation with1 crop, fallowor leguminouscrop (restinglots).
Rotation withmore than onecrop.
Utilizes rotationwith strategicplanning betweendifferent familiesand leguminousplants to returnsoilnutrientloss.
Utilizes rotationwith strategicplanningbetweendifferent familiesand leguminousplants to returnsoil nutrient loss.Intercrops withfruit tress, annualand perennialcrops.
Farmselfsufficiency/ExternalDependence
Uses syntheticfertilizers andpesticides.Regularpreventiveapplications.
UsetheminimumchemicalfertilizersUseothertechniqueslikemicroorganismsandorganicagricultureapprovedinputs.
Uses approvedorganicagricultureinputs. NaturalPest Control.NaturalPermittedFertilizers
Purchase manureandingredientstocreate compost(rock phosphate,blood meal, etc.).Also purchasesother naturalpesticides ormicroorganisms.
Utilizes in farmmanure and cropresidue to createcompost andother farmfertilizers ornatural pesticides(Bordeauxmixture,BiologicalControl,etc.)
Profitshare‐farmworkers
Onlytemporaryworkers,usuallyillegallyandusuallylowsalaries.
Minimumsalarypayment andno socialsecurity‐temporaryworkershired.
FixedWorkers, socialsecuritypayments.
Family basedfarms, subsidizedwork with ownlabor. But thewholefamilylivesfrom the farm(income andfood)
Social communityprograms. Specialcertificationswithprice premiumsfor socialwellnessprograms.Includes
35
programslikefairtrade certificationandGlobalGap.
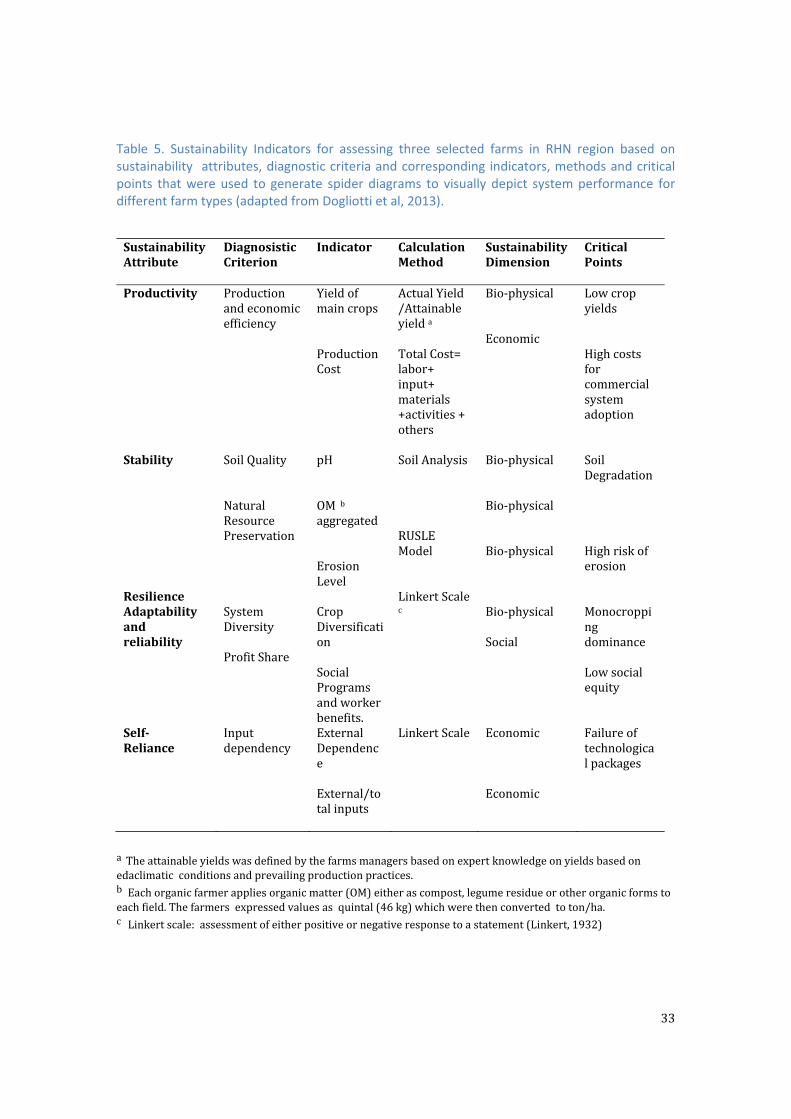
Three farms were selected and follow up interviews were used to generate therequiredsustainabilityparameterusingthemethodologydiscussedabove.Selectioncriteriaincludedavailabilityofreliableproductionrecordsanditwasalsodecidedtocontrastorganicvs.conventionalsystemsandfarmsize.Withinorganicsystemssmallfarmtargetinglocalmarketswerecomparedtolargefarmexclusivelyfocusingonexportproduction.Bothfarms2and3areintheclusterofbigfarmers.ThiswasunfortunatelybutthoseweretheonlyfarmswithenoughinformationtocarrytheMESMISanalysis.SeeTable7.Table 7. Farms selected for assessment of farm performance analysis.
Farms Hectares Cluster MarketOrientationNo1,Organic 20 2 LocalMarketNo2,Organic 395 1 ExportMarketNo3,Conventional 241 1 ExportMarket
2.3 Global system performance and participatory methods
2.3.1 SWOT Analysis ASWOTanalysiswasincludedtocomplementthefarmtypology.Inthiscontext,aSWOTanalysiswasimplementedforspecificfarmgroups.TheSWOTanalysiswasbased on information obtained during from farm surveys, interviews, andworkshopsandthisinformationwascomplementedbyaliteraturereview.
First the internal factors (strengths and weaknesses) and external factors(opportunities and threats) of selected farm types were identified. This analysishelpedto integrateandsynthesize information, tocommunicate it tostakeholdersandhelpedtostructureappropriatestrategiesfortargetedgroupsoffarmers.
2.3.2 Participatory System Evaluation Techniques. Participatorymethods allow formore effective utilization of local knowledge andafford farmers andactorsof the sector to actively contribute to the generationofknowledge and sharing of information. This may improve end‐user engagement,relevance,andownershipofproposedinnovations.Duringthecourseofthisthesistwotoolswerebeingemployedtocontributetothisprocess:(1)problemtreesand(2)workshop.

36
2.3.2.1 Problem Tree Development and Evaluation Active participation of farmers and a continuous dialogue among stakeholders isessentialbothduringtheproblemidentification(problemtreedevelopment)andaswell while exploring and structuring solutions. Throughout this process thistechniquewillbeexploredwithinputofthedifferentactorsactivelysolicited.Theproblemtreewasdevelopedinthreestages:Diagnose/IdentificationThe surveys and interviewsgreatly contributedduring the identificationof farm‐specific and more universal problems for the different farm types. During theinterviewsfarmersarticulatedtheirspecificproblems,andrankedthemduringtheinterviewandwerealsoencouragedtodescribesequenceofeventslinkingdifferentaspects.Draw/AnalysisandElaborationoftreesA visualization and analysis of the problems bymapping the linkage by differentcausal agents and consequences (problem tree)wasmade in order to assist theanalysis and clarification of cause‐effect relations. The trees weremade togetherwhile visiting with the farmers. The initial conceptualized versions were thenrevisedtomeetastandardformat(causalfactorsatthebottomandconsequencesatthe top with the farm operation being in the middle) and presented to therepresentativesofthesectorduringtheworkshops.Theobjectivewastogettheiractiveinputandrevisethediagramsaccordingly.Thisprocessisaspiralprocessinwhich there is always new input and changes of external factors. As a result, theunderstandingandinterpretationofgoverningfactorscontinuoustoevolveforanyspecificfarmoperation.DialogueDuring the workshop together with stakeholders and farmers the trees werediscussed to validate theproblem trees.During theworkshopablankpaperwiththe3problems treespresented in the resultswerehanded to all 20 stakeholderspresent.Attheendoftheworkshopthepaperswerecollectedwithcommentsfromallstakeholders(SeeFig.5).Thishelpedtodeterminetherootcausesofthemainproblemsandcorrespondingconsequenceswhile alsomappossible solutions. In thismanner it complementedandreinforcedtheresults fromthefarmtypologysince itallowedthetargetingofspecific farm types rather then using a “one‐size fits all” type of problem solvingapproach. After the stage of analyzing all the information gathered during theinterviews and surveys, the formulation of problem trees has three main parts:problems,causesandeffects.Participatorydiscussiontablesareessentialtoachieve
37
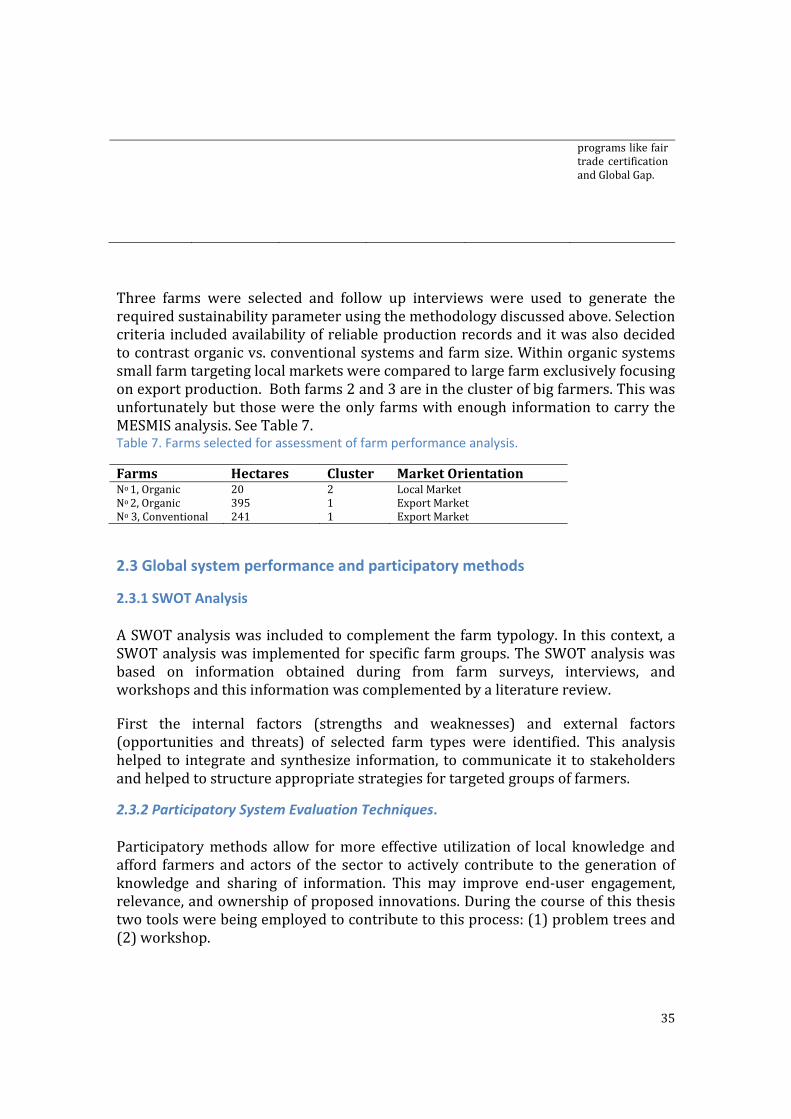
solutionstothemainproblemsthatwanttobeaddressedinthenewfarmdesignsandfeedbackforchangesordifferencesofopinions(S.Dogliotti,2013)
Figure 6. Problem Tree Diagram Methodology.
2.3.2.2Work Shop Theprimeobjectiveoftheworkshopwastopresentthepreliminaryresultsofthepilotstudy.Theactivitytookplacetodiscusscertaintopics(Table8)ofinterestwithdifferentactorsfromthepineapplevaluechainandtheagendaoftheworkshopispresentedinAppendix2.Ingroupsoffiveactorsfromdifferentareasandexpertise,participantsdiscussedforone hour the problem trees and possible solutions and consequences in terms ofdesirabledesignoffutureproductionsystemsand/orvaluechains.
38
Table 8. Methodology used during the workshop that elucidated the opinion of the different stakeholders within the organic pineapple sector and other key informants and actors (conventional producers, governmental representatives). (Serna,. 2013)
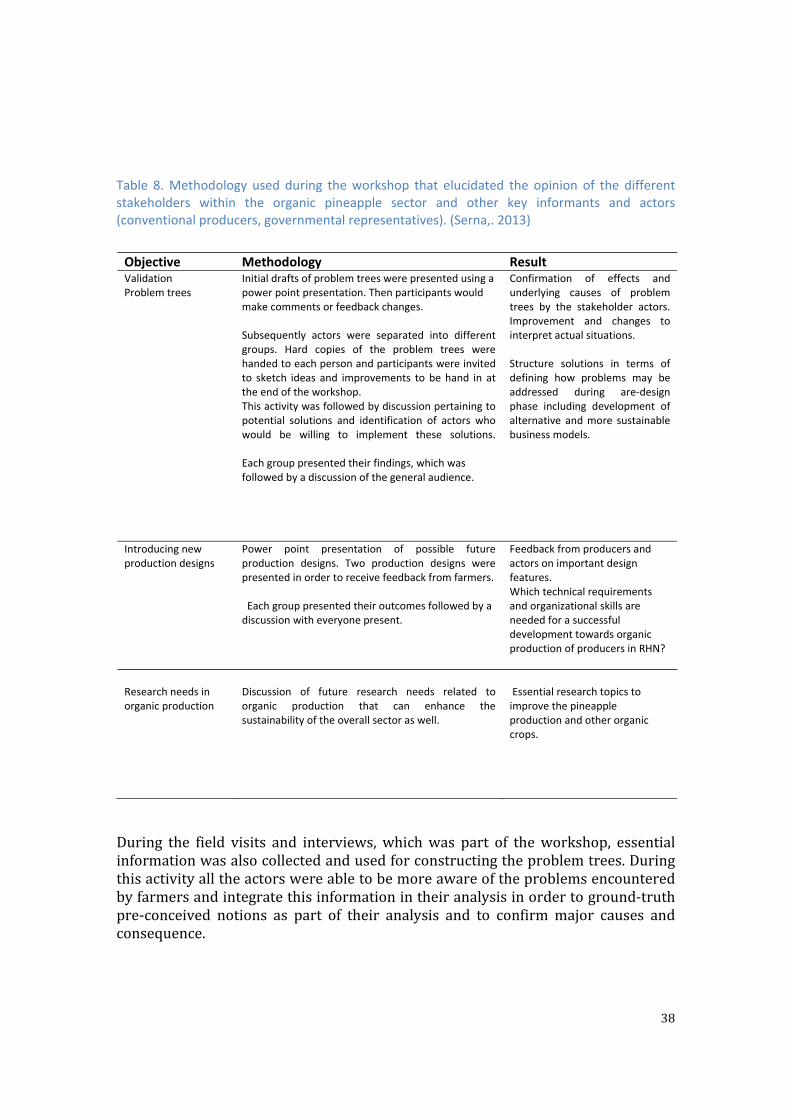
During the field visits and interviews, whichwas part of theworkshop, essentialinformationwasalsocollectedandusedforconstructingtheproblemtrees.Duringthisactivityalltheactorswereabletobemoreawareoftheproblemsencounteredbyfarmersandintegratethisinformationintheiranalysisinordertoground‐truthpre‐conceived notions as part of their analysis and to confirmmajor causes andconsequence.
Objective Methodology Result Validation Problem trees
Initial drafts of problem trees were presented using a power point presentation. Then participants would make comments or feedback changes. Subsequently actors were separated into different groups. Hard copies of the problem trees were handed to each person and participants were invited to sketch ideas and improvements to be hand in at the end of the workshop. This activity was followed by discussion pertaining to potential solutions and identification of actors who would be willing to implement these solutions. Each group presented their findings, which was followed by a discussion of the general audience.
Confirmation of effects and underlying causes of problem trees by the stakeholder actors. Improvement and changes to interpret actual situations. Structure solutions in terms of defining how problems may be addressed during are‐design phase including development of alternative and more sustainable business models.
Introducing new production designs
Power point presentation of possible future production designs. Two production designs were presented in order to receive feedback from farmers. Each group presented their outcomes followed by a discussion with everyone present.
Feedback from producers and actors on important design features. Which technical requirements and organizational skills are needed for a successful development towards organic production of producers in RHN?
Research needs in organic production
Discussion of future research needs related to organic production that can enhance the sustainability of the overall sector as well.
Essential research topics to improve the pineapple production and other organic crops.
39
This method will be continued during new designs and further investigations.Farmersshouldagreeupon issuespresentedandprovide feedbacktoanalyzeandproposedifferentviablesolutionstosolvetheseproblems.Includingdifferentactorswithin the value chain is critical to come up with feasible solutions and to getbroader support for potential intervention from the entire sector and throughoutthewholevaluechain.Thisactivitywasfollowedbydiscussionstoaddresspotentialobstacles related to production, marketing, commercialization and distributiontacticsoftheagriculturalchain.Alternative managements practices and production systems designs (based onemergingmarketnichesfortubersandtropical fruits fromEOSTAandcompatiblewith current production practices and existing infrastructure) were presented totheproducersandotheractors.Thesedesignswereexamplesofviablealternativesthatarenotwidelybeingusedyetbutmayholdpromise.
40
3. Results
3.1 Profiling of the pineapple Industry Tofullyunderstandthepineappleindustryareviewofimportanthistoriceventsisnecessary alongwith an outlinewhat external and internal forces that shape theindustry,whichisprovidedinthefollowingsection.
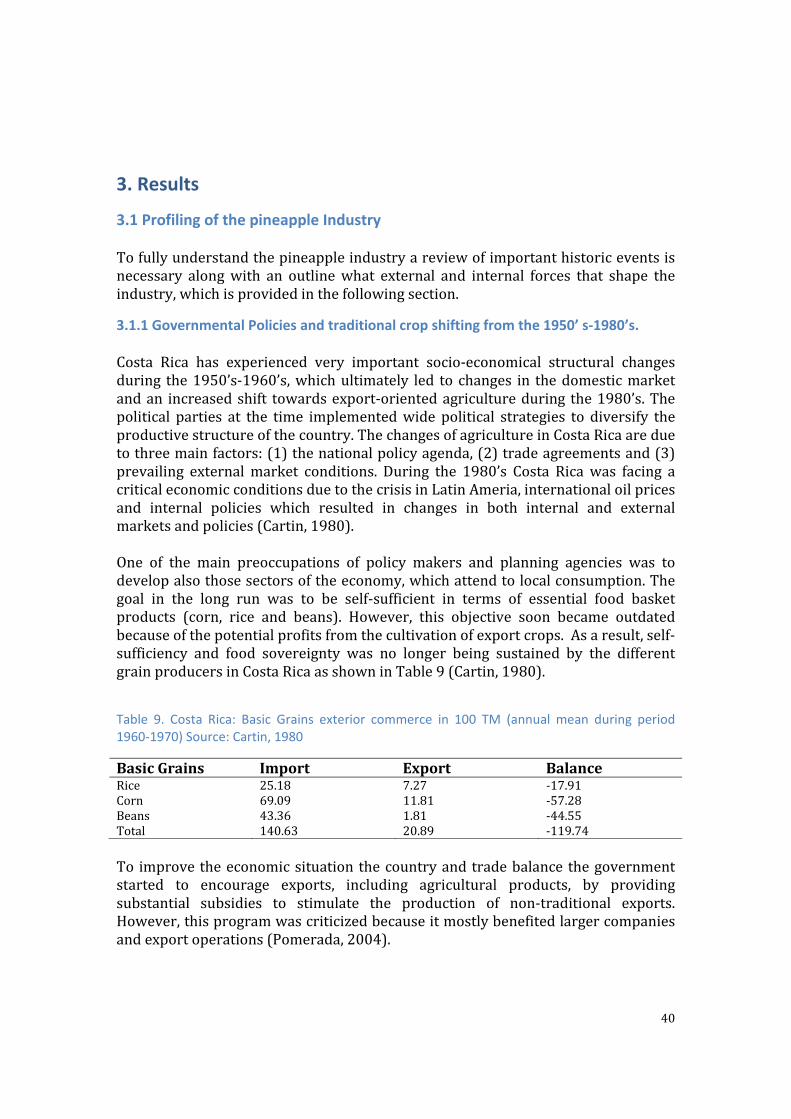
3.1.1 Governmental Policies and traditional crop shifting from the 1950’ s‐1980’s. Costa Rica has experienced very important socio‐economical structural changesduring the1950’s‐1960’s,whichultimately led to changes in thedomesticmarketandan increasedshift towardsexport‐orientedagricultureduring the1980’s.Thepolitical parties at the time implementedwide political strategies to diversify theproductivestructureofthecountry.ThechangesofagricultureinCostaRicaareduetothreemainfactors:(1)thenationalpolicyagenda,(2)tradeagreementsand(3)prevailing externalmarket conditions. During the 1980’s Costa Ricawas facing acriticaleconomicconditionsduetothecrisisinLatinAmeria,internationaloilpricesand internal policies which resulted in changes in both internal and externalmarketsandpolicies(Cartin,1980).One of the main preoccupations of policy makers and planning agencies was todevelopalsothosesectorsoftheeconomy,whichattendtolocalconsumption.Thegoal in the long run was to be self‐sufficient in terms of essential food basketproducts (corn, rice and beans). However, this objective soon became outdatedbecauseofthepotentialprofitsfromthecultivationofexportcrops.Asaresult,self‐sufficiency and food sovereignty was no longer being sustained by the differentgrainproducersinCostaRicaasshowninTable9(Cartin,1980).
Table 9. Costa Rica: Basic Grains exterior commerce in 100 TM (annual mean during period 1960‐1970) Source: Cartin, 1980
BasicGrains Import Export BalanceRice 25.18 7.27 ‐17.91Corn 69.09 11.81 ‐57.28Beans 43.36 1.81 ‐44.55Total 140.63 20.89 ‐119.74To improvetheeconomicsituationthecountryandtradebalancethegovernmentstarted to encourage exports, including agricultural products, by providingsubstantial subsidies to stimulate the production of non‐traditional exports.However,thisprogramwascriticizedbecauseitmostlybenefitedlargercompaniesandexportoperations(Pomerada,2004).

41
Regardlessclearchangesoccurredincludingasharpincreaseintheexportsofnon‐traditional crops while production of traditional crops like basic staple cropsincludingrice,maizeandbeans.Thesecropsaremainlyproducedbysmallholders,whichhavedeclinedintermsoflandusefrom39.7%in1990to28.5%in2000andthiswasmirroredbyadecreaseinproductionareadedicatedtobasicgrains(Cartin,1980). Moreover, the elimination of government support of price guaranteeprograms, jeopardize theexistenceofsmallgrainproducers,whichchangedcropsoroptedtopursueoff‐farmemploymentinlargefarms/companies.
3.1.2 Evolution of Market Oriented fruit production in Costa Rica Costa Rica is known for several export products such as pineapple, coffee andbanana. The evolution of the fresh fruit for international and localmarkets grewvery fast. From the 50’s to 90’s Costa Ricawasmostly self‐sufficient in terms ofagricultural production but over time it has increasingly focused on exportcommoditieswhile increasingly importing foodcrops. Theministryofagriculturehas separated and grouped the variation of crops in Costa Rica in the followingcategories:(1)industrialcrops, likesugarcane,coffee,orange,macadamia,etc.(2)fresh fruits, (3) tropical roots, (4)horticultural products, (5)basic grains.Mostofthe agricultural products are for export markets while second and third qualityproducts from the fresh fruits, industrialized crops and tubers may bemarketedlocally. In contrast,most horticultural products andbasic grains areproduced forlocalconsumption(MAG,2010). FromTable10 it isevident that in termsof landarea fresh fruit cropsare the second largest sectorafter industrial cropsand thatbetween2000and2008theacreageoffruitcropsincreasedby22%.Thisincreasewascoincidingwithadecreaseingraincropacreageby27%.Intermoftheacreageoffreshfruitcrops,pineappleisthesecondlargestcropandthisareaincreasedbyafactor three between 2000 and 2008 (Table 11). Moreover, in 2013, it alreadyaccounted for 45.000 hawhile at the same time the production also is becomingincreasinglymarginalized. Table 10. Cultivated Area of the main tropical fruits during 2000‐2008 in Costa Rica. (MAG, 2010)
Crop Ha Change
Year 2000 2008 %Banana 47982 44313 ‐8Pineapple 12500 33488 +168Melon 7185 8640 +20Plantain 8347 6500 ‐22Papaya 619 840 +35Mango 8200 8500 +4Strawberry 100 136 +36Total 84933 102417 +20
42
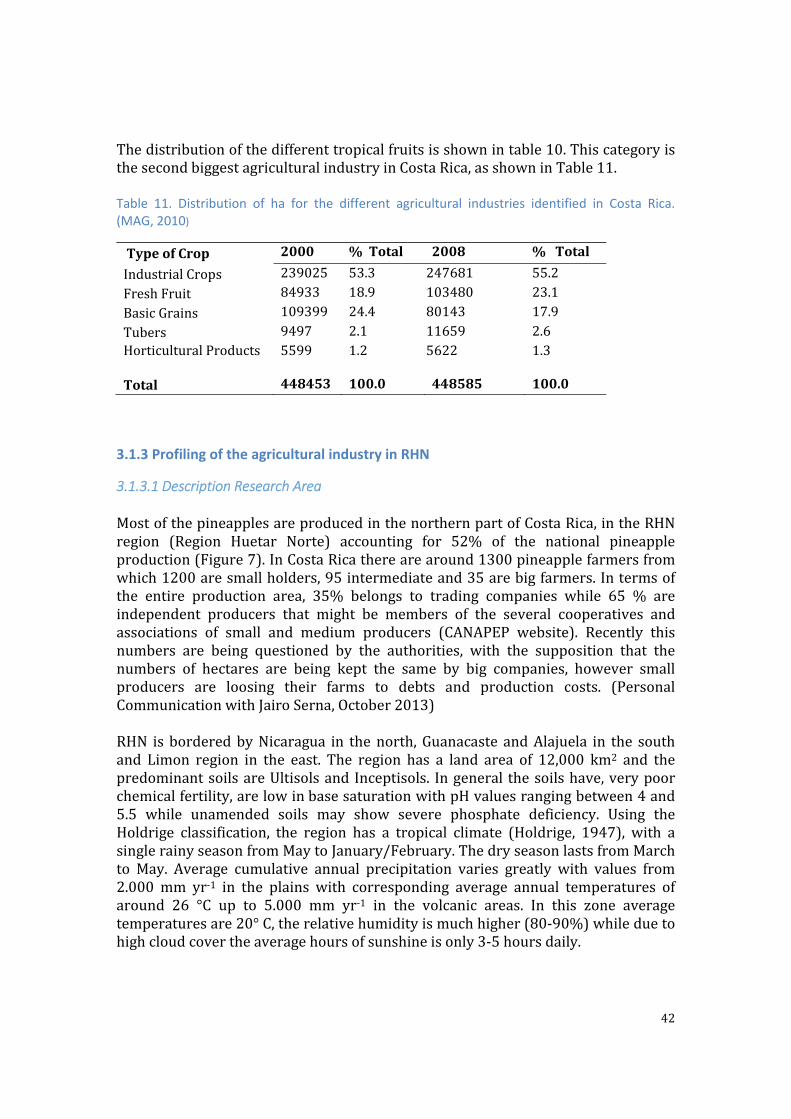
Thedistributionofthedifferenttropicalfruitsisshownintable10.ThiscategoryisthesecondbiggestagriculturalindustryinCostaRica,asshowninTable11.Table 11. Distribution of ha for the different agricultural industries identified in Costa Rica. (MAG, 2010)
TypeofCrop 2000 %Total 2008 %Total
IndustrialCrops 239025 53.3 247681 55.2
FreshFruit 84933 18.9 103480 23.1
BasicGrains 109399 24.4 80143 17.9
Tubers 9497 2.1 11659 2.6HorticulturalProducts
5599
1.2
5622 1.3
Total 448453 100.0 448585 100.0
3.1.3 Profiling of the agricultural industry in RHN
3.1.3.1Description Research Area MostofthepineapplesareproducedinthenorthernpartofCostaRica,intheRHNregion (Region Huetar Norte) accounting for 52% of the national pineappleproduction(Figure7).InCostaRicatherearearound1300pineapplefarmersfromwhich1200aresmallholders,95intermediateand35arebigfarmers.Intermsofthe entire production area, 35% belongs to trading companies while 65 % areindependent producers that might be members of the several cooperatives andassociations of small and medium producers (CANAPEP website). Recently thisnumbers are being questioned by the authorities, with the supposition that thenumbers of hectares are being kept the same by big companies, however smallproducers are loosing their farms to debts and production costs. (PersonalCommunicationwithJairoSerna,October2013)RHN isborderedbyNicaragua in thenorth,Guanacaste andAlajuela in the southand Limon region in the east. The region has a land area of 12,000 km2 and thepredominantsoilsareUltisolsandInceptisols. Ingeneral thesoilshave,verypoorchemicalfertility,arelowinbasesaturationwithpHvaluesrangingbetween4and5.5 while unamended soils may show severe phosphate deficiency. Using theHoldrige classification, the region has a tropical climate (Holdrige, 1947), with asinglerainyseasonfromMaytoJanuary/February.ThedryseasonlastsfromMarchto May. Average cumulative annual precipitation varies greatly with values from2.000 mm yr‐1 in the plains with corresponding average annual temperatures ofaround 26 °C up to 5.000 mm yr‐1 in the volcanic areas. In this zone averagetemperaturesare20°C,therelativehumidityismuchhigher(80‐90%)whileduetohighcloudcovertheaveragehoursofsunshineisonly3‐5hoursdaily.
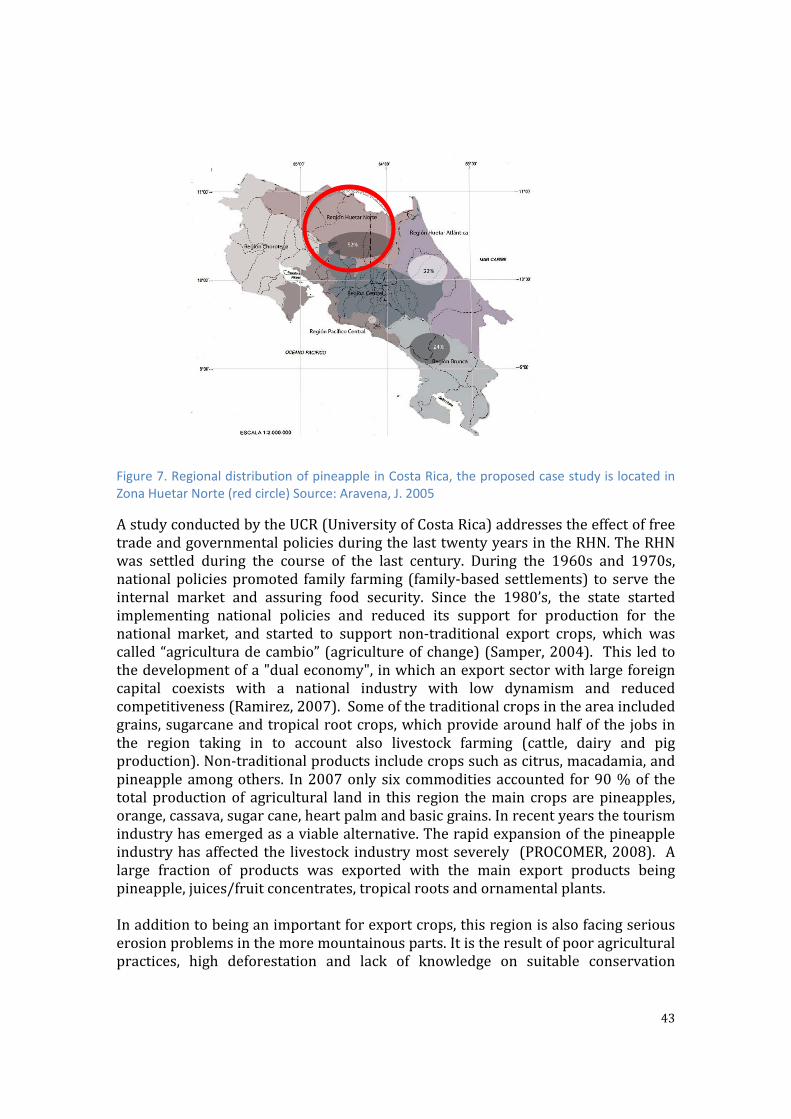
43
Figure 7. Regional distribution of pineapple in Costa Rica, the proposed case study is located in Zona Huetar Norte (red circle) Source: Aravena, J. 2005
AstudyconductedbytheUCR(UniversityofCostaRica)addressestheeffectoffreetradeandgovernmentalpoliciesduringthelasttwentyyearsintheRHN.TheRHNwas settled during the course of the last century. During the 1960s and 1970s,nationalpoliciespromoted family farming (family‐basedsettlements) to serve theinternal market and assuring food security. Since the 1980’s, the state startedimplementing national policies and reduced its support for production for thenational market, and started to support non‐traditional export crops, which wascalled“agriculturadecambio”(agricultureofchange)(Samper,2004). This ledtothedevelopmentofa"dualeconomy",inwhichanexportsectorwithlargeforeigncapital coexists with a national industry with low dynamism and reducedcompetitiveness(Ramirez,2007).Someofthetraditionalcropsintheareaincludedgrains,sugarcaneandtropicalrootcrops,whichprovidearoundhalfofthejobsinthe region taking in to account also livestock farming (cattle, dairy and pigproduction).Non‐traditionalproductsincludecropssuchascitrus,macadamia,andpineappleamongothers. In2007onlysix commoditiesaccounted for90%of thetotal productionof agricultural land in this region themain crops arepineapples,orange,cassava,sugarcane,heartpalmandbasicgrains.Inrecentyearsthetourismindustryhasemergedasaviablealternative.Therapidexpansionofthepineappleindustryhasaffected the livestock industrymostseverely (PROCOMER,2008). Alarge fraction of products was exported with the main export products beingpineapple,juices/fruitconcentrates,tropicalrootsandornamentalplants.Inadditiontobeinganimportantforexportcrops,thisregionisalsofacingseriouserosionproblemsinthemoremountainousparts.Itistheresultofpooragriculturalpractices, high deforestation and lack of knowledge on suitable conservation
44
practices of the local farm communities. The current growth in pineappleproduction has resulted in a shift from more agroforestry‐based systems tounshadedmonocroppingsystems.Thishasresultedinenvironmentalperturbancestriggeringsoildegradation,surfacewatercontaminationsandproblemswithsolidwaste management. In recent years public institutes, private enterprises,municipalities and international NGO’s have been trying to develop soilconservationmeasuresandreversethedegradationofnaturalresources.Based on field observations it is evident that producers cannot abandon theircurrent high input and tillage production systems instantaneously and also needadequate support while adapting different production techniques. As an examplethe conversion of conventional to organic, requires better management skills,different inputs while farmers need to comply with certification standards andmaintain a record keeping system. Moreover, the transition is three years.Furthermore, in termsoforganizationalandoperational components farmers facemany challenges including logistics, quality control, and storage facilities; havingaccesstopropermarketingchannelsgaps.Finallysolutionsshouldbeplacedinthecontext of resource endowment, resource management, capacity building, andmarketaccessInthecontextofmappinglocalfarmingsystemsitisrelevanttolookatsomebasicfarm types including farming styles and/or strategies, farm activities, farm scale,andperformanceassessmentcriteria.InTable12abasictypologyoftheprevailingfarm types in the RHN region is provided along with their strategies, assets andevaluation criteria (critical points). From this table itmay be concluded that thedifferentfarmershaveimplementedmanydifferentstrategies.Someofthemfocusin exports markets or in renovation of diverse farming systems. Some havecontinuedwiththesamecropsproducedinthearealikemeatanddairyfarms.Thistablehighlightsandallowsapreviewofthehighdiversityoffarmersintheareaandhowtheyhavefounddifferentwaystosustaintheirfarmswithdifferentactivities.

45
Table 12. Characterization of farms in the RHN in relation to their strategy. Source: Faure, 2004
aHaveenoughincometoinvestininnovationandmodernizationsoftheirfarms.
b Means they depend less in intermediaries to commercialize their products and they depend on local consumers and
markets.
National policies provided incentives (e.g. subsidies) to farmers to specialize andintensify their farm operations. This led to increased production, thereforeincreased dependence on expensive technologies, like imported agrochemicals,machinery, and fossil‐fuel consumption.Pineapple is a relatively intensive crop interms of agro‐chemical inputs as shown in Table 13. (Ingswere, 2012). In thiscontext, large companies and international markets were governing prevailingproductionpracticeswhilealsocontrollingexternaldistribution(Faure ,2002andAravena,2005).
Strategy Export Modernization Renovation Permanence Defensive No
relationwithstructureforexport
Relationwithstructureforexport
Cattle/Crops
Milk DiversifiedFarmingSystem
SugarCane
Lives‐tockMeat/Milk
ExtensiveCattle
Settlementsthatfacedifficulties
No.ofProducers
2000 1500 2000 1500 1000 1000 3500 1500 4000
Surface/exploitation(ha)
1to30 2to30 50to300
10to50
5to30 3to100
10to50
50to500
5to20
Advantages
FinancialCapacitya/Riskdistribution
Incomestability
Technicalknowledge/Autonomyb/Riskdistribution
Incomestability/
Autonomy/LowproductionCosts
Autonomy/LowproductionCosts
Mobility
CriticalPoints
ProductionCosts/Norms/Weakorganization
ProductionCost/Norms
ProductionCosts/Unattractiveprices
ProductionCosts
Technicstobeimproved/Organization/Modestincome
ProductionCost/Lowproductivity
ModestIncome
Lowproductivity
LowinvestmentCapacity

46
InordertobecompetitiveandtoadapttoglobalmarketsproducersinRHNfocusedtheirproductionschemesonasmallnumberofcommoditiesthatmainlytargetedexportmarketsforpineapples,ornamentalplants,cassava,andoranges(Table14).Table 14. Surface (ha) of new export crops in 5 municipalities of RHN in 2000. (Source: Faure, 2004)
Crop Guatuso Upala SanCarlos LosChiles Sarapiqui Total
Cassava 150 90 3940 600 350 5130
Othertubers 140 440 560 940 240 2320
Plantain 80 290 520 0 290 1180
Pineapple 180 30 3300 0 1500 5010
HeartofPalm 60 1520 1270 0 4310 7160
Orange 20 900 1390 11000 0 13310Cashew 0 1180 10 0 0 1190
OrnamentalPlants 0 0 660 10 180 850
TOTAL 630 4450 11650 12540 6870 36150
%exportcrops/exportcrop+traditionalcrops 62 76 52 44 96 56
Table 13. Summary of pineapple data. Use of energy inputs (pesticides, fertilizers and fuelconsumption). Source: Ingswere, 2012

47
Table 15. Distribution of cultivated land between families based systems and companies in 2004. (Source: SEPSA, Regional Survey of fruits and tropical roots, 2005, UNICERSE 2004).
As a result, agriculture evolved rapidly in this area and this triggered varioustransformations in the farmsof thearea.Biggerproducers,usually cattle farmers,whichconvertedtoagriculturalproduction,plantedmostofthesenewcrops.Mainlythishappenedwithinvestmentofferedbyinternationalcompanies(USA/Europe/Mexican/Colombian).Thecontrastbetweendifferentsizesoffarms(smallvs.big)andtheirshareinthedifferentcommoditiesisshowninTable15.Itisevidentfromthistablethatfamilyfarmers only account for a very small share of the pineapple business (5%)comparedtoindustrialfarms(27.9%).Inthiscontext,Familyfarmsmainlyfocusonstaplecropsforfamilyconsumptionlikebasicgrains(45.5%)ortubers(18.2%).Bigcompanies,on theotherhand, focusmainlyonexportcommodities likepineapple(27.9%)andoranges(48.5%),asshowninTable16.Table 16. Share of different crops on family and industrialized farms total cropland.
Crops %ofeachcroponfamilyfarms
%ofeachcroponindustrialfarms
Tubers 18.2 5.9
Basicgrains 45.5 2.9
Pineapple 4.5 27.9
Orange 1.5 48.5
Sugarcane 9.1 8.8
Others 21.2 5.9
Typeofproducer Tubers BasicGrains Pineapple Orange SugarCane Others Total
ha % ha % ha % ha % ha % ha % ha %
FamilyFarms 6000 75 15000 94 1500 14 500 3 3000 50 7000 78 33000 49Internationalandnationalcompanies 2000 25 1000 6 9500 86 16500 97 3000 50 2000 22 34000 51
Total 8000 100 16000 100 11000 100 17000 100 6000 100 9000 1000 67000 100
48
Due to the rapid expansion of pineapple production other agricultural activitieswere being deemphasized and often abandoned. Certain farmers in the areacontinuedproducingcommoditiesforthenationalmarket(beef,beans,milk,amongothers)(Acuña,G.2006).Forexamplethenumberofmilkcattlefarmsintheareain1984accountedfor34500producerswhilein2000ithaddeclinedto15100.Somefarmerssimplystoppedfarmingwhereasothersstartedcultivatingpineapple,likewasthecaseformajorityofproducersinthesouthoftheRHNregion(Faure,2004).In2011pineapplewasthemayorexportproductinRHNanditaccountedfor66.4%ofthetotalexportsoftheregion(Calderon,2013).
3.1.4 Evolution of pineapple farms in Costa Rica
3.1.4.1 Historic perspective
Theplantingsofpineappleforinternationalmarketswasinitiatedinthe1960’swithcertain governmental policies as explained in the first section. The ChiquitacompanypromotedandplantedthevarietyMontelirio forexport tocompetewithexisting farms in Hawaii, andwas the first exporter at that time. Afterwards, thevarietysmoothcayenneHawaiianwasplanted,butduetothelackoftechnologythefruitdidnotproduceas expected. Ultimately the cropwasabandoned for exportandonlycultivatedforthenationalmarkets.
3.1.4.2 Agronomic practices
Traditionallypineapplewasproducedinanaturalway(noagrochemical)anditdidnot require any technological package. During the 1970’s the PineappleDevelopmentCompany(PINDECO)startoperating inCostaRicaandthiscompanyinitiatedoperationsinthesouthernpartofthecountry.Bythe1980’s(90%)oftheproductionoccurred in the southernpartofCostaRicawhile inheNorthernpartless then 10%was produced. But PINDECO also started promoting production indifferentregionsofthecountryaswellby introducingnewproductiontechniquesand technological packages. But the biggest expansion of pineapple startedwhenthecompany introduced thehybridMD‐2whichwasadapted to the local climaticconditions. This fruit became the most wanted because of its level of sweetness(Brix degrees)(Peña, 2011) Since the 1980’s standard technological package havebeen introduced including selected varieties suitable for export and introducingunknownmachineryinthecountry.ThisincreasedproductionbutalsoaugmentedthedependencyonproductiontechnologyandinputsimportedfromtheUSA.Thistechnological package was adapted from industrial plantations in Hawaii, whereagroecological, topographic, pedoclimatic and socio‐economic conditions arecompletelydifferent fromthose inCostaRica.Asaresult, theplanting techniques,density, fertilization schemes, application of agrochemicals, cycle, etc., werecompletely different from the traditional methods used by local Campesinos.Regardless,thenewvarietyadaptedverywelltothesoilsandclimateinthecountryandCostaRicabecamethelargestproducerofexportfreshpineappleintheworld
49
(Quijandria,1997).Itmaybenotedthattheindustryhasevolvedinmanydifferentways. A concise overview of the agronomic practices and key features of the keyproducersisprovidedinTable12.
3.1.4.3 Local industry and transnational companies
Global forces and national policies thus shaped the development pathway ofagricultureinCostaRica.Thepineappleindustryinthe80’srapidlygrewbyactiveinvolvement of large companies like PINDECO, while demand for this fruit keptgrowingintheUSAandEurope.Currently,pineappleisthenumberoneagricultureproduct exported to the European Union. It accounts for 347.5 million dollars(20.7%) of total exports and in 2011, 375.9 million dollars (19.9%) (Calderon,2013).Thisallowedandenticedmoreandmoreproducerstoproducepineappletomeet this demand. So even small family farms started to participate in globalproductionduetothehighpricebeingpaidinthebeginningof2000’s.However,in2006itwasestimatedthatPINDECOcontrolled50%ofthetotalpineappleareainthe country (approximately 15000 ha)(Acuña, 2006). PINDECO also started togather independent farmerswith an arrangement known as “satellite farming” inwhich the farmers provide their land and labor while the company supplies thetechnologyandmachinery,andalsoisguaranteeingthepurchaseofthefruit.
3.1.4.4 Economic realities of local (small‐holder) farmers
Sincesomanyproducersstartedproducingpineapple,especiallysmallfarmersarefacingproblemstobecompetitivesincetheycannoteffectivelycompetewithlargecooperativefarms,whichhavetherequiredinfrastructureandbenefitofeconomiesof scale to produce and export pineapple, which is becoming increasinglymarginalized.Thisdueto increasingproductioncosts, lowerpricesandchallengesassociatedwithmarketing logistics,whichwill bediscussed inmoredetailbelow.Thesuccessoffamily‐basedfarmsthusdependsonseveralfactorssuchaseconomicand production conditions. The economic performance of pineapple producers ismay differ among different farm types depending on several characteristics andcircumstances (farm structure, size, biodiversity, financial capacity, and access toknowledge, technologies, markets among others). Besides these, the objectives ofthefarmersareknowntovaryaswell,asshowninTable12(Faure,2002).Producers are also affected by the exchange rate of Costa Rican currency (colon)compared to the dollar, as product prices are negotiated in dollars even thoughproducershaveall their cost inCostaRicanColones. Especially smallholdersarefacingchallengesduetothehighcostofestablishing1haofMD2pineappleandthe2‐year cycle of this crop. This requires high investments, external loans andpreventssmallproducersfromhaveshort‐termincomewhiletheyareincreasinglydependentonincomefrompineappletofeedtheirfamilies.Moreover,inmostofthecasesinitialcropperformancemaynotbeoptimalwhileinitialcostsareveryhigh,therefore only after 3 to 4 years producers start making profits. Besides this,production costs keep increasing. In 2007 itwas calculated that inputs costs like
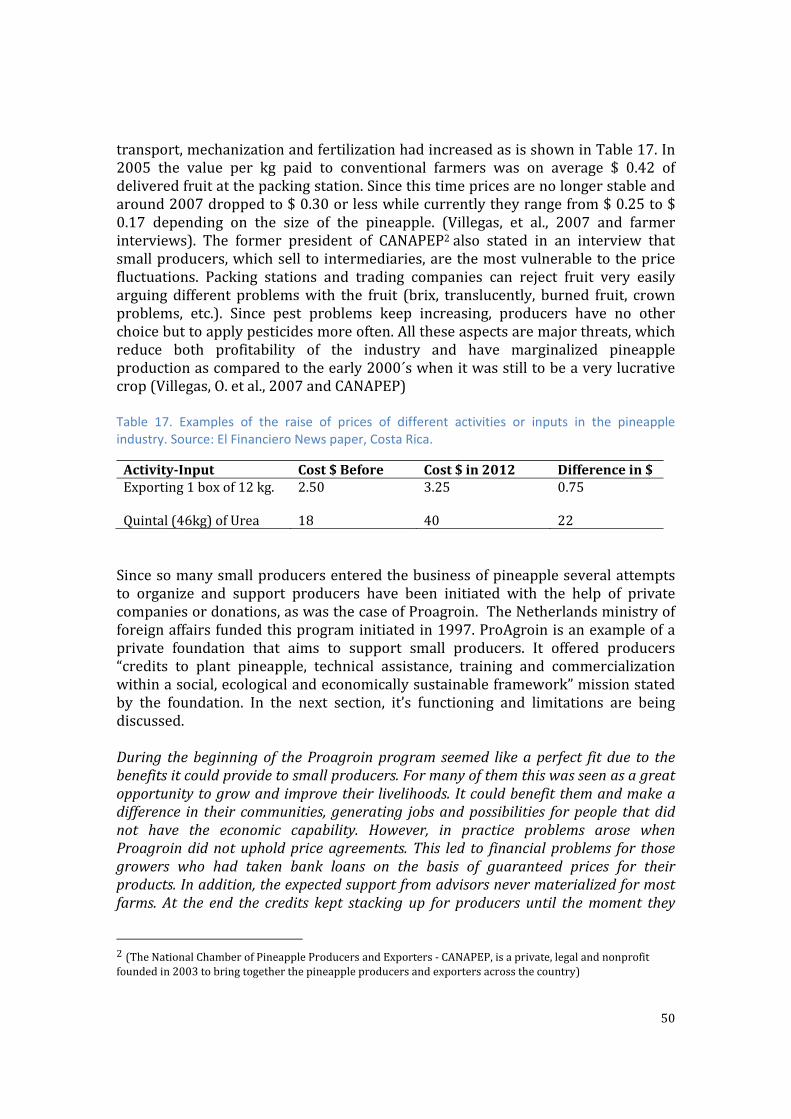
50
transport,mechanizationandfertilizationhadincreasedasisshowninTable17.In2005 the value per kg paid to conventional farmers was on average $ 0.42 ofdeliveredfruitatthepackingstation.Sincethistimepricesarenolongerstableandaround2007droppedto$0.30orlesswhilecurrentlytheyrangefrom$0.25to$0.17 depending on the size of the pineapple. (Villegas, et al., 2007 and farmerinterviews). The former president of CANAPEP2also stated in an interview thatsmallproducers,whichsell to intermediaries,arethemostvulnerabletothepricefluctuations. Packing stations and trading companies can reject fruit very easilyarguing different problemswith the fruit (brix, translucently, burned fruit, crownproblems, etc.). Since pest problems keep increasing, producers have no otherchoicebuttoapplypesticidesmoreoften.Alltheseaspectsaremajorthreats,whichreduce both profitability of the industry and have marginalized pineappleproductionascomparedtotheearly2000´swhenitwasstilltobeaverylucrativecrop(Villegas,O.etal.,2007andCANAPEP)Table 17. Examples of the raise of prices of different activities or inputs in the pineapple industry. Source: El Financiero News paper, Costa Rica.
Activity‐Input Cost$Before Cost$in2012 Differencein$Exporting1boxof12kg.
2.50 3.25 0.75
Quintal(46kg)ofUrea 18 40 22Sincesomanysmallproducersenteredthebusinessofpineappleseveralattemptsto organize and support producers have been initiated with the help of privatecompaniesordonations,aswasthecaseofProagroin.TheNetherlandsministryofforeignaffairsfundedthisprograminitiatedin1997.ProAgroinisanexampleofaprivate foundation that aims to support small producers. It offered producers“credits to plant pineapple, technical assistance, training and commercializationwithinasocial,ecologicalandeconomicallysustainableframework”missionstatedby the foundation. In the next section, it’s functioning and limitations are beingdiscussed.During thebeginningof theProagroinprogram seemed likeaperfect fitdue to thebenefitsitcouldprovidetosmallproducers.Formanyofthemthiswasseenasagreatopportunitytogrowand improvetheir livelihoods.Itcouldbenefitthemandmakeadifference in theircommunities,generating jobsandpossibilities forpeople thatdidnot have the economic capability. However, in practice problems arose whenProagroindidnotupholdpriceagreements.This led to financialproblems for thosegrowers who had taken bank loans on the basis of guaranteed prices for theirproducts.Inaddition,theexpectedsupportfromadvisorsnevermaterializedformostfarms.At the end the credits kept stackingup forproducersuntil themoment they
2(TheNationalChamberofPineappleProducersandExporters‐CANAPEP,isaprivate,legalandnonprofitfoundedin2003tobringtogetherthepineappleproducersandexportersacrossthecountry)
51
wentbankrupt(Informationfromproducersinterviewedandstakeholdersinsights).In2013theCostaRicanmassmediaMAGannouncedthebankruptcyof450producers,which were part of this foundation (Teletica, 2013)http://www.teletica.com/Noticias/5108‐Asamblea‐Legislativa‐investigara‐a‐Proagroin‐tras‐denuncias‐de‐cientos‐de‐pineros.note.aspx.
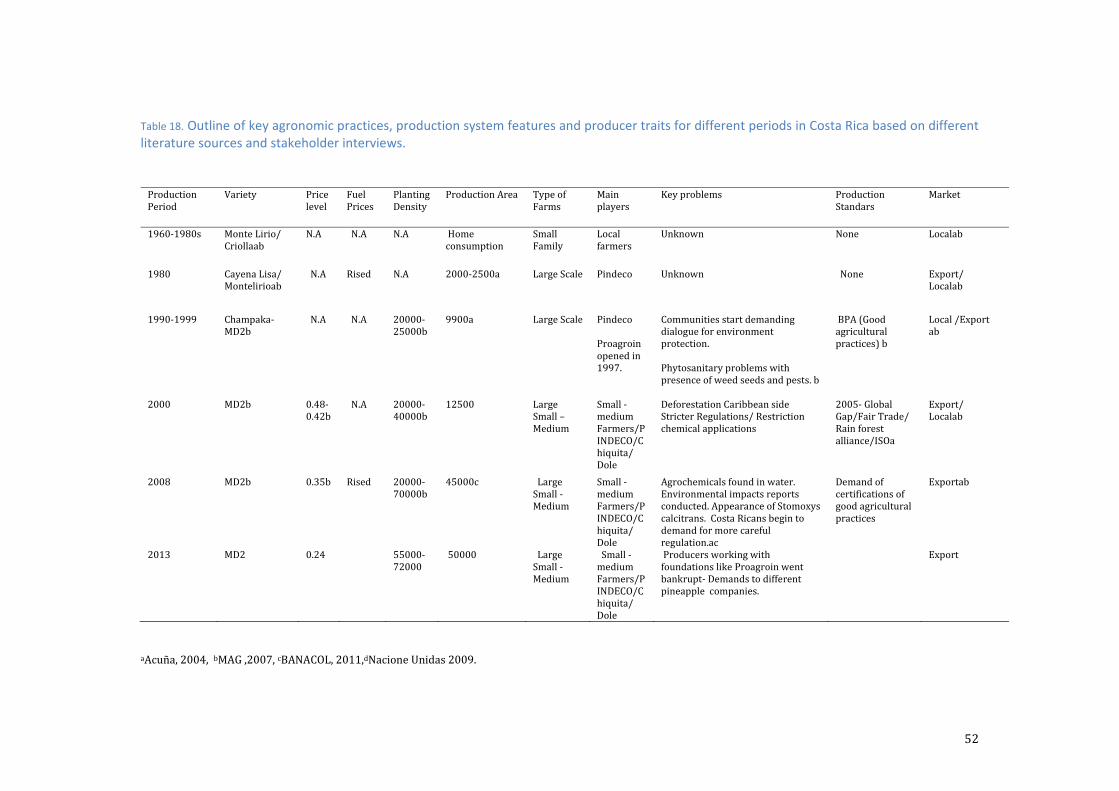
52
Table 18. Outline of key agronomic practices, production system features and producer traits for different periods in Costa Rica based on different literature sources and stakeholder interviews.
aAcuña,2004,bMAG,2007,cBANACOL,2011,dNacioneUnidas2009.
ProductionPeriod
Variety Pricelevel
FuelPrices
PlantingDensity
ProductionArea TypeofFarms
Mainplayers
Keyproblems ProductionStandars
Market
1960‐1980s MonteLirio/Criollaab
N.A N.A N.A Homeconsumption
SmallFamily
Localfarmers
Unknown None Localab
1980 CayenaLisa/Montelirioab
N.A Rised N.A 2000‐2500a LargeScale Pindeco Unknown None Export/Localab
1990‐1999 Champaka‐MD2b
N.A N.A 20000‐25000b
9900a
LargeScale PindecoProagroinopenedin1997.
Communitiesstartdemandingdialogueforenvironmentprotection.Phytosanitaryproblemswithpresenceofweedseedsandpests.b
BPA(Goodagriculturalpractices)b
Local/Exportab
2000 MD2b 0.48‐0.42b
N.A 20000‐40000b
12500
LargeSmall–Medium
Small‐mediumFarmers/PINDECO/Chiquita/Dole
DeforestationCaribbeansideStricterRegulations/Restrictionchemicalapplications
2005‐GlobalGap/FairTrade/Rainforestalliance/ISOa
Export/Localab
2008 MD2b 0.35b Rised 20000‐70000b
45000c
LargeSmall‐Medium
Small‐mediumFarmers/PINDECO/Chiquita/Dole
Agrochemicalsfoundinwater.Environmentalimpactsreportsconducted.AppearanceofStomoxyscalcitrans.CostaRicansbegintodemandformorecarefulregulation.ac
Demandofcertificationsofgoodagriculturalpractices
Exportab
2013 MD2 0.24 55000‐72000
50000 LargeSmall‐Medium
Small‐mediumFarmers/PINDECO/Chiquita/Dole
ProducersworkingwithfoundationslikeProagroinwentbankrupt‐Demandstodifferentpineapplecompanies.
Export

53
3.1.5 Market requirements, sustainable production and market niches
With the growing global demand for pineapples from Costa Rica and differentproducers (small‐medium and big) entering into the market, internationalstandardsforfruitqualitywerebeingdevelopedandimposedbybuyersduringtheearly 1980’s. Currently, producers therefore must comply with the strictrequirementsofpublicandprivatestandardsforthesecurityandassuranceoffoodquality.Thisistheconsequenceofthepreoccupationofwesternconsumersrelatedto different scandals connected to food security and market globalization(Trienekens,2007).Inordertocomplywithinternationalexportregulations(GlobalGap3, HACCP4, ISO, etc.) farming systems had to modify and adapt. Figure 8illustrates the buyer requirements which are divided into 3 (1)mandatory, legalrequirementsthatallproducersmustmeettoenterintheEUmarket,(2)common,whichmeansmostcompetitorscomplywithand(3)nicherequirementsforspecificmarkets(CBIMarketInformationDatabase).
Besidesqualitycertificationsithasbecomecommonpracticeforbuyerstodemandcertification to show that producers are implementing sustainable practices.Moreover,inordertobemorecompetitiveinglobalmarketssomeproducersoptedtofindnichemarketslikeorganicorfairtrade.Duringtheendof2000’stheorganicmarketwasboominginCostaRicaandmanyproducersstartedshiftingtoorganicproduction. InCostaRica thereareseveralorganicproducersalthoughtheirexactnumbers are not known. Production costs for organic pineapple are at least 25%higher comparing to conventional production (Table 19). However, the currentprice premiums cannot fully cover the high costs. The organic area has beenshrinking in the past years since it is not viable for producers. Besides, smallproducers suffer from the high varying quality of product. In reality, instead ofpromoting sustainable production practices and protecting organic producers viacertification and price premiums, gradually producers stopped receiving pricepremiums for required certifications. This trend is becoming more and morecommon and certification is no longer an optionbut a standard requirement. ForexamplepineappleproducersareaskedtocomplywithGlobalGapcertificationandCODEX Alimentarius in order to be considered as suppliers (personalcommunicationHenk Zoutwelle, June, 2014). If nothing else this shows that evenorganicalternativessofarhaveprovidedlittleintermsofaddressinglocalconcerns.
3 G.A.P. stands for Good Agricultural Practice – and GLOBALG.A.P. is the worldwide standard that assures it. Visit: http://www.globalgap.org/uk_en/ 4The HACCP stands for Hazard analysis and critical control point system, which is science based and systematic, identifies specific hazards and measures for their control to ensure the safety of food. Visit: http://www.haccpeurope.com/index.php

54
Table 19. Basic cost of production for conventional and organic pineapple MD‐2. (Kellon, D., R. León, and R. Marsh. 2011.)
Aspresentedabovetheindustryhasevolvedinmanydifferentways.Afinaloverviewoftheindustryispresentedintable19.Thistablepresentsthedifferenttimeframesinatimeline
Figure 8. CBI Market Information Database: EU buyer requirements for fresh fruit and vegetables.(http://www.cbi.eu/marketintel_platform/fresh‐fruit‐vegetables/136122/buyerrequirements)

55
3.2 Diversity of pineapple growers in RHN.
3.2.1 Existing farm typologies Basedonexisting local studies (Kellonetal.2011,Faure,2004andMAG2007) thefollowing five types of farmers have been identified in Costa Rica: micro, small,medium, large, transnational producers. An outline ofmain characteristics of thesegroups is presented in Table 20. Small‐scale farmers are characterized by havingsmaller sized farmswithout any packing station for pineapple. These include verysmall (family‐based) farmers (1‐2 ha), that sell only in localmarkets and that arebeing characterized by producing other crops such as cassava, oranges, sweetpotatoes, which are also engaged in animal husbandry (micro‐producer). Mediumscale farmers are usually bigger in terms of land size and have via commercialcompanies,accesstoapackingstationaswell.Largefarmersarecultivatingextensiveareas and have their own packing station, they are typically associated withinternational companies,which commercialize and export thepineapple directly tointernational buyers.(Kellon, 2011). Transnational farms have the biggest landownership. These include holdings by companies likeDelMonte, PINDECO (4000Hha)andBanacol fromChiquita.Theymanage theentirepineapplevaluechainuntilthe final destination of the fruit. However, specific characteristics of each type offarmer are not well documented nor are clear how farm size affects productionefficiencyandsustainability.
Table 20 Characteristics Producers in Costa Rica. (Source: Aravena. 2005, Kellon. 2011 and MAG 2007).
GroupsofProducer
Hectares Yields
ConventionalInfrastructure
Micro‐producer
>1 Unknown Nopackingstation
Small <50(1‐10ha)
Unknown Nopackingstation
Medium 50‐250 Unknown Accesstopackingstation.
Large >250 80 -110 t/ha Privatepackingstation.
Transnational Unknown Unknown Privatepackingstation.
3.2.2 Farm Typology‐ Multiple Correspondence Analysis As mentioned in the methodology a farm typology was performed using MultipleCorrespondenceAnalysis(MCA)oncategoricalvariables.Therefore,thequantitativevariableswere transformed into categorical variables usingHierarchical Clustering(HC) techniques to obtain classes for the different variables. An example of this ispresentedinFig.9thatshowsthefourclassesobtainedweregeneratedforplantingdensity (see Annex 3 for the box plots for other transformed variables). Certain

56
variables,like“management”and“productiontype”,werenottakenintoaaccountfortheMCAbecausesomeoftheirclasseswereunder‐represented(e.g.only3farmersdoorganicagricultureonthesampleretained for theMCA)andtheclassesoverlapwithothervariablesas“priceQ”sotheywerenot included.Thegeneralclassesandcorresponding ranges for the overall modalities used in this analysis are beingoutlinedinTable21.
Figure 9. Box plot showing the value of each class for the variable of planting density.
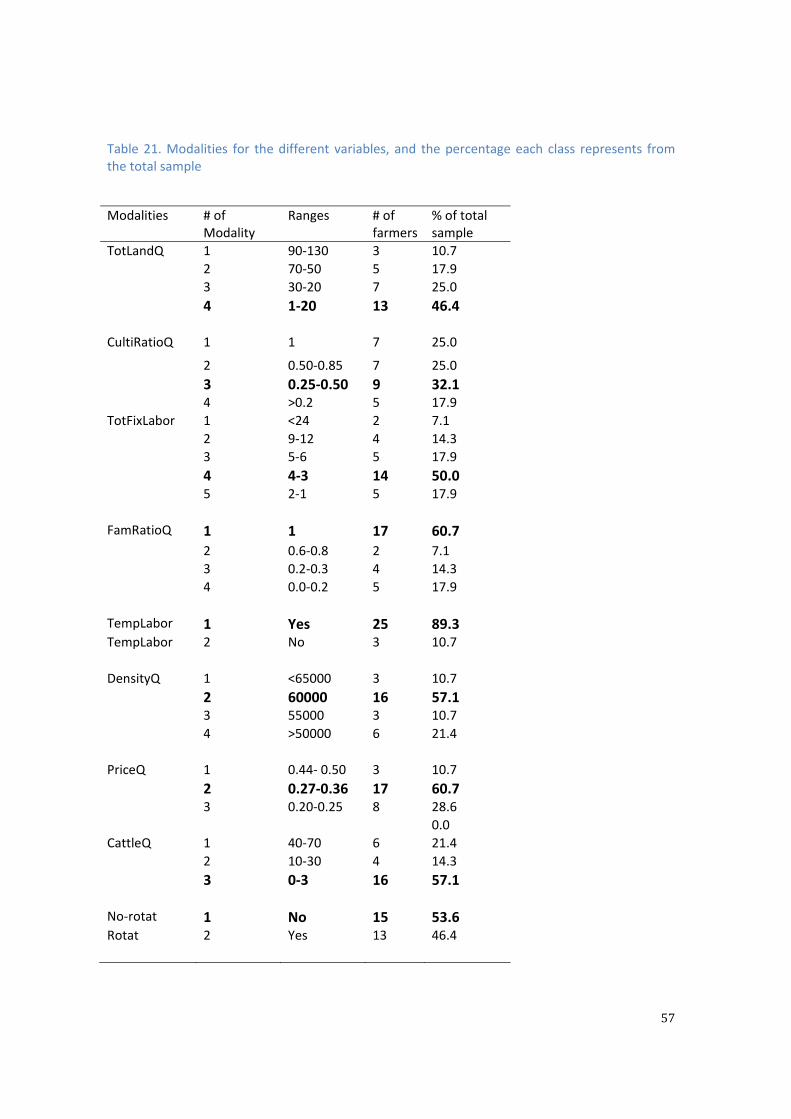
57
Table 21. Modalities for the different variables, and the percentage each class represents from the total sample
Modalities # of
Modality Ranges # of
farmers% of total sample
TotLandQ 1 90‐130 3 10.7
2 70‐50 5 17.9
3 30‐20 7 25.0
4 1‐20 13 46.4
CultiRatioQ 1 1 7 25.0
2 0.50‐0.85 7 25.0
3 0.25‐0.50 9 32.1 4 >0.2 5 17.9
TotFixLabor 1 <24 2 7.1
2 9‐12 4 14.3
3 5‐6 5 17.9
4 4‐3 14 50.05 2‐1 5 17.9
FamRatioQ 1 1 17 60.7
2 0.6‐0.8 2 7.1
3 0.2‐0.3 4 14.3
4 0.0‐0.2 5 17.9
TempLabor 1 Yes 25 89.3 TempLabor 2 No 3 10.7
DensityQ 1 <65000 3 10.7
2 60000 16 57.1 3 55000 3 10.7
4 >50000 6 21.4
PriceQ 1 0.44‐ 0.50 3 10.7
2 0.27‐0.36 17 60.73 0.20‐0.25 8 28.6
0.0
CattleQ 1 40‐70 6 21.4
2 10‐30 4 14.3
3 0‐3 16 57.1
No‐rotat 1 No 15 53.6 Rotat 2 Yes 13 46.4
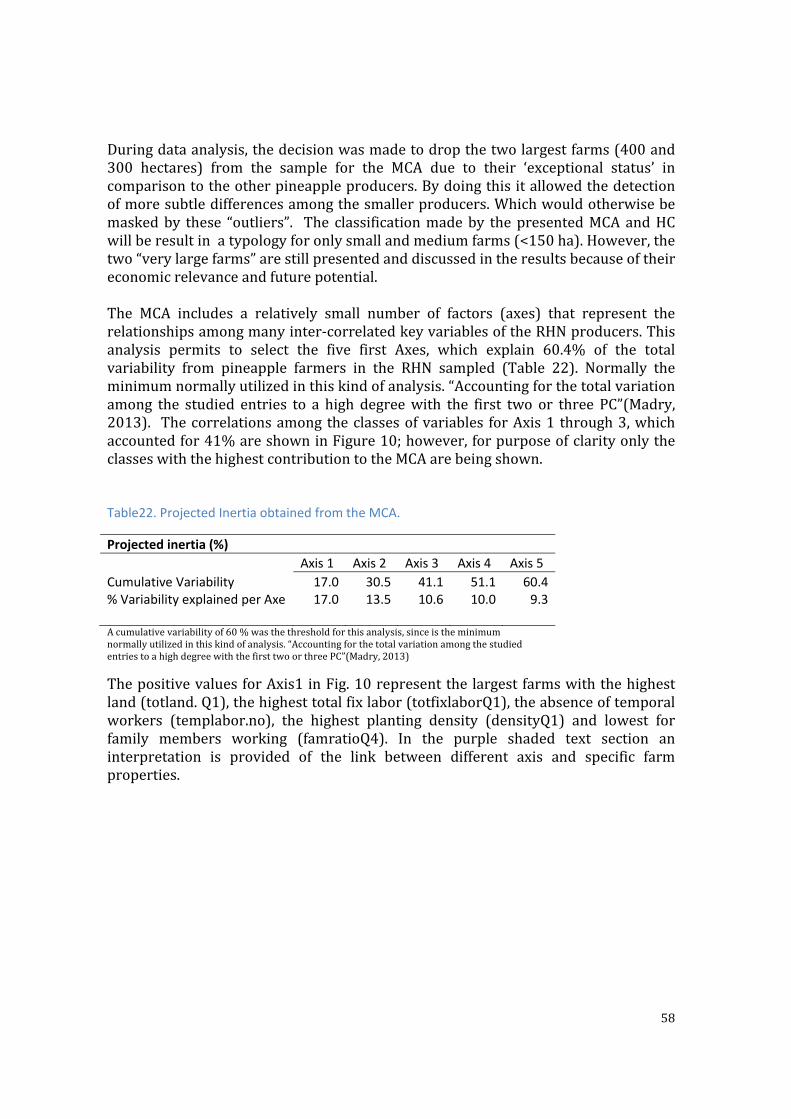
58
Duringdataanalysis,thedecisionwasmadetodropthetwolargestfarms(400and300 hectares) from the sample for the MCA due to their ‘exceptional status’ incomparisontotheotherpineappleproducers.Bydoingthisitallowedthedetectionofmoresubtledifferencesamongthesmallerproducers.Whichwouldotherwisebemaskedby these “outliers”. The classificationmadeby thepresentedMCAandHCwillberesultinatypologyforonlysmallandmediumfarms(<150ha).However,thetwo“verylargefarms”arestillpresentedanddiscussedintheresultsbecauseoftheireconomicrelevanceandfuturepotential.The MCA includes a relatively small number of factors (axes) that represent therelationshipsamongmanyinter‐correlatedkeyvariablesoftheRHNproducers.Thisanalysis permits to select the five first Axes, which explain 60.4% of the totalvariability from pineapple farmers in the RHN sampled (Table 22). Normally theminimumnormallyutilizedinthiskindofanalysis.“Accountingforthetotalvariationamong the studied entries to a high degreewith the first two or three PC”(Madry,2013). Thecorrelationsamongtheclassesofvariables forAxis1 through3,whichaccountedfor41%areshowninFigure10;however,forpurposeofclarityonlytheclasseswiththehighestcontributiontotheMCAarebeingshown.
Table22. Projected Inertia obtained from the MCA.
Projected inertia (%)
Axis 1 Axis 2 Axis 3 Axis 4 Axis 5
Cumulative Variability 17.0 30.5 41.1 51.1 60.4% Variability explained per Axe
17.0 13.5 10.6 10.0 9.3
Acumulativevariabilityof60%wasthethresholdforthisanalysis,sinceistheminimumnormallyutilizedinthiskindofanalysis.“AccountingforthetotalvariationamongthestudiedentriestoahighdegreewiththefirsttwoorthreePC”(Madry,2013)
ThepositivevaluesforAxis1inFig.10representthe largestfarmswiththehighestland(totland.Q1),thehighesttotalfixlabor(totfixlaborQ1),theabsenceoftemporalworkers (templabor.no), the highest planting density (densityQ1) and lowest forfamily members working (famratioQ4). In the purple shaded text section aninterpretation is provided of the link between different axis and specific farmproperties.
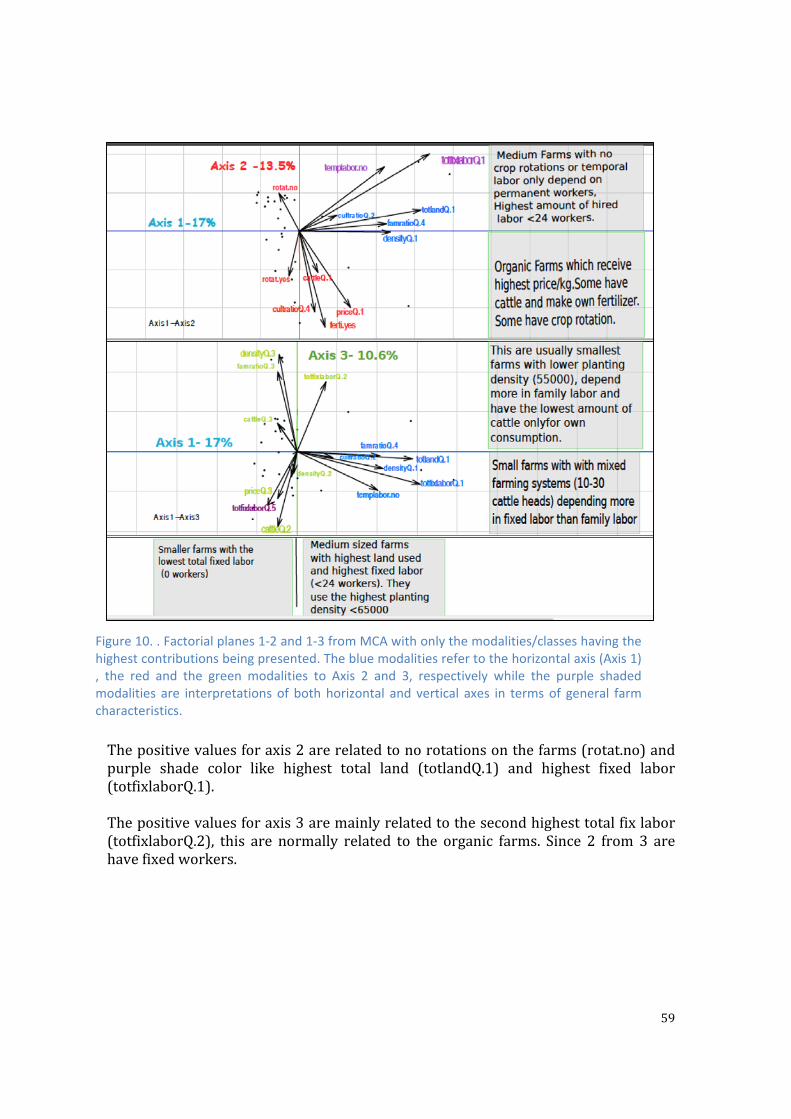
59
Thepositivevaluesforaxis2arerelatedtonorotationsonthefarms(rotat.no)andpurple shade color like highest total land (totlandQ.1) and highest fixed labor(totfixlaborQ.1).Thepositivevaluesforaxis3aremainlyrelatedtothesecondhighesttotalfixlabor(totfixlaborQ.2), this are normally related to the organic farms. Since 2 from 3 arehavefixedworkers.
Figure 10. . Factorial planes 1‐2 and 1‐3 from MCA with only the modalities/classes having thehighest contributions being presented. The blue modalities refer to the horizontal axis (Axis 1), the red and the green modalities to Axis 2 and 3, respectively while the purple shadedmodalities are interpretations of both horizontal and vertical axes in terms of general farmcharacteristics.

60
A factorialmapsgrouping for thedifferent farm typesacross thedifferentX‐axis ispresented in Fig. 11. This figures shows the farm types related to the variablespresentedinfactorialmapinfigure10.ThecharacteristicspresentedinFig.10relatedirectlytothegroupingabove.Mediumfarmersforexamplehavenotemporallaborandhavethehighestnumberoffixedworkers.
Figure 12. Cluster Dendrogram obtained from the Hierarchical Clustering showing a classificationof 28 pineapple farms selected for the analysis. Each number represents a farm from the RHN.Each color represents a different cluster or farm type. A 7th farm type was distinguished but isnot shown in this Dendrogram and it relates to the two very large farms (>250ha).
.
Figure 11. Representation of six types of pineapple farms from the MCA factorial planesdefined by the first three factors (Axis 1, Axis 2 and Axis 3).

61
ThedifferentfarmtypesarealsobeingdepictedFig.12usingaclusterDendrogramthatalsoshowsthenumberoffarmspercluster.DifferentcolorsrepresentdifferentclusterswithclusterareferringtoMediumfarms,BtoOrganicFarms,whileC,D,E,Fincludedifferenttypesofsmallfarms. Thesesmallfarmsweredifferingintermsofspecificmodalities.Amoredetaileddescriptionofeachfarmtype ifprovidedinthenextsection.
3.4 Detailed characterization of farm types in RHN region Based on theMCA analysis sixmain farm types of pineapplewere observed in thenorthernregionofCostaRica.Inthiscontext,thelargestproducerswerenotincludedin the analysis but theywere distinctly different from the other types. In the nextsectioneachofthesefarmtypesifbeingdescribedinmoredetailintermsofkeyfarmchacteristics.Small‐holderProducers‐TypesA,B,C,DSmallholderproducersarecharacterizedbynothaving fixed laborbut instead theyprimarily rely on family labor, especially sons while daughters normally carry outadministrative work and may also help with general logistics. These farms onlyemploy temporary workers for tasks labor demand tasks during labor peaksincluding planting or harvesting. Most small producers have loans with the bankssomeofthemcanmakethepaymentsontimewhilesomecarryunresolveddebts.Inthenextsectionspecificdifferentiatingcharacteristicsamongsmallproducerswillbediscussedinmoredetail.TypeB&CVerysmallfarmsTypeB(n=10)representsthegroupoffarmerswithsmallerareasreferredasmicroproducers. In this case there is no diversification of production activities and theentirefarmisusedformonocultureofpineapple.TypeC(n=4)correspondstomixedfarmingsystemswhichhavelivestockforhomeconsumption, this means they are less intense farms which practice rotationsincludingpasturesandpineapple.Theyarecharacterizedbyowning1‐20haofland.Theyrelyoncreditloansfromnationalbanks(mostlyBancoNacional).Thesearethemost fragileproducers,whichdonothaveenoughmoney to reinvest in their farm.Besides these producers are also burdened with previous unpaid debts. Thesefarmers show slight signs of modernization; they do not posses much machinery,whichmeanstheymustrentthismachinery.
62
TypeA&D‐SmallFarmsThis group of small holders shares some of the characteristics mentioned aboveincluding dependence on family labor and credits loans. They also use hiredtemporary workers for harvesting and planting tasks. Differences resulted in adistinctionbetweentypesBandDreferredtoassmallproducers.Bothtypesownorrentaround20‐70ha.TypeD(n=7)isbeingcharacterizedbyhavingdiverseactivitiesintheirfarm,besidespineapplegrowing.Someof themostcommonactivities in theareaappeared tobedairy farming (Costa Rican Cooperative called Dos Pinos). "Dairy farming pays thebillswhileplantingpineappleallowsustohaveextramoneyforotherinvestments",saidoneoftheproducers.Othercommonactivitiesweretoplantothercropslikerootand tuber crops such as cassava and yams. This allows these producers to haveenoughprofitfromtheirharvesttogroworinvestinmechanization(machinery)andprocessingpractices.Type A (n=2) differs from D in terms of it having no diversification and farmersallocatingalltheirlandtopineappleproduction.Thisgroupofproducershadamorestable income than the very small producers of the RHN,whichmay be related toeconomiesofscale.TypeE‐MediumProducersTypeE (n=2) is characterizedby farmsizes ranging from70‐250ha.Theywereallindividual farmers with having access to either national or foreign capital. Theyemployafarmmanager(eitheranengineerortheowner)andover24fixedworkers.Theycomplywithcertificationsunderthelabelsrequiredbycommercialandpackingcompanies, like Global Gap and Tesco. They are still dependent on buyers andcommercial companies to sell their pineapple. But normally they can negotiatecontractsandbetterpricesthansmallerproducersbecausetheyhavelargervolumestosupplyregularly.TypeF‐OrganicProducersTypeF(n=3)isthemostdiversegroupoffarms.Inthisgroupincludeddifferentsizeoperationsthatuseorganicproductionmethods.Themaincharacteristicofthistypeisthefactthattheyreceivethehighestpriceofallthepineappleproducersforfreshpineapple: 0.30‐0.47$/kg. They have rotationswith leguminous plants or fallow asobligedbyorganicEUregulation.Butwhenyoucomparetheorganicmedium‐smallorbigproducerswiththeconventionalproducerstheysharethesamecharacteristicsastheonespresentedabovefortheothergroups,exceptfortheprice.
63
TypeG‐LargeProducersTypeG(notincludedinFig.12)isthegroupofthelargestproducers(n=2)thatarecharacterized by having over 250 ha planted with pineapple. Often companiesmanagethefarmsandfarmsarecharacterizedbyhavinglargenumberoffixedlabor(>300), own machinery and a packing station. They are considered enterprisesownedeitherbyindividualsorcompanies.TheyexportdirectlytoimportersinUSAand Europe, with no intermediaries. They use the highest planting densitiescompared to small andmediumproducers (72000plants/ha). Largeproducers arenot affected as much by international prices as the small and medium producers.Moreover,theycanplaywithpricessincetheyhavemuchmorevolumethananyoftheotherproducersorcooperatives.Therewaslittleinterestinparticipatinginthisstudybythisgroup.Thereforethenumberofbigfarmsincludedwasverylow,eventhoughtheyareamongtheeasiesttocharacterizeandidentify.
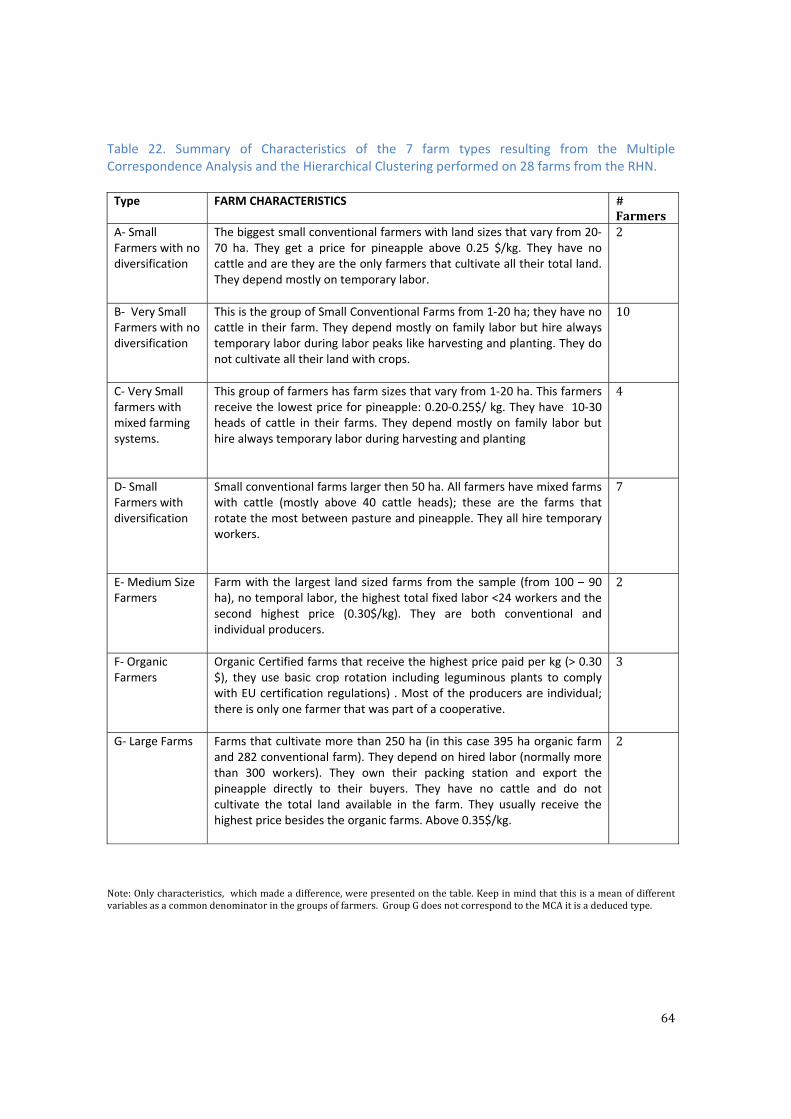
64
Table 22. Summary of Characteristics of the 7 farm types resulting from the Multiple Correspondence Analysis and the Hierarchical Clustering performed on 28 farms from the RHN.
Note:Onlycharacteristics, whichmadeadifference,werepresentedonthetable.Keepinmindthatthisisameanofdifferentvariablesasacommondenominatorinthegroupsoffarmers.GroupGdoesnotcorrespondtotheMCAitisadeducedtype.
Type FARM CHARACTERISTICS #Farmers
A‐ Small Farmers with no diversification
The biggest small conventional farmers with land sizes that vary from 20‐70 ha. They get a price for pineapple above 0.25 $/kg. They have no cattle and are they are the only farmers that cultivate all their total land. They depend mostly on temporary labor.
2
B‐ Very Small Farmers with no diversification
This is the group of Small Conventional Farms from 1‐20 ha; they have no cattle in their farm. They depend mostly on family labor but hire always temporary labor during labor peaks like harvesting and planting. They do not cultivate all their land with crops.
10
C‐ Very Small farmers with mixed farming systems.
This group of farmers has farm sizes that vary from 1‐20 ha. This farmers receive the lowest price for pineapple: 0.20‐0.25$/ kg. They have 10‐30 heads of cattle in their farms. They depend mostly on family labor but hire always temporary labor during harvesting and planting
4
D‐ Small Farmers with diversification
Small conventional farms larger then 50 ha. All farmers have mixed farms with cattle (mostly above 40 cattle heads); these are the farms that rotate the most between pasture and pineapple. They all hire temporary workers.
7
E‐ Medium Size Farmers
Farm with the largest land sized farms from the sample (from 100 – 90 ha), no temporal labor, the highest total fixed labor <24 workers and the second highest price (0.30$/kg). They are both conventional and individual producers.
2
F‐ Organic Farmers
Organic Certified farms that receive the highest price paid per kg (> 0.30 $), they use basic crop rotation including leguminous plants to comply with EU certification regulations) . Most of the producers are individual; there is only one farmer that was part of a cooperative.
3
G‐ Large Farms
Farms that cultivate more than 250 ha (in this case 395 ha organic farm and 282 conventional farm). They depend on hired labor (normally more than 300 workers). They own their packing station and export the pineapple directly to their buyers. They have no cattle and do not cultivate the total land available in the farm. They usually receive the highest price besides the organic farms. Above 0.35$/kg.
2

65
3.3 Sustainability Assessment of different farm operations
3.3.1 MESMIS Analysis There were three farms that provided more detailed information regarding their2013/14pineappleproductioncycle.Thefirstoperationswerelarge(>250ha)andare referred to as “Organic”and “Conventional” andbothwereownedby the samecompany.Thethirdfarmbeingasmallerfarmusingagroecologicalbasedtechniques.Thislastfarmmaybeconsideredtobesometypeofmodelfarmsinceitusesdesigntechniquesandmanagementpracticesthatappeartobemorealignedwithecologicalprinciples and sound agronomic practices. In the following analysis only the firstpineapple harvest was considered without taking into account the costs for thesecond harvest. The farms also provided information on soil analysis for differentplots, erosion/ha, production costs, yield/ha, social programs and input usewhichareoutlinedandspecifiedinTable24.Table 23. Sustainability Indicator Scores for three pineapple systems: Large Conventional (C) and Organic (O) Farm (both and an AF (Agro ecological Farm) in original units and as percentages (in parenthesis) of reference values (Table adapted from S. Lopez‐Ridaura et al.2002).
Attribute
Farms Indicator
Unit Organic System
Agroecological System
Conventional System
Optimum (100%)
Economic Yield Ton/ha 72 (80)
60 (66.7) 66 (73.3)
90
Selling Price $/kg 0.43 (64.2)
0.67(100) 0.36 (53.7) 0.67
Production Costs
$/ha
25,329 (100)
N.A 16204 (80.2)
0
Environmental Soil Loss
Ton/ha/yr
1 (0)
1 (0)
70 (0)
0
Soil Quality Organic Matter applied
Ton/ha/cycle
40 (100)
N.A 0 (0)
40
pH
Numerical 4.4 (88)
N.A 4.1 (82)
5
Stability Crop Rotation
Numerical Score
2 (40)
4 (70)
1(20)
5
External Dependence
Numerical Score
3.5 (50) 4.5 (90) 2 (40) 5 5
5 Social Profit Share-
by Workers Numerical Score
5(100) 3.5 (70) 5(100)
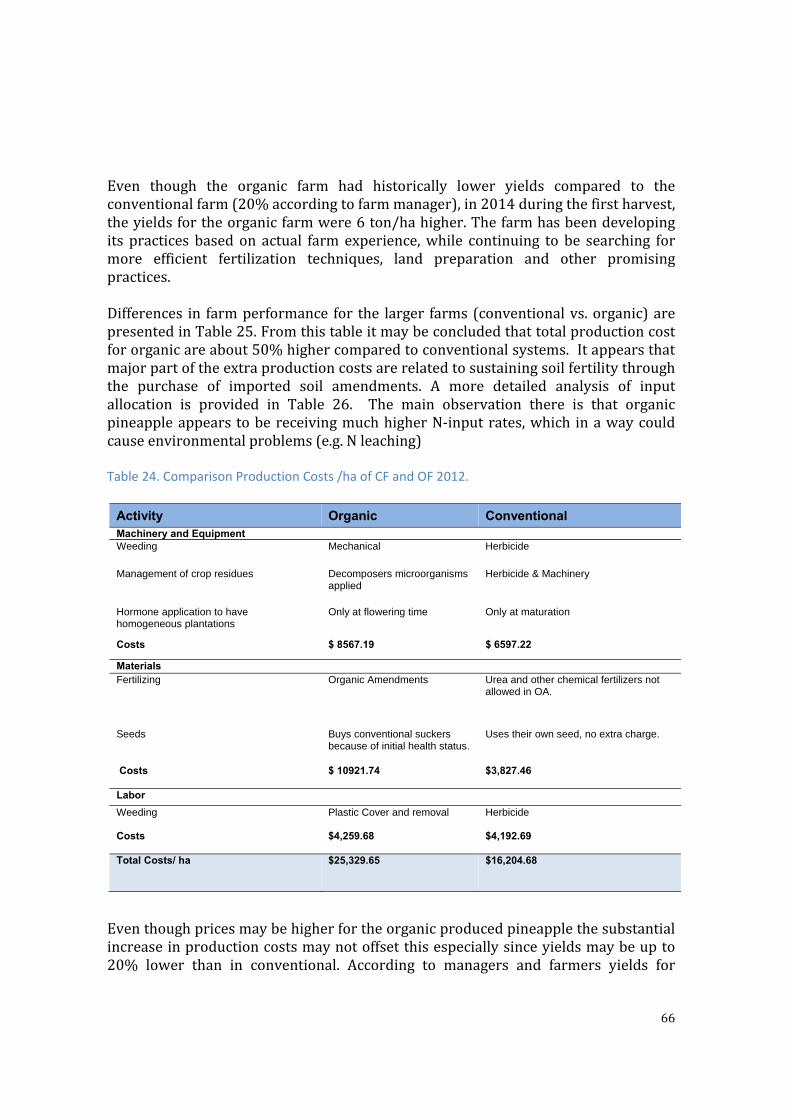
66
Even though the organic farm had historically lower yields compared to theconventionalfarm(20%accordingtofarmmanager),in2014duringthefirstharvest,theyieldsfortheorganicfarmwere6ton/hahigher.Thefarmhasbeendevelopingits practices based on actual farm experience,while continuing to be searching formore efficient fertilization techniques, land preparation and other promisingpractices.Differences in farmperformance for the larger farms (conventionalvs.organic)arepresentedinTable25.Fromthistableitmaybeconcludedthattotalproductioncostfororganicareabout50%highercomparedtoconventionalsystems.Itappearsthatmajorpartoftheextraproductioncostsarerelatedtosustainingsoilfertilitythroughthe purchase of imported soil amendments. A more detailed analysis of inputallocation is provided in Table 26. The main observation there is that organicpineappleappears tobereceivingmuchhigherN‐inputrates,which inawaycouldcauseenvironmentalproblems(e.g.Nleaching)Table 24. Comparison Production Costs /ha of CF and OF 2012.
Eventhoughpricesmaybehigherfortheorganicproducedpineapplethesubstantialincreaseinproductioncostsmaynotoffsetthisespeciallysinceyieldsmaybeupto20% lower than in conventional. According to managers and farmers yields for
Activity Organic Conventional Machinery and Equipment Weeding
Mechanical Herbicide
Management of crop residues Decomposers microorganisms applied
Herbicide & Machinery
Hormone application to have homogeneous plantations
Only at flowering time Only at maturation
Costs $ 8567.19 $ 6597.22
Materials Fertilizing Organic Amendments Urea and other chemical fertilizers not
allowed in OA.
Seeds Buys conventional suckers because of initial health status.
Uses their own seed, no extra charge.
Costs $ 10921.74 $3,827.46
Labor
Weeding Costs
Plastic Cover and removal $4,259.68
Herbicide $4,192.69
Total Costs/ ha $25,329.65
$16,204.68
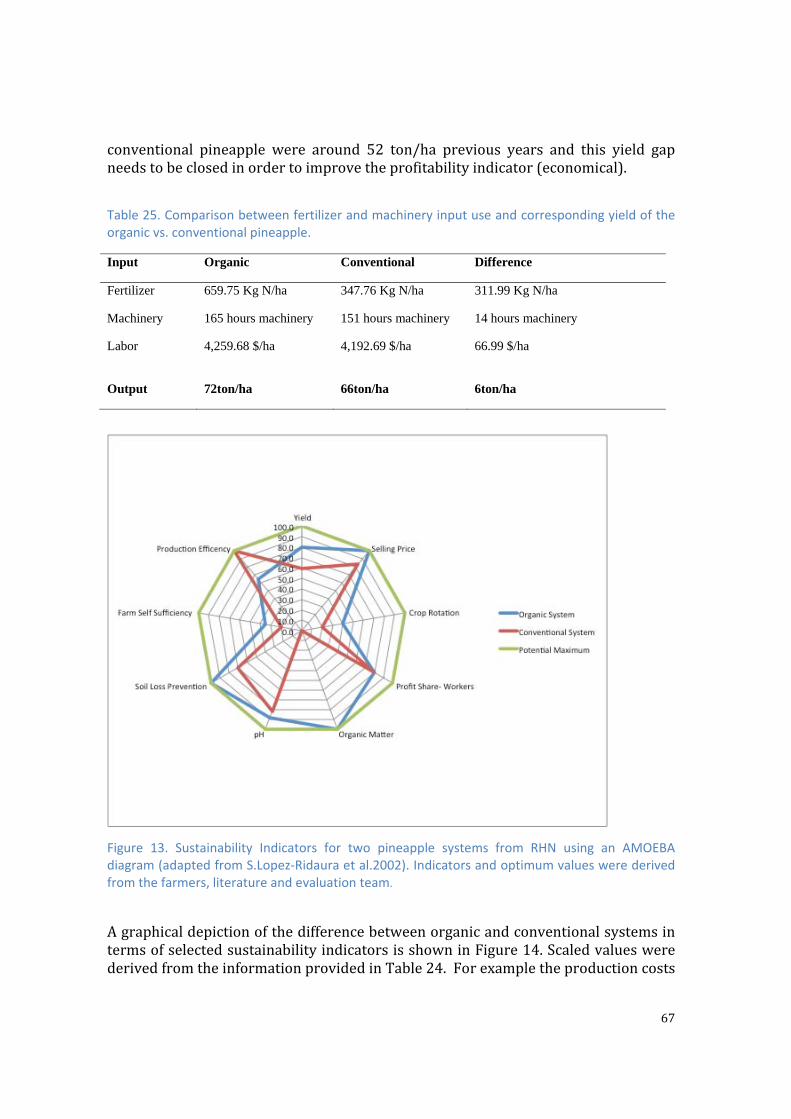
67
conventional pineapple were around 52 ton/ha previous years and this yield gapneedstobeclosedinordertoimprovetheprofitabilityindicator(economical). Table 25. Comparison between fertilizer and machinery input use and corresponding yield of the organic vs. conventional pineapple.
Input Organic Conventional Difference
Fertilizer 659.75 Kg N/ha 347.76 Kg N/ha 311.99 Kg N/ha
Machinery 165 hours machinery 151 hours machinery 14 hours machinery
Labor 4,259.68 $/ha
4,192.69 $/ha
66.99 $/ha
Output 72ton/ha 66ton/ha 6ton/ha
.
Figure 13. Sustainability Indicators for two pineapple systems from RHN using an AMOEBA diagram (adapted from S.Lopez‐Ridaura et al.2002). Indicators and optimum values were derived from the farmers, literature and evaluation team.
AgraphicaldepictionofthedifferencebetweenorganicandconventionalsystemsintermsofselectedsustainabilityindicatorsisshowninFigure14.ScaledvalueswerederivedfromtheinformationprovidedinTable24.Forexampletheproductioncosts
68
of the farmswereusedtocalculate the%ofproductioncosts.By taking the lowestproduction cost (CF) and dividing it for the farms (Organic vs Conventional)productioncosts.Inmostofthecasesthefarmthatscoredhigherforanindicator,forexampleOMaggregated(OFaggregates40ton/ha)thiswasconsideredtheoptimumforallfarms.Based on Figure 14 t appears that the organic system has a higher sustainabilityperformance formost indicators.The indicator inwhich theOF isscoringpoorly isproductioncosts(costs/ha).Eventhoughtheyareexceedingtheproductivityperhaof theCFthecostsarestillrelativelyhightherebyreducingprofitseventhoughthatconventionalproductsgeneratelessperkg(seeTable19).Thereareseveralaspectsin which large farms like the one evaluated here can still improve (crop rotation,external dependence,productivity, amongother variables). In general the aim is tohavethe lowestproductioncost.AsshowninTable16,theproductioncostsperhafor largeorganic farms ismuchhigher thanforconventional farms. In2013/14thedifferencewas $ 9122. Based on Table 26 this is mainly attributed to fertilizationmaterials,planthealth(buyingofsuckers)and theapplicationof inputs inorder tosupport decomposition of the plant residue. Even though the conventional systemtypically requiresmore inputs (especially agrochemicals) compared to the OF, thecostassociatedwithapprovedorganicinputs(suchasbloodmealforfertilization)ismuch higher. However, use of waste products of the bio‐industry, as a soilamendmentissomewhatquestionable,especiallyattheexcessivelyhighapplicationratesthatarebeingused.Developmentofmoresoundsorganicfertilizationschemesbased on sound crop rotations and plant‐based organic amendments includingcompoststhusmaybearelevantresearchinquiryfororganicproducers.In terms of soil degradation indicators (ecological) the OF performs much betterbecause they use plastic mulch covers through all their fields. This is a standardpracticeimplementedbymostorganicfarmers.Eventhoughitincreasesproductioncosts slightly, it is the only effective technique tomanageweeds so far. Ecologicalindicators were complicated to gather, not much information is yet collectedconcerningthistopic.Erosionisaclearindicatorinsoilquality,acleardifferenceof69tons/ha/yrhasbeenfoundforthesefarms.Ofcoursethisdatawilldependonthearea, topography, soil and climate of each farm (Gauggel, DOLE expert, personnelcommunication). Besides the bloodmeal, the farm also applies 40 ton/ha/cycle ofcompost, which provides a substantial amount of organic matter to crop residue.Even though the organic system performed in many cases, the lines are at timesrather close together, which means there is still room for improvement. Forindicatorslikeexternaldependenceandcroprotation(stability),theOFhasahigherscorewhencomparedtotheCF.However,somethingtoemphasizeisthefactthattheOFshowsahighdependenceonexternalinputs.AsshowninTable26theOFutilizesdoubletheamountofN/ha(311.99kgN/ha)thantheconventionalfarm.Thismeansthe OF is highly dependent of external inputs such as the presented organicamendment.Thedifferenceinyieldbetweenthefarmsisonly6ton/ha,whichdoesnot justify the excessive use of organic amendments which in turn may cause
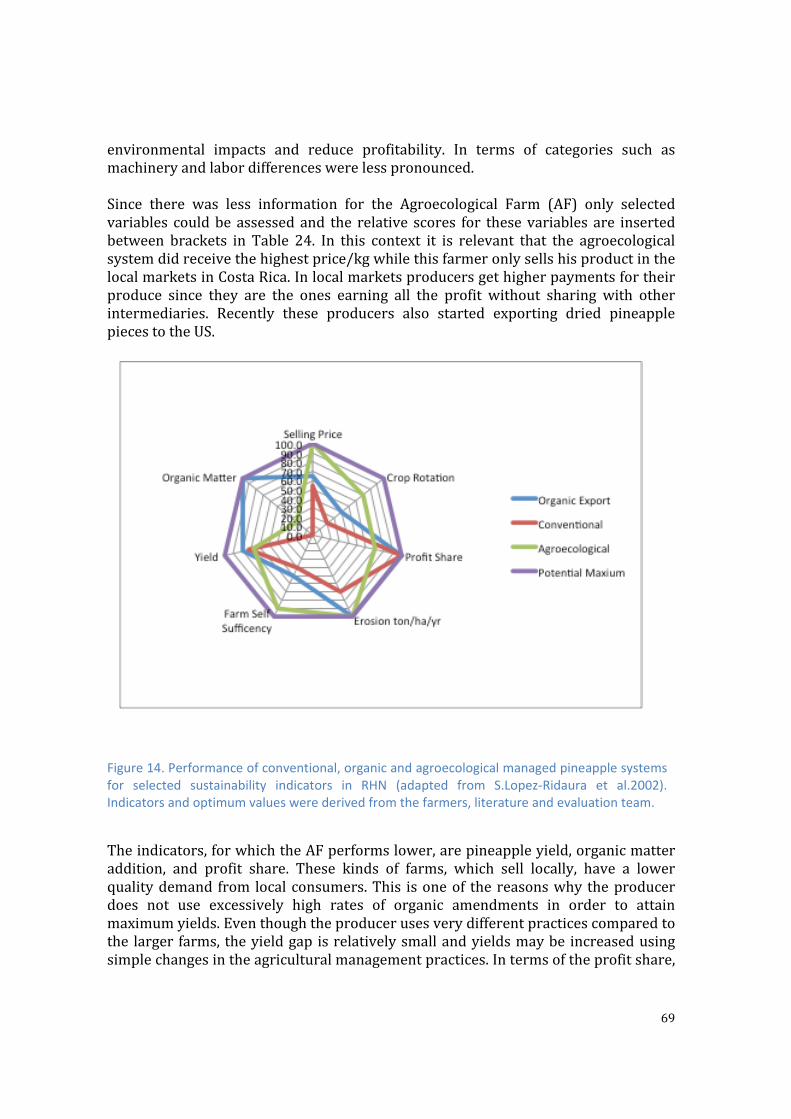
69
environmental impacts and reduce profitability. In terms of categories such asmachineryandlabordifferenceswerelesspronounced.Since there was less information for the Agroecological Farm (AF) only selectedvariables couldbe assessed and the relative scores for these variables are insertedbetween brackets in Table 24. In this context it is relevant that the agroecologicalsystemdidreceivethehighestprice/kgwhilethisfarmeronlysellshisproductinthelocalmarketsinCostaRica.Inlocalmarketsproducersgethigherpaymentsfortheirproduce since they are the ones earning all the profit without sharing with otherintermediaries. Recently these producers also started exporting dried pineapplepiecestotheUS.
Theindicators,forwhichtheAFperformslower,arepineappleyield,organicmatteraddition, and profit share. These kinds of farms, which sell locally, have a lowerqualitydemand from local consumers.This isoneof thereasonswhy theproducerdoes not use excessively high rates of organic amendments in order to attainmaximumyields.Eventhoughtheproducerusesverydifferentpracticescomparedtothe larger farms,theyieldgap isrelativelysmallandyieldsmaybe increasedusingsimplechangesintheagriculturalmanagementpractices.Intermsoftheprofitshare,
Figure 14. Performance of conventional, organic and agroecological managed pineapple systemsfor selected sustainability indicators in RHN (adapted from S.Lopez‐Ridaura et al.2002).Indicators and optimum values were derived from the farmers, literature and evaluation team.
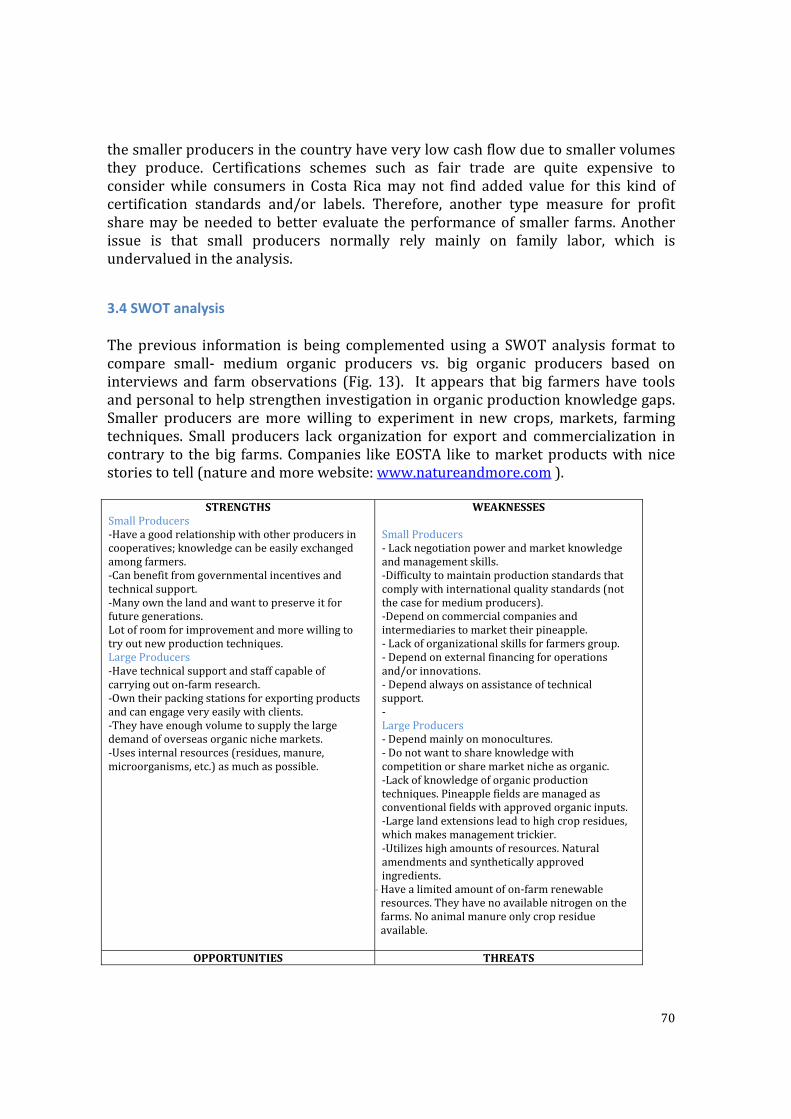
70
thesmallerproducersinthecountryhaveverylowcashflowduetosmallervolumesthey produce. Certifications schemes such as fair trade are quite expensive toconsiderwhile consumers in Costa Ricamay not find added value for this kind ofcertification standards and/or labels. Therefore, another type measure for profitsharemaybeneeded tobetterevaluate theperformanceof smaller farms.Anotherissue is that small producers normally rely mainly on family labor, which isundervaluedintheanalysis.
3.4 SWOT analysis The previous information is being complemented using a SWOT analysis format tocompare small‐ medium organic producers vs. big organic producers based oninterviews and farmobservations (Fig. 13). It appears that big farmers have toolsandpersonaltohelpstrengtheninvestigationinorganicproductionknowledgegaps.Smaller producers aremorewilling to experiment in new crops, markets, farmingtechniques. Small producers lack organization for export and commercialization incontrary to thebig farms.Companies likeEOSTA like tomarketproductswithnicestoriestotell(natureandmorewebsite:www.natureandmore.com).
STRENGTHSSmallProducers‐Haveagoodrelationshipwithotherproducersincooperatives;knowledgecanbeeasilyexchangedamongfarmers.‐Canbenefitfromgovernmentalincentivesandtechnicalsupport.‐Manyownthelandandwanttopreserveitforfuturegenerations.Lotofroomforimprovementandmorewillingtotryoutnewproductiontechniques.LargeProducers‐Havetechnicalsupportandstaffcapableofcarryingouton‐farmresearch.‐Owntheirpackingstationsforexportingproductsandcanengageveryeasilywithclients.‐Theyhaveenoughvolumetosupplythelargedemandofoverseasorganicnichemarkets.‐Usesinternalresources(residues,manure,microorganisms,etc.)asmuchaspossible.
WEAKNESSESSmallProducers‐Lacknegotiationpowerandmarketknowledgeandmanagementskills.‐Difficultytomaintainproductionstandardsthatcomplywithinternationalqualitystandards(notthecaseformediumproducers).‐Dependoncommercialcompaniesandintermediariestomarkettheirpineapple.‐Lackoforganizationalskillsforfarmersgroup.‐Dependonexternalfinancingforoperationsand/orinnovations.‐Dependalwaysonassistanceoftechnicalsupport.‐LargeProducers‐Dependmainlyonmonocultures.‐Donotwanttoshareknowledgewithcompetitionorsharemarketnicheasorganic.‐Lackofknowledgeoforganicproductiontechniques.Pineapplefieldsaremanagedasconventionalfieldswithapprovedorganicinputs.‐Largelandextensionsleadtohighcropresidues,whichmakesmanagementtrickier.‐Utilizeshighamountsofresources.Naturalamendmentsandsyntheticallyapprovedingredients.‐ Havealimitedamountofon‐farmrenewableresources.Theyhavenoavailablenitrogenonthefarms.Noanimalmanureonlycropresidueavailable.
OPPORTUNITIES THREATS
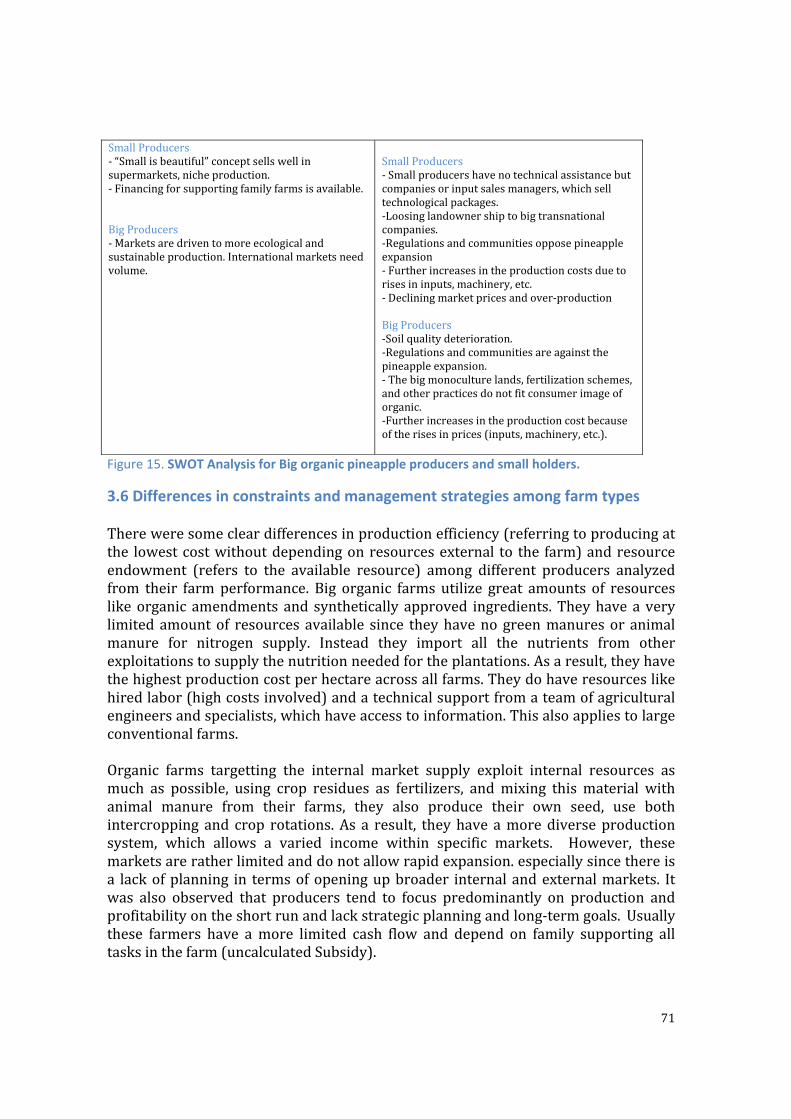
71
SmallProducers‐“Smallisbeautiful”conceptsellswellinsupermarkets,nicheproduction.‐Financingforsupportingfamilyfarmsisavailable.BigProducers‐Marketsaredriventomoreecologicalandsustainableproduction.Internationalmarketsneedvolume.
SmallProducers‐Smallproducershavenotechnicalassistancebutcompaniesorinputsalesmanagers,whichselltechnologicalpackages.‐Loosinglandownershiptobigtransnationalcompanies.‐Regulationsandcommunitiesopposepineappleexpansion‐Furtherincreasesintheproductioncostsduetorisesininputs,machinery,etc.‐Decliningmarketpricesandover‐productionBigProducers‐Soilqualitydeterioration.‐Regulationsandcommunitiesareagainstthepineappleexpansion.‐Thebigmonoculturelands,fertilizationschemes,andotherpracticesdonotfitconsumerimageoforganic.‐Furtherincreasesintheproductioncostbecauseoftherisesinprices(inputs,machinery,etc.).
Figure 15. SWOT Analysis for Big organic pineapple producers and small holders.
3.6 Differences in constraints and management strategies among farm types
Thereweresomecleardifferencesinproductionefficiency(referringtoproducingatthe lowestcostwithoutdependingonresourcesexternal to the farm)andresourceendowment (refers to the available resource) among different producers analyzedfrom their farmperformance. Big organic farms utilize great amounts of resourceslikeorganic amendments and synthetically approved ingredients.Theyhavea verylimitedamountof resources available since theyhavenogreenmanuresor animalmanure for nitrogen supply. Instead they import all the nutrients from otherexploitationstosupplythenutritionneededfortheplantations.Asaresult,theyhavethehighestproductioncostperhectareacrossallfarms.Theydohaveresourceslikehiredlabor(highcostsinvolved)andatechnicalsupportfromateamofagriculturalengineersandspecialists,whichhaveaccesstoinformation.Thisalsoappliestolargeconventionalfarms.
Organic farms targetting the internal market supply exploit internal resources asmuch as possible, using crop residues as fertilizers, andmixing thismaterial withanimal manure from their farms, they also produce their own seed, use bothintercropping and crop rotations.As a result, theyhave amorediverseproductionsystem, which allows a varied income within specific markets. However, thesemarketsareratherlimitedanddonotallowrapidexpansion.especiallysincethereisa lackofplanning in termsofopeningupbroader internalandexternalmarkets. Itwas also observed that producers tend to focus predominantly on production andprofitabilityontheshortrunandlackstrategicplanningandlong‐termgoals.Usuallythese farmers have amore limited cash flow and depend on family supporting alltasksinthefarm(uncalculatedSubsidy).
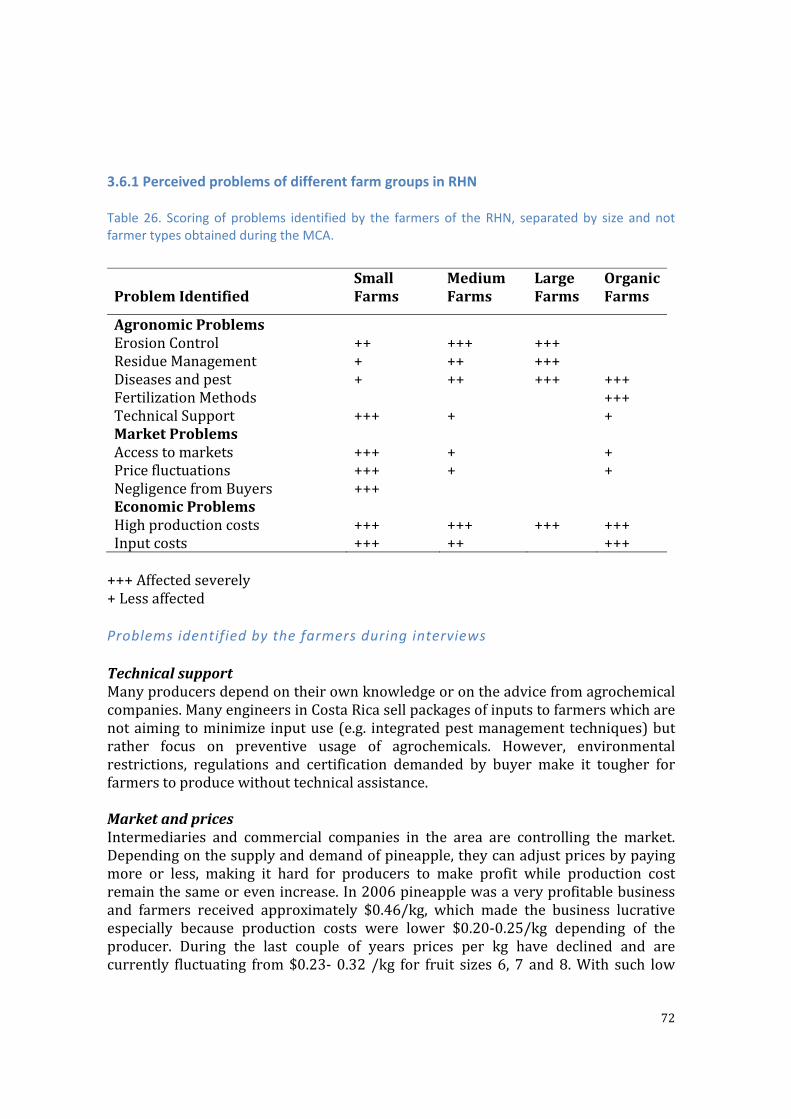
72
3.6.1 Perceived problems of different farm groups in RHN Table 26. Scoring of problems identified by the farmers of the RHN, separated by size and not farmer types obtained during the MCA.
+++Affectedseverely+Lessaffected Problems identified by the farmers during interviews TechnicalsupportManyproducersdependontheirownknowledgeorontheadvicefromagrochemicalcompanies.ManyengineersinCostaRicasellpackagesofinputstofarmerswhicharenotaimingtominimize inputuse(e.g. integratedpestmanagementtechniques)butrather focus on preventive usage of agrochemicals. However, environmentalrestrictions, regulations and certification demanded by buyer make it tougher forfarmerstoproducewithouttechnicalassistance.MarketandpricesIntermediaries and commercial companies in the area are controlling the market.Dependingonthesupplyanddemandofpineapple,theycanadjustpricesbypayingmore or less, making it hard for producers to make profit while production costremainthesameorevenincrease.In2006pineapplewasaveryprofitablebusinessand farmers received approximately $0.46/kg, which made the business lucrativeespecially because production costs were lower $0.20‐0.25/kg depending of theproducer. During the last couple of years prices per kg have declined and arecurrently fluctuating from$0.23‐0.32 /kg for fruit sizes 6, 7 and8.With such low
ProblemIdentified
SmallFarms
MediumFarms
LargeFarms
OrganicFarms
AgronomicProblems ErosionControl ++ +++ +++ ResidueManagement + ++ +++ Diseasesandpest + ++ +++ +++FertilizationMethodsTechnicalSupport
+++
+
++++
MarketProblems Accesstomarkets +++ + +Pricefluctuations +++ + +NegligencefromBuyers +++ EconomicProblems HighproductioncostsInputcosts
++++++
+++++
+++ ++++++
73
prices the profit margin is slim or negative, especially when the cost of externalinputs and labor keeps increasing. When demand is high or low quality fruit isrejectedatthepackingstations,thisisaffectingthosewhodon’thaveenoughvolumeto negotiate (small producers) the most. Since these producers tend to face morechallengeswhilemaintainingfruitqualityandalsohavelimitedfinancialbuffers.DifficultytocollectpaymentsMany of the buyers and commercial companies fail to pay the producers for theirpineapple.Manyproducersareowedthousandsofdollarsbecausethenegligenceofcompanies to pay the money in the absence of legal contracts. It is unclear whyintermediaries are not paying the money to the producers, some intermediariesclaimed that the buyers were not paying the product when it arrived at its finaldestinationorthecontainerwassendbackbecausequalityissues.(Source:producersandintermediaries)FinancingMost of the growers interviewed stated that their operations were fundedmainlyfromtheirownmeans.Duetopricefluctuationsandcashflowproblemsarising,theyhad no option but to request private loans. Having credits unpaid by Proagroinobligedtheproducerstoendtherelationshipandtakecreditswithbankstopaytheirinitialdebts.Thisdoesnotallowthemtohavethefinancialpossibilitytocontinueinthebusinessofplantingpineapple.BuyersCredibilityEspeciallysmallerandmedium‐sizedproducersareloosingfaithinthebuyers.Eitherwaydueto lackofdirectaccess toexternalmarkets theyhavenochoicebuttoselltheirpineappletowhomeverbuysitlocally.LowercostsforfertilizationOrganicproducers,mostoftheproblems(Annex2)revolvearoundfertilizationissuesanddiseasemanagement,mainlybecauseofrestraintsfromorganicregulations.ErosioninvestigationIn Costa Rica on going investigation target to reducewater erosion in cultivars ofpineappleintheregion.Producersandstakeholdersareconcernedbytheenormousquantityofsoilerosionthatgoesonintheirfarms.Muchinvestigationisdoneinlargefarms like PINDECO and DOLE. Reduction of erosion has been effective, but notenoughtopreventthatthousandsoftonofsoilsarelosteachyear.Theactualsystemsare variable but they are focused on being cheap, with little technicality, aimed atimprovingdrainageusingbasicmitigations.Ingeneraltheydonotendtofullycontrolerosion but just comply with environmental requirements and infrastructuremaintenance(PresentationChiquita,date?).

74
Flymanagement(Stomoxyscalcitrans)andcropresiduemanagementPineapplefarmershavebeenblamedfortheproliferationofthe“moscadelestablo”(stablefly)throughouttheregion.Thelargeamountofresiduesleftinthefieldafterharvest has attracted this fly to reproduce in the residue. This is affecting cattlefarmersdirectlyintheregion;becauseoftheattacksoftheflythecattlestopseating,looseweightandhavelowerproductivity(EARTH,incompletereference).ManagementofstubbletomanagefusariumThe farmers expressed concerns about fusarium oxysporum a soil‐borne disease,which is increasing during the past years. For organic farmers it is even morecomplicatedbecausetheydependonbiologicalinputs,whicharenoteffectiveasagrochemicals.Butevenforconventionalfarmersalthoughtheuseoffungicidestocontrolthisdisease is increasing, it isstillpresent inthe fields.Generatinginformationandtechnologiesforbettermanagingthisfungusbystudyingitslifecyclethusisneeded.
3.6.2 Farm practices, markets, and innovations
Whencomparingdifferentfarmsizesan,marketorientationsandinnovationwithinthe pineapple value chain we can see a clear difference between farm operations.Duringtheinterviewstwofarmersthathadratherinterestingfarmoperations,thesefarms were thus chosen for further analysis to see if there were differences inpractices as related to their marketing strategies. Organic farmers have a specificniche inwhichtheysell theirpineappleeitherto localorexternalmarkets.Whenitcomes to market orientations pronounced differences were observed betweenproductionsforlocalvs.internationalmarkets.
Localmarkets
Whenproducing for localmarkets, farmers are clearlymore interested inhaving avarietyofcropstosellintheorganicfairs.
1.) Carlos Viquez (Cash Crops): Cassava, papaya, arugula, lemon grass, turmeric,ginger,andbasil,amongmanymore.Carloshasalmost100cropsplantedina3hagarden.Hehasnotbeenabletoexpandbecausetheinternalmarketislimitedintermsofthedemandforcertifiedorganicproducts.Hisfarmisaround120hawith cattle for meat production. This farmer has plenty of area to expandprovidedhewouldhaveaccesstoothermarkets.(Figure16and17).
Forlocalmarketsthefarmersareclearlymoreinterestedinhavingavarietyofcropstosellintheorganicfairs.

75
2.) Carlos Viquez (Cash Crops): Cassava, papaya, arugula, lemon grass, turmeric,ginger,andbasil,amongmanymore.Carloshasalmost100varietiesplantedina3hagarden.Hehasnotbeenabletogrowtohigherdensitiesbecausehehasnointernalmarketwithsuchhighdemandofcertifiedorganicproducts.Hisfarmisaround120hawithcattleheads formeat;hehasplentyofareatoexpandifhegetsaninterestingproposaltowardothermarkets.(Figure16and17).
AlbertoChinchilla:pineapple(maincrop),turmeric,melon,banana,passionfruit,andpeanuts,amongothercrops.Albertohasmorelandallocatedtohiscrops;hehaslessintercroppingbutdependsmoreonrotationschemes.Hehastakenoverthemarketofpineappleintheorganicfairs.Healsohasbecomeanentrepreneurasherecentlystarted to engage in processing and is producing dehydrated pineapple and othercrops(Figure19and20).Bydiversificationincropsandadded‐value(preservation)processheeven foundamarketoutlet for theorganicpeelofpineapple formakingteas.
Figure 16. Fruit Nursery Field: lemons, star fruits, bananas,and legumes hedgerows.
Figure 19. Dehydration Plant for processing differentproducts.
Figure 17. Intercropping with basil, lemon grass, turmeric and papaya plants. Irrigation for cash crops (greens). Mulch with lemon grass.
Figure 18. Dehydrated Pineapple and Plantain fromAlberto Chinchillas farm.

76
Bothproducershadadifferentapproachtowardsagriculturalpractices.Bothofthemuse techniques like: compostingwith residuesandanimalmanure, liquid fertilizers(Fig.21,22and23),mulch(Fig.17), seedsaving,croprotation(Figure16and17),intercropping, among many more. In the ecological aspect organic small holdersoriented to local markets tend to use more sustainable practices. They are lessdependent on external inputs and agrochemical companies since they try tomakeoptimaluseofinternal(on‐farm)resources.
They also obtain a higher price per kilogram of fresh produce due to the directmarketing approach they use as they sell their produce in the localmarkets (fairs,processing, restaurants). However, they sell smaller quantities of products butproducershaveenoughincometosustaintheirfarmsandmaintaintheirlivelihoods.Even though, they would be interested in expanding their production scale toincreasetheirincome.
Figure 21. Compost pile from cow manure and crop residues.
Figure 20. Lombricompost and other liquid fertilizers, MM,(mountain microorganisms) among other mixtures.
Figure 22. Bioferment production in 12 ha organic farm of LuisFernando from Cooperative Coopepiagua
77
Sincetheyhavevariousproductsavailableatdifferenttimesoftheyearprofitabilityindicatorswerehardtogather.Theseproducersdonothaveasteadyincome,sincethey have complex crop systems rather than amonoculture. This is an aspect thatneeds to be addressedwhen studying and supporting small holders producing forlocalmarketssincetheydonothaveanorganizedsystemforrecordkeeping.
In the caseof the largeorganic farmalthough theyhavea lowerecological score itperformedwellintermsofsocialaspects.Thisbecausetheyareinaspecialprogramwith special fair tradeprogram, inwhich theyhave constructedanafter school forworkers and their familiesandpeople from theadjacent communities.This farm isthe only pineapple producer, which has this type of certification, which makes itrather different from other farms. Small organic farmers hire on demand, so thisregularlymeanstheworkershavenobenefits.Somefarmershavetheworkerslivingattheirhouse,asisthecaseofCarlosViquezinwhichhisworkersliveandeatinthefarm.
78
4.Discussion ThisthesisreportwastheinitialstageforaprojectthatEOSTAwantstoimplementto address some of the sustainability issues presented above. Research is beingrequired to guide farmers in Costa Rica during the exploration process for moresustainableproduction systems.However, inorder todevelop theproject an initialdiagnosisneededtobedevelopedwiththehelpoflocalstakeholders.Consequentlyasocio‐economicanalysisof the farmer’sproblems,resourceendowment,productiontechniques, production capacity, and identificationof farmers interested to activelytakepartinpilotstudiesneededtobeidentifiedfirst(Dogliottietal,2013).Forthisitwas important to map prevailing farming practices and organizational schemes,whichlateronmaybeimplementedandadoptedbydifferentfarmersgroups(small,mediumandlarge).Farmingsystemsdiversityinthecontextofthisthesisrevolvesaroundthreefactors:resource endowment, production efficiency and external/ internal forces such asmarketorientation,policiesandstakeholders.Themainfocusofthisresearchwastounderstand the relationship between the farming types and farm performance(sustainability, constraints and resource use). The uses of typologies support theunderstanding of different farming systems. It can facilitate identifying keydifferences in farm characteristics among farmers groups. They contribute todeveloping suitable strategies for agricultural planning at different levels likepolicymaking, individual farm strategies, or organizational schemes for producers(Lopez,2008).Oneof themajorbreachesof the studywas the choiceof the farmsused for the indepth analyzes of their performance. These were chosen based on findings fromprevious typologies (small,mediumandbig identifiedbyMAG2007). Later itwasfound that the actual farm types were more diverse than expected and the farmschosen formoredetailed follow‐up studies didnot represent all the different farmtype. Besides this the time frameandobstacles encountered (missingdata, lackofdetailed technical informationby the smaller farmers included in the surveys, etc.)alongthewaywhichmadeithardtocollectalltheinformationinatimelyfashion.Existing characterizations of pineapple growers were reviewed as part of theliterature review. The typology generated by Faure and Samper (2004) separatesfarmer typesofRHNregionaccording to the strategies implemented (Diverse farmsystem,cattlefarms,export,non‐export,etc.).Byfarmdiversityhereferstofarmers,which diversify by growing multiple crops. This study did not focus on pineapplegrowersspecifically,eventhoughit includedthem,butitmainlyfocusedatregionalscale on all producers. The present study aims to find characteristics of pineapplegrowersatregionalscaleinordertoidentifyadoptersofalternativefarmingsystems
79
in the region. The term ‘alternative’ refers to being different from present‐dayprevailingconventionalpractices(Daskalopoulou,2002).Inagreementwithaprior studybyEARTHUniversity (consultancybyKellonet al.2011) in Costa Rica the current study confirmed the existence of 5 farms types:micro, small, medium, large and transnational scales. The current research projectgenerated more detailed information regarding the specific characteristics ofpineapple farmers in the RHN. Themost vital information came from the fact thatthere are still mixed farming systems among pineapple growers. None of the pasttypologiesorcharacterizationsofproducers in the literature(Kellon, etal.2011orMag,2007)madereferencetothis.Eventhoughthepresenceofmorecomplexfarmswith multiple farm activities is identified, it is still unknown how farmers areallocatingandmanagingmakinguseofthedifferentresourcesavailablelike:manure,residues, rotations, etc. So despite the current study there still remains a clearknowledge gap that should be explored further in order to truly understand thedifferences between this different types of producers. This is essential informationfor assessing nutrient balances and differences in input use and resource useefficienciesacrossthediversityoffarms.Someofthefarmerswithnitrogen(manure)availableintheirfarmwereusingitforfertilizationintheirfieldsasslurry,whichisacommonpractice in dairyoperations. Farmerswithmixed farms are implementingcroprotationbetweenpastures‐pineapplesandsometimesothercrops(cassavaandother tubers). These practices couldmake significant changes in SOM and nutrientbalances (N, P, K and other nutrients) among other important soil qualitymeasurements.OtherstudieslikeTittonelletal(2013)measuredthediversityinsoilfertilityofdifferentfarmtypes;thiscouldbeanimportantsecondsteptoadditiontofarmertypologiesintheRHN.Different studies around the world present diverse farming systems. CertaincharacteristicsfoundinthestudyinCostaRica,canbecomparedtootherstudiesinLatinAmerica.ForexampleinthestudyinUruguaybyRighietal.2011,segregatedfarmsintomixedfarmingsystems(animalhusbandryandcrops)orcroppingsystems(specialized). Some other characteristics included the level of modernization,whethertheyusemachineryornotandlaboravailability:hiredorfamilylabor.InthecaseofRHNthefarmtypologyanalysisrevealedsimilarresultswiththeexistenceof7farmtypesinthenorthernregionofCostaRica.Theseincludesmall(macro/micromixed farming systems and micro/macro monoculture systems), medium, big andorganicfarms. Whileintermsofmodernizationtherewerepronounceddifferencesbetweenfarmersfocusingininternalorexternalmarketsandalsodependingontheirfarmsize.Farm typologies have been an important tool to explain the diversification amongfarmers. Sustainability is a relative new concept, which many scholars have beentryingtoincorporateandlinktofarmtypologies(Pacinietal2014,Blazyetal2009,).Itwasattemptedtobeabletodoasustainabilityassessmentbetweenfarmtypesbutas explained above there was not enough detailed information especially for the

80
smaller farms which requires more frequent monitoring and prolonged recordkeepingduringfollowstudies.At thebeginningof the study,marketorientation (internalor external)wasnot animportantfactorfortheresearch.Althoughoncetheanalysisoftheresultsbegan,thisspecificcharacteristicstartedtoemergeasbeingamajorgoverningfactorthatistoalarge extend shaping agricultural practices. During the fieldwork different organicfarmerswerevisited,andsomeoftheseareproducingforexportmarketswhileothertarget mainly local markets. Clear differences were observed and it appears thatproducers focusingoninternalmarketsareexperimentingmuchmorewithorganicfertilizer production, intercropping systems and alternative production strategies(forexampleusingcrownsasplantingmaterialinsteadofsuckers).Theywerehavingbothmorediversefarmingsystemsanddevelopingverysuccessfulbusinessmodelsforinternalmarkets.Among small producers, that export, management strategies were less articulatedandhardtoidentify,aswasthecasefororganicfarmersdedicatedtolocalmarkets.Theagriculturalpracticestendedtobeverysimilartolargerfarmsincludingbuyingmanure and organic amendments to make fertilizers, disease control, landpreparation, etc. As shown by the MESMIS analysis, large organic farm’s currentpractices are very similar to conventional, meaning that they have adapted atechnological package to organic approved practices (the so called “inputsubstitution” approach). A term used by Best (2008) refers to this process as the“conventionalization hypothesis” which implies that especially large‐scale organicagriculture is becoming industrialized and somewhat modified as a model ofconventional agriculture. This is a common situation for large commercial farms,whichhaveenteredthisnichemarketoforganicproduction.Smallorganicproducersmaybeincapableofcompetingwithlargefarms,andinordertosubsisteconomicallytheyhavetoadapttheirfarmingsystems(Best,2008).ThisisthecaseformostofthefarmersinCostaRica,thesesmallorganicfarmersthatexportproductshadtoadaptand industrialize their small farms to compete in terms of meeting quality anduniformitystandardsasdictatedby internationalmarkets.Formanyof theorganicsmall farms (1‐12 ha) the price premium vs. the cost of certification andcorresponding required organic practices: plasticmulch, high nitrogen fertilization,pest control, was too high and organics thus not provide them with a viable(profitable) alternative. Best (2008) describes a phenomenon of “ assimilation”, inwhich they adopt conventional practices, and “bifurcation” in which some smallproducer(low‐profit)trytostrengthentheconnectiontolocalmarketsandviadirectmarketingstrategiessustaintheirlivelihoods.Butthisisnotthecaseforallofthem;someinnovatedoingdifferentthingsthatcouldnotbefullydocumentedduringthecourseofthisresearchproject.Eventhoughsomesmaller farmerswereassimilatingnewtechniquesanddevelopedtheirownrecipesofbiofermentsandbokashi,theystillsufferedfromhighcertificationpricesandlowpayments per kilogram. Size, price and quantity are affecting these producers indifferentways.Thisshouldbeanalyzed furthertodocumentall thedifferencesand
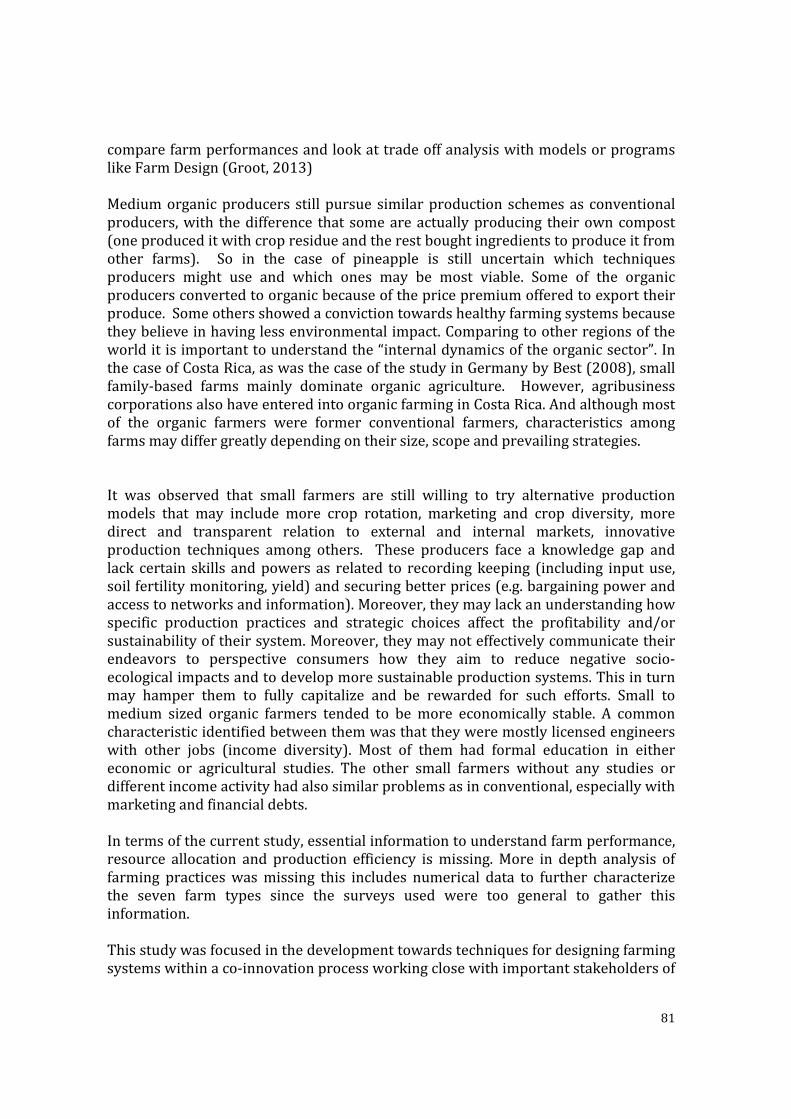
81
comparefarmperformancesandlookattradeoffanalysiswithmodelsorprogramslikeFarmDesign(Groot,2013)Mediumorganicproducers stillpursue similarproduction schemesas conventionalproducers,with thedifference that someareactuallyproducing theirowncompost(oneproduceditwithcropresidueandtherestboughtingredientstoproduceitfromother farms). So in the case of pineapple is still uncertain which techniquesproducers might use and which ones may be most viable. Some of the organicproducersconvertedtoorganicbecauseofthepricepremiumofferedtoexporttheirproduce.Someothersshowedaconvictiontowardshealthyfarmingsystemsbecausetheybelieveinhavinglessenvironmentalimpact.Comparingtootherregionsoftheworlditisimportanttounderstandthe“internaldynamicsoftheorganicsector”.InthecaseofCostaRica,aswasthecaseofthestudyinGermanybyBest(2008),smallfamily‐based farms mainly dominate organic agriculture. However, agribusinesscorporationsalsohaveenteredintoorganicfarminginCostaRica.Andalthoughmostof the organic farmers were former conventional farmers, characteristics amongfarmsmaydiffergreatlydependingontheirsize,scopeandprevailingstrategies.
It was observed that small farmers are still willing to try alternative productionmodels that may include more crop rotation, marketing and crop diversity, moredirect and transparent relation to external and internal markets, innovativeproduction techniques among others. These producers face a knowledge gap andlack certain skills andpowers as related to recordingkeeping (including inputuse,soilfertilitymonitoring,yield)andsecuringbetterprices(e.g.bargainingpowerandaccesstonetworksandinformation).Moreover,theymaylackanunderstandinghowspecific production practices and strategic choices affect the profitability and/orsustainabilityoftheirsystem.Moreover,theymaynoteffectivelycommunicatetheirendeavors to perspective consumers how they aim to reduce negative socio‐ecologicalimpactsandtodevelopmoresustainableproductionsystems.Thisinturnmay hamper them to fully capitalize and be rewarded for such efforts. Small tomedium sized organic farmers tended to be more economically stable. A commoncharacteristicidentifiedbetweenthemwasthattheyweremostlylicensedengineerswith other jobs (income diversity). Most of them had formal education in eithereconomic or agricultural studies. The other small farmers without any studies ordifferentincomeactivityhadalsosimilarproblemsasinconventional,especiallywithmarketingandfinancialdebts.
Intermsofthecurrentstudy,essentialinformationtounderstandfarmperformance,resource allocation and production efficiency ismissing.More in depth analysis offarming practiceswasmissing this includes numerical data to further characterizethe seven farm types since the surveys used were too general to gather thisinformation.Thisstudywasfocusedinthedevelopmenttowardstechniquesfordesigningfarmingsystemswithinaco‐innovationprocessworkingclosewithimportantstakeholdersof
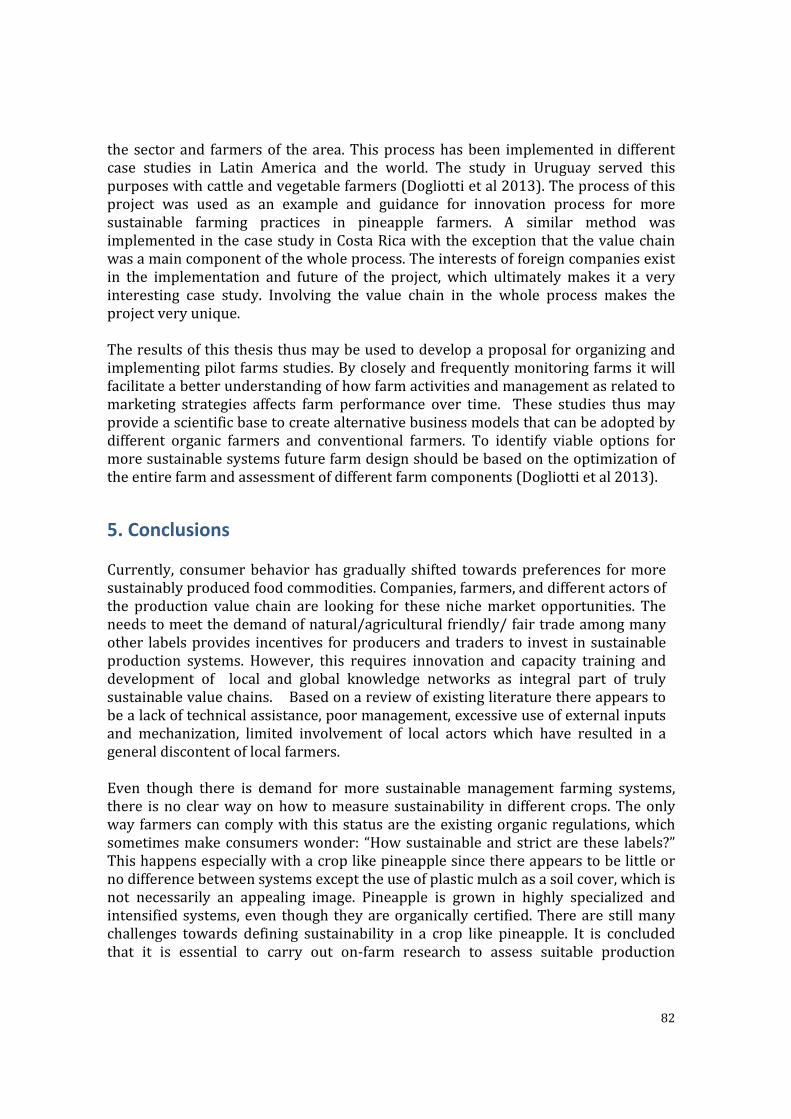
82
the sectorand farmersof thearea.Thisprocesshasbeen implemented indifferentcase studies in Latin America and the world. The study in Uruguay served thispurposeswithcattleandvegetablefarmers(Dogliottietal2013).Theprocessofthisproject was used as an example and guidance for innovation process for moresustainable farming practices in pineapple farmers. A similar method wasimplementedinthecasestudyinCostaRicawiththeexceptionthatthevaluechainwasamaincomponentofthewholeprocess.Theinterestsofforeigncompaniesexistin the implementation and future of the project, which ultimately makes it a veryinteresting case study. Involving the value chain in the whole process makes theprojectveryunique.
Theresultsofthisthesisthusmaybeusedtodevelopaproposalfororganizingandimplementingpilotfarmsstudies.Bycloselyandfrequentlymonitoringfarmsitwillfacilitateabetterunderstandingofhowfarmactivitiesandmanagementasrelatedtomarketing strategies affects farm performance over time. These studies thusmayprovideascientificbasetocreatealternativebusinessmodelsthatcanbeadoptedbydifferent organic farmers and conventional farmers. To identify viable options formoresustainablesystemsfuturefarmdesignshouldbebasedontheoptimizationoftheentirefarmandassessmentofdifferentfarmcomponents(Dogliottietal2013).
5. Conclusions Currently, consumerbehaviorhas gradually shifted towardspreferences formoresustainablyproducedfoodcommodities.Companies,farmers,anddifferentactorsofthe production value chain are looking for these nichemarket opportunities. Theneedstomeetthedemandofnatural/agriculturalfriendly/fairtradeamongmanyother labelsprovides incentives forproducersandtraders to invest insustainableproduction systems. However, this requires innovation and capacity training anddevelopment of local and global knowledge networks as integral part of trulysustainablevaluechains.Basedonareviewofexistingliteraturethereappearstobealackoftechnicalassistance,poormanagement,excessiveuseofexternalinputsand mechanization, limited involvement of local actors which have resulted in ageneraldiscontentoflocalfarmers.Even though there is demand for more sustainable management farming systems,there isnoclearwayonhow tomeasure sustainability indifferent crops.Theonlywayfarmerscancomplywiththisstatusaretheexistingorganicregulations,whichsometimesmakeconsumerswonder: “Howsustainableandstrictare these labels?”Thishappensespeciallywithacroplikepineapplesincethereappearstobelittleornodifferencebetweensystemsexcepttheuseofplasticmulchasasoilcover,whichisnot necessarily an appealing image. Pineapple is grown in highly specialized andintensifiedsystems,even though theyareorganicallycertified.Therearestillmanychallenges towards defining sustainability in a crop like pineapple. It is concludedthat it is essential to carry out on‐farm research to assess suitable production
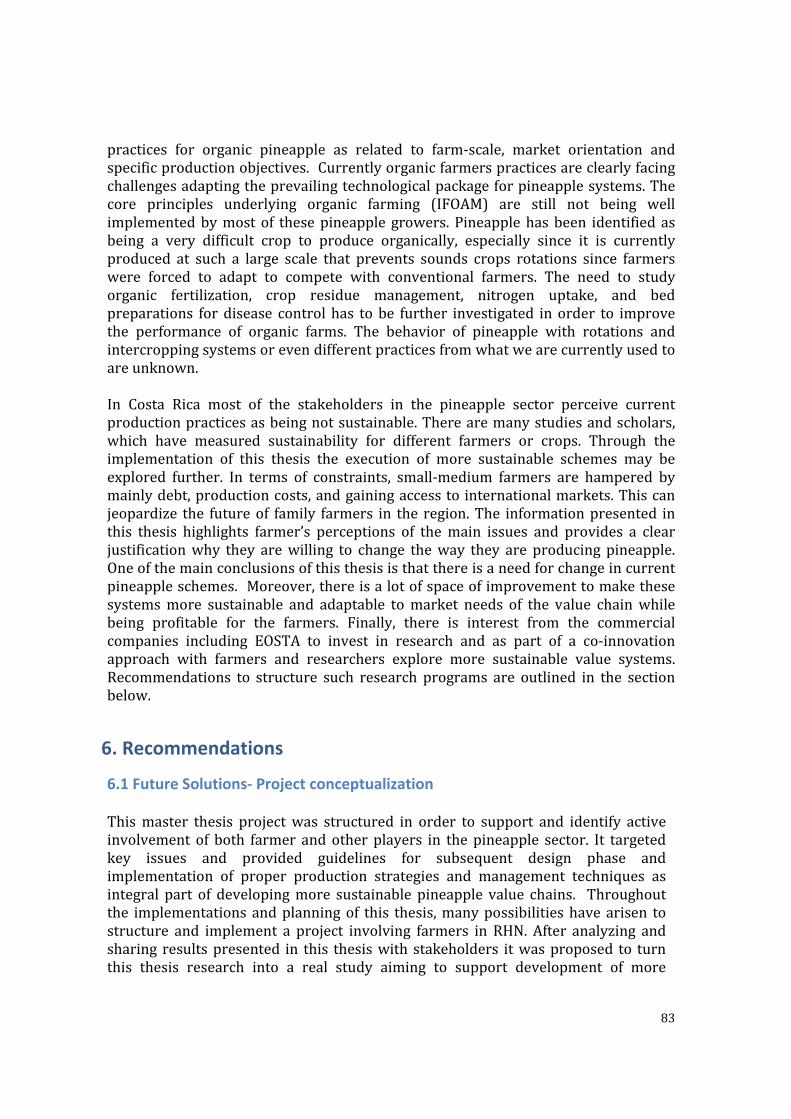
83
practices for organic pineapple as related to farm‐scale, market orientation andspecificproductionobjectives.Currentlyorganicfarmerspracticesareclearlyfacingchallengesadaptingtheprevailingtechnologicalpackageforpineapplesystems.Thecore principles underlying organic farming (IFOAM) are still not being wellimplementedbymostof thesepineapple growers.Pineapplehasbeen identifiedasbeing a very difficult crop to produce organically, especially since it is currentlyproduced at such a large scale that prevents sounds crops rotations since farmerswere forced to adapt to compete with conventional farmers. The need to studyorganic fertilization, crop residue management, nitrogen uptake, and bedpreparations fordisease control has tobe further investigated inorder to improvethe performance of organic farms. The behavior of pineapple with rotations andintercroppingsystemsorevendifferentpracticesfromwhatwearecurrentlyusedtoareunknown.In Costa Rica most of the stakeholders in the pineapple sector perceive currentproductionpracticesasbeingnotsustainable.Therearemanystudiesandscholars,which have measured sustainability for different farmers or crops. Through theimplementation of this thesis the execution of more sustainable schemes may beexplored further. In terms of constraints, small‐medium farmers are hampered bymainlydebt,productioncosts,andgainingaccesstointernationalmarkets.Thiscanjeopardize the futureof family farmers in the region.The informationpresented inthis thesis highlights farmer’s perceptions of themain issues and provides a clearjustificationwhy they arewilling to change theway they are producing pineapple.Oneofthemainconclusionsofthisthesisisthatthereisaneedforchangeincurrentpineappleschemes.Moreover,thereisalotofspaceofimprovementtomakethesesystemsmore sustainable and adaptable tomarket needs of the value chainwhilebeing profitable for the farmers. Finally, there is interest from the commercialcompanies including EOSTA to invest in research and as part of a co‐innovationapproach with farmers and researchers explore more sustainable value systems.Recommendations to structure such research programs are outlined in the sectionbelow.
6. Recommendations
6.1 Future Solutions‐ Project conceptualization Thismaster thesis projectwas structured in order to support and identify activeinvolvement of both farmer andother players in thepineapple sector. It targetedkey issues and provided guidelines for subsequent design phase andimplementation of proper production strategies and management techniques asintegral part of developingmore sustainable pineapple value chains. Throughoutthe implementationsandplanningof this thesis,manypossibilitieshavearisen tostructure and implement a project involving farmers in RHN. After analyzing andsharing resultspresented in this thesiswith stakeholders itwasproposed to turnthis thesis research into a real study aiming to support development of more
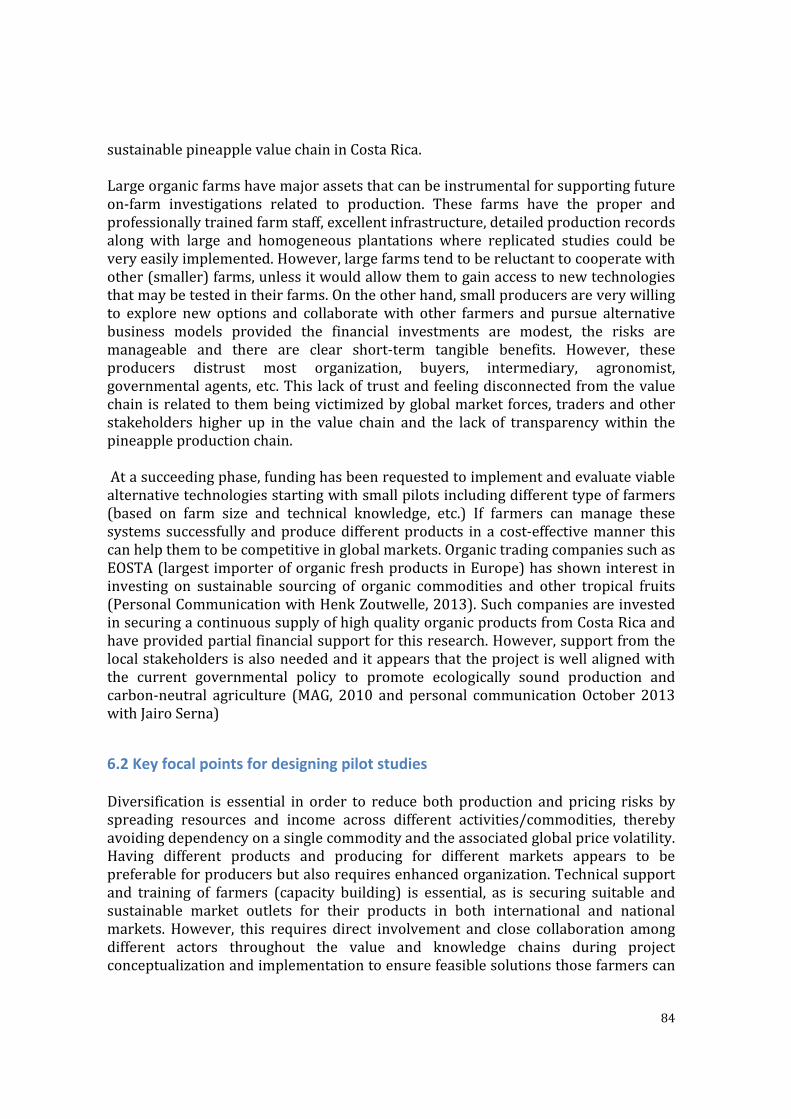
84
sustainablepineapplevaluechaininCostaRica.
Largeorganicfarmshavemajorassetsthatcanbeinstrumentalforsupportingfutureon‐farm investigations related to production. These farms have the proper andprofessionallytrainedfarmstaff,excellentinfrastructure,detailedproductionrecordsalong with large and homogeneous plantations where replicated studies could beveryeasilyimplemented.However,largefarmstendtobereluctanttocooperatewithother(smaller)farms,unlessitwouldallowthemtogainaccesstonewtechnologiesthatmaybetestedintheirfarms.Ontheotherhand,smallproducersareverywillingto explore new options and collaboratewith other farmers and pursue alternativebusiness models provided the financial investments are modest, the risks aremanageable and there are clear short‐term tangible benefits. However, theseproducers distrust most organization, buyers, intermediary, agronomist,governmentalagents,etc.This lackoftrustandfeelingdisconnectedfromthevaluechain isrelatedtothembeingvictimizedbyglobalmarketforces,tradersandotherstakeholders higher up in the value chain and the lack of transparencywithin thepineappleproductionchain.
Atasucceedingphase,fundinghasbeenrequestedtoimplementandevaluateviablealternativetechnologiesstartingwithsmallpilotsincludingdifferenttypeoffarmers(based on farm size and technical knowledge, etc.) If farmers can manage thesesystemssuccessfullyandproducedifferentproducts ina cost‐effectivemanner thiscanhelpthemtobecompetitiveinglobalmarkets.OrganictradingcompaniessuchasEOSTA(largestimporteroforganicfreshproductsinEurope)hasshowninterestininvesting on sustainable sourcing of organic commodities and other tropical fruits(PersonalCommunicationwithHenkZoutwelle,2013).SuchcompaniesareinvestedinsecuringacontinuoussupplyofhighqualityorganicproductsfromCostaRicaandhaveprovidedpartialfinancialsupportforthisresearch.However,supportfromthelocalstakeholdersisalsoneededanditappearsthattheprojectiswellalignedwiththe current governmental policy to promote ecologically sound production andcarbon‐neutral agriculture (MAG, 2010 and personal communicationOctober 2013withJairoSerna)
6.2 Key focal points for designing pilot studies Diversification is essential in order to reduce both production and pricing risks byspreading resources and income across different activities/commodities, therebyavoidingdependencyonasinglecommodityandtheassociatedglobalpricevolatility.Having different products and producing for different markets appears to bepreferableforproducersbutalsorequiresenhancedorganization.Technicalsupportand training of farmers (capacity building) is essential, as is securing suitable andsustainable market outlets for their products in both international and nationalmarkets. However, this requires direct involvement and close collaboration amongdifferent actors throughout the value and knowledge chains during projectconceptualizationandimplementationtoensurefeasiblesolutionsthosefarmerscan
85
readilyadopt.Proposed strategies may include green manures, intercropping systems, croprotations, compost andmarket diversification andwill include strategies identifiedduringinterviewswithlocalproducers.Thisintegratedsystemapproachaimstohelpfarmerstogainmoreautonomyandreducetheirdependencyonexternalinputsandintermediariesthatcontrolinternationalmarkets.Duringaproject‐conceptualizationworkshop farmersandotherexpertswereinvitedto listsolutionstohelpstructuremoresustainablesystems.Theworkgroups focusedmainlyonproblemsoforganicproducersandsmallholders.Presentedbelowarethemainstatementsmentionedbythegroups.
Groups Statements of Solutions
‐ HouseholdEconomyEducation: thiswasstatedasasolutiontoaddresscertain
knowledgeandinformationgapsestablishedforsmallholders.Farmersneedtobe able to adapt tomarket changes, negotiate prices and be capable of havingenoughskillstohaveaprofitablebusinessandtoensuresustainabilityforthemand their family. Fair prices, diverse production schemes, and varied marketsboth locally and internationally play an important role in this new businessmodel.
‐ Stable and reliable markets are seen as key elements in assuring long‐termsustainability for small producers. Thismay be facilitated by buyers providingsigned letters of compromise and contracts for the producers. This type ofcompromise can allow the producer to request a loans or insurance for theircrops.
‐ Diversifying production to commercialize more crops to to differentiate andcomplement income by including: vegetable crops (short cycle cutting greens)forlocalmarketsandfruitcrops(pineapple,starfruit,melon,amongmanymore)toexport.
‐ Providetechnicalsupportteamsthatcanhelptoorganizeproducersinagroupwith centralized administration (cooperative/organization) and assist themcomply with legal requirement (certification, quality standards, organizationalskillsandexportationrequirements).
‐ Technicalsupportfortransitionmodels(conventionaltoorganic).‐ Avoid over production of crops. Produce based on the needs of the different
markets: local,processingandexportinggoods.Methodologicalassistance frombuyer/importertodesignaprogrammedproductiononthefarms.Monthlyplanfor planting and harvesting quantity, alongwith other technical aspects of thefarmdesignincludingnutrientbudgetsandinputuserecords.
‐ Integratesocialsciencesandembracedifferentideasandnewcustoms.Thiscanhelp guide a project in terms of how to organize and integrate producers andconsumersintofarmingandinnovationssystems.
86
New Design ‐ CropZoning:Specializingthedifferentproducersaccordingtothedifferentcrops
thatarebestproducedinthedifferentpedoclimaticconditions.Theministryofagriculturewas suggestedasbeingable to facilitate the implementationof thistypeofproject.
‐ Maincropsof interestforexternalandinternalmarketsare:pineapple(Ananascomosus), ginger (Zingiberofficinale), star fruit (Averrhoa carambola), passionfruit (Passiflora edulis ), curcuma (Curcuma longa L.), sweet potato (Ipomeabatatas), cassava (Manihotesculenta), coconut, lemon (Citruslimonum), papaya(Carica papaya), squash, arlum melons (Cucumis melo), with possibilities tointroducenewexoticcropsoftheinternationalmarketdemand.
‐ Twodesignswereofspecial interest fortheproducers.Thefirstone isanagroecological design of bigger areas (0.5‐1 ha) with rotational alternatives ofdifferent crops. These designs are especially intended for farmers that usemechanization in their farm. This tendency is for farmers, who usually havebigger areas and hire extra labor for planting, harvesting and other tasks. Theseconddesignisanintercroppingsystem,whichincludesmanycropsinamoredetailed planning. Both systems embrace in their design key improvedagronomic practices such as: use of compost, microorganisms, crop rotation,greencompost,hedgesoflegumes,andotheragroecologicalpractices.
‐ Exportationandorganizationguidelinesforproducersespeciallyformaintainingquality standards required for the different markets.. Taking into accountmethods that can allow producers to learn and share this knowledge betweenthem.
‐ Importantactorshavebeenidentifiedasparticipantsinthere‐designofthenewbusinessmodels.
Farmersneedsupporttofindsolutionstotheirproblemsstartingwiththemappingof their interests as related to specific production techniques, crops, and concernsamongmanyother characteristics thatwouldbe incorporated in new systems thataddresstheirneedsandshareholdersofthewholesector.Organization and need for transparency in transactions There is need to advice farmers on how to organize themselves in a structuredmanner that will allow them to benefit from economies of scale in terms ofproduction,training,andcertification.Thisrequiresproperorganizationalstructureand management techniques so they can learn and as a group evolve as anindependentorganization.Thisappliesmostlytosmallandmediumproducers,whichare part of the cooperatives. At this point, it is essential for producers to haveknowledge about marketing, production, legalities, and negotiations among manyotherskillsandtrainingrequired inorder tobesuccessful in theirdailyoperationsandbusiness.ItiscrucialforthefunctionalityofagroupofproducerstoidentifythenecessarytoolstofunctionasanorganizationIthasbeenwellknownthatthereare
87
some problems in cooperatives in Costa Rica; this should be further analyzedthoroughly to learn from past mistakes and work with people with experiencehandling organic groups and farms successfully (certification / inspectors /individualproducers/etc.) Co‐ Innovation and Technology Transfer For the pineapple sector there are many areas to be improve when it comes toagricultural practices. Several studies conducted in Costa Rica focus on theenvironmental problems associated with poorly managed pineapple productionsystems.Newinvestigationsareneededtoaddressorganicproductionproblemsandto develop suitable solutions to these problems. The aim would be to create aninnovation environment that enable generation of applied knowledge and suitableproduction techniques that can help support successful production system thatcomply with key sustainability requirements. Discussion of these various issuesfound during the first stagewant to be discussed and overviewed to findways tocarryoutstudiesandresearchproposals..
6.3 Research ‐ Opportunities for improving production systems It is evident that there is a need for research in organic pineapple production. Ifproducersaimtoevolvetowardsmoresustainableproductionsystemstheywillneedsupport or incentives to be successful during the transition. This in order toimplement the required changes in their farms. Producers of intensively managedfarms thus may have to invest in improved inherent soil structure and fertility,making use of a combination of different management strategies and technicalinterventionspresentedabove.Producersexperimentaspartoffarmingandare“learningbydoing”andinthiswayfarmmanagement skills and production techniques evolve continuously through a“learning selection” mechanisms. Nevertheless, small farmers are increasinglyconfrontedwithsituationsforwhichpreviousexperienceprovideslimitedguidance.At this point, researchers can play a role in supporting the intrinsic learningcapabilities of farmers so that they canmake better‐informed decisions by helpingthemmanagethecomplexityoftheirfarmsandadaptcurrentpracticestoemergingconditions. Throughout the DEED process researchers interact closely withstakeholdersandalso learnbyanalyzingcurrentsituationsandprevailingpracticesandactivelyconsultwithlocalactorswhenidentifyingdesirablefuturesandplausibleoutcomes. Use of system design tools can reinforce this process by allowingresearchers to analyze many farm structures and corresponding managementpracticesthatfarmsrepresent.Suchinnovationprocessesappeartobemoreeffectivewhen also involving actors from the wider farmer network, including governmentsupport,suppliers,retailers,andpolicymakers(Rossing,2010).

88
Basedonthispremise, it isessential to identifyactors involved inorganizationandevaluationoftheproject.Anoutlineofsomeoftheactorsthathavebeenidentifiedtobe supportive and involved in the project is outlined in Annex 3. Meetings andworkshops have to be carried out with different actors, which might be involvedduringthefutureimplementationofthisproject.Large producers are perceived to be less interested in participating in sharing ofknowledge and are also less inclined to change in their production schemes. Theconventional producers are not interested in any kind of diversifying productionschemesincludingpineapplebeingpartofa largercroprotation.However,theydidshow an interest in investigations that can help to improve current productionsystemsincludingcompostingasameansforresiduemanagement,biorepellentsfordifferent plagues, among others. They produce large amounts of quality pineapple;theydonotseesmallquantitiesofdiversifiedproductstobeaviablealternativeforthecurrentstatusquo.Besidesthistheyarenotinterestedinengaginginapossiblealliancewithsmallorganicproducersforproducingandpackingspecialcommodities.Largeorganicfarmsdonotexperiencemuchcompetitionfromsmall‐scaleproducers.Eventhoughtheyproducelargevolumes,theirproductioncostsarestillmuchhigherthanconventional,whichmakesorganicpineappleaverychallengingbusinessmodelformonoculturefarms.All farmersshowedaninterest inthetransferoftechnologyand the exploration of more sustainable and economically feasible productiontechniques andmanagement strategies. Large producers seemed uncomfortable toshareand/ortransfertechnologiesbecausetheyprefertokeepacompetitiveedge.Medium size farmers expressed mixed feelings about these schemes. They like toexplorethepossibilityofincludingotherproducesintheirplantingsystems,toassuremoremonetary stability. However, they are a bit skeptic about the organization ofsuch systems and the structuring of required distribution channels. Some showedinterest in participating in future pilot studies to further explore such systems orbusinessplans.They seemedmoreopen to technology transferbetweenproducerscomparedtolargeproducers.Alsotheyareinmoresecurepositionintermsofpricesand marketing, which is an advantage over smaller growers. Since they managesmallerareas itmayalsobemoreeasytomanagemoredifferentcropsatthesametime.Thesehypothesiscouldnotbeverifiedandthuswarrantfurtherinvestigations.Smallfarmerswereveryinterestedinnewbusinessplans,sincemanyhavefailedtoovercomethepineapplecrisisduringthepastyears.However,theyhavelosttrustinthe sector and also in the governmental institutions, commercial companies, andresearch institutions including Universities. They stated that the only reason toparticipatewould be if theywere assuredof good prices and secure internationalsales.Ithasbeenidentifiedthattheywouldneedhelpinmanyorganizationalaspectsincluding certification, quality produce assurance, price negotiation, sustainableproductionpracticesandproducer’sorganizationforexport.

89
7. References Acuña, G. 2004. Diagnostic situation and conditions of the pineapple industry:Characteristics, organization and labor conditions. ASEPEROLA (Asociaciónserviciosdepromociónlaboral).
Acuña,G.2006.ProduccióndepiñaenCaribeyPacíficoSurdeCostaRica.Ambientico,158.UniversidadNacional(UNA),Heredia,CostaRica.
Alvarez,S.,Paas,W.,Descheemaeker,K.,andGroot,J.2014.Workshop11‐13.Constructingtypologies,awaytodealwithfarmdiversity:GeneralguidelineforHumidTropics.PlantScienceGroup,WageningenUniversity,Netherlands.
Alvarez‐Lopez,C.,RiveiroJ.,Marey,F.2008.Typology,classificationandcharacterizationoffarmsforagriculturalproductionplanning.SpanishJournalofAgriculturalResearch.
Aravena, J.2005.Laexpansiónpiñeraencostaricalarealidaddelosperdedoresde la agroindustria exportadora de la piña. COECOCeiba. Available at:coecoceiba.org/wp‐content/subidas/2010/03/pub11.pdf
Astier,M.,L.García‐Barrios,Y.Galván‐Miyoshi,C.E.González‐Esquivel,andO.R.Masera. 2012. Assessing the sustainability of small farmer natural resourcemanagement systems. A critical analysis of theMESMIS program. (1995‐2010).EcologyandSociety17(3):25.
Banacol. 2011.Estudio de Caso: Evaluación del sistema de producción de piña(Ananas Comosus L.Merr.) y la implementación tecnológica de buenas practicasagrícolas integradas en la Región Huetar Norte y Nor‐ atlántica de Costa Rica.ProyectoGEF‐REPCar.
Barrientos,O.andChaves,G.SEPSAandPROCOMER.2008.Regiónhuetarnorte:ofertaexportadaactualyofertapotencialdeproductosagropecuariosalternativoseproductosagropecuariosalternativos.Availableat:http://www.procomer.com/contenido/descargables/investigaciones_economicas/2008/Region_Huetar_Norte_final.pdf
Barrientos,O.2010. SectorAgropecuario:Cadenaproductivadepiñapolíticas yacciones. SEPSA (Secretaria ejecutiva de planificación sectorial agropecuaria) yMAG(MinisteriodeAgricultura)SanJoséCostaRica.Best,H.(2008).Organicagricultureandtheconventionalizationhypothesis:AcasestudyfromWestGermany.AgricultureandHumanValues,25(1),95‐106.

90
Blazy,J.etal.2009.Amethodologicalframeworkthataccountsforfarmdiversityintheprototypingofcropmanagementsystems.Appicationtobanana‐basedsystemsinGuadeloupe.Elsevier.AgriculturalSystems.101.30‐41.
Bremmers,H.,Trienekens,J.H.,vanderVorst,J.G.,&Bloemhof,J.M.(2011).Systemsforsustainabilityandtransparencyoffoodsupplychains–Currentstatusandchallenges.AdvancedEngineeringInformatics,25(1),65‐76.
Brenes,L.2011.DevelopingaSmallGrowerBasedOrganicPineappleExportSystem.AgrivitaandProagroin.Availableat:http://www.pnp.cr/investigaciones.php
Calderon,J.etal.2013.EstadísticasdeComercioExteriordeCostaRica2012.PRCOMER(PromotoradelcomercioexteriordeCostaRica.)SanJosé,CostaRicaISSN:2215‐2342.
Cartin,S.andPiszk,I.1980.LaproduccióndegranosbásicosenCostaRica:Institucionesestatalesyfuerzassocialesperiododediversificacióneconómica.Cienc.Soc.19‐20:25‐35.
CANAPEP (CamaraNacional de Productores y Exportadores de Piña) CostaRica.Availableat:http://www.canapep.com/pina‐de‐costa‐rica/historia
CostaRicanNewsTeletica,March2013Article fromlocalnewspaper.LaNaciónpg 20A. Published on the 20 th of June 2013. Costa Rica. Available at:http://www.teletica.com/Noticias/5108‐Asamblea‐Legislativa‐investigara‐a‐Proagroin‐tras‐denuncias‐de‐cientos‐de‐pineros.note.aspx.
Daskalopoulou I. and Petrou, A. 2002. Utilizing a farm typology to identify potentialadopters of alternative farming activities in Greek agriculture. Journal of Rural Studies(2002)95‐103
Sakane, N., Becker,M. and Langensiepen. 2013. Typology of Smallholder production inSmallEast‐AfricanWetlands.SocietyofWetlandScientists.33:101‐116.
Dogliotti,S.,etal.Co‐Innovationoffamilyfarmingsystems:asystemsapproachtosustainableagriculture.Agr.Syst.(2013)Availableat:http://dx.doi.org/10.1016/j.agsy.2013.02.009
Diaz,S.2013.ElDulceyamargosabordelapiña.ElFinancieroNewspaper.SanJose,CostaRica
EOSTA and ICCO, 2010. Sustainabilityoforganic&organic–fairtradepineapplegrowingforexport. ICCO&EOSTAMissionReport.AvailableatNatureandMorewebsite:http://www.natureandmore.com/search?portal_type=Blog+Item&portal_type=Grower&portal_type=Product&portal_type=Standard+Page&SearchableText=ICCO
91
Emanuelli, M., Jonsen, J. and Monsalve, S. 2009. Latin America reports onmonocultureandviolationsof thehumanrights toadequate foodandhousing, towatertolandandtoterritory.FIAMSwedenandSAL.FIANInternational,Sweden.
Guadarrama,C.2008.Agrowertypology:ApproachtoassessingenvironmentalimpactofcoffeefarminginVeracruz,Mexico.2008.WURLibraryAvailableat:http://books.google.nl/books?hl=nl&lr=&id=BbGTuQEQ0kMC&oi=fnd&pg=PA127&dq=farm+typologies+in+costa+rica&ots=G‐pBdvnomN&sig=1‐c_DvF1NXnvcQ36SRS9674J8hE#v=onepage&q&f=false
FAO Corporate Document Repository. Participatory survey methods forgathering information. Technical Cooperation DepartmentAvailable:http://www.fao.org/docrep/w8016e/w8016e01.htm#knowledge,%20attitude%20and%20practice%20surveys
Faure, G and D Meneses, 2002. The Farm in the region Huetar Norte: andevaluationofactualconditionsofthefarmsoffamilyproducers.CIRADFranciaandMAG(MinistryofagricultureCostaRica.)
FaureandG.andSamper,M.2004.Veinteañosdeaperturaeconómica:Elporvenircomprometido de la agricultura familiar en el norte de Costa Rica. Anuario deEstudiosCentroamericanos,UniversidaddeCostaRica,30(1‐2)7‐26,2004.
Gauggel, C.ProgramadeConservacióndesuelosenelcultivodelapiña(PineappleProgramforsoilconservation).Presentation forpineappleproducers inofficesofDole,CostaRica.InternationalDirectorofSoilManagement.
Giller, K. E. et al. 2008. Competing claims on natural resources: what role forscience. Ecology and Society 13(2): 34. [Online] URL:http://www.ecologyandsociety.org/vol13/iss2/art34/
Groot, J. 2013. Analysis and Design of Farming Systems Course, WageningenUniversity.Guinot,C.,Latreille,J.,Malvy,D.,Preziosi,P.,Galan,P.,Hercberg,S.,&Tenenhaus,M.(2001).Useofmultiplecorrespondenceanalysisandclusteranalysistostudydietarybehaviour:foodconsumptionquestionnaireintheSU.VI.MAX.cohort.Europeanjournalofepidemiology,17(6),505‐516.
Hayati,D.,Ranjbar,Z.andKarami,E.2011.MeasuringAgriculturalSustainability.
92
Department of Agricultural Extension and Education, College of AgriculturalShirazUniversity,Shiraz,Iran.Springerarticle.ISBN:978‐90‐481‐9512‐1.
Holdridge,L.R.:1947,‘DeterminationofWorldPlantFormationsfromSimpleClimaticData’,Science105.367–368.
Ingwerse,W.2012.LifeCycleAssessmentoffreshpineapplefromCostaRica.Elsevier. JournalofCleanerProduction35(2012)152‐163.
Kellon,D.,R.León,andR.Marsh.2011.Pineappleproducerperspectivesandpolicyimplications topromote ecologically sustainableproductionofpineapple inCostaRica. Ecoagriculture Report. Washington, DC: EcoAgriculture Partners withEARTH University. Available at:http://www.pnp.cr/backend/files/catalogo/4999_Perspectivas%20de%20los%20productores%20de%20pi%C3%B1a%20e%20implicaciones%20pol%C3%ADticas%20para%20promover%20la%20producci%C3%B3n%20sostenible%20de%20pi%C3%B1a%20en%20CR‐2011_bib.pdf.
Landais,E.,1998.Modelingfarmdiversity:newapproachestotypologybuildinginFrance.AgriculturalSystems58,505527.
Lopez‐Ridaura,S.Astier,M. andO.Masera.2002.Evaluatingthesustainabilityofcomplex socio‐enviromental systems. The Mesmesis framework. EcologicalIndicators,ElsevierScienseLtd.
López‐Ridaura, S., van Keulen, H., Van Ittersum, M.K., and Leffelaar, P.A., 2005.Multiscale Methodological Framework to Derive Criteria and Indicators forSustainability Evaluation of Peasant Natural Resource Management Systems.Environment,DevelopmentandSustainability7,51‐69.
Mądry,W.,Mena,Y.,Roszkowska‐Mądra,B.,Gozdowski,D.,Hryniewski,R.,&Castel,J.M.(2013).Anoverviewoffarmingsystemtypologymethodologiesanditsuseinthestudyofpasture‐basedfarmingsystem:areview.SpanishJournalofAgriculturalResearch,11(2),316‐326.
MAG, 2010. Estudio del estado de la producción sostenible y propuesta demecanismos permanentes para el fomento de la producción sostenible.GFAConsulting Group S.A. Available at:http://www.mag.go.cr/bibliotecavirtual/a00186.pdf
Maglianesi, M. 2013.Desarrollode laspiñerasenCostaRicaysus impactossobreecosistemasnaturalesyagro‐urbanos.BiocenosisVol.27(1‐2).UNED,CostaRica.
Peña,M.2011.Gestiónderiesgosambientalesdelsectorfinancierorelacionadascon
93
sus carteras agrícolas de piña. Available at:http://www.pnp.cr/backend/files/catalogo/2323_Gestion%20de%20Riesgos%20Ambientales%20del%20Sector%20Financiero.pdf
Pomerada, C. WTO agreement on agriculture: the implementation experience...Studyprepared forFAO.San Jose,CostaRica.Producedby:EconomicandSocialDevelopmentDepartment
PROAGROINWebsite:http://www.procomer.com/contenido/proagroin.html
Quijandría,G.,BerrocaJ.andPratt,L.Julio1997.LaIndustriadelaPiñaenCostaRica Análisis de Sostenibilidad. INCAE. Available in:http://www.incae.edu/es/clacds/publicaciones/pdf/cen707.pdf
Ramirez,R.andMuñoz,J.2007.LareformaeconómicaysuimpactosocialenCostaRicaduranteelperíododeajusteestructural:Apuntescríticosparaelanálisis.UNA(UniversidadNacionaldeCostaRica).EconomíaySociedadNo31and32.Pg.5‐34.
Richardson, R. et al. 2013. Using choice experiments to understand householdtradeoffsregardingpineappleproductionandenvironmentalmanagementinCostaRica.ELSEVIER.JournalofEnvironmentalManagement.127.308‐316
RossingW., 2010 et al.Projectdesignandmanagementbasedonaco‐innovationframework: towards more effective research intervention for sustainabledevelopmentoffarmingsystems.9thEuropeanIFSASymposium,ViennaAustria.
RCoreTeam(2012).R:Alanguageandenvironmentforstatisticalcomputing.RFoundation for Statistical Computing. Version 2.14, Vienna, Austria. URL :http://www.R‐project.org/
Russo,R.etal.2006.ProspectiveimpactanalysisofthegrowthpineapplecropareaintheAtlanticRegionofCostaRica.Proc.Fla.StateHort.Soc.119:1‐3.Availableat:http://www.pnp.cr/investigaciones.php
Speelman,E.N.,Astier,M.,López‐Ridaura,S.,Masera,O.R.,&Gonzalez‐Esquivel,C.E.(2011).Sustainabilityindicators,alternativestrategiesandtrade‐offsinpeasantagroecosystems:analysing15casestudiesfromLatinAmerica.InternationalJournalofAgriculturalSustainability,9(3),409‐422.
Tittonell, P. et al 2009. Beyond resource constraints‐ Exploring the biophysicalfeasibilityofoptionsfortheintensificationofsmallholdercrop‐livestocksystemsin
94
Vihigadistrict,Kenya.AgriculturalSystems101(2009)1‐19.
Trienekens,J.2007.Losestándaresdecalidadyseguridadenlacadenaalimentariainternacional.DistribuciónyConsumo21.WagenigneUniversity,Netherlands.
United Nations: Comisión Económica para América Latina y el Caribe(CEPAL)2009.Crisisdelospreciosdelpetróleoysuimpactoenlospaísescentroamericanos.Availableat:http://www.cepal.org/publicaciones/xml/8/36328/L908.pdf
Villegas, O. et al. 2007. MAG (Ministerio de Agricultura y Ganadería. DirecciónRegionalHuetarNorte.2007.Caracterizaciónyplandeacciónparaeldesarrollodela agro cadena de piña en la regiónHuetarNorte.Cuidad Quesada, Costa Rica.Availablein:www.pnp.cr/backend/files/.../2645_MAG‐DRHNORTE‐2007bib.pdf
Waney, N.F.L, Soemarno, Yuliaty, Y. and Polii, B. 2014 Developing IndicatorsofSustaiableAgricultureat farm level. IOSR Journal of Agriculture and VeterinaryScience(IOSR‐JAVS)e‐ISSN:2319‐2380,p‐ISSN:2319‐2372.Volume7,Issue2Ver.II(Mar‐Apr.2014),PP42‐53www.iosrjournals.org
Willer, et al. 2009. TheWorld of Organic Agriculture. Statistics and EmergingTrends2009.FIBL‐IFOAMReport.IFOAM,Bonn;FiBL,Frick;ITC,Geneva.
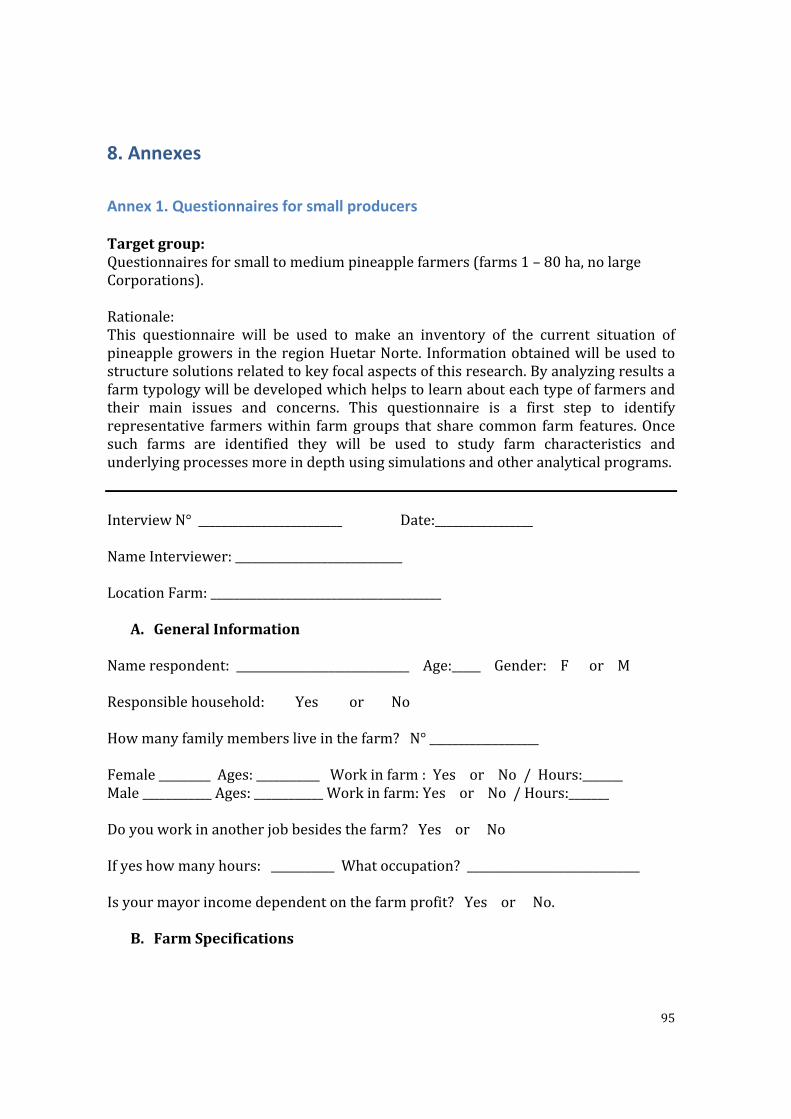
95
8. Annexes
Annex 1. Questionnaires for small producers Targetgroup:Questionnairesforsmalltomediumpineapplefarmers(farms1–80ha,nolargeCorporations).Rationale:This questionnaire will be used to make an inventory of the current situation ofpineapplegrowersintheregionHuetarNorte. Informationobtainedwillbeusedtostructuresolutionsrelatedtokeyfocalaspectsofthisresearch.Byanalyzingresultsafarmtypologywillbedevelopedwhichhelpstolearnabouteachtypeoffarmersandtheir main issues and concerns. This questionnaire is a first step to identifyrepresentative farmerswithin farmgroups that share common farm features.Oncesuch farms are identified they will be used to study farm characteristics andunderlyingprocessesmoreindepthusingsimulationsandotheranalyticalprograms.InterviewN°_________________________Date:_________________NameInterviewer:_____________________________LocationFarm:________________________________________
A. GeneralInformationNamerespondent:______________________________Age:_____Gender:ForMResponsiblehousehold:YesorNoHowmanyfamilymembersliveinthefarm?N°___________________Female_________Ages:___________Workinfarm:YesorNo/Hours:_______Male____________Ages:____________Workinfarm:YesorNo/Hours:_______Doyouworkinanotherjobbesidesthefarm?YesorNoIfyeshowmanyhours:___________Whatoccupation?______________________________Isyourmayorincomedependentonthefarmprofit?YesorNo.
B. FarmSpecifications
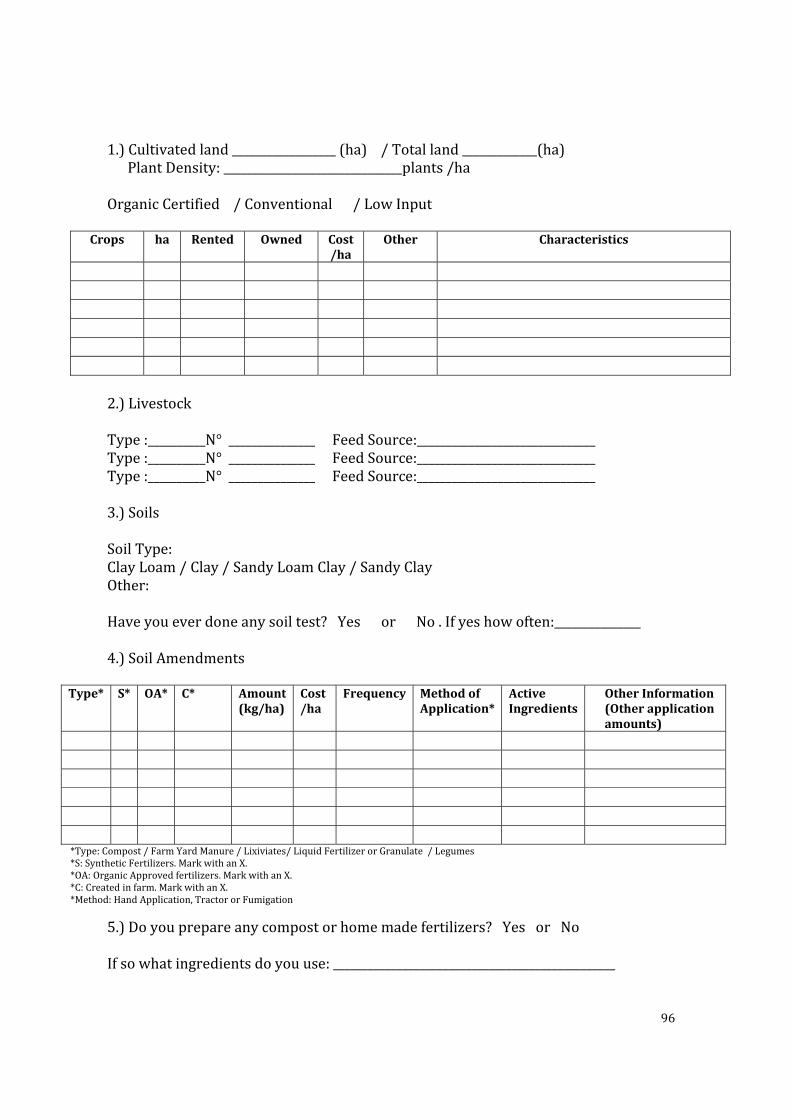
96
1.)Cultivatedland__________________(ha)/Totalland_____________(ha)PlantDensity:_______________________________plants/haOrganicCertified/Conventional/LowInput
Crops
ha Rented Owned Cost/ha
Other Characteristics
2.)LivestockType:__________N°_______________FeedSource:_______________________________Type:__________N°_______________FeedSource:_______________________________Type:__________N°_______________FeedSource:_______________________________3.)SoilsSoilType:ClayLoam/Clay/SandyLoamClay/SandyClayOther:Haveyoueverdoneanysoiltest?YesorNo.Ifyeshowoften:_______________4.)SoilAmendments
Type* S* OA* C* Amount(kg/ha)
Cost/ha
Frequency MethodofApplication*
ActiveIngredients
OtherInformation(Otherapplicationamounts)
*Type:Compost/FarmYardManure/Lixiviates/LiquidFertilizerorGranulate/Legumes*S:SyntheticFertilizers.MarkwithanX.*OA:OrganicApprovedfertilizers.MarkwithanX.*C:Createdinfarm.MarkwithanX.*Method:HandApplication,TractororFumigation
5.)Doyouprepareanycompostorhomemadefertilizers?YesorNoIfsowhatingredientsdoyouuse:_________________________________________________
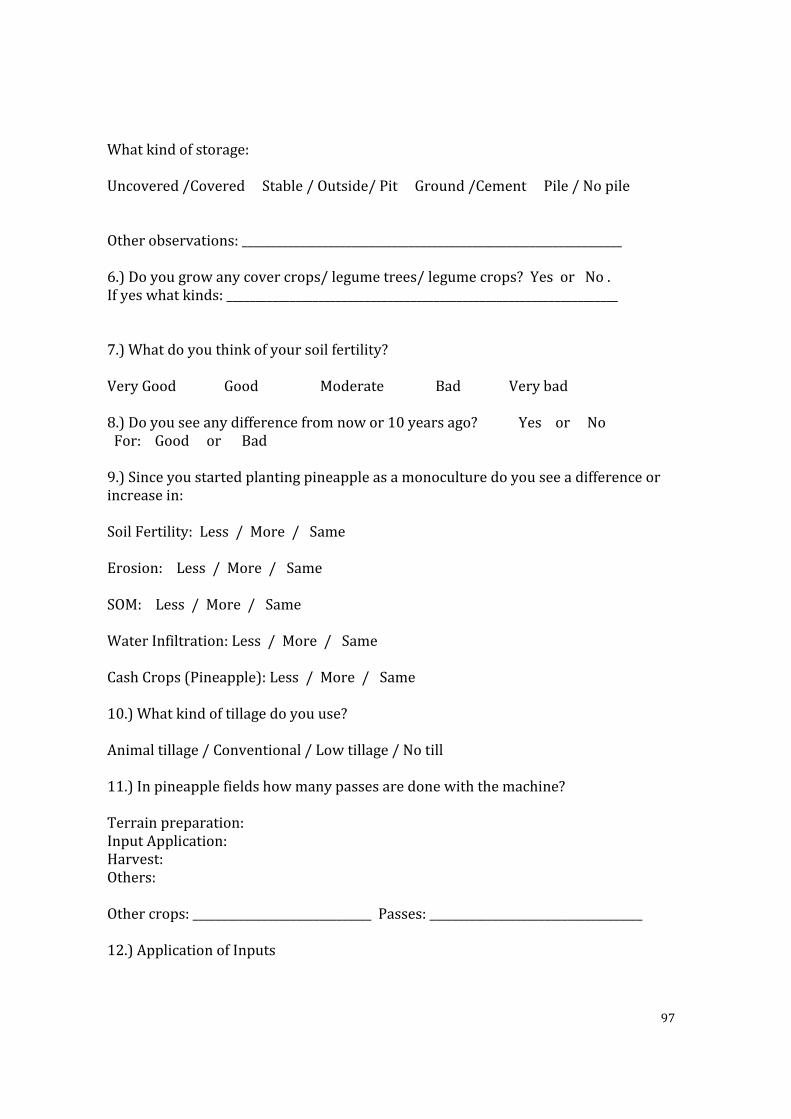
97
Whatkindofstorage:Uncovered/CoveredStable/Outside/PitGround/CementPile/NopileOtherobservations:__________________________________________________________________6.)Doyougrowanycovercrops/legumetrees/legumecrops?YesorNo.Ifyeswhatkinds:____________________________________________________________________7.)Whatdoyouthinkofyoursoilfertility?VeryGoodGoodModerateBadVerybad8.)Doyouseeanydifferencefromnowor10yearsago?YesorNoFor:GoodorBad9.)Sinceyoustartedplantingpineappleasamonoculturedoyouseeadifferenceorincreasein:SoilFertility:Less/More/SameErosion:Less/More/SameSOM:Less/More/SameWaterInfiltration:Less/More/SameCashCrops(Pineapple):Less/More/Same10.)Whatkindoftillagedoyouuse?Animaltillage/Conventional/Lowtillage/Notill11.)Inpineapplefieldshowmanypassesaredonewiththemachine?Terrainpreparation:InputApplication:Harvest:Others:Othercrops:_______________________________Passes:_____________________________________12.)ApplicationofInputs
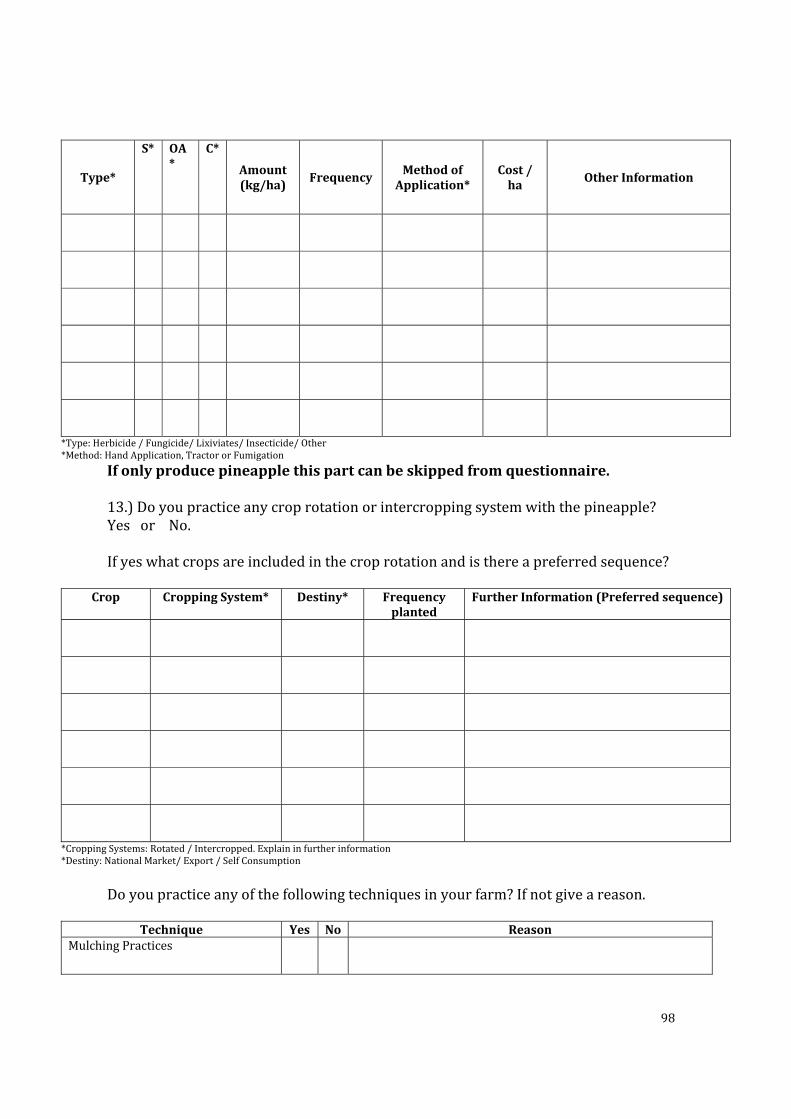
98
Type*
S* OA*
C*
Amount(kg/ha) Frequency Methodof
Application*Cost/ha OtherInformation
*Type:Herbicide/Fungicide/Lixiviates/Insecticide/Other*Method:HandApplication,TractororFumigation
Ifonlyproducepineapplethispartcanbeskippedfromquestionnaire.13.)Doyoupracticeanycroprotationorintercroppingsystemwiththepineapple?YesorNo.Ifyeswhatcropsareincludedinthecroprotationandisthereapreferredsequence?
Crop CroppingSystem* Destiny* Frequencyplanted
FurtherInformation(Preferredsequence)
*CroppingSystems:Rotated/Intercropped.Explaininfurtherinformation*Destiny:NationalMarket/Export/SelfConsumption
Doyoupracticeanyofthefollowingtechniquesinyourfarm?Ifnotgiveareason.
Technique Yes No ReasonMulchingPractices

99
GreenManuresorcompost
Integratingothercrops
CropRotations
Agroforestry
Minimizechemicalinput
Createownfertilizer/biopesticides
ProducerSupportSystems*
*ProducerSupportSystems:Workinginfarmersupportgroupstosharetechnologiesandworktogetherformarketingproducts.
C. SocialAspect:Networks,FarmResourcesandTraining1.)Doyouhireanyworkers?YesorNo.Temporary___________/Fixed__________.TemporaryFor:Planting/Harvesting/FarmChoresIfyeshowmanypeople:__________________.Pricepaidbyhour:___________________.Whatisyouryieldperha:____________________________1stquality(export)%perha_____________________________price/ton___________________2ndquality%perha________________________________________price/ton___________________Whatisyourcostperha:______________________________2.)Wheredoyougetyourtechnicalsupportandinformation?Neighbors/SupplyCompanies/MAG/Other:_____________________________Haveyoubeenpartofanyextensionortrainingprogram?YesorNo.Ifyespleasespecify:Typeoftraining Times Year&Duration Organizedby 3.)Haveyoueverbeenpartofatechnicalsupportgroupinyourcommunityforpineappleproductionorothercrops?
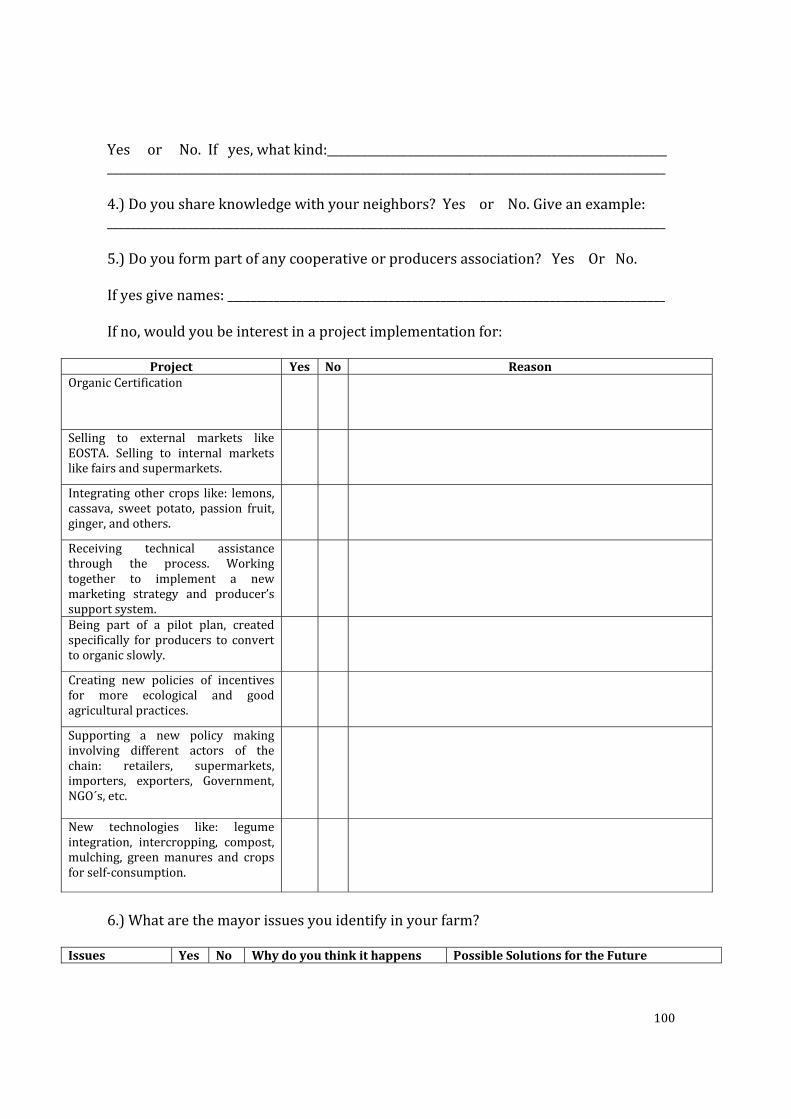
100
YesorNo.Ifyes,whatkind:____________________________________________________________________________________________________________________________________________________________4.)Doyoushareknowledgewithyourneighbors?YesorNo.Giveanexample:_________________________________________________________________________________________________5.)Doyouformpartofanycooperativeorproducersassociation?YesOrNo.Ifyesgivenames:____________________________________________________________________________Ifno,wouldyoubeinterestinaprojectimplementationfor:
Project Yes No ReasonOrganicCertification
Selling to external markets likeEOSTA. Selling to internal marketslikefairsandsupermarkets.
Integratingothercrops like: lemons,cassava, sweet potato, passion fruit,ginger,andothers.
Receiving technical assistancethrough the process. Workingtogether to implement a newmarketing strategy and producer’ssupportsystem.
Being part of a pilot plan, createdspecifically forproducers to converttoorganicslowly.
Creating new policies of incentivesfor more ecological and goodagriculturalpractices.
Supporting a new policy makinginvolving different actors of thechain: retailers, supermarkets,importers, exporters, Government,NGO´s,etc.
New technologies like: legumeintegration, intercropping, compost,mulching, greenmanures and cropsforself‐consumption.
6.)Whatarethemayorissuesyouidentifyinyourfarm?
Issues Yes No Whydoyouthinkithappens PossibleSolutionsfortheFuture
101
Soil
Diseases
LaborIntensity
Selling&Distribution
Cost:Benefit
Competition
QualityStandards
Others
D. MarketandDistribution
Wheredoyousellyourproduct?InternalMarketorExport.Ifyousellintheinternalmarket,whereortowhomyousellyourproduct:_______________________________________________________________________Whatpricedoyougetper/kgofpineapple:______________________________Othercrops:Howdoyoupackordistributeyourproduct:Bulkdistributedinyourcar/PackedinboxesreadyforexportIfyouexport,doyouownorrentapackingstation?YesorNo.Ifyouselltoadistributor,whatcompany:_________________________________________Doyouhaveacontract?YesorNo.Dotheygiveyouafixedprice:YesorNoPriceofkg/pineapple:________________________
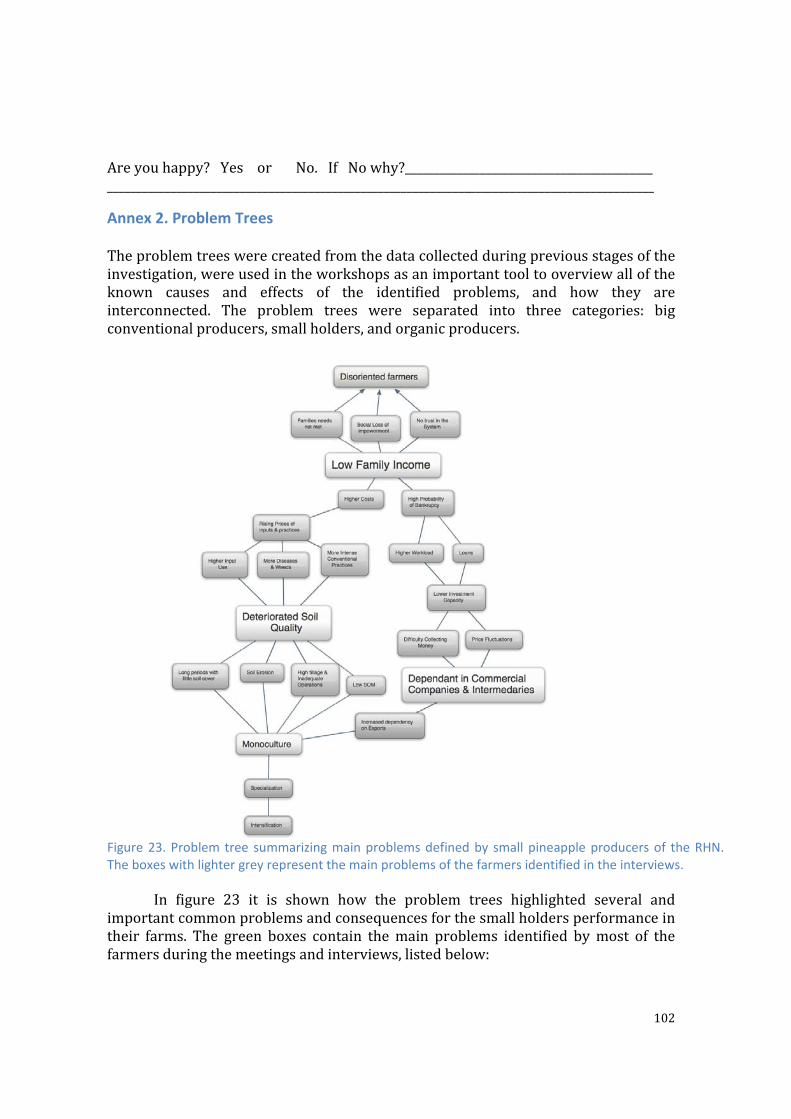
102
Areyouhappy?YesorNo.IfNowhy?__________________________________________________________________________________________________________________________________________
Annex 2. Problem Trees Theproblemtreeswerecreatedfromthedatacollectedduringpreviousstagesoftheinvestigation,wereusedintheworkshopsasanimportanttooltooverviewalloftheknown causes and effects of the identified problems, and how they areinterconnected. The problem trees were separated into three categories: bigconventionalproducers,smallholders,andorganicproducers.
In figure 23 it is shown how the problem trees highlighted several andimportantcommonproblemsandconsequencesforthesmallholdersperformanceintheir farms. The green boxes contain themain problems identified bymost of thefarmersduringthemeetingsandinterviews,listedbelow:
Figure 23. Problem tree summarizing main problems defined by small pineapple producers of the RHN.The boxes with lighter grey represent the main problems of the farmers identified in the interviews.
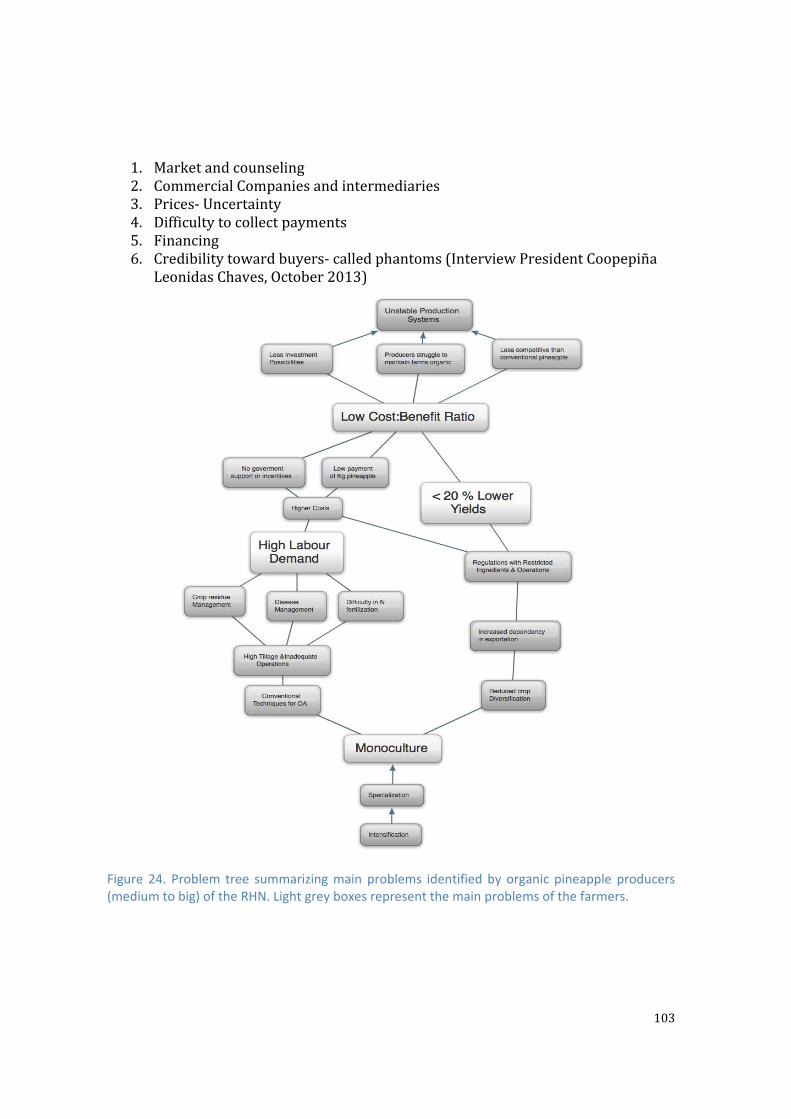
103
1. Marketandcounseling2. CommercialCompaniesandintermediaries3. Prices‐Uncertainty4. Difficultytocollectpayments5. Financing6. Credibilitytowardbuyers‐calledphantoms(InterviewPresidentCoopepiña
LeonidasChaves,October2013)
Figure 24. Problem tree summarizing main problems identified by organic pineapple producers (medium to big) of the RHN. Light grey boxes represent the main problems of the farmers.
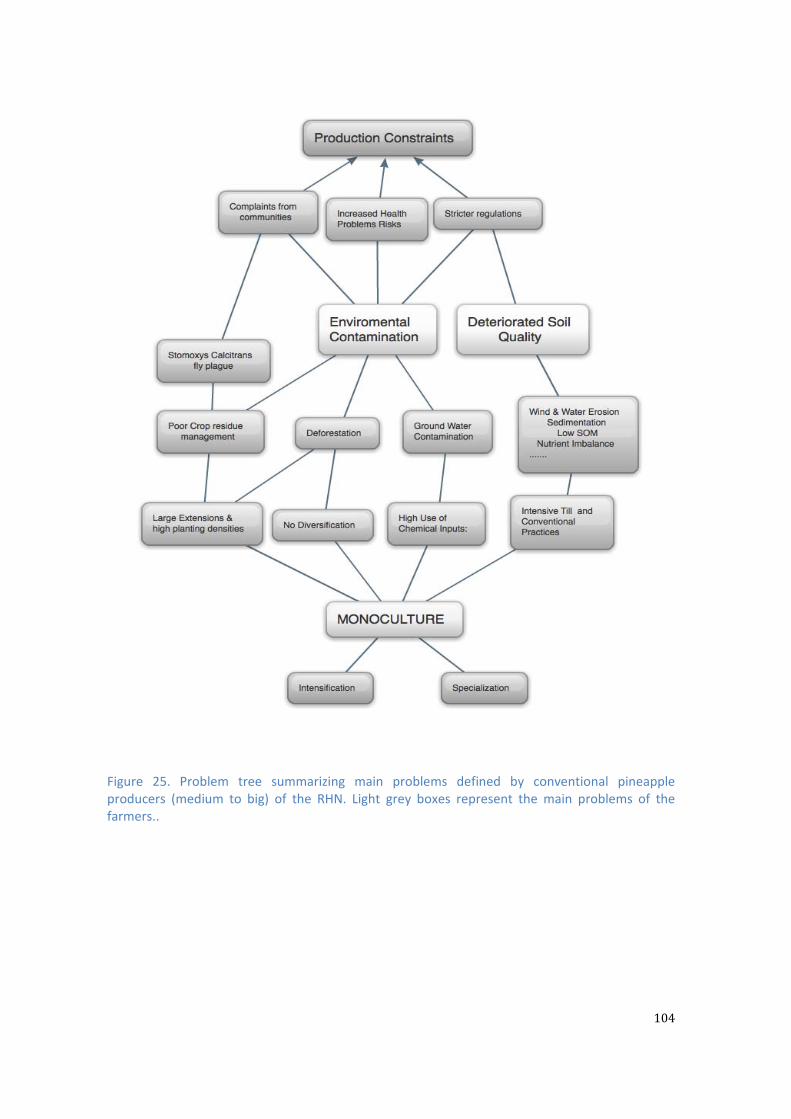
104
Figure 25. Problem tree summarizing main problems defined by conventional pineapple producers (medium to big) of the RHN. Light grey boxes represent the main problems of the farmers..

105
Annex 3. Work shop Agenda
Schedule Activity Methodology Materials Coordinator Result
9:00‐9:30am Introduction to the Agenda
Provide a brief power point presentation as an
introduction. Each person will have a copy of the
agenda. Tables according to color groups, which each person will be granted,
previously. Wanted groups will have players who can contribute to finding
solutions to each other. Markers and ballots for Workgroups surrender.
‐Agenda printed ‐Projector ‐Big papers ‐Markers
Maria Pia Gamboa Submit actors day
schedule. Delivery of material.
9:30‐10:30 am Problem trees Presentation
1. Trees are presented in a power point presentation. Then comments or feedback changes would be made.
‐ Projector María Pia Gamboa
Share the results found during the first phase of research. Confirmation of effects and causes of problem trees by the
producers, these reflect reality?
10:30‐10:45am COFFEE BREAK
10:45‐12:00am
Solutions Round‐Table
present results
discussion
1. Subsequently be separated into different groups. It would give
between separate groups: large producers, small, and
medium. These workshops will be to find the best solutions for the problems in order of importance. They seek to
find who might be responsible, who can
support them and a period to implement these
solutions.
2. Presentation and discussion with everyone
present.
‐Markers and big papers
Moderator: María Pia Gamboa
12:00‐12:30
Introducing new possible production designs
Short presentation of the plans and important actors. Share EOSTA commitment
and the University of Wageningen in the project and interest in research,
training and future producers find they can
handle organ systems to sell organic produce to the
company.
María Pia Gamboa
Describe the plan for future research and
potential business plans organic productions.
12:30‐1:30pm LUNCH
106
1:30pm‐2:15pm
Introducing new possible production designs
Second Part
Power point presentation of possible future production
designs. At least 3 productive designs in order to receive feedback from farmers is presented. You need to receive all relevant
observations to achieve in the future do a business plan suitable for producers and importers. Systems that meet quality, capacity and
diversity necessary.
‐Markers and big papers
María Pia Gamboa
Receive feedback of producers and actors. As the project you may
be interested and organic production process and know which crops are comfortable. Production
management andorganization of producers.
1:45‐2:15pm
Interest and research needs.
Organic and conventional
Sector
Presentation and introduction of the first
research topic planned via this project.
Compost and organic
fertilizers through waste residue of pineapple.
María Pia Gamboa and Fabián Calvo a senior at EARTH
University
Discussion of the need for research in the field, mainly in organic issues that can influence in
finding more sustainable solutions
for all sectors.
Discuss and present possible research topics
to improve the pineapple production or alternative mentioned
in the project.
2:15‐2:30
CLOUSURE & QUESTIONS
Annex 4. Work shop Attendants
Name Organization/Institution StakeholderPositionXinia Solano MAOCO/Organic Organic ProducerCarlos Víquez Organic Producer Organic ProducerAndrés Núñez GeneralManagerCoorsicanaPineappleFarm Organic CompanyProducerRigoberto InputManagerCoorsicanaPineappleFarm OrganicCompanyProducerFabián Calvo EARTHUniversity4thyearstudent InvestigatorWalter Rossing Universidad Wagenignen FSE Group InvestigatorJuan Carlos Arias
Representative of EOSTA in Costa Rica Exporter
Henk Zoutwelle
BuyerofPineappleforEOSTAintheNetherlands
Importer
Daniel Herrera OrganicProducer‐EARTHUniversity ProducerAlberto Chinchilla
OrganicConsulterL.A OrganicProducer
Arturo PITTA Piña Investigator
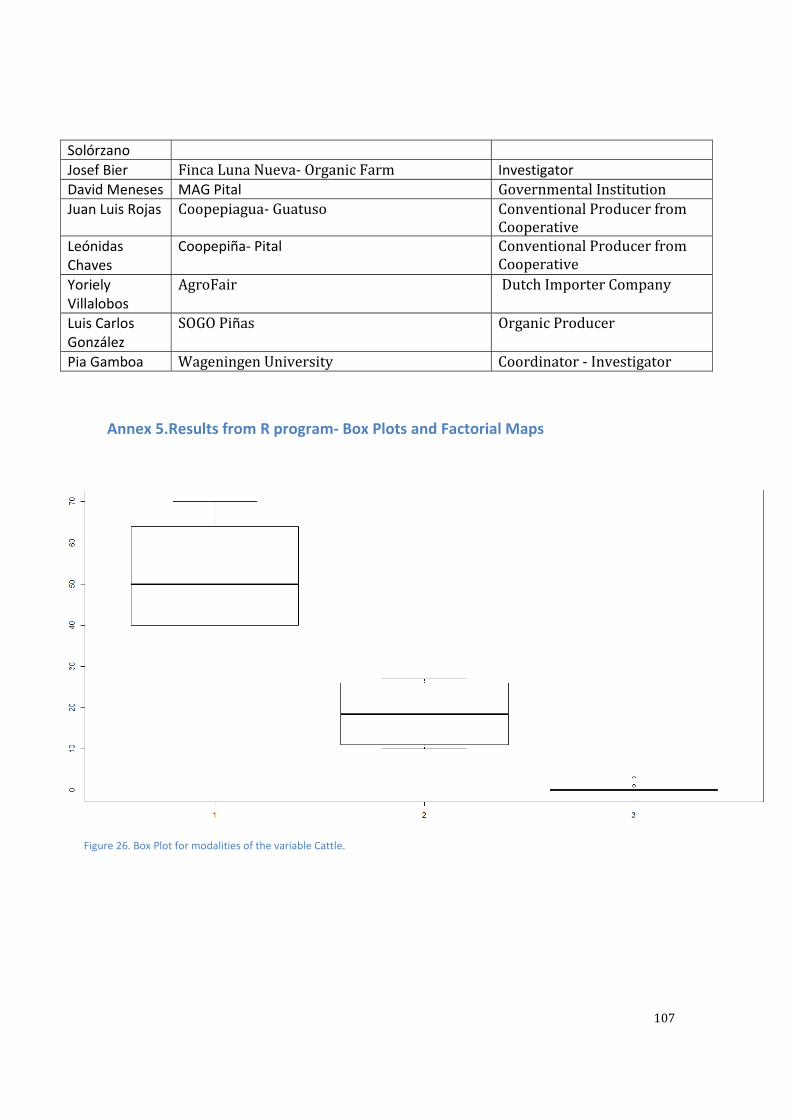
107
Solórzano Josef Bier FincaLunaNueva‐OrganicFarm InvestigatorDavid Meneses MAG Pital GovernmentalInstitutionJuan Luis Rojas Coopepiagua‐Guatuso ConventionalProducerfrom
CooperativeLeónidas Chaves
Coopepiña‐ Pital ConventionalProducerfromCooperative
Yoriely Villalobos
AgroFair DutchImporterCompany
Luis Carlos González
SOGOPiñas OrganicProducer
Pia Gamboa WageningenUniversity Coordinator‐Investigator
Annex 5.Results from R program‐ Box Plots and Factorial Maps
Figure 26. Box Plot for modalities of the variable Cattle.

108
Figure 27. Box Plot for modalities of the variable Cultivated Ratio.
Figure 28. Box Plot for modalities of the variable Famratio.
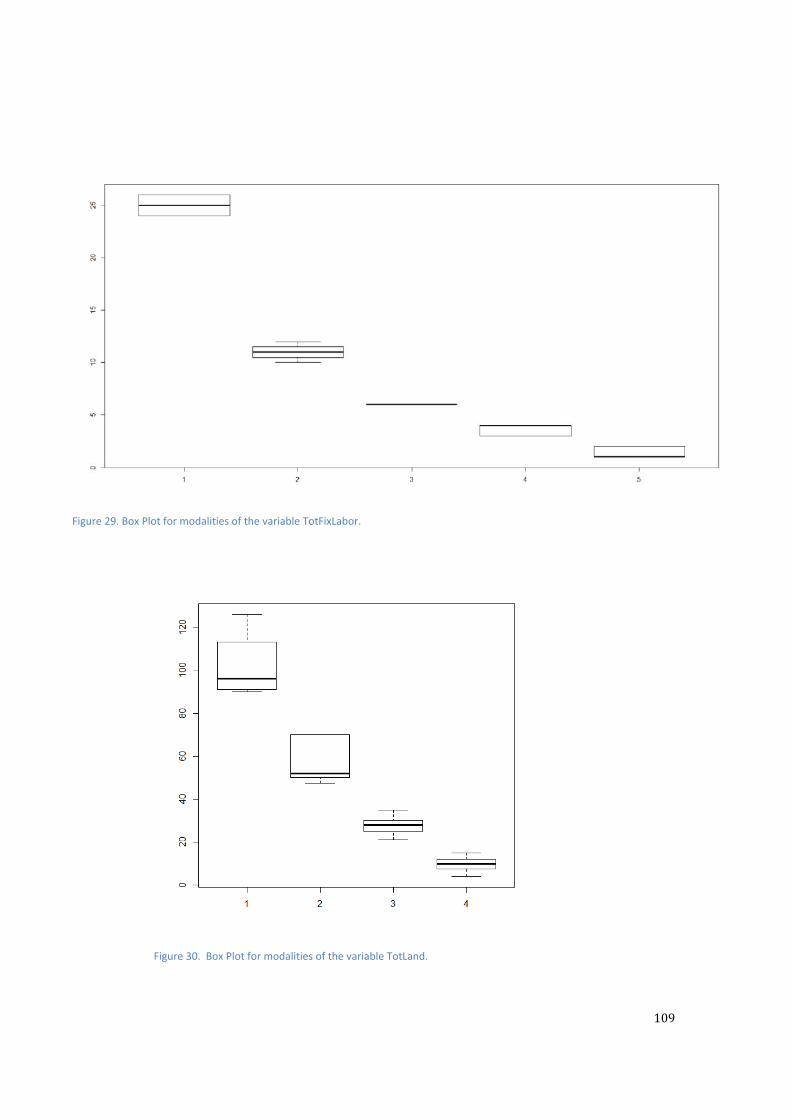
109
Figure 29. Box Plot for modalities of the variable TotFixLabor.
Figure 30. Box Plot for modalities of the variable TotLand.
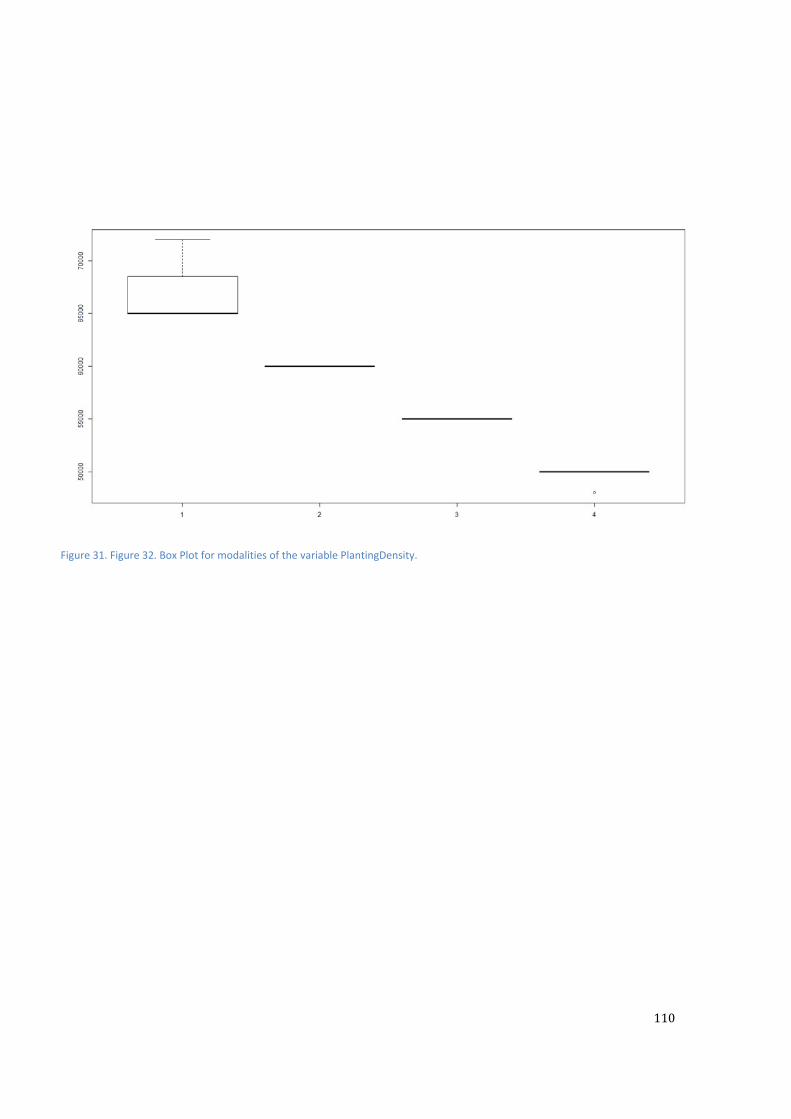
110
Figure 31. Figure 32. Box Plot for modalities of the variable PlantingDensity.
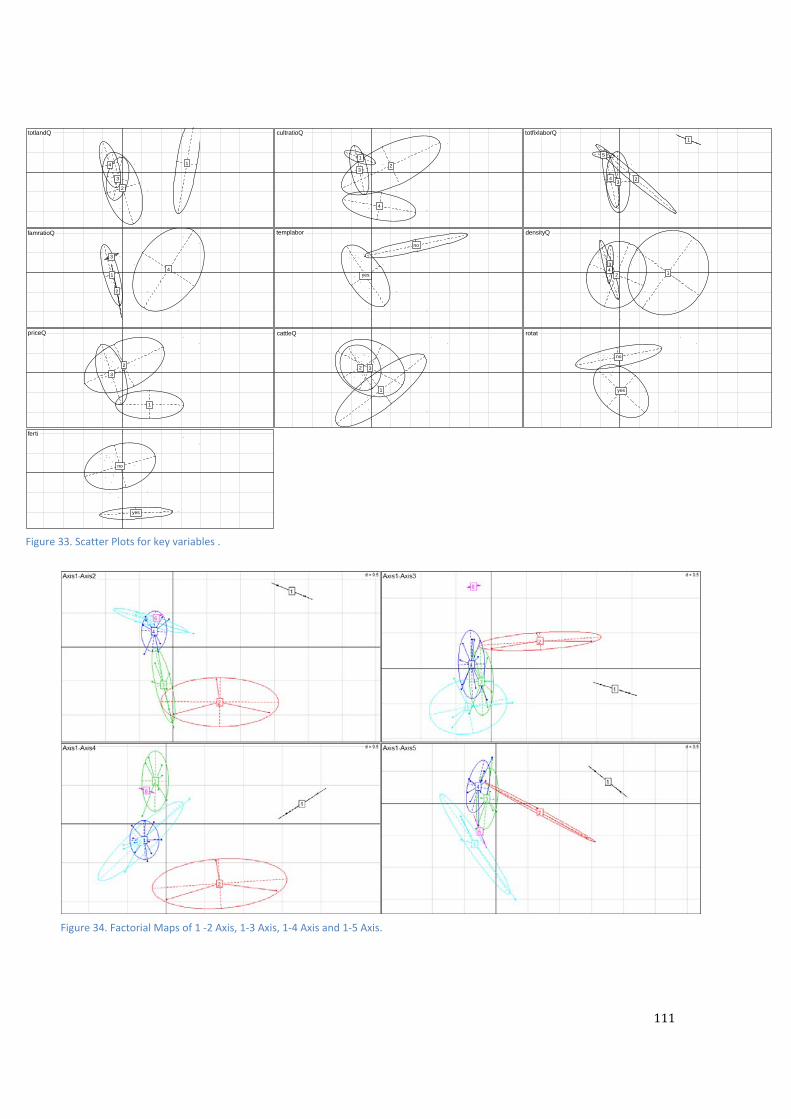
111
totlandQ ●
●
●
●
●
●
●
●
●
●
●
●
●
●
●●
●●
●
●
●●
●
●●
●
●
●
1
2
3
4
cultratioQ
●
●
●
●
●
● ●
●
●
●
●
●
●
●
●
●●
●
●
●
●
●
●
●
●
●
●
●
1
2 3
4
totfixlaborQ ●
●
●
●
●
●
●
●●
●
●
●
●
●
●
●
●
●●
●●
●
●
●●
●
●
●
1
2 3
4
5
famratioQ
●
●
●
●
●
●
●
●
●
●●
●
●
●
●
●
●
●
●
●
●●
●
●
●
●
●
●
1
2
3
4
templabor ●
●
●
●
●
●
●
●
●
●
●
●
●
●
●
●
●
●
●
●●
●
●
●
●
●
●
●
no
yes
densityQ
●
●
●
●
●
●
●
●
●
●
●
●
●●
●
●
●
●
●
●
●
●
●
●
●
●
●
●
1 2
3 4
priceQ
●
●●
●
●
●
●
●
●
●
●
●
●
●●
●
●
●
●
●
●
●●
●
●
●
●
●
1
2
3
cattleQ
●
●
●
●
●
●
●
●
●
●
●
●
●
●
●
●
●
●
●
●
●●
●
●
●●
●
●
1
2 3
rotat
●
●
●
●
●
●
●
●
●
●
●
●
● ●
●
●
●
●
●
●
●
●
●●
●
●
●
●
no
yes
ferti
●
●
●
●
●
●
●
●
●
●
●
●
●
●
●
●
●●
●
●
●
●
●
●
●●
●
●
no
yes
Figure 33. Scatter Plots for key variables .
Figure 34. Factorial Maps of 1 ‐2 Axis, 1‐3 Axis, 1‐4 Axis and 1‐5 Axis.