Embed Size (px)
Citation preview

PhD Thesis
ENVIRONMENTAL SUSTAINABILITY ANALYSIS OF WATER
FOOTPRINTS OF PESHAWAR BASIN PAKISTAN
BY
TARIQ KHAN
DEPARTMENT OF ENVIRONMENTAL SCIENCES
UNIVERSITY OF PESHAWAR
(2013-2014)
PhD Thesis
ENVIRONMENTAL SUSTAINABILITY ANALYSIS OF WATER
FOOTPRINTS OF PESHAWAR BASIN PAKISTAN
BY
TARIQ KHAN
RESEARCH SUPERVISOR
PROFDR HIZBULLAH KHAN
DEPARTMENT OF ENVIRONMENTAL SCIENCES
UNIVERSITY OF PESHAWAR
(2013-2014)
Say Have you considered if your water was to become sunken [into
the earth] then who could bring you flowing water
(The Holy Quran 6730)
ii
CONTENTS Page No
Acknowledgementhelliphelliphelliphelliphelliphelliphelliphelliphelliphelliphelliphelliphelliphelliphelliphelliphelliphelliphelliphelliphelliphelliphelliphelliphelliphelliphelliphellipv
List of Tableshelliphelliphelliphelliphelliphelliphelliphelliphelliphelliphelliphelliphelliphelliphelliphelliphelliphelliphelliphelliphelliphelliphelliphelliphelliphelliphelliphellipvii
List of Figures helliphelliphelliphelliphelliphelliphelliphelliphelliphelliphelliphelliphelliphelliphelliphelliphelliphelliphelliphelliphelliphelliphelliphelliphelliphelliphelliphellipviii
List of Abbreviationshelliphelliphelliphelliphelliphelliphelliphelliphelliphelliphelliphelliphelliphelliphelliphelliphelliphelliphelliphelliphelliphelliphelliphelliphelliphelliphelliphellipix
Summaryhelliphelliphelliphelliphelliphelliphelliphelliphelliphelliphelliphelliphelliphelliphelliphelliphelliphelliphelliphelliphelliphelliphelliphelliphelliphelliphelliphelliphelliphelliphelliphelliphellipx
1 Introduction
11 Background 1
12 Problem Statement 2
13 Scope and Goal of the study 3
131 Scope 4
132 Goal 4
14 Description of study area 4
141 Climate 5
142 Irrigation system 5
143 Agriculture cropsproducts 5
144 Industries 6
145 Rivers flowing through Peshawar Basin 6
1451 Kabul River 6
1452 Chitral River 7
1453 Swat River 7
15 Dams on Kabul River and its tributaries 8
16 Hydrology of Kabul River 9
17 Fish of Kabul River 9
18 Water Footprint Assessment Approach 9
19 Specific objectives of the study 10
110 Data Sources 11
111 Thesis outline 11
2 Literature review
21 Concepts and Definitions 12
22 Water Footprint of River Basins Global Context 12
23 Specific river basins studies 14
24 Water Resources Situation in Pakistan 18
iii
25 Water Pollution in Kabul River Case Studies 18
3 Blue and green water footprint of agriculture in Peshawar Basin Pakistan
31 Abstract 23
32 Introduction 24
33 Study area 25
34 Data and method 26
35 Methods 27
351 Simulation of crop growth and Soil water balance 27
352 Water Footprint Assessment 28
36 Results 29
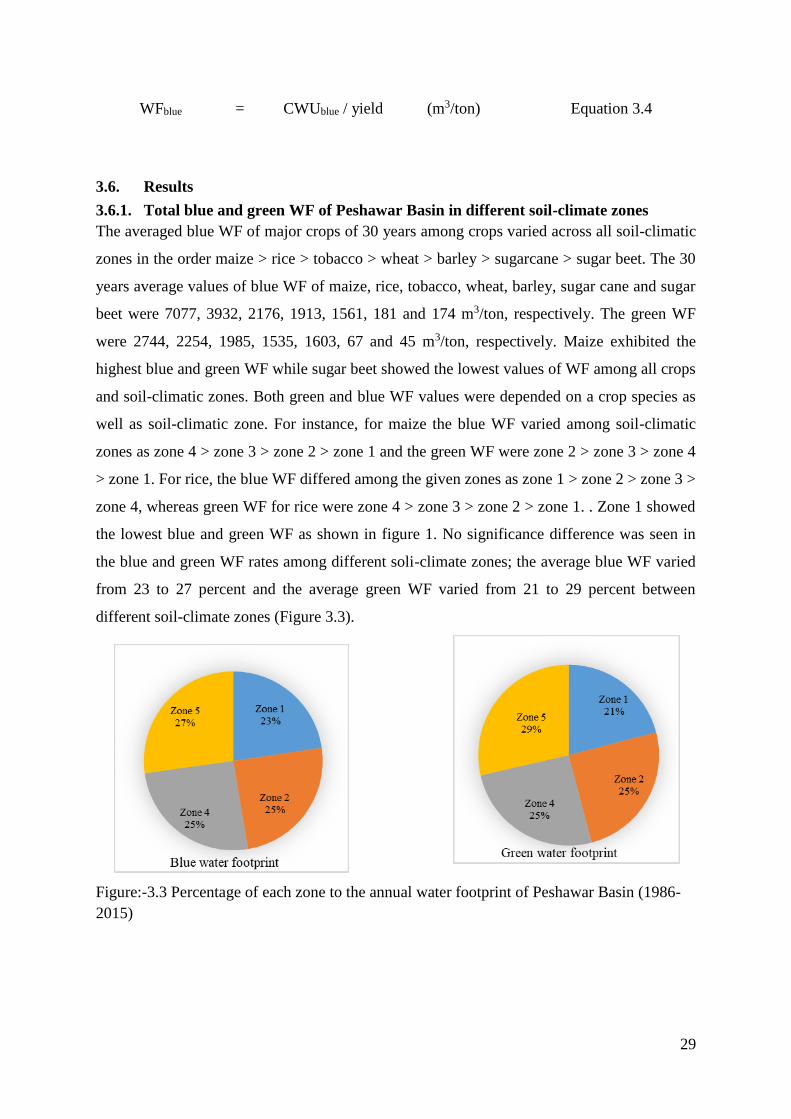
361 Total blue and green WF of Peshawar Basin in different soil-climate zones 29
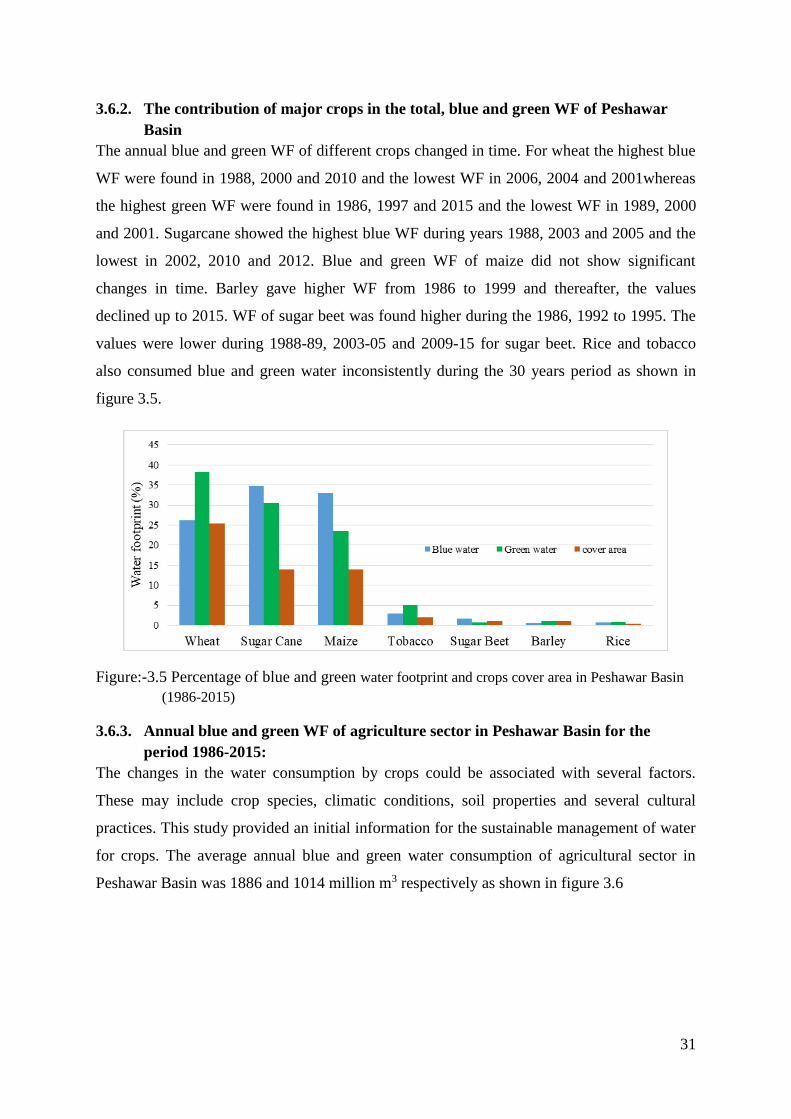
362 The contribution of major crops in the total blue and green WF 31
363 Annual blue and green WF of agriculture sector in Peshawar Basin 1986-2015 31
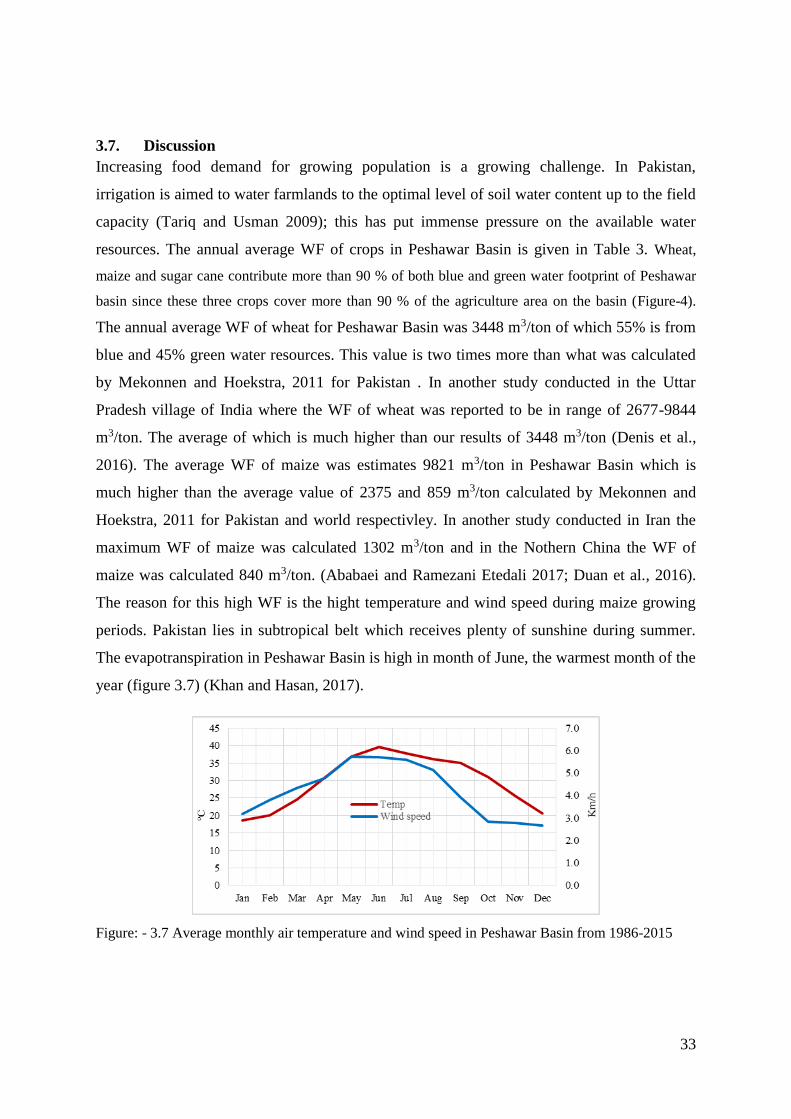
37 Discussion 33
4 Environmental sustainability of blue and green water footprint in Peshawar
Basin Pakistan
4 1 Abstract 35
4 2 Introduction 36
4 3 Method and material
43 1 Water balance of Peshawar Basin 37
432 Blue water availability (WAblue) 39
433 Blue water footprint (WFblue) 39
434 Green water availability (WAgreen) 39
435 Green water footprint (WFgreen) 40
436 Environmental sustainability of WFblue 40
437 Environmental sustainability of WFgreen 40
44 Results 42
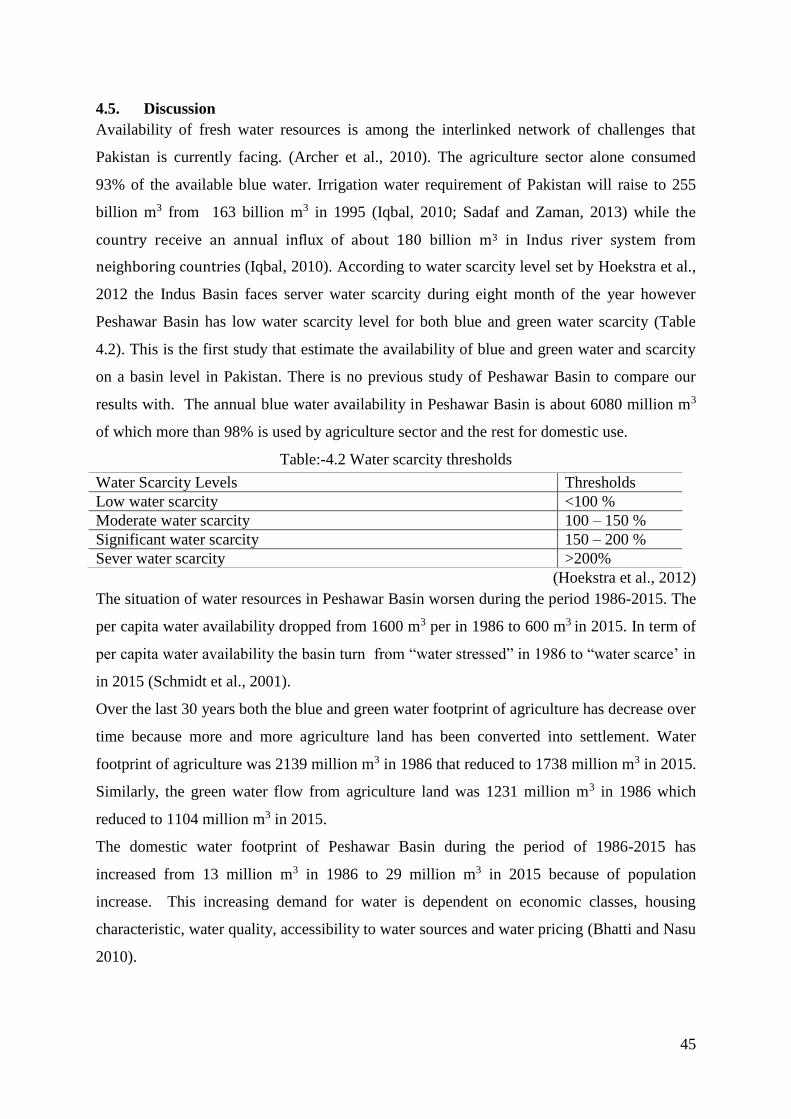
45 Discussion 45
5 Environmental sustainability of grey water footprints in Peshawar Basin
scenarios for current and future reduced flow in Kabul River
5 1 Abstract 46
5 2 Introduction 47
5 3 Materials and Methods 49
iv
53 1 Grey water footprint 49
53 2 Environmental sustainability of grey water 50
53 3 Reduced runoff scenarios 50
5 4 Data description 50
5 5 Results 51
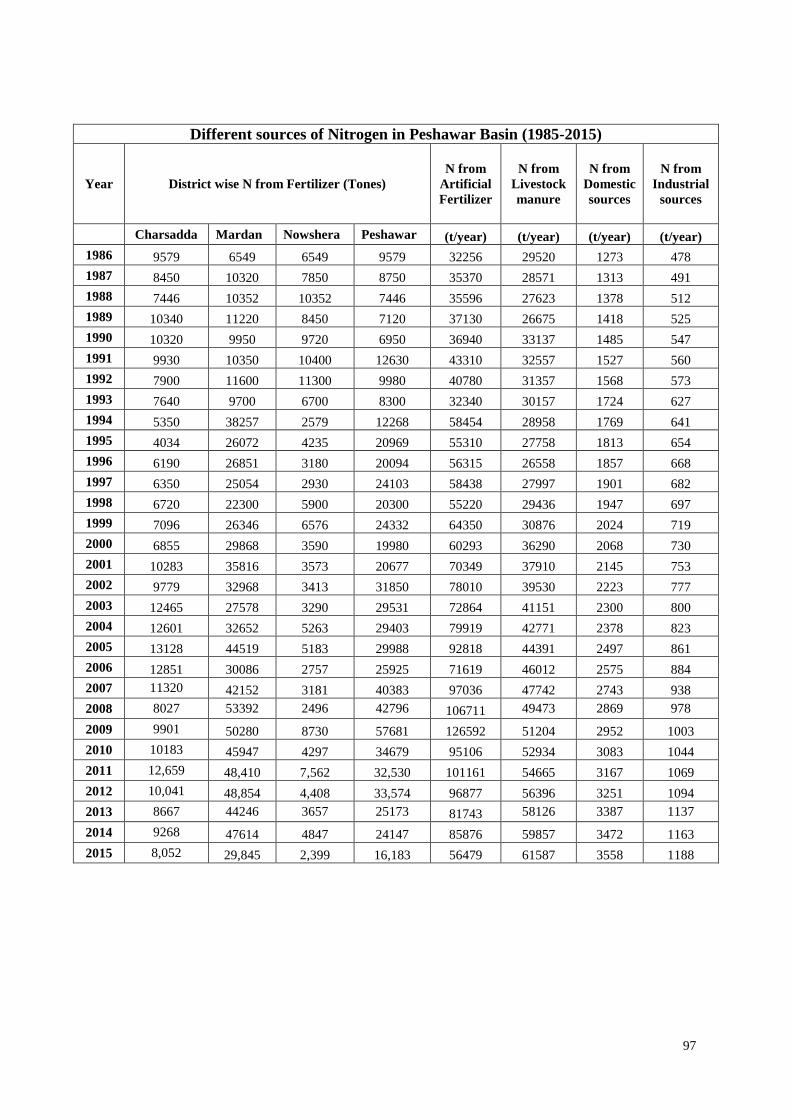
551 Application of N and P fertilizers in Peshawar Basin 51
552 N and P loads from livestock manure 52
553 WFgrey of N and P 53
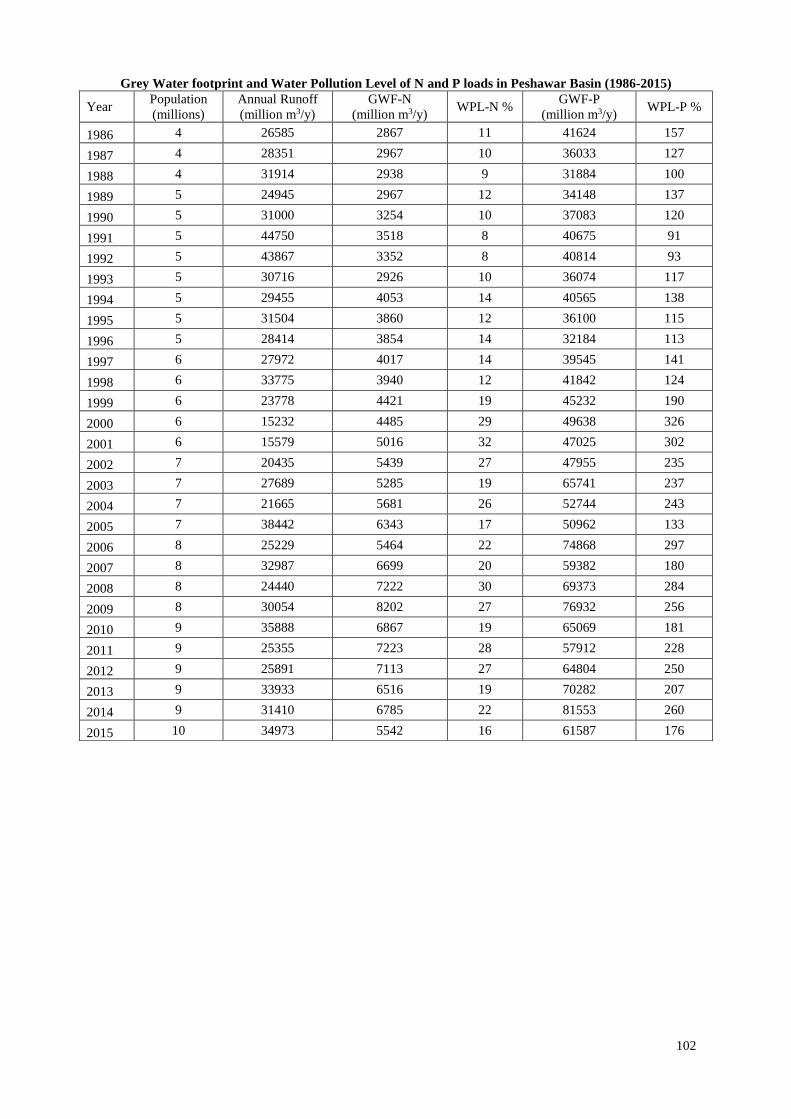
554 WPL of N and P 54
555 WPL for reduced runoff scenarios 54
56 Discussion 55
6 Conclusions and recommendations
6 1 Conclusion 57
6 2 Recommendations 59
Referenceshelliphelliphelliphelliphelliphelliphelliphelliphelliphelliphelliphelliphelliphelliphelliphelliphelliphelliphelliphelliphelliphelliphelliphelliphelliphelliphelliphellip57
Appendixhelliphelliphelliphelliphelliphelliphelliphelliphelliphelliphelliphelliphelliphelliphelliphelliphelliphelliphelliphelliphelliphelliphelliphelliphelliphelliphelliphelliphellip73
v
Acknowledgements
All glory is for ALLAH the most Merciful and Beneficent who gave me patience
vehemence and ability to accomplish this study and all respect to His last and final
messenger The Prophet Muhammadصلى الله عليه وسلم Who is a final source of knowledge and guidance for
the entire mankind
First of all I want to thanks my supervisor Dr Hizbullah Khan Professor Department of
Environmental Sciences University of Peshawar Pakistan for his kind support and guidance
during the entire period of my PhD I would like to acknowledge my foreign supervisor Dr
Arjen Y Hoekstra Professor Department Water Engineering and Management The
University of Twente The Netherlands for allowing me to work in his research group and Dr
Martijn J Booij Associate Professor Department Water Engineering and Management The
University of Twente The Netherlands my daily supervisor without whom I may have not
been able to accomplish this research
I must acknowledge the financial support of the Higher Education Commission of Pakistan
through IRSIP fellowship for my stay at the University of Twente The Netherlands I am
thankful to external evaluators and internal viva examiners for their kind suggestions to
improve the quality of research presented in this thesis My gratitude goes to Dr Abdullah
Khan Assistant Professor and Head Department of Environmental University of Haripur
Pakistan for facilitating me during the entire period of my PhD program
I have many colleagues to thank Thanks to Dr Zia ur Rahman and Mr Salman Khan for
having best conversation partners during my entire course of PhD study Also thanks to Dr
Khursheed Mr Muhammad Fawad Mr Muhammad Ayaz Khan Ms Naureen Aurangzeb
Dr Muhammad Khurshid Dr Alia Naz Dr Hajira Haroon and Dr Wisal Shah whose moral
support always boosted my energies
I am highly obliged to my teachers in Department of Environmental Sciences University of
Peshawar Pakistan who appreciated the compilation of this Thesis I am thankful to Dr
Muhammad Irshad Professor and Chairman Department of Environmental Sciences
COMSATS University Islamabad Abbottabad Campus and Dr Qaiser Mahood Associate
Professor Department of Environmental Sciences COMSATS University Islamabad
Abbottabad Campus Dr Ihsan Ullah Assistant Professor Department of Geography
vi
University of Peshawar Pakistan and Dr Saad Khan Head Department of Geology Bacha
Khan University Charsadda Pakistan for their support and input in my thesis
Special thanks are extended to Dr Joep Schyns Dr Hamideh Nouri and Hatem Chouchane
Department of Water Engineering and Management University of Twente The Netherlands
for their support and guidance My sincere thanks to Mr Afzal Hussain and his family
especially Zakia Hussain for their forbearance helpful and enjoyable company during our
stay in Enschede The Netherlands
Life outside the office environment has been a joy with many milestone in the past five years
Thanks to all my friends and family for this I canrsquot find the words to express my gratitude for
the unconditional love care and prayers of my parents brothers and sisters Thanks to my
wife for being the love of my life and a superb mother and wife Thanks Eishaal Khan for
being the amazing little girl that you are You two are the best part of my life and a consistent
source of inspiration for me that help me in every move of my life
Tariq Khan
vii
LIST OF TABLES
Table Title Page
11 Potential new site for dam construction on Kabul River Basin in
Afghanistan
3
12 Water footprint assessment setting 4
21 Water footprint methodologies used for sustainable water resources 21
31 Temperature precipitation and evapotranspiration in Peshawar
Basin
24
32 Average blue and green water footprint of main crops and total
water footprint of crop production in Peshawar Basin (1986-2015)
33
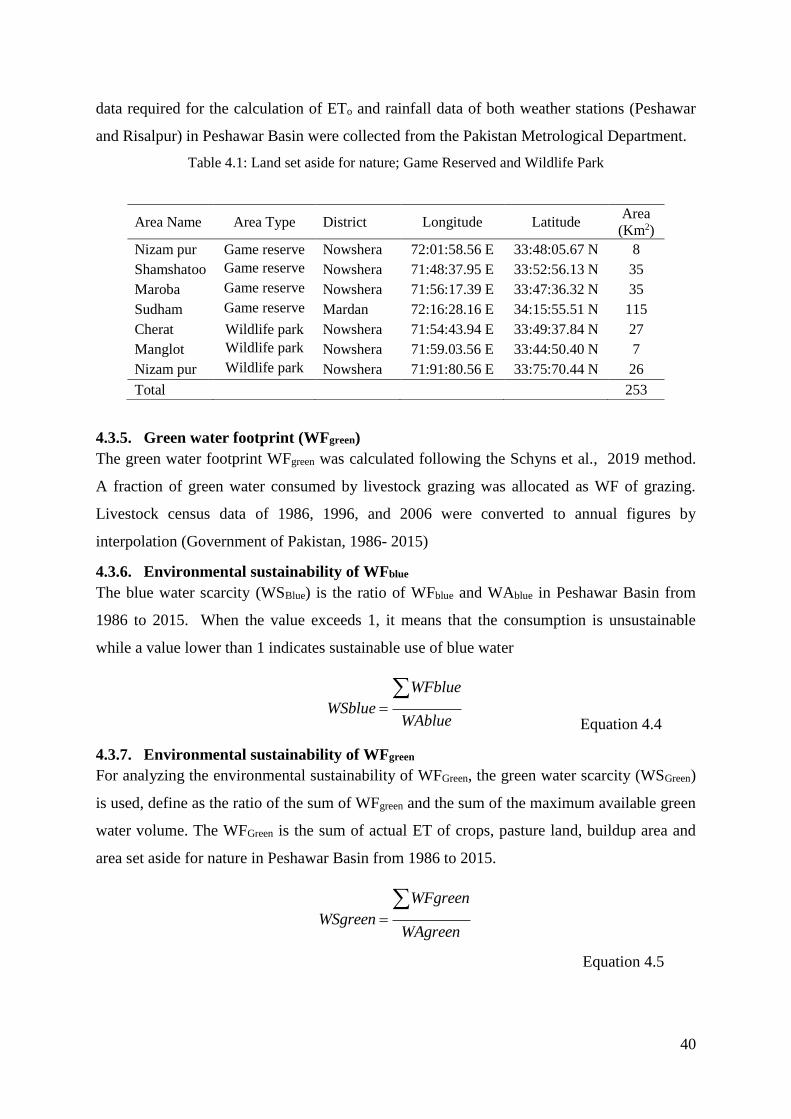
41 Land set aside for nature game reserved and wildlife park 39
42 Water scarcity thresholds 44
51 Water pollution studies on Kabul river in Peshawar Basin in
Pakistan
48
52 Slaughtered weight and N and P contents in various livestock
categories
49
viii
LIST OF FIGURES
Figure Title Page
11 Storage option of Kabul River Basin in Afghanistan 3
12 Peshawar Basin in Pakistan 11
31 Map of Peshawar Basin 24
32 Soil-climate zones of Peshawar Basin
26
33 Percentage of each zone to the annual water footprint of Peshawar Basin
(1986-2015)
28
34 Annual water footprint of crops in different soil-climate zones of Peshawar Basin
(1986-2015)
29
35 Percentage of blue and green water footprint and crops cover area in Peshawar
Basin (1986-2015) 30
36 Mean annual blue green and total WF of major crops in Peshawar Basin
(1986-2015)
31
37 Average monthly air temperature and wind speed in Peshawar Basin from 1986-2015
32
41 Land cover change in Peshawar Basin from 1986-2015 40
42 Annual availibility of blue water in Peshawar Basin (1986-2015 42
43 Annual green water flow from various sources in Peshawar Basin (1986-2015)
42
44 Blue WF and per capita blue water availability in Peshawar Basin (1986-2015)
42
45 Percentage of green water flow (A) and Percentage of blue water supply (B) in
Peshawar Basin (1986-2015) 43
46 Blue and green water scarcity in Peshawar Basin (1986-2015 43
51 Kabul river passing through Peshawar Basin in Pakistan 46
52 Application of N and P in Peshawar Basin from 1986-2015 (tonsyear 51
53 Input of N and P by different livestock in Peshawar Basin (average of 30
years) 51
54
Source to WFgrey () in Peshawar Basin (30 years average) (A) nitrogen (B)
phosphorus
52
55 5 N and P-related WFgrey in Peshawar Basin during 1986-2015 52
56 WPL in Kabul River of Peshawar Basin during 1986-2015 53
57
N and P related WPL for five different reduced-runoff scenarios in Peshawar
Basin
54
ix
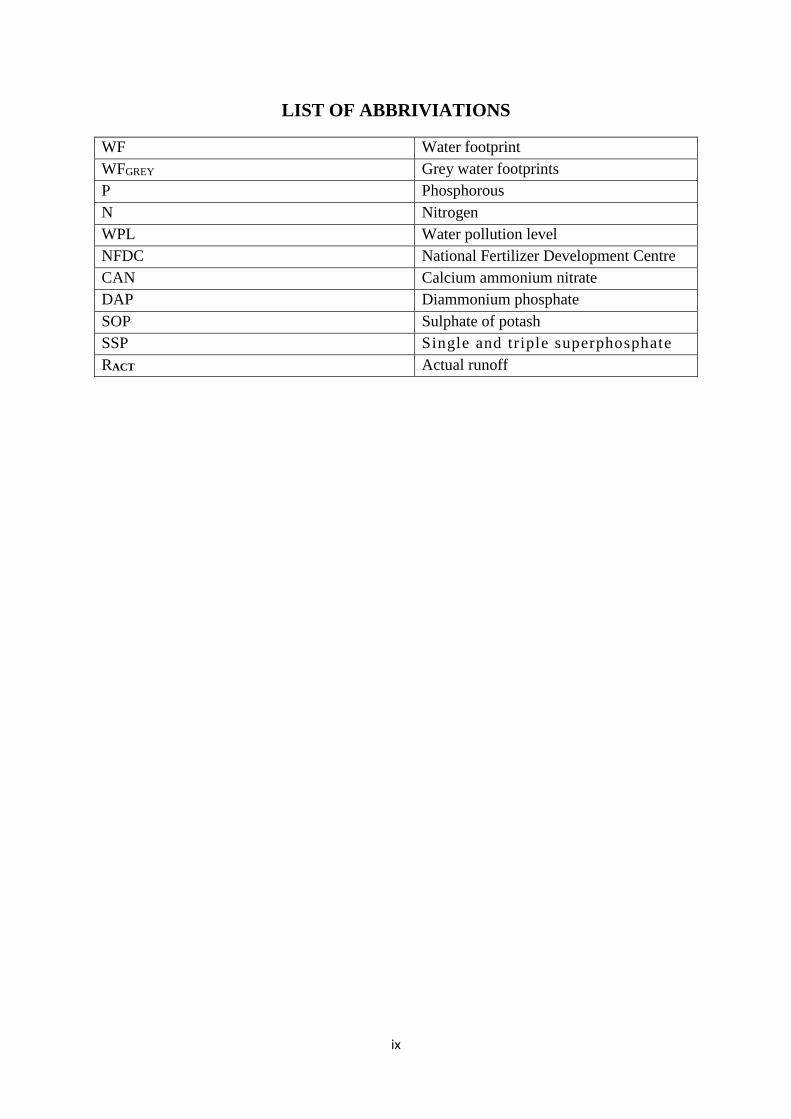
LIST OF ABBRIVIATIONS
WF Water footprint
WFGREY Grey water footprints
P Phosphorous
N Nitrogen
WPL Water pollution level
NFDC National Fertilizer Development Centre
CAN Calcium ammonium nitrate
DAP Diammonium phosphate
SOP Sulphate of potash
SSP Single and triple superphosphate
RACT Actual runoff
x
SUMMARY
Water is a fundamental resource for sustainable social and economic development of any
country Freshwater resources are becoming scarce due to inevitable demand for food
industrial development and growing urban and rural population Over the last few decades
demand for the agricultural products has been increased due to the population and economic
growth This has exerted immense pressure on the available water resources Pakistan is
located in the arid region of the world with an average annual rainfall less than 240 mm
Being an agriculture based economy the availability of fresh water is essential for
sustainable economic development The goal of this research was to analyze the
environmental sustainability of blue green and grey water footprint in Peshawar Basin during
the period 1986 to 2015 The basin is located in the northwest of Indus Basin at longitude of
710 15 and 720 45 E and latitude 330 45 and 340 30 N in Khyber Pakhtunkhwa province of
Pakistan that covers an area of 5617 km2 and has 978 million inhabitants Blue and green
water scarcity was selected as an indicator to assess the environmental sustainability of water
footprints Further the study was aimed to assess the potential impact of dam on Kabul river
water pollution The water pollution level was estimated under normal and reduced runoff
scenarios for an increased upstream use of water from Kabul River in Afghanistan
The annual blue and green water availability and scarcity was calculated following global
water footprint assessment standard during the period 1986-2015 and annual blue and green
water footprints of crops were estimated using AquaCrop model The AquaCrop output was
post-processed to separate incoming and outgoing water fluxes and soil water content into
blue and green water components considering blue water fluxes from irrigation and capillary
rise Consequently evapotranspiration (ET) originating from irrigation water capillary rise
and rainwater was tracked out Grey water footprints is used as an indicator to assess
environmental sustainability related to nitrogen (N) and phosphorus (P) pollution in Peshawar
Basin Pakistan The N and P pollutants load from artificial fertilizers animal manure
household and industrial sources were considered during 1986 to 2015
The results showed that per capita water availability dropped from 1700 m3 per in 1986 to
600 m3 in 2015 In terms of per capita water availability the basin has turned from ldquowater
stressedrdquo in 1986 to ldquowater scarcedrsquo in 2015 Further both the blue and green water footprint
of agriculture has decreased from 2139 million m3 in 1986 that reduced to 1738 million m3 in
xi
2015 Similarly the green water flow from agricultural land was 1231 million m3 in 1986
which reduced to 1104 million m3 in 2015 The domestic water footprint has increased from
13 million m3 in 1986 to 29 million m3 in 2015
The average of 30 years blue water footprint of maize rice tobacco wheat barley sugar
cane and sugar beet were 7077 3932 2176 1913 1561 181 and 174 m3ton respectively
The mean values of green water footprint were 2744 2254 1985 1535 1603 67 and 45
m3ton respectively The 30 years average annual blue water consumption of sugar cane
maize wheat tobacco sugar beet rice and barley was 655 623 494 57 32 14 and 11
million m3 respectively while green water was 308 236 391 52 8 8 and 11 million m3
respectively The average annual blue and green water consumption of agricultural sector in
Peshawar Basin was 1886 and 1014 million m3 respectively
Average of 30-years N-related WFgrey showed that artificial fertilizer contributed 61
livestock manure 36 household sources 2 and industries 1 while for P-related WFgrey
the contribution from artificial fertilizer livestock manure and household sources were 50
49 and 1 respectively Averaged 30-years N and P associated WFgrey of the basin were
50108 m3y and 50109 m3y respectively The water pollution level was estimated under
normal and reduced runoff scenarios for an increased upstream use of water from Kabul
River in Afghanistan N-related WPL was within the sustainability limit of 100 while P-
related WPL exceeded sustainable limits in every year under normal runoff and were worse
in each reduced runoff scenarios
This study shows that the blue and green water scarcity are less than 100 and are low water
scarcity level It provided a baseline information for the sustainability food security and
water productivity of crops This would be helpful for policy makers for efficient irrigation
management and water conservation in Peshawar valley The study further shows the
deterioration of water quality of Kabul River and the findings may be helpful for future
planning and management of the basin
1
CHAPTER NO 1
INTRODUCTION
11 Background
Over the last few decades demand for agriculture products industrial goods and domestic
human consumption have increased manifold due to increase in population This ever-
increasing population followed by upsurge economic growth have placed substantial load on
scarce water resources of the planet (Launiainen et al 2014) Freshwater is not only essential
for satisfying direct human needs but for agriculture productions and industrial processes as
well (Cazcarro et al 2014 Lee 2015) In view of the scarcity and overexploitation water is
becoming more precious and prized resource than ever (Van Oel and Hoekstra 2012 Zhang
et al 2013) Fresh water resources are limited in space and time (Dessu et al 2014) and
greatly threatened by human activities (Vorosmarty et al 2010) Globally one third of
human population is living in water scarce areas with a forecast of two-third by 2025 (UN
2014 Dessu et al 2014) International council for science and world federation of
engineering organization has predicted that there will be worldwide water crisis by 2050 due
to the increase in population pollution and impact of climate change and because of these
reasons there will be more stress on available water resources (Malley et al 2009)
United Nation (2012) claimed that 800 million people lacks access to safe and clean water
and 2 billion people around the globe have no proper sanitation available (Falconer et al
2012) Reports claim an increasing trend of water scarcity worldwide and release of
pollutants in water bodies make them unsafe for use (Yang et al 2003 Pellicer et al 2016)
Pakistan has predominantly arid and semi-arid climate and ratio between current population
and available water resources has turned Pakistan into water stress country (Government of
Pakistan 2014) In these climatic regions river basins are facing issues like drying up of
rivers decline in water table and water pollution (Vorosmarty et al 2010) Pakistan has
exhausted all of its available water resources and like many developing countries has been
facing sever water shortage and water pollution problem (Azizullah et al 2011) It has been
reported that in Pakistan over 50 million people donrsquot have access to safe drinking water and
about 74 million people lack proper sanitation Further the availability of water per capita
has dropped from 5000 m3 in 1950 to less than 1500 m3 in 2009 hence the country may
become water scarce by 2035 (Bisht 2013)
Only 1 of industries are treating waste before disposal approximately 45 x 109 m3 of
wastewater per annum produced is released in rivers and open areas Kabul River daily
2
receive a load of 80000 m3 effluents directly from industrial and domestic sources since
water waste water treatment plants have been damaged during 2010 extreme flood (Khan et
al 2012 EPA-KP 2014)
Water being very basic and fundamental scarce natural resource if not used sustainably and
managed properly can have profound economic social and environmental consequences
(Ridoutt and Pfister 2010) and therefore effective management and good governance of
water resources have emerged as key concern in terms of real sustainability indicator around
the globe in order to keep a balance in ecosystem protection and human use of resources
(Adeel 2004)
12 Problem Statement
Peshawar Basin is a sub-basin of Indus River Basin It extended from 710 15 to 720 45 East
longitude and from 330 45 to 340 30 North latitude in the province of Khyber Pakhtunkhwa
Pakistan Kabul River is the main river flowing through Peshawar Basin that originates from
Unai Pass of Hindukush Mountains in Afghanistan It runs approximately 700 km distance
from Unai pass up to Indus River The river flows about 560 km in Afghanistan and 140 km
in Pakistan The river has been shared by Pakistan and Afghanistan and to date there has been
no agreement between the two countries to regulate water like The Indus Water Treaty
(Salman 2008 and Ali 2015) The Government of Afghanistan has developed a
comprehensive future plan for power generation and irrigation on Kabul River (Table 11
Figure 11) (World Bank 2010 Mustafa 2016) Consequently flow to Peshawar Basin will
get reduced that would have impact on both the quality and quantity of available water
resource of Peshawar Basin There has been no study on the capacity of Kabul River to
assimilate pollutants load and downstream impacts of future reduced flow on water quality
and quantity as a result of construction of dams in Afghanistan It is therefore important to
study the environmental sustainability of water resources in Peshawar Basin for current and
future reduced flow both in term of quality and quantity
3
Table - 11 Potential New Site for Dam Construction in Kabul River Basin in Afghanistan
Name of subbasin of Kabul
River Basin in Afghanistan
Location
code
Dam
height
(m)
Gross
storage
(Mm3)
Live
storage
(Mm3)
Installed
capacity
MW
Capital cost
(MUS$)
Panjshir subbasin
Totumdara R8 135 410 340 NA 332
Barak R9 155 530 390 100 1174
Panjshir I R10 180 1300 1130 100 1078
Baghdara R11 40 400 330 210 607
Logar Upper Kabul subbasin
Haijan R12 50 220 200 NA 72
Kajab R2 85 400 365 NA 207
Tangi Wardag R4 65 350 300 NA 356
Gat R7 20 500 440 NA 51
Lower Kabul subbasin
Sarobi II (run of the river) R16B 200 NA NA 210 442
Laghman A R17 No data 405 288 44 1251
Konar A R19 No data 1212 1010 366 948
Konar B (run of the river) R20 No data NA NA 81 232
Kama (run of the river) R21 No data NA NA 60 115
Figure-11 Storage Option of Kabul River Basin in Afghanistan (World Bank 2010)
13 Scope and Goal of the study
The scope of this study is confined to the boundaries of Peshawar basin The general setting
in this research is given in table-12
4
131 Scope
The environmental sustainability of Peshawar Basin is assessed by considering two main
sectors ie agriculture (crop and livestock) and domestic The sustainability of blue water is
assessed by comparing annual blue water consumption by agriculture and domestic to the
annual blue water availability Similarly the sustainability of green water is assessed by
taking into account the annual green water footprint of crops urban area and pasture and
compare it with the annual green water availability The outcome of both is the green and
blue water scarcity rate per annum In case of grey water Nitrogen and Phosphorous were
consider from agriculture (crops and livestock) domestic and industrial sources
Table - 12 Water footprint assessment setting
Setting This Study
Water footprint assessment type Basin level
Name of basin Peshawar Basin Pakistan
Period 1986 ndash 2015 (30 years)
Origin of water footprint Only internal process
Water footprint type Green blue and grey
Accounting groups Agriculture domestic and industrial
Sustainability perspectives Geographic environmental
Sustainability internal Annual
132 Goal
The main goal of this study is to assess the environmental sustainability of green blue and
grey water footprints of Peshawar Basin for current flow Further the study has been
extended to evaluate environmental sustainability of grey water footprint in light of reduced
flow scenarios ie 10 20 30 40 and 50 in Kabul River flows as a result of
construction of dams on Kabul River by the Government of Afghanistan
14 Description of study area
Peshawar Basin lies at the foothills of Himalayas and the northwest of Indus basin at the
longitude 710 15 and 720 45 E and latitude 330 45 and 340 30 N in Khyber Pakhtunkhwa
(KP) province of Pakistan covering an area of 8000 km2 as shown in Figure 12 The basin is
surrounded by mountain ranges of Swat in northeast Attock in south Khyber in west and
northwest and on the southeastern side it is bordered by Indus River where the basin
5
discharges all of its water (Tariq 2001) The rivers flowing through Peshawar basin are
Kabul River Chitral River Swat River Panjgora River and Bara River (Bisht 2013)
141 Climate
Peshawar basin has diverse type of climate the western part has semi- arid to subtropical
climate while the eastern region has sub-humid to subtropical climate The annual average
data from local metrological stations show the rainfall in a range of 340 mm to 630 mm June
and July being the hottest months with average daily maximum temperature of 40 to 48
and January being the coldest month with average daily minimum temperature of -5 to -2
The mean annual potential evaporation is approximately 1500 mm in Peshawar 1200 in
Mardan and Nowshera and 1100 mm in Charsadda (Tariq 2001Nasreen 2006)
142 Irrigation system
Pakistan has the worldrsquos largest canal irrigation system of 60000 km length Agriculture
alone consume about 97 of allocated surface water the rest 3 is available for other
purposes Pakistan has an agro based industry and cotton being the major export any decline
in major crop production would have significant impact on the country economy (Bisht
2013)
In KP Kabul River has been diverted upstream at Warsak dam into two canals the northern
canal that irrigate Shabqadar and Charsadda region while the southern canal which irrigate
Jamrud Peshawar and Nowshera area About 5km downstream of the Warsak dam another
canal has been taken off to irrigate land of Peshawar up to Akbarpura Swat River has also
been diverted in to Lower Swat Canal and Upper Swat Canal at Munda and Amandara Head
works to irrigate the agriculture lands of district Charsadda and Mardan regions The
Irrigation Department KP has been managing water supply to all districts of the province
Peshawar basin comprises of four sub-divisions ie Peshawar Charsadda Mardan and
Malakand Each sub division has its own network of canal system that regulates water supply
to the fields Peshawar sub-division has 18 canals with total length of 211 km Charsadda
has10 canals with a total of 65 km length Mardan has 42 canals and the region of Malakand
sub-division that fall in study area has 30 canals with total length of 290 km (Department of
irrigation Khyber Pakhtunkhwa) The detail of these canals are given in Appendix-B
143 Agriculture cropsproducts
In Peshawar basin agriculture is the main source of income of rural community and most
people directly depend on agriculture for their livelihood The main Crops grown in Peshawar
basin are wheat barley tobacco gram sugarcane cotton jowar rice maize and rapeseed
and mustard The basin has a variety of trees ie fruit or garden trees shadowy trees hilly
6
and wild trees The indigenous tree species are Mulberry (Morus nigra) pepal (Ficus
religiosa) Phulai (Acacia modesta) Ber (Ziziphus mauritinana) Karer (Caparis deciduas)
Siris (Albezia lebbek) Ghaz (Tamarix appylla) Kikar (Accacia nilotica) Shisham (Delgergia
sissoo) and Melia (Melia azedarach) Wood from these trees have been used for making
furniture and fixture house hold and utensils agriculture tools and in building as well Some
of the fruits are Aru (prunus persica) Bihi (Cydonia) Kela (Musa sp) Lemu (Cetrulus
medica) Alocha (Prunus Comunis) Grapes (Vitis vinifera) and Narangi (citrulus aurantum)
apple peach plum pear apricot guava loquat and persimmon In addition to fulfilling the
local needs these fruits are exported to other areas on the country
Weeds species that are used as a fodder are Paspalum distichum Launaea procumbens
Cyperus Spp Echinochloa colonum Cynodon dactylon Imperata cylindrical and
Desmostachya bipinnata Sorghum halepense Dichanthium annulatum and Panicum
antidotale are some of the common grasses in the region (Sepah 1993)
144 Industries
Sarhad Development Authority (SDA) is responsible for planning and promotion of industrial
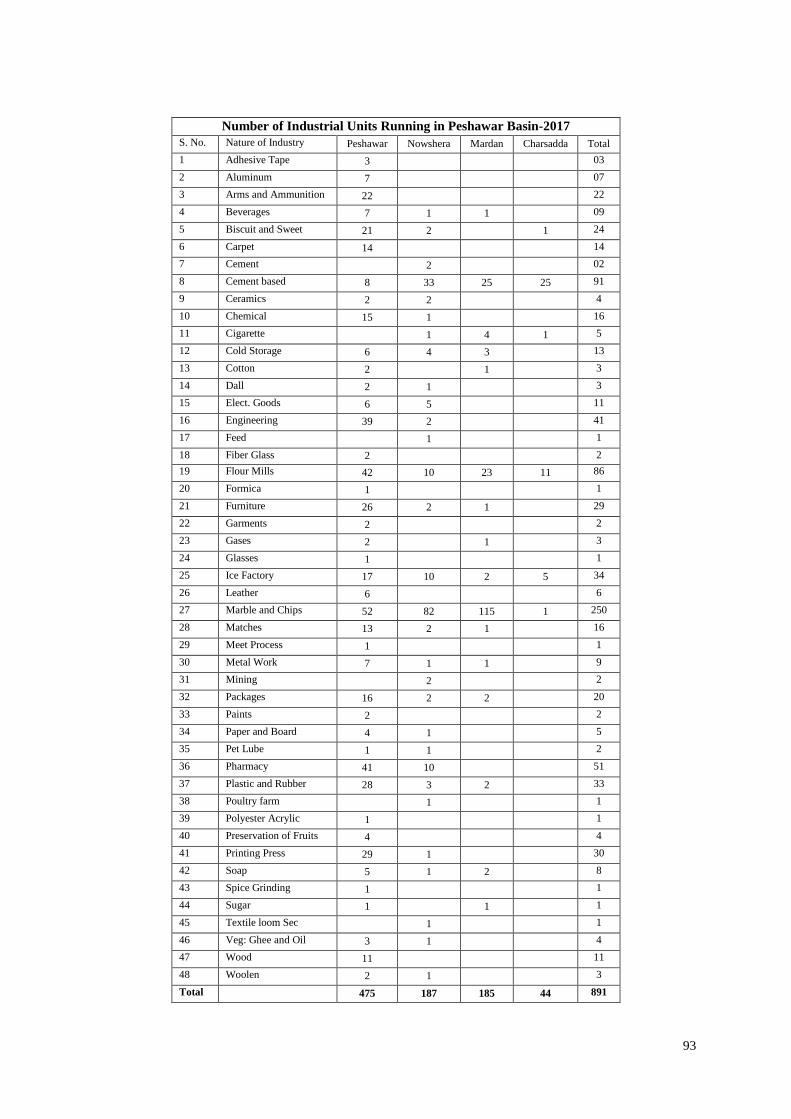
development in the province According to the Development Statistic of KP (2017) there are
891industrial units running in Peshawar basin which have been classified into 48 different
categories The number of units operating in Peshawar Nowshera Mardan and Charsadda
are 475 187185 and 44 respectively Detail is given in appendix-D It has been reported
(IUCN 1994 Azizullah et al 2011 Khan et al 2013 Ahmad et al 2015) that almost all
these industries discharges effluents directly or indirectly to Kabul River Waste dumping
around Kabul Indus and Swat Rivers has severely degraded aquatic and terrestrial ecosystem
which has negative impact on surrounding community and fish population (Nafees et al
2011)
145 Rivers flowing through Peshawar Basin
1451 Kabul River
The Kabul River originates from Unai pass in the Sanglakh range of Hindukush Mountains of
Afghanistan about 72 km west of Kabul It has an estimated 75390 km2 basin that includes
all Afghan rivers joining the Indus River in Pakistan The total length of Kabul River from
Unai pass to Attack where it join Indus River is 700 km In Afghanistan the major tributaries
of Kabul River are Logar River Ghorbank River Panjsher River Alingar River Bashagal
River and Konar River The Konar River is the biggest tributary of Kabul River joining in
east of Jalalabad which originates in Tirichmir mountain of Chitral in Pakistan The River
flows about 560 km in Afghanistan and irrigates an estimated land of 306000 hectares which
7
is nearly 20 percent of the estimated 156 million hectares of irrigated area in Afghanistan
(Sepah 1993 World Bank 2010 IUCN Pakistan 2010)
In Pakistan the Kabul River enters at Shin Pokh area of Mohmand Agency takes its source in
the Karakoram Mountains and flows approximately 140 km through Pakistan before joining
the Indus River (Favre and Kanal 2004) The watershed of Kabul River in Pakistan includes
Chitral Dir Swat Peshawar Nowshera Mohmand Agency and Malakand protected area
Major tributaries of Kabul River in Pakistan are Chitral Swat River Panjkora Bara and
Kalpani River
1452 Chitral River
Kabul River has a watershed that spread over the Northern Himalaya zone The Chitral River
flows about 150 km in Chitral and has different names as it passes through various regions
ie it is called Yarkun River at the point where it originates in Chiantar Glacier after
receiving water from Laspur which drains the major portion of Shandur range it is given the
name of Mastuj River Downstream it is joined by the Lutkoh River making it main stream of
Chitral River It enters Afghanistan at Barikot area and there it is called Kunar River which is
the major tributary of Kabul River The Konar River joins Kabul River in the east of
Jalalabad where its volume is almost equal to the Kabul River
1453 Swat River
Swat River is a river of KP Pakistan and important tributary of Kabul River rises in the
Hindukush Mountains and feed by glaciers water In Kalam valley the river is further joined
by three sub tributaries ie Gabral river Bahandra river and Ushu river flowing southward in
a narrow gorge of 24 miles long till it reaches village Madiyan The river is feed by both
summer snow melt and monsoon rainfall and the average summer discharge reaches to 4488
cubic feetsec Downstream at Madiyan village the river behave like braided stream and
broadens from 1-3 miles width In the extreme south the river is joined by the Panjkora River
at Qalangi after passes through Chakdara town of Lower Dir district of Malakand to join
Kabul River in Peshawar Basin at Charsadda (Nafees 1992 Bisht 2013)
The Bara River originates from Terah Valley of Tehsil Bara of Khyber Pakhtunkhwa join
Chinde River near the village Banda Sheikh Ismail Zai Before joining the Kabul River near
the Camp Koruna of village Akbarpura in Nowshera the river is feed by many seasonal
streams and sometime cause flooding in monsoon season Previously the river water was very
clean and clear but due to population growth the domestic sewerage the river has now
become like a sanitation channel (Bisht 2013)
8
15 Dams on Kabul River and its tributaries
In Afghanistan all important rivers takes their sources from either the central highlands
mountains or the northeastern mountains except the Kunar River which takes its source
across the border in Pakistan from Karakoram Mountains Afghanistan shares most of their
rivers with neighboring countries and most rivers dry up in irrigation canals or sandy deserts
or drains into inland lakes except the Kabul River which joins the Indus River and empties in
the Indian Ocean Since the utilization of rivers water has a regional dimension in
Afghanistan (Favre and Kanal 2004) hence policy makers and international community have
recognized water related disputes in Central Asia The United State Senate Foreign Relations
Committee recommended guideline for preventing conflicts over shared water resource and
according to Norwegian Institute of International Affaire (NUPI) water resource scarcity and
transboundary water resource management are the key challenges to the stability of
Afghanistan
There are 8 hydroelectric power plants constructed on Kabul Rivertributaries Of which 6 are
in Afghanistan and 2 in Pakistani territory These hydro power plants have been constructed
with half of foreign assistance from time to time
i Jabal-e-Saraj hydro power plant-(1916)
ii Chaki Wardak hydro power plant-(1938)
iii Sarobi hydro power plant-(1953)
iv Darunta hydro power plant-(1964)
v Mahipar hydro power plant-(1966)
vi Naghlu hydro power plant-(1967)
vii Warsak hydro power plant-(1960)
viii Golen Gol Hydro power Plant-(2017)
More than 25 years of war and civil unrest in Afghanistan the county has not altered any
river but recently it has been reported that Government of Afghanistan has planned to
develop 13 multiple purpose hydropower projects and irrigation schemes on Kabul River
The proposed projects will have approximately storage capacity of 3309 million cubic meter
which is about 63 of annual average flow of Kabul River without taking into account of
Konar River flow This storage of water has to potential impact on Pakistan (Worl Bank
2010)
9
16 Hydrology of Kabul River
The Kabul River exhibits high seasonal variability in discharge because of variation in
seasonal rainfall glacier and snowmelt the month of June July and August are considered as
flood period since discharge reaches its peak while September to April are considered as low
flow period The total annual discharge of Kabul River at Pak-Afghan border is 1935 billion
cubic meters (BCM) of which 49 is contributed by Afghanistan through Kabul River
while 51 is contributed by Pakistan through Chitral River Downstream of Warsak dam
Swat River and Kalpani River contribute about 688 BCM and the mean annual discharge of
Kabul River at Nowshera become 2623 BCM (Yousafzai et al 2004 Akhtar and Iqbal
2017)
17 Fish of Kabul River
The Kabul River and its tributaries has been used for commercial as well as sport fish which
is a source of income for thousands of families living along river bank (Yousafzai et al
2008) A total of 54 fish species have been reported in Kabul River and its tributaries (Butt
and Mirza 1981 Rafique 2001) While Mirza 1997 reported 67 fish species and about 35 of
them are considered as species of common and commercial importance The population of
the fish has declined in the river due to pollution from industrial effluents and sewerage
water Nafees et al 2011 selected 9 fish species and reported that their population has been
declining due to pollution and illegal fishing that has negative impact on the socio-economic
condition on the community directly dependent families on fish business Further toxicity of
Pb Cd Zn Mn Cu Ni and Cr in fish show high concentration as a result of bioaccumulation
of these metals These metals have exceeded WHOrsquos and US recommended daily dietary
allowances (RDA) that has negative impact on fish consumer and aquatic flora and fauna
(Ahmad et al 2015 Usman et al 2017)
18 Water Footprint Assessment Approach
Water footprint assessment is an analytical tool relating water scarcity and pollution to
human activities or products and the consequent impacts It further goes on formulating
strategies these activities and product should not be at the cost of unsustainable use of fresh
water (Hoekstra 2011) Water footprint assessment method is used to evaluate water
resource utilization in relation to human consumption (Hoekstra and Hung 2002) The WF is
the consumption based indicator of freshwater use that looks at both direct and indirect water
use of a consumer or producer It comprises of three parts namely green blue and grey water
that covers the complete evaluation in line with Water Footprint Network as well as ISO-
10
14046 directions (Lovarelli et al 2016) In view of water pollution as well as water
consumption water footprint assessment is the key methodology for water sustainability
(Cucek et al 2015) that present a clear and elaborate picture to decision makers pertaining to
proper management of water resources (Hoekstra and Chapagain 2007) WF methodology
could be used for a specific product such as goods and services for consumers group like
individualregionbasindistrictnationglobe etc or producers such government organization
private enterprise and industrial sector etc (Ercin et al 2011) The WF of a product is thus a
multidimensional indicator whereas ldquovirtual-water contentrdquo refers to water volume alone
(Hoekstra 2011) Whereas WF of an individual community or business is the total volume
of freshwater used to produce the goods and services consumed by the individual or
community or produced by the business (Hoekstra 2011)
The terms virtual water content refers to the volume of water embodied in the product alone
whereas WF consider detailed account the volume as well the sort of water being used
(green blue grey) and to when and where the water was used The terms virtual water and
water footprints both terms are similar) however being used alternatively in some published
research literature (Allan 1997 Hoekstra and Hung 2002 Hoekstra and Chapagain 2008)
Virtual water is the volume of water required to grow produce and package of agriculture
commodities and consumer goods or services (Allan 1997)
Interest in water footprint methodology has been increasing since it is a multidimensional
indicator that not only measure water consumption volume by source but also polluted
volumes by type of pollution instead of traditional water withdrawal what only measure
direct blue water use not considering the green and grey water and indirect use of water
(Hoekstra et al 2011) Water footprint assessment covers a full range of activities ie
quantifying and locating water footprint of geographic area producerconsumer process or
product assessing the environmental social and economic sustainability of water footprint
and formulation of response strategy
19 Specific objectives of the study
The specific objectives of this study were
To estimate the green and blue water footprints of crops in Peshawar Basin
To calculate the green and blue water availability in Peshawar basin
To determine the grey water footprint of Peshawar basin
To evaluate the environmental sustainability of green blue and grey water
footprints of water in Peshawar basin
11
To analyze the environmental sustainability of grey water footprints as a result of
anticipated reduction in water supply scenario in Peshawar Basin
110 Data Sources
The data require to run the AquaCrop model includes rainfall temperature (maxi and mini)
reference evapotranspiration (ETo) and mean annual atmospheric CO2 The climate data for
30 years period (1986-2016) ie maximini temperature wind speed solar radiation of two
weather stations was obtained from regional office of Pakistan Metrological Department
Crop cover area yield per hectare and fertilizer application data and irrigation schedule was
taken from Bureau of Statistics and Irrigation Department of Khyber Pakhtunkhwa Pakistan
The data on soil type and characteristic was obtain from Harmonized World Soil Database
(IIASA 2018) The soils texture identified using the Soil Texture Triangle Hydraulic
Properties Calculator of Saxton et al 1986 The AquaCrop default crop characteristics were
updated to growing degree days and field management according to the field collected data
111 Thesis outline
Figure-12 Peshawar Basin in Pakistan
Chapter 2
Literature
Review
Chapter 3
Green and blue
water footprints of
agriculture
Chapter 4
Environmental
sustainability of
green and blue
water footprints
Chapter 5
Environmental
sustainability of
grey water
footprint
Chapter 6
Conclusion
and
Recommendation
12
CHAPTER NO 2
LITERATURE REVIEW
21 Concepts and Definitions
The concept ldquoWater Footprintrdquo first introduced by Dutch Scientist Hoekstra in (2003) that
was subsequently elaborated by Hoekstra and Chapagain (2008) It provides a framework for
analysis where we are linking human consumption with fresh water resources This concept
of water footprint has been developed with the aim to use it as an indicator for fresh water
resources consumed by the inhabitants The concept of water footprint defined for a country
as the total volume of water required to produce goods and services in a country that are
directly and indirectly consumed by the local inhabitants (Chapagain and Hoekstra 2003)
This water footprint is further categorised into Blue green and grey water footprint that
represent the consumption of ground and surface water rainwater and the total volume of
water required to dilute pollution in the water (Mekonnen and Hoekstra 2010 Klemes et al
2009)
This review chapter has been focused on various methodologies adopted for assessing
sustainability of water footprint in different River Basin and Watersheds For this we have
reviewed research articles published on water footprint during last sixteen years As the
subject of water footprint in sustainability context is newly emerged field of interest for
researchers development practitioners and policy makers However this review section has
been organized in global regional and local context where the reviewed articles have mainly
explored methodological framework for water footprint and its implementation particularly
for water basins
22 Water Footprint of River Basins Global Context
Water as an essential natural resources have been greatly threatened by excessive usage for
human activities (Oki and Kanae 2006) In the world about 800 million people are facing
water shortage in term of safe drinking water and basic water sanitation (Falconer et al
2012) This water shortage problem is more severe in arid and semi-arid regions of the world
where all river basins have serious water shortage problems such as drying up rivers
pollution in the surface water declining trends in water table (Jose et al 2010) It is necessary
to find new tools and approaches for Integrated Water Resources Management (IWRM) that
bring sustainability in water resources in term of human needs and ecosystem protection
13
(Dudgeon et al 2006) For this new paradigms or approaches such as Water footprint blue
and gray water have been introduced by scientific communities with aim to promote efficient
equitable and sustainable use of water resources in planning and management context
(Falkenmark 2003 Falkenmark and Rockstrom 2006)
Mekonnen and Hoeskstra (2010) carried out a study on green blue and gray water footprints
used for the production and consumption of wheat The scholars conducted this study in 26
major wheat producing countries and 18 major rivers basins of the world Methodologically
5 x 5 arc minute grid size was used with the aim to understand water balance model and to
further calculate water consumed for wheat production during 1996-2005 The results
showed that globally water footprint for wheat production is 1088 Gm3year that is highest
recorded for green water (70) followed by blue (19) and gray (11) respectively This
shows that green water footprint is four time higher than blue water footprint Focusing on
Ganges and Indus river basin where 47 of blue water footprint is related to wheat
production
Liu et al 2012 conducted a study on grey water footprint showing past present and future
trends for anthropogenic dissolved inorganic nitrogen (DIN) and dissolved inorganic
phosphorus (DIP) in more than 1000 major water basins in the world In this study they used
Global NEWS (Global Nutrient Export from Watersheds) model for N and P export by river
The trends calculated for past (1970) present (2000) and future 2050 The future analysis is
mainly based on Millennium Ecosystems Assessment (MA) The results showed that one
third of the world rivers have water pollution level less than 1 where water pollution level
value for N and P has already been exceeding that one for about two third of the major water
basin that is showing serious water pollution problem The results further showed that
contributing factors behind DIN are manure and fertilizer inputs similarly sewage discharge
and detergents are considered as contributing factors for phosphates The WPL in these rivers
is continuously increasing from 1970 to 2000 for all form of N and P This pollution problem
is projected to shift from industrialized countries to developing countries where largest
changes in WPL found in South East Asia
Hoekstra et al 2012 conducted a study with aim to understand blue water footprints versus
blue water availability in the major waters basins of the world They evaluated 405 major
water basins for blue water footprints and blue water sacristy on monthly basis at the 10 year
average for 1996 to 2005 at a 5 x 5 arc minute special resolution They considered three
14
major water consumption sectors ie agriculture industries and domestic water supply They
further classified water scarcity value in to four levels ie low water scarcity moderate water
scarcity and significant water scarcity and severe water scarcity The results showed that
severe water scarcity found at least one month of the year in 201 major water basins with
267 billion inhabitants Among these Indus river basin with 212 million people placed 4 in
context of severe water scarcity during eight months of the year and 12 rivers basins showed
severe water scarcity level during all months of the year
Ercin and Hoekstra (2014) conducted a global study with a question that how WF of
humanity change towards 2050 under four different scenarios Considering 5 various drivers
such as population growth economic growth productiontrade pattern and consumption
pattern and technological development The results showed that WF is a sensitive parameter
that is varying for all scenario and change from one to another The WF for production and
consumption in the regional market (scenario 2) is highest due to growing population and
increasing meat and dairy consumption Similarly scenario 3 (global sustainability) and
scenario 4 (regional sustainability) have also increased with increasing population growth but
is showing decreasing meat and dairy product consumption This study shows that water
footprint of humanity at sustainable level is possible with increasing population but it has
closely linked to the changes in the product consumption pattern of our daily life style
23 Specific river basins studies
Pisimaras et al 2009 carried out a study on Kosynthos River basin (watershed) in Greece
This river basin is stretched approximately 52 km that covers about 440 km2 area
Methodologically the researchers used Multiple Hydrologic Unit (HRU) SWAT and GIS
models in which they analyzed three years temporal data from 2003 to 2006 for Nitrate and
soluble phosphorus These parameters studied with different scenario such as deforestation
(100) urban area encroachment and crops management (20) The results supports the
SWAT model for demonstrating various land use change pattern runoff from crops
management and nutrient loading If SWAT properly managed and validated
Zeng et al 2012 carried out a study on Heihle River Basin in North-West China In this
study they focused on the sustainability of Blue and Green water footprints and Virtual water
contents on monthly bases Methodologically the entire river basin has been divided in to
three major classes such as agriculture Industrial and domestic with the aim to evaluate and
simulate soil water balance for two year data (2004-2006) through CROPWAT model The
15
results showed the water footprint of the entire river basin about 1768 Million m3 per year
during 2004-2006 The results further showed that water consumption is higher in agriculture
(96) followed by industrial and domestic (4) respectively This study revealed that blue
water footprint is unsustainable as the blue water footprint is exceeding during eight months
of the year
Zang et al 2012 conducted another study on the spatio-temporal dynamics of green and blue
water in Basin that is under natural condition Methodologically the river basin divided in to
three sections such as upstream mid-stream and downstream while the whole basin divided
into 303 hydrological response unit and 34 sub-basin using Digital Elevation Model (DEM)
Furthermore this study aimed to assess and validate the SWAT (2005) hydrological model
with Arcview (33) for Heiher river basin For this purpose they used river discharge data
from 1997-1997 and 1990-2004 respectively The simulation of the discharge data (1997-
2004) showed good performance of the SWAT model to demonstrate the spatio-temporal
distribution of green and blue water flows in the entire basin The results further showed that
upstream has a high blue water flow as compare to the downstream similarly the green water
flow is equally distributed among all sub-basins where the total green and blue water flows
were recorded about 2205-22551 billion m3 in 2000
Dumont et al 2013 carried out a study on Guadalquivir river basin in Span where they
analyzed the green and blue water footprint and integrated it with environmental water
consumption considering ground water footprint The total area of the basin is about 57530
km3 with population of more than 55 million Methodologically the water footprint has been
divided into four major sectors such as i) agriculture ii) livestock and pastures iii) industry
domestic supply energy tourism and dams iv) ground water The results showed that green
water footprint is about 190 mm (46 consumption) while blue water footprint is mainly
associated with agriculture (80 of the blue water consumption) Similarly groundwater is
amounting about 720 Mm3 in 2008 where rising groundwater footprint is reducing surface
water availability The results further revealed that among crops Olive groves found major
green and blue water consumer that is 74 and 31 of the total water footprint respectively
Dessu et al 2014 carried out a study on the water resource availability against demands in a
watershed of Mara river basin situated in Kenya and north of western Tanzania The results
showed that there is a remarkable variability in water availability and demand is existing in
16
the basin that shows that increasing demand will put more pressure on available water
resources and may expose the inhabitants of the basin to severe water shortage in the future
Pellicer and Martines (2014) studied Segura river basin in Spain for estimating ground water
flow and direction of water flow between different basins in the catchment area of the Segura
River This estimation is based on the monthly data of 18 consecutive years (1990-2008) The
methodology of this study is based on two stages i) the modified abcd model and ii) semi-
distributed model The results showed that modified model abcd is more authentic and
valuable for inter basin ground water flow This model further provides good results for
quantification of direction and volume of exchange
Multsch et al 2016 carried out a study in the high plans aquifer of USA where they studied
the spatial distribution of blue and green water footprint in connection to the ground water
decline As the said aquifer of USA is highly water stresses where 60 of the irrigation is
mainly dependent on ground water The selected crops for this study were alfalfa corn
cotton sorghum soybean and wheat The time series data (from 1990-2012) used in this
study and processed through spatial decision support system (SPARE) and GIS tools
Furthermore cluster analysis has been performed by considering three parameters i) ground
water level decline ii) green water footprint are (km3year) and iii) blue water footprint area
(km3year) The results showed that the area or region of Water footprint is 4572 km2year
with 54 blue and 46 green water footprint The cluster analysis showed that two clusters
are in the category of significant or severe with 20 of the irrigated land that consume 32
of the total blue water
Pellicer and Martinez (2016) developed a methodological framework for assessment of gray
water footprint They applied this methodology for Segura River basin in the south of eastern
Spain The researchers considered pollutant load in the basin that is based on two stages i)
simulation of enterprise water cycle in which they used spatio-temporal distribution of all
water flows that is based on hydrological model (SIMPA) and Optiges as Decision Support
System (DSS) ii) assessment of gray water footprint of low considering pollutant discharge
such as organic matter (BOD5) Nitrate and phosphates The results showed that gray water
footprint is unsustainable in Segura River both in short and medium terms
Pellicer and Martinez (2016) conducted another study on Segura River Basin in Spain where
they evaluated the effectiveness of water footprint in environmental sustainability and water
17
resource management context The methodology of this study consist on two consecutive
stages i) simulation of anthropised water cycle in which they combined a hydrological model
(SIMPA) with Decision Support System (DSS) ii) in the second stage they considered blue
green and gray water footprints with aim to know the spatio-temporal distribution these water
footprints In this study they assesses sustainability for the periods of 2010 2015 and 2027
scenario as per Hoekstra eta (2011) formulation The results showed that on average green
water use is sustainable while blue water use is un-sustainable due to over exploitation of the
aquifer The results further showed that surface water pollution is mainly caused by excessive
discharge of phosphate so as the gray water footprint is remain unsustainable
Monona et al 2016 carried out a study with the aim to evaluate the application of
Environmental and Economic accounting system for water in Jucar river Basin in Spain This
catchment area covers approximately 43000 km2 with local population of about 5 million
This basin area is highly water stressed area where water is mainly used for agriculture In
methodological framework the researchers combined PATRICAL and SIMGES as the
hydrological model with AQUAACCOUNTS as the decision support system For this
purpose they considered 198081 and 201112 as reference periods for simulation The
results showed that the total water use in Jucar RBD is 15 143 hm3year in the reference
periods where the total water renewable resources is 3909 hm3 per year The water services
cost amout is 6434 million euroyear as of 2012 constant price
Zhang et al 2017 reviewed about 636 peer reviewed research article on the subject of water
footprints from 2006 to 2015 Their results revealed that US researchers have published more
articles (241) followed by China (192) Netherland (16) and India (24) respectively
After reviewing these articles it was found that there are no scientific research studies have
been carried on the topic water footprints in Pakistan though there is widespread
development in in the utilization of water footprint accounting aaplciations and
methodologies
Lovarelli et al 2016 carried out a comprehensive review on water footprints in which they
particularly focused on food crops feed fiber and bioenergy purposes The results showed
that 96 case studies carried out on water footprint for agriculture production in which 75
studies largely cover the quantification in regional and global context furthermore 14 studies
particularly focused on the implication of future water use and water scarcity uncertainty
18
Among these studies 2 analyzed the indicator and availability data on statistical point of view
while 3 is based on literature review Furthermore 2 studies have focused on identification
and comparison of carbon ecological and water footprints Among these 75 studies focused
on the quantification of water footprint of green and blue water while gray water footprint
quantified in 46 in which nitrogen is mainly considered
24 Water Resources Situation in Pakistan
Pakistan is an agriculture based country-majority of the livelihoods are associated with
agriculture A strong interrelationship has been established between water resources and
economic development The growing population recorded about 40 million in 1950 further
grown up to 185 million in 2010 (UN 2012) This fast growing population along with other
socio-economic and climatic factors have exposed Pakistan to different challenges
particularly water resources
Archer et al 2010 carried out a comprehensive study with the aim to explore water
sustainability in Indus River Basin under the changing socio-economic and climatic
conditions The total surface water availability in Indus River is about 137x103 supplying
water mainly for agriculture (Qureshi et al 2010) Archer study found that the sustainability
of water resources in Pakistan has been threatened mainly by socio-economic and climatic
factors Hence Being a water stressed country the threshold value is below 1700
m3capitayear and this will further reach to water scarcity ie 1000 m3capitayear
25 Water Pollution in Kabul River Case Studies
Water pollution has also considered as an issue of concern in Pakistan that is posing threats to
public health due to poor sanitation and monitoring practices The main pollutants found are
coliforms toxic pesticides and heavy metals (Azizullah et al 2011) According to Noor et
al (1982) industrial wastewater is mainly contributing to water pollution and make clean
water more alkaline and showing high level of hardness and chloride and COD
Other water pollution indicators such as Dissolved Oxygen (DO) and Biological Oxygen
Demand (BOD) studied by Noor and Khan (1983) in Kabul River The key finding of the
study showed DO at Azakhail Bala (355mgl) Nowshera bridge (402 mgl) Akora Khattak
(36 mgl) and Khairabad Kund (373 mgl) respectively BOD level at the same sample sites
was recorded as 040 035 and 056 mgl These pollutants are also posing threats to aquatic
fauna
19
Kamin et al (1985) carried out a study on Kabul river and Kheshki lake where they
analyzed and found water pollutants such as total dissolved solids (1550-1820 mgl) sulphide
(075-331 mgl) and sulphate (768-816 mgl) respectively The results showed that the
presence of high level oxidinzable matter including sulphide decreased DO level
significantly The level of Sulphide concentration recorded above the permissible limits that
causing pollution in both Kabul River and Kheshki Lake The pollution of various physio-
chemical and biological parameters are varying across the Kabul river as the main river
channel at Nowshera is not much affected by the industrial pollutants (Butt 1989)
A study carried out by Sohail (1989) on fauna and organic matter in deep bottom of Kabul-
Indus river system This study showed that heavy organic load mud and decomposable
matter found in the surrounding of Nowshera The heavy mud deposited at Nowshera is due
to slow flow of the river while other decomposable matter or organic load come from the
nearby urban areas domestic activities and industries The concentration of organic load is
continuously increasing in the river ecosystems that has direct impacts on fresh water
ecosystems aquatic flora and fauna Furthermore a regular decrease (bellow 75 ppm)
observed in dissolved oxygen at Nowshera during November to January while BOD is
increasing This has also negative impacts on fish population Other factors responsible for
disturbance in aquatic ecosystem are over-fishing hurdles and fish migration and lack of
awareness Khan and Ullah (1991) carried out another study on aquatic pollution in Kabul
River and studied the role of industries in water pollution Particularly they analyzed the
effluents of Paper Mills and Ghee industries This study showed that flow of waste water
recorded as 24 kmh in which the major parameters were Temperature (25⁰C) pH (85) total
suspended solids (1230 mgl) total dissolved solid (2893 mgl) respectively
Nafees and Ghulam (1991-92) carried out Environmental Monitoring of Amangarh Industrial
Estate This study showed that the pH Dissolved Solids Suspended Solids Sulphide
Chloride etc were much higher in concentration against the recommended standards for
industrial effluents However other heavy metals concentration found within the permissible
limits Other study of Ali (1991-92) on river Swat showed these parameters are within the
permissible limits except suspended solids in River Swat and the River is safe from
environment point of view
According to Khattak and Rehman (1992) high concentration of various pollutants or heavy
metals such as Cu Zn Cd Pb and Ni are existing in the Kabul River at Pirsabak Most of
20
these elements are exceeding the permissible level for irrigation However pH and salinity
are found within the permissible limits Another study of Wahid and Muhammad (1992)
showed that these parameters are not creating any harmful effects for aquatic ecosystem at
Amangarh in Kabul River This shows that the impacts and existing of these are varying
across the Kabul River mostly these are found in the industrial zones
Sepah (1993) showed that Shalm river is more polluted because of the municipal effluents
and Khazana Sugar Mills in Peshawar According Nawab (1992) two major drains ie Budni
Nulla and Ganda Vind are carrying various heavy metals and other pollutants that are finally
discharged into Kabul River without any treatment where they are disturbing the aquatic
ecosystem Majority of these trace elements and other pollutants are found above the
permissible level
IUCN (1994) carried out a study on Pollution and The Kabul River in collaboration with
University of Peshawar The results showed that Kabul river is carrying high suspended loads
(340-1310 mgl) under the high flow condition and (10-800 mgl) in low flow condition This
study also showed that the Kabul River is highly contaminated with various heavy metals and
the water is alkaline in nature Sabir (1996) studied major rivers in Khyber Pakhtunkhwa for
suspended load The suspended load (turbidity) was highly found in Chitral river (1112 ppm)
and Bara river (1152 ppm) followed by Kabul river (684 ppm) Panjkora (443 ppm) and Swat
(57 ppm) respectively The remaining important parameters found within the permissible
level for drinking water
Shahina (2001) carried out surface and subsurface water analysis in Peshawar Basin and
studied various cations and anions particularly Cd Mg Potassium Bicarbonate Sulfate and
Chloride This study showed that all these parameters are within the permissible level for
drinking water domestic and agriculture use However the surface water in the vicinity of
Akbarpura are found unsuitable for domestic use Furthermore the Oxygen Isotopic data of
the underground water system showed that the aquifers in the Peshawar Basin is mainly
recharged by Kabul and Swat river and rain water process
Akhter and Iqbal (2017) studied the transboundary water sharing of Kabul River and water
quality were analyzed in light of reduced flow The water quality of Kabul River was found
unsuitable for drinking purpose and is fit for irrigation Reduction in the annual quantity of
21
Kabul River water inside Pakistan will impose a serious problem to agricultural economy and
social dislocation
Nafees et al 2018 conducting study on the effects of water shortage in Kabul River on
wetland of Peshawar Basin It has been observed that the continuous decline in wetlands has
affected habitat with impacts on fish and migratory birds The study also revealed that a
variety of anthropogenic actions had substantial effects on wetlands
22
Table-21 Water footprint methodologies used for sustainable water resources
S No Methodology Geographic Scale Sector Type of water
footprint Reference
1 5x5 arc minute grid size resolution (GISRS) Global river basins Agriculture (Wheat) Blue green
and grey
Mekonnen and
Hoekstra 2010
2 Global Nutrient Export from Watersheds
(Global NEWS model) Global river basins Water pollution Grey (NandP) Liu et al 2011
3 5x5 arc minute grid size resolution (GISRS) Global river basins Agriculture industrial and
domestic Blue
Hoekstra et al
2012
4 Global river basins Socio-economic Blue Ercin and Hoekstra
2016
5 SWAT model with GIS interface Kosynthos River River
basin Greece
Urban area and crop
management Grey (NandP)
Pisinaras et al
2009
6 CROPWAT model Heihe river basin China Agriculture industrial and
domestic Blue Zeng et al 2012
7 SWAT 2005 model Heihe river basin China Water availability Blue and green Zang et al 2012
8 Hydrological model balance MED Guadalquivir river
basin Spain
Agriculture domestic energy
tourism and industrial Blue and green
Dumont et al
2013
9 SWAT model Mara river basin Kenya
and Tanzania Water availability vs demand Blue Dessu et al (2014
10 abcd model and semi distributed model Segura river basin
Spain Interbasin ground water flow Blue
Pellicer and
Martinez 2014
11 SPARE WATER via GIS high plans aquifer USA Agriculture Blue and green Multsch et al
2016
12 SIMPA model with Optiges as DSS Segura river basin
Spain Water Pollution
Grey (BOD5
N and P)
Pellicer and
Martinez 2016
13 SIMPA model with Optiges as DSS Segura river basin
Spain Water sustainability
Blue green
and grey
Pellicer and
Martinez 2016
14 PATRICAL and SIMGES hydrological model
with AQUACCOUNTS as DSS Jucar river basin Spain
Monzonis et al
(2016)
23
CHAPTER NO 3
Blue and Green Water Footprint of Agriculture in Peshawar Basin Pakistan
31 Abstract
Over the last few decades the demand for agricultural products has increased due to
population and economic growth This has exerted immense pressure on the available water
resources of Pakistan In this study the annual blue and green water footprint (WF) of crops
in Peshawar basin from 1986 to 2015 was estimated using an AquaCrop model and global
water footprint assessment (WFA) standard The AquaCrop output was post-processed to
separate soil water content and outgoing water fluxes into blue and green water components
while considering blue water inputs to the soil from both irrigation and capillary rise
Subsequently evapotranspiration (ET) originating from irrigation water capillary rise and
rainwater was determined Results showed that the 30-year average blue WFs of maize rice
tobacco wheat barley sugar cane and sugar beet were 7077 3932 2176 1913 1561 181
and 174 m3ton respectively while the green WFs were 2744 2254 1985 1535 1603 67
and 45 m3ton respectively The aggregated 30-year average annual blue water consumption
of the seven crops in the basin was 1876 million m3 (two thirds of which related to sugar cane
plus maize) while green water consumption was 1014 million m3 (two thirds for sugar cane
and wheat) The WF of all crops exceed the global average except for sugar cane The
findings of this study could be helpful for policy makers to set WF reduction targets increase
efficiency of irrigation and conserve water resources in Peshawar basin
Keywords Green water footprint Blue water footprint AquaCrop Irrigated crops Pakistan
________________________________________________________________________________________
The abstract of this chapter has been accepted by the European Geoscience Union-2019 and the paper will be
presented at EGU General Assembly on 7th April 2019 at Vienna Austria
24
32 Introduction
Fresh water is greatly threatened by human activities (Dos Santos et al 2013) One third of
human population is living in water scarce areas (UN 2014) that is expected to rise to the
two-third of population by 2025 (Dessu et al 2014) Water scarcity in arid regions besides
overexploitation of blue water resources put extra pressure on limited resources (Van Oel and
Hoekstra 2012 Zhang et al 2012) This stress on available water resources is increasing due
to population growth water pollution and the impact of climate change (Malley et al 2009)
Water consumption for irrigation purposes accounts was estimated about 70 of the total
annual water withdrawal in the global scale (Alexandratos and Bruinsma 2012) that
continues to increase (Launiainen et al 2014) This increasing demand has put more pressure
on supply water for domestic and industry activities (Siebert et al 2015)
Pakistan is an agrarian country where 70 of population directly or indirectly depends on
agriculture for livelihood (Khoso et al 2015) It has the world largest irrigation system
serving 54000000 acres of cultivated land (Ahmad 2011 Hassan 2016) In Pakistan the
irrigated area has increased from 1080 million hectares in 1961 to 1470 million hectares in
2005 (Government of Pakistan 2014) Agriculture sector as the primary consumer of water
resources uses about 69 of the available water resources the next consumers are
industries and domestic with rates of 23 and 8 respectively (Khoso et al 2015)
Agriculture sector considers the backbone of the economy in Pakistan as it contributes to
about 40 of labor force and 22 of the National Gross Domestic Product (GDP) and
supports 65 of rural population (World Bank 2011) The country has exploited most of its
available water resources and is now facing sever water shortage (Azizullah et al 2011) this
is the greatest threat to the sustainable crops production (Jehangir et al 2007) Therefore
impacts of water scarcity will have synergic effects on the country economic situation
(Hassan 2016)
There are numerous WF studies in the global and national scales (Chapagain and Hoekstra
2011 Hoekstra and Mekonnen 2010 Lovarelli etal 2016 Mekonnen and Hoekstra 2010)
(Duan et al 2016 Bulsink et al 2009 Chouchane et al 2015) However not many WF
studies were found in the basin level (Duan et al 2016 Mekonnen and Hoekstra 2010
Nouri et al 2019 Pedro-Monzoniacutes et al 2016 Pellicer-Martiacutenez and Martiacutenez-Paz 2016)
This study is the first to assess the water footprint of major crops in Peshawar Basin in
Pakistan This study was designed with an aim to estimate the green and blue water footprint
25
of agriculture in Peshawar Basin from field collected data unlike the previous studies in
which remote sensing data were used for the WF estimation
33 Study area
The basin is located in the northwest of Indus Basin at longitude of 710 15 and 720 45 E and
latitude 330 45 and 340 30 N in the Khyber Pakhtunkhwa province of Pakistan (Shah and
Tariq 2001) It covers an area of 5617 km2 and includes major cities of Peshawar Mardan
and Nowshera and two main rivers of Kabul River and Swat River as shown in figure
31(Bisht 2013) There are about 100 canals running across the basin with an estimated
length of 290 km long (Zakir et al 2013 Department of Irrigation KP 2018) The basin has
about 978 million inhabitants (Bureau of statistics 2017) The average annual minimum and
maximum temperature rainfall potential evapotranspiration and actual evapotranspiration of
a two weather stations in the basin are given in Table 31
Table-31 Temperature precipitation and evapotranspiration in Peshawar Basin
Figure - 31 Map of Peshawar Basin
Weather
Station
Mini-Temp
(⁰C)
Maxi-Temp
(⁰C)
30 years average
Precipitation
(mm)
ET0
(mm)
Actual ET
(mm)
Peshawar -15 50 476 447 425
Risalpur -35 49 703 630 540
26
34 Data and method
The FAO model of AquaCrop - standard (version 61) was used to simulate the soil water
balance crop growth and yield production of Peshawar Basin (Steduto et al 2009) The
input data to run AquaCrop model includes rainfall temperature (max and min) reference
evapotranspiration (ET0) and mean annual atmospheric CO2 The climate data for 30 years
period (1986-2015) ie maximini temperature wind speed solar radiation of two weather
stations were obtained from regional office of Pakistan Metrological Department Based on
the average cultivation area of common crops in the last 30 years major crops were
identified Wheat (43) maize (24) and sugar cane (24) tobacco (4) barley (2)
sugar beet (1) and rice (1) (Bureau of Statistics 2018) The required data including crop
cover area yield per hectare fertilization and irrigation were collected from the field and
irrigation department of Khyber Pakhtunkhwa Pakistan through questionnaire survey Soil
data was extracted from Harmonized World Soil Database 2018 The soils texture was
identified using soil texture triangle hydraulic properties calculator of Saxton et al 1986 The
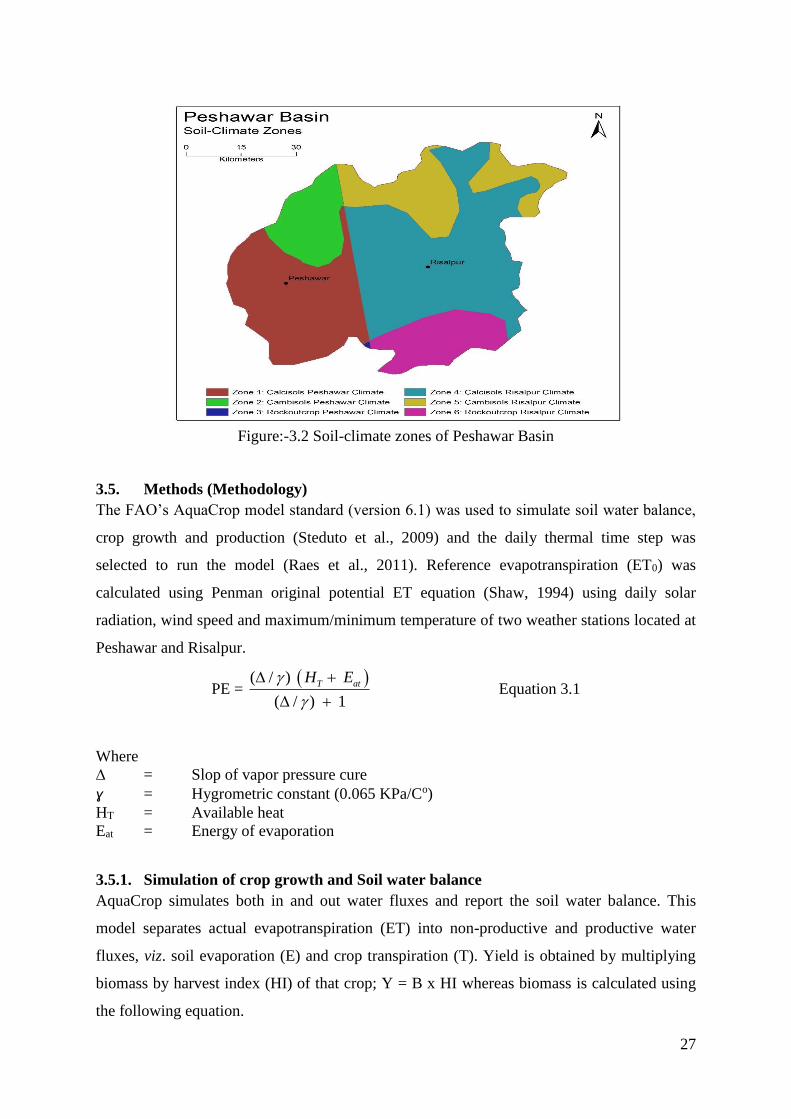
basin has three soil types ie calcisols (65) cambisols (25) and rock outcrop (10) as
shown in figure 32 taken from harmonized world soil database (IIASA 2018) The
difference between maximum and minimum cover area over the last 30 years by wheat
maize sugar cane tobacco sugar beet barley and rice is 12 8 3 4 1 1 and 02 percent
respectively The spatial distribution of these crops on each soil type was estimated from
satellite image and it was assumed that this annual difference of these crops cover area occurs
on the same soil type The AquaCrop default crop characteristics were updated to growing
degree days and field management according to the field collected data
27
Figure-32 Soil-climate zones of Peshawar Basin
35 Methods (Methodology)
The FAOrsquos AquaCrop model standard (version 61) was used to simulate soil water balance
crop growth and production (Steduto et al 2009) and the daily thermal time step was
selected to run the model (Raes et al 2011) Reference evapotranspiration (ET0) was
calculated using Penman original potential ET equation (Shaw 1994) using daily solar
radiation wind speed and maximumminimum temperature of two weather stations located at
Peshawar and Risalpur
PE =
( )
( ) 1
T atH E
Equation 31
Where
∆ = Slop of vapor pressure cure
ɣ = Hygrometric constant (0065 KPaCo)
HT = Available heat
Eat = Energy of evaporation
351 Simulation of crop growth and Soil water balance
AquaCrop simulates both in and out water fluxes and report the soil water balance This
model separates actual evapotranspiration (ET) into non-productive and productive water
fluxes viz soil evaporation (E) and crop transpiration (T) Yield is obtained by multiplying
biomass by harvest index (HI) of that crop Y = B x HI whereas biomass is calculated using
the following equation
28
B = WP x sumT Equation 32
Where
B = biomass (kg)
WP = water productivity (kgm3)
T = transpiration (mm)
The main purpose of AquaCrop model is to simulate the biomass water productivity (WP)
(Steduto et al 2007 Raes et al 2009 Chukalla et al 2015)
352 Water Footprint Assessment
The output of AquaCrop simulation - crop growth characteristics and water fluxes - were
post-processed to estimate the footprint of each crop as it was described in the global water
footprint accounting standards (Hoekstra et al 2011) and separated into green and blue
compartments using the method introduced by Chukalla et al (2015)
dSgdt = R ndash (Dr + ET) (SgS) ndash RO (R I+R)
dSb-CRdt = CR ndash (Dr + ET) (Sb-CRS)
dSb-Idt = I ndash (Dr + ET) (Sb-IS) ndash RO (II+R)
Where
dt = time step (1day)
R = rainfall (mm)
I = irrigation (mm)
RO = surface runoff (mm)
ET = evapotranspiration (mm)
Dr = drainage (mm)
CR = capillary rise (mm)
Sb-I = blue water from irrigation (mm)
Sb-CR = blue water from capillary rise (mm)
Sg = green water storage (mm)
The green and blue water portion of crop water use (CWU) over the season were calculated
as follow
CWUgreen = sumTt=1 SgtSt ETt 10 (m3)
CWUblue = sumTt=1 SbtSt ETt 10 (m3)
To convert millimeter (mm) to m3ha volume per land use factor 10 is use
WFgreen = CWUgreen yield (m3ton) Equation 33
29
WFblue = CWUblue yield (m3ton) Equation 34
36 Results
361 Total blue and green WF of Peshawar Basin in different soil-climate zones
The averaged blue WF of major crops of 30 years among crops varied across all soil-climatic
zones in the order maize gt rice gt tobacco gt wheat gt barley gt sugarcane gt sugar beet The 30
years average values of blue WF of maize rice tobacco wheat barley sugar cane and sugar
beet were 7077 3932 2176 1913 1561 181 and 174 m3ton respectively The green WF
were 2744 2254 1985 1535 1603 67 and 45 m3ton respectively Maize exhibited the
highest blue and green WF while sugar beet showed the lowest values of WF among all crops
and soil-climatic zones Both green and blue WF values were depended on a crop species as
well as soil-climatic zone For instance for maize the blue WF varied among soil-climatic
zones as zone 4 gt zone 3 gt zone 2 gt zone 1 and the green WF were zone 2 gt zone 3 gt zone 4
gt zone 1 For rice the blue WF differed among the given zones as zone 1 gt zone 2 gt zone 3 gt
zone 4 whereas green WF for rice were zone 4 gt zone 3 gt zone 2 gt zone 1 Zone 1 showed
the lowest blue and green WF as shown in figure 1 No significance difference was seen in
the blue and green WF rates among different soli-climate zones the average blue WF varied
from 23 to 27 percent and the average green WF varied from 21 to 29 percent between
different soil-climate zones (Figure 33)
Figure-33 Percentage of each zone to the annual water footprint of Peshawar Basin (1986-
2015)
30
Figure-34 Annual water footprint of crops in different soil-climate zones of Peshawar Basin (1986-
2015)
31
362 The contribution of major crops in the total blue and green WF of Peshawar
Basin
The annual blue and green WF of different crops changed in time For wheat the highest blue
WF were found in 1988 2000 and 2010 and the lowest WF in 2006 2004 and 2001whereas
the highest green WF were found in 1986 1997 and 2015 and the lowest WF in 1989 2000
and 2001 Sugarcane showed the highest blue WF during years 1988 2003 and 2005 and the
lowest in 2002 2010 and 2012 Blue and green WF of maize did not show significant
changes in time Barley gave higher WF from 1986 to 1999 and thereafter the values
declined up to 2015 WF of sugar beet was found higher during the 1986 1992 to 1995 The
values were lower during 1988-89 2003-05 and 2009-15 for sugar beet Rice and tobacco
also consumed blue and green water inconsistently during the 30 years period as shown in
figure 35
Figure-35 Percentage of blue and green water footprint and crops cover area in Peshawar Basin
(1986-2015)
363 Annual blue and green WF of agriculture sector in Peshawar Basin for the
period 1986-2015
The changes in the water consumption by crops could be associated with several factors
These may include crop species climatic conditions soil properties and several cultural
practices This study provided an initial information for the sustainable management of water
for crops The average annual blue and green water consumption of agricultural sector in
Peshawar Basin was 1886 and 1014 million m3 respectively as shown in figure 36
32
Figure-36 Mean annual blue green and total WF of major crops in Peshawar Basin (1986-
2015)
33
37 Discussion
Increasing food demand for growing population is a growing challenge In Pakistan
irrigation is aimed to water farmlands to the optimal level of soil water content up to the field
capacity (Tariq and Usman 2009) this has put immense pressure on the available water
resources The annual average WF of crops in Peshawar Basin is given in Table 3 Wheat
maize and sugar cane contribute more than 90 of both blue and green water footprint of Peshawar
basin since these three crops cover more than 90 of the agriculture area on the basin (Figure-4)
The annual average WF of wheat for Peshawar Basin was 3448 m3ton of which 55 is from
blue and 45 green water resources This value is two times more than what was calculated
by Mekonnen and Hoekstra 2011 for Pakistan In another study conducted in the Uttar
Pradesh village of India where the WF of wheat was reported to be in range of 2677-9844
m3ton The average of which is much higher than our results of 3448 m3ton (Denis et al
2016) The average WF of maize was estimates 9821 m3ton in Peshawar Basin which is
much higher than the average value of 2375 and 859 m3ton calculated by Mekonnen and
Hoekstra 2011 for Pakistan and world respectivley In another study conducted in Iran the
maximum WF of maize was calculated 1302 m3ton and in the Nothern China the WF of
maize was calculated 840 m3ton (Ababaei and Ramezani Etedali 2017 Duan et al 2016)
The reason for this high WF is the hight temperature and wind speed during maize growing
periods Pakistan lies in subtropical belt which receives plenty of sunshine during summer
The evapotranspiration in Peshawar Basin is high in month of June the warmest month of the
year (figure 37) (Khan and Hasan 2017)
Figure - 37 Average monthly air temperature and wind speed in Peshawar Basin from 1986-2015
34
Table - 32 Average blue and green water footprint of main crops and total water footprint of crop
production in Peshawar Basin (1986-2015)
( Mekonnen and Hoekstra 2011)
The WF of sugar cane in Peshawar Basin was estimated as 248 m3ton of which 73 is from blue
water while 27 is from green This WF is larger than the global average of 196 m3ton but it is lower
than of Pakistan 309 m3ton The WF 248 m3ton for sugarcane in Peshawar Basin is similar to the
study conducted by Kongboon and Sampattagul (2012) that reported the WF 202 m3ton for sugar
cane in northern Thailand The blue and green WF of rice barley sugar beet and tobacco as shown in
table-3 are higher than the mean global and national reported by Mekonnen and Hoekstra 2011
The thirty years average annual blue water consumption of sugar cane maize wheat
tobacco sugar beet rice and barley were 655 623 494 57 32 14 and 11 million m3
respectively while green water were 308 236 391 52 8 8 and 11 million m3 respectively
The average annual blue and green water consumption of agricultural sector in Peshawar
Basin was 1886 and 1014 million m3 respectively
Water footprint of crops in
Peshawar Basin (m3ton)
Water footprint of crops
in Pakistan (m3ton)
Global average water
footprint (m3ton)
Crops Blue Green Total Blue Green Total Blue Green Total
Maize 7077 2744 9821 614 1747 2361 81 947 1028
Rice 3932 2254 6186 3437 1051 4488 535 1800 2335
Tobacco 2176 1985 4161 NA 1337 1337 205 2021 2226
Wheat 1913 1535 3448 1368 732 2100 1277 342 1619
Barley 1561 1603 3164 2808 2773 5581 79 1213 1292
Sugar cane 181 67 248 217 92 309 57 139 196
Sugar beet 174 45 219 1 109 110 26 82 108
35
CHAPTER NO 4
Environmental Sustainability of Blue and Green Water Footprint in Peshawar
Basin Pakistan
4 1 Abstract
Water is a fundamental resource for sustainable economic development of any country
Freshwater resources are becoming scarce due to inevitable demand for food industrial
development and growing urban and rural population Pakistan is in arid region of the world
with an average annual rainfall less than 240 mm Being an agriculture based economy the
availability of fresh water is essential for sustainable economic growth Both the green and
blue water serves population and economy In this study the blue and green water availability
and scarcity was calculated following Water Footprint Assessment Standard in Peshawar
Basin during the period 1986-2015 The result show that per capita water availability dropped
from 1700 m3 per in 1986 to 600 m3 in 2015 In term of per capita water availability the basin
turn from ldquowater stressedrdquo in 1986 to ldquowater scarcersquo in in 2015 Further both the blue and
green water footprint of agriculture has decrease from 2139 million m3 in 1986 that reduced
to 1738 million m3 in 2015 Similarly the green water flow from agriculture land was 1231
million m3 in 1986 which reduced to 1104 million m3 in 2015 The domestic water footprint
has increased from 13 million m3 in 1986 to 29 million m3 in 2015 Both the blue and green
water scarcity are less than 100 and are low water scarcity level
Keywords Sustainability Green water footprint Blue water footprint Water scarcity
Peshawar basin Pakistan
36
4 2 Introduction
Water is a fundamental resource for sustainable economic development of any country
(Siegmann and Shezad 2006) Freshwater resources are becoming scarce due to inevitable
demand for food feed fiber and bioenergy industrial development and growing urban and
rural population (Hoekstra et al 2012) Pakistan is located in an arid region of the world with
an average annual rainfall of less than 240 mm Being an agriculture-based economy the
availability of fresh water is essential for sustainable economic growth The agricultural
sector consumes more than 96 of the countryrsquos fresh water resources (Sadaf and Zaman
2013) Pakistan solely depends on the Indus River System for its water supply (Iqbal 2010)
The country receives an annual inflow of about 180 billion m3 from the Indus river system
The groundwater resources that are mainly situated in the Indus river plains are subject to
over-exploitation and are not only depleting but also mostly polluted The per capita water
availability will drop from 11844 m3 in 1950 to 1823 m3 in 2025 (Gardner-Outlaw and
Engelman 1997) Unlike blue water consisting of surface water and ground water green
water has received little attention in the literature (Schyns et al 2019) Green water is
defined as the rain water that doesnrsquot runoff or recharge the groundwater but is stored in the
soil and available for vegetation (Hoekstra et al 2011) Like blue water green water is also
scarce since using green water for one purpose makes it unavailable for another purpose
Green water scarcity is the ratio of the green water footprint and the available green water
resources of a particular region Allocation of green water is basically the allocation of land
for a particular use People mostly ignore green water scarcity because of this indirect free of
cost allocation Both green and blue water serves population and economy resulting in a
green and blue water footprint (Schyns et al 2015) Review of literature shows that there are
many studies on the blue water footprint at country and basin level an (eg Archer et al
2010 Dessu et al 2014 Hoekstra et al 2012 Pellicer-Martiacutenez and Martiacutenez-Paz 2016
Zang et al 2012)
Peshawar basin is a sub-basin of the Indus basin and extends from 710 15 to 720 45 east
longitude and from 330 45 to 340 30 north latitude in the province of Khyber Pakhtunkhwa
Pakistan (Shah and Tariq 2001) Blue water is mainly supplied through the Kabul and Swat
rivers The total length of the Kabul River from the Unai pass in the Sanglakh range of the
Hindukush mountains in Afghanistan to the Indus River in Pakistan is about 700 km (Sepah
1993 World Bank 2010 IUCN Pakistan 2010) The Kabul River has its source in the
37
Karakoram Mountains enters Pakistan at the Shin Pokh area of Mohmand Agency and flows
approximately 560 km in Afghanistan and 140 km through Pakistan (Favre and Kamal
2004)
The average annual discharge of the Kabul River at the border between Afghanistan and
Pakistan is 19 billion m3 (BCM) of which 49 is contributed by Afghanistan through the
Kabul River and 51 by Pakistan through the Chitral River Downstream of Warsak dam
the Kabul River (including the Chitral River) contributes 58 of the flow while the Swat
River contributes 42 of the flow The mean annual discharge of Kabul River at Nowshera
is 27 BCM (Akhtar and Iqbal 2017 Yousafzai et al 2004)
There are eight hydroelectric power plants constructed in the Kabul River and its tributaries
Six are located in Afghanistan and two in Pakistan In Afghanistan due to more than 25 years
of war and civil unrest no river has been altered but recently the Government of Afghanistan
has planned to develop 13 multiple purpose hydropower projects and irrigation schemes in
the Kabul River The proposed projects will have storage capacity of approximately 3309
million m3 which is about 63 of the annual average flow of the Kabul River without taking
into account the flow of the Konar River This storage of water will probably affect the
downstream flow regime and water resources in Pakistan (World Bank 2010 Mustafa 2016
Govt of Afghanistan 2017)
Previously there has been no study on the blue and green water availability and scarcity in
Peshawar Basin Therefore the aim of this study is first to estimate the availability of blue
and green water in Peshawar Basin and second to estimate the environmental sustainability of
blue and green water during the period 1986-2015 Blue and green water scarcity has been
used as an indicator to determine the environmental sustainability (Hoekstra et al 2011)
4 3 Materials and Methods
In this study we followed the approach described by Hoekstra et al 2011 concerning the
global standard for water footprint assessment (Schyns et al 2019)
43 1 Water balance of Peshawar Basin
The water balance of Peshawar basin can be described by the following equation
Inflow - outflow = change in storage
QWarsak + QMunda + P = QNowshera + QKalpani + ET + ΔS Equation 41
38
Q = discharge at Warsak Munda Nowshera and Kalpani (mmyear)
P = precipitation (mmyear)
ET = actual evapotranspiration (mmyear)
ΔS = change in soil water storage (mmyear)
Evapotranspiration was calculated by the following Penmen equation (Shaw 1994)
ETo =
( )
( ) 1
T atH E
Equation 42
Where
HT = RI (1 ndash r) -Ro
RI = (1- r) = 075 Raƒa (n N)
Ro = σTa4 (047 ndash 0075radic ϱa ) (017 + 083nN
Eat = 035 (1 ndash u2 100)( ϱa - ϱd)
Where
ETo = potential evapotranspiration
∆ = slop of the vapor pressure cure (KPa)
r = hygrometric constant (0065 KPa)
H = available heat
Ea = energy of evaporation
Ta = mean air temperature ()
RI = incoming radiation
Ro = outgoing radiation
ϱd = actual vapor pressure of the air (mm of Hg)
ϱa = saturated vapor pressure of the air (mm of Hg)
ϱa - ϱd= saturation deficit
n = bright sunshine hours
N = mean daily duration of maximum possible sunshine hour
The actual evapotranspiration was calculated following the method of Zhang et al (2001)
1
1
T1
Eo
o o
ET
P
ET ET
P P
P
Equation 43
Where
ET = actual evapotranspiration
39
ETo = potential evapotranspiration
P = precipitation
120596 = coefficient
432 Blue water availability (WAblue)
Blue water supply to Peshawar Basin is mainly from Kabul River and Swat River The
discharge data of Kabul River at Warsak (Q1) and Swat River at Munda (Q2) for the period
1986 to 2015 was obtained from Pakistan Water and Power Development Authority
(WAPDA) and irrigation department Following Hoekstra et al 2012 and Richter et al
2012 80 of the natural runoff was allocated as environmental flow requirement (EFR) The
remaining 20 is the blue water availability WAblue for consumption The per capita annual
WAblue was determined as the ratio of annual WAblue to the corresponding year population
433 Blue water footprint (WFblue)
The blue water footprint WFblue of the agricultural sector in Peshawar Basin was estimated
for seven crops by using the AquaCrop model (Steduto et al 2009) and separating blue and
green evapotranspiration following the method of Chukalla et al (2015) The blue WF of the
domestic sector was estimated by taking 25 imperial gallons (114 liters) per capita per day for
urban population and 15 imperial gallon (68 liters) per capita per day for rural population
(Public Health Department 2019) The percentage of the population supplied by different
water sources was taken from Pakistan Social and Living Standard Measurement Survey
1986-2015 The blue WF of the domestic sector was taken as 10 of the total domestic
water withdrawal (Hoekstra et al 2012)
434 Green water availability (WAgreen)
The annual actual evapotranspiration (ET) was estimated using formula of Zhang et al
(2001) The green water flow in Peshawar Basin during the period 1986 to 2015 for
agriculture pasture and urban area were estimated based on the corresponding areas from
satellite images of 1985 1990 1995 2000 2005 2010 and 2015 (see figure 41) The green
water flow from urban area was estimated by multiplying the urban area with an
evapotranspiration (ET) rate calculated with equation (2) with a w value of 01 which
represents a very low ability to store water
The total green water flow from pasture was calculated by multiplying the actual ET with the
pasture area from 1986 to 2015 The areas reserved for nature conservation in Peshawar basin
are shown in Table 41 ET from this area was estimated accordingly All the meteorological
40
data required for the calculation of ETo and rainfall data of both weather stations (Peshawar
and Risalpur) in Peshawar Basin were collected from the Pakistan Metrological Department
Table 41 Land set aside for nature Game Reserved and Wildlife Park
435 Green water footprint (WFgreen)
The green water footprint WFgreen was calculated following the Schyns et al 2019 method
A fraction of green water consumed by livestock grazing was allocated as WF of grazing
Livestock census data of 1986 1996 and 2006 were converted to annual figures by
interpolation (Government of Pakistan 1986- 2015)
436 Environmental sustainability of WFblue
The blue water scarcity (WSBlue) is the ratio of WFblue and WAblue in Peshawar Basin from
1986 to 2015 When the value exceeds 1 it means that the consumption is unsustainable
while a value lower than 1 indicates sustainable use of blue water
WFblue
WSblueWAblue
Equation 44
437 Environmental sustainability of WFgreen
For analyzing the environmental sustainability of WFGreen the green water scarcity (WSGreen)
is used define as the ratio of the sum of WFgreen and the sum of the maximum available green
water volume The WFGreen is the sum of actual ET of crops pasture land buildup area and
area set aside for nature in Peshawar Basin from 1986 to 2015
WFgreen
WSgreenWAgreen
Equation 45
Area Name Area Type District Longitude Latitude Area
(Km2)
Nizam pur Game reserve Nowshera 72015856 E 33480567 N 8
Shamshatoo Game reserve Nowshera 71483795 E 33525613 N 35
Maroba Game reserve Nowshera 71561739 E 33473632 N 35
Sudham Game reserve Mardan 72162816 E 34155551 N 115
Cherat Wildlife park Nowshera 71544394 E 33493784 N 27
Manglot Wildlife park Nowshera 71590356 E 33445040 N 7
Nizam pur Wildlife park Nowshera 71918056 E 33757044 N 26
Total 253
41
When the value exceeds 1 it means that the consumption is unsustainable while a value
lower than 1 value indicates sustainable use of WFgreen
Figure-41 Land cover change in Peshawar Basin from 1986-2015
42
44 Results
Figure 42 shows that the actual runoff fluctuated during the period 1986 to 2015 with higher
values during 1987-2005 and then again the magnitude increased with some variations up to
2015
Green water use in Peshawar Basin during 1986-2015 from agriculture pasture and urban
area is shown in Figure 43 The green water flow values differed as agriculture gt pasture gt
urban area gt area for nature The green water use of agriculture pasture urban built area and
areas set aside to nature is 50 31 12 and 7 respectively
Figure 44 shows that the blue WFagriculture shows a decreasing trend because the agriculture
area in 1986 was reported as 4114 km2 and reduced to 3103 km2 in 2015 since agricultural
land has been converted to settlement over time On the other hand there is an increase in the
blue WFdomestic because of the increasing population in the basin Further the per capita blue
water availability in Peshawar Basin (1986-2015) indicated a substantial declining trend
throughout the period In 1986 the per capita availability of blue water was more than 1600
m3 whereas in 2015 the per capita blue water availability was lower than 600 m3 This
declining trend can be associated with the population growth migration of peoples from rural
to urban areas and other agricultural and economic activities in Peshawar basin Figure 44
shows that blue water and green water scarcity have gradually increased with time The
scarcity percentage of green water is larger than that of blue water Figure 45 show that the
distribution of blue water sources in Peshawar Basin are given as tape water 36 motor
pump 26 hand pump 22 and dug-well 16 This research also indicated that blue water
and green water scarcity have been gradually increased with time The scarcity percentage of
green water was observed greater than blue water scarcity Blue water scarcity obviously
fluctuated during the three decades as shown in figure 45
43
44
Figure-45 Percentage of green water flow (A) and Percentage of blue water supply (B) in
Peshawar Basin (1986-2015)
45
45 Discussion
Availability of fresh water resources is among the interlinked network of challenges that
Pakistan is currently facing (Archer et al 2010) The agriculture sector alone consumed
93 of the available blue water Irrigation water requirement of Pakistan will raise to 255
billion m3 from 163 billion m3 in 1995 (Iqbal 2010 Sadaf and Zaman 2013) while the
country receive an annual influx of about 180 billion m3 in Indus river system from
neighboring countries (Iqbal 2010) According to water scarcity level set by Hoekstra et al
2012 the Indus Basin faces server water scarcity during eight month of the year however
Peshawar Basin has low water scarcity level for both blue and green water scarcity (Table
42) This is the first study that estimate the availability of blue and green water and scarcity
on a basin level in Pakistan There is no previous study of Peshawar Basin to compare our
results with The annual blue water availability in Peshawar Basin is about 6080 million m3
of which more than 98 is used by agriculture sector and the rest for domestic use
Table-42 Water scarcity thresholds
(Hoekstra et al 2012)
The situation of water resources in Peshawar Basin worsen during the period 1986-2015 The
per capita water availability dropped from 1600 m3 per in 1986 to 600 m3 in 2015 In term of
per capita water availability the basin turn from ldquowater stressedrdquo in 1986 to ldquowater scarcersquo in
in 2015 (Schmidt et al 2001)
Over the last 30 years both the blue and green water footprint of agriculture has decrease over
time because more and more agriculture land has been converted into settlement Water
footprint of agriculture was 2139 million m3 in 1986 that reduced to 1738 million m3 in 2015
Similarly the green water flow from agriculture land was 1231 million m3 in 1986 which
reduced to 1104 million m3 in 2015
The domestic water footprint of Peshawar Basin during the period of 1986-2015 has
increased from 13 million m3 in 1986 to 29 million m3 in 2015 because of population
increase This increasing demand for water is dependent on economic classes housing
characteristic water quality accessibility to water sources and water pricing (Bhatti and Nasu
2010)
Water Scarcity Levels Thresholds
Low water scarcity lt100
Moderate water scarcity 100 ndash 150
Significant water scarcity 150 ndash 200
Sever water scarcity gt200
46
CHAPTER NO 5
1Environmental Sustainability of Grey Water Footprints in Peshawar Basin
Scenarios for Current and Future Reduced Flow in Kabul River
5 1 Abstract
Fresh water resources play an important role in social and economic development of a
country Measuring water pollution at basin level is one of the main challenges in water
resource management In this study grey water footprints (WFgrey) is used as an indicator to
assess environmental sustainability related to Nitrogen (N) and Phosphorus (P) pollution in
Peshawar Basin Pakistan The N and P pollutants load from artificial fertilizers animal
manure household and industrial sources were considered during 1986 to 2015 Average of
30-years N-related WFgrey showed that artificial fertilizer contributed 61 livestock manure
36 household sources 2 and industries 1 while for P-related WFgrey the contribution
from artificial fertilizer livestock manure and household sources were 50 49 and 1
respectively Averaged 30-years N and P associated WFgrey of the basin were 50108 m3y
and 50109 m3y respectively To assess the potential impact of dams on Kabul river water
pollution The water pollution level (WPL) was estimated under normal and reduced runoff
scenarios for an increased upstream use of water from Kabul river in Afghanistan N-related
WPL was within the sustainability limit of 100 while P-related WPL exceeded sustainable
limits in every year under normal runoff and were worse in each reduced runoff scenarios
This study shows the deterioration of water quality of Kabul river and the findings may be
helpful for future planning and management of the basin
Keywords Sustainability Grey water footprint Nitrogen Phosphorus Kabul River Pakistan
This chapter is submitted to International journal of agriculture and biological engineering (IJABE) and is under
review
47
5 2 Introduction
Pakistan is facing serious water shortage as the available water resources have been
exhausted to great extent (Govt of Pakistan 2014) Sharp decline of about 3500 m3 per
capita water availability has been recorded from 1950 to 2009 Water availability has dropped
down further to 1500 m3 in 2009 as compared to the baseline data of 5000 m3 in 1950
(Azizullah et al 2011) Most of the existing water resources has been polluted due to
unchecked discharge of industrial and municipal effluents (Bisht 2013) Agricultural
intensification population growth industrialization and urbanization are the key contributing
factors to quality and quantity of water resources (Liu et al 2012 Helen et al 2006 Eva et
al 2017 Karn et al 2001 Serio et al 2018 Yan et al 2013 and Manzardo et al 2016)
Peshawar Basin is extended from 710 15 to 720 45 East longitude and from 330 45 to 340 30
North latitude in the province of Khyber Pakhtunkhwa Pakistan (Figure51) (Shah and Tariq
2001) Kabul River is the main river flowing through Peshawar Basin that originates from
Unai Pass of Hindukush Mountains in Afghanistan It covers approximately 700 km distance
from Unai pass up to Indus River (Favre and Kamal 2004)
Figure-51 Kabul river passing through Peshawar Basin in Pakistan
The Basin comprised of four districts (Peshawar Mardan Charsadda and Nowshera)
covering an area of 5623 km2 with a population of 978 million (Govt of Pakistan 2017)
48
Like rest of the country quality and quantity of water sources in Peshawar basin has been
adversely affected Effluents from households and industries directly or indirectly discharge
to Kabul River without any treatment (Azizullah et al 2011 IUCN 1994 Zakir et al 2013
Khan et al 2013 and Ahmad et al 2015) Kabul River flows about 560 km in Afghanistan
and 140 km in Pakistan In Afghanistan the river contributes about 26 of surface water
flow (Favre and Kamal 2004) The Government of Afghanistan intends to construct 13 dams
(Table S1in supporting material) for power generation and irrigation on river Kabul (World
Bank 2010 Govt of Afghanistan 2017) These projects in general and Konar storage project
in particular would result significant reduction in water flow to Peshawar Basin
Consequently adverse impacts are expected on ecosystems and livelihood opportunities of
lower riparian (Mustafa 2016)
Review of literature show that previous studies have mainly focused on physico-chemical
characteristics of water quality in Kabul River (summarized in Table 1) Some studies
analysed heavy metals concentrations in water at various locations while others have
determined the impact of polluted water on fish and wheat irrigated with riverrsquos water (Noor
et al 1982 Noor and Khan 1983 Kamin et al 1985 Sohail 1989 Nafees and Ghulam
1992 Nawab 1992 Wahid and Muhammad 1992 Khattak and Rehman 1992 Sepah
1993 IUCN 1994 Iqrar 1994 Shah and Tariq 2001 Yousafzai and Shakoori 2007 Khan
et al 2011 and Khan and Khan 2012) However no study has been reported on the overall
sustainability aspects of Kabul River to assimilate pollution load and the likely future
scenarios in the context of reduced water flow as a result of construction of dams in
Afghanistan and its subsequent downstream impacts
The concept of water footprint is commonly used these days for the assessment of
environmental sustainability of industrial parks urban area and river basins (Miglietta et al
2017 Ma et al 2015 Fang et al 2015 Chen et al 2015 and Pellicer-Martnez and Martnez-
Paz 2016) This study was designed to analyse the environmental sustainability of WFgrey
and WPL in relation to N and P loads from artificial fertilizers animal manure households
and industrial sources during a period of 1986 to 2015 and to determine the likely impacts of
reduced runoff scenarios from increased water usage in Afghanistan
49
Table-51 Previous studies on water pollution of Kabul River
Year Temp
(⁰C) pH
Cond
(microscm)
Alkalinity
(mgl)
SO42-
(mgl)
DO
(mgl)
BOD
(mgl)
COD
(mgl)
NO3-
(mgl)
PO43-
(mgl) Reference
1982-
83 875 840 2840 379 044 2081
Noor et al 1982
Noor et al 1983
1990 1920 807 3160 Akif et al 2002
1994 2222 758 36298 11768 4432 643 310 8175 491 052 IUCN 1994
1997 2500 765 26500 9200 3100 630 26 78 126 030 Khan et al 1997
1999 1550 800 2900 15454 11502 948 332 4757 051 Khan et al 999a
Khan et al1999b
2008 15923 14061 427 12226 164 017 Yousafzai et al
200810
2009 760 46756 6606 612 320 Iqbal et al 2009
2010 2333 755 20640 12386 16399 377 128 011 Yousafzai et al2010
2011 786 Nosheen et al 2011
2013 760 560 116 103 Zahidullah et al 2013
2014 3012 822 2320 032 Jan et al 2014
2015 1844 817 21262 8094 303 043 Rauf et al 2015
2017 808 33566 14866 144 720 075 Akhtar et al 2017
5 3 Materials and Methods
53 1 Grey water footprint
WFgrey is define as the volume of fresh water required to assimilate the load of pollutants
discharged into water based on natural background concentrations and existing water quality
standards WFgrey was calculated using Global Water Footprint Assessment Standard and
Grey Water Footprint Accounting Guidelines WFgrey (m3) was computed by dividing N and
P application (tonsyear) by the difference between the maximum acceptable concentration
Cmax and the natural background concentration Cnat of N and P (Hoekstra et al 2011 Franke
and Mathews 2011 and Franke et al 2013)
max( )grey
nat
LWF
C C
[m3] Equation 51
L application [tonyear]
α = leaching-runoff fraction
L = pollution load [tons]
Cmax = maximum allowable concentration [tonm3]
Cnat = natural background concentration [tonm3]
50
53 2 Environmental sustainability of grey water
Environmental sustainability was calculated according to the method described Hoekstra et
al 2011 where WPL was used for environmental sustainability analysis of WFgrey WPL is
the ratio of total WFgrey in a basin to the actual run-off (Ract) in basin A 100 value of WPL
indicate that waste assimilation capacity has been completely consumed and WFgrey is
unsustainable (Hoekstra et al 2011)
WPL = sumWFgrey Ract Equation 52
Ract = actual runoff [m3year]
53 3 Reduced runoff scenarios
The 30 years annual average (1986-2015) of WFgrey and runoff of Kabul river is taken as
reference value The reference runoff is reduced by 10 20 30 40 and 50 to
analyse the effect of flow on WPL for each (Rreduced) scenario keeping WFgrey constant
5 4 Data description
The N and P loads for the period of 1986 to 2015 from livestock manure is calculated by
multiplying livestock population by animal-specific excretion rates (Govt of Pakistan 1986-
2015) Livestock censuses data of 1986 1996 and 2006 were converted to annual figures by
interpolation while 2007 to 2015 population data was obtained from Livestock Department
Khyber Pakhtunkhwa province The slaughtered weights of animals in Pakistan for the years
1980 1990 and 2000 are shown in Table 2 (FAO 2003 Yousif and Babiker 1989) and
animal excretion rates were taken from Sheldrick et al 2003
Table-52 Slaughtered weight and N and P contents in various livestock categories
Ammonia volatization rates for cattle and poultry (36) and for buffaloes sheep and goat
(28) were taken from Bouwman et al 1997 accordingly Input of artificial fertilizers was
Livestock
Type
Slaughtered
weight
(kg)
Kg of nutrient
(per slaughtered weight per year)
Slaughtered weight
in Pakistan (kg)
Nitrogen Phosphorus 1980 1990 2000
Cattle 250 50 10 1269 164 1909
Buffaloes 250 50 10 885 1171 1331
Horse 250 45 8
Asses 45 8
Mules 45 8
Sheep 15 10 2 107 174 170
Goats 12 10 2 96 155 170
Camels 456 50 10 456
Poultry 2 06 019 07 10 11
51
obtained from Pakistanrsquos National Fertilizer Development Centre (NFDC) annual reports
(Govt of Pakistan 1986-2015) NFDC annually reports N and P nutrients in the form of urea
calcium ammonium nitrate (CAN) diammonium phosphate (DAP) single and triple
superphosphate (SSP) and sulphate of potash (SOP) in the country The N and P loads from
households and industrial sources were calculated according to Van Drecht et al 2009
Mekonnen and Hoekstra 2015-2018 Human population censuses of 1981 1998 and 2017
were converted into annual population by interpolation (Govt of Pakistan 2017) Since
Peshawar basin has no operational wastewater treatment plant (Qureshi 2014) therefore
population connected to public sewerage system (D) and removal of N and P through
wastewater treatment (RN = 0) and (RP = 0) was presented accordingly The N and P load
from industrial sources were taken as a function of urban household load as in equation (4)
and (5) (Mekonnen and Hoekstra 2015-2018 )
Nisw = 01times 07 times [Nhum U times (1-RN)] Equation 53
Pisw = 01times 07 times [Phum U times (1-RP)] Equation 54
Where
Nisw = nitrogen load from industries (kgpersonyear)
Pisw = phosphorous load from industries (kgpersonyear)
Nhum = human nitrogen emission (kgpersonyear)
Phum = human phosphorous emission (kgpersonyear)
U = urban population
RN = removal of nitrogen through wastewater treatment
RP = removal of phosphorous through wastewater treatment
In the absence of standard setup for Cmax and Cnat for N and P for surface water in Pakistan
the Cmax of 29 mgl and Cnat of 04 mgl for N and Cmax of 002 mgl and Cnat
of 001 mgl for
P were set from (Mekonnen and Hoekstra 2015-2018 ) Runoff data (m3year) of Kabul
River were obtained from Water and Power Development Authority (Govt of Pakistan
1986-2015)
5 5 Results
551 Application of N and P fertilizers in Peshawar Basin
The application of N and P fertilizers in Peshawar Basin from 1986-2015 are given in Figure
52 The data revealed that community has been using chemical fertilizers in huge amounts
for intensive agricultural activities across the basin Every passing year witness an apparent
increment in application of N and P nutrients The application of N and P fertilizers show that
the water pollution level of N and P in river water is substantially attributed to the use of
artificial fertilizers in Peshawar Basin
52
Figure -52 Application of N and P in Peshawar Basin from 1986-2015 (tonsyear)
552 N and P loads from livestock manure
N and P loads from livestock manure were measured by multiplying livestock population by
manure production During 30-years period average N and P loads from livestock manures in
Peshawar Basin have been highly depended on the animal species
Figure-53 Input of N and P by different livestock in Peshawar Basin (average of 30 years)
For instance cattle manure contributed to the N input of the basin by 50 buffaloes by 19
goat by 16 equine by 8 sheep by 4 and camels by 1 For P load cattle manures
53
contributed by 37 sheep by 28 buffaloes by 14 goat by 12 equine by 5 and
camels by 1 (Figure 3) Changes in the N and P inputs could be attributed to the innate
concentrations of these nutrients in manures as well as excretion rate per livestock
553 WFgrey of N and P
Average of 30-years N-related WFgrey in Peshawar Basin showed that artificial fertilizer
contributed 61 livestock manure 36 household sources 2 and industries 1 For P-
related WFgrey the contribution from artificial fertilizer livestock manure and household
sources were 50 49 and 1 respectively The contribution from industrial sources found
as negligible (Figure 54)
Figure-54 Source to WFgrey () in Peshawar Basin (30 years average) (A) nitrogen (B)
phosphorus
Figure-55 N and P-related WFgrey in Peshawar Basin during 1986-2015
Both N and P-related WFgrey in Peshawar Basin steadily increased over the period of 1986-
2015 P-related WFgrey exhibited higher values than Nndashrelated WFgrey During 1986 the N-
54
related WFgrey was less than 30 108 m3y whereas P- WFgrey was slightly more than 40108
m3y However after 30 years period the average N-related WFgrey exceeded the amount of
50108 m3y and P-related WFgrey over the study period reached to a level of 50109 m3y
(Figure55)
554 WPL of N and P
WPL was used for environmental sustainability analysis of grey water footprint WPL for N
and P substantially enhanced during the period of 1986-2015 In the last 15 years the
increase in the water pollution was higher and fluctuated during the subsequent years The
consistent higher values of WPL in the last decade could be associated with the excessive
human activities in the forms of intensive agriculture raising of livestock industrialization or
urbanization The N-related WPL was within the sustainability limit of 100 for each
passing year during the study period whereas P-related WPL has exceeded the sustainability
limit (Figure 56)
555 WPL for reduced runoff scenarios
The study predicted the impacts of reduced runoff scenarios in the river on N and P linked
water pollution level of Kabul River Results of the N and P related WPL for the future
reduced runoff scenarios of 10 20 30 40 and 50 are given in Figure 56 N-related
WPL for the five simulated runoff scenarios were 19 21 24 28 and 34
respectively
Figure - 56 WPL in Kabul River of Peshawar Basin during 1986-2015
55
All these values remained within the sustainability limit of 100 P associated WPL
exceeded the sustainability limit for each scenario The WPL-P values were calculated in the
following pattern 194 218 249 291 and 349 respectively (Figure 57) Since P has
exceeded the sustainability limits therefore decrease in the quantity of water or increase in
the magnitude of P release may further exacerbate the quality of water in Kabul River This
situation could be harmful to ecosystem in terms of water quantity and quality after mixing of
drainage water untreated industrial and municipal wastewater
Figure - 57 N and P related WPL for five different reduced-runoff scenarios in Peshawar
Basin
56 Discussion
WFgrey determines the sustainability of water resources The study investigated WFgrey for N
and P load originated from different sources in Peshawar Basin during 1986 to 2015 Both N
and P-related WFgrey steadily increased during the investigation period The level of WFgrey
has been associated with factors like artificial fertilizers livestock manures household and
industrial sources WFgrey of N and P ascertained that Peshawar basin has adversely affected
the river water quality
Unfortunately there is no previous research concerning WFgrey in Peshawar Basin for
comparison of results However according to Mekonnen and Hoekstra 2015 N-related
WFgrey of Pakistan was 288 billion m3year in 2002-2010 where 262 billion m3year were
from agriculture 23 billion m3year from households and 3 billion m3year from industries
The Indus river basin has N-related WFgrey of 440 billion m3year as agriculture being the
main contributor (59) and households as the second (38) (Mekonnen and Hoekstra
56
2015) Nafees et al 2018 reported that 68 of wetlands in Peshawar Basin has been
converted into agricultural fields due to the shortage of water in Kabul River However this
study showed that high P-related pollution in river over last 30 years lead to eutrophication of
wetlands (Correl 1998) in the basin The local community convert these dry lands for
agriculture fields that further increases pollution by escalating application of fertilizers In the
absence of any previous published work this study confirms that environmental pollution has
degraded the quality of water in Kabul River This would render it unsuitable for agriculture
or domestic water supply Ahmadullah and Dongshik 2015
The reduced runoff scenarios exhibited higher level of N- and P-related WPL and further
reduction in volume of river water would certainly aggravate quality of water The proposed
hydro projects in Afghanistan would result in reduced water flow to Peshawar Basin This
would adversely affect downstream ecosystems and communities dependent on it (World
Bank 2010 and Mustafa 2016) Monitoring the Kabul river pollution is an effort for a good
water management in Pakistan Based on the literature review water in the Kabul River was
found to be unsuitable for drinking but fit for the irrigation purpose The reduction in the
inflow of Kabul river development would severely affect Pakistanrsquos existing and future water
usages for crops and may lead to economic deterioration and health issues
Since Kabul River is a shared resource of Pakistan and Afghanistan hence both countries
have the right to use it for their economic up-lift Factors like impacts of climate change
increasing demand for water and concerns for environment would lead to complex disputes
between two countries The issue can be harmoniously resolved through an institutionalized
agreement on sharing the Kabul river water equitably between the two riparian states In
Kabul river water treaty optimal quality and quantity of water must be considered Both the
governments should take measures for the protection and conservation of water for
sustainable economic and ecological activities such as fisheries eco-tourism recreation and
watershed management The deteriorating and depleting water resources of Kabul river
system also suggest that the water resources of Kabul River should be safeguarded to avoid
future conflicts
57
CHAPTER NO 6
CONCLUSIONS AND RECOMMENDATIONS
6 1 Conclusions
The goal of this thesis is analyze the environmental sustainability of blue green and grey
water footprint of Peshawar Basin This is first study of its kind on basin level in Pakistan and
the finding will contribute a lot in future research and policy making It is concluded that blue
and green water scarcity is less than 100 and is low water scarcity It provide a baseline
information for sustainability food security and crops water productivity Agriculture sector
has the highest blue and green water footprint of sugar cane maize and wheat alone
constitute about 94 and 92 of the total agriculture water footprint respectively
The average available blue water resources of Peshawar Basin over the last 30 years is
estimated as 6080 million m3year The population of the basin has increased by 57 during
this period as a result per capita blue water availability has dropped from 1700 m3 to 600 m3
The domestic water footprint of the basin has increased by 55 It is found that water
footprint of agriculture over the last 30 years has dropped by 12 due to agriculture land
being converted into buildup area The domestic and agriculture water footprint led to an
increase in blue water scarcity by 33 On the other hand buildup area has increased by 34
while pasture and agriculture land has declined by 9 and 4 respectively This change in
land use pattern has caused 8 reduction in 2022 million m3 of available green water as a
result the green water scarcity has reached to 99
The grey water footprint in relation to nitrogen and phosphorous over the last 30 years
steadily increased The application of nitrogen fertilizer has increased by 43 livestock
manure by 52 domestic sources by 64 and industrial sources by 60 while phosphorous
application from artificial fertilizers livestock manure domestic and industrial sources has
increased by 20 52 64 and 64 respectively As a result of this increased in nitrogen
and phosphorous load to surface water the grey water footprint has increased by 48 and
41 respectively
It is concluded that Kabul River contribute 576 m3sec and Swat River 411 m3sec to
Peshawar Basin Of this 576 m3sec of Kabul River water 276 m3sec of water comes from
Chitral River (a tributary of Kabul River originate in Pakistan and is called River Kunar in
Afghanistan) The total supply of water from Afghanistan is estimated as 300 m3sec which
is only 30 of total supply to the basin In all reduced runoff scenarios (10-50) the water
58
pollution level of nitrogen was within sustainability limits whereas the values for
phosphorous has exceeded the sustainability limit in each scenario
This finding would be help for policy makers for efficient irrigation management and water
conservation in Peshawar Basin The study further show the deterioration of water quality of
Kabul River and the finding may be helpful for future planning and management of the basin
59
62 Recommendations
There is a dire need for the collaborative efforts of all relevant stakeholder to come forward
for a practical solution of water scarcity in Peshawar Basin The following recommendations
are made based on the finding of this study
The crop water productivity can be increase by introducing efficient irrigation
techniques in Peshawar Basin
Crops with high WF and low economic benefit may be replace low WF and high
economic benefits
To reduce the grey water footprint organic forming may be maximise and an efficient
utilization of artificial fertilizer by optimize the timing and techniques of application
fertilizer
Minimize the water losses from storage and during distribution system via
evaporation efficient irrigation schedule by improving timing and volume of water
There must be an integrated policy of agriculture water energy and trade to ensure
sustainable use of water resources
Government should introduce policy that regulate building of housing societies on
agriculture land to help prevent the conversion of agriculture land in build-up area
The rapid conversion of agriculture fields and pasture land into housing societies is
alarming There must a policy to regulate this practice to minimize the green water
scarcity
Nitrogen and phosphorous fertilizer must be applied in phases to reduce reaching-
runoff to Kabul River water
The study suggest further research to estimate the virtual water export to know how
much of water Peshawar Basin is exporting
Awareness project and programs for general local community may be encourage
regarding efficient use of blue water
60
References
Ababaei B and Ramezani Etedali H (2017) Water footprint assessment of main cereals in
Iran Agricultural Water Management httpsdoiorg101016jagwat201607016
Adeel Z (2004) Focus on new water issues-perspectives at the end of the international year
of freshwater Global Environmental Change 141-4
Afshar and Neshat A (2013) lsquoEvaluation of AquaCrop computer model in the potato under
irrigation management of continuity plan of Jiroft region Kerman Iranrsquo Int J Adv Biol
Biom Res 1669-1678
Ahmad B (2011) Water Management A Solution to Water Scarcity in Pakistan 9(2) 111ndash
125
Ahmad H Yousafzai A M Siraj M Ahmad R Ahmad I Nadeem M S Ahmad W
Akbar N Muhammad K (2015) Pollution Problem in River Kabul Accumulation
Estimates of Heavy Metals in Native Fish Species Biomed Res Int
Ahmadullah R Dongshik K (2015) Assessment of potential dam sites in the Kabul river
basin using GIS Inter J Adv Comp Sci Appl 6(2) 83-89
Akhtar S M Iqbal J (2017) Assessment of Emerging Hydrological Water Quality Issues
and Policy Discussion on Water Sharing of Transboundary Kabul River Water Policy 19
(4) 650ndash672
Akif M Khan A R Sok K Hussain Z (2002) Textile Effluents and Their Contribution
Towards Aquatic Pollution in the Kabul River (Pakistan) JourChem SocPak 24 (2)
106-111
Alexandratos Nikos and Bruinsma Jelle (2012) World agriculture towards 20302050 The
2012 revision Global Perspective Studies Team FAO Agricultural Development
Economics Division wwwfaoorgeconomicesa
Ali M Y (2004) ldquoToxicological Effects of Industrial Effluents Dumped in River Kabul on
MahaseerTor Putitora at Aman Garh Industrial Area Nowshera Peshawar Pakistanrdquo
1ndash316
Ali (1993) Water Quality Assessment of River Swat master thesis Department of
Environmental Planning and Management University of Peshawar Peshawar 13-28
Ali N (2015) Indus Water Treaty between Pakistan and India From Conciliation to
Confrontation Dialogue (1819-6462) 10(2)
Allan J A (1997) ldquoVirtual Waterrdquo A Long Term Solution for Water Short Middle Eastern
Economies London Sch Orient African Stud Univ London No September 24ndash29
61
Archer D R N Forsythe H J Fowler and S M Shah (2010) ldquoSustainability of Water
Resources Management in the Indus Basin under Changing Climatic and Socio Economic
Conditionsrdquo Hydrology and Earth System Sciences 14(8) 1669ndash80
Azizullah A Khattak M Richter P Haumlder D (2011) Water Pollution in Pakistan and Its
Impact on Public Health mdash A Review Environ Int 37 (2) 479ndash497
Bhatti Asif M and Seigo Nasu (2010) ldquoSociety for Social Management Systems (SSMS-
2010) Domestic Water Demand Forecasting and Management Under Changing Socio-
Economic Scenariordquo
Bisht M (2013) Water Sector in Pakistan Policy Politic Management Institute for
Defence Studies and Analysis New Delhi India
Bouwman A F Lee D S Asman W A H Dentener F J Van Der Hoek K W
Olivier JG(1997) Global High-Resolution Emission Inventory for Ammonia Global
Biogeochemical Cycles pp 561ndash587
Briscoe John and Usman Qamar (2005) ldquoINDIArsquoS WATER ECONOMY Bracing for a
Turbulent Future THE WORLD BANK Agriculture and Rural Development Sector South
Asia Regionrdquo World Bank
httpdocumentsworldbankorgcurateden989891468059352743pdf443750PUB0PK0W1
Box0327398B01PUBLIC1pdf
Bulsink F Hoekstra A Y and Booij M J (2009) The water footprint of Indonesian
provinces related to the consumption of crop products Value of Water Research Report
Series No 37 119ndash128 httpsdoiorg105194hess-14-119-2010
Butt JA and Mirza MR (1981) Fishes of the vale of Peshawar North West Frontier
Province Pakistan Biologia (Pakistan) 27 145-163
Butt JA 1(986) Fish and fisheries of North West Frontier Province Pakistan Biologia
(Pakistan) 32 21-34
Cazcarro I Hoekstra AY Saacutenchez Choacuteliz J(2014) The water Footprint of Tourism in
Spain Tour Manag 40 90ndash101 httpdxdoiorg101016jtourman2013 05010
Chapagain AK and Hoekstra AY (2003) Virtual water trade A quantification of virtual
water flows between nations in relation to international trade of livestock and livestock
products
Chapagain A K and Hoekstra A Y (2011) The blue green and grey water footprint of
rice from production and consumption perspectives Ecological Economics 70(4) 749ndash
758 httpsdoiorg101016jecolecon201011012
62
Chen H S (2015) Using Water Footprints for Examining the Sustainable Development of
Science Parks Sustain 7 (5) 5521ndash5541
Chenoweth J Hadjikakou M Zoumides C (2014) Quantifying the human impact on water
resources a critical review of the water footprint concept Hydrology and Earth System
Sciences Jun 24 18(6)2325-42
Chouchane H Hoekstra A Y Krol M S and Mekonnen M M (2015) The water
footprint of Tunisia from an economic perspective Ecological Indicators 52 311ndash319
httpsdoiorg101016jecolind201412015
Chukalla AD Krol MS Hoekstra AY (2015) Green and blue water footprint reduction in
irrigated agriculture effect of irrigation techniques irrigation strategies and mulching
Hydrology and earth system sciences 19(12)4877
Chukalla A D Krol M S and Hoekstra A Y (2015) Green and blue water footprint
reduction in irrigated agriculture Effect of irrigation techniques irrigation strategies and
mulching Hydrology and Earth System Sciences 19(12) 4877ndash4891
httpsdoiorg105194hess-19-4877-2015
Correll D L (1998) The Role of Phosphorus in the Eutrophication of Receiving Waters A
Review J Environ Qual 27261-266doi102134jeq199800472425002700020004x
Cucek L Klemes JJ Varbanov PS Kravanja Z (2015) Significance of environmental
footprints for evaluating sustainability and security of development Clean Technol
Environ Policy 17 (8) 2125e2141
Dessu S B Melesse A M Bhat M G and McClain M E (2014) Assessment of water
resources availability and demand in the Mara River Basin Catena 115 104-114
Dos Santos Cristiane Engel et al (2013) ldquoVasculite C-ANCA Relacionada Em Paciente
Com Retocolite Ulcerativa Relato de Casordquo Revista Brasileira de Reumatologia 53(5)
441ndash43
Duan P Qin L Wang Y and He H (2016) Spatial pattern characteristics of water
footprint for maize production in Northeast China Journal of the Science of Food and
Agriculture 96(2) 561ndash568 httpsdoiorg101002jsfa7124
Dudgeon D Arthington A H Gessner M O Kawabata Z I Knowler D J Levacute eque
C Naiman R J Prieur-Richard A ˆ H Soto D and Stiassny M L J(2006)
Freshwater biodiversity importance threats status and conservation challenges Biol
Rev 81 163ndash182
63
Dumont A Salmoral G and Llamas M R (2013) The water footprint of a river basin
with a special focus on groundwater The case of Guadalquivir basin (Spain) Water
Resources and Industry 1 60-76
EPA-KP (2014) Provincial Assemble Khyber Pakhtunkhwa Government Press Khyber
Pakhtunkhwa
Ercin A E and Hoekstra A Y (2014) Water footprint scenarios for 2050 A global
analysis Environment international 64 71-82
Ercin E Wiedmann T Giljum S Galli A Knoblauch D and Ewing B (2011)
Integrating Ecological Carbon and Water footprint into a ldquoFootprint Familyrdquo of
indicators Definition and role in tracking human pressure on the planet Ecological
Indicators 16 100ndash112 httpsdoiorg101016jecolind201106017
Eva M M Deakin J Archbold M Gill L Daly D and Bruen M (2017) Sources of
nitrogen and phosphorus emissions to Irish rivers and coastal waters Estimates from a
nutrient load apportionment framework Science of The Total Environment 601ndash602
326-339 httpsdoiorg101016jscitotenv201705186
Falconer R A Norton M R Fernando H J S Klaiaelig Z and McCulley J L (2012)
Global Water Security Engineering the Future National Security and Human Health
Implications of Climate Change in NATO Science for Peace and Security Series C
Environmental Security Springer Netherlands 261ndash269
Falkenmark M (2003) freshwater as shared between society and ecosystems from divided
approaches to integrated challenges Philos T R Soc Lon B 358 2037ndash2049
Falkenmark M and Rockstrom J (2006) The new blue and green water paradigm
Breaking new ground for water resources planning and management J Water Res Pl-
ASCE 132 129ndash132 doi101061(ASCE)0733-9496(2006)1323(129)
Fang K Heijungs R Duan Z De Snoo G R (2015) The Environmental Sustainability
of Nations Benchmarking the Carbon Water and Land Footprints against Allocated
Planetary Boundaries Sustain 7 (8) 11285ndash11305
FAO (2003) Livestock Sector Brief Pakistan Livestock Information Sector Analysis and
Policy Branch
Favre R and Kamal G M (2004) Watershed Atlas of Afghanistan Ministry of Irrigation
Water Resource and Environment Kabul Afghanistan
64
Franke N A Boyacioglu H and Hoekstra AY (2013) Grey Water Footprint Accounting
Tier 1 Supporting Guidelines UNESCO-IHE Institute of Water Education Delft
Netherlands
Franke N Mathews R (2011) Grey Water Footprint Indicator of Water Pollution in the
Production of Organic vs Conventional Cotton in India Water Footpr Netw
Gardner-Outlaw Tom and Robert Engelman (1997) ldquoSustaining Water Easing Scarcityrdquo
Revised Data for the Population Action International Report Sustaining Water Population
and the Future of Renewable Water Supplies 20
Government of Afghanistan (2017) Afghanistan National Peace and Development
Framework (ANPDF)
Government of Khyber Pakhtunkhwa (2017) Development Statistics of Khyber
Pakhtunkhwa Pakistan
Government of Pakistan (1986-2015) Agriculture Census Organization Census of Livestock
NWFP Report Lahore
Government of Pakistan (1986-2015) National Fertalizer Development Centrre National
Fertalizer Annual Report Islamabad
Government of Pakistan (2014) Ministry of Science and Technology Pakistan Council for
Science and Technology Pakistanrsquos Water Technology Foresight
Government of Pakistan (2018) Bureau of statistic wwwpbsgovpk
Government of Pakistan (1986-2015) Water and Power Developent Authority (WAPDA)
Tarbella Pakistan
Government of Pakistan (2014) Ministry of Science and Technology Pakistan Council for
Science and Technology Pakistanrsquos Water Technology Foresight
Government of Pakistan Bureau of Statistic (2017) (wwwpbsgovpk) (accessed on
09112017)
Government of Pakistan Bureau of statistics 2017 httpwwwpbsgovpk (accessed on
09112017)
Government of Pakistan (2016) Ministry of Finance Pakistan economic survey
Government of Pakistan (2014) Pakistanrsquos water technology foresight Pakistan council for
science and technology Ministry of Science and Technology
Hassan M (2016) Development Advocate Pakistan- water security in pakistan issues and
challenges Development Advocate Pakistan 3(4) 1ndash33
65
Helen P J Neal C and Paul J A (2006) Sewage-effluent phosphorus A greater risk to
river eutrophication than agricultural phosphorus Science of The Total Environment 360
(1ndash3) 246-253 httpsdoiorg101016jscitotenv200508038
Hoekstra AY and Hung PQ (2003) Virtual water trade A quantification of virtual water
flows between nations in relation to international crop trade
Hoekstra A Y and Chapagain A K (2008) Globalization of Water Sharing the Planetrsquos
Freshwater Resources Blackwell Publishing Oxford
Hoekstra A Y and Mekonnen M M (2010) The Green Blue and Grey Water Footprint of
Crops and Derived Crop Products Main Report Value of Water Research Report Series
No 47 1(16) 80 httpsdoiorg105194hess-14-1259-2010
Hoekstra A Y Chapagain A K Aldaya M M and Mekonnen M M (2011) The Water
Footprint Assessment Manual Febrero 2011 httpsdoiorg978-1-84971-279-8
Hoekstra A Y Mekonnen M M Chapagain A K Mathews R E and Richter B D
(2012) Global monthly water scarcity blue water footprints versus blue water
availability PLoS One 7(2) e32688
Hoekstra AY (2003) lsquoVirtual water trade Proceedings of the International Expert Meeting
on Virtual Water Tradersquo Value of Water Research Report Series No12 UNESCO-IHE
Delft 2003 The Netherlands available at httpwwwwaterfootprintorg
ReportsReport12pdf (Last accessed 22 August 2016)
Hoekstra AY Chapagain AK (2007) Water footprints of nations water use by people as
a function of their consumption pattern Water Resour Manag 21 (1) 35e48
Hoekstra AY Hung PQ (2002) Virtual water trade a quantification of virtual water
flows between nations in relation to international crop trade Value water Res Rep Ser
166
Hoekstra Arjen Y (2008) Water neutral Reducing and offsetting the impacts of water
footprints
Hoekstra Arjen Y (2012) ldquoGlobal Monthly Water Scarcity Blue Water Footprints versus
Blue Water Availabilityrdquo PLoS ONE 7(2)
IIASA ISRIC ISSCAS FAO JRC (2018) Harmonized World Soil Database (version
12) FAO Rome Italy and IIASA Laxenburg Austria
(httpwebarchiveiiasaacatResearchLUCExternal-World-soil-database)
Iqbal Abdul Rauf (2010) ldquoWater Shortage in Pakistan ndash a Crisis around the Cornerrdquo ISSRA
Papers 1ndash13
66
Iqbal U Qasim H Khan A K Rashid R Nasreen S Mahmood Q Khan J (2009)
Surface and Ground Water Quality Risk Assessment in District Attock Pakistan World
Appl Sci J 7 (8) 1029ndash1036
Iqrar M (1994) Survey of Khazana Sugar Mill Peshawar A Case Study of Nasir Killy
Village Program Master thesis Department of environmental planning and management
University of Peshawar Pakistan
IUCN Pakistan (2010) ldquoTowards Kabul Water Treaty Managing Shared Water Resources ndash
Policy Issues and Optionsrdquo
IUCN (1994) Pollution and the Kabul River An Analysis and Action Planning Department
of Environmental Planning and Mangement University of Peshawar
Jan A N Khan Q Khan A Raziq S Muhammad A (2014) Monitoring of Water
Quality Parameters to Know the Suitability of Water for Fish Fauna at River Sardaryab
Khyber Pakhtunkhwa Pakistan Correspondence 1 (3) 31ndash37
Javed B (1989) ldquoStudy of Physical Chemistry and Biological Parameter of Kabul River at
Nowsherardquo Department of Zoology University of Peshawar
Jehangir W A Masih I and Ahmed S (2007) Sustaining Crop Water Productivity in
Rice-Wheat Systems of South Asia A Case Study from the
Jose A Elena C and Javier T (2010) Water quality and nonpoint pollution in Re-
thinking Water and Food Security CRC Press 251ndash 256
Kamin K Arif M Khattak M A and Shah R A (1985) Chemical Characteristic of
Drinking Water of NWFP Part-1 Pakistan Council Scientific and Industrial Reseach
(PCSIR) Peshawar Pakistan
Karn S K Harada H (2001) Surface Water Pollution in Three Urban Territories of Nepal
India and Bangladesh Environ Manage 28 (4) 483ndash496
Khalid K (1989) ldquoPrimary productivity Oxygen and Biological Oxygen Demand in Kabul-
Indus drainage System at Michni Nowshera and Manori NWFP Pakistanrdquo Department of
Zoology University of Peshawar pp-20-34
Khan B Khan H Muhammad S Khan T (2012 ) Heavy metals concentration trends in three
fish species from Shah Alam River (Khyber Pakhtunkhwa Province Pakistan) Journal of
Natural and Environmental Sciences 23(1)1-8
Khan A R Kashif M and Riaz M (1999) Impact of Industrial Discharge on the Quality
of Kabul River Water at Amangarh Nowshera Pakistan Journal of Chemical Society of
Pakistan 21(2) 97-105
67
Khan B and Zahidullah (1991) ldquoAquatic Pollution Due To Industries in River Kabul at
Amangarh Nowshera NWFP (Pakistan)rdquo MSc thesis DEPM Peshawar University
Khan B Khan H Muhammad S Khan T (2012) Heavy Metals Concentration Trends In
Three Fish Species From Shah Alam River (Khyber Pakhtunkhwa Province Pakistan) J
Nat Environ Sci 3 (1) 1ndash8
Khan S A and Khan M (1997) Water Quality Characteristics of the Kabul River in
Pakistan Under High Flow Conditions Jourrnal of Chemical society of Pakistan 19(3)
201-209
Khan S et al (2013) lsquoDrinking water quality and human health risk in Charsadda district
Pakistanrsquo Journal of Cleaner Production 60(April 2015) pp 93ndash101httpsdoi
101016jjclepro201202016
Khan S Shahnaz M Jehan N Rehman S Shah M T Din I (2013) Drinking Water
Quality and Human Health Risk in Charsadda District Pakistan J Clean Prod 60 93ndash
101
Khan T Muhammad S and Khan B (2011) Investigating the Levels of Selected Heavy
Metals in Surface Water of Shah Alam River (A Tributary of River Kabul Khyber
Pakhtunkhwa) 44 (2) 71ndash79
Khana AR Akif M Wadud S and Khan K (1999) Pollution Studies of Kabul River and
Its Tributaries for the Assessment of Organic Strength and Fecal Coliform Journal of
Chemical Society of Pakistan 21(1) 41-47
Khanb A R Kashif M and Riaz M (1999) Impact of Industrial Discharge on the Quality
of Kabul River Water at Amangarh Nowshera Pakistan Journal of Chemical Society of
Pakistan 21(2) 97-105
Khattak RA and A Rehman (1992) ldquoEffect of disposal of industrial wastes on the quality
of Kabul River water and soil at Pirsanakrdquo A final project report NWFP Agriculture
University Tipan Project Peshawar Pp 15-45
Khoso S Wagan F H Tunio A H and Ansari A A (2015) An overview on emerging
water scarcity in pakistan its causes impacts and remedial measures Journal of Applied
Engineering Science 13(1) 35ndash44 httpsdoiorg105937jaes13-6445
Khyber Pakhtunkhwa development statistics (2014) Bureau of statistics planning and
development department Government of Khyber Pakhtunkhwa
Klemes JJ Varbanov PS Lam HL (2009) Water footprint water recycling and food
industry supply chain In Waldron K (2009 Waste Management and Co-product
68
Recovery in Food Processing vol 2 Woodhead Publishing Limited Cambridge UK
ISBN 978 1 84569 391 6
Launiainen S Futter M N Ellison D Clarke N Fineacuter L Houmlgbom LRing E (2014)
Is the water footprint an appropriate tool for forestry and forest products The
fennoscandian case Ambio 43(2) 244ndash256 httpsdoiorg101007s13280-013-0380
Lee Y-J (2015) Land carbon and water footprints in Taiwan Environ Impact Assess
Rev 54 1ndash8 httpdxdoiorg101016jeiar201504004
Liu C Kroeze C Hoekstra A Y Gerbens-Leenes W (2012) Past and Future Trends in
Grey Water Footprints of Anthropogenic Nitrogen and Phosphorus Inputs to Major World
Rivers Ecol Indic 18 42ndash49
Lovarelli D Bacenetti J and Fiala M (2016) Water Footprint of crop productions A
review Science of the Total Environment 548ndash549 236ndash251
httpsdoiorg101016jscitotenv201601022
M Amjad S (1996) ldquoQuantitative and Qualitative Analysis of the Suspended Sediment from
River of North West Frontier Province (NWFP)rdquo Unpublished thesis National Center of
Excellence in Geology University of Peshawar Pp 35-56
Ma D Xian C Zhang J Zhang R Ouyang Z (2015) The Evaluation of Water
Footprints and Sustainable Water Utilization in Beijing Sustain 7 (10) 13206ndash13221
Malley ZJ Taeb M Matsumoto T Takeya H (2009) Environmental sustainability and water
availability Analyses of the scarcity and improvement opportunities in the Usangu plain
Tanzania Physics and Chemistry of the Earth Parts ABC 34(1)3-13
Manzardo A Loss A Fialkiewicz W Rauch W Scipioni A (2016) Methodological
Proposal to Assess the Water Footprint Accounting of Direct Water Use at an Urban
Level A Case Study of the Municipality of Vicenza Ecol Indic 69 165ndash175
Mekonnen MM Hoekstra AY (2012) lsquoA global assessment of the water footprint of farm
animal productsrsquo Ecosystems 15(3)401-15
Mekonnen M M and Hoekstra A Y (2010) A global and high-resolution assessment of
the green blue and grey water footprint of wheat Hydrology and Earth System Sciences
14(7) 1259ndash1276 httpsdoiorg105194hess-14-1259-2010
Mekonnen M M Hoekstra A Y (2015) Global Gray Water Footprint and Water
Pollution Levels Related to Anthropogenic Nitrogen Loads to Fresh Water Environ Sci
Technol 49 (21) 12860ndash12868
69
Mekonnen M M Hoekstra A Y (2010) A Global and High-Resolution Assessment of the
Green Blue and Grey Water Footprint of Wheat Hydrol Earth Syst Sci 14 (7) 1259ndash
1276
Mekonnen M M Hoekstra A Y (2018) Global Anthropogenic Phosphorus Loads to
Freshwater and Associated Grey Water Footprints and Water Pollution Levels A High-
Resolution Global Study Water Resour Res 54 (1) 345ndash358
Mekonnen MM Hoekstra AY (2011) National Water Footprint Accounts the Green
Blue and Grey Water Footprint of Production and Consumption Value of Water Research
Report Series No 50 UNESCO-IHE Delft The Netherlands
wwwwaterfootprintorgReportsReport50-NationalWaterFootprints-Vol1pdf
Miglietta P P Toma P Fanizzi F P De Donno A Coluccia B Migoni D Bagordo
F Serio F A (2017) Grey Water Footprint Assessment of Groundwater Chemical
Pollution Case Study in Salento (Southern Italy) Sustain 9 (5)
Multsch S Pahlow M Ellensohn J Michalik T Frede H G and Breuer L (2016) A
hotspot analysis of water footprints and groundwater decline in the High Plains aquifer
region USA Regional Environmental Change 16(8) 2419-2428
Mustafa K (2016) The News International 5th June 2016
httpswwwthenewscompkprint125490-India-out-to-damage-Pakistans-water-interests-
on-Kabul-river (accessed on 10th September 2017)
Nafees M and Ghulam K (1992) Environmental Impact Assessment of Amangarh
Industrial Estate Nowshera Mphil Thesis Department of Environmental Planning and
Management University of Peshawar Pakistan
Nafees M Ahmed T and Arshad M (2011) lsquoA Review of Kabul River Uses and Its
Impacts on Fish and Fishermanrsquo Journal of Humanities and Social sciences XIX(2) pp
73ndash84
Nafees M Ahmad F Butt M N Khurshed M (2018) Effects of Water Shortage in
Kabul River Network on the Plain Areas of Khyber Pakhtunkhwa Pakistan Environ
Monit Assess 190 (6)
Nasreen A (2006) Monitoring of surface water groundwater air and soil in Peshawar basin
against time the 3rd dimension 2006 (doctoral dissertation University of Peshawar
Peshawar)
Nawab B (1992) Evaluation of Sewage Water Pollution in Peshawar City Master Thesis
Department of Environmental Planning and Management University of Peshawar
70
Pakistan
Noor A and Khan F (1983) Dissolved Oxygen and Biochemical Oxygen Demand of Kabul
River and Industrial Wastewaters of Nowshera Industrial Area Physical chemistry (3) 87-
95
Noor A and Saleem M (1982) ldquoDetermination of Chemical Pollutants in River Drinking
and Industrial Waste Water of NWFPrdquo National Center of Excellence in Physical
Chemistry University of Peshawar
Noor A Saleem M and Fazalullah (1982) Water Pollution Studies of the Urban and
Industrial Areas of NWFP Pakistan Physical Chemistry (2) 25-34
Nosheen N Ullah M Khan K A and Rehman A (2011) Impacts of Industrial Effluent
on River Kabul Hydro Nepal Journal of Water Energy and Environment (8) 44-47
httpdxdoiorg103126hnv8i04924
Nouri H Stokvis B Galindo A Blatchford M and Hoekstra A Y (2019) Water
scarcity alleviation through water footprint reduction in agriculture The effect of soil
mulching and drip irrigation Science of the Total Environment 653 241ndash252
httpsdoiorg101016jscitotenv201810311
Oki T and Kanae S (2006) Global hydrological cycles and world water resources Science
313 1068-1072 httpsdoi101126science1128845
Pakistan Bureau of Statistic Pakistan agricultural machinery census (2016) Khyber
Pakhtunkhwa
Pedro-Monzoniacutes M Solera A Ferrer J Andreu J and Estrela T (2016) Water
accounting for stressed river basins based on water resources management models
Science of the Total Environment 565 181ndash190
httpsdoiorg101016jscitotenv201604161
Pellicer-Martiacutenez F and Martiacutenez-Paz J M (2014) Assessment of inter-basin groundwater
flows between catchments using a semi-distributed water balance model Journal of
Hydrology 519 1848-1858
Pellicer-Martiacutenez F and Martiacutenez-Paz J M (2016) Grey water footprint assessment at the
river basin level Accounting method and case study in the Segura River Basin
Spain Ecological Indicators 60 1173-1183
Pellicer-Martiacutenez F and Martiacutenez-Paz J M (2016) The Water Footprint as an indicator of
environmental sustainability in water use at the river basin level Science of the Total
Environment 571 561ndash574 httpsdoiorg101016jscitotenv201607022
71
Sepah M P (1993) ldquoThe flood plain vegetation of Kabul River and its tributaries in Duaba-
Daudzai area Near Peshawar Pakistanrdquo Area study center (Central Asia) UOP
Pisinaras V Petalas C Gikas G D Gemitzi A and Tsihrintzis V A (2010)
Hydrological and water quality modeling in a medium-sized basin using the Soil and
Water Assessment Tool (SWAT) Desalination 250(1) 274-286
Qureshi A S Mc Cornick P G Sarwar A and Sharma B R (2010) Challenges and
prospects of sustainable groundwater management in the Indus Basin Pakistan Water
resources management 24(8) 1551-1569
Qureshi Z (2014) Water and sanitation in Khyber Pakhtunkhwa South Asian Cities
Confrence 2014 Karachi January 10th -12th Pakistan Urban Forum Karachi
Raes D (2011) The ETo Calculator Reference Manual Version 32 Food and Agriculture
Organization of the United Nations Rome Italy
Raes D Steduto P C Hsiao T and Fereres E (2011) Reference Manual AquaCrop
plug-in program Food and Agriculture Organization of the United Nations Land and
Water Division Rome Italy
Raes D Steduto P Hsiao T C and Fereres E (2009) AquaCrop-The FAO Crop Model
to Simulate Yield Response to Water II Main Algorithms and Software Description
Agron J 101 438ndash447
Raes D Steduto P Hsiao T C and Fereres E (2017) Chapter 3 ndash AquaCrop Version
61 Food and Agriculture Organization of the United Nations Land and Water Division
Rome Italy
Rauf M Ullah S Haseeb A Shah H Khan M (2015) Physiochemical Investigation of
River Kabul at Michini Khyber Pakhtunkhwa Pakistan 7 (3) 280ndash291
Ridoutt BG Pfister S (2010) A revised approach to water footprinting to make
transparent the impacts of consumption and production on global freshwater scarcity
Glob Environ Chang 20 (1) 113ndash120
httpdxdoiorg101016jgloenvcha200908003
Sadaf M and Zaman A (2013) ldquoPotential of Water Management Through Pakistani Water
International Water Technology Journal 3(3)
Salman SM (2008) The Baglihar difference and its resolution process-a triumph for the
Indus Waters Treaty Water Policy 10(2)105-17
Saxton K Rawls W J Romberger J and Papendick R1 (986) Estimating generalized
soil-water characteristics from texture Soil Sci Soc Am J 50 1031ndash1036
72
Schmidt Ralph et al (2001) ldquoEsources 2000 ndash2001rdquo World
Schwarzenbach R P Escher BI Fenner K Hofstetter TB Johnson CA Von Gunten U
Wehrli B ( 2006) The challenge of micro pollutants in aquatic systems Science
313(5790)1072-7
Schyns J F A Y Hoekstra and M J Booij (2015) ldquoReview and Classification of
Indicators of Green Water Availability and Scarcityrdquo Hydrology and Earth System
Sciences Discussions 12(6) 5519ndash64
Schyns J F A Y Hoekstra and M J Booij (2019) limits to the worldrsquos green water
resources for food feed fibre timber and bio-energy PhD Thesis The University of
Twente The Netherlands
Serio F Miglietta PP Lamastra L Ficocelli S Intini F De Leo F and De Donno A
(2018) Groundwater nitrate contamination and agriculture land use A grey water
footprint perspective in South Apulia Region (Italy) Sciences of the Total Environment
645 1425-1431
Shah M T and Tariq S (2001) Environmental Geochemistry of the Soil of Peshawar
Basin NWFP Pakistan Journal of Chemical Society of Pakistan 29 (5) 438-445
ShahinaT (2001) ldquoEnvironmental Geochemistry of Surface and Sub-Surface Water and Soil in
Peshawar Basin NWFP Pakistanrdquo National Center of Excellence in Geology University of
Peshawar NWFP Pakistan pp 80-128 173-176
Shaw EM (1994) Hydrology in Practice 3rd Edition Chapman and Hall London
Sheldrick W Keith Syers J Lingard J (2003) Contribution of Livestock Excreta to
Nutrient Balances Nutr Cycl Agroecosystems 66 (2) 119ndash131
Siebert S Kummu M Porkka M Doumlll P Ramankutty N and Scanlon B R (2015) A
global data set of the extent of irrigated land from 1900 to 2005 Hydrol Earth Syst Sci
19 1521-1545 httpsdoiorg105194hess-19-1521
Siegmann Karin Astrid and Shafqat Shezad (2006) ldquoPakistanrsquos Water Challenges A
Human Development Perspectiverdquo 1ndash38 httpssdpiorgpublicationsfilesA105pdf
Sohail A (1989) Bottom Fauna and Organic Matter in Bottom Mud of Kabul-Indus Drainge
System Master Thesis Department of Zoology University of Peshawar Pakistan
Steduto P Hsiao TC Fereres E (2007) On the conservative behavior of biomass water
productivity Irrigation Science 2007 Mar 1 25(3)189-207
Steduto P Hsiao TC Fereres E (2007) On the conservative behavior of biomass water
productivity Irrigation Science 25(3)189-207
73
Steduto P Hsiao TC Raes D Fereres E (2009) AquaCropmdashThe FAO crop model to
simulate yield response to water I Concepts and underlying principles Agronomy
Journal 101(3)426-37
Steduto P Hsiao T C and Fereres E (2007) On the conservative behavior of biomass
water productivity Irrig Sci 25 189ndash207
Steduto P Hsiao T C Raes D and Fereres E (2009) Aquacrop-the FAO crop model to
simulate yield response to water I concepts and underlying principles Agronomy
Journal 101(3) 426ndash437 httpsdoiorg102134agronj20080139s
Syed Sajid Ali Khurram Ashfaq Baloch and Saher Masood (2017) ldquoWater Sustainability in
Pakistan Key Issues and Challengesrdquo State Bank of Pakistanrsquos Annual Report 2016-17
93ndash103 httpwwwsbporgpkreportsannualarFY17Chapter-07pdf
United Nations (2012) Secretary General Ban ki-moon unwise use of water will result in
persisting hunger drought political instability Secretary-General warns in observance
message 2012 available at httpwwwunorgNewsPressdocs2012sgsm14163 dochtm
(last accessed 21 August) 2016
United Nations (2014) water and energy world water development report
Van Drecht G Bouwman A F Harrison J Knoop J M (2009) Global Nitrogen and
Phosphate in Urban Wastewater for the Period 1970 to 2050 Global Biogeochem Cycles
23 (3) 1ndash19
Van Oel P R and Hoekstra A Y (2012) Towards Quantification of the Water Footprint of
Paper A First Estimate of its Consumptive Component Water Resources Management
26(3) 733ndash749 httpsdoiorg101007s11269-011-9942-7
Vorosmarty CJ McIntyre PB Gessner MO Dudgeon D Prusevich A Green P Glidden S
Bunn SE Sullivan CA Liermann CR Davies PM (2010) Global threats to human water
security and river biodiversity Nature 467(7315)555-61
Wahid A and Muhammad G (1992) ldquoImpact of industrial effluents on Wheat and aquatic
fauna (fishes) in River Kabul near Amangarhrdquo MSc thesis DEPM Peshawar University
World Bank (2010) Scoping Strategic Options for Development of the Kabul River Basin
Sustainable Development Department South Asia Region
httpsopenknowledgeworldbankorghandle1098618422
World Bank (2011) World Bank Development Indicators 2011
httpsiteresourcesworldbankorgDATASTATISTICSResourceswdi_ebookpdf
74
Yan Y Jia J Zhou K Wu G (2013) Study of Regional Water Footprint of Industrial
Sectors The Case of Chaoyang City Liaoning Province China Int J Sustain Dev
World Ecol 20 (6) 542ndash548
Yang H Reichert P Abbaspour KC Zehnder AJA (2003) water resources threshold and its
implications for food security Environmental science and technology 37(14)3048-54
Yousafzai A M Khan A R Shakoori A R (2010) Pollution of Large Subtropical
Rivers-River Kabul Khyber-Pakhtun Khwa Province Pakistan Physico-Chemical
Indicators Pak J Zool 42 (6) 795ndash808
Yousafzai A M Khan A R Shakoori A R (2008) An Assessment of Chemical
Pollution in River Kabul and Its Possible Impacts on Fisheries Pak J Zool 40 (3) 199ndash
210
Yousafzai A M Shakoori A R (2007) Heavy Metals Bioaccumulation in the Muscle of
Mahaseer Tor Putitora as an Evidenceof the the Presence of Heavy Metals Pollution in
River Kabul Pakistan Pakistan J Zool 39 (1) 1ndash8
Yousif O K Babiker S A (1989) The Desert Camel as a Meat Animal Meat Sci 26 (4)
245ndash254
Zakir SN Ali L and Khattak SA (2013) Variation in major element oxide with time in the
soils of Peshawar Basin their comparison with the normal agricultural soil Journal of
Himalayan Earth Sciences 46(2)35-48
Zang C F J Liu M Van Der Velde and F Kraxner (2012) ldquoAssessment of Spatial and
Temporal Patterns of Green and Blue Water Flows under Natural Conditions in Inland
River Basins in Northwest Chinardquo Hydrology and Earth System Sciences 16(8) 2859ndash70
Zeng Z Liu J Koeneman P H Zarate E Hoekstra A Y (2012) Assessing Water
Footprint at River Basin Level A Case Study for the Heihe River Basin in Northwest
China Hydrol Earth Syst Sci 16 (8) 2771ndash2781
Zhaidllah Khan H Waseem A Mahmood Q Farooq U (2013) Water Quality
Assessment of the River Kabul at Peshawar Pakistan Industrial and Urban Wastewater
Impacts J Water Chem Technol 35 (4) 170ndash176
Zhang GP Hoekstra AY Mathews RE (2013) Water Footprint Assessment (WFA) for
better water governance and sustainable development Water Resour Ind 1-2 1ndash6
httpdxdoiorg101016jwri201306004
75
APPENDIX-A
Monthly mean maximum temperature (degC) at Peshawar weather station (1986-2015)
Year Jan Feb Mar Apr May Jun Jul Aug Sep Oct Nov Dec
1986 197 198 223 302 361 405 375 359 355 319 25 19
1987 214 21 219 309 329 396 405 389 376 308 275 225
1988 201 218 225 329 394 399 372 358 358 322 266 204
1989 178 195 231 302 374 409 388 353 358 323 259 199
1990 196 189 233 293 392 408 389 359 358 302 265 188
1991 175 187 231 276 335 40 397 365 341 316 257 203
1992 177 196 223 278 335 403 375 362 346 31 258 214
1993 179 234 218 314 384 401 375 387 351 319 27 233
1994 196 185 261 289 364 419 356 354 342 30 268 193
1995 193 209 234 269 372 427 378 356 351 322 271 203
1996 189 217 246 321 363 398 389 364 367 308 265 22
1997 192 219 242 277 338 386 383 366 358 277 236 182
1998 178 19 231 318 369 405 38 369 359 327 278 213
1999 168 207 252 343 399 423 392 37 367 33 261 237
2000 184 194 241 341 404 297 372 361 333 310 247 213
2001 188 225 270 310 396 393 362 361 345 314 246 210
2002 187 186 257 320 388 395 398 345 327 303 247 196
2003 188 187 239 306 349 410 365 353 340 302 244 212
2004 175 219 299 329 375 385 381 359 350 289 263 209
2005 164 163 240 308 329 404 375 377 355 310 248 206
2006 177 249 251 322 400 392 368 348 349 313 227 178
2007 200 185 233 342 363 393 365 367 345 315 241 198
2008 156 212 295 283 385 387 369 350 340 329 259 218
2009 190 206 255 291 372 391 387 374 359 325 248 213
2010 209 197 298 338 372 381 372 337 347 320 266 197
2011 184 186 271 307 392 403 364 354 342 306 259 213
2012 168 178 257 301 363 408 397 367 325 297 246 207
2013 193 187 264 304 376 390 371 352 351 312 243 205
2014 207 201 226 300 348 412 376 370 355 299 255 208
2015 195 213 238 304 354 385 359 348 343 302 235 200
76
Monthly mean minimum temperature (degC) at Peshawar weather station (1986-2015)
Year Jan Feb Mar Apr May Jun Jul Aug Sep Oct Nov Dec
1986 29 60 99 152 207 252 262 254 217 168 105 56
1987 42 74 118 162 197 234 258 271 242 161 92 49
1988 63 77 111 178 227 259 272 252 232 156 105 64
1989 38 55 115 143 205 258 257 248 220 157 99 65
1990 60 76 106 158 238 263 270 258 245 152 99 50
1991 34 62 105 148 196 243 266 260 232 145 88 67
1992 53 59 106 153 192 249 259 259 220 158 94 69
1993 30 83 96 164 220 246 256 260 229 149 98 50
1994 49 58 121 148 210 255 265 260 205 140 93 51
1995 26 60 96 143 206 252 267 251 214 161 85 39
1996 35 82 127 167 205 260 265 255 237 151 77 25
1997 27 51 110 156 187 244 276 256 239 165 97 55
1998 38 65 105 176 218 242 268 259 234 173 93 41
1999 64 86 116 172 223 258 271 260 244 169 104 46
2000 45 57 113 189 260 270 270 264 233 179 110 65
2001 39 82 129 181 249 274 266 268 229 181 107 74
2002 44 74 135 195 251 265 276 262 222 181 119 71
2003 52 80 123 179 213 269 264 257 242 164 96 60
2004 61 76 152 195 235 257 269 257 234 156 101 71
2005 42 70 133 158 193 247 264 257 233 158 89 26
2006 48 110 129 165 235 243 269 260 226 184 124 62
2007 41 89 120 189 221 260 267 268 234 149 102 58
2008 36 64 143 170 220 267 264 252 220 182 99 68
2009 76 83 125 162 206 224 259 269 234 156 92 53
2010 40 82 149 189 219 236 264 262 228 184 94 26
2011 30 82 126 162 229 263 257 254 231 167 116 28
2012 26 46 104 168 200 242 266 259 222 156 92 52
2013 26 74 122 162 210 249 261 255 234 177 84 50
2014 29 61 102 155 201 246 264 259 237 181 90 38
2015 43 90 115 175 217 247 269 257 211 167 102 46
77
Monthly mean rainfall (mm) at Peshawar weather station (1986-2015)
Year Jan Feb Mar Apr May Jun Jul Aug Sep Oct Nov Dec
1985 289 56 243 299 191 00 250 956 50 20 105 947
1986 190 709 737 327 148 160 235 415 247 00 641 350
1987 00 705 1636 85 334 196 49 00 57 333 00 30
1988 404 100 1629 137 40 100 164 654 55 80 00 306
1989 371 110 455 193 93 10 509 184 162 90 30 316
1990 497 678 542 262 170 24 94 745 450 522 85 469
1991 97 543 1414 585 714 10 130 200 50 20 30 50
1992 848 618 1142 730 594 20 40 1029 267 180 -10 330
1993 357 145 1785 344 123 554 584 -10 560 110 102 00
1994 170 775 600 800 255 140 1623 375 551 557 10 567
1995 00 490 1268 1304 253 10 925 990 650 130 130 30
1996 290 740 758 380 145 120 178 1100 510 2030 420 -10
1997 160 270 235 1433 290 380 455 130 120 938 40 285
1998 446 1440 670 690 315 255 970 650 215 75 -10 00
1999 1503 280 735 105 65 480 245 365 150 10 240 00
2000 370 285 410 50 100 125 110 160 468 90 -10 220
2001 -10 16 375 375 190 365 500 390 180 00 240 -10
2002 20 760 730 210 80 530 -10 870 200 20 80 380
2003 330 1315 660 1290 230 100 1560 1140 1110 700 420 190
2004 1090 930 00 600 00 00 70 570 350 246 156 344
2005 1310 1122 1392 298 370 00 310 116 713 40 123 00
2006 553 175 274 153 50 248 566 80 58 150 210 600
2007 00 1591 810 146 218 541 508 182 132 00 70 00
2008 635 89 106 1071 27 96 633 1363 120 00 16 138
2009 301 353 485 961 426 21 225 435 146 00 160 06
2010 206 947 100 201 139 292 291 954 83 00 00 92
2011 06 800 194 263 179 28 338 1674 450 313 196 00
2012 419 216 85 423 315 75 00 920 1146 141 27 775
2013 30 1810 1233 841 122 165 310 164 52 176 270 10
2014 52 406 1197 548 166 278 484 610 150 432 12 00
2015 337 701 1203 1141 392 00 1190 1584 533 520 296 80
78
Daily sunshine (hours) at Peshawar weather station (1986-2015)
Year Jan Feb Mar Apr May Jun Jul Aug Sep Oct Nov Dec
1986 830 648 695 875 1060 1014 936 712 917 938 723 550
1987 828 610 430 815 851 967 952 940 811 870 870 381
1988 507 691 369 808 1072 613 818 885 909 965 814 295
1989 655 675 530 865 1086 1042 896 845 862 920 720 269
1990 438 515 671 802 1052 000 1024 739 839 879 799 330
1991 687 495 638 576 789 1065 939 828 697 917 765 491
1992 830 648 695 875 1060 1014 936 712 917 938 723 550
1993 828 610 430 815 851 967 952 940 811 870 870 381
1994 507 691 369 808 1072 613 818 885 909 965 814 295
1995 655 675 530 865 1086 1042 896 845 862 920 720 269
1996 438 515 671 802 1052 000 1024 739 839 879 799 330
1997 687 495 638 576 789 1065 939 828 697 917 765 491
1998 597 579 802 825 994 976 945 961 866 916 875 618
1999 470 566 687 1007 1019 1015 873 767 762 892 689 655
2000 494 750 680 918 924 834 844 881 844 861 648 438
2001 675 770 811 807 1013 961 728 925 840 824 795 524
2002 646 464 709 691 941 786 923 608 800 760 586 485
2003 503 472 541 722 866 986 881 804 659 800 648 602
2004 316 700 783 683 1031 945 829 893 804 742 619 461
2005 523 342 553 655 769 958 833 783 712 641 565 559
2006 495 520 574 855 965 928 736 640 813 779 534 520
2007 737 363 615 819 713 897 853 733 660 629 447 575
2008 501 579 659 610 850 803 754 737 770 739 593 576
2009 509 518 552 694 900 806 888 822 793 776 604 530
2010 551 447 700 556 831 846 759 525 669 789 731 598
2011 567 317 673 767 948 906 766 736 686 717 585 651
2012 556 464 554 581 839 874 889 614 615 764 590 574
2013 615 428 688 695 875 853 765 649 655 566 532 507
2014 529 495 555 694 692 929 692 765 755 526 509 428
2015 439 421 447 667 805 858 677 650 692 639 353 520
79
Monthly mean rainfall (mm) at Risalpur weather station (1986-2015)
Year Jan Feb Mar Apr May Jun Jul Aug Sep Oct Nov Dec
1986 21 15 112 92 14 15 45 18 5 10 21 22
1987 000 903 1644 68 775 196 237 12 48 177 0 5
1988 632 26 1716 2 1 75 1635 1219 335 10 0 515
1989 45 167 477 105 16 0 876 96 13 13 0 243
1990 259 749 856 555 7 426 1316 266 37 585 55 654
1991 165 74 108 649 652 33 75 2236 53 0 5 21
1992 1229 51 869 654 183 0 43 596 1666 55 7 38
1993 44 343 1702 71 115 30 97 34 108 8 25 0
1994 17 832 40 591 40 16 314 173 63 65 0 87
1995 0 55 123 865 6 0 1377 260 23 7 17 8
1996 443 119 69 347 123 306 33 1554 285 616 8 8
1997 20 22 34 1915 20 14 131 315 7 0 6 73
1998 235 163 84 65 277 9 171 215 78 16 0 0
1999 185 35 49 4 6 36 113 200 21 0 23 0
2000 79 42 37 9 7 4 224 184 117 9 2 11
2001 0 3 39 12 34 39 185 202 8 0 4 1
2002 1 61 72 7 7 56 16 351 83 0 05 32
2003 28 173 91 67 20 6 180 123 42 16 12 51
2004 84 77 0 635 1 32 595 975 20 117 145 485
2005 129 130 795 4 49 10 185 260 136 18 16 0
2006 64 18 215 225 20 37 675 715 335 255 41 78
2007 1 266 148 36 245 82 41 59 49 0 18 0
2008 68 23 2 172 9 29 267 158 14 1 5 0
2009 59 55 82 134 18 3 163 30 34 6 21 0
2010 23 131 14 15 26 31 431 355 23 0 0 16
2011 5 984 366 313 3 14 4135 1114 303 322 64 0
2012 53 397 9 736 224 13 1224 542 953 37 24 1091
2013 12 2905 1144 545 52 92 4155 892 602 6 29 22
2014 51 505 1542 883 87 32 454 434 513 502 24 0
2015 312 472 1244 1571 333 01 1822 2314 72 1052 233 30
80
Potential and Actual Evapotranspiration of Weather Station in Peshawar Basin
Peshawar Weather Station Risalpur Weather Station
Year Potential ET
(mm Year-1)
Rainfall
(mm Year-1)
Actual ET
(mm year-1)
Potential ET
(mm Year-1)
Rainfall
(mm Year-1)
Actual ET
(mm year-1)
1986 1338 407 365 1331 691 546
1987 1344 343 316 1241 422 371
1988 1316 361 329 1254 652 515
1989 1348 251 239 1353 370 337
1990 1247 449 390 1364 616 507
1991 1271 384 345 1356 739 575
1992 1313 580 480 1375 714 565
1993 1349 469 410 1303 633 511
1994 1274 642 512 1258 957 656
1995 1350 619 508 1331 723 564
1996 1258 667 524 1241 604 487
1997 1264 443 387 1254 484 414
1998 1378 574 483 1353 852 631
1999 1398 407 368 1364 672 540
2000 1291 259 245 1356 724 568
2001 1351 268 254 1375 527 452
2002 1269 299 278 1303 687 541
2003 1256 905 635 1258 809 594
2004 1334 453 398 1354 615 506
2005 1227 625 497 1234 1017 672
2006 1275 498 425 1314 500 429
2007 1239 685 531 1259 725 554
2008 1247 817 596 1227 748 560
2009 1286 623 503 1288 605 493
2010 1233 839 603 1240 1065 690
2011 1270 426 375 1234 760 567
2012 1227 420 369 1314 676 536
2013 1226 562 461 1259 1077 699
2014 1224 455 393 1227 532 443
2015 1169 717 536 1288 956 662
81
APPENDIX-B
Peshawar Irrigation Divisionrsquos Canal System
S No Name of irrigation canal scheme
Discharge
(Cusec)
Length
(ft)
CCA
(Acres)
1 Kabul River Main Canal 800 1500 --
2 Kabul River Canal 450 198000 24338
3 Hazar Khani Branch 106 96000 9484
4 Kurve Branch 54 44000 6224
5 Wazir Garhi Minor 17 24500 2160
6 Pabbi Minor 10 15300 2234
7 Banda Mohib Minor 46 24150 1441
8 Branch Banda Mohib Minor 5 5000 449
9 Dehri Ishaq Minor 2158 21000 1234
10 Zakhai Lift irrigation Scheme 666 7000 562
11 Wazir Garhi Lift Irrigation Scheme 666 2500 714
12 Jue Sheikh Minor 350 143700 24889
13 Shah Mahal Minor 35 26200 1471
14 Yasin Abad Minor 08 8000 236
15 Jue Zardad Canal 3130 43000 1646
16 Mian Gujar Canal 35 25600 2567
17 Sangu Branch 10 4000 1355
18 Sheikhan Branch 16 5000 3266
Charsadda Irrigation Divisionrsquos Canal System
SNo Name of irrigation canal scheme
Discharge
(Cusec)
Length
(ft)
CCA
(Acres)
1 Doaba Canal 350 48500 25368
2 New Michni Minor 85 36180 357
3 Ucha Wala Minor 06 14500 363
4 Subhan Khwar Disty 63 15800 2397
5 Dalazak Minor 31 13000 2019
6 Ichri Branch 30 3466 2682
7 Shabqaddar Branch 14 15000 791
8 Sholgara Canal 174 9100 1953
9 Iceland Canal 53 29000 1808
10 Samkana Branch 185 30900 1511
82
Malakand Irrigation Divisionrsquos Canal System
S No Name of irrigation canal scheme
Discharge
(Cusec)
Length
(ft)
CCA
(Acres)
1 Mian Line Canal 3657 19850 666
2 Power Channel 1380 20975 1477
3 Pitched Channel 1380 20975 576
4 PC Minor 32 42250 3162
5 Abazai Branch 661 86000 8285
6 Meherdi Minor 28 31000 2919
7 Shingri Minor 29 17413 2927
8 Pirsado Disty 98 32367 5414
9 Qutab Garah Minor 29 22500 2964
10 Ghano Minor 15 10340 1462
11 Harichand Disty 51 1000 3022
12 Bari Bund Disty 188 56438 19236
13 Machai Branch 2355 105571 5512
14 Jalala Disty 155 75000 11056
15 Sher Garah Minor 37 25425 3538
16 Spokanda Disty 82 36560 2482
17 Hathian Minor 9 7708 873
18 Kalu Branch Minor 44 37925 4343
19 Kalu Shah Disty 6 9640 595
20 Dundyan Disty 18 16798 1957
21 Shamozai Disty 77 47898 2275
22 Lund Khawar Disty 55 46000 5478
23 Likpani Minor 14 10000 1324
24 Dheri Minor 17 11166 1702
25 Shamozai Tail Minor 17 14150 1892
26 Sarwala Disty 20 13440 1802
27 Said Abad Disty 77 54000 6710
28 Pirabad Minor 10 15000 953
29 Katlang Disty 104 44192 10603
30 Hero Shah Minor 26 42000 2143
83
APPENDIX-C
Mardan Irrigation Divisionrsquos Canal System
S No Name of irrigation canal scheme
Discharge
(Cusec)
Length
(ft)
CCA
(Acres)
1 Main Canal 194000 5644
2 Disty No1 1810 1123
3 Disty No2 5400 1557
4 Sherpao Minor 3500 2371
5 Disty No3 2700 1796
6 Disty No4 5500 4247
7 Disty No5 9000 6462
8 Spinwari Minor 1200 683
9 Disty No6 48500 14220
10 Nisata Branch 19900 9452
11 Nisata Minor 5000 3755
12 Palosa Minor 4600 3262
13 Tangi LIS 1800 1766
14 Zardad Branch 3500 7431
15 Kheshki Branch 2000 4315
16 Maira Nistta LIS 0400 520
17 Main Canal 143600 000
18 Khan Mahi Branch 10900 8111
19 Disty No7 2500 2531
20 Disty No8 45400 16533
21 Korough Branch 9400 7202
22 Sheikh Yousaf Minor 3200 2102
23 Moho Dehri Minor 2800 1772
24 Rashakai Minor 6700 4158
25 Bara Bandaa Minor 1500 779
26 Turlandi Minor 2800 1879
27 Nowshera Minor 2600 2235
28 Disty No9 44000 13333
29 Minor No1 Disty No9 3500 2957
30 Minor No2 Disty No9 3500 2067
31 Minor No3 Disty No9 2500 1479
32 Power House Minor 1700 2100
33 Kalpani Disty 15800 4417
34 Kodinaka Minor No1Kalpani 4500 3364
35 Taus Minor No2Kalpani 4200 2269
36 Mohib Banda Minor Br 2 of Minor 2 500 867
37 Old Mayar 150 745
38 New Mayar Channel A 350 31500
39 New Mayar Channel B 225 354
40 Kandar Minor 1250 850
41 Main Channel 850 1154
42 Murdara Minor 100 154
84
Cover area and production of Wheat in Peshawar Basin
Wheat Area (Hectares) Wheat Production (Tonnes)
SNo Year Peshawar Chardadda Nowshera Mardan Peshawar Chardadda Nowshera Mardan
1 1981-82 79100 0 0 97900 147600 0 0 113000
2 1982-83 82400 0 0 99700 152200 0 0 116000
3 1983-84 67100 0 0 92900 127800 0 0 91100
4 1984-85 65400 0 0 95600 126500 0 0 102100
5 1985-86 79800 0 0 97200 149800 0 0 104300
6 1986-87 80700 0 0 95900 143300 0 0 108800
7 1987-88 67900 0 0 96900 121500 0 0 120200
8 1988-89 74900 0 0 96800 135900 0 0 132400
9 1989-90 51400 27100 0 47500 99900 59700 0 80400
10 1990-91 27200 27700 25700 47100 54200 60500 47500 82100
11 1991-92 27100 27300 26300 47600 55200 60100 49600 83400
12 1992-93 27700 27300 30800 47700 57100 65900 49200 85700
13 1993-94 26200 28200 27500 47100 57600 71900 44000 81100
14 1994-95 25500 30400 30000 47600 54500 80800 48000 82700
15 1995-96 30600 27300 29400 47400 65000 73600 53000 84100
16 1996-97 31900 35000 30000 47200 58400 69000 41600 76100
17 1997-98 37400 29000 30300 49500 86100 81800 57200 107100
18 1998-99 35700 28500 25300 44000 82200 78100 47700 87600
19 1999-00 35300 28700 25700 44500 73400 77100 47400 90100
20 2000-01 34800 29200 25900 44600 57600 58500 28700 85300
21 2001-02 35200 16100 15200 45000 59900 29400 35300 90500
22 2002-03 34200 27000 20400 45000 60100 71700 44100 82200
23 2003-04 34200 25700 22300 44900 59200 68400 48300 80700
24 2004-05 34500 27500 23100 45000 76100 47400 48300 78900
25 2005-06 34500 27300 23200 45000 76200 59500 48400 89900
26 2006-07 34500 27200 23300 45000 76500 66300 51300 99800
27 2007-08 34500 27200 23400 46000 78000 64100 49000 95500
28 2008-09 35300 33000 23400 50000 83600 86400 56800 99000
29 2009-10 35935 33265 23356 49446 78735 83635 55329 90734
30 2010-11 73477 27782 23005 46611 73477 73477 57598 98024
31 2011-12 36078 28484 23025 41886 79723 74499 57691 86297
32 2012-13 36952 29643 23058 41865 81399 74814 57377 80694
33 2013-14 36228 33123 23088 43943 80061 85508 57779 96350
34 2014-15 36362 27488 24841 42397 80291 70567 48909 80999
35 2015-16 37544 40446 25007 44123 80306 107690 52671 91004
85
Rice Area (Hectares) Rice Production (Tonnes)
SNo Year Peshawar Chardadda Nowshera Mardan Peshawar Chardadda Nowshera Mardan
1 1981-82 700 0 0 1100 1200 0 0 1500
2 1982-83 800 0 0 900 1400 0 0 1300
3 1983-84 600 0 0 900 1100 0 0 1200
4 1984-85 800 0 0 900 1400 0 0 1500
5 1985-86 800 0 0 1000 1600 0 0 1700
6 1986-87 900 0 0 1600 1800 0 0 2800
7 1987-88 800 0 0 1500 2200 0 0 2100
8 1988-89 700 0 0 1800 1700 0 0 3300
9 1989-90 600 100 0 1300 1100 300 0 2000
10 1990-91 500 100 0 1300 1000 300 0 2000
11 1991-92 400 100 100 1300 800 400 200 2100
12 1992-93 500 100 100 1300 1000 300 100 2200
13 1993-94 300 100 100 1300 600 300 100 2200
14 1994-95 400 100 100 1400 900 300 100 2200
15 1995-96 300 200 0 1300 600 400 0 2200
16 1996-97 300 100 0 1300 500 200 0 2200
17 1997-98 300 100 100 1300 600 400 100 2300
18 1998-99 300 100 100 1300 700 200 100 2100
19 1999-00 300 200 0 1300 600 400 100 2100
20 2000-01 300 200 100 1300 600 300 100 2200
21 2001-02 300 100 100 1400 600 300 100 2200
22 2002-03 300 100 100 1400 600 300 100 2100
23 2003-04 300 100 100 1400 700 300 100 2200
24 2004-05 300 100 100 1400 700 300 200 2400
25 2005-06 300 100 100 1400 700 200 100 2300
26 2006-07 300 100 100 1400 700 100 100 2400
27 2007-08 300 100 100 1400 700 100 200 2900
28 2008-09 300 100 100 1400 700 300 200 3100
29 2009-10 323 158 104 1889 677 379 191 4022
30 2010-11 196 110 97 1851 411 264 174 3498
31 2011-12 320 132 100 1749 670 292 178 3456
32 2012-13 336 116 85 1750 680 270 156 2853
33 2013-14 340 114 81 1739 711 273 153 3078
34 2014-15 750 108 82 1772 2199 257 153 3153
35 2015-16 345 121 79 1863 724 276 142 3321
86
Maize Area (Hectares) Maize Production (Tonnes)
SNo Year Peshawar Chardadda Nowshera Mardan Peshawar Chardadda Nowshera Mardan
1 1981-82 45600 0 0 58000 87500 0 0 93700
2 1982-83 45100 0 0 54100 86100 0 0 88300
3 1983-84 41600 0 0 59800 74300 0 0 99600
4 1984-85 39700 0 0 58900 68400 0 0 99000
5 1985-86 40500 0 0 68800 71100 0 0 129500
6 1986-87 41200 0 0 71000 71900 0 0 130100
7 1987-88 40300 0 0 68200 74100 0 0 114900
8 1988-89 38100 0 0 71200 71100 0 0 122100
9 1989-90 21700 17900 0 32300 38900 34600 0 57400
10 1990-91 23100 18900 0 32300 40000 36500 0 61400
11 1991-92 14600 18400 8500 32600 26800 36500 15800 59200
12 1992-93 15500 17600 10300 32300 25600 30000 18600 56700
13 1993-94 14900 18100 11000 32300 24600 34500 20300 55800
14 1994-95 12600 18600 10100 32000 20500 38100 18200 56700
15 1995-96 13100 16500 11300 32400 20000 28000 22300 56900
16 1996-97 13100 18000 11500 32400 20900 32600 24000 56700
17 1997-98 14400 10900 11300 34300 23300 18600 23200 59900
18 1998-99 13800 18600 11300 28400 23000 36400 23300 50900
19 1999-00 15500 19100 10300 31000 26500 38400 20300 56700
20 2000-01 14600 18900 11500 31700 26200 33600 23400 59700
21 2001-02 16500 18100 11300 30900 29300 35700 23900 58500
22 2002-03 16600 15800 7300 29300 28900 26800 15800 54900
23 2003-04 16600 15800 11100 29100 29900 27000 23900 58700
24 2004-05 16700 17900 10800 29600 30000 30500 23400 59800
25 2005-06 16700 17600 10800 33100 30200 38700 23400 84700
26 2006-07 16600 17700 10800 31000 30000 40300 23600 83800
27 2007-08 16600 17400 10900 31000 29400 40300 24600 96600
28 2008-09 16900 16200 10900 32300 29800 56500 31000 110500
29 2009-10 16865 18172 10885 32113 29637 52610 31002 109036
30 2010-11 12482 12557 7946 32016 21911 33022 22472 106420
31 2011-12 16706 18181 10849 30530 29358 43259 29788 114587
32 2012-13 16730 14479 10726 30927 29441 36969 30236 100706
33 2013-14 16777 16406 10759 30977 29477 37752 30422 109963
34 2014-15 16754 16578 12340 29229 29311 37779 33095 94565
35 2015-16 16000 16319 12131 28992 29532 38330 33042 89651
87
Sugar Cane Area (Hectares) Sugar Cane Production (Tonnes)
SNo Year Peshawar Chardadda Nowshera Mardan Peshawar Chardadda Nowshera Mardan
1 1981-82 55000 0 0 26900 2409700 0 0 1087500
2 1982-83 54200 0 0 26500 2367200 0 0 1080500
3 1983-84 54000 0 0 31100 2227700 0 0 1264700
4 1984-85 51100 0 0 26400 2106800 0 0 1074400
5 1985-86 47800 0 0 27000 1973800 0 0 1092500
6 1986-87 48400 0 0 27200 2005400 0 0 1016500
7 1987-88 50100 0 0 33500 2122900 0 0 1401700
8 1988-89 51600 0 0 31400 2501000 0 0 1320400
9 1989-90 21700 29400 0 31000 1050500 1430700 0 1261900
10 1990-91 23200 28700 0 31000 1126900 1393500 0 1239600
11 1991-92 15900 28700 6100 31300 778800 1445200 314800 1264500
12 1992-93 15700 25100 6400 31000 786600 1295000 307800 1281300
13 1993-94 16200 25500 6300 31000 818800 1317400 300600 1281200
14 1994-95 14300 29200 5500 31000 719400 1518700 259300 1282400
15 1995-96 14700 28800 6100 31000 754200 1473100 291200 1285600
16 1996-97 14200 31800 5700 31000 726100 1620500 277000 1281300
17 1997-98 13700 33600 5500 27800 697700 1778200 268500 1176400
18 1998-99 12800 31900 5700 28500 655300 1682900 274900 1211800
19 1999-00 12600 33600 6400 29600 646700 1796300 308300 1256900
20 2000-01 12900 33600 5900 30900 666600 1646300 288500 1328800
21 2001-02 12200 31300 5700 31100 641900 1585700 285000 1451800
22 2002-03 12200 32200 5900 31200 645900 1662700 300300 1508800
23 2003-04 12200 32200 5600 31300 629900 1358200 285500 1521500
24 2004-05 11900 34700 5100 31000 612300 1483700 259000 1509700
25 2005-06 11900 31600 5000 29400 611400 1418300 253600 1347000
26 2006-07 11900 32200 5100 29400 613500 1429700 259500 1407800
27 2007-08 11900 32100 5200 29500 613000 1441000 260400 1412500
28 2008-09 11500 30800 5200 28400 598600 1376200 260500 1309700
29 2009-10 11566 31597 5154 29871 600749 1434152 261830 44430
30 2010-11 9480 20418 4742 30144 490905 914275 240112 1463491
31 2011-12 11034 32298 5182 31750 573116 1374566 262870 1511912
32 2012-13 11106 34593 5225 30436 576850 1502268 266241 1420448
33 2013-14 11164 32615 5240 30552 576880 1451177 265812 1463746
34 2014-15 11376 30012 4260 30689 568800 1368221 219279 1381285
35 2015-16 8134 31115 5263 30915 422998 1442903 270003 1369273
88
Tobacco Area (Hectares) Tobacco Production (Tonnes)
SNo Year Peshawar Chardadda Nowshera Mardan Peshawar Chardadda Nowshera Mardan
1 1981-82 4567 0 0 17052 7980 0 0 30220
2 1982-83 4130 0 0 17265 5850 0 0 30750
3 1983-84 5731 0 0 18309 11330 0 0 37170
4 1984-85 7936 0 0 18609 15747 0 0 38014
5 1985-86 6502 0 0 16422 12439 0 0 33607
6 1986-87 5499 0 0 13481 10701 0 0 28082
7 1987-88 4774 0 0 15510 9036 0 0 31292
8 1988-89 4754 0 0 15730 9116 0 0 32378
9 1989-90 225 4840 0 2962 398 9264 0 6887
10 1990-91 230 4980 0 3182 474 9795 0 6994
11 1991-92 0 7335 310 5100 0 15057 642 11644
12 1992-93 0 7794 774 7159 0 14481 1509 14351
13 1993-94 0 7730 880 5246 0 15670 1812 11062
14 1994-95 0 5579 560 4807 0 10723 1148 9983
15 1995-96 0 5221 500 4579 0 10331 1062 9815
16 1996-97 0 5644 620 4451 0 12628 1505 11026
17 1997-98 0 6567 500 5199 0 14444 1150 12036
18 1998-99 0 6571 560 5553 0 15282 1311 13491
19 1999-00 0 6189 600 5897 0 14353 1410 13945
20 2000-01 0 3997 350 4417 0 9579 827 11099
21 2001-02 0 4351 521 4904 0 10560 1276 12436
22 2002-03 0 3317 411 3471 0 8141 1048 8887
23 2003-04 0 2753 350 3920 0 6807 881 10320
24 2004-05 0 3364 596 6012 0 8311 1570 15675
25 2005-06 0 4420 962 7238 0 11413 2564 18464
26 2006-07 0 3108 1115 5163 0 8497 3010 14202
27 2007-08 0 3433 1151 5433 0 8677 2874 15893
28 2008-09 0 3467 1253 5745 0 9159 3351 16369
29 2009-10 0 3827 1450 6071 0 10660 4453 18662
30 2010-11 0 4420 1409 3607 0 10510 2544 10682
31 2011-12 0 4420 1409 3607 0 10510 2544 10682
32 2012-13 0 3670 1219 3935 0 10670 3626 10642
33 2013-14 0 3670 1219 3935 0 10670 3626 10642
34 2014-15 0 4194 1860 4123 0 12410 5500 12230
35 2015-16 0 4194 1860 4123 0 12410 5500 12230
89
Sugar Beet Area (Hectares) Sugar Beet Production (Tonnes)
SNo Year Peshawar Chardadda Nowshera Mardan Peshawar Chardadda Nowshera Mardan
1 1981-82 5833 6578 0 0 169174 190771 0 0
2 1982-83 4069 4588 0 0 96759 109112 0 0
3 1983-84 3836 0 0 4322 81859 0 0 96163
4 1984-85 1529 0 0 2185 46998 0 0 56139
5 1985-86 1093 0 0 2255 52935 0 0 82126
6 1986-87 6910 0 0 2731 176259 0 0 143091
7 1987-88 6974 0 0 4805 255741 0 0 200749
8 1988-89 4426 0 0 6847 140628 0 0 193818
9 1989-90 3035 1279 0 6575 98036 50344 0 175008
10 1990-91 2839 838 0 6723 105639 37956 0 208517
11 1991-92 2879 0 0 5979 106240 0 0 164757
12 1992-93 1781 616 0 5895 50193 17352 0 142681
13 1993-94 1518 728 0 4619 57224 42576 0 116872
14 1994-95 1895 1012 0 4561 48397 28327 0 154814
15 1995-96 1824 0 0 5945 56856 0 0 127074
16 1996-97 993 0 0 4223 39801 0 0 75623
17 1997-98 573 0 0 3329 6171 0 0 0
18 1998-99 546 0 0 0 32937 0 0 0
19 1999-00 1386 0 0 0 55123 0 0 129946
20 2000-01 1900 460 400 4346 58000 14000 12000 195000
21 2001-02 1972 467 500 5200 73100 17745 18500 123170
22 2002-03 1900 450 350 4000 58900 13900 10500 159098
23 2003-04 535 1493 89 5121 22812 63661 3795 88538
24 2004-05 180 501 43 2060 8436 20978 1778 52011
25 2005-06 212 599 68 2178 9730 27493 3121 50355
26 2006-07 27 565 162 1233 1103 23090 6620 58741
27 2007-08 16 200 21 1646 544 4114 483 0
28 2008-09 0 0 0 0 0 0 0
29 2009-10
30 2010-11
31 2011-12
32 2012-13
33 2013-14
34 2014-15
35 2015-16
90
Barley Area (Hectares) Barley Production (Tonnes)
SNo Year Peshawar Chardadda Nowshera Mardan Peshawar Chardadda Nowshera Mardan
1 1981-82 5700 0 0 7400 5800 0 0 6700
2 1982-83 6200 0 0 7400 6200 0 0 6600
3 1983-84 4200 0 0 9700 4400 0 0 6500
4 1984-85 2900 0 0 9900 3200 0 0 7200
5 1985-86 3400 0 0 9000 3800 0 0 7600
6 1986-87 3600 0 0 8200 4500 0 0 6400
7 1987-88 2900 0 0 8700 3800 0 0 7800
8 1988-89 3100 0 0 9000 3900 0 0 8200
9 1989-90 2700 1400 0 7000 3300 2000 0 6200
10 1990-91 1300 1600 1600 7000 1700 2100 1800 6900
11 1991-92 1300 900 1900 6900 1800 1200 2100 7100
12 1992-93 1100 700 1200 7800 1500 900 1600 8000
13 1993-94 900 800 1000 7000 1300 900 1300 5900
14 1994-95 1100 600 1100 6900 1400 1000 1400 6000
15 1995-96 1700 600 1000 6900 2500 900 1300 6000
16 1996-97 2100 600 900 7000 2800 700 1200 6000
17 1997-98 1600 500 1000 6900 2300 800 1400 6000
18 1998-99 1600 400 900 7000 2200 600 1100 2500
19 1999-00 1500 500 800 6900 2200 800 1100 2600
20 2000-01 1500 300 400 2700 2100 400 500 2300
21 2001-02 400 300 500 2700 600 400 600 2500
22 2002-03 700 400 800 2700 700 500 1100 2600
23 2003-04 300 400 700 2700 400 400 900 2600
24 2004-05 300 300 1100 2600 300 300 1300 2800
25 2005-06 300 100 1000 2600 300 200 1300 3000
26 2006-07 300 200 1100 2600 300 200 1400 3100
27 2007-08 300 100 1200 2500 300 200 1400 2900
28 2008-09 200 300 600 2500 200 400 700 3000
29 2009-10 84 328 615 2512 109 400 694 2299
30 2010-11 76 90 586 2192 96 109 647 1995
31 2011-12 63 120 581 1663 80 132 607 1508
32 2012-13 99 62 567 1610 121 68 571 1295
33 2013-14 51 19 554 1373 62 23 567 1170
34 2014-15 49 19 504 1364 50 24 662 1129
35 2015-16 79 0 337 1315 86 0 513 1053
91
Crops Cover Area in Peshawar Basin (Hactar) Rabi Crops (Winter) Kharif Crops (Summer) Perennial Crop
Year Wheat Rice Maize Sugar Cane Tobacco Sugar Beet Barley Total Area Wheat Tobacco Sugar Beet Barley Rice Maize Sugar Cane
1985-86 177000 1800 109300 74800 22924 3348 12400 401572 44 6 1 3 0 27 19
1986-87 176600 2500 112200 75600 18980 9641 11800 407321 43 5 2 3 1 28 19
1987-88 164800 2300 108500 83600 20284 11779 11600 402863 41 5 3 3 1 27 21
1988-89 171700 2500 109300 83000 20484 11273 12100 410357 42 5 3 3 1 27 20
1989-90 126000 2000 71900 82100 8027 10889 11100 312016 40 3 3 4 1 23 26
1990-91 127700 1900 74300 82900 8392 10400 11500 317092 40 3 3 4 1 23 26
1991-92 128300 1900 74100 82000 12745 8858 11000 318903 40 4 3 3 1 23 26
1992-93 133500 2000 75700 78200 15727 8292 10800 324219 41 5 3 3 1 23 24
1993-94 129000 1800 76300 79000 13856 6865 9700 316521 41 4 2 3 1 24 25
1994-95 133500 2000 73300 80000 10946 7468 9700 316914 42 3 2 3 1 23 25
1995-96 134700 1800 73300 80600 10300 7769 10200 318669 42 3 2 3 1 23 25
1996-97 144100 1700 75000 82700 10715 5216 10600 330031 44 3 2 3 1 23 25
1997-98 146200 1800 70900 80600 12266 3902 10000 325668 45 4 1 3 1 22 25
1998-99 133500 1800 72100 78900 12684 546 9900 309430 43 4 0 3 1 23 25
1999-00 134200 1800 75900 82200 12686 1386 9700 317872 42 4 0 3 1 24 26
2000-01 134500 1900 76700 83300 8764 7106 4900 317170 42 3 2 2 1 24 26
2001-02 111500 1900 76800 80300 9776 8139 3900 292315 38 3 3 1 1 26 27
2002-03 126600 1900 69000 81500 7199 6700 4600 297499 43 2 2 2 1 23 27
2003-04 127100 1900 72600 81300 7023 7238 4100 301261 42 2 2 1 1 24 27
2004-05 130100 1900 75000 82700 9972 2784 4300 306756 42 3 1 1 1 24 27
2005-06 130000 1900 78200 77900 12620 3057 4000 307677 42 4 1 1 1 25 25
2006-07 130000 1900 76100 78600 9386 1987 4200 302173 43 3 1 1 1 25 26
2007-08 131100 1900 75900 78700 10017 1883 4100 303600 43 3 1 1 1 25 26
2008-09 141700 1900 76300 75900 10465 0 3600 309865 46 3 0 1 1 25 24
2009-10 142002 2474 78035 78188 11348 0 3539 315586 45 4 0 1 1 25 25
2010-11 170875 2254 65001 64784 9436 0 2944 315294 54 3 0 1 1 21 21
2011-12 129473 2301 76266 80264 9436 0 2427 300167 43 3 0 1 1 25 27
2012-13 131518 2287 72862 81360 8824 0 2338 299189 44 3 0 1 1 24 27
2013-14 136382 2274 74919 79571 8824 0 1997 303967 45 3 0 1 1 25 26
2014-15 131088 2712 74901 76337 10177 0 1936 297151 44 3 0 1 1 25 26
2015-16 147120 2408 73442 75427 10177 0 1731 310305 47 3 0 1 1 24 24
92
APPENDIX-D
93
Number of Industrial Units Running in Peshawar Basin-2017
S No Nature of Industry Peshawar Nowshera Mardan Charsadda Total
1 Adhesive Tape 3 03
2 Aluminum 7 07
3 Arms and Ammunition 22 22
4 Beverages 7 1 1 09
5 Biscuit and Sweet 21 2 1 24
6 Carpet 14 14
7 Cement 2 02
8 Cement based 8 33 25 25 91
9 Ceramics 2 2 4
10 Chemical 15 1 16
11 Cigarette 1 4 1 5
12 Cold Storage 6 4 3 13
13 Cotton 2 1 3
14 Dall 2 1 3
15 Elect Goods 6 5 11
16 Engineering 39 2 41
17 Feed 1 1
18 Fiber Glass 2 2
19 Flour Mills 42 10 23 11 86
20 Formica 1 1
21 Furniture 26 2 1 29
22 Garments 2 2
23 Gases 2 1 3
24 Glasses 1 1
25 Ice Factory 17 10 2 5 34
26 Leather 6 6
27 Marble and Chips 52 82 115 1 250
28 Matches 13 2 1 16
29 Meet Process 1 1
30 Metal Work 7 1 1 9
31 Mining 2 2
32 Packages 16 2 2 20
33 Paints 2 2
34 Paper and Board 4 1 5
35 Pet Lube 1 1 2
36 Pharmacy 41 10 51
37 Plastic and Rubber 28 3 2 33
38 Poultry farm 1 1
39 Polyester Acrylic 1 1
40 Preservation of Fruits 4 4
41 Printing Press 29 1 30
42 Soap 5 1 2 8
43 Spice Grinding 1 1
44 Sugar 1 1 1
45 Textile loom Sec 1 1
46 Veg Ghee and Oil 3 1 4
47 Wood 11 11
48 Woolen 2 1 3
Total 475 187 185 44 891
94
APPENDIX-E
Monthly mean discharge (m3s) Kabul River at warsak gauge (1986-2015) Year Jan Feb Mar Apr May Jun July Aug Sep Oct Nov Dec
1986 160 180 214 497 736 1019 1440 1010 362 225 243 265
1987 166 166 344 565 764 1401 1325 806 508 248 193 164
1988 165 172 315 741 1194 1128 1258 793 367 216 188 158
1989 157 138 174 24 618 1142 909 615 353 205 175 175
1990 167 193 270 415 1330 1211 510 863 497 250 188 189
1991 190 240 400 953 1487 2121 1904 1093 582 315 224 228
1992 195 175 277 692 1496 1983 2216 1311 550 334 269 225
1993 232 205 312 666 1117 1349 1172 673 502 237 180 231
1994 166 182 234 428 979 1499 1687 1067 440 251 235 181
1995 169 171 241 561 1005 1594 1742 1042 374 247 203 177
1996 172 172 257 557 835 1603 1116 916 452 255 205 197
1997 149 146 179 608 1048 1661 1598 994 503 255 184 167
1998 163 217 287 948 1341 1148 1754 882 462 269 205 194
1999 218 218 256 447 1023 1105 962 747 441 233 200 189
2000 183 163 156 308 651 575 766 661 446 206 185 180
2001 147 146 185 347 795 969 1028 663 380 185 160 174
2002 138 147 214 479 804 1356 814 754 404 204 188 169
2003 141 146 228 622 755 1548 1459 826 439 247 225 183
2004 170 175 196 397 822 1156 863 683 395 315 218 184
2005 202 189 478 748 1038 1790 2139 1044 572 302 222 185
2006 186 196 243 381 1075 789 951 934 432 238 203 207
2007 172 211 435 1373 1414 1722 1392 861 497 242 194 181
2008 178 162 228 446 778 1185 856 749 323 204 172 155
2009 180 189 314 553 1086 1249 1771 1132 444 256 216 207
2010 175 189 309 483 947 1199 1614 1651 558 293 237 197
2011 175 184 250 420 931 872 841 841 459 242 208 172
2012 158 169 204 692 698 1290 1378 790 546 253 197 187
2013 170 210 441 530 1240 1791 1108 1121 454 296 223 227
2014 189 163 304 563 1219 1586 1455 771 366 412 213 179
2015 181 248 371 663 1085 1236 1474 1047 404 257 302 241
95
Monthly mean discharge (m3s) of Swat River at munda gauge (1986-
2015)
Year Jan Feb Mar Apr May Jun Jul Aug Sep Oct Nov Dec
1986 364 429 552 883 703 847 910 673 471 467 376 318
1987 259 485 495 646 754 854 856 717 588 538 496 481
1988 289 249 559 557 586 549 646 592 590 453 428 409
1989 332 349 451 629 845 899 807 584 437 540 384 287
1990 173 203 466 625 588 577 788 804 406 416 271 274
1991 364 429 552 883 703 847 910 673 471 467 376 318
1992 259 480 502 648 760 854 859 704 588 541 493 480
1993 283 248 559 557 586 549 646 592 590 453 428 409
1994 332 349 451 629 845 899 807 584 436 540 384 287
1995 173 203 466 625 588 577 788 804 406 416 271 274
1996 364 429 552 883 703 847 910 673 471 467 376 318
1997 259 480 502 648 760 854 859 704 588 541 493 480
1998 283 248 559 557 586 549 646 592 590 453 428 409
1999 332 349 451 629 845 899 807 584 436 540 384 287
2000 281 329 416 508 606 506 517 548 100 540 360 370
2001 92 73 158 160 398 440 429 379 273 133 96 48
2002 96 146 210 418 539 468 349 478 253 113 64 65
2003 90 118 243 497 517 629 545 421 277 158 116 102
2004 76 108 122 309 564 580 364 425 230 520 259 196
2005 241 296 624 654 633 756 861 499 378 272 84 83
2006 133 197 371 424 1259 602 745 794 294 55 131 223
2007 185 364 700 766 600 647 506 352 244 54 38 57
2008 79 86 272 610 651 729 524 448 115 43 34 35
2009 89 92 151 454 525 568 677 514 145 34 31 30
2010 60 220 406 483 587 479 857 947 352 120 49 37
2011 51 285 271 323 511 445 401 408 290 115 73 40
2012 112 256 173 384 233 579 606 423 335 78 60 96
2013 168 327 436 293 459 727 491 518 227 219 224 219
2014 242 283 363 364 538 548 572 373 175 165 155 95
2015 96 199 306 431 387 426 562 460 113 56 149 92
96
Mean monthly discharge of Kabul River at Nowshera gauge (m3s) (1986 -2015)
Year Jan Feb Mar Apr May Jun Jul Aug Sep Oct Nov Dec
1986 332 327 493 1308 1846 2132 1538 842 538 348 230 243
1987 308 272 716 1006 1192 1757 1717 1100 714 453 255 214
1988 283 255 484 1027 1700 1643 1967 1491 536 303 225 256
1989 317 213 316 609 1101 1778 1415 1155 486 274 228 257
1990 303 363 685 834 2126 1757 1600 1350 761 379 257 271
1991 367 548 808 1874 2267 3323 2977 1748 1005 550 379 369
1992 423 462 633 1319 2286 2832 3366 2176 1057 588 430 365
1993 462 304 760 1199 1709 1991 1832 965 680 269 148 188
1994 179 193 326 772 1340 1938 2531 1581 651 289 244 209
1995 223 174 409 1009 1444 2022 2393 1508 595 371 233 259
1996 311 322 555 870 1169 2202 1558 1393 660 449 261 259
1997 287 237 249 962 1320 1998 2075 1288 662 409 259 251
1998 355 488 638 1417 1910 1477 2444 1206 701 383 283 277
1999 415 511 568 739 1308 1356 1121 933 519 234 190 155
2000 251 199 118 451 822 713 949 810 551 198 139 130
2001 163 86 108 407 937 1075 1093 790 392 158 150 150
2002 166 162 290 615 953 1571 933 992 554 180 151 144
2003 158 194 354 910 1035 1859 1821 1010 591 287 226 194
2004 279 313 226 522 1082 1370 942 818 442 473 240 215
2005 344 448 877 1166 1489 2431 3551 1465 761 465 324 281
2006 398 432 452 613 1472 1020 1309 1674 597 257 302 393
2007 319 479 968 1929 1801 2013 1934 1055 690 340 243 249
2008 333 320 359 847 1116 1702 1319 1156 431 246 197 196
2009 308 383 486 1093 1633 1561 2235 1485 592 300 258 246
2010 280 453 567 770 1325 1486 1760 3512 973 607 437 372
2011 390 499 592 878 1619 1264 1064 1113 686 282 257 173
2012 249 301 300 1003 926 1630 1928 1124 950 323 257 272
2013 328 479 821 1002 1865 2827 1535 1649 619 383 300 213
2014 252 294 713 1008 1852 2365 2078 1076 476 408 320 253
2015 311 531 702 1304 1764 1908 2438 1802 466 366 470 329
97
Different sources of Nitrogen in Peshawar Basin (1985-2015)
Year District wise N from Fertilizer (Tones)
N from
Artificial
Fertilizer
N from
Livestock
manure
N from
Domestic
sources
N from
Industrial
sources
Charsadda Mardan Nowshera Peshawar (tyear) (tyear) (tyear) (tyear)
1986 9579 6549 6549 9579 32256 29520 1273 478
1987 8450 10320 7850 8750 35370 28571 1313 491
1988 7446 10352 10352 7446 35596 27623 1378 512
1989 10340 11220 8450 7120 37130 26675 1418 525
1990 10320 9950 9720 6950 36940 33137 1485 547
1991 9930 10350 10400 12630 43310 32557 1527 560
1992 7900 11600 11300 9980 40780 31357 1568 573
1993 7640 9700 6700 8300 32340 30157 1724 627
1994 5350 38257 2579 12268 58454 28958 1769 641
1995 4034 26072 4235 20969 55310 27758 1813 654
1996 6190 26851 3180 20094 56315 26558 1857 668
1997 6350 25054 2930 24103 58438 27997 1901 682
1998 6720 22300 5900 20300 55220 29436 1947 697
1999 7096 26346 6576 24332 64350 30876 2024 719
2000 6855 29868 3590 19980 60293 36290 2068 730
2001 10283 35816 3573 20677 70349 37910 2145 753
2002 9779 32968 3413 31850 78010 39530 2223 777
2003 12465 27578 3290 29531 72864 41151 2300 800
2004 12601 32652 5263 29403 79919 42771 2378 823
2005 13128 44519 5183 29988 92818 44391 2497 861
2006 12851 30086 2757 25925 71619 46012 2575 884
2007 11320 42152 3181 40383 97036 47742 2743 938
2008 8027 53392 2496 42796 106711 49473 2869 978
2009 9901 50280 8730 57681 126592 51204 2952 1003
2010 10183 45947 4297 34679 95106 52934 3083 1044
2011 12659 48410 7562 32530 101161 54665 3167 1069
2012 10041 48854 4408 33574 96877 56396 3251 1094
2013 8667 44246 3657 25173 81743 58126 3387 1137
2014 9268 47614 4847 24147 85876 59857 3472 1163
2015 8052 29845 2399 16183 56479 61587 3558 1188
98
Different sources of Phosphorus in Peshawar Basin (1985-2015)
Year District wise P from Fertilizer (Tones)
P from
Artificial
Fertilizer
P from
Livestock
manure
P from
Domestic
sources
P from
Industrial
sources
Charsadda Mardan Nowshera Peshawar (tyear) (tyear) (tyear) (tyear)
1986 2657 2835 2836 2658 10986 8871 127 19
1987 1059 3594 510 3416 8579 8587 131 20
1988 1011 2350 1001 2500 6862 8302 138 21
1989 950 3230 1120 2930 8230 8018 142 21
1990 1050 3850 1020 1750 7670 9980 149 22
1991 1230 4200 950 3200 9580 9792 153 23
1992 983 4500 1020 3500 10003 9431 157 24
1993 998 3500 1200 2370 8068 9070 172 26
1994 883 5421 2000 2278 10582 8709 177 27
1995 1007 5462 543 1780 8792 8348 181 27
1996 1110 3440 692 2024 7266 7987 186 28
1997 1630 3900 760 4080 10370 8416 190 29
1998 1160 4600 980 4300 11040 8844 195 29
1999 1196 5253 750 5033 12232 9273 202 30
2000 1180 6713 1061 3753 12707 10910 207 31
2001 800 6718 232 3209 10959 11393 215 32
2002 462 6093 230 4129 10914 11876 222 33
2003 1361 6595 514 10499 18969 12360 230 35
2004 1114 6564 702 3851 12231 12843 238 36
2005 981 6334 387 3176 10878 13326 250 37
2006 1878 10765 774 8457 21874 13809 258 39
2007 343 6802 246 6508 13899 14323 274 41
2008 951 10077 425 6719 18172 14837 287 43
2009 656 10229 268 10128 21281 15351 295 44
2010 1314 7238 285 6214 15051 15865 308 46
2011 1071 4820 341 4856 11088 16379 317 48
2012 4652 5711 269 3245 13877 16892 325 49
2013 2033 8626 666 4655 15980 17406 339 51
2014 2220 11906 1238 5509 20873 17920 347 52
2015 1274 6624 363 2493 10754 18434 356 53
99
Livestock Population in Peshawar Basin 1985-2015
Year Bovine Animals
Sheep Goats Camels Equine
Poultry Cattle Buffaloes Horses Asses Mules
1985 911941 498575 239241 510087 5721 14969 128452 2521 5706659
1986 881656 481482 229940 510027 5506 14513 116996 2944 5582935
1987 851372 464390 220638 509968 5292 14057 105540 9255 5459210
1988 821087 447297 211336 509908 5078 13600 94085 15566 5335486
1989 790802 430205 202034 509848 4863 13144 82629 21877 5211761
1990 760517 413112 192733 509789 4649 12687 71173 28188 5088036
1991 730233 396019 183431 509729 4435 12231 59717 34500 4964312
1992 699948 378927 174129 509669 4220 11775 48261 40811 4840587
1993 669663 361834 164827 509610 4006 11318 36805 47122 4716863
1994 639378 344741 155526 509550 3792 10862 25350 53433 4593138
1995 609094 327649 146224 509491 3577 10405 13894 59744 4469414
1996 578809 310556 136922 509431 3363 9949 2438 66055 4345689
1997 611044 327192 146884 542214 3457 10484 10465 59751 4467335
1998 643280 343827 156845 574996 3550 11019 18493 53447 4588981
1999 675515 360463 166807 607779 3644 11554 26520 47143 4710626
2000 707751 377098 176769 640562 3738 12089 34548 40839 4832272
2001 739986 393734 186731 673345 3832 12624 42575 34535 4953918
2002 772221 410369 196692 706127 3925 13159 50602 28231 5075564
2003 804457 427005 206654 738910 4019 13694 58630 21927 5197210
2004 836692 443640 216616 771693 4113 14229 66657 15623 5318855
2005 868928 460276 226577 804475 4206 14764 74685 9319 5440501
2006 901163 476911 236539 837258 4300 15299 82712 3015 5562147
2007 940199 495931 240857 874140 4300 15299 82712 3015 5562147
2008 979234 514952 245174 911021 4300 15299 82712 3015 5562147
2009 1018270 533972 249492 947903 4300 15299 82712 3015 5562147
2010 1057305 552993 253809 984785 4300 15299 82712 3015 5562147
2011 1096341 572013 258127 1021667 4300 15299 82712 3015 5562147
2012 1135376 591033 262445 1058548 4300 15299 82712 3015 5562147
2013 1174412 610054 266762 1095430 4300 15299 82712 3015 5562147
2014 1213447 629074 271080 1132312 4300 15299 82712 3015 5562147
2015 1252483 648095 275397 1169193 4300 15299 82712 3015 5562147
Pakistan Census of livestock 1986-2006 (2007 to 2015 projected)
100
Human Population of Peshawar Basin 1986-2015)
Charsadda Mardan Nowshera Peshawar Peshawar Basin
SNo Year Urban Rural Urban Rural Urban Rural Urban Rural Urban Rural
1 1986 149780 596193 204192 847460 521341 483762 688768 670512 1564082 2597927
2 1987 153369 615637 211770 873919 525814 497394 713272 700994 1604226 2687944
3 1988 156959 635080 219348 900378 530287 511025 737776 731477 1644370 2777961
4 1989 160548 654523 226926 926838 534760 524657 762280 761959 1684514 2867978
5 1990 164137 673967 234504 953297 539233 538289 786784 792442 1724658 2957994
6 1991 167726 693410 242082 979757 543706 551921 811288 822924 1764802 3048011
7 1992 171316 712853 249660 1006216 548179 565552 835792 853407 1804946 3138028
8 1993 174905 732297 257238 1032675 552652 579184 860296 883889 1845090 3228045
9 1994 178494 751740 264816 1059135 557124 592816 884800 914372 1885235 3318062
10 1995 182083 771183 272394 1085594 561597 606448 909304 944854 1925379 3408079
11 1996 185673 790626 279972 1112053 566070 620079 933808 975337 1965523 3498096
12 1997 189262 810070 287550 1138513 570543 633711 958312 1005819 2005667 3588113
13 1998 192851 829513 295128 1164972 580530 647343 982816 1036302 2051325 3678130
14 1999 196921 856698 302717 1205433 580891 675372 1034775 1102762 2115304 3840265
15 2000 200990 883882 310307 1245895 586765 703401 1086735 1169221 2184797 4002399
16 2001 205060 911067 317896 1286356 592640 731429 1138694 1235681 2254290 4164534
17 2002 209130 938252 325485 1326817 598515 759458 1190653 1302141 2323783 4326668
18 2003 213199 965437 333075 1367278 604390 787487 1242612 1368601 2393276 4488803
19 2004 217269 992621 340664 1407740 610264 815516 1294572 1435060 2462769 4650937
20 2005 221339 1019806 348253 1448201 616139 843545 1346531 1501520 2532262 4813072
21 2006 225408 1046991 355843 1488662 622014 871573 1398490 1567980 2601755 4975206
22 2007 229478 1074176 363432 1529123 627889 899602 1450449 1634440 2671248 5137341
23 2008 233548 1101360 371021 1569585 633763 927631 1502409 1700899 2740741 5299475
24 2009 237618 1128545 378610 1610046 639638 955660 1554368 1767359 2810234 5461610
25 2010 241687 1155730 386200 1650507 645513 983688 1606327 1833819 2879727 5623744
26 2011 245757 1182915 393789 1690968 651388 1011717 1658286 1900279 2949220 5785879
27 2012 249827 1210099 401378 1731430 657262 1039746 1710246 1966738 3018713 5948013
28 2013 253896 1237284 408968 1771891 663137 1067775 1762205 2033198 3088206 6110148
29 2014 257966 1264469 416557 1812352 669012 1095804 1814164 2099658 3157699 6272282
30 2015 262036 1291654 424146 1852813 674887 1123832 1866123 2166118 3227192 6434417
101
Soil Type No of
Horizons
Texture
(USDA)
Thickness
(m)
Sand
fraction
Silt
fraction
Clay
fraction
Bulk
density
(kgdm3)
Organic
matter
(wt )
Salinity
(dsm)
Calcisols
Top soil Loam 03 39 40 21 132 07 16
Sub soil Loam 07 36 40 24 142 029 16
Cambisols
Top soil Loam 03 42 36 22 137 10 01
Sub soil Loam 07 40 35 25 139 04 01
Rock
Outcrop
Top soil Loam 03 43 34 23 130 14 01
Sub soil Clay
loam 07 42 30 28 137 03 07
Harmonized World Soil Database
Soil Type No of
Horizons
Texture
(USDA)
Thickness
(m)
Soil Water Stoniness
() PWP FC SAT Ksat
(Volume ) mmday
Calcisols
Top soil Loam 03 135 267 46 1965 4
Sub soil Loam 07 15 287 411 1315 3
Cambisols
Top soil Loam 03 14 27 423 100 9
Sub soil Loam 07 153 281 411 116 12
Rock Outcrop
Top soil Loam 03 147 276 43 1512 26
Sub soil Clay
loam 07 171 293 413 437 3
102
Grey Water footprint and Water Pollution Level of N and P loads in Peshawar Basin (1986-2015)
Year Population
(millions)
Annual Runoff
(million m3y)
GWF-N
(million m3y) WPL-N
GWF-P
(million m3y) WPL-P
1986 4 26585 2867 11 41624 157
1987 4 28351 2967 10 36033 127
1988 4 31914 2938 9 31884 100
1989 5 24945 2967 12 34148 137
1990 5 31000 3254 10 37083 120
1991 5 44750 3518 8 40675 91
1992 5 43867 3352 8 40814 93
1993 5 30716 2926 10 36074 117
1994 5 29455 4053 14 40565 138
1995 5 31504 3860 12 36100 115
1996 5 28414 3854 14 32184 113
1997 6 27972 4017 14 39545 141
1998 6 33775 3940 12 41842 124
1999 6 23778 4421 19 45232 190
2000 6 15232 4485 29 49638 326
2001 6 15579 5016 32 47025 302
2002 7 20435 5439 27 47955 235
2003 7 27689 5285 19 65741 237
2004 7 21665 5681 26 52744 243
2005 7 38442 6343 17 50962 133
2006 8 25229 5464 22 74868 297
2007 8 32987 6699 20 59382 180
2008 8 24440 7222 30 69373 284
2009 8 30054 8202 27 76932 256
2010 9 35888 6867 19 65069 181
2011 9 25355 7223 28 57912 228
2012 9 25891 7113 27 64804 250
2013 9 33933 6516 19 70282 207
2014 9 31410 6785 22 81553 260
2015 10 34973 5542 16 61587 176
103
104
105
106
107
108
Table-00 Annual water footprint of crops in Peshawar Basin during 1986-2015 (million m3)
Wheat Sugar Cane Maize Sugar Beet Rice Tobacco Barley
Year Blue Green Blue Green Blue Green Blue Green Blue Green Blue Green Blue Green
1986 527 563 665 259 556 279 60 18 18 10 94 81 18 21
1987 589 432 712 298 801 234 46 11 17 8 100 106 18 18
1988 665 385 762 262 714 256 45 7 17 10 101 85 19 19
1989 466 347 702 300 618 200 19 5 15 8 43 31 18 19
1990 499 449 666 343 635 221 18 6 13 7 42 37 19 21
1991 486 439 667 325 618 236 48 14 13 7 65 68 16 19
1992 478 413 657 311 633 224 61 18 14 8 81 77 18 19
1993 492 356 590 330 662 240 57 14 13 7 66 62 16 17
1994 495 432 625 334 583 252 53 17 13 9 55 50 17 17
1995 490 373 687 315 600 241 58 13 12 8 49 50 17 18
1996 550 404 689 304 642 230 48 13 12 7 55 47 19 15
1997 492 458 619 338 610 198 42 13 12 7 58 57 15 17
1998 442 334 708 290 587 237 39 8 13 7 61 62 14 16
1999 490 296 714 283 644 232 42 7 13 7 67 47 16 15
2000 577 261 737 302 638 246 47 6 13 8 47 32 9 6
2001 427 254 704 282 625 245 29 6 14 7 53 39 7 6
2002 417 410 579 348 579 222 18 6 13 7 36 32 6 8
2003 446 333 759 308 590 241 3 1 13 8 34 31 6 7
2004 412 426 618 326 651 219 7 2 14 8 52 42 6 8
2005 522 304 741 292 632 265 45 8 13 8 65 56 7 6
2006 374 446 599 308 639 231 38 15 13 7 47 42 6 8
2007 469 365 590 322 625 237 36 9 14 7 46 47 6 6
2008 487 443 615 307 601 261 34 11 13 8 48 47 6 6
2009 545 365 620 319 674 231 16 3 18 10 55 53 6 6
2010 621 359 527 235 486 241 17 3 15 10 48 42 5 4
2011 509 310 735 300 612 261 12 2 15 10 50 40 4 4
2012 396 462 593 331 605 224 9 3 16 9 44 40 3 4
2013 500 407 639 300 603 245 8 2 16 10 41 46 3 3
2014 461 436 574 343 632 210 6 2 19 11 49 53 3 3
2015 490 480 567 322 603 236 6 2 16 11 54 49 3 3
109
APPENDIX-F
110

PhD Thesis
ENVIRONMENTAL SUSTAINABILITY ANALYSIS OF WATER
FOOTPRINTS OF PESHAWAR BASIN PAKISTAN
BY
TARIQ KHAN
RESEARCH SUPERVISOR
PROFDR HIZBULLAH KHAN
DEPARTMENT OF ENVIRONMENTAL SCIENCES
UNIVERSITY OF PESHAWAR
(2013-2014)
Say Have you considered if your water was to become sunken [into
the earth] then who could bring you flowing water
(The Holy Quran 6730)
ii
CONTENTS Page No
Acknowledgementhelliphelliphelliphelliphelliphelliphelliphelliphelliphelliphelliphelliphelliphelliphelliphelliphelliphelliphelliphelliphelliphelliphelliphelliphelliphelliphelliphellipv
List of Tableshelliphelliphelliphelliphelliphelliphelliphelliphelliphelliphelliphelliphelliphelliphelliphelliphelliphelliphelliphelliphelliphelliphelliphelliphelliphelliphelliphellipvii
List of Figures helliphelliphelliphelliphelliphelliphelliphelliphelliphelliphelliphelliphelliphelliphelliphelliphelliphelliphelliphelliphelliphelliphelliphelliphelliphelliphelliphellipviii
List of Abbreviationshelliphelliphelliphelliphelliphelliphelliphelliphelliphelliphelliphelliphelliphelliphelliphelliphelliphelliphelliphelliphelliphelliphelliphelliphelliphelliphelliphellipix
Summaryhelliphelliphelliphelliphelliphelliphelliphelliphelliphelliphelliphelliphelliphelliphelliphelliphelliphelliphelliphelliphelliphelliphelliphelliphelliphelliphelliphelliphelliphelliphelliphelliphellipx
1 Introduction
11 Background 1
12 Problem Statement 2
13 Scope and Goal of the study 3
131 Scope 4
132 Goal 4
14 Description of study area 4
141 Climate 5
142 Irrigation system 5
143 Agriculture cropsproducts 5
144 Industries 6
145 Rivers flowing through Peshawar Basin 6
1451 Kabul River 6
1452 Chitral River 7
1453 Swat River 7
15 Dams on Kabul River and its tributaries 8
16 Hydrology of Kabul River 9
17 Fish of Kabul River 9
18 Water Footprint Assessment Approach 9
19 Specific objectives of the study 10
110 Data Sources 11
111 Thesis outline 11
2 Literature review
21 Concepts and Definitions 12
22 Water Footprint of River Basins Global Context 12
23 Specific river basins studies 14
24 Water Resources Situation in Pakistan 18
iii
25 Water Pollution in Kabul River Case Studies 18
3 Blue and green water footprint of agriculture in Peshawar Basin Pakistan
31 Abstract 23
32 Introduction 24
33 Study area 25
34 Data and method 26
35 Methods 27
351 Simulation of crop growth and Soil water balance 27
352 Water Footprint Assessment 28
36 Results 29
361 Total blue and green WF of Peshawar Basin in different soil-climate zones 29
362 The contribution of major crops in the total blue and green WF 31
363 Annual blue and green WF of agriculture sector in Peshawar Basin 1986-2015 31
37 Discussion 33
4 Environmental sustainability of blue and green water footprint in Peshawar
Basin Pakistan
4 1 Abstract 35
4 2 Introduction 36
4 3 Method and material
43 1 Water balance of Peshawar Basin 37
432 Blue water availability (WAblue) 39
433 Blue water footprint (WFblue) 39
434 Green water availability (WAgreen) 39
435 Green water footprint (WFgreen) 40
436 Environmental sustainability of WFblue 40
437 Environmental sustainability of WFgreen 40
44 Results 42
45 Discussion 45
5 Environmental sustainability of grey water footprints in Peshawar Basin
scenarios for current and future reduced flow in Kabul River
5 1 Abstract 46
5 2 Introduction 47
5 3 Materials and Methods 49
iv
53 1 Grey water footprint 49
53 2 Environmental sustainability of grey water 50
53 3 Reduced runoff scenarios 50
5 4 Data description 50
5 5 Results 51
551 Application of N and P fertilizers in Peshawar Basin 51
552 N and P loads from livestock manure 52
553 WFgrey of N and P 53
554 WPL of N and P 54
555 WPL for reduced runoff scenarios 54
56 Discussion 55
6 Conclusions and recommendations
6 1 Conclusion 57
6 2 Recommendations 59
Referenceshelliphelliphelliphelliphelliphelliphelliphelliphelliphelliphelliphelliphelliphelliphelliphelliphelliphelliphelliphelliphelliphelliphelliphelliphelliphelliphelliphellip57
Appendixhelliphelliphelliphelliphelliphelliphelliphelliphelliphelliphelliphelliphelliphelliphelliphelliphelliphelliphelliphelliphelliphelliphelliphelliphelliphelliphelliphelliphellip73
v
Acknowledgements
All glory is for ALLAH the most Merciful and Beneficent who gave me patience
vehemence and ability to accomplish this study and all respect to His last and final
messenger The Prophet Muhammadصلى الله عليه وسلم Who is a final source of knowledge and guidance for
the entire mankind
First of all I want to thanks my supervisor Dr Hizbullah Khan Professor Department of
Environmental Sciences University of Peshawar Pakistan for his kind support and guidance
during the entire period of my PhD I would like to acknowledge my foreign supervisor Dr
Arjen Y Hoekstra Professor Department Water Engineering and Management The
University of Twente The Netherlands for allowing me to work in his research group and Dr
Martijn J Booij Associate Professor Department Water Engineering and Management The
University of Twente The Netherlands my daily supervisor without whom I may have not
been able to accomplish this research
I must acknowledge the financial support of the Higher Education Commission of Pakistan
through IRSIP fellowship for my stay at the University of Twente The Netherlands I am
thankful to external evaluators and internal viva examiners for their kind suggestions to
improve the quality of research presented in this thesis My gratitude goes to Dr Abdullah
Khan Assistant Professor and Head Department of Environmental University of Haripur
Pakistan for facilitating me during the entire period of my PhD program
I have many colleagues to thank Thanks to Dr Zia ur Rahman and Mr Salman Khan for
having best conversation partners during my entire course of PhD study Also thanks to Dr
Khursheed Mr Muhammad Fawad Mr Muhammad Ayaz Khan Ms Naureen Aurangzeb
Dr Muhammad Khurshid Dr Alia Naz Dr Hajira Haroon and Dr Wisal Shah whose moral
support always boosted my energies
I am highly obliged to my teachers in Department of Environmental Sciences University of
Peshawar Pakistan who appreciated the compilation of this Thesis I am thankful to Dr
Muhammad Irshad Professor and Chairman Department of Environmental Sciences
COMSATS University Islamabad Abbottabad Campus and Dr Qaiser Mahood Associate
Professor Department of Environmental Sciences COMSATS University Islamabad
Abbottabad Campus Dr Ihsan Ullah Assistant Professor Department of Geography
vi
University of Peshawar Pakistan and Dr Saad Khan Head Department of Geology Bacha
Khan University Charsadda Pakistan for their support and input in my thesis
Special thanks are extended to Dr Joep Schyns Dr Hamideh Nouri and Hatem Chouchane
Department of Water Engineering and Management University of Twente The Netherlands
for their support and guidance My sincere thanks to Mr Afzal Hussain and his family
especially Zakia Hussain for their forbearance helpful and enjoyable company during our
stay in Enschede The Netherlands
Life outside the office environment has been a joy with many milestone in the past five years
Thanks to all my friends and family for this I canrsquot find the words to express my gratitude for
the unconditional love care and prayers of my parents brothers and sisters Thanks to my
wife for being the love of my life and a superb mother and wife Thanks Eishaal Khan for
being the amazing little girl that you are You two are the best part of my life and a consistent
source of inspiration for me that help me in every move of my life
Tariq Khan
vii
LIST OF TABLES
Table Title Page
11 Potential new site for dam construction on Kabul River Basin in
Afghanistan
3
12 Water footprint assessment setting 4
21 Water footprint methodologies used for sustainable water resources 21
31 Temperature precipitation and evapotranspiration in Peshawar
Basin
24
32 Average blue and green water footprint of main crops and total
water footprint of crop production in Peshawar Basin (1986-2015)
33
41 Land set aside for nature game reserved and wildlife park 39
42 Water scarcity thresholds 44
51 Water pollution studies on Kabul river in Peshawar Basin in
Pakistan
48
52 Slaughtered weight and N and P contents in various livestock
categories
49
viii
LIST OF FIGURES
Figure Title Page
11 Storage option of Kabul River Basin in Afghanistan 3
12 Peshawar Basin in Pakistan 11
31 Map of Peshawar Basin 24
32 Soil-climate zones of Peshawar Basin
26
33 Percentage of each zone to the annual water footprint of Peshawar Basin
(1986-2015)
28
34 Annual water footprint of crops in different soil-climate zones of Peshawar Basin
(1986-2015)
29
35 Percentage of blue and green water footprint and crops cover area in Peshawar
Basin (1986-2015) 30
36 Mean annual blue green and total WF of major crops in Peshawar Basin
(1986-2015)
31
37 Average monthly air temperature and wind speed in Peshawar Basin from 1986-2015
32
41 Land cover change in Peshawar Basin from 1986-2015 40
42 Annual availibility of blue water in Peshawar Basin (1986-2015 42
43 Annual green water flow from various sources in Peshawar Basin (1986-2015)
42
44 Blue WF and per capita blue water availability in Peshawar Basin (1986-2015)
42
45 Percentage of green water flow (A) and Percentage of blue water supply (B) in
Peshawar Basin (1986-2015) 43
46 Blue and green water scarcity in Peshawar Basin (1986-2015 43
51 Kabul river passing through Peshawar Basin in Pakistan 46
52 Application of N and P in Peshawar Basin from 1986-2015 (tonsyear 51
53 Input of N and P by different livestock in Peshawar Basin (average of 30
years) 51
54
Source to WFgrey () in Peshawar Basin (30 years average) (A) nitrogen (B)
phosphorus
52
55 5 N and P-related WFgrey in Peshawar Basin during 1986-2015 52
56 WPL in Kabul River of Peshawar Basin during 1986-2015 53
57
N and P related WPL for five different reduced-runoff scenarios in Peshawar
Basin
54
ix
LIST OF ABBRIVIATIONS
WF Water footprint
WFGREY Grey water footprints
P Phosphorous
N Nitrogen
WPL Water pollution level
NFDC National Fertilizer Development Centre
CAN Calcium ammonium nitrate
DAP Diammonium phosphate
SOP Sulphate of potash
SSP Single and triple superphosphate
RACT Actual runoff
x
SUMMARY
Water is a fundamental resource for sustainable social and economic development of any
country Freshwater resources are becoming scarce due to inevitable demand for food
industrial development and growing urban and rural population Over the last few decades
demand for the agricultural products has been increased due to the population and economic
growth This has exerted immense pressure on the available water resources Pakistan is
located in the arid region of the world with an average annual rainfall less than 240 mm
Being an agriculture based economy the availability of fresh water is essential for
sustainable economic development The goal of this research was to analyze the
environmental sustainability of blue green and grey water footprint in Peshawar Basin during
the period 1986 to 2015 The basin is located in the northwest of Indus Basin at longitude of
710 15 and 720 45 E and latitude 330 45 and 340 30 N in Khyber Pakhtunkhwa province of
Pakistan that covers an area of 5617 km2 and has 978 million inhabitants Blue and green
water scarcity was selected as an indicator to assess the environmental sustainability of water
footprints Further the study was aimed to assess the potential impact of dam on Kabul river
water pollution The water pollution level was estimated under normal and reduced runoff
scenarios for an increased upstream use of water from Kabul River in Afghanistan
The annual blue and green water availability and scarcity was calculated following global
water footprint assessment standard during the period 1986-2015 and annual blue and green
water footprints of crops were estimated using AquaCrop model The AquaCrop output was
post-processed to separate incoming and outgoing water fluxes and soil water content into
blue and green water components considering blue water fluxes from irrigation and capillary
rise Consequently evapotranspiration (ET) originating from irrigation water capillary rise
and rainwater was tracked out Grey water footprints is used as an indicator to assess
environmental sustainability related to nitrogen (N) and phosphorus (P) pollution in Peshawar
Basin Pakistan The N and P pollutants load from artificial fertilizers animal manure
household and industrial sources were considered during 1986 to 2015
The results showed that per capita water availability dropped from 1700 m3 per in 1986 to
600 m3 in 2015 In terms of per capita water availability the basin has turned from ldquowater
stressedrdquo in 1986 to ldquowater scarcedrsquo in 2015 Further both the blue and green water footprint
of agriculture has decreased from 2139 million m3 in 1986 that reduced to 1738 million m3 in
xi
2015 Similarly the green water flow from agricultural land was 1231 million m3 in 1986
which reduced to 1104 million m3 in 2015 The domestic water footprint has increased from
13 million m3 in 1986 to 29 million m3 in 2015
The average of 30 years blue water footprint of maize rice tobacco wheat barley sugar
cane and sugar beet were 7077 3932 2176 1913 1561 181 and 174 m3ton respectively
The mean values of green water footprint were 2744 2254 1985 1535 1603 67 and 45
m3ton respectively The 30 years average annual blue water consumption of sugar cane
maize wheat tobacco sugar beet rice and barley was 655 623 494 57 32 14 and 11
million m3 respectively while green water was 308 236 391 52 8 8 and 11 million m3
respectively The average annual blue and green water consumption of agricultural sector in
Peshawar Basin was 1886 and 1014 million m3 respectively
Average of 30-years N-related WFgrey showed that artificial fertilizer contributed 61
livestock manure 36 household sources 2 and industries 1 while for P-related WFgrey
the contribution from artificial fertilizer livestock manure and household sources were 50
49 and 1 respectively Averaged 30-years N and P associated WFgrey of the basin were
50108 m3y and 50109 m3y respectively The water pollution level was estimated under
normal and reduced runoff scenarios for an increased upstream use of water from Kabul
River in Afghanistan N-related WPL was within the sustainability limit of 100 while P-
related WPL exceeded sustainable limits in every year under normal runoff and were worse
in each reduced runoff scenarios
This study shows that the blue and green water scarcity are less than 100 and are low water
scarcity level It provided a baseline information for the sustainability food security and
water productivity of crops This would be helpful for policy makers for efficient irrigation
management and water conservation in Peshawar valley The study further shows the
deterioration of water quality of Kabul River and the findings may be helpful for future
planning and management of the basin
1
CHAPTER NO 1
INTRODUCTION
11 Background
Over the last few decades demand for agriculture products industrial goods and domestic
human consumption have increased manifold due to increase in population This ever-
increasing population followed by upsurge economic growth have placed substantial load on
scarce water resources of the planet (Launiainen et al 2014) Freshwater is not only essential
for satisfying direct human needs but for agriculture productions and industrial processes as
well (Cazcarro et al 2014 Lee 2015) In view of the scarcity and overexploitation water is
becoming more precious and prized resource than ever (Van Oel and Hoekstra 2012 Zhang
et al 2013) Fresh water resources are limited in space and time (Dessu et al 2014) and
greatly threatened by human activities (Vorosmarty et al 2010) Globally one third of
human population is living in water scarce areas with a forecast of two-third by 2025 (UN
2014 Dessu et al 2014) International council for science and world federation of
engineering organization has predicted that there will be worldwide water crisis by 2050 due
to the increase in population pollution and impact of climate change and because of these
reasons there will be more stress on available water resources (Malley et al 2009)
United Nation (2012) claimed that 800 million people lacks access to safe and clean water
and 2 billion people around the globe have no proper sanitation available (Falconer et al
2012) Reports claim an increasing trend of water scarcity worldwide and release of
pollutants in water bodies make them unsafe for use (Yang et al 2003 Pellicer et al 2016)
Pakistan has predominantly arid and semi-arid climate and ratio between current population
and available water resources has turned Pakistan into water stress country (Government of
Pakistan 2014) In these climatic regions river basins are facing issues like drying up of
rivers decline in water table and water pollution (Vorosmarty et al 2010) Pakistan has
exhausted all of its available water resources and like many developing countries has been
facing sever water shortage and water pollution problem (Azizullah et al 2011) It has been
reported that in Pakistan over 50 million people donrsquot have access to safe drinking water and
about 74 million people lack proper sanitation Further the availability of water per capita
has dropped from 5000 m3 in 1950 to less than 1500 m3 in 2009 hence the country may
become water scarce by 2035 (Bisht 2013)
Only 1 of industries are treating waste before disposal approximately 45 x 109 m3 of
wastewater per annum produced is released in rivers and open areas Kabul River daily
2
receive a load of 80000 m3 effluents directly from industrial and domestic sources since
water waste water treatment plants have been damaged during 2010 extreme flood (Khan et
al 2012 EPA-KP 2014)
Water being very basic and fundamental scarce natural resource if not used sustainably and
managed properly can have profound economic social and environmental consequences
(Ridoutt and Pfister 2010) and therefore effective management and good governance of
water resources have emerged as key concern in terms of real sustainability indicator around
the globe in order to keep a balance in ecosystem protection and human use of resources
(Adeel 2004)
12 Problem Statement
Peshawar Basin is a sub-basin of Indus River Basin It extended from 710 15 to 720 45 East
longitude and from 330 45 to 340 30 North latitude in the province of Khyber Pakhtunkhwa
Pakistan Kabul River is the main river flowing through Peshawar Basin that originates from
Unai Pass of Hindukush Mountains in Afghanistan It runs approximately 700 km distance
from Unai pass up to Indus River The river flows about 560 km in Afghanistan and 140 km
in Pakistan The river has been shared by Pakistan and Afghanistan and to date there has been
no agreement between the two countries to regulate water like The Indus Water Treaty
(Salman 2008 and Ali 2015) The Government of Afghanistan has developed a
comprehensive future plan for power generation and irrigation on Kabul River (Table 11
Figure 11) (World Bank 2010 Mustafa 2016) Consequently flow to Peshawar Basin will
get reduced that would have impact on both the quality and quantity of available water
resource of Peshawar Basin There has been no study on the capacity of Kabul River to
assimilate pollutants load and downstream impacts of future reduced flow on water quality
and quantity as a result of construction of dams in Afghanistan It is therefore important to
study the environmental sustainability of water resources in Peshawar Basin for current and
future reduced flow both in term of quality and quantity
3
Table - 11 Potential New Site for Dam Construction in Kabul River Basin in Afghanistan
Name of subbasin of Kabul
River Basin in Afghanistan
Location
code
Dam
height
(m)
Gross
storage
(Mm3)
Live
storage
(Mm3)
Installed
capacity
MW
Capital cost
(MUS$)
Panjshir subbasin
Totumdara R8 135 410 340 NA 332
Barak R9 155 530 390 100 1174
Panjshir I R10 180 1300 1130 100 1078
Baghdara R11 40 400 330 210 607
Logar Upper Kabul subbasin
Haijan R12 50 220 200 NA 72
Kajab R2 85 400 365 NA 207
Tangi Wardag R4 65 350 300 NA 356
Gat R7 20 500 440 NA 51
Lower Kabul subbasin
Sarobi II (run of the river) R16B 200 NA NA 210 442
Laghman A R17 No data 405 288 44 1251
Konar A R19 No data 1212 1010 366 948
Konar B (run of the river) R20 No data NA NA 81 232
Kama (run of the river) R21 No data NA NA 60 115
Figure-11 Storage Option of Kabul River Basin in Afghanistan (World Bank 2010)
13 Scope and Goal of the study
The scope of this study is confined to the boundaries of Peshawar basin The general setting
in this research is given in table-12
4
131 Scope
The environmental sustainability of Peshawar Basin is assessed by considering two main
sectors ie agriculture (crop and livestock) and domestic The sustainability of blue water is
assessed by comparing annual blue water consumption by agriculture and domestic to the
annual blue water availability Similarly the sustainability of green water is assessed by
taking into account the annual green water footprint of crops urban area and pasture and
compare it with the annual green water availability The outcome of both is the green and
blue water scarcity rate per annum In case of grey water Nitrogen and Phosphorous were
consider from agriculture (crops and livestock) domestic and industrial sources
Table - 12 Water footprint assessment setting
Setting This Study
Water footprint assessment type Basin level
Name of basin Peshawar Basin Pakistan
Period 1986 ndash 2015 (30 years)
Origin of water footprint Only internal process
Water footprint type Green blue and grey
Accounting groups Agriculture domestic and industrial
Sustainability perspectives Geographic environmental
Sustainability internal Annual
132 Goal
The main goal of this study is to assess the environmental sustainability of green blue and
grey water footprints of Peshawar Basin for current flow Further the study has been
extended to evaluate environmental sustainability of grey water footprint in light of reduced
flow scenarios ie 10 20 30 40 and 50 in Kabul River flows as a result of
construction of dams on Kabul River by the Government of Afghanistan
14 Description of study area
Peshawar Basin lies at the foothills of Himalayas and the northwest of Indus basin at the
longitude 710 15 and 720 45 E and latitude 330 45 and 340 30 N in Khyber Pakhtunkhwa
(KP) province of Pakistan covering an area of 8000 km2 as shown in Figure 12 The basin is
surrounded by mountain ranges of Swat in northeast Attock in south Khyber in west and
northwest and on the southeastern side it is bordered by Indus River where the basin
5
discharges all of its water (Tariq 2001) The rivers flowing through Peshawar basin are
Kabul River Chitral River Swat River Panjgora River and Bara River (Bisht 2013)
141 Climate
Peshawar basin has diverse type of climate the western part has semi- arid to subtropical
climate while the eastern region has sub-humid to subtropical climate The annual average
data from local metrological stations show the rainfall in a range of 340 mm to 630 mm June
and July being the hottest months with average daily maximum temperature of 40 to 48
and January being the coldest month with average daily minimum temperature of -5 to -2
The mean annual potential evaporation is approximately 1500 mm in Peshawar 1200 in
Mardan and Nowshera and 1100 mm in Charsadda (Tariq 2001Nasreen 2006)
142 Irrigation system
Pakistan has the worldrsquos largest canal irrigation system of 60000 km length Agriculture
alone consume about 97 of allocated surface water the rest 3 is available for other
purposes Pakistan has an agro based industry and cotton being the major export any decline
in major crop production would have significant impact on the country economy (Bisht
2013)
In KP Kabul River has been diverted upstream at Warsak dam into two canals the northern
canal that irrigate Shabqadar and Charsadda region while the southern canal which irrigate
Jamrud Peshawar and Nowshera area About 5km downstream of the Warsak dam another
canal has been taken off to irrigate land of Peshawar up to Akbarpura Swat River has also
been diverted in to Lower Swat Canal and Upper Swat Canal at Munda and Amandara Head
works to irrigate the agriculture lands of district Charsadda and Mardan regions The
Irrigation Department KP has been managing water supply to all districts of the province
Peshawar basin comprises of four sub-divisions ie Peshawar Charsadda Mardan and
Malakand Each sub division has its own network of canal system that regulates water supply
to the fields Peshawar sub-division has 18 canals with total length of 211 km Charsadda
has10 canals with a total of 65 km length Mardan has 42 canals and the region of Malakand
sub-division that fall in study area has 30 canals with total length of 290 km (Department of
irrigation Khyber Pakhtunkhwa) The detail of these canals are given in Appendix-B
143 Agriculture cropsproducts
In Peshawar basin agriculture is the main source of income of rural community and most
people directly depend on agriculture for their livelihood The main Crops grown in Peshawar
basin are wheat barley tobacco gram sugarcane cotton jowar rice maize and rapeseed
and mustard The basin has a variety of trees ie fruit or garden trees shadowy trees hilly
6
and wild trees The indigenous tree species are Mulberry (Morus nigra) pepal (Ficus
religiosa) Phulai (Acacia modesta) Ber (Ziziphus mauritinana) Karer (Caparis deciduas)
Siris (Albezia lebbek) Ghaz (Tamarix appylla) Kikar (Accacia nilotica) Shisham (Delgergia
sissoo) and Melia (Melia azedarach) Wood from these trees have been used for making
furniture and fixture house hold and utensils agriculture tools and in building as well Some
of the fruits are Aru (prunus persica) Bihi (Cydonia) Kela (Musa sp) Lemu (Cetrulus
medica) Alocha (Prunus Comunis) Grapes (Vitis vinifera) and Narangi (citrulus aurantum)
apple peach plum pear apricot guava loquat and persimmon In addition to fulfilling the
local needs these fruits are exported to other areas on the country
Weeds species that are used as a fodder are Paspalum distichum Launaea procumbens
Cyperus Spp Echinochloa colonum Cynodon dactylon Imperata cylindrical and
Desmostachya bipinnata Sorghum halepense Dichanthium annulatum and Panicum
antidotale are some of the common grasses in the region (Sepah 1993)
144 Industries
Sarhad Development Authority (SDA) is responsible for planning and promotion of industrial
development in the province According to the Development Statistic of KP (2017) there are
891industrial units running in Peshawar basin which have been classified into 48 different
categories The number of units operating in Peshawar Nowshera Mardan and Charsadda
are 475 187185 and 44 respectively Detail is given in appendix-D It has been reported
(IUCN 1994 Azizullah et al 2011 Khan et al 2013 Ahmad et al 2015) that almost all
these industries discharges effluents directly or indirectly to Kabul River Waste dumping
around Kabul Indus and Swat Rivers has severely degraded aquatic and terrestrial ecosystem
which has negative impact on surrounding community and fish population (Nafees et al
2011)
145 Rivers flowing through Peshawar Basin
1451 Kabul River
The Kabul River originates from Unai pass in the Sanglakh range of Hindukush Mountains of
Afghanistan about 72 km west of Kabul It has an estimated 75390 km2 basin that includes
all Afghan rivers joining the Indus River in Pakistan The total length of Kabul River from
Unai pass to Attack where it join Indus River is 700 km In Afghanistan the major tributaries
of Kabul River are Logar River Ghorbank River Panjsher River Alingar River Bashagal
River and Konar River The Konar River is the biggest tributary of Kabul River joining in
east of Jalalabad which originates in Tirichmir mountain of Chitral in Pakistan The River
flows about 560 km in Afghanistan and irrigates an estimated land of 306000 hectares which
7
is nearly 20 percent of the estimated 156 million hectares of irrigated area in Afghanistan
(Sepah 1993 World Bank 2010 IUCN Pakistan 2010)
In Pakistan the Kabul River enters at Shin Pokh area of Mohmand Agency takes its source in
the Karakoram Mountains and flows approximately 140 km through Pakistan before joining
the Indus River (Favre and Kanal 2004) The watershed of Kabul River in Pakistan includes
Chitral Dir Swat Peshawar Nowshera Mohmand Agency and Malakand protected area
Major tributaries of Kabul River in Pakistan are Chitral Swat River Panjkora Bara and
Kalpani River
1452 Chitral River
Kabul River has a watershed that spread over the Northern Himalaya zone The Chitral River
flows about 150 km in Chitral and has different names as it passes through various regions
ie it is called Yarkun River at the point where it originates in Chiantar Glacier after
receiving water from Laspur which drains the major portion of Shandur range it is given the
name of Mastuj River Downstream it is joined by the Lutkoh River making it main stream of
Chitral River It enters Afghanistan at Barikot area and there it is called Kunar River which is
the major tributary of Kabul River The Konar River joins Kabul River in the east of
Jalalabad where its volume is almost equal to the Kabul River
1453 Swat River
Swat River is a river of KP Pakistan and important tributary of Kabul River rises in the
Hindukush Mountains and feed by glaciers water In Kalam valley the river is further joined
by three sub tributaries ie Gabral river Bahandra river and Ushu river flowing southward in
a narrow gorge of 24 miles long till it reaches village Madiyan The river is feed by both
summer snow melt and monsoon rainfall and the average summer discharge reaches to 4488
cubic feetsec Downstream at Madiyan village the river behave like braided stream and
broadens from 1-3 miles width In the extreme south the river is joined by the Panjkora River
at Qalangi after passes through Chakdara town of Lower Dir district of Malakand to join
Kabul River in Peshawar Basin at Charsadda (Nafees 1992 Bisht 2013)
The Bara River originates from Terah Valley of Tehsil Bara of Khyber Pakhtunkhwa join
Chinde River near the village Banda Sheikh Ismail Zai Before joining the Kabul River near
the Camp Koruna of village Akbarpura in Nowshera the river is feed by many seasonal
streams and sometime cause flooding in monsoon season Previously the river water was very
clean and clear but due to population growth the domestic sewerage the river has now
become like a sanitation channel (Bisht 2013)
8
15 Dams on Kabul River and its tributaries
In Afghanistan all important rivers takes their sources from either the central highlands
mountains or the northeastern mountains except the Kunar River which takes its source
across the border in Pakistan from Karakoram Mountains Afghanistan shares most of their
rivers with neighboring countries and most rivers dry up in irrigation canals or sandy deserts
or drains into inland lakes except the Kabul River which joins the Indus River and empties in
the Indian Ocean Since the utilization of rivers water has a regional dimension in
Afghanistan (Favre and Kanal 2004) hence policy makers and international community have
recognized water related disputes in Central Asia The United State Senate Foreign Relations
Committee recommended guideline for preventing conflicts over shared water resource and
according to Norwegian Institute of International Affaire (NUPI) water resource scarcity and
transboundary water resource management are the key challenges to the stability of
Afghanistan
There are 8 hydroelectric power plants constructed on Kabul Rivertributaries Of which 6 are
in Afghanistan and 2 in Pakistani territory These hydro power plants have been constructed
with half of foreign assistance from time to time
i Jabal-e-Saraj hydro power plant-(1916)
ii Chaki Wardak hydro power plant-(1938)
iii Sarobi hydro power plant-(1953)
iv Darunta hydro power plant-(1964)
v Mahipar hydro power plant-(1966)
vi Naghlu hydro power plant-(1967)
vii Warsak hydro power plant-(1960)
viii Golen Gol Hydro power Plant-(2017)
More than 25 years of war and civil unrest in Afghanistan the county has not altered any
river but recently it has been reported that Government of Afghanistan has planned to
develop 13 multiple purpose hydropower projects and irrigation schemes on Kabul River
The proposed projects will have approximately storage capacity of 3309 million cubic meter
which is about 63 of annual average flow of Kabul River without taking into account of
Konar River flow This storage of water has to potential impact on Pakistan (Worl Bank
2010)
9
16 Hydrology of Kabul River
The Kabul River exhibits high seasonal variability in discharge because of variation in
seasonal rainfall glacier and snowmelt the month of June July and August are considered as
flood period since discharge reaches its peak while September to April are considered as low
flow period The total annual discharge of Kabul River at Pak-Afghan border is 1935 billion
cubic meters (BCM) of which 49 is contributed by Afghanistan through Kabul River
while 51 is contributed by Pakistan through Chitral River Downstream of Warsak dam
Swat River and Kalpani River contribute about 688 BCM and the mean annual discharge of
Kabul River at Nowshera become 2623 BCM (Yousafzai et al 2004 Akhtar and Iqbal
2017)
17 Fish of Kabul River
The Kabul River and its tributaries has been used for commercial as well as sport fish which
is a source of income for thousands of families living along river bank (Yousafzai et al
2008) A total of 54 fish species have been reported in Kabul River and its tributaries (Butt
and Mirza 1981 Rafique 2001) While Mirza 1997 reported 67 fish species and about 35 of
them are considered as species of common and commercial importance The population of
the fish has declined in the river due to pollution from industrial effluents and sewerage
water Nafees et al 2011 selected 9 fish species and reported that their population has been
declining due to pollution and illegal fishing that has negative impact on the socio-economic
condition on the community directly dependent families on fish business Further toxicity of
Pb Cd Zn Mn Cu Ni and Cr in fish show high concentration as a result of bioaccumulation
of these metals These metals have exceeded WHOrsquos and US recommended daily dietary
allowances (RDA) that has negative impact on fish consumer and aquatic flora and fauna
(Ahmad et al 2015 Usman et al 2017)
18 Water Footprint Assessment Approach
Water footprint assessment is an analytical tool relating water scarcity and pollution to
human activities or products and the consequent impacts It further goes on formulating
strategies these activities and product should not be at the cost of unsustainable use of fresh
water (Hoekstra 2011) Water footprint assessment method is used to evaluate water
resource utilization in relation to human consumption (Hoekstra and Hung 2002) The WF is
the consumption based indicator of freshwater use that looks at both direct and indirect water
use of a consumer or producer It comprises of three parts namely green blue and grey water
that covers the complete evaluation in line with Water Footprint Network as well as ISO-
10
14046 directions (Lovarelli et al 2016) In view of water pollution as well as water
consumption water footprint assessment is the key methodology for water sustainability
(Cucek et al 2015) that present a clear and elaborate picture to decision makers pertaining to
proper management of water resources (Hoekstra and Chapagain 2007) WF methodology
could be used for a specific product such as goods and services for consumers group like
individualregionbasindistrictnationglobe etc or producers such government organization
private enterprise and industrial sector etc (Ercin et al 2011) The WF of a product is thus a
multidimensional indicator whereas ldquovirtual-water contentrdquo refers to water volume alone
(Hoekstra 2011) Whereas WF of an individual community or business is the total volume
of freshwater used to produce the goods and services consumed by the individual or
community or produced by the business (Hoekstra 2011)
The terms virtual water content refers to the volume of water embodied in the product alone
whereas WF consider detailed account the volume as well the sort of water being used
(green blue grey) and to when and where the water was used The terms virtual water and
water footprints both terms are similar) however being used alternatively in some published
research literature (Allan 1997 Hoekstra and Hung 2002 Hoekstra and Chapagain 2008)
Virtual water is the volume of water required to grow produce and package of agriculture
commodities and consumer goods or services (Allan 1997)
Interest in water footprint methodology has been increasing since it is a multidimensional
indicator that not only measure water consumption volume by source but also polluted
volumes by type of pollution instead of traditional water withdrawal what only measure
direct blue water use not considering the green and grey water and indirect use of water
(Hoekstra et al 2011) Water footprint assessment covers a full range of activities ie
quantifying and locating water footprint of geographic area producerconsumer process or
product assessing the environmental social and economic sustainability of water footprint
and formulation of response strategy
19 Specific objectives of the study
The specific objectives of this study were
To estimate the green and blue water footprints of crops in Peshawar Basin
To calculate the green and blue water availability in Peshawar basin
To determine the grey water footprint of Peshawar basin
To evaluate the environmental sustainability of green blue and grey water
footprints of water in Peshawar basin
11
To analyze the environmental sustainability of grey water footprints as a result of
anticipated reduction in water supply scenario in Peshawar Basin
110 Data Sources
The data require to run the AquaCrop model includes rainfall temperature (maxi and mini)
reference evapotranspiration (ETo) and mean annual atmospheric CO2 The climate data for
30 years period (1986-2016) ie maximini temperature wind speed solar radiation of two
weather stations was obtained from regional office of Pakistan Metrological Department
Crop cover area yield per hectare and fertilizer application data and irrigation schedule was
taken from Bureau of Statistics and Irrigation Department of Khyber Pakhtunkhwa Pakistan
The data on soil type and characteristic was obtain from Harmonized World Soil Database
(IIASA 2018) The soils texture identified using the Soil Texture Triangle Hydraulic
Properties Calculator of Saxton et al 1986 The AquaCrop default crop characteristics were
updated to growing degree days and field management according to the field collected data
111 Thesis outline
Figure-12 Peshawar Basin in Pakistan
Chapter 2
Literature
Review
Chapter 3
Green and blue
water footprints of
agriculture
Chapter 4
Environmental
sustainability of
green and blue
water footprints
Chapter 5
Environmental
sustainability of
grey water
footprint
Chapter 6
Conclusion
and
Recommendation
12
CHAPTER NO 2
LITERATURE REVIEW
21 Concepts and Definitions
The concept ldquoWater Footprintrdquo first introduced by Dutch Scientist Hoekstra in (2003) that
was subsequently elaborated by Hoekstra and Chapagain (2008) It provides a framework for
analysis where we are linking human consumption with fresh water resources This concept
of water footprint has been developed with the aim to use it as an indicator for fresh water
resources consumed by the inhabitants The concept of water footprint defined for a country
as the total volume of water required to produce goods and services in a country that are
directly and indirectly consumed by the local inhabitants (Chapagain and Hoekstra 2003)
This water footprint is further categorised into Blue green and grey water footprint that
represent the consumption of ground and surface water rainwater and the total volume of
water required to dilute pollution in the water (Mekonnen and Hoekstra 2010 Klemes et al
2009)
This review chapter has been focused on various methodologies adopted for assessing
sustainability of water footprint in different River Basin and Watersheds For this we have
reviewed research articles published on water footprint during last sixteen years As the
subject of water footprint in sustainability context is newly emerged field of interest for
researchers development practitioners and policy makers However this review section has
been organized in global regional and local context where the reviewed articles have mainly
explored methodological framework for water footprint and its implementation particularly
for water basins
22 Water Footprint of River Basins Global Context
Water as an essential natural resources have been greatly threatened by excessive usage for
human activities (Oki and Kanae 2006) In the world about 800 million people are facing
water shortage in term of safe drinking water and basic water sanitation (Falconer et al
2012) This water shortage problem is more severe in arid and semi-arid regions of the world
where all river basins have serious water shortage problems such as drying up rivers
pollution in the surface water declining trends in water table (Jose et al 2010) It is necessary
to find new tools and approaches for Integrated Water Resources Management (IWRM) that
bring sustainability in water resources in term of human needs and ecosystem protection
13
(Dudgeon et al 2006) For this new paradigms or approaches such as Water footprint blue
and gray water have been introduced by scientific communities with aim to promote efficient
equitable and sustainable use of water resources in planning and management context
(Falkenmark 2003 Falkenmark and Rockstrom 2006)
Mekonnen and Hoeskstra (2010) carried out a study on green blue and gray water footprints
used for the production and consumption of wheat The scholars conducted this study in 26
major wheat producing countries and 18 major rivers basins of the world Methodologically
5 x 5 arc minute grid size was used with the aim to understand water balance model and to
further calculate water consumed for wheat production during 1996-2005 The results
showed that globally water footprint for wheat production is 1088 Gm3year that is highest
recorded for green water (70) followed by blue (19) and gray (11) respectively This
shows that green water footprint is four time higher than blue water footprint Focusing on
Ganges and Indus river basin where 47 of blue water footprint is related to wheat
production
Liu et al 2012 conducted a study on grey water footprint showing past present and future
trends for anthropogenic dissolved inorganic nitrogen (DIN) and dissolved inorganic
phosphorus (DIP) in more than 1000 major water basins in the world In this study they used
Global NEWS (Global Nutrient Export from Watersheds) model for N and P export by river
The trends calculated for past (1970) present (2000) and future 2050 The future analysis is
mainly based on Millennium Ecosystems Assessment (MA) The results showed that one
third of the world rivers have water pollution level less than 1 where water pollution level
value for N and P has already been exceeding that one for about two third of the major water
basin that is showing serious water pollution problem The results further showed that
contributing factors behind DIN are manure and fertilizer inputs similarly sewage discharge
and detergents are considered as contributing factors for phosphates The WPL in these rivers
is continuously increasing from 1970 to 2000 for all form of N and P This pollution problem
is projected to shift from industrialized countries to developing countries where largest
changes in WPL found in South East Asia
Hoekstra et al 2012 conducted a study with aim to understand blue water footprints versus
blue water availability in the major waters basins of the world They evaluated 405 major
water basins for blue water footprints and blue water sacristy on monthly basis at the 10 year
average for 1996 to 2005 at a 5 x 5 arc minute special resolution They considered three
14
major water consumption sectors ie agriculture industries and domestic water supply They
further classified water scarcity value in to four levels ie low water scarcity moderate water
scarcity and significant water scarcity and severe water scarcity The results showed that
severe water scarcity found at least one month of the year in 201 major water basins with
267 billion inhabitants Among these Indus river basin with 212 million people placed 4 in
context of severe water scarcity during eight months of the year and 12 rivers basins showed
severe water scarcity level during all months of the year
Ercin and Hoekstra (2014) conducted a global study with a question that how WF of
humanity change towards 2050 under four different scenarios Considering 5 various drivers
such as population growth economic growth productiontrade pattern and consumption
pattern and technological development The results showed that WF is a sensitive parameter
that is varying for all scenario and change from one to another The WF for production and
consumption in the regional market (scenario 2) is highest due to growing population and
increasing meat and dairy consumption Similarly scenario 3 (global sustainability) and
scenario 4 (regional sustainability) have also increased with increasing population growth but
is showing decreasing meat and dairy product consumption This study shows that water
footprint of humanity at sustainable level is possible with increasing population but it has
closely linked to the changes in the product consumption pattern of our daily life style
23 Specific river basins studies
Pisimaras et al 2009 carried out a study on Kosynthos River basin (watershed) in Greece
This river basin is stretched approximately 52 km that covers about 440 km2 area
Methodologically the researchers used Multiple Hydrologic Unit (HRU) SWAT and GIS
models in which they analyzed three years temporal data from 2003 to 2006 for Nitrate and
soluble phosphorus These parameters studied with different scenario such as deforestation
(100) urban area encroachment and crops management (20) The results supports the
SWAT model for demonstrating various land use change pattern runoff from crops
management and nutrient loading If SWAT properly managed and validated
Zeng et al 2012 carried out a study on Heihle River Basin in North-West China In this
study they focused on the sustainability of Blue and Green water footprints and Virtual water
contents on monthly bases Methodologically the entire river basin has been divided in to
three major classes such as agriculture Industrial and domestic with the aim to evaluate and
simulate soil water balance for two year data (2004-2006) through CROPWAT model The
15
results showed the water footprint of the entire river basin about 1768 Million m3 per year
during 2004-2006 The results further showed that water consumption is higher in agriculture
(96) followed by industrial and domestic (4) respectively This study revealed that blue
water footprint is unsustainable as the blue water footprint is exceeding during eight months
of the year
Zang et al 2012 conducted another study on the spatio-temporal dynamics of green and blue
water in Basin that is under natural condition Methodologically the river basin divided in to
three sections such as upstream mid-stream and downstream while the whole basin divided
into 303 hydrological response unit and 34 sub-basin using Digital Elevation Model (DEM)
Furthermore this study aimed to assess and validate the SWAT (2005) hydrological model
with Arcview (33) for Heiher river basin For this purpose they used river discharge data
from 1997-1997 and 1990-2004 respectively The simulation of the discharge data (1997-
2004) showed good performance of the SWAT model to demonstrate the spatio-temporal
distribution of green and blue water flows in the entire basin The results further showed that
upstream has a high blue water flow as compare to the downstream similarly the green water
flow is equally distributed among all sub-basins where the total green and blue water flows
were recorded about 2205-22551 billion m3 in 2000
Dumont et al 2013 carried out a study on Guadalquivir river basin in Span where they
analyzed the green and blue water footprint and integrated it with environmental water
consumption considering ground water footprint The total area of the basin is about 57530
km3 with population of more than 55 million Methodologically the water footprint has been
divided into four major sectors such as i) agriculture ii) livestock and pastures iii) industry
domestic supply energy tourism and dams iv) ground water The results showed that green
water footprint is about 190 mm (46 consumption) while blue water footprint is mainly
associated with agriculture (80 of the blue water consumption) Similarly groundwater is
amounting about 720 Mm3 in 2008 where rising groundwater footprint is reducing surface
water availability The results further revealed that among crops Olive groves found major
green and blue water consumer that is 74 and 31 of the total water footprint respectively
Dessu et al 2014 carried out a study on the water resource availability against demands in a
watershed of Mara river basin situated in Kenya and north of western Tanzania The results
showed that there is a remarkable variability in water availability and demand is existing in
16
the basin that shows that increasing demand will put more pressure on available water
resources and may expose the inhabitants of the basin to severe water shortage in the future
Pellicer and Martines (2014) studied Segura river basin in Spain for estimating ground water
flow and direction of water flow between different basins in the catchment area of the Segura
River This estimation is based on the monthly data of 18 consecutive years (1990-2008) The
methodology of this study is based on two stages i) the modified abcd model and ii) semi-
distributed model The results showed that modified model abcd is more authentic and
valuable for inter basin ground water flow This model further provides good results for
quantification of direction and volume of exchange
Multsch et al 2016 carried out a study in the high plans aquifer of USA where they studied
the spatial distribution of blue and green water footprint in connection to the ground water
decline As the said aquifer of USA is highly water stresses where 60 of the irrigation is
mainly dependent on ground water The selected crops for this study were alfalfa corn
cotton sorghum soybean and wheat The time series data (from 1990-2012) used in this
study and processed through spatial decision support system (SPARE) and GIS tools
Furthermore cluster analysis has been performed by considering three parameters i) ground
water level decline ii) green water footprint are (km3year) and iii) blue water footprint area
(km3year) The results showed that the area or region of Water footprint is 4572 km2year
with 54 blue and 46 green water footprint The cluster analysis showed that two clusters
are in the category of significant or severe with 20 of the irrigated land that consume 32
of the total blue water
Pellicer and Martinez (2016) developed a methodological framework for assessment of gray
water footprint They applied this methodology for Segura River basin in the south of eastern
Spain The researchers considered pollutant load in the basin that is based on two stages i)
simulation of enterprise water cycle in which they used spatio-temporal distribution of all
water flows that is based on hydrological model (SIMPA) and Optiges as Decision Support
System (DSS) ii) assessment of gray water footprint of low considering pollutant discharge
such as organic matter (BOD5) Nitrate and phosphates The results showed that gray water
footprint is unsustainable in Segura River both in short and medium terms
Pellicer and Martinez (2016) conducted another study on Segura River Basin in Spain where
they evaluated the effectiveness of water footprint in environmental sustainability and water
17
resource management context The methodology of this study consist on two consecutive
stages i) simulation of anthropised water cycle in which they combined a hydrological model
(SIMPA) with Decision Support System (DSS) ii) in the second stage they considered blue
green and gray water footprints with aim to know the spatio-temporal distribution these water
footprints In this study they assesses sustainability for the periods of 2010 2015 and 2027
scenario as per Hoekstra eta (2011) formulation The results showed that on average green
water use is sustainable while blue water use is un-sustainable due to over exploitation of the
aquifer The results further showed that surface water pollution is mainly caused by excessive
discharge of phosphate so as the gray water footprint is remain unsustainable
Monona et al 2016 carried out a study with the aim to evaluate the application of
Environmental and Economic accounting system for water in Jucar river Basin in Spain This
catchment area covers approximately 43000 km2 with local population of about 5 million
This basin area is highly water stressed area where water is mainly used for agriculture In
methodological framework the researchers combined PATRICAL and SIMGES as the
hydrological model with AQUAACCOUNTS as the decision support system For this
purpose they considered 198081 and 201112 as reference periods for simulation The
results showed that the total water use in Jucar RBD is 15 143 hm3year in the reference
periods where the total water renewable resources is 3909 hm3 per year The water services
cost amout is 6434 million euroyear as of 2012 constant price
Zhang et al 2017 reviewed about 636 peer reviewed research article on the subject of water
footprints from 2006 to 2015 Their results revealed that US researchers have published more
articles (241) followed by China (192) Netherland (16) and India (24) respectively
After reviewing these articles it was found that there are no scientific research studies have
been carried on the topic water footprints in Pakistan though there is widespread
development in in the utilization of water footprint accounting aaplciations and
methodologies
Lovarelli et al 2016 carried out a comprehensive review on water footprints in which they
particularly focused on food crops feed fiber and bioenergy purposes The results showed
that 96 case studies carried out on water footprint for agriculture production in which 75
studies largely cover the quantification in regional and global context furthermore 14 studies
particularly focused on the implication of future water use and water scarcity uncertainty
18
Among these studies 2 analyzed the indicator and availability data on statistical point of view
while 3 is based on literature review Furthermore 2 studies have focused on identification
and comparison of carbon ecological and water footprints Among these 75 studies focused
on the quantification of water footprint of green and blue water while gray water footprint
quantified in 46 in which nitrogen is mainly considered
24 Water Resources Situation in Pakistan
Pakistan is an agriculture based country-majority of the livelihoods are associated with
agriculture A strong interrelationship has been established between water resources and
economic development The growing population recorded about 40 million in 1950 further
grown up to 185 million in 2010 (UN 2012) This fast growing population along with other
socio-economic and climatic factors have exposed Pakistan to different challenges
particularly water resources
Archer et al 2010 carried out a comprehensive study with the aim to explore water
sustainability in Indus River Basin under the changing socio-economic and climatic
conditions The total surface water availability in Indus River is about 137x103 supplying
water mainly for agriculture (Qureshi et al 2010) Archer study found that the sustainability
of water resources in Pakistan has been threatened mainly by socio-economic and climatic
factors Hence Being a water stressed country the threshold value is below 1700
m3capitayear and this will further reach to water scarcity ie 1000 m3capitayear
25 Water Pollution in Kabul River Case Studies
Water pollution has also considered as an issue of concern in Pakistan that is posing threats to
public health due to poor sanitation and monitoring practices The main pollutants found are
coliforms toxic pesticides and heavy metals (Azizullah et al 2011) According to Noor et
al (1982) industrial wastewater is mainly contributing to water pollution and make clean
water more alkaline and showing high level of hardness and chloride and COD
Other water pollution indicators such as Dissolved Oxygen (DO) and Biological Oxygen
Demand (BOD) studied by Noor and Khan (1983) in Kabul River The key finding of the
study showed DO at Azakhail Bala (355mgl) Nowshera bridge (402 mgl) Akora Khattak
(36 mgl) and Khairabad Kund (373 mgl) respectively BOD level at the same sample sites
was recorded as 040 035 and 056 mgl These pollutants are also posing threats to aquatic
fauna
19
Kamin et al (1985) carried out a study on Kabul river and Kheshki lake where they
analyzed and found water pollutants such as total dissolved solids (1550-1820 mgl) sulphide
(075-331 mgl) and sulphate (768-816 mgl) respectively The results showed that the
presence of high level oxidinzable matter including sulphide decreased DO level
significantly The level of Sulphide concentration recorded above the permissible limits that
causing pollution in both Kabul River and Kheshki Lake The pollution of various physio-
chemical and biological parameters are varying across the Kabul river as the main river
channel at Nowshera is not much affected by the industrial pollutants (Butt 1989)
A study carried out by Sohail (1989) on fauna and organic matter in deep bottom of Kabul-
Indus river system This study showed that heavy organic load mud and decomposable
matter found in the surrounding of Nowshera The heavy mud deposited at Nowshera is due
to slow flow of the river while other decomposable matter or organic load come from the
nearby urban areas domestic activities and industries The concentration of organic load is
continuously increasing in the river ecosystems that has direct impacts on fresh water
ecosystems aquatic flora and fauna Furthermore a regular decrease (bellow 75 ppm)
observed in dissolved oxygen at Nowshera during November to January while BOD is
increasing This has also negative impacts on fish population Other factors responsible for
disturbance in aquatic ecosystem are over-fishing hurdles and fish migration and lack of
awareness Khan and Ullah (1991) carried out another study on aquatic pollution in Kabul
River and studied the role of industries in water pollution Particularly they analyzed the
effluents of Paper Mills and Ghee industries This study showed that flow of waste water
recorded as 24 kmh in which the major parameters were Temperature (25⁰C) pH (85) total
suspended solids (1230 mgl) total dissolved solid (2893 mgl) respectively
Nafees and Ghulam (1991-92) carried out Environmental Monitoring of Amangarh Industrial
Estate This study showed that the pH Dissolved Solids Suspended Solids Sulphide
Chloride etc were much higher in concentration against the recommended standards for
industrial effluents However other heavy metals concentration found within the permissible
limits Other study of Ali (1991-92) on river Swat showed these parameters are within the
permissible limits except suspended solids in River Swat and the River is safe from
environment point of view
According to Khattak and Rehman (1992) high concentration of various pollutants or heavy
metals such as Cu Zn Cd Pb and Ni are existing in the Kabul River at Pirsabak Most of
20
these elements are exceeding the permissible level for irrigation However pH and salinity
are found within the permissible limits Another study of Wahid and Muhammad (1992)
showed that these parameters are not creating any harmful effects for aquatic ecosystem at
Amangarh in Kabul River This shows that the impacts and existing of these are varying
across the Kabul River mostly these are found in the industrial zones
Sepah (1993) showed that Shalm river is more polluted because of the municipal effluents
and Khazana Sugar Mills in Peshawar According Nawab (1992) two major drains ie Budni
Nulla and Ganda Vind are carrying various heavy metals and other pollutants that are finally
discharged into Kabul River without any treatment where they are disturbing the aquatic
ecosystem Majority of these trace elements and other pollutants are found above the
permissible level
IUCN (1994) carried out a study on Pollution and The Kabul River in collaboration with
University of Peshawar The results showed that Kabul river is carrying high suspended loads
(340-1310 mgl) under the high flow condition and (10-800 mgl) in low flow condition This
study also showed that the Kabul River is highly contaminated with various heavy metals and
the water is alkaline in nature Sabir (1996) studied major rivers in Khyber Pakhtunkhwa for
suspended load The suspended load (turbidity) was highly found in Chitral river (1112 ppm)
and Bara river (1152 ppm) followed by Kabul river (684 ppm) Panjkora (443 ppm) and Swat
(57 ppm) respectively The remaining important parameters found within the permissible
level for drinking water
Shahina (2001) carried out surface and subsurface water analysis in Peshawar Basin and
studied various cations and anions particularly Cd Mg Potassium Bicarbonate Sulfate and
Chloride This study showed that all these parameters are within the permissible level for
drinking water domestic and agriculture use However the surface water in the vicinity of
Akbarpura are found unsuitable for domestic use Furthermore the Oxygen Isotopic data of
the underground water system showed that the aquifers in the Peshawar Basin is mainly
recharged by Kabul and Swat river and rain water process
Akhter and Iqbal (2017) studied the transboundary water sharing of Kabul River and water
quality were analyzed in light of reduced flow The water quality of Kabul River was found
unsuitable for drinking purpose and is fit for irrigation Reduction in the annual quantity of
21
Kabul River water inside Pakistan will impose a serious problem to agricultural economy and
social dislocation
Nafees et al 2018 conducting study on the effects of water shortage in Kabul River on
wetland of Peshawar Basin It has been observed that the continuous decline in wetlands has
affected habitat with impacts on fish and migratory birds The study also revealed that a
variety of anthropogenic actions had substantial effects on wetlands
22
Table-21 Water footprint methodologies used for sustainable water resources
S No Methodology Geographic Scale Sector Type of water
footprint Reference
1 5x5 arc minute grid size resolution (GISRS) Global river basins Agriculture (Wheat) Blue green
and grey
Mekonnen and
Hoekstra 2010
2 Global Nutrient Export from Watersheds
(Global NEWS model) Global river basins Water pollution Grey (NandP) Liu et al 2011
3 5x5 arc minute grid size resolution (GISRS) Global river basins Agriculture industrial and
domestic Blue
Hoekstra et al
2012
4 Global river basins Socio-economic Blue Ercin and Hoekstra
2016
5 SWAT model with GIS interface Kosynthos River River
basin Greece
Urban area and crop
management Grey (NandP)
Pisinaras et al
2009
6 CROPWAT model Heihe river basin China Agriculture industrial and
domestic Blue Zeng et al 2012
7 SWAT 2005 model Heihe river basin China Water availability Blue and green Zang et al 2012
8 Hydrological model balance MED Guadalquivir river
basin Spain
Agriculture domestic energy
tourism and industrial Blue and green
Dumont et al
2013
9 SWAT model Mara river basin Kenya
and Tanzania Water availability vs demand Blue Dessu et al (2014
10 abcd model and semi distributed model Segura river basin
Spain Interbasin ground water flow Blue
Pellicer and
Martinez 2014
11 SPARE WATER via GIS high plans aquifer USA Agriculture Blue and green Multsch et al
2016
12 SIMPA model with Optiges as DSS Segura river basin
Spain Water Pollution
Grey (BOD5
N and P)
Pellicer and
Martinez 2016
13 SIMPA model with Optiges as DSS Segura river basin
Spain Water sustainability
Blue green
and grey
Pellicer and
Martinez 2016
14 PATRICAL and SIMGES hydrological model
with AQUACCOUNTS as DSS Jucar river basin Spain
Monzonis et al
(2016)
23
CHAPTER NO 3
Blue and Green Water Footprint of Agriculture in Peshawar Basin Pakistan
31 Abstract
Over the last few decades the demand for agricultural products has increased due to
population and economic growth This has exerted immense pressure on the available water
resources of Pakistan In this study the annual blue and green water footprint (WF) of crops
in Peshawar basin from 1986 to 2015 was estimated using an AquaCrop model and global
water footprint assessment (WFA) standard The AquaCrop output was post-processed to
separate soil water content and outgoing water fluxes into blue and green water components
while considering blue water inputs to the soil from both irrigation and capillary rise
Subsequently evapotranspiration (ET) originating from irrigation water capillary rise and
rainwater was determined Results showed that the 30-year average blue WFs of maize rice
tobacco wheat barley sugar cane and sugar beet were 7077 3932 2176 1913 1561 181
and 174 m3ton respectively while the green WFs were 2744 2254 1985 1535 1603 67
and 45 m3ton respectively The aggregated 30-year average annual blue water consumption
of the seven crops in the basin was 1876 million m3 (two thirds of which related to sugar cane
plus maize) while green water consumption was 1014 million m3 (two thirds for sugar cane
and wheat) The WF of all crops exceed the global average except for sugar cane The
findings of this study could be helpful for policy makers to set WF reduction targets increase
efficiency of irrigation and conserve water resources in Peshawar basin
Keywords Green water footprint Blue water footprint AquaCrop Irrigated crops Pakistan
________________________________________________________________________________________
The abstract of this chapter has been accepted by the European Geoscience Union-2019 and the paper will be
presented at EGU General Assembly on 7th April 2019 at Vienna Austria
24
32 Introduction
Fresh water is greatly threatened by human activities (Dos Santos et al 2013) One third of
human population is living in water scarce areas (UN 2014) that is expected to rise to the
two-third of population by 2025 (Dessu et al 2014) Water scarcity in arid regions besides
overexploitation of blue water resources put extra pressure on limited resources (Van Oel and
Hoekstra 2012 Zhang et al 2012) This stress on available water resources is increasing due
to population growth water pollution and the impact of climate change (Malley et al 2009)
Water consumption for irrigation purposes accounts was estimated about 70 of the total
annual water withdrawal in the global scale (Alexandratos and Bruinsma 2012) that
continues to increase (Launiainen et al 2014) This increasing demand has put more pressure
on supply water for domestic and industry activities (Siebert et al 2015)
Pakistan is an agrarian country where 70 of population directly or indirectly depends on
agriculture for livelihood (Khoso et al 2015) It has the world largest irrigation system
serving 54000000 acres of cultivated land (Ahmad 2011 Hassan 2016) In Pakistan the
irrigated area has increased from 1080 million hectares in 1961 to 1470 million hectares in
2005 (Government of Pakistan 2014) Agriculture sector as the primary consumer of water
resources uses about 69 of the available water resources the next consumers are
industries and domestic with rates of 23 and 8 respectively (Khoso et al 2015)
Agriculture sector considers the backbone of the economy in Pakistan as it contributes to
about 40 of labor force and 22 of the National Gross Domestic Product (GDP) and
supports 65 of rural population (World Bank 2011) The country has exploited most of its
available water resources and is now facing sever water shortage (Azizullah et al 2011) this
is the greatest threat to the sustainable crops production (Jehangir et al 2007) Therefore
impacts of water scarcity will have synergic effects on the country economic situation
(Hassan 2016)
There are numerous WF studies in the global and national scales (Chapagain and Hoekstra
2011 Hoekstra and Mekonnen 2010 Lovarelli etal 2016 Mekonnen and Hoekstra 2010)
(Duan et al 2016 Bulsink et al 2009 Chouchane et al 2015) However not many WF
studies were found in the basin level (Duan et al 2016 Mekonnen and Hoekstra 2010
Nouri et al 2019 Pedro-Monzoniacutes et al 2016 Pellicer-Martiacutenez and Martiacutenez-Paz 2016)
This study is the first to assess the water footprint of major crops in Peshawar Basin in
Pakistan This study was designed with an aim to estimate the green and blue water footprint
25
of agriculture in Peshawar Basin from field collected data unlike the previous studies in
which remote sensing data were used for the WF estimation
33 Study area
The basin is located in the northwest of Indus Basin at longitude of 710 15 and 720 45 E and
latitude 330 45 and 340 30 N in the Khyber Pakhtunkhwa province of Pakistan (Shah and
Tariq 2001) It covers an area of 5617 km2 and includes major cities of Peshawar Mardan
and Nowshera and two main rivers of Kabul River and Swat River as shown in figure
31(Bisht 2013) There are about 100 canals running across the basin with an estimated
length of 290 km long (Zakir et al 2013 Department of Irrigation KP 2018) The basin has
about 978 million inhabitants (Bureau of statistics 2017) The average annual minimum and
maximum temperature rainfall potential evapotranspiration and actual evapotranspiration of
a two weather stations in the basin are given in Table 31
Table-31 Temperature precipitation and evapotranspiration in Peshawar Basin
Figure - 31 Map of Peshawar Basin
Weather
Station
Mini-Temp
(⁰C)
Maxi-Temp
(⁰C)
30 years average
Precipitation
(mm)
ET0
(mm)
Actual ET
(mm)
Peshawar -15 50 476 447 425
Risalpur -35 49 703 630 540
26
34 Data and method
The FAO model of AquaCrop - standard (version 61) was used to simulate the soil water
balance crop growth and yield production of Peshawar Basin (Steduto et al 2009) The
input data to run AquaCrop model includes rainfall temperature (max and min) reference
evapotranspiration (ET0) and mean annual atmospheric CO2 The climate data for 30 years
period (1986-2015) ie maximini temperature wind speed solar radiation of two weather
stations were obtained from regional office of Pakistan Metrological Department Based on
the average cultivation area of common crops in the last 30 years major crops were
identified Wheat (43) maize (24) and sugar cane (24) tobacco (4) barley (2)
sugar beet (1) and rice (1) (Bureau of Statistics 2018) The required data including crop
cover area yield per hectare fertilization and irrigation were collected from the field and
irrigation department of Khyber Pakhtunkhwa Pakistan through questionnaire survey Soil
data was extracted from Harmonized World Soil Database 2018 The soils texture was
identified using soil texture triangle hydraulic properties calculator of Saxton et al 1986 The
basin has three soil types ie calcisols (65) cambisols (25) and rock outcrop (10) as
shown in figure 32 taken from harmonized world soil database (IIASA 2018) The
difference between maximum and minimum cover area over the last 30 years by wheat
maize sugar cane tobacco sugar beet barley and rice is 12 8 3 4 1 1 and 02 percent
respectively The spatial distribution of these crops on each soil type was estimated from
satellite image and it was assumed that this annual difference of these crops cover area occurs
on the same soil type The AquaCrop default crop characteristics were updated to growing
degree days and field management according to the field collected data
27
Figure-32 Soil-climate zones of Peshawar Basin
35 Methods (Methodology)
The FAOrsquos AquaCrop model standard (version 61) was used to simulate soil water balance
crop growth and production (Steduto et al 2009) and the daily thermal time step was
selected to run the model (Raes et al 2011) Reference evapotranspiration (ET0) was
calculated using Penman original potential ET equation (Shaw 1994) using daily solar
radiation wind speed and maximumminimum temperature of two weather stations located at
Peshawar and Risalpur
PE =
( )
( ) 1
T atH E
Equation 31
Where
∆ = Slop of vapor pressure cure
ɣ = Hygrometric constant (0065 KPaCo)
HT = Available heat
Eat = Energy of evaporation
351 Simulation of crop growth and Soil water balance
AquaCrop simulates both in and out water fluxes and report the soil water balance This
model separates actual evapotranspiration (ET) into non-productive and productive water
fluxes viz soil evaporation (E) and crop transpiration (T) Yield is obtained by multiplying
biomass by harvest index (HI) of that crop Y = B x HI whereas biomass is calculated using
the following equation
28
B = WP x sumT Equation 32
Where
B = biomass (kg)
WP = water productivity (kgm3)
T = transpiration (mm)
The main purpose of AquaCrop model is to simulate the biomass water productivity (WP)
(Steduto et al 2007 Raes et al 2009 Chukalla et al 2015)
352 Water Footprint Assessment
The output of AquaCrop simulation - crop growth characteristics and water fluxes - were
post-processed to estimate the footprint of each crop as it was described in the global water
footprint accounting standards (Hoekstra et al 2011) and separated into green and blue
compartments using the method introduced by Chukalla et al (2015)
dSgdt = R ndash (Dr + ET) (SgS) ndash RO (R I+R)
dSb-CRdt = CR ndash (Dr + ET) (Sb-CRS)
dSb-Idt = I ndash (Dr + ET) (Sb-IS) ndash RO (II+R)
Where
dt = time step (1day)
R = rainfall (mm)
I = irrigation (mm)
RO = surface runoff (mm)
ET = evapotranspiration (mm)
Dr = drainage (mm)
CR = capillary rise (mm)
Sb-I = blue water from irrigation (mm)
Sb-CR = blue water from capillary rise (mm)
Sg = green water storage (mm)
The green and blue water portion of crop water use (CWU) over the season were calculated
as follow
CWUgreen = sumTt=1 SgtSt ETt 10 (m3)
CWUblue = sumTt=1 SbtSt ETt 10 (m3)
To convert millimeter (mm) to m3ha volume per land use factor 10 is use
WFgreen = CWUgreen yield (m3ton) Equation 33
29
WFblue = CWUblue yield (m3ton) Equation 34
36 Results
361 Total blue and green WF of Peshawar Basin in different soil-climate zones
The averaged blue WF of major crops of 30 years among crops varied across all soil-climatic
zones in the order maize gt rice gt tobacco gt wheat gt barley gt sugarcane gt sugar beet The 30
years average values of blue WF of maize rice tobacco wheat barley sugar cane and sugar
beet were 7077 3932 2176 1913 1561 181 and 174 m3ton respectively The green WF
were 2744 2254 1985 1535 1603 67 and 45 m3ton respectively Maize exhibited the
highest blue and green WF while sugar beet showed the lowest values of WF among all crops
and soil-climatic zones Both green and blue WF values were depended on a crop species as
well as soil-climatic zone For instance for maize the blue WF varied among soil-climatic
zones as zone 4 gt zone 3 gt zone 2 gt zone 1 and the green WF were zone 2 gt zone 3 gt zone 4
gt zone 1 For rice the blue WF differed among the given zones as zone 1 gt zone 2 gt zone 3 gt
zone 4 whereas green WF for rice were zone 4 gt zone 3 gt zone 2 gt zone 1 Zone 1 showed
the lowest blue and green WF as shown in figure 1 No significance difference was seen in
the blue and green WF rates among different soli-climate zones the average blue WF varied
from 23 to 27 percent and the average green WF varied from 21 to 29 percent between
different soil-climate zones (Figure 33)
Figure-33 Percentage of each zone to the annual water footprint of Peshawar Basin (1986-
2015)
30
Figure-34 Annual water footprint of crops in different soil-climate zones of Peshawar Basin (1986-
2015)
31
362 The contribution of major crops in the total blue and green WF of Peshawar
Basin
The annual blue and green WF of different crops changed in time For wheat the highest blue
WF were found in 1988 2000 and 2010 and the lowest WF in 2006 2004 and 2001whereas
the highest green WF were found in 1986 1997 and 2015 and the lowest WF in 1989 2000
and 2001 Sugarcane showed the highest blue WF during years 1988 2003 and 2005 and the
lowest in 2002 2010 and 2012 Blue and green WF of maize did not show significant
changes in time Barley gave higher WF from 1986 to 1999 and thereafter the values
declined up to 2015 WF of sugar beet was found higher during the 1986 1992 to 1995 The
values were lower during 1988-89 2003-05 and 2009-15 for sugar beet Rice and tobacco
also consumed blue and green water inconsistently during the 30 years period as shown in
figure 35
Figure-35 Percentage of blue and green water footprint and crops cover area in Peshawar Basin
(1986-2015)
363 Annual blue and green WF of agriculture sector in Peshawar Basin for the
period 1986-2015
The changes in the water consumption by crops could be associated with several factors
These may include crop species climatic conditions soil properties and several cultural
practices This study provided an initial information for the sustainable management of water
for crops The average annual blue and green water consumption of agricultural sector in
Peshawar Basin was 1886 and 1014 million m3 respectively as shown in figure 36
32
Figure-36 Mean annual blue green and total WF of major crops in Peshawar Basin (1986-
2015)
33
37 Discussion
Increasing food demand for growing population is a growing challenge In Pakistan
irrigation is aimed to water farmlands to the optimal level of soil water content up to the field
capacity (Tariq and Usman 2009) this has put immense pressure on the available water
resources The annual average WF of crops in Peshawar Basin is given in Table 3 Wheat
maize and sugar cane contribute more than 90 of both blue and green water footprint of Peshawar
basin since these three crops cover more than 90 of the agriculture area on the basin (Figure-4)
The annual average WF of wheat for Peshawar Basin was 3448 m3ton of which 55 is from
blue and 45 green water resources This value is two times more than what was calculated
by Mekonnen and Hoekstra 2011 for Pakistan In another study conducted in the Uttar
Pradesh village of India where the WF of wheat was reported to be in range of 2677-9844
m3ton The average of which is much higher than our results of 3448 m3ton (Denis et al
2016) The average WF of maize was estimates 9821 m3ton in Peshawar Basin which is
much higher than the average value of 2375 and 859 m3ton calculated by Mekonnen and
Hoekstra 2011 for Pakistan and world respectivley In another study conducted in Iran the
maximum WF of maize was calculated 1302 m3ton and in the Nothern China the WF of
maize was calculated 840 m3ton (Ababaei and Ramezani Etedali 2017 Duan et al 2016)
The reason for this high WF is the hight temperature and wind speed during maize growing
periods Pakistan lies in subtropical belt which receives plenty of sunshine during summer
The evapotranspiration in Peshawar Basin is high in month of June the warmest month of the
year (figure 37) (Khan and Hasan 2017)
Figure - 37 Average monthly air temperature and wind speed in Peshawar Basin from 1986-2015
34
Table - 32 Average blue and green water footprint of main crops and total water footprint of crop
production in Peshawar Basin (1986-2015)
( Mekonnen and Hoekstra 2011)
The WF of sugar cane in Peshawar Basin was estimated as 248 m3ton of which 73 is from blue
water while 27 is from green This WF is larger than the global average of 196 m3ton but it is lower
than of Pakistan 309 m3ton The WF 248 m3ton for sugarcane in Peshawar Basin is similar to the
study conducted by Kongboon and Sampattagul (2012) that reported the WF 202 m3ton for sugar
cane in northern Thailand The blue and green WF of rice barley sugar beet and tobacco as shown in
table-3 are higher than the mean global and national reported by Mekonnen and Hoekstra 2011
The thirty years average annual blue water consumption of sugar cane maize wheat
tobacco sugar beet rice and barley were 655 623 494 57 32 14 and 11 million m3
respectively while green water were 308 236 391 52 8 8 and 11 million m3 respectively
The average annual blue and green water consumption of agricultural sector in Peshawar
Basin was 1886 and 1014 million m3 respectively
Water footprint of crops in
Peshawar Basin (m3ton)
Water footprint of crops
in Pakistan (m3ton)
Global average water
footprint (m3ton)
Crops Blue Green Total Blue Green Total Blue Green Total
Maize 7077 2744 9821 614 1747 2361 81 947 1028
Rice 3932 2254 6186 3437 1051 4488 535 1800 2335
Tobacco 2176 1985 4161 NA 1337 1337 205 2021 2226
Wheat 1913 1535 3448 1368 732 2100 1277 342 1619
Barley 1561 1603 3164 2808 2773 5581 79 1213 1292
Sugar cane 181 67 248 217 92 309 57 139 196
Sugar beet 174 45 219 1 109 110 26 82 108
35
CHAPTER NO 4
Environmental Sustainability of Blue and Green Water Footprint in Peshawar
Basin Pakistan
4 1 Abstract
Water is a fundamental resource for sustainable economic development of any country
Freshwater resources are becoming scarce due to inevitable demand for food industrial
development and growing urban and rural population Pakistan is in arid region of the world
with an average annual rainfall less than 240 mm Being an agriculture based economy the
availability of fresh water is essential for sustainable economic growth Both the green and
blue water serves population and economy In this study the blue and green water availability
and scarcity was calculated following Water Footprint Assessment Standard in Peshawar
Basin during the period 1986-2015 The result show that per capita water availability dropped
from 1700 m3 per in 1986 to 600 m3 in 2015 In term of per capita water availability the basin
turn from ldquowater stressedrdquo in 1986 to ldquowater scarcersquo in in 2015 Further both the blue and
green water footprint of agriculture has decrease from 2139 million m3 in 1986 that reduced
to 1738 million m3 in 2015 Similarly the green water flow from agriculture land was 1231
million m3 in 1986 which reduced to 1104 million m3 in 2015 The domestic water footprint
has increased from 13 million m3 in 1986 to 29 million m3 in 2015 Both the blue and green
water scarcity are less than 100 and are low water scarcity level
Keywords Sustainability Green water footprint Blue water footprint Water scarcity
Peshawar basin Pakistan
36
4 2 Introduction
Water is a fundamental resource for sustainable economic development of any country
(Siegmann and Shezad 2006) Freshwater resources are becoming scarce due to inevitable
demand for food feed fiber and bioenergy industrial development and growing urban and
rural population (Hoekstra et al 2012) Pakistan is located in an arid region of the world with
an average annual rainfall of less than 240 mm Being an agriculture-based economy the
availability of fresh water is essential for sustainable economic growth The agricultural
sector consumes more than 96 of the countryrsquos fresh water resources (Sadaf and Zaman
2013) Pakistan solely depends on the Indus River System for its water supply (Iqbal 2010)
The country receives an annual inflow of about 180 billion m3 from the Indus river system
The groundwater resources that are mainly situated in the Indus river plains are subject to
over-exploitation and are not only depleting but also mostly polluted The per capita water
availability will drop from 11844 m3 in 1950 to 1823 m3 in 2025 (Gardner-Outlaw and
Engelman 1997) Unlike blue water consisting of surface water and ground water green
water has received little attention in the literature (Schyns et al 2019) Green water is
defined as the rain water that doesnrsquot runoff or recharge the groundwater but is stored in the
soil and available for vegetation (Hoekstra et al 2011) Like blue water green water is also
scarce since using green water for one purpose makes it unavailable for another purpose
Green water scarcity is the ratio of the green water footprint and the available green water
resources of a particular region Allocation of green water is basically the allocation of land
for a particular use People mostly ignore green water scarcity because of this indirect free of
cost allocation Both green and blue water serves population and economy resulting in a
green and blue water footprint (Schyns et al 2015) Review of literature shows that there are
many studies on the blue water footprint at country and basin level an (eg Archer et al
2010 Dessu et al 2014 Hoekstra et al 2012 Pellicer-Martiacutenez and Martiacutenez-Paz 2016
Zang et al 2012)
Peshawar basin is a sub-basin of the Indus basin and extends from 710 15 to 720 45 east
longitude and from 330 45 to 340 30 north latitude in the province of Khyber Pakhtunkhwa
Pakistan (Shah and Tariq 2001) Blue water is mainly supplied through the Kabul and Swat
rivers The total length of the Kabul River from the Unai pass in the Sanglakh range of the
Hindukush mountains in Afghanistan to the Indus River in Pakistan is about 700 km (Sepah
1993 World Bank 2010 IUCN Pakistan 2010) The Kabul River has its source in the
37
Karakoram Mountains enters Pakistan at the Shin Pokh area of Mohmand Agency and flows
approximately 560 km in Afghanistan and 140 km through Pakistan (Favre and Kamal
2004)
The average annual discharge of the Kabul River at the border between Afghanistan and
Pakistan is 19 billion m3 (BCM) of which 49 is contributed by Afghanistan through the
Kabul River and 51 by Pakistan through the Chitral River Downstream of Warsak dam
the Kabul River (including the Chitral River) contributes 58 of the flow while the Swat
River contributes 42 of the flow The mean annual discharge of Kabul River at Nowshera
is 27 BCM (Akhtar and Iqbal 2017 Yousafzai et al 2004)
There are eight hydroelectric power plants constructed in the Kabul River and its tributaries
Six are located in Afghanistan and two in Pakistan In Afghanistan due to more than 25 years
of war and civil unrest no river has been altered but recently the Government of Afghanistan
has planned to develop 13 multiple purpose hydropower projects and irrigation schemes in
the Kabul River The proposed projects will have storage capacity of approximately 3309
million m3 which is about 63 of the annual average flow of the Kabul River without taking
into account the flow of the Konar River This storage of water will probably affect the
downstream flow regime and water resources in Pakistan (World Bank 2010 Mustafa 2016
Govt of Afghanistan 2017)
Previously there has been no study on the blue and green water availability and scarcity in
Peshawar Basin Therefore the aim of this study is first to estimate the availability of blue
and green water in Peshawar Basin and second to estimate the environmental sustainability of
blue and green water during the period 1986-2015 Blue and green water scarcity has been
used as an indicator to determine the environmental sustainability (Hoekstra et al 2011)
4 3 Materials and Methods
In this study we followed the approach described by Hoekstra et al 2011 concerning the
global standard for water footprint assessment (Schyns et al 2019)
43 1 Water balance of Peshawar Basin
The water balance of Peshawar basin can be described by the following equation
Inflow - outflow = change in storage
QWarsak + QMunda + P = QNowshera + QKalpani + ET + ΔS Equation 41
38
Q = discharge at Warsak Munda Nowshera and Kalpani (mmyear)
P = precipitation (mmyear)
ET = actual evapotranspiration (mmyear)
ΔS = change in soil water storage (mmyear)
Evapotranspiration was calculated by the following Penmen equation (Shaw 1994)
ETo =
( )
( ) 1
T atH E
Equation 42
Where
HT = RI (1 ndash r) -Ro
RI = (1- r) = 075 Raƒa (n N)
Ro = σTa4 (047 ndash 0075radic ϱa ) (017 + 083nN
Eat = 035 (1 ndash u2 100)( ϱa - ϱd)
Where
ETo = potential evapotranspiration
∆ = slop of the vapor pressure cure (KPa)
r = hygrometric constant (0065 KPa)
H = available heat
Ea = energy of evaporation
Ta = mean air temperature ()
RI = incoming radiation
Ro = outgoing radiation
ϱd = actual vapor pressure of the air (mm of Hg)
ϱa = saturated vapor pressure of the air (mm of Hg)
ϱa - ϱd= saturation deficit
n = bright sunshine hours
N = mean daily duration of maximum possible sunshine hour
The actual evapotranspiration was calculated following the method of Zhang et al (2001)
1
1
T1
Eo
o o
ET
P
ET ET
P P
P
Equation 43
Where
ET = actual evapotranspiration
39
ETo = potential evapotranspiration
P = precipitation
120596 = coefficient
432 Blue water availability (WAblue)
Blue water supply to Peshawar Basin is mainly from Kabul River and Swat River The
discharge data of Kabul River at Warsak (Q1) and Swat River at Munda (Q2) for the period
1986 to 2015 was obtained from Pakistan Water and Power Development Authority
(WAPDA) and irrigation department Following Hoekstra et al 2012 and Richter et al
2012 80 of the natural runoff was allocated as environmental flow requirement (EFR) The
remaining 20 is the blue water availability WAblue for consumption The per capita annual
WAblue was determined as the ratio of annual WAblue to the corresponding year population
433 Blue water footprint (WFblue)
The blue water footprint WFblue of the agricultural sector in Peshawar Basin was estimated
for seven crops by using the AquaCrop model (Steduto et al 2009) and separating blue and
green evapotranspiration following the method of Chukalla et al (2015) The blue WF of the
domestic sector was estimated by taking 25 imperial gallons (114 liters) per capita per day for
urban population and 15 imperial gallon (68 liters) per capita per day for rural population
(Public Health Department 2019) The percentage of the population supplied by different
water sources was taken from Pakistan Social and Living Standard Measurement Survey
1986-2015 The blue WF of the domestic sector was taken as 10 of the total domestic
water withdrawal (Hoekstra et al 2012)
434 Green water availability (WAgreen)
The annual actual evapotranspiration (ET) was estimated using formula of Zhang et al
(2001) The green water flow in Peshawar Basin during the period 1986 to 2015 for
agriculture pasture and urban area were estimated based on the corresponding areas from
satellite images of 1985 1990 1995 2000 2005 2010 and 2015 (see figure 41) The green
water flow from urban area was estimated by multiplying the urban area with an
evapotranspiration (ET) rate calculated with equation (2) with a w value of 01 which
represents a very low ability to store water
The total green water flow from pasture was calculated by multiplying the actual ET with the
pasture area from 1986 to 2015 The areas reserved for nature conservation in Peshawar basin
are shown in Table 41 ET from this area was estimated accordingly All the meteorological
40
data required for the calculation of ETo and rainfall data of both weather stations (Peshawar
and Risalpur) in Peshawar Basin were collected from the Pakistan Metrological Department
Table 41 Land set aside for nature Game Reserved and Wildlife Park
435 Green water footprint (WFgreen)
The green water footprint WFgreen was calculated following the Schyns et al 2019 method
A fraction of green water consumed by livestock grazing was allocated as WF of grazing
Livestock census data of 1986 1996 and 2006 were converted to annual figures by
interpolation (Government of Pakistan 1986- 2015)
436 Environmental sustainability of WFblue
The blue water scarcity (WSBlue) is the ratio of WFblue and WAblue in Peshawar Basin from
1986 to 2015 When the value exceeds 1 it means that the consumption is unsustainable
while a value lower than 1 indicates sustainable use of blue water
WFblue
WSblueWAblue
Equation 44
437 Environmental sustainability of WFgreen
For analyzing the environmental sustainability of WFGreen the green water scarcity (WSGreen)
is used define as the ratio of the sum of WFgreen and the sum of the maximum available green
water volume The WFGreen is the sum of actual ET of crops pasture land buildup area and
area set aside for nature in Peshawar Basin from 1986 to 2015
WFgreen
WSgreenWAgreen
Equation 45
Area Name Area Type District Longitude Latitude Area
(Km2)
Nizam pur Game reserve Nowshera 72015856 E 33480567 N 8
Shamshatoo Game reserve Nowshera 71483795 E 33525613 N 35
Maroba Game reserve Nowshera 71561739 E 33473632 N 35
Sudham Game reserve Mardan 72162816 E 34155551 N 115
Cherat Wildlife park Nowshera 71544394 E 33493784 N 27
Manglot Wildlife park Nowshera 71590356 E 33445040 N 7
Nizam pur Wildlife park Nowshera 71918056 E 33757044 N 26
Total 253
41
When the value exceeds 1 it means that the consumption is unsustainable while a value
lower than 1 value indicates sustainable use of WFgreen
Figure-41 Land cover change in Peshawar Basin from 1986-2015
42
44 Results
Figure 42 shows that the actual runoff fluctuated during the period 1986 to 2015 with higher
values during 1987-2005 and then again the magnitude increased with some variations up to
2015
Green water use in Peshawar Basin during 1986-2015 from agriculture pasture and urban
area is shown in Figure 43 The green water flow values differed as agriculture gt pasture gt
urban area gt area for nature The green water use of agriculture pasture urban built area and
areas set aside to nature is 50 31 12 and 7 respectively
Figure 44 shows that the blue WFagriculture shows a decreasing trend because the agriculture
area in 1986 was reported as 4114 km2 and reduced to 3103 km2 in 2015 since agricultural
land has been converted to settlement over time On the other hand there is an increase in the
blue WFdomestic because of the increasing population in the basin Further the per capita blue
water availability in Peshawar Basin (1986-2015) indicated a substantial declining trend
throughout the period In 1986 the per capita availability of blue water was more than 1600
m3 whereas in 2015 the per capita blue water availability was lower than 600 m3 This
declining trend can be associated with the population growth migration of peoples from rural
to urban areas and other agricultural and economic activities in Peshawar basin Figure 44
shows that blue water and green water scarcity have gradually increased with time The
scarcity percentage of green water is larger than that of blue water Figure 45 show that the
distribution of blue water sources in Peshawar Basin are given as tape water 36 motor
pump 26 hand pump 22 and dug-well 16 This research also indicated that blue water
and green water scarcity have been gradually increased with time The scarcity percentage of
green water was observed greater than blue water scarcity Blue water scarcity obviously
fluctuated during the three decades as shown in figure 45
43
44
Figure-45 Percentage of green water flow (A) and Percentage of blue water supply (B) in
Peshawar Basin (1986-2015)
45
45 Discussion
Availability of fresh water resources is among the interlinked network of challenges that
Pakistan is currently facing (Archer et al 2010) The agriculture sector alone consumed
93 of the available blue water Irrigation water requirement of Pakistan will raise to 255
billion m3 from 163 billion m3 in 1995 (Iqbal 2010 Sadaf and Zaman 2013) while the
country receive an annual influx of about 180 billion m3 in Indus river system from
neighboring countries (Iqbal 2010) According to water scarcity level set by Hoekstra et al
2012 the Indus Basin faces server water scarcity during eight month of the year however
Peshawar Basin has low water scarcity level for both blue and green water scarcity (Table
42) This is the first study that estimate the availability of blue and green water and scarcity
on a basin level in Pakistan There is no previous study of Peshawar Basin to compare our
results with The annual blue water availability in Peshawar Basin is about 6080 million m3
of which more than 98 is used by agriculture sector and the rest for domestic use
Table-42 Water scarcity thresholds
(Hoekstra et al 2012)
The situation of water resources in Peshawar Basin worsen during the period 1986-2015 The
per capita water availability dropped from 1600 m3 per in 1986 to 600 m3 in 2015 In term of
per capita water availability the basin turn from ldquowater stressedrdquo in 1986 to ldquowater scarcersquo in
in 2015 (Schmidt et al 2001)
Over the last 30 years both the blue and green water footprint of agriculture has decrease over
time because more and more agriculture land has been converted into settlement Water
footprint of agriculture was 2139 million m3 in 1986 that reduced to 1738 million m3 in 2015
Similarly the green water flow from agriculture land was 1231 million m3 in 1986 which
reduced to 1104 million m3 in 2015
The domestic water footprint of Peshawar Basin during the period of 1986-2015 has
increased from 13 million m3 in 1986 to 29 million m3 in 2015 because of population
increase This increasing demand for water is dependent on economic classes housing
characteristic water quality accessibility to water sources and water pricing (Bhatti and Nasu
2010)
Water Scarcity Levels Thresholds
Low water scarcity lt100
Moderate water scarcity 100 ndash 150
Significant water scarcity 150 ndash 200
Sever water scarcity gt200
46
CHAPTER NO 5
1Environmental Sustainability of Grey Water Footprints in Peshawar Basin
Scenarios for Current and Future Reduced Flow in Kabul River
5 1 Abstract
Fresh water resources play an important role in social and economic development of a
country Measuring water pollution at basin level is one of the main challenges in water
resource management In this study grey water footprints (WFgrey) is used as an indicator to
assess environmental sustainability related to Nitrogen (N) and Phosphorus (P) pollution in
Peshawar Basin Pakistan The N and P pollutants load from artificial fertilizers animal
manure household and industrial sources were considered during 1986 to 2015 Average of
30-years N-related WFgrey showed that artificial fertilizer contributed 61 livestock manure
36 household sources 2 and industries 1 while for P-related WFgrey the contribution
from artificial fertilizer livestock manure and household sources were 50 49 and 1
respectively Averaged 30-years N and P associated WFgrey of the basin were 50108 m3y
and 50109 m3y respectively To assess the potential impact of dams on Kabul river water
pollution The water pollution level (WPL) was estimated under normal and reduced runoff
scenarios for an increased upstream use of water from Kabul river in Afghanistan N-related
WPL was within the sustainability limit of 100 while P-related WPL exceeded sustainable
limits in every year under normal runoff and were worse in each reduced runoff scenarios
This study shows the deterioration of water quality of Kabul river and the findings may be
helpful for future planning and management of the basin
Keywords Sustainability Grey water footprint Nitrogen Phosphorus Kabul River Pakistan
This chapter is submitted to International journal of agriculture and biological engineering (IJABE) and is under
review
47
5 2 Introduction
Pakistan is facing serious water shortage as the available water resources have been
exhausted to great extent (Govt of Pakistan 2014) Sharp decline of about 3500 m3 per
capita water availability has been recorded from 1950 to 2009 Water availability has dropped
down further to 1500 m3 in 2009 as compared to the baseline data of 5000 m3 in 1950
(Azizullah et al 2011) Most of the existing water resources has been polluted due to
unchecked discharge of industrial and municipal effluents (Bisht 2013) Agricultural
intensification population growth industrialization and urbanization are the key contributing
factors to quality and quantity of water resources (Liu et al 2012 Helen et al 2006 Eva et
al 2017 Karn et al 2001 Serio et al 2018 Yan et al 2013 and Manzardo et al 2016)
Peshawar Basin is extended from 710 15 to 720 45 East longitude and from 330 45 to 340 30
North latitude in the province of Khyber Pakhtunkhwa Pakistan (Figure51) (Shah and Tariq
2001) Kabul River is the main river flowing through Peshawar Basin that originates from
Unai Pass of Hindukush Mountains in Afghanistan It covers approximately 700 km distance
from Unai pass up to Indus River (Favre and Kamal 2004)
Figure-51 Kabul river passing through Peshawar Basin in Pakistan
The Basin comprised of four districts (Peshawar Mardan Charsadda and Nowshera)
covering an area of 5623 km2 with a population of 978 million (Govt of Pakistan 2017)
48
Like rest of the country quality and quantity of water sources in Peshawar basin has been
adversely affected Effluents from households and industries directly or indirectly discharge
to Kabul River without any treatment (Azizullah et al 2011 IUCN 1994 Zakir et al 2013
Khan et al 2013 and Ahmad et al 2015) Kabul River flows about 560 km in Afghanistan
and 140 km in Pakistan In Afghanistan the river contributes about 26 of surface water
flow (Favre and Kamal 2004) The Government of Afghanistan intends to construct 13 dams
(Table S1in supporting material) for power generation and irrigation on river Kabul (World
Bank 2010 Govt of Afghanistan 2017) These projects in general and Konar storage project
in particular would result significant reduction in water flow to Peshawar Basin
Consequently adverse impacts are expected on ecosystems and livelihood opportunities of
lower riparian (Mustafa 2016)
Review of literature show that previous studies have mainly focused on physico-chemical
characteristics of water quality in Kabul River (summarized in Table 1) Some studies
analysed heavy metals concentrations in water at various locations while others have
determined the impact of polluted water on fish and wheat irrigated with riverrsquos water (Noor
et al 1982 Noor and Khan 1983 Kamin et al 1985 Sohail 1989 Nafees and Ghulam
1992 Nawab 1992 Wahid and Muhammad 1992 Khattak and Rehman 1992 Sepah
1993 IUCN 1994 Iqrar 1994 Shah and Tariq 2001 Yousafzai and Shakoori 2007 Khan
et al 2011 and Khan and Khan 2012) However no study has been reported on the overall
sustainability aspects of Kabul River to assimilate pollution load and the likely future
scenarios in the context of reduced water flow as a result of construction of dams in
Afghanistan and its subsequent downstream impacts
The concept of water footprint is commonly used these days for the assessment of
environmental sustainability of industrial parks urban area and river basins (Miglietta et al
2017 Ma et al 2015 Fang et al 2015 Chen et al 2015 and Pellicer-Martnez and Martnez-
Paz 2016) This study was designed to analyse the environmental sustainability of WFgrey
and WPL in relation to N and P loads from artificial fertilizers animal manure households
and industrial sources during a period of 1986 to 2015 and to determine the likely impacts of
reduced runoff scenarios from increased water usage in Afghanistan
49
Table-51 Previous studies on water pollution of Kabul River
Year Temp
(⁰C) pH
Cond
(microscm)
Alkalinity
(mgl)
SO42-
(mgl)
DO
(mgl)
BOD
(mgl)
COD
(mgl)
NO3-
(mgl)
PO43-
(mgl) Reference
1982-
83 875 840 2840 379 044 2081
Noor et al 1982
Noor et al 1983
1990 1920 807 3160 Akif et al 2002
1994 2222 758 36298 11768 4432 643 310 8175 491 052 IUCN 1994
1997 2500 765 26500 9200 3100 630 26 78 126 030 Khan et al 1997
1999 1550 800 2900 15454 11502 948 332 4757 051 Khan et al 999a
Khan et al1999b
2008 15923 14061 427 12226 164 017 Yousafzai et al
200810
2009 760 46756 6606 612 320 Iqbal et al 2009
2010 2333 755 20640 12386 16399 377 128 011 Yousafzai et al2010
2011 786 Nosheen et al 2011
2013 760 560 116 103 Zahidullah et al 2013
2014 3012 822 2320 032 Jan et al 2014
2015 1844 817 21262 8094 303 043 Rauf et al 2015
2017 808 33566 14866 144 720 075 Akhtar et al 2017
5 3 Materials and Methods
53 1 Grey water footprint
WFgrey is define as the volume of fresh water required to assimilate the load of pollutants
discharged into water based on natural background concentrations and existing water quality
standards WFgrey was calculated using Global Water Footprint Assessment Standard and
Grey Water Footprint Accounting Guidelines WFgrey (m3) was computed by dividing N and
P application (tonsyear) by the difference between the maximum acceptable concentration
Cmax and the natural background concentration Cnat of N and P (Hoekstra et al 2011 Franke
and Mathews 2011 and Franke et al 2013)
max( )grey
nat
LWF
C C
[m3] Equation 51
L application [tonyear]
α = leaching-runoff fraction
L = pollution load [tons]
Cmax = maximum allowable concentration [tonm3]
Cnat = natural background concentration [tonm3]
50
53 2 Environmental sustainability of grey water
Environmental sustainability was calculated according to the method described Hoekstra et
al 2011 where WPL was used for environmental sustainability analysis of WFgrey WPL is
the ratio of total WFgrey in a basin to the actual run-off (Ract) in basin A 100 value of WPL
indicate that waste assimilation capacity has been completely consumed and WFgrey is
unsustainable (Hoekstra et al 2011)
WPL = sumWFgrey Ract Equation 52
Ract = actual runoff [m3year]
53 3 Reduced runoff scenarios
The 30 years annual average (1986-2015) of WFgrey and runoff of Kabul river is taken as
reference value The reference runoff is reduced by 10 20 30 40 and 50 to
analyse the effect of flow on WPL for each (Rreduced) scenario keeping WFgrey constant
5 4 Data description
The N and P loads for the period of 1986 to 2015 from livestock manure is calculated by
multiplying livestock population by animal-specific excretion rates (Govt of Pakistan 1986-
2015) Livestock censuses data of 1986 1996 and 2006 were converted to annual figures by
interpolation while 2007 to 2015 population data was obtained from Livestock Department
Khyber Pakhtunkhwa province The slaughtered weights of animals in Pakistan for the years
1980 1990 and 2000 are shown in Table 2 (FAO 2003 Yousif and Babiker 1989) and
animal excretion rates were taken from Sheldrick et al 2003
Table-52 Slaughtered weight and N and P contents in various livestock categories
Ammonia volatization rates for cattle and poultry (36) and for buffaloes sheep and goat
(28) were taken from Bouwman et al 1997 accordingly Input of artificial fertilizers was
Livestock
Type
Slaughtered
weight
(kg)
Kg of nutrient
(per slaughtered weight per year)
Slaughtered weight
in Pakistan (kg)
Nitrogen Phosphorus 1980 1990 2000
Cattle 250 50 10 1269 164 1909
Buffaloes 250 50 10 885 1171 1331
Horse 250 45 8
Asses 45 8
Mules 45 8
Sheep 15 10 2 107 174 170
Goats 12 10 2 96 155 170
Camels 456 50 10 456
Poultry 2 06 019 07 10 11
51
obtained from Pakistanrsquos National Fertilizer Development Centre (NFDC) annual reports
(Govt of Pakistan 1986-2015) NFDC annually reports N and P nutrients in the form of urea
calcium ammonium nitrate (CAN) diammonium phosphate (DAP) single and triple
superphosphate (SSP) and sulphate of potash (SOP) in the country The N and P loads from
households and industrial sources were calculated according to Van Drecht et al 2009
Mekonnen and Hoekstra 2015-2018 Human population censuses of 1981 1998 and 2017
were converted into annual population by interpolation (Govt of Pakistan 2017) Since
Peshawar basin has no operational wastewater treatment plant (Qureshi 2014) therefore
population connected to public sewerage system (D) and removal of N and P through
wastewater treatment (RN = 0) and (RP = 0) was presented accordingly The N and P load
from industrial sources were taken as a function of urban household load as in equation (4)
and (5) (Mekonnen and Hoekstra 2015-2018 )
Nisw = 01times 07 times [Nhum U times (1-RN)] Equation 53
Pisw = 01times 07 times [Phum U times (1-RP)] Equation 54
Where
Nisw = nitrogen load from industries (kgpersonyear)
Pisw = phosphorous load from industries (kgpersonyear)
Nhum = human nitrogen emission (kgpersonyear)
Phum = human phosphorous emission (kgpersonyear)
U = urban population
RN = removal of nitrogen through wastewater treatment
RP = removal of phosphorous through wastewater treatment
In the absence of standard setup for Cmax and Cnat for N and P for surface water in Pakistan
the Cmax of 29 mgl and Cnat of 04 mgl for N and Cmax of 002 mgl and Cnat
of 001 mgl for
P were set from (Mekonnen and Hoekstra 2015-2018 ) Runoff data (m3year) of Kabul
River were obtained from Water and Power Development Authority (Govt of Pakistan
1986-2015)
5 5 Results
551 Application of N and P fertilizers in Peshawar Basin
The application of N and P fertilizers in Peshawar Basin from 1986-2015 are given in Figure
52 The data revealed that community has been using chemical fertilizers in huge amounts
for intensive agricultural activities across the basin Every passing year witness an apparent
increment in application of N and P nutrients The application of N and P fertilizers show that
the water pollution level of N and P in river water is substantially attributed to the use of
artificial fertilizers in Peshawar Basin
52
Figure -52 Application of N and P in Peshawar Basin from 1986-2015 (tonsyear)
552 N and P loads from livestock manure
N and P loads from livestock manure were measured by multiplying livestock population by
manure production During 30-years period average N and P loads from livestock manures in
Peshawar Basin have been highly depended on the animal species
Figure-53 Input of N and P by different livestock in Peshawar Basin (average of 30 years)
For instance cattle manure contributed to the N input of the basin by 50 buffaloes by 19
goat by 16 equine by 8 sheep by 4 and camels by 1 For P load cattle manures
53
contributed by 37 sheep by 28 buffaloes by 14 goat by 12 equine by 5 and
camels by 1 (Figure 3) Changes in the N and P inputs could be attributed to the innate
concentrations of these nutrients in manures as well as excretion rate per livestock
553 WFgrey of N and P
Average of 30-years N-related WFgrey in Peshawar Basin showed that artificial fertilizer
contributed 61 livestock manure 36 household sources 2 and industries 1 For P-
related WFgrey the contribution from artificial fertilizer livestock manure and household
sources were 50 49 and 1 respectively The contribution from industrial sources found
as negligible (Figure 54)
Figure-54 Source to WFgrey () in Peshawar Basin (30 years average) (A) nitrogen (B)
phosphorus
Figure-55 N and P-related WFgrey in Peshawar Basin during 1986-2015
Both N and P-related WFgrey in Peshawar Basin steadily increased over the period of 1986-
2015 P-related WFgrey exhibited higher values than Nndashrelated WFgrey During 1986 the N-
54
related WFgrey was less than 30 108 m3y whereas P- WFgrey was slightly more than 40108
m3y However after 30 years period the average N-related WFgrey exceeded the amount of
50108 m3y and P-related WFgrey over the study period reached to a level of 50109 m3y
(Figure55)
554 WPL of N and P
WPL was used for environmental sustainability analysis of grey water footprint WPL for N
and P substantially enhanced during the period of 1986-2015 In the last 15 years the
increase in the water pollution was higher and fluctuated during the subsequent years The
consistent higher values of WPL in the last decade could be associated with the excessive
human activities in the forms of intensive agriculture raising of livestock industrialization or
urbanization The N-related WPL was within the sustainability limit of 100 for each
passing year during the study period whereas P-related WPL has exceeded the sustainability
limit (Figure 56)
555 WPL for reduced runoff scenarios
The study predicted the impacts of reduced runoff scenarios in the river on N and P linked
water pollution level of Kabul River Results of the N and P related WPL for the future
reduced runoff scenarios of 10 20 30 40 and 50 are given in Figure 56 N-related
WPL for the five simulated runoff scenarios were 19 21 24 28 and 34
respectively
Figure - 56 WPL in Kabul River of Peshawar Basin during 1986-2015
55
All these values remained within the sustainability limit of 100 P associated WPL
exceeded the sustainability limit for each scenario The WPL-P values were calculated in the
following pattern 194 218 249 291 and 349 respectively (Figure 57) Since P has
exceeded the sustainability limits therefore decrease in the quantity of water or increase in
the magnitude of P release may further exacerbate the quality of water in Kabul River This
situation could be harmful to ecosystem in terms of water quantity and quality after mixing of
drainage water untreated industrial and municipal wastewater
Figure - 57 N and P related WPL for five different reduced-runoff scenarios in Peshawar
Basin
56 Discussion
WFgrey determines the sustainability of water resources The study investigated WFgrey for N
and P load originated from different sources in Peshawar Basin during 1986 to 2015 Both N
and P-related WFgrey steadily increased during the investigation period The level of WFgrey
has been associated with factors like artificial fertilizers livestock manures household and
industrial sources WFgrey of N and P ascertained that Peshawar basin has adversely affected
the river water quality
Unfortunately there is no previous research concerning WFgrey in Peshawar Basin for
comparison of results However according to Mekonnen and Hoekstra 2015 N-related
WFgrey of Pakistan was 288 billion m3year in 2002-2010 where 262 billion m3year were
from agriculture 23 billion m3year from households and 3 billion m3year from industries
The Indus river basin has N-related WFgrey of 440 billion m3year as agriculture being the
main contributor (59) and households as the second (38) (Mekonnen and Hoekstra
56
2015) Nafees et al 2018 reported that 68 of wetlands in Peshawar Basin has been
converted into agricultural fields due to the shortage of water in Kabul River However this
study showed that high P-related pollution in river over last 30 years lead to eutrophication of
wetlands (Correl 1998) in the basin The local community convert these dry lands for
agriculture fields that further increases pollution by escalating application of fertilizers In the
absence of any previous published work this study confirms that environmental pollution has
degraded the quality of water in Kabul River This would render it unsuitable for agriculture
or domestic water supply Ahmadullah and Dongshik 2015
The reduced runoff scenarios exhibited higher level of N- and P-related WPL and further
reduction in volume of river water would certainly aggravate quality of water The proposed
hydro projects in Afghanistan would result in reduced water flow to Peshawar Basin This
would adversely affect downstream ecosystems and communities dependent on it (World
Bank 2010 and Mustafa 2016) Monitoring the Kabul river pollution is an effort for a good
water management in Pakistan Based on the literature review water in the Kabul River was
found to be unsuitable for drinking but fit for the irrigation purpose The reduction in the
inflow of Kabul river development would severely affect Pakistanrsquos existing and future water
usages for crops and may lead to economic deterioration and health issues
Since Kabul River is a shared resource of Pakistan and Afghanistan hence both countries
have the right to use it for their economic up-lift Factors like impacts of climate change
increasing demand for water and concerns for environment would lead to complex disputes
between two countries The issue can be harmoniously resolved through an institutionalized
agreement on sharing the Kabul river water equitably between the two riparian states In
Kabul river water treaty optimal quality and quantity of water must be considered Both the
governments should take measures for the protection and conservation of water for
sustainable economic and ecological activities such as fisheries eco-tourism recreation and
watershed management The deteriorating and depleting water resources of Kabul river
system also suggest that the water resources of Kabul River should be safeguarded to avoid
future conflicts
57
CHAPTER NO 6
CONCLUSIONS AND RECOMMENDATIONS
6 1 Conclusions
The goal of this thesis is analyze the environmental sustainability of blue green and grey
water footprint of Peshawar Basin This is first study of its kind on basin level in Pakistan and
the finding will contribute a lot in future research and policy making It is concluded that blue
and green water scarcity is less than 100 and is low water scarcity It provide a baseline
information for sustainability food security and crops water productivity Agriculture sector
has the highest blue and green water footprint of sugar cane maize and wheat alone
constitute about 94 and 92 of the total agriculture water footprint respectively
The average available blue water resources of Peshawar Basin over the last 30 years is
estimated as 6080 million m3year The population of the basin has increased by 57 during
this period as a result per capita blue water availability has dropped from 1700 m3 to 600 m3
The domestic water footprint of the basin has increased by 55 It is found that water
footprint of agriculture over the last 30 years has dropped by 12 due to agriculture land
being converted into buildup area The domestic and agriculture water footprint led to an
increase in blue water scarcity by 33 On the other hand buildup area has increased by 34
while pasture and agriculture land has declined by 9 and 4 respectively This change in
land use pattern has caused 8 reduction in 2022 million m3 of available green water as a
result the green water scarcity has reached to 99
The grey water footprint in relation to nitrogen and phosphorous over the last 30 years
steadily increased The application of nitrogen fertilizer has increased by 43 livestock
manure by 52 domestic sources by 64 and industrial sources by 60 while phosphorous
application from artificial fertilizers livestock manure domestic and industrial sources has
increased by 20 52 64 and 64 respectively As a result of this increased in nitrogen
and phosphorous load to surface water the grey water footprint has increased by 48 and
41 respectively
It is concluded that Kabul River contribute 576 m3sec and Swat River 411 m3sec to
Peshawar Basin Of this 576 m3sec of Kabul River water 276 m3sec of water comes from
Chitral River (a tributary of Kabul River originate in Pakistan and is called River Kunar in
Afghanistan) The total supply of water from Afghanistan is estimated as 300 m3sec which
is only 30 of total supply to the basin In all reduced runoff scenarios (10-50) the water
58
pollution level of nitrogen was within sustainability limits whereas the values for
phosphorous has exceeded the sustainability limit in each scenario
This finding would be help for policy makers for efficient irrigation management and water
conservation in Peshawar Basin The study further show the deterioration of water quality of
Kabul River and the finding may be helpful for future planning and management of the basin
59
62 Recommendations
There is a dire need for the collaborative efforts of all relevant stakeholder to come forward
for a practical solution of water scarcity in Peshawar Basin The following recommendations
are made based on the finding of this study
The crop water productivity can be increase by introducing efficient irrigation
techniques in Peshawar Basin
Crops with high WF and low economic benefit may be replace low WF and high
economic benefits
To reduce the grey water footprint organic forming may be maximise and an efficient
utilization of artificial fertilizer by optimize the timing and techniques of application
fertilizer
Minimize the water losses from storage and during distribution system via
evaporation efficient irrigation schedule by improving timing and volume of water
There must be an integrated policy of agriculture water energy and trade to ensure
sustainable use of water resources
Government should introduce policy that regulate building of housing societies on
agriculture land to help prevent the conversion of agriculture land in build-up area
The rapid conversion of agriculture fields and pasture land into housing societies is
alarming There must a policy to regulate this practice to minimize the green water
scarcity
Nitrogen and phosphorous fertilizer must be applied in phases to reduce reaching-
runoff to Kabul River water
The study suggest further research to estimate the virtual water export to know how
much of water Peshawar Basin is exporting
Awareness project and programs for general local community may be encourage
regarding efficient use of blue water
60
References
Ababaei B and Ramezani Etedali H (2017) Water footprint assessment of main cereals in
Iran Agricultural Water Management httpsdoiorg101016jagwat201607016
Adeel Z (2004) Focus on new water issues-perspectives at the end of the international year
of freshwater Global Environmental Change 141-4
Afshar and Neshat A (2013) lsquoEvaluation of AquaCrop computer model in the potato under
irrigation management of continuity plan of Jiroft region Kerman Iranrsquo Int J Adv Biol
Biom Res 1669-1678
Ahmad B (2011) Water Management A Solution to Water Scarcity in Pakistan 9(2) 111ndash
125
Ahmad H Yousafzai A M Siraj M Ahmad R Ahmad I Nadeem M S Ahmad W
Akbar N Muhammad K (2015) Pollution Problem in River Kabul Accumulation
Estimates of Heavy Metals in Native Fish Species Biomed Res Int
Ahmadullah R Dongshik K (2015) Assessment of potential dam sites in the Kabul river
basin using GIS Inter J Adv Comp Sci Appl 6(2) 83-89
Akhtar S M Iqbal J (2017) Assessment of Emerging Hydrological Water Quality Issues
and Policy Discussion on Water Sharing of Transboundary Kabul River Water Policy 19
(4) 650ndash672
Akif M Khan A R Sok K Hussain Z (2002) Textile Effluents and Their Contribution
Towards Aquatic Pollution in the Kabul River (Pakistan) JourChem SocPak 24 (2)
106-111
Alexandratos Nikos and Bruinsma Jelle (2012) World agriculture towards 20302050 The
2012 revision Global Perspective Studies Team FAO Agricultural Development
Economics Division wwwfaoorgeconomicesa
Ali M Y (2004) ldquoToxicological Effects of Industrial Effluents Dumped in River Kabul on
MahaseerTor Putitora at Aman Garh Industrial Area Nowshera Peshawar Pakistanrdquo
1ndash316
Ali (1993) Water Quality Assessment of River Swat master thesis Department of
Environmental Planning and Management University of Peshawar Peshawar 13-28
Ali N (2015) Indus Water Treaty between Pakistan and India From Conciliation to
Confrontation Dialogue (1819-6462) 10(2)
Allan J A (1997) ldquoVirtual Waterrdquo A Long Term Solution for Water Short Middle Eastern
Economies London Sch Orient African Stud Univ London No September 24ndash29
61
Archer D R N Forsythe H J Fowler and S M Shah (2010) ldquoSustainability of Water
Resources Management in the Indus Basin under Changing Climatic and Socio Economic
Conditionsrdquo Hydrology and Earth System Sciences 14(8) 1669ndash80
Azizullah A Khattak M Richter P Haumlder D (2011) Water Pollution in Pakistan and Its
Impact on Public Health mdash A Review Environ Int 37 (2) 479ndash497
Bhatti Asif M and Seigo Nasu (2010) ldquoSociety for Social Management Systems (SSMS-
2010) Domestic Water Demand Forecasting and Management Under Changing Socio-
Economic Scenariordquo
Bisht M (2013) Water Sector in Pakistan Policy Politic Management Institute for
Defence Studies and Analysis New Delhi India
Bouwman A F Lee D S Asman W A H Dentener F J Van Der Hoek K W
Olivier JG(1997) Global High-Resolution Emission Inventory for Ammonia Global
Biogeochemical Cycles pp 561ndash587
Briscoe John and Usman Qamar (2005) ldquoINDIArsquoS WATER ECONOMY Bracing for a
Turbulent Future THE WORLD BANK Agriculture and Rural Development Sector South
Asia Regionrdquo World Bank
httpdocumentsworldbankorgcurateden989891468059352743pdf443750PUB0PK0W1
Box0327398B01PUBLIC1pdf
Bulsink F Hoekstra A Y and Booij M J (2009) The water footprint of Indonesian
provinces related to the consumption of crop products Value of Water Research Report
Series No 37 119ndash128 httpsdoiorg105194hess-14-119-2010
Butt JA and Mirza MR (1981) Fishes of the vale of Peshawar North West Frontier
Province Pakistan Biologia (Pakistan) 27 145-163
Butt JA 1(986) Fish and fisheries of North West Frontier Province Pakistan Biologia
(Pakistan) 32 21-34
Cazcarro I Hoekstra AY Saacutenchez Choacuteliz J(2014) The water Footprint of Tourism in
Spain Tour Manag 40 90ndash101 httpdxdoiorg101016jtourman2013 05010
Chapagain AK and Hoekstra AY (2003) Virtual water trade A quantification of virtual
water flows between nations in relation to international trade of livestock and livestock
products
Chapagain A K and Hoekstra A Y (2011) The blue green and grey water footprint of
rice from production and consumption perspectives Ecological Economics 70(4) 749ndash
758 httpsdoiorg101016jecolecon201011012
62
Chen H S (2015) Using Water Footprints for Examining the Sustainable Development of
Science Parks Sustain 7 (5) 5521ndash5541
Chenoweth J Hadjikakou M Zoumides C (2014) Quantifying the human impact on water
resources a critical review of the water footprint concept Hydrology and Earth System
Sciences Jun 24 18(6)2325-42
Chouchane H Hoekstra A Y Krol M S and Mekonnen M M (2015) The water
footprint of Tunisia from an economic perspective Ecological Indicators 52 311ndash319
httpsdoiorg101016jecolind201412015
Chukalla AD Krol MS Hoekstra AY (2015) Green and blue water footprint reduction in
irrigated agriculture effect of irrigation techniques irrigation strategies and mulching
Hydrology and earth system sciences 19(12)4877
Chukalla A D Krol M S and Hoekstra A Y (2015) Green and blue water footprint
reduction in irrigated agriculture Effect of irrigation techniques irrigation strategies and
mulching Hydrology and Earth System Sciences 19(12) 4877ndash4891
httpsdoiorg105194hess-19-4877-2015
Correll D L (1998) The Role of Phosphorus in the Eutrophication of Receiving Waters A
Review J Environ Qual 27261-266doi102134jeq199800472425002700020004x
Cucek L Klemes JJ Varbanov PS Kravanja Z (2015) Significance of environmental
footprints for evaluating sustainability and security of development Clean Technol
Environ Policy 17 (8) 2125e2141
Dessu S B Melesse A M Bhat M G and McClain M E (2014) Assessment of water
resources availability and demand in the Mara River Basin Catena 115 104-114
Dos Santos Cristiane Engel et al (2013) ldquoVasculite C-ANCA Relacionada Em Paciente
Com Retocolite Ulcerativa Relato de Casordquo Revista Brasileira de Reumatologia 53(5)
441ndash43
Duan P Qin L Wang Y and He H (2016) Spatial pattern characteristics of water
footprint for maize production in Northeast China Journal of the Science of Food and
Agriculture 96(2) 561ndash568 httpsdoiorg101002jsfa7124
Dudgeon D Arthington A H Gessner M O Kawabata Z I Knowler D J Levacute eque
C Naiman R J Prieur-Richard A ˆ H Soto D and Stiassny M L J(2006)
Freshwater biodiversity importance threats status and conservation challenges Biol
Rev 81 163ndash182
63
Dumont A Salmoral G and Llamas M R (2013) The water footprint of a river basin
with a special focus on groundwater The case of Guadalquivir basin (Spain) Water
Resources and Industry 1 60-76
EPA-KP (2014) Provincial Assemble Khyber Pakhtunkhwa Government Press Khyber
Pakhtunkhwa
Ercin A E and Hoekstra A Y (2014) Water footprint scenarios for 2050 A global
analysis Environment international 64 71-82
Ercin E Wiedmann T Giljum S Galli A Knoblauch D and Ewing B (2011)
Integrating Ecological Carbon and Water footprint into a ldquoFootprint Familyrdquo of
indicators Definition and role in tracking human pressure on the planet Ecological
Indicators 16 100ndash112 httpsdoiorg101016jecolind201106017
Eva M M Deakin J Archbold M Gill L Daly D and Bruen M (2017) Sources of
nitrogen and phosphorus emissions to Irish rivers and coastal waters Estimates from a
nutrient load apportionment framework Science of The Total Environment 601ndash602
326-339 httpsdoiorg101016jscitotenv201705186
Falconer R A Norton M R Fernando H J S Klaiaelig Z and McCulley J L (2012)
Global Water Security Engineering the Future National Security and Human Health
Implications of Climate Change in NATO Science for Peace and Security Series C
Environmental Security Springer Netherlands 261ndash269
Falkenmark M (2003) freshwater as shared between society and ecosystems from divided
approaches to integrated challenges Philos T R Soc Lon B 358 2037ndash2049
Falkenmark M and Rockstrom J (2006) The new blue and green water paradigm
Breaking new ground for water resources planning and management J Water Res Pl-
ASCE 132 129ndash132 doi101061(ASCE)0733-9496(2006)1323(129)
Fang K Heijungs R Duan Z De Snoo G R (2015) The Environmental Sustainability
of Nations Benchmarking the Carbon Water and Land Footprints against Allocated
Planetary Boundaries Sustain 7 (8) 11285ndash11305
FAO (2003) Livestock Sector Brief Pakistan Livestock Information Sector Analysis and
Policy Branch
Favre R and Kamal G M (2004) Watershed Atlas of Afghanistan Ministry of Irrigation
Water Resource and Environment Kabul Afghanistan
64
Franke N A Boyacioglu H and Hoekstra AY (2013) Grey Water Footprint Accounting
Tier 1 Supporting Guidelines UNESCO-IHE Institute of Water Education Delft
Netherlands
Franke N Mathews R (2011) Grey Water Footprint Indicator of Water Pollution in the
Production of Organic vs Conventional Cotton in India Water Footpr Netw
Gardner-Outlaw Tom and Robert Engelman (1997) ldquoSustaining Water Easing Scarcityrdquo
Revised Data for the Population Action International Report Sustaining Water Population
and the Future of Renewable Water Supplies 20
Government of Afghanistan (2017) Afghanistan National Peace and Development
Framework (ANPDF)
Government of Khyber Pakhtunkhwa (2017) Development Statistics of Khyber
Pakhtunkhwa Pakistan
Government of Pakistan (1986-2015) Agriculture Census Organization Census of Livestock
NWFP Report Lahore
Government of Pakistan (1986-2015) National Fertalizer Development Centrre National
Fertalizer Annual Report Islamabad
Government of Pakistan (2014) Ministry of Science and Technology Pakistan Council for
Science and Technology Pakistanrsquos Water Technology Foresight
Government of Pakistan (2018) Bureau of statistic wwwpbsgovpk
Government of Pakistan (1986-2015) Water and Power Developent Authority (WAPDA)
Tarbella Pakistan
Government of Pakistan (2014) Ministry of Science and Technology Pakistan Council for
Science and Technology Pakistanrsquos Water Technology Foresight
Government of Pakistan Bureau of Statistic (2017) (wwwpbsgovpk) (accessed on
09112017)
Government of Pakistan Bureau of statistics 2017 httpwwwpbsgovpk (accessed on
09112017)
Government of Pakistan (2016) Ministry of Finance Pakistan economic survey
Government of Pakistan (2014) Pakistanrsquos water technology foresight Pakistan council for
science and technology Ministry of Science and Technology
Hassan M (2016) Development Advocate Pakistan- water security in pakistan issues and
challenges Development Advocate Pakistan 3(4) 1ndash33
65
Helen P J Neal C and Paul J A (2006) Sewage-effluent phosphorus A greater risk to
river eutrophication than agricultural phosphorus Science of The Total Environment 360
(1ndash3) 246-253 httpsdoiorg101016jscitotenv200508038
Hoekstra AY and Hung PQ (2003) Virtual water trade A quantification of virtual water
flows between nations in relation to international crop trade
Hoekstra A Y and Chapagain A K (2008) Globalization of Water Sharing the Planetrsquos
Freshwater Resources Blackwell Publishing Oxford
Hoekstra A Y and Mekonnen M M (2010) The Green Blue and Grey Water Footprint of
Crops and Derived Crop Products Main Report Value of Water Research Report Series
No 47 1(16) 80 httpsdoiorg105194hess-14-1259-2010
Hoekstra A Y Chapagain A K Aldaya M M and Mekonnen M M (2011) The Water
Footprint Assessment Manual Febrero 2011 httpsdoiorg978-1-84971-279-8
Hoekstra A Y Mekonnen M M Chapagain A K Mathews R E and Richter B D
(2012) Global monthly water scarcity blue water footprints versus blue water
availability PLoS One 7(2) e32688
Hoekstra AY (2003) lsquoVirtual water trade Proceedings of the International Expert Meeting
on Virtual Water Tradersquo Value of Water Research Report Series No12 UNESCO-IHE
Delft 2003 The Netherlands available at httpwwwwaterfootprintorg
ReportsReport12pdf (Last accessed 22 August 2016)
Hoekstra AY Chapagain AK (2007) Water footprints of nations water use by people as
a function of their consumption pattern Water Resour Manag 21 (1) 35e48
Hoekstra AY Hung PQ (2002) Virtual water trade a quantification of virtual water
flows between nations in relation to international crop trade Value water Res Rep Ser
166
Hoekstra Arjen Y (2008) Water neutral Reducing and offsetting the impacts of water
footprints
Hoekstra Arjen Y (2012) ldquoGlobal Monthly Water Scarcity Blue Water Footprints versus
Blue Water Availabilityrdquo PLoS ONE 7(2)
IIASA ISRIC ISSCAS FAO JRC (2018) Harmonized World Soil Database (version
12) FAO Rome Italy and IIASA Laxenburg Austria
(httpwebarchiveiiasaacatResearchLUCExternal-World-soil-database)
Iqbal Abdul Rauf (2010) ldquoWater Shortage in Pakistan ndash a Crisis around the Cornerrdquo ISSRA
Papers 1ndash13
66
Iqbal U Qasim H Khan A K Rashid R Nasreen S Mahmood Q Khan J (2009)
Surface and Ground Water Quality Risk Assessment in District Attock Pakistan World
Appl Sci J 7 (8) 1029ndash1036
Iqrar M (1994) Survey of Khazana Sugar Mill Peshawar A Case Study of Nasir Killy
Village Program Master thesis Department of environmental planning and management
University of Peshawar Pakistan
IUCN Pakistan (2010) ldquoTowards Kabul Water Treaty Managing Shared Water Resources ndash
Policy Issues and Optionsrdquo
IUCN (1994) Pollution and the Kabul River An Analysis and Action Planning Department
of Environmental Planning and Mangement University of Peshawar
Jan A N Khan Q Khan A Raziq S Muhammad A (2014) Monitoring of Water
Quality Parameters to Know the Suitability of Water for Fish Fauna at River Sardaryab
Khyber Pakhtunkhwa Pakistan Correspondence 1 (3) 31ndash37
Javed B (1989) ldquoStudy of Physical Chemistry and Biological Parameter of Kabul River at
Nowsherardquo Department of Zoology University of Peshawar
Jehangir W A Masih I and Ahmed S (2007) Sustaining Crop Water Productivity in
Rice-Wheat Systems of South Asia A Case Study from the
Jose A Elena C and Javier T (2010) Water quality and nonpoint pollution in Re-
thinking Water and Food Security CRC Press 251ndash 256
Kamin K Arif M Khattak M A and Shah R A (1985) Chemical Characteristic of
Drinking Water of NWFP Part-1 Pakistan Council Scientific and Industrial Reseach
(PCSIR) Peshawar Pakistan
Karn S K Harada H (2001) Surface Water Pollution in Three Urban Territories of Nepal
India and Bangladesh Environ Manage 28 (4) 483ndash496
Khalid K (1989) ldquoPrimary productivity Oxygen and Biological Oxygen Demand in Kabul-
Indus drainage System at Michni Nowshera and Manori NWFP Pakistanrdquo Department of
Zoology University of Peshawar pp-20-34
Khan B Khan H Muhammad S Khan T (2012 ) Heavy metals concentration trends in three
fish species from Shah Alam River (Khyber Pakhtunkhwa Province Pakistan) Journal of
Natural and Environmental Sciences 23(1)1-8
Khan A R Kashif M and Riaz M (1999) Impact of Industrial Discharge on the Quality
of Kabul River Water at Amangarh Nowshera Pakistan Journal of Chemical Society of
Pakistan 21(2) 97-105
67
Khan B and Zahidullah (1991) ldquoAquatic Pollution Due To Industries in River Kabul at
Amangarh Nowshera NWFP (Pakistan)rdquo MSc thesis DEPM Peshawar University
Khan B Khan H Muhammad S Khan T (2012) Heavy Metals Concentration Trends In
Three Fish Species From Shah Alam River (Khyber Pakhtunkhwa Province Pakistan) J
Nat Environ Sci 3 (1) 1ndash8
Khan S A and Khan M (1997) Water Quality Characteristics of the Kabul River in
Pakistan Under High Flow Conditions Jourrnal of Chemical society of Pakistan 19(3)
201-209
Khan S et al (2013) lsquoDrinking water quality and human health risk in Charsadda district
Pakistanrsquo Journal of Cleaner Production 60(April 2015) pp 93ndash101httpsdoi
101016jjclepro201202016
Khan S Shahnaz M Jehan N Rehman S Shah M T Din I (2013) Drinking Water
Quality and Human Health Risk in Charsadda District Pakistan J Clean Prod 60 93ndash
101
Khan T Muhammad S and Khan B (2011) Investigating the Levels of Selected Heavy
Metals in Surface Water of Shah Alam River (A Tributary of River Kabul Khyber
Pakhtunkhwa) 44 (2) 71ndash79
Khana AR Akif M Wadud S and Khan K (1999) Pollution Studies of Kabul River and
Its Tributaries for the Assessment of Organic Strength and Fecal Coliform Journal of
Chemical Society of Pakistan 21(1) 41-47
Khanb A R Kashif M and Riaz M (1999) Impact of Industrial Discharge on the Quality
of Kabul River Water at Amangarh Nowshera Pakistan Journal of Chemical Society of
Pakistan 21(2) 97-105
Khattak RA and A Rehman (1992) ldquoEffect of disposal of industrial wastes on the quality
of Kabul River water and soil at Pirsanakrdquo A final project report NWFP Agriculture
University Tipan Project Peshawar Pp 15-45
Khoso S Wagan F H Tunio A H and Ansari A A (2015) An overview on emerging
water scarcity in pakistan its causes impacts and remedial measures Journal of Applied
Engineering Science 13(1) 35ndash44 httpsdoiorg105937jaes13-6445
Khyber Pakhtunkhwa development statistics (2014) Bureau of statistics planning and
development department Government of Khyber Pakhtunkhwa
Klemes JJ Varbanov PS Lam HL (2009) Water footprint water recycling and food
industry supply chain In Waldron K (2009 Waste Management and Co-product
68
Recovery in Food Processing vol 2 Woodhead Publishing Limited Cambridge UK
ISBN 978 1 84569 391 6
Launiainen S Futter M N Ellison D Clarke N Fineacuter L Houmlgbom LRing E (2014)
Is the water footprint an appropriate tool for forestry and forest products The
fennoscandian case Ambio 43(2) 244ndash256 httpsdoiorg101007s13280-013-0380
Lee Y-J (2015) Land carbon and water footprints in Taiwan Environ Impact Assess
Rev 54 1ndash8 httpdxdoiorg101016jeiar201504004
Liu C Kroeze C Hoekstra A Y Gerbens-Leenes W (2012) Past and Future Trends in
Grey Water Footprints of Anthropogenic Nitrogen and Phosphorus Inputs to Major World
Rivers Ecol Indic 18 42ndash49
Lovarelli D Bacenetti J and Fiala M (2016) Water Footprint of crop productions A
review Science of the Total Environment 548ndash549 236ndash251
httpsdoiorg101016jscitotenv201601022
M Amjad S (1996) ldquoQuantitative and Qualitative Analysis of the Suspended Sediment from
River of North West Frontier Province (NWFP)rdquo Unpublished thesis National Center of
Excellence in Geology University of Peshawar Pp 35-56
Ma D Xian C Zhang J Zhang R Ouyang Z (2015) The Evaluation of Water
Footprints and Sustainable Water Utilization in Beijing Sustain 7 (10) 13206ndash13221
Malley ZJ Taeb M Matsumoto T Takeya H (2009) Environmental sustainability and water
availability Analyses of the scarcity and improvement opportunities in the Usangu plain
Tanzania Physics and Chemistry of the Earth Parts ABC 34(1)3-13
Manzardo A Loss A Fialkiewicz W Rauch W Scipioni A (2016) Methodological
Proposal to Assess the Water Footprint Accounting of Direct Water Use at an Urban
Level A Case Study of the Municipality of Vicenza Ecol Indic 69 165ndash175
Mekonnen MM Hoekstra AY (2012) lsquoA global assessment of the water footprint of farm
animal productsrsquo Ecosystems 15(3)401-15
Mekonnen M M and Hoekstra A Y (2010) A global and high-resolution assessment of
the green blue and grey water footprint of wheat Hydrology and Earth System Sciences
14(7) 1259ndash1276 httpsdoiorg105194hess-14-1259-2010
Mekonnen M M Hoekstra A Y (2015) Global Gray Water Footprint and Water
Pollution Levels Related to Anthropogenic Nitrogen Loads to Fresh Water Environ Sci
Technol 49 (21) 12860ndash12868
69
Mekonnen M M Hoekstra A Y (2010) A Global and High-Resolution Assessment of the
Green Blue and Grey Water Footprint of Wheat Hydrol Earth Syst Sci 14 (7) 1259ndash
1276
Mekonnen M M Hoekstra A Y (2018) Global Anthropogenic Phosphorus Loads to
Freshwater and Associated Grey Water Footprints and Water Pollution Levels A High-
Resolution Global Study Water Resour Res 54 (1) 345ndash358
Mekonnen MM Hoekstra AY (2011) National Water Footprint Accounts the Green
Blue and Grey Water Footprint of Production and Consumption Value of Water Research
Report Series No 50 UNESCO-IHE Delft The Netherlands
wwwwaterfootprintorgReportsReport50-NationalWaterFootprints-Vol1pdf
Miglietta P P Toma P Fanizzi F P De Donno A Coluccia B Migoni D Bagordo
F Serio F A (2017) Grey Water Footprint Assessment of Groundwater Chemical
Pollution Case Study in Salento (Southern Italy) Sustain 9 (5)
Multsch S Pahlow M Ellensohn J Michalik T Frede H G and Breuer L (2016) A
hotspot analysis of water footprints and groundwater decline in the High Plains aquifer
region USA Regional Environmental Change 16(8) 2419-2428
Mustafa K (2016) The News International 5th June 2016
httpswwwthenewscompkprint125490-India-out-to-damage-Pakistans-water-interests-
on-Kabul-river (accessed on 10th September 2017)
Nafees M and Ghulam K (1992) Environmental Impact Assessment of Amangarh
Industrial Estate Nowshera Mphil Thesis Department of Environmental Planning and
Management University of Peshawar Pakistan
Nafees M Ahmed T and Arshad M (2011) lsquoA Review of Kabul River Uses and Its
Impacts on Fish and Fishermanrsquo Journal of Humanities and Social sciences XIX(2) pp
73ndash84
Nafees M Ahmad F Butt M N Khurshed M (2018) Effects of Water Shortage in
Kabul River Network on the Plain Areas of Khyber Pakhtunkhwa Pakistan Environ
Monit Assess 190 (6)
Nasreen A (2006) Monitoring of surface water groundwater air and soil in Peshawar basin
against time the 3rd dimension 2006 (doctoral dissertation University of Peshawar
Peshawar)
Nawab B (1992) Evaluation of Sewage Water Pollution in Peshawar City Master Thesis
Department of Environmental Planning and Management University of Peshawar
70
Pakistan
Noor A and Khan F (1983) Dissolved Oxygen and Biochemical Oxygen Demand of Kabul
River and Industrial Wastewaters of Nowshera Industrial Area Physical chemistry (3) 87-
95
Noor A and Saleem M (1982) ldquoDetermination of Chemical Pollutants in River Drinking
and Industrial Waste Water of NWFPrdquo National Center of Excellence in Physical
Chemistry University of Peshawar
Noor A Saleem M and Fazalullah (1982) Water Pollution Studies of the Urban and
Industrial Areas of NWFP Pakistan Physical Chemistry (2) 25-34
Nosheen N Ullah M Khan K A and Rehman A (2011) Impacts of Industrial Effluent
on River Kabul Hydro Nepal Journal of Water Energy and Environment (8) 44-47
httpdxdoiorg103126hnv8i04924
Nouri H Stokvis B Galindo A Blatchford M and Hoekstra A Y (2019) Water
scarcity alleviation through water footprint reduction in agriculture The effect of soil
mulching and drip irrigation Science of the Total Environment 653 241ndash252
httpsdoiorg101016jscitotenv201810311
Oki T and Kanae S (2006) Global hydrological cycles and world water resources Science
313 1068-1072 httpsdoi101126science1128845
Pakistan Bureau of Statistic Pakistan agricultural machinery census (2016) Khyber
Pakhtunkhwa
Pedro-Monzoniacutes M Solera A Ferrer J Andreu J and Estrela T (2016) Water
accounting for stressed river basins based on water resources management models
Science of the Total Environment 565 181ndash190
httpsdoiorg101016jscitotenv201604161
Pellicer-Martiacutenez F and Martiacutenez-Paz J M (2014) Assessment of inter-basin groundwater
flows between catchments using a semi-distributed water balance model Journal of
Hydrology 519 1848-1858
Pellicer-Martiacutenez F and Martiacutenez-Paz J M (2016) Grey water footprint assessment at the
river basin level Accounting method and case study in the Segura River Basin
Spain Ecological Indicators 60 1173-1183
Pellicer-Martiacutenez F and Martiacutenez-Paz J M (2016) The Water Footprint as an indicator of
environmental sustainability in water use at the river basin level Science of the Total
Environment 571 561ndash574 httpsdoiorg101016jscitotenv201607022
71
Sepah M P (1993) ldquoThe flood plain vegetation of Kabul River and its tributaries in Duaba-
Daudzai area Near Peshawar Pakistanrdquo Area study center (Central Asia) UOP
Pisinaras V Petalas C Gikas G D Gemitzi A and Tsihrintzis V A (2010)
Hydrological and water quality modeling in a medium-sized basin using the Soil and
Water Assessment Tool (SWAT) Desalination 250(1) 274-286
Qureshi A S Mc Cornick P G Sarwar A and Sharma B R (2010) Challenges and
prospects of sustainable groundwater management in the Indus Basin Pakistan Water
resources management 24(8) 1551-1569
Qureshi Z (2014) Water and sanitation in Khyber Pakhtunkhwa South Asian Cities
Confrence 2014 Karachi January 10th -12th Pakistan Urban Forum Karachi
Raes D (2011) The ETo Calculator Reference Manual Version 32 Food and Agriculture
Organization of the United Nations Rome Italy
Raes D Steduto P C Hsiao T and Fereres E (2011) Reference Manual AquaCrop
plug-in program Food and Agriculture Organization of the United Nations Land and
Water Division Rome Italy
Raes D Steduto P Hsiao T C and Fereres E (2009) AquaCrop-The FAO Crop Model
to Simulate Yield Response to Water II Main Algorithms and Software Description
Agron J 101 438ndash447
Raes D Steduto P Hsiao T C and Fereres E (2017) Chapter 3 ndash AquaCrop Version
61 Food and Agriculture Organization of the United Nations Land and Water Division
Rome Italy
Rauf M Ullah S Haseeb A Shah H Khan M (2015) Physiochemical Investigation of
River Kabul at Michini Khyber Pakhtunkhwa Pakistan 7 (3) 280ndash291
Ridoutt BG Pfister S (2010) A revised approach to water footprinting to make
transparent the impacts of consumption and production on global freshwater scarcity
Glob Environ Chang 20 (1) 113ndash120
httpdxdoiorg101016jgloenvcha200908003
Sadaf M and Zaman A (2013) ldquoPotential of Water Management Through Pakistani Water
International Water Technology Journal 3(3)
Salman SM (2008) The Baglihar difference and its resolution process-a triumph for the
Indus Waters Treaty Water Policy 10(2)105-17
Saxton K Rawls W J Romberger J and Papendick R1 (986) Estimating generalized
soil-water characteristics from texture Soil Sci Soc Am J 50 1031ndash1036
72
Schmidt Ralph et al (2001) ldquoEsources 2000 ndash2001rdquo World
Schwarzenbach R P Escher BI Fenner K Hofstetter TB Johnson CA Von Gunten U
Wehrli B ( 2006) The challenge of micro pollutants in aquatic systems Science
313(5790)1072-7
Schyns J F A Y Hoekstra and M J Booij (2015) ldquoReview and Classification of
Indicators of Green Water Availability and Scarcityrdquo Hydrology and Earth System
Sciences Discussions 12(6) 5519ndash64
Schyns J F A Y Hoekstra and M J Booij (2019) limits to the worldrsquos green water
resources for food feed fibre timber and bio-energy PhD Thesis The University of
Twente The Netherlands
Serio F Miglietta PP Lamastra L Ficocelli S Intini F De Leo F and De Donno A
(2018) Groundwater nitrate contamination and agriculture land use A grey water
footprint perspective in South Apulia Region (Italy) Sciences of the Total Environment
645 1425-1431
Shah M T and Tariq S (2001) Environmental Geochemistry of the Soil of Peshawar
Basin NWFP Pakistan Journal of Chemical Society of Pakistan 29 (5) 438-445
ShahinaT (2001) ldquoEnvironmental Geochemistry of Surface and Sub-Surface Water and Soil in
Peshawar Basin NWFP Pakistanrdquo National Center of Excellence in Geology University of
Peshawar NWFP Pakistan pp 80-128 173-176
Shaw EM (1994) Hydrology in Practice 3rd Edition Chapman and Hall London
Sheldrick W Keith Syers J Lingard J (2003) Contribution of Livestock Excreta to
Nutrient Balances Nutr Cycl Agroecosystems 66 (2) 119ndash131
Siebert S Kummu M Porkka M Doumlll P Ramankutty N and Scanlon B R (2015) A
global data set of the extent of irrigated land from 1900 to 2005 Hydrol Earth Syst Sci
19 1521-1545 httpsdoiorg105194hess-19-1521
Siegmann Karin Astrid and Shafqat Shezad (2006) ldquoPakistanrsquos Water Challenges A
Human Development Perspectiverdquo 1ndash38 httpssdpiorgpublicationsfilesA105pdf
Sohail A (1989) Bottom Fauna and Organic Matter in Bottom Mud of Kabul-Indus Drainge
System Master Thesis Department of Zoology University of Peshawar Pakistan
Steduto P Hsiao TC Fereres E (2007) On the conservative behavior of biomass water
productivity Irrigation Science 2007 Mar 1 25(3)189-207
Steduto P Hsiao TC Fereres E (2007) On the conservative behavior of biomass water
productivity Irrigation Science 25(3)189-207
73
Steduto P Hsiao TC Raes D Fereres E (2009) AquaCropmdashThe FAO crop model to
simulate yield response to water I Concepts and underlying principles Agronomy
Journal 101(3)426-37
Steduto P Hsiao T C and Fereres E (2007) On the conservative behavior of biomass
water productivity Irrig Sci 25 189ndash207
Steduto P Hsiao T C Raes D and Fereres E (2009) Aquacrop-the FAO crop model to
simulate yield response to water I concepts and underlying principles Agronomy
Journal 101(3) 426ndash437 httpsdoiorg102134agronj20080139s
Syed Sajid Ali Khurram Ashfaq Baloch and Saher Masood (2017) ldquoWater Sustainability in
Pakistan Key Issues and Challengesrdquo State Bank of Pakistanrsquos Annual Report 2016-17
93ndash103 httpwwwsbporgpkreportsannualarFY17Chapter-07pdf
United Nations (2012) Secretary General Ban ki-moon unwise use of water will result in
persisting hunger drought political instability Secretary-General warns in observance
message 2012 available at httpwwwunorgNewsPressdocs2012sgsm14163 dochtm
(last accessed 21 August) 2016
United Nations (2014) water and energy world water development report
Van Drecht G Bouwman A F Harrison J Knoop J M (2009) Global Nitrogen and
Phosphate in Urban Wastewater for the Period 1970 to 2050 Global Biogeochem Cycles
23 (3) 1ndash19
Van Oel P R and Hoekstra A Y (2012) Towards Quantification of the Water Footprint of
Paper A First Estimate of its Consumptive Component Water Resources Management
26(3) 733ndash749 httpsdoiorg101007s11269-011-9942-7
Vorosmarty CJ McIntyre PB Gessner MO Dudgeon D Prusevich A Green P Glidden S
Bunn SE Sullivan CA Liermann CR Davies PM (2010) Global threats to human water
security and river biodiversity Nature 467(7315)555-61
Wahid A and Muhammad G (1992) ldquoImpact of industrial effluents on Wheat and aquatic
fauna (fishes) in River Kabul near Amangarhrdquo MSc thesis DEPM Peshawar University
World Bank (2010) Scoping Strategic Options for Development of the Kabul River Basin
Sustainable Development Department South Asia Region
httpsopenknowledgeworldbankorghandle1098618422
World Bank (2011) World Bank Development Indicators 2011
httpsiteresourcesworldbankorgDATASTATISTICSResourceswdi_ebookpdf
74
Yan Y Jia J Zhou K Wu G (2013) Study of Regional Water Footprint of Industrial
Sectors The Case of Chaoyang City Liaoning Province China Int J Sustain Dev
World Ecol 20 (6) 542ndash548
Yang H Reichert P Abbaspour KC Zehnder AJA (2003) water resources threshold and its
implications for food security Environmental science and technology 37(14)3048-54
Yousafzai A M Khan A R Shakoori A R (2010) Pollution of Large Subtropical
Rivers-River Kabul Khyber-Pakhtun Khwa Province Pakistan Physico-Chemical
Indicators Pak J Zool 42 (6) 795ndash808
Yousafzai A M Khan A R Shakoori A R (2008) An Assessment of Chemical
Pollution in River Kabul and Its Possible Impacts on Fisheries Pak J Zool 40 (3) 199ndash
210
Yousafzai A M Shakoori A R (2007) Heavy Metals Bioaccumulation in the Muscle of
Mahaseer Tor Putitora as an Evidenceof the the Presence of Heavy Metals Pollution in
River Kabul Pakistan Pakistan J Zool 39 (1) 1ndash8
Yousif O K Babiker S A (1989) The Desert Camel as a Meat Animal Meat Sci 26 (4)
245ndash254
Zakir SN Ali L and Khattak SA (2013) Variation in major element oxide with time in the
soils of Peshawar Basin their comparison with the normal agricultural soil Journal of
Himalayan Earth Sciences 46(2)35-48
Zang C F J Liu M Van Der Velde and F Kraxner (2012) ldquoAssessment of Spatial and
Temporal Patterns of Green and Blue Water Flows under Natural Conditions in Inland
River Basins in Northwest Chinardquo Hydrology and Earth System Sciences 16(8) 2859ndash70
Zeng Z Liu J Koeneman P H Zarate E Hoekstra A Y (2012) Assessing Water
Footprint at River Basin Level A Case Study for the Heihe River Basin in Northwest
China Hydrol Earth Syst Sci 16 (8) 2771ndash2781
Zhaidllah Khan H Waseem A Mahmood Q Farooq U (2013) Water Quality
Assessment of the River Kabul at Peshawar Pakistan Industrial and Urban Wastewater
Impacts J Water Chem Technol 35 (4) 170ndash176
Zhang GP Hoekstra AY Mathews RE (2013) Water Footprint Assessment (WFA) for
better water governance and sustainable development Water Resour Ind 1-2 1ndash6
httpdxdoiorg101016jwri201306004
75
APPENDIX-A
Monthly mean maximum temperature (degC) at Peshawar weather station (1986-2015)
Year Jan Feb Mar Apr May Jun Jul Aug Sep Oct Nov Dec
1986 197 198 223 302 361 405 375 359 355 319 25 19
1987 214 21 219 309 329 396 405 389 376 308 275 225
1988 201 218 225 329 394 399 372 358 358 322 266 204
1989 178 195 231 302 374 409 388 353 358 323 259 199
1990 196 189 233 293 392 408 389 359 358 302 265 188
1991 175 187 231 276 335 40 397 365 341 316 257 203
1992 177 196 223 278 335 403 375 362 346 31 258 214
1993 179 234 218 314 384 401 375 387 351 319 27 233
1994 196 185 261 289 364 419 356 354 342 30 268 193
1995 193 209 234 269 372 427 378 356 351 322 271 203
1996 189 217 246 321 363 398 389 364 367 308 265 22
1997 192 219 242 277 338 386 383 366 358 277 236 182
1998 178 19 231 318 369 405 38 369 359 327 278 213
1999 168 207 252 343 399 423 392 37 367 33 261 237
2000 184 194 241 341 404 297 372 361 333 310 247 213
2001 188 225 270 310 396 393 362 361 345 314 246 210
2002 187 186 257 320 388 395 398 345 327 303 247 196
2003 188 187 239 306 349 410 365 353 340 302 244 212
2004 175 219 299 329 375 385 381 359 350 289 263 209
2005 164 163 240 308 329 404 375 377 355 310 248 206
2006 177 249 251 322 400 392 368 348 349 313 227 178
2007 200 185 233 342 363 393 365 367 345 315 241 198
2008 156 212 295 283 385 387 369 350 340 329 259 218
2009 190 206 255 291 372 391 387 374 359 325 248 213
2010 209 197 298 338 372 381 372 337 347 320 266 197
2011 184 186 271 307 392 403 364 354 342 306 259 213
2012 168 178 257 301 363 408 397 367 325 297 246 207
2013 193 187 264 304 376 390 371 352 351 312 243 205
2014 207 201 226 300 348 412 376 370 355 299 255 208
2015 195 213 238 304 354 385 359 348 343 302 235 200
76
Monthly mean minimum temperature (degC) at Peshawar weather station (1986-2015)
Year Jan Feb Mar Apr May Jun Jul Aug Sep Oct Nov Dec
1986 29 60 99 152 207 252 262 254 217 168 105 56
1987 42 74 118 162 197 234 258 271 242 161 92 49
1988 63 77 111 178 227 259 272 252 232 156 105 64
1989 38 55 115 143 205 258 257 248 220 157 99 65
1990 60 76 106 158 238 263 270 258 245 152 99 50
1991 34 62 105 148 196 243 266 260 232 145 88 67
1992 53 59 106 153 192 249 259 259 220 158 94 69
1993 30 83 96 164 220 246 256 260 229 149 98 50
1994 49 58 121 148 210 255 265 260 205 140 93 51
1995 26 60 96 143 206 252 267 251 214 161 85 39
1996 35 82 127 167 205 260 265 255 237 151 77 25
1997 27 51 110 156 187 244 276 256 239 165 97 55
1998 38 65 105 176 218 242 268 259 234 173 93 41
1999 64 86 116 172 223 258 271 260 244 169 104 46
2000 45 57 113 189 260 270 270 264 233 179 110 65
2001 39 82 129 181 249 274 266 268 229 181 107 74
2002 44 74 135 195 251 265 276 262 222 181 119 71
2003 52 80 123 179 213 269 264 257 242 164 96 60
2004 61 76 152 195 235 257 269 257 234 156 101 71
2005 42 70 133 158 193 247 264 257 233 158 89 26
2006 48 110 129 165 235 243 269 260 226 184 124 62
2007 41 89 120 189 221 260 267 268 234 149 102 58
2008 36 64 143 170 220 267 264 252 220 182 99 68
2009 76 83 125 162 206 224 259 269 234 156 92 53
2010 40 82 149 189 219 236 264 262 228 184 94 26
2011 30 82 126 162 229 263 257 254 231 167 116 28
2012 26 46 104 168 200 242 266 259 222 156 92 52
2013 26 74 122 162 210 249 261 255 234 177 84 50
2014 29 61 102 155 201 246 264 259 237 181 90 38
2015 43 90 115 175 217 247 269 257 211 167 102 46
77
Monthly mean rainfall (mm) at Peshawar weather station (1986-2015)
Year Jan Feb Mar Apr May Jun Jul Aug Sep Oct Nov Dec
1985 289 56 243 299 191 00 250 956 50 20 105 947
1986 190 709 737 327 148 160 235 415 247 00 641 350
1987 00 705 1636 85 334 196 49 00 57 333 00 30
1988 404 100 1629 137 40 100 164 654 55 80 00 306
1989 371 110 455 193 93 10 509 184 162 90 30 316
1990 497 678 542 262 170 24 94 745 450 522 85 469
1991 97 543 1414 585 714 10 130 200 50 20 30 50
1992 848 618 1142 730 594 20 40 1029 267 180 -10 330
1993 357 145 1785 344 123 554 584 -10 560 110 102 00
1994 170 775 600 800 255 140 1623 375 551 557 10 567
1995 00 490 1268 1304 253 10 925 990 650 130 130 30
1996 290 740 758 380 145 120 178 1100 510 2030 420 -10
1997 160 270 235 1433 290 380 455 130 120 938 40 285
1998 446 1440 670 690 315 255 970 650 215 75 -10 00
1999 1503 280 735 105 65 480 245 365 150 10 240 00
2000 370 285 410 50 100 125 110 160 468 90 -10 220
2001 -10 16 375 375 190 365 500 390 180 00 240 -10
2002 20 760 730 210 80 530 -10 870 200 20 80 380
2003 330 1315 660 1290 230 100 1560 1140 1110 700 420 190
2004 1090 930 00 600 00 00 70 570 350 246 156 344
2005 1310 1122 1392 298 370 00 310 116 713 40 123 00
2006 553 175 274 153 50 248 566 80 58 150 210 600
2007 00 1591 810 146 218 541 508 182 132 00 70 00
2008 635 89 106 1071 27 96 633 1363 120 00 16 138
2009 301 353 485 961 426 21 225 435 146 00 160 06
2010 206 947 100 201 139 292 291 954 83 00 00 92
2011 06 800 194 263 179 28 338 1674 450 313 196 00
2012 419 216 85 423 315 75 00 920 1146 141 27 775
2013 30 1810 1233 841 122 165 310 164 52 176 270 10
2014 52 406 1197 548 166 278 484 610 150 432 12 00
2015 337 701 1203 1141 392 00 1190 1584 533 520 296 80
78
Daily sunshine (hours) at Peshawar weather station (1986-2015)
Year Jan Feb Mar Apr May Jun Jul Aug Sep Oct Nov Dec
1986 830 648 695 875 1060 1014 936 712 917 938 723 550
1987 828 610 430 815 851 967 952 940 811 870 870 381
1988 507 691 369 808 1072 613 818 885 909 965 814 295
1989 655 675 530 865 1086 1042 896 845 862 920 720 269
1990 438 515 671 802 1052 000 1024 739 839 879 799 330
1991 687 495 638 576 789 1065 939 828 697 917 765 491
1992 830 648 695 875 1060 1014 936 712 917 938 723 550
1993 828 610 430 815 851 967 952 940 811 870 870 381
1994 507 691 369 808 1072 613 818 885 909 965 814 295
1995 655 675 530 865 1086 1042 896 845 862 920 720 269
1996 438 515 671 802 1052 000 1024 739 839 879 799 330
1997 687 495 638 576 789 1065 939 828 697 917 765 491
1998 597 579 802 825 994 976 945 961 866 916 875 618
1999 470 566 687 1007 1019 1015 873 767 762 892 689 655
2000 494 750 680 918 924 834 844 881 844 861 648 438
2001 675 770 811 807 1013 961 728 925 840 824 795 524
2002 646 464 709 691 941 786 923 608 800 760 586 485
2003 503 472 541 722 866 986 881 804 659 800 648 602
2004 316 700 783 683 1031 945 829 893 804 742 619 461
2005 523 342 553 655 769 958 833 783 712 641 565 559
2006 495 520 574 855 965 928 736 640 813 779 534 520
2007 737 363 615 819 713 897 853 733 660 629 447 575
2008 501 579 659 610 850 803 754 737 770 739 593 576
2009 509 518 552 694 900 806 888 822 793 776 604 530
2010 551 447 700 556 831 846 759 525 669 789 731 598
2011 567 317 673 767 948 906 766 736 686 717 585 651
2012 556 464 554 581 839 874 889 614 615 764 590 574
2013 615 428 688 695 875 853 765 649 655 566 532 507
2014 529 495 555 694 692 929 692 765 755 526 509 428
2015 439 421 447 667 805 858 677 650 692 639 353 520
79
Monthly mean rainfall (mm) at Risalpur weather station (1986-2015)
Year Jan Feb Mar Apr May Jun Jul Aug Sep Oct Nov Dec
1986 21 15 112 92 14 15 45 18 5 10 21 22
1987 000 903 1644 68 775 196 237 12 48 177 0 5
1988 632 26 1716 2 1 75 1635 1219 335 10 0 515
1989 45 167 477 105 16 0 876 96 13 13 0 243
1990 259 749 856 555 7 426 1316 266 37 585 55 654
1991 165 74 108 649 652 33 75 2236 53 0 5 21
1992 1229 51 869 654 183 0 43 596 1666 55 7 38
1993 44 343 1702 71 115 30 97 34 108 8 25 0
1994 17 832 40 591 40 16 314 173 63 65 0 87
1995 0 55 123 865 6 0 1377 260 23 7 17 8
1996 443 119 69 347 123 306 33 1554 285 616 8 8
1997 20 22 34 1915 20 14 131 315 7 0 6 73
1998 235 163 84 65 277 9 171 215 78 16 0 0
1999 185 35 49 4 6 36 113 200 21 0 23 0
2000 79 42 37 9 7 4 224 184 117 9 2 11
2001 0 3 39 12 34 39 185 202 8 0 4 1
2002 1 61 72 7 7 56 16 351 83 0 05 32
2003 28 173 91 67 20 6 180 123 42 16 12 51
2004 84 77 0 635 1 32 595 975 20 117 145 485
2005 129 130 795 4 49 10 185 260 136 18 16 0
2006 64 18 215 225 20 37 675 715 335 255 41 78
2007 1 266 148 36 245 82 41 59 49 0 18 0
2008 68 23 2 172 9 29 267 158 14 1 5 0
2009 59 55 82 134 18 3 163 30 34 6 21 0
2010 23 131 14 15 26 31 431 355 23 0 0 16
2011 5 984 366 313 3 14 4135 1114 303 322 64 0
2012 53 397 9 736 224 13 1224 542 953 37 24 1091
2013 12 2905 1144 545 52 92 4155 892 602 6 29 22
2014 51 505 1542 883 87 32 454 434 513 502 24 0
2015 312 472 1244 1571 333 01 1822 2314 72 1052 233 30
80
Potential and Actual Evapotranspiration of Weather Station in Peshawar Basin
Peshawar Weather Station Risalpur Weather Station
Year Potential ET
(mm Year-1)
Rainfall
(mm Year-1)
Actual ET
(mm year-1)
Potential ET
(mm Year-1)
Rainfall
(mm Year-1)
Actual ET
(mm year-1)
1986 1338 407 365 1331 691 546
1987 1344 343 316 1241 422 371
1988 1316 361 329 1254 652 515
1989 1348 251 239 1353 370 337
1990 1247 449 390 1364 616 507
1991 1271 384 345 1356 739 575
1992 1313 580 480 1375 714 565
1993 1349 469 410 1303 633 511
1994 1274 642 512 1258 957 656
1995 1350 619 508 1331 723 564
1996 1258 667 524 1241 604 487
1997 1264 443 387 1254 484 414
1998 1378 574 483 1353 852 631
1999 1398 407 368 1364 672 540
2000 1291 259 245 1356 724 568
2001 1351 268 254 1375 527 452
2002 1269 299 278 1303 687 541
2003 1256 905 635 1258 809 594
2004 1334 453 398 1354 615 506
2005 1227 625 497 1234 1017 672
2006 1275 498 425 1314 500 429
2007 1239 685 531 1259 725 554
2008 1247 817 596 1227 748 560
2009 1286 623 503 1288 605 493
2010 1233 839 603 1240 1065 690
2011 1270 426 375 1234 760 567
2012 1227 420 369 1314 676 536
2013 1226 562 461 1259 1077 699
2014 1224 455 393 1227 532 443
2015 1169 717 536 1288 956 662
81
APPENDIX-B
Peshawar Irrigation Divisionrsquos Canal System
S No Name of irrigation canal scheme
Discharge
(Cusec)
Length
(ft)
CCA
(Acres)
1 Kabul River Main Canal 800 1500 --
2 Kabul River Canal 450 198000 24338
3 Hazar Khani Branch 106 96000 9484
4 Kurve Branch 54 44000 6224
5 Wazir Garhi Minor 17 24500 2160
6 Pabbi Minor 10 15300 2234
7 Banda Mohib Minor 46 24150 1441
8 Branch Banda Mohib Minor 5 5000 449
9 Dehri Ishaq Minor 2158 21000 1234
10 Zakhai Lift irrigation Scheme 666 7000 562
11 Wazir Garhi Lift Irrigation Scheme 666 2500 714
12 Jue Sheikh Minor 350 143700 24889
13 Shah Mahal Minor 35 26200 1471
14 Yasin Abad Minor 08 8000 236
15 Jue Zardad Canal 3130 43000 1646
16 Mian Gujar Canal 35 25600 2567
17 Sangu Branch 10 4000 1355
18 Sheikhan Branch 16 5000 3266
Charsadda Irrigation Divisionrsquos Canal System
SNo Name of irrigation canal scheme
Discharge
(Cusec)
Length
(ft)
CCA
(Acres)
1 Doaba Canal 350 48500 25368
2 New Michni Minor 85 36180 357
3 Ucha Wala Minor 06 14500 363
4 Subhan Khwar Disty 63 15800 2397
5 Dalazak Minor 31 13000 2019
6 Ichri Branch 30 3466 2682
7 Shabqaddar Branch 14 15000 791
8 Sholgara Canal 174 9100 1953
9 Iceland Canal 53 29000 1808
10 Samkana Branch 185 30900 1511
82
Malakand Irrigation Divisionrsquos Canal System
S No Name of irrigation canal scheme
Discharge
(Cusec)
Length
(ft)
CCA
(Acres)
1 Mian Line Canal 3657 19850 666
2 Power Channel 1380 20975 1477
3 Pitched Channel 1380 20975 576
4 PC Minor 32 42250 3162
5 Abazai Branch 661 86000 8285
6 Meherdi Minor 28 31000 2919
7 Shingri Minor 29 17413 2927
8 Pirsado Disty 98 32367 5414
9 Qutab Garah Minor 29 22500 2964
10 Ghano Minor 15 10340 1462
11 Harichand Disty 51 1000 3022
12 Bari Bund Disty 188 56438 19236
13 Machai Branch 2355 105571 5512
14 Jalala Disty 155 75000 11056
15 Sher Garah Minor 37 25425 3538
16 Spokanda Disty 82 36560 2482
17 Hathian Minor 9 7708 873
18 Kalu Branch Minor 44 37925 4343
19 Kalu Shah Disty 6 9640 595
20 Dundyan Disty 18 16798 1957
21 Shamozai Disty 77 47898 2275
22 Lund Khawar Disty 55 46000 5478
23 Likpani Minor 14 10000 1324
24 Dheri Minor 17 11166 1702
25 Shamozai Tail Minor 17 14150 1892
26 Sarwala Disty 20 13440 1802
27 Said Abad Disty 77 54000 6710
28 Pirabad Minor 10 15000 953
29 Katlang Disty 104 44192 10603
30 Hero Shah Minor 26 42000 2143
83
APPENDIX-C
Mardan Irrigation Divisionrsquos Canal System
S No Name of irrigation canal scheme
Discharge
(Cusec)
Length
(ft)
CCA
(Acres)
1 Main Canal 194000 5644
2 Disty No1 1810 1123
3 Disty No2 5400 1557
4 Sherpao Minor 3500 2371
5 Disty No3 2700 1796
6 Disty No4 5500 4247
7 Disty No5 9000 6462
8 Spinwari Minor 1200 683
9 Disty No6 48500 14220
10 Nisata Branch 19900 9452
11 Nisata Minor 5000 3755
12 Palosa Minor 4600 3262
13 Tangi LIS 1800 1766
14 Zardad Branch 3500 7431
15 Kheshki Branch 2000 4315
16 Maira Nistta LIS 0400 520
17 Main Canal 143600 000
18 Khan Mahi Branch 10900 8111
19 Disty No7 2500 2531
20 Disty No8 45400 16533
21 Korough Branch 9400 7202
22 Sheikh Yousaf Minor 3200 2102
23 Moho Dehri Minor 2800 1772
24 Rashakai Minor 6700 4158
25 Bara Bandaa Minor 1500 779
26 Turlandi Minor 2800 1879
27 Nowshera Minor 2600 2235
28 Disty No9 44000 13333
29 Minor No1 Disty No9 3500 2957
30 Minor No2 Disty No9 3500 2067
31 Minor No3 Disty No9 2500 1479
32 Power House Minor 1700 2100
33 Kalpani Disty 15800 4417
34 Kodinaka Minor No1Kalpani 4500 3364
35 Taus Minor No2Kalpani 4200 2269
36 Mohib Banda Minor Br 2 of Minor 2 500 867
37 Old Mayar 150 745
38 New Mayar Channel A 350 31500
39 New Mayar Channel B 225 354
40 Kandar Minor 1250 850
41 Main Channel 850 1154
42 Murdara Minor 100 154
84
Cover area and production of Wheat in Peshawar Basin
Wheat Area (Hectares) Wheat Production (Tonnes)
SNo Year Peshawar Chardadda Nowshera Mardan Peshawar Chardadda Nowshera Mardan
1 1981-82 79100 0 0 97900 147600 0 0 113000
2 1982-83 82400 0 0 99700 152200 0 0 116000
3 1983-84 67100 0 0 92900 127800 0 0 91100
4 1984-85 65400 0 0 95600 126500 0 0 102100
5 1985-86 79800 0 0 97200 149800 0 0 104300
6 1986-87 80700 0 0 95900 143300 0 0 108800
7 1987-88 67900 0 0 96900 121500 0 0 120200
8 1988-89 74900 0 0 96800 135900 0 0 132400
9 1989-90 51400 27100 0 47500 99900 59700 0 80400
10 1990-91 27200 27700 25700 47100 54200 60500 47500 82100
11 1991-92 27100 27300 26300 47600 55200 60100 49600 83400
12 1992-93 27700 27300 30800 47700 57100 65900 49200 85700
13 1993-94 26200 28200 27500 47100 57600 71900 44000 81100
14 1994-95 25500 30400 30000 47600 54500 80800 48000 82700
15 1995-96 30600 27300 29400 47400 65000 73600 53000 84100
16 1996-97 31900 35000 30000 47200 58400 69000 41600 76100
17 1997-98 37400 29000 30300 49500 86100 81800 57200 107100
18 1998-99 35700 28500 25300 44000 82200 78100 47700 87600
19 1999-00 35300 28700 25700 44500 73400 77100 47400 90100
20 2000-01 34800 29200 25900 44600 57600 58500 28700 85300
21 2001-02 35200 16100 15200 45000 59900 29400 35300 90500
22 2002-03 34200 27000 20400 45000 60100 71700 44100 82200
23 2003-04 34200 25700 22300 44900 59200 68400 48300 80700
24 2004-05 34500 27500 23100 45000 76100 47400 48300 78900
25 2005-06 34500 27300 23200 45000 76200 59500 48400 89900
26 2006-07 34500 27200 23300 45000 76500 66300 51300 99800
27 2007-08 34500 27200 23400 46000 78000 64100 49000 95500
28 2008-09 35300 33000 23400 50000 83600 86400 56800 99000
29 2009-10 35935 33265 23356 49446 78735 83635 55329 90734
30 2010-11 73477 27782 23005 46611 73477 73477 57598 98024
31 2011-12 36078 28484 23025 41886 79723 74499 57691 86297
32 2012-13 36952 29643 23058 41865 81399 74814 57377 80694
33 2013-14 36228 33123 23088 43943 80061 85508 57779 96350
34 2014-15 36362 27488 24841 42397 80291 70567 48909 80999
35 2015-16 37544 40446 25007 44123 80306 107690 52671 91004
85
Rice Area (Hectares) Rice Production (Tonnes)
SNo Year Peshawar Chardadda Nowshera Mardan Peshawar Chardadda Nowshera Mardan
1 1981-82 700 0 0 1100 1200 0 0 1500
2 1982-83 800 0 0 900 1400 0 0 1300
3 1983-84 600 0 0 900 1100 0 0 1200
4 1984-85 800 0 0 900 1400 0 0 1500
5 1985-86 800 0 0 1000 1600 0 0 1700
6 1986-87 900 0 0 1600 1800 0 0 2800
7 1987-88 800 0 0 1500 2200 0 0 2100
8 1988-89 700 0 0 1800 1700 0 0 3300
9 1989-90 600 100 0 1300 1100 300 0 2000
10 1990-91 500 100 0 1300 1000 300 0 2000
11 1991-92 400 100 100 1300 800 400 200 2100
12 1992-93 500 100 100 1300 1000 300 100 2200
13 1993-94 300 100 100 1300 600 300 100 2200
14 1994-95 400 100 100 1400 900 300 100 2200
15 1995-96 300 200 0 1300 600 400 0 2200
16 1996-97 300 100 0 1300 500 200 0 2200
17 1997-98 300 100 100 1300 600 400 100 2300
18 1998-99 300 100 100 1300 700 200 100 2100
19 1999-00 300 200 0 1300 600 400 100 2100
20 2000-01 300 200 100 1300 600 300 100 2200
21 2001-02 300 100 100 1400 600 300 100 2200
22 2002-03 300 100 100 1400 600 300 100 2100
23 2003-04 300 100 100 1400 700 300 100 2200
24 2004-05 300 100 100 1400 700 300 200 2400
25 2005-06 300 100 100 1400 700 200 100 2300
26 2006-07 300 100 100 1400 700 100 100 2400
27 2007-08 300 100 100 1400 700 100 200 2900
28 2008-09 300 100 100 1400 700 300 200 3100
29 2009-10 323 158 104 1889 677 379 191 4022
30 2010-11 196 110 97 1851 411 264 174 3498
31 2011-12 320 132 100 1749 670 292 178 3456
32 2012-13 336 116 85 1750 680 270 156 2853
33 2013-14 340 114 81 1739 711 273 153 3078
34 2014-15 750 108 82 1772 2199 257 153 3153
35 2015-16 345 121 79 1863 724 276 142 3321
86
Maize Area (Hectares) Maize Production (Tonnes)
SNo Year Peshawar Chardadda Nowshera Mardan Peshawar Chardadda Nowshera Mardan
1 1981-82 45600 0 0 58000 87500 0 0 93700
2 1982-83 45100 0 0 54100 86100 0 0 88300
3 1983-84 41600 0 0 59800 74300 0 0 99600
4 1984-85 39700 0 0 58900 68400 0 0 99000
5 1985-86 40500 0 0 68800 71100 0 0 129500
6 1986-87 41200 0 0 71000 71900 0 0 130100
7 1987-88 40300 0 0 68200 74100 0 0 114900
8 1988-89 38100 0 0 71200 71100 0 0 122100
9 1989-90 21700 17900 0 32300 38900 34600 0 57400
10 1990-91 23100 18900 0 32300 40000 36500 0 61400
11 1991-92 14600 18400 8500 32600 26800 36500 15800 59200
12 1992-93 15500 17600 10300 32300 25600 30000 18600 56700
13 1993-94 14900 18100 11000 32300 24600 34500 20300 55800
14 1994-95 12600 18600 10100 32000 20500 38100 18200 56700
15 1995-96 13100 16500 11300 32400 20000 28000 22300 56900
16 1996-97 13100 18000 11500 32400 20900 32600 24000 56700
17 1997-98 14400 10900 11300 34300 23300 18600 23200 59900
18 1998-99 13800 18600 11300 28400 23000 36400 23300 50900
19 1999-00 15500 19100 10300 31000 26500 38400 20300 56700
20 2000-01 14600 18900 11500 31700 26200 33600 23400 59700
21 2001-02 16500 18100 11300 30900 29300 35700 23900 58500
22 2002-03 16600 15800 7300 29300 28900 26800 15800 54900
23 2003-04 16600 15800 11100 29100 29900 27000 23900 58700
24 2004-05 16700 17900 10800 29600 30000 30500 23400 59800
25 2005-06 16700 17600 10800 33100 30200 38700 23400 84700
26 2006-07 16600 17700 10800 31000 30000 40300 23600 83800
27 2007-08 16600 17400 10900 31000 29400 40300 24600 96600
28 2008-09 16900 16200 10900 32300 29800 56500 31000 110500
29 2009-10 16865 18172 10885 32113 29637 52610 31002 109036
30 2010-11 12482 12557 7946 32016 21911 33022 22472 106420
31 2011-12 16706 18181 10849 30530 29358 43259 29788 114587
32 2012-13 16730 14479 10726 30927 29441 36969 30236 100706
33 2013-14 16777 16406 10759 30977 29477 37752 30422 109963
34 2014-15 16754 16578 12340 29229 29311 37779 33095 94565
35 2015-16 16000 16319 12131 28992 29532 38330 33042 89651
87
Sugar Cane Area (Hectares) Sugar Cane Production (Tonnes)
SNo Year Peshawar Chardadda Nowshera Mardan Peshawar Chardadda Nowshera Mardan
1 1981-82 55000 0 0 26900 2409700 0 0 1087500
2 1982-83 54200 0 0 26500 2367200 0 0 1080500
3 1983-84 54000 0 0 31100 2227700 0 0 1264700
4 1984-85 51100 0 0 26400 2106800 0 0 1074400
5 1985-86 47800 0 0 27000 1973800 0 0 1092500
6 1986-87 48400 0 0 27200 2005400 0 0 1016500
7 1987-88 50100 0 0 33500 2122900 0 0 1401700
8 1988-89 51600 0 0 31400 2501000 0 0 1320400
9 1989-90 21700 29400 0 31000 1050500 1430700 0 1261900
10 1990-91 23200 28700 0 31000 1126900 1393500 0 1239600
11 1991-92 15900 28700 6100 31300 778800 1445200 314800 1264500
12 1992-93 15700 25100 6400 31000 786600 1295000 307800 1281300
13 1993-94 16200 25500 6300 31000 818800 1317400 300600 1281200
14 1994-95 14300 29200 5500 31000 719400 1518700 259300 1282400
15 1995-96 14700 28800 6100 31000 754200 1473100 291200 1285600
16 1996-97 14200 31800 5700 31000 726100 1620500 277000 1281300
17 1997-98 13700 33600 5500 27800 697700 1778200 268500 1176400
18 1998-99 12800 31900 5700 28500 655300 1682900 274900 1211800
19 1999-00 12600 33600 6400 29600 646700 1796300 308300 1256900
20 2000-01 12900 33600 5900 30900 666600 1646300 288500 1328800
21 2001-02 12200 31300 5700 31100 641900 1585700 285000 1451800
22 2002-03 12200 32200 5900 31200 645900 1662700 300300 1508800
23 2003-04 12200 32200 5600 31300 629900 1358200 285500 1521500
24 2004-05 11900 34700 5100 31000 612300 1483700 259000 1509700
25 2005-06 11900 31600 5000 29400 611400 1418300 253600 1347000
26 2006-07 11900 32200 5100 29400 613500 1429700 259500 1407800
27 2007-08 11900 32100 5200 29500 613000 1441000 260400 1412500
28 2008-09 11500 30800 5200 28400 598600 1376200 260500 1309700
29 2009-10 11566 31597 5154 29871 600749 1434152 261830 44430
30 2010-11 9480 20418 4742 30144 490905 914275 240112 1463491
31 2011-12 11034 32298 5182 31750 573116 1374566 262870 1511912
32 2012-13 11106 34593 5225 30436 576850 1502268 266241 1420448
33 2013-14 11164 32615 5240 30552 576880 1451177 265812 1463746
34 2014-15 11376 30012 4260 30689 568800 1368221 219279 1381285
35 2015-16 8134 31115 5263 30915 422998 1442903 270003 1369273
88
Tobacco Area (Hectares) Tobacco Production (Tonnes)
SNo Year Peshawar Chardadda Nowshera Mardan Peshawar Chardadda Nowshera Mardan
1 1981-82 4567 0 0 17052 7980 0 0 30220
2 1982-83 4130 0 0 17265 5850 0 0 30750
3 1983-84 5731 0 0 18309 11330 0 0 37170
4 1984-85 7936 0 0 18609 15747 0 0 38014
5 1985-86 6502 0 0 16422 12439 0 0 33607
6 1986-87 5499 0 0 13481 10701 0 0 28082
7 1987-88 4774 0 0 15510 9036 0 0 31292
8 1988-89 4754 0 0 15730 9116 0 0 32378
9 1989-90 225 4840 0 2962 398 9264 0 6887
10 1990-91 230 4980 0 3182 474 9795 0 6994
11 1991-92 0 7335 310 5100 0 15057 642 11644
12 1992-93 0 7794 774 7159 0 14481 1509 14351
13 1993-94 0 7730 880 5246 0 15670 1812 11062
14 1994-95 0 5579 560 4807 0 10723 1148 9983
15 1995-96 0 5221 500 4579 0 10331 1062 9815
16 1996-97 0 5644 620 4451 0 12628 1505 11026
17 1997-98 0 6567 500 5199 0 14444 1150 12036
18 1998-99 0 6571 560 5553 0 15282 1311 13491
19 1999-00 0 6189 600 5897 0 14353 1410 13945
20 2000-01 0 3997 350 4417 0 9579 827 11099
21 2001-02 0 4351 521 4904 0 10560 1276 12436
22 2002-03 0 3317 411 3471 0 8141 1048 8887
23 2003-04 0 2753 350 3920 0 6807 881 10320
24 2004-05 0 3364 596 6012 0 8311 1570 15675
25 2005-06 0 4420 962 7238 0 11413 2564 18464
26 2006-07 0 3108 1115 5163 0 8497 3010 14202
27 2007-08 0 3433 1151 5433 0 8677 2874 15893
28 2008-09 0 3467 1253 5745 0 9159 3351 16369
29 2009-10 0 3827 1450 6071 0 10660 4453 18662
30 2010-11 0 4420 1409 3607 0 10510 2544 10682
31 2011-12 0 4420 1409 3607 0 10510 2544 10682
32 2012-13 0 3670 1219 3935 0 10670 3626 10642
33 2013-14 0 3670 1219 3935 0 10670 3626 10642
34 2014-15 0 4194 1860 4123 0 12410 5500 12230
35 2015-16 0 4194 1860 4123 0 12410 5500 12230
89
Sugar Beet Area (Hectares) Sugar Beet Production (Tonnes)
SNo Year Peshawar Chardadda Nowshera Mardan Peshawar Chardadda Nowshera Mardan
1 1981-82 5833 6578 0 0 169174 190771 0 0
2 1982-83 4069 4588 0 0 96759 109112 0 0
3 1983-84 3836 0 0 4322 81859 0 0 96163
4 1984-85 1529 0 0 2185 46998 0 0 56139
5 1985-86 1093 0 0 2255 52935 0 0 82126
6 1986-87 6910 0 0 2731 176259 0 0 143091
7 1987-88 6974 0 0 4805 255741 0 0 200749
8 1988-89 4426 0 0 6847 140628 0 0 193818
9 1989-90 3035 1279 0 6575 98036 50344 0 175008
10 1990-91 2839 838 0 6723 105639 37956 0 208517
11 1991-92 2879 0 0 5979 106240 0 0 164757
12 1992-93 1781 616 0 5895 50193 17352 0 142681
13 1993-94 1518 728 0 4619 57224 42576 0 116872
14 1994-95 1895 1012 0 4561 48397 28327 0 154814
15 1995-96 1824 0 0 5945 56856 0 0 127074
16 1996-97 993 0 0 4223 39801 0 0 75623
17 1997-98 573 0 0 3329 6171 0 0 0
18 1998-99 546 0 0 0 32937 0 0 0
19 1999-00 1386 0 0 0 55123 0 0 129946
20 2000-01 1900 460 400 4346 58000 14000 12000 195000
21 2001-02 1972 467 500 5200 73100 17745 18500 123170
22 2002-03 1900 450 350 4000 58900 13900 10500 159098
23 2003-04 535 1493 89 5121 22812 63661 3795 88538
24 2004-05 180 501 43 2060 8436 20978 1778 52011
25 2005-06 212 599 68 2178 9730 27493 3121 50355
26 2006-07 27 565 162 1233 1103 23090 6620 58741
27 2007-08 16 200 21 1646 544 4114 483 0
28 2008-09 0 0 0 0 0 0 0
29 2009-10
30 2010-11
31 2011-12
32 2012-13
33 2013-14
34 2014-15
35 2015-16
90
Barley Area (Hectares) Barley Production (Tonnes)
SNo Year Peshawar Chardadda Nowshera Mardan Peshawar Chardadda Nowshera Mardan
1 1981-82 5700 0 0 7400 5800 0 0 6700
2 1982-83 6200 0 0 7400 6200 0 0 6600
3 1983-84 4200 0 0 9700 4400 0 0 6500
4 1984-85 2900 0 0 9900 3200 0 0 7200
5 1985-86 3400 0 0 9000 3800 0 0 7600
6 1986-87 3600 0 0 8200 4500 0 0 6400
7 1987-88 2900 0 0 8700 3800 0 0 7800
8 1988-89 3100 0 0 9000 3900 0 0 8200
9 1989-90 2700 1400 0 7000 3300 2000 0 6200
10 1990-91 1300 1600 1600 7000 1700 2100 1800 6900
11 1991-92 1300 900 1900 6900 1800 1200 2100 7100
12 1992-93 1100 700 1200 7800 1500 900 1600 8000
13 1993-94 900 800 1000 7000 1300 900 1300 5900
14 1994-95 1100 600 1100 6900 1400 1000 1400 6000
15 1995-96 1700 600 1000 6900 2500 900 1300 6000
16 1996-97 2100 600 900 7000 2800 700 1200 6000
17 1997-98 1600 500 1000 6900 2300 800 1400 6000
18 1998-99 1600 400 900 7000 2200 600 1100 2500
19 1999-00 1500 500 800 6900 2200 800 1100 2600
20 2000-01 1500 300 400 2700 2100 400 500 2300
21 2001-02 400 300 500 2700 600 400 600 2500
22 2002-03 700 400 800 2700 700 500 1100 2600
23 2003-04 300 400 700 2700 400 400 900 2600
24 2004-05 300 300 1100 2600 300 300 1300 2800
25 2005-06 300 100 1000 2600 300 200 1300 3000
26 2006-07 300 200 1100 2600 300 200 1400 3100
27 2007-08 300 100 1200 2500 300 200 1400 2900
28 2008-09 200 300 600 2500 200 400 700 3000
29 2009-10 84 328 615 2512 109 400 694 2299
30 2010-11 76 90 586 2192 96 109 647 1995
31 2011-12 63 120 581 1663 80 132 607 1508
32 2012-13 99 62 567 1610 121 68 571 1295
33 2013-14 51 19 554 1373 62 23 567 1170
34 2014-15 49 19 504 1364 50 24 662 1129
35 2015-16 79 0 337 1315 86 0 513 1053
91
Crops Cover Area in Peshawar Basin (Hactar) Rabi Crops (Winter) Kharif Crops (Summer) Perennial Crop
Year Wheat Rice Maize Sugar Cane Tobacco Sugar Beet Barley Total Area Wheat Tobacco Sugar Beet Barley Rice Maize Sugar Cane
1985-86 177000 1800 109300 74800 22924 3348 12400 401572 44 6 1 3 0 27 19
1986-87 176600 2500 112200 75600 18980 9641 11800 407321 43 5 2 3 1 28 19
1987-88 164800 2300 108500 83600 20284 11779 11600 402863 41 5 3 3 1 27 21
1988-89 171700 2500 109300 83000 20484 11273 12100 410357 42 5 3 3 1 27 20
1989-90 126000 2000 71900 82100 8027 10889 11100 312016 40 3 3 4 1 23 26
1990-91 127700 1900 74300 82900 8392 10400 11500 317092 40 3 3 4 1 23 26
1991-92 128300 1900 74100 82000 12745 8858 11000 318903 40 4 3 3 1 23 26
1992-93 133500 2000 75700 78200 15727 8292 10800 324219 41 5 3 3 1 23 24
1993-94 129000 1800 76300 79000 13856 6865 9700 316521 41 4 2 3 1 24 25
1994-95 133500 2000 73300 80000 10946 7468 9700 316914 42 3 2 3 1 23 25
1995-96 134700 1800 73300 80600 10300 7769 10200 318669 42 3 2 3 1 23 25
1996-97 144100 1700 75000 82700 10715 5216 10600 330031 44 3 2 3 1 23 25
1997-98 146200 1800 70900 80600 12266 3902 10000 325668 45 4 1 3 1 22 25
1998-99 133500 1800 72100 78900 12684 546 9900 309430 43 4 0 3 1 23 25
1999-00 134200 1800 75900 82200 12686 1386 9700 317872 42 4 0 3 1 24 26
2000-01 134500 1900 76700 83300 8764 7106 4900 317170 42 3 2 2 1 24 26
2001-02 111500 1900 76800 80300 9776 8139 3900 292315 38 3 3 1 1 26 27
2002-03 126600 1900 69000 81500 7199 6700 4600 297499 43 2 2 2 1 23 27
2003-04 127100 1900 72600 81300 7023 7238 4100 301261 42 2 2 1 1 24 27
2004-05 130100 1900 75000 82700 9972 2784 4300 306756 42 3 1 1 1 24 27
2005-06 130000 1900 78200 77900 12620 3057 4000 307677 42 4 1 1 1 25 25
2006-07 130000 1900 76100 78600 9386 1987 4200 302173 43 3 1 1 1 25 26
2007-08 131100 1900 75900 78700 10017 1883 4100 303600 43 3 1 1 1 25 26
2008-09 141700 1900 76300 75900 10465 0 3600 309865 46 3 0 1 1 25 24
2009-10 142002 2474 78035 78188 11348 0 3539 315586 45 4 0 1 1 25 25
2010-11 170875 2254 65001 64784 9436 0 2944 315294 54 3 0 1 1 21 21
2011-12 129473 2301 76266 80264 9436 0 2427 300167 43 3 0 1 1 25 27
2012-13 131518 2287 72862 81360 8824 0 2338 299189 44 3 0 1 1 24 27
2013-14 136382 2274 74919 79571 8824 0 1997 303967 45 3 0 1 1 25 26
2014-15 131088 2712 74901 76337 10177 0 1936 297151 44 3 0 1 1 25 26
2015-16 147120 2408 73442 75427 10177 0 1731 310305 47 3 0 1 1 24 24
92
APPENDIX-D
93
Number of Industrial Units Running in Peshawar Basin-2017
S No Nature of Industry Peshawar Nowshera Mardan Charsadda Total
1 Adhesive Tape 3 03
2 Aluminum 7 07
3 Arms and Ammunition 22 22
4 Beverages 7 1 1 09
5 Biscuit and Sweet 21 2 1 24
6 Carpet 14 14
7 Cement 2 02
8 Cement based 8 33 25 25 91
9 Ceramics 2 2 4
10 Chemical 15 1 16
11 Cigarette 1 4 1 5
12 Cold Storage 6 4 3 13
13 Cotton 2 1 3
14 Dall 2 1 3
15 Elect Goods 6 5 11
16 Engineering 39 2 41
17 Feed 1 1
18 Fiber Glass 2 2
19 Flour Mills 42 10 23 11 86
20 Formica 1 1
21 Furniture 26 2 1 29
22 Garments 2 2
23 Gases 2 1 3
24 Glasses 1 1
25 Ice Factory 17 10 2 5 34
26 Leather 6 6
27 Marble and Chips 52 82 115 1 250
28 Matches 13 2 1 16
29 Meet Process 1 1
30 Metal Work 7 1 1 9
31 Mining 2 2
32 Packages 16 2 2 20
33 Paints 2 2
34 Paper and Board 4 1 5
35 Pet Lube 1 1 2
36 Pharmacy 41 10 51
37 Plastic and Rubber 28 3 2 33
38 Poultry farm 1 1
39 Polyester Acrylic 1 1
40 Preservation of Fruits 4 4
41 Printing Press 29 1 30
42 Soap 5 1 2 8
43 Spice Grinding 1 1
44 Sugar 1 1 1
45 Textile loom Sec 1 1
46 Veg Ghee and Oil 3 1 4
47 Wood 11 11
48 Woolen 2 1 3
Total 475 187 185 44 891
94
APPENDIX-E
Monthly mean discharge (m3s) Kabul River at warsak gauge (1986-2015) Year Jan Feb Mar Apr May Jun July Aug Sep Oct Nov Dec
1986 160 180 214 497 736 1019 1440 1010 362 225 243 265
1987 166 166 344 565 764 1401 1325 806 508 248 193 164
1988 165 172 315 741 1194 1128 1258 793 367 216 188 158
1989 157 138 174 24 618 1142 909 615 353 205 175 175
1990 167 193 270 415 1330 1211 510 863 497 250 188 189
1991 190 240 400 953 1487 2121 1904 1093 582 315 224 228
1992 195 175 277 692 1496 1983 2216 1311 550 334 269 225
1993 232 205 312 666 1117 1349 1172 673 502 237 180 231
1994 166 182 234 428 979 1499 1687 1067 440 251 235 181
1995 169 171 241 561 1005 1594 1742 1042 374 247 203 177
1996 172 172 257 557 835 1603 1116 916 452 255 205 197
1997 149 146 179 608 1048 1661 1598 994 503 255 184 167
1998 163 217 287 948 1341 1148 1754 882 462 269 205 194
1999 218 218 256 447 1023 1105 962 747 441 233 200 189
2000 183 163 156 308 651 575 766 661 446 206 185 180
2001 147 146 185 347 795 969 1028 663 380 185 160 174
2002 138 147 214 479 804 1356 814 754 404 204 188 169
2003 141 146 228 622 755 1548 1459 826 439 247 225 183
2004 170 175 196 397 822 1156 863 683 395 315 218 184
2005 202 189 478 748 1038 1790 2139 1044 572 302 222 185
2006 186 196 243 381 1075 789 951 934 432 238 203 207
2007 172 211 435 1373 1414 1722 1392 861 497 242 194 181
2008 178 162 228 446 778 1185 856 749 323 204 172 155
2009 180 189 314 553 1086 1249 1771 1132 444 256 216 207
2010 175 189 309 483 947 1199 1614 1651 558 293 237 197
2011 175 184 250 420 931 872 841 841 459 242 208 172
2012 158 169 204 692 698 1290 1378 790 546 253 197 187
2013 170 210 441 530 1240 1791 1108 1121 454 296 223 227
2014 189 163 304 563 1219 1586 1455 771 366 412 213 179
2015 181 248 371 663 1085 1236 1474 1047 404 257 302 241
95
Monthly mean discharge (m3s) of Swat River at munda gauge (1986-
2015)
Year Jan Feb Mar Apr May Jun Jul Aug Sep Oct Nov Dec
1986 364 429 552 883 703 847 910 673 471 467 376 318
1987 259 485 495 646 754 854 856 717 588 538 496 481
1988 289 249 559 557 586 549 646 592 590 453 428 409
1989 332 349 451 629 845 899 807 584 437 540 384 287
1990 173 203 466 625 588 577 788 804 406 416 271 274
1991 364 429 552 883 703 847 910 673 471 467 376 318
1992 259 480 502 648 760 854 859 704 588 541 493 480
1993 283 248 559 557 586 549 646 592 590 453 428 409
1994 332 349 451 629 845 899 807 584 436 540 384 287
1995 173 203 466 625 588 577 788 804 406 416 271 274
1996 364 429 552 883 703 847 910 673 471 467 376 318
1997 259 480 502 648 760 854 859 704 588 541 493 480
1998 283 248 559 557 586 549 646 592 590 453 428 409
1999 332 349 451 629 845 899 807 584 436 540 384 287
2000 281 329 416 508 606 506 517 548 100 540 360 370
2001 92 73 158 160 398 440 429 379 273 133 96 48
2002 96 146 210 418 539 468 349 478 253 113 64 65
2003 90 118 243 497 517 629 545 421 277 158 116 102
2004 76 108 122 309 564 580 364 425 230 520 259 196
2005 241 296 624 654 633 756 861 499 378 272 84 83
2006 133 197 371 424 1259 602 745 794 294 55 131 223
2007 185 364 700 766 600 647 506 352 244 54 38 57
2008 79 86 272 610 651 729 524 448 115 43 34 35
2009 89 92 151 454 525 568 677 514 145 34 31 30
2010 60 220 406 483 587 479 857 947 352 120 49 37
2011 51 285 271 323 511 445 401 408 290 115 73 40
2012 112 256 173 384 233 579 606 423 335 78 60 96
2013 168 327 436 293 459 727 491 518 227 219 224 219
2014 242 283 363 364 538 548 572 373 175 165 155 95
2015 96 199 306 431 387 426 562 460 113 56 149 92
96
Mean monthly discharge of Kabul River at Nowshera gauge (m3s) (1986 -2015)
Year Jan Feb Mar Apr May Jun Jul Aug Sep Oct Nov Dec
1986 332 327 493 1308 1846 2132 1538 842 538 348 230 243
1987 308 272 716 1006 1192 1757 1717 1100 714 453 255 214
1988 283 255 484 1027 1700 1643 1967 1491 536 303 225 256
1989 317 213 316 609 1101 1778 1415 1155 486 274 228 257
1990 303 363 685 834 2126 1757 1600 1350 761 379 257 271
1991 367 548 808 1874 2267 3323 2977 1748 1005 550 379 369
1992 423 462 633 1319 2286 2832 3366 2176 1057 588 430 365
1993 462 304 760 1199 1709 1991 1832 965 680 269 148 188
1994 179 193 326 772 1340 1938 2531 1581 651 289 244 209
1995 223 174 409 1009 1444 2022 2393 1508 595 371 233 259
1996 311 322 555 870 1169 2202 1558 1393 660 449 261 259
1997 287 237 249 962 1320 1998 2075 1288 662 409 259 251
1998 355 488 638 1417 1910 1477 2444 1206 701 383 283 277
1999 415 511 568 739 1308 1356 1121 933 519 234 190 155
2000 251 199 118 451 822 713 949 810 551 198 139 130
2001 163 86 108 407 937 1075 1093 790 392 158 150 150
2002 166 162 290 615 953 1571 933 992 554 180 151 144
2003 158 194 354 910 1035 1859 1821 1010 591 287 226 194
2004 279 313 226 522 1082 1370 942 818 442 473 240 215
2005 344 448 877 1166 1489 2431 3551 1465 761 465 324 281
2006 398 432 452 613 1472 1020 1309 1674 597 257 302 393
2007 319 479 968 1929 1801 2013 1934 1055 690 340 243 249
2008 333 320 359 847 1116 1702 1319 1156 431 246 197 196
2009 308 383 486 1093 1633 1561 2235 1485 592 300 258 246
2010 280 453 567 770 1325 1486 1760 3512 973 607 437 372
2011 390 499 592 878 1619 1264 1064 1113 686 282 257 173
2012 249 301 300 1003 926 1630 1928 1124 950 323 257 272
2013 328 479 821 1002 1865 2827 1535 1649 619 383 300 213
2014 252 294 713 1008 1852 2365 2078 1076 476 408 320 253
2015 311 531 702 1304 1764 1908 2438 1802 466 366 470 329
97
Different sources of Nitrogen in Peshawar Basin (1985-2015)
Year District wise N from Fertilizer (Tones)
N from
Artificial
Fertilizer
N from
Livestock
manure
N from
Domestic
sources
N from
Industrial
sources
Charsadda Mardan Nowshera Peshawar (tyear) (tyear) (tyear) (tyear)
1986 9579 6549 6549 9579 32256 29520 1273 478
1987 8450 10320 7850 8750 35370 28571 1313 491
1988 7446 10352 10352 7446 35596 27623 1378 512
1989 10340 11220 8450 7120 37130 26675 1418 525
1990 10320 9950 9720 6950 36940 33137 1485 547
1991 9930 10350 10400 12630 43310 32557 1527 560
1992 7900 11600 11300 9980 40780 31357 1568 573
1993 7640 9700 6700 8300 32340 30157 1724 627
1994 5350 38257 2579 12268 58454 28958 1769 641
1995 4034 26072 4235 20969 55310 27758 1813 654
1996 6190 26851 3180 20094 56315 26558 1857 668
1997 6350 25054 2930 24103 58438 27997 1901 682
1998 6720 22300 5900 20300 55220 29436 1947 697
1999 7096 26346 6576 24332 64350 30876 2024 719
2000 6855 29868 3590 19980 60293 36290 2068 730
2001 10283 35816 3573 20677 70349 37910 2145 753
2002 9779 32968 3413 31850 78010 39530 2223 777
2003 12465 27578 3290 29531 72864 41151 2300 800
2004 12601 32652 5263 29403 79919 42771 2378 823
2005 13128 44519 5183 29988 92818 44391 2497 861
2006 12851 30086 2757 25925 71619 46012 2575 884
2007 11320 42152 3181 40383 97036 47742 2743 938
2008 8027 53392 2496 42796 106711 49473 2869 978
2009 9901 50280 8730 57681 126592 51204 2952 1003
2010 10183 45947 4297 34679 95106 52934 3083 1044
2011 12659 48410 7562 32530 101161 54665 3167 1069
2012 10041 48854 4408 33574 96877 56396 3251 1094
2013 8667 44246 3657 25173 81743 58126 3387 1137
2014 9268 47614 4847 24147 85876 59857 3472 1163
2015 8052 29845 2399 16183 56479 61587 3558 1188
98
Different sources of Phosphorus in Peshawar Basin (1985-2015)
Year District wise P from Fertilizer (Tones)
P from
Artificial
Fertilizer
P from
Livestock
manure
P from
Domestic
sources
P from
Industrial
sources
Charsadda Mardan Nowshera Peshawar (tyear) (tyear) (tyear) (tyear)
1986 2657 2835 2836 2658 10986 8871 127 19
1987 1059 3594 510 3416 8579 8587 131 20
1988 1011 2350 1001 2500 6862 8302 138 21
1989 950 3230 1120 2930 8230 8018 142 21
1990 1050 3850 1020 1750 7670 9980 149 22
1991 1230 4200 950 3200 9580 9792 153 23
1992 983 4500 1020 3500 10003 9431 157 24
1993 998 3500 1200 2370 8068 9070 172 26
1994 883 5421 2000 2278 10582 8709 177 27
1995 1007 5462 543 1780 8792 8348 181 27
1996 1110 3440 692 2024 7266 7987 186 28
1997 1630 3900 760 4080 10370 8416 190 29
1998 1160 4600 980 4300 11040 8844 195 29
1999 1196 5253 750 5033 12232 9273 202 30
2000 1180 6713 1061 3753 12707 10910 207 31
2001 800 6718 232 3209 10959 11393 215 32
2002 462 6093 230 4129 10914 11876 222 33
2003 1361 6595 514 10499 18969 12360 230 35
2004 1114 6564 702 3851 12231 12843 238 36
2005 981 6334 387 3176 10878 13326 250 37
2006 1878 10765 774 8457 21874 13809 258 39
2007 343 6802 246 6508 13899 14323 274 41
2008 951 10077 425 6719 18172 14837 287 43
2009 656 10229 268 10128 21281 15351 295 44
2010 1314 7238 285 6214 15051 15865 308 46
2011 1071 4820 341 4856 11088 16379 317 48
2012 4652 5711 269 3245 13877 16892 325 49
2013 2033 8626 666 4655 15980 17406 339 51
2014 2220 11906 1238 5509 20873 17920 347 52
2015 1274 6624 363 2493 10754 18434 356 53
99
Livestock Population in Peshawar Basin 1985-2015
Year Bovine Animals
Sheep Goats Camels Equine
Poultry Cattle Buffaloes Horses Asses Mules
1985 911941 498575 239241 510087 5721 14969 128452 2521 5706659
1986 881656 481482 229940 510027 5506 14513 116996 2944 5582935
1987 851372 464390 220638 509968 5292 14057 105540 9255 5459210
1988 821087 447297 211336 509908 5078 13600 94085 15566 5335486
1989 790802 430205 202034 509848 4863 13144 82629 21877 5211761
1990 760517 413112 192733 509789 4649 12687 71173 28188 5088036
1991 730233 396019 183431 509729 4435 12231 59717 34500 4964312
1992 699948 378927 174129 509669 4220 11775 48261 40811 4840587
1993 669663 361834 164827 509610 4006 11318 36805 47122 4716863
1994 639378 344741 155526 509550 3792 10862 25350 53433 4593138
1995 609094 327649 146224 509491 3577 10405 13894 59744 4469414
1996 578809 310556 136922 509431 3363 9949 2438 66055 4345689
1997 611044 327192 146884 542214 3457 10484 10465 59751 4467335
1998 643280 343827 156845 574996 3550 11019 18493 53447 4588981
1999 675515 360463 166807 607779 3644 11554 26520 47143 4710626
2000 707751 377098 176769 640562 3738 12089 34548 40839 4832272
2001 739986 393734 186731 673345 3832 12624 42575 34535 4953918
2002 772221 410369 196692 706127 3925 13159 50602 28231 5075564
2003 804457 427005 206654 738910 4019 13694 58630 21927 5197210
2004 836692 443640 216616 771693 4113 14229 66657 15623 5318855
2005 868928 460276 226577 804475 4206 14764 74685 9319 5440501
2006 901163 476911 236539 837258 4300 15299 82712 3015 5562147
2007 940199 495931 240857 874140 4300 15299 82712 3015 5562147
2008 979234 514952 245174 911021 4300 15299 82712 3015 5562147
2009 1018270 533972 249492 947903 4300 15299 82712 3015 5562147
2010 1057305 552993 253809 984785 4300 15299 82712 3015 5562147
2011 1096341 572013 258127 1021667 4300 15299 82712 3015 5562147
2012 1135376 591033 262445 1058548 4300 15299 82712 3015 5562147
2013 1174412 610054 266762 1095430 4300 15299 82712 3015 5562147
2014 1213447 629074 271080 1132312 4300 15299 82712 3015 5562147
2015 1252483 648095 275397 1169193 4300 15299 82712 3015 5562147
Pakistan Census of livestock 1986-2006 (2007 to 2015 projected)
100
Human Population of Peshawar Basin 1986-2015)
Charsadda Mardan Nowshera Peshawar Peshawar Basin
SNo Year Urban Rural Urban Rural Urban Rural Urban Rural Urban Rural
1 1986 149780 596193 204192 847460 521341 483762 688768 670512 1564082 2597927
2 1987 153369 615637 211770 873919 525814 497394 713272 700994 1604226 2687944
3 1988 156959 635080 219348 900378 530287 511025 737776 731477 1644370 2777961
4 1989 160548 654523 226926 926838 534760 524657 762280 761959 1684514 2867978
5 1990 164137 673967 234504 953297 539233 538289 786784 792442 1724658 2957994
6 1991 167726 693410 242082 979757 543706 551921 811288 822924 1764802 3048011
7 1992 171316 712853 249660 1006216 548179 565552 835792 853407 1804946 3138028
8 1993 174905 732297 257238 1032675 552652 579184 860296 883889 1845090 3228045
9 1994 178494 751740 264816 1059135 557124 592816 884800 914372 1885235 3318062
10 1995 182083 771183 272394 1085594 561597 606448 909304 944854 1925379 3408079
11 1996 185673 790626 279972 1112053 566070 620079 933808 975337 1965523 3498096
12 1997 189262 810070 287550 1138513 570543 633711 958312 1005819 2005667 3588113
13 1998 192851 829513 295128 1164972 580530 647343 982816 1036302 2051325 3678130
14 1999 196921 856698 302717 1205433 580891 675372 1034775 1102762 2115304 3840265
15 2000 200990 883882 310307 1245895 586765 703401 1086735 1169221 2184797 4002399
16 2001 205060 911067 317896 1286356 592640 731429 1138694 1235681 2254290 4164534
17 2002 209130 938252 325485 1326817 598515 759458 1190653 1302141 2323783 4326668
18 2003 213199 965437 333075 1367278 604390 787487 1242612 1368601 2393276 4488803
19 2004 217269 992621 340664 1407740 610264 815516 1294572 1435060 2462769 4650937
20 2005 221339 1019806 348253 1448201 616139 843545 1346531 1501520 2532262 4813072
21 2006 225408 1046991 355843 1488662 622014 871573 1398490 1567980 2601755 4975206
22 2007 229478 1074176 363432 1529123 627889 899602 1450449 1634440 2671248 5137341
23 2008 233548 1101360 371021 1569585 633763 927631 1502409 1700899 2740741 5299475
24 2009 237618 1128545 378610 1610046 639638 955660 1554368 1767359 2810234 5461610
25 2010 241687 1155730 386200 1650507 645513 983688 1606327 1833819 2879727 5623744
26 2011 245757 1182915 393789 1690968 651388 1011717 1658286 1900279 2949220 5785879
27 2012 249827 1210099 401378 1731430 657262 1039746 1710246 1966738 3018713 5948013
28 2013 253896 1237284 408968 1771891 663137 1067775 1762205 2033198 3088206 6110148
29 2014 257966 1264469 416557 1812352 669012 1095804 1814164 2099658 3157699 6272282
30 2015 262036 1291654 424146 1852813 674887 1123832 1866123 2166118 3227192 6434417
101
Soil Type No of
Horizons
Texture
(USDA)
Thickness
(m)
Sand
fraction
Silt
fraction
Clay
fraction
Bulk
density
(kgdm3)
Organic
matter
(wt )
Salinity
(dsm)
Calcisols
Top soil Loam 03 39 40 21 132 07 16
Sub soil Loam 07 36 40 24 142 029 16
Cambisols
Top soil Loam 03 42 36 22 137 10 01
Sub soil Loam 07 40 35 25 139 04 01
Rock
Outcrop
Top soil Loam 03 43 34 23 130 14 01
Sub soil Clay
loam 07 42 30 28 137 03 07
Harmonized World Soil Database
Soil Type No of
Horizons
Texture
(USDA)
Thickness
(m)
Soil Water Stoniness
() PWP FC SAT Ksat
(Volume ) mmday
Calcisols
Top soil Loam 03 135 267 46 1965 4
Sub soil Loam 07 15 287 411 1315 3
Cambisols
Top soil Loam 03 14 27 423 100 9
Sub soil Loam 07 153 281 411 116 12
Rock Outcrop
Top soil Loam 03 147 276 43 1512 26
Sub soil Clay
loam 07 171 293 413 437 3
102
Grey Water footprint and Water Pollution Level of N and P loads in Peshawar Basin (1986-2015)
Year Population
(millions)
Annual Runoff
(million m3y)
GWF-N
(million m3y) WPL-N
GWF-P
(million m3y) WPL-P
1986 4 26585 2867 11 41624 157
1987 4 28351 2967 10 36033 127
1988 4 31914 2938 9 31884 100
1989 5 24945 2967 12 34148 137
1990 5 31000 3254 10 37083 120
1991 5 44750 3518 8 40675 91
1992 5 43867 3352 8 40814 93
1993 5 30716 2926 10 36074 117
1994 5 29455 4053 14 40565 138
1995 5 31504 3860 12 36100 115
1996 5 28414 3854 14 32184 113
1997 6 27972 4017 14 39545 141
1998 6 33775 3940 12 41842 124
1999 6 23778 4421 19 45232 190
2000 6 15232 4485 29 49638 326
2001 6 15579 5016 32 47025 302
2002 7 20435 5439 27 47955 235
2003 7 27689 5285 19 65741 237
2004 7 21665 5681 26 52744 243
2005 7 38442 6343 17 50962 133
2006 8 25229 5464 22 74868 297
2007 8 32987 6699 20 59382 180
2008 8 24440 7222 30 69373 284
2009 8 30054 8202 27 76932 256
2010 9 35888 6867 19 65069 181
2011 9 25355 7223 28 57912 228
2012 9 25891 7113 27 64804 250
2013 9 33933 6516 19 70282 207
2014 9 31410 6785 22 81553 260
2015 10 34973 5542 16 61587 176
103
104
105
106
107
108
Table-00 Annual water footprint of crops in Peshawar Basin during 1986-2015 (million m3)
Wheat Sugar Cane Maize Sugar Beet Rice Tobacco Barley
Year Blue Green Blue Green Blue Green Blue Green Blue Green Blue Green Blue Green
1986 527 563 665 259 556 279 60 18 18 10 94 81 18 21
1987 589 432 712 298 801 234 46 11 17 8 100 106 18 18
1988 665 385 762 262 714 256 45 7 17 10 101 85 19 19
1989 466 347 702 300 618 200 19 5 15 8 43 31 18 19
1990 499 449 666 343 635 221 18 6 13 7 42 37 19 21
1991 486 439 667 325 618 236 48 14 13 7 65 68 16 19
1992 478 413 657 311 633 224 61 18 14 8 81 77 18 19
1993 492 356 590 330 662 240 57 14 13 7 66 62 16 17
1994 495 432 625 334 583 252 53 17 13 9 55 50 17 17
1995 490 373 687 315 600 241 58 13 12 8 49 50 17 18
1996 550 404 689 304 642 230 48 13 12 7 55 47 19 15
1997 492 458 619 338 610 198 42 13 12 7 58 57 15 17
1998 442 334 708 290 587 237 39 8 13 7 61 62 14 16
1999 490 296 714 283 644 232 42 7 13 7 67 47 16 15
2000 577 261 737 302 638 246 47 6 13 8 47 32 9 6
2001 427 254 704 282 625 245 29 6 14 7 53 39 7 6
2002 417 410 579 348 579 222 18 6 13 7 36 32 6 8
2003 446 333 759 308 590 241 3 1 13 8 34 31 6 7
2004 412 426 618 326 651 219 7 2 14 8 52 42 6 8
2005 522 304 741 292 632 265 45 8 13 8 65 56 7 6
2006 374 446 599 308 639 231 38 15 13 7 47 42 6 8
2007 469 365 590 322 625 237 36 9 14 7 46 47 6 6
2008 487 443 615 307 601 261 34 11 13 8 48 47 6 6
2009 545 365 620 319 674 231 16 3 18 10 55 53 6 6
2010 621 359 527 235 486 241 17 3 15 10 48 42 5 4
2011 509 310 735 300 612 261 12 2 15 10 50 40 4 4
2012 396 462 593 331 605 224 9 3 16 9 44 40 3 4
2013 500 407 639 300 603 245 8 2 16 10 41 46 3 3
2014 461 436 574 343 632 210 6 2 19 11 49 53 3 3
2015 490 480 567 322 603 236 6 2 16 11 54 49 3 3
109
APPENDIX-F
110