Embed Size (px)
Citation preview
FINAL REPORT
VEGETATION SURVIVORSHIP MONITORING
Department of Environment, Water and Natural Resources (DEWNR)
June 2013
COOE Pty Ltd ABN 65 147 909751
P/F: +61 0(8) 8362 4282 | E: [email protected] | PO Box 591, Littlehampton SA 5250 | www.cooe.com.au

<Back of Title Page>
Vegetation Survivorship Monitoring
Prepared for: Department of Environment, Water and Natural Resources
Prepared by: COOE Pty Ltd
Level 7, 19 North Terrace Hackney, SA
PO Box 591 Littlehampton, SA 5250
+61 8 83985090, www.cooe.com.au
DOCUMENT CONTROL
Document code: DEWNR.VSM.01.01072013_VSMReport_FINAL02
Date Version Reason for change Author(s) Editor(s)
14/06/2013 Draft01 Draft-Internal Review
A.Cantin& V. Giannasi
S. Steed
17/06/2013 Final Draft Submit to Client A.Cantin& V. Giannasi
24/06/2013 Draft02 Client edits T. Te& S.
Jellinek
28/06/2013 Final Report Submit Final to
Client
A.Cantin S. Steed
04/07/2013 Final Report02 Client edits A.Cantin S. Steed
This document and the information contained within were produced by COOE solely for the use of the client identified on the cover sheet for the purpose for which it has been prepared. COOE undertakes no duty to or accepts any responsibility to any third party who may rely upon this document.
Vegetation Survivorship Monitoring
Page i 12/07/2013
Executive Summary
The Department of Environment, Water and Natural Resources (DEWNR) Coorong, Lower Lakes and Murray Mouth (CLLMM) Program is delivering a five year restoration project in the CLLMM region. As an emergency response to prolonged drought, bioremediation and
revegetation activities were initiated in 2009. In 2012, 648,000 plants were planted as part of the CLLMM Vegetation Project covering an area of 406 hectares.
To assess the restoration activities in the CLLMM region, survival assessment of a sub-
sample of the plantings is required to enable success to be tracked and inform continued delivery improvements.
COOE monitored 56 sites across the Coorong and Lower Lakes regions to estimate survivorship and assess plant health. The monitoring program also provides an independent check against reported works completed.
A transect method was used to estimate survivorship. Along a 50m length and 1m either side of the tape, plants were identified and listed as either alive or dead and a health score
assigned to alive plants. Planted areas were divided into one or more zones to signify differences in landform and soil types. Sampling units were located within each zone to allow comparison of survival across and between zone types.
Across all the sites monitored 62% (22,018 individuals) of the plants identified were recorded as alive with 38% recorded as dead (13,320 individuals). The majority of the sites
scored a survivorship of between 60-80%. Plant health was overall good with 36 sites having healthy plants.
Survivorship across the sites was affected by common issues including high levels of
grazing, inefficient planting, lack of tree guards at some sites, insufficient pre and post-planting site management and off-target herbicide spraying. The highest contributing factor that could be observed to plant deaths was from pest impacts. The most likely grazers on
the seedlings included rabbits and kangaroos, based on scat observations at the sites.
A large proportion (81 species) of the 121 species identified recorded over 80%
survivorship. Some of the most notable species within this category included Acacia spp., Eucalyptus spp., Allocasuarina spp., Enchylaena tomentosa and sedges. Fourteen species recorded very low survivorship (<20%) and included Puccinellia stricta, Lasiopetalum baueri, Enneapogon nigricans and mostly unknown species.
Several recommendations are provided to assist in the survivorship of future plantings. The
primary recommendations include the use of tree guards, pest and weed control, possible use of strategic fencing and ongoing monitoring for new plants.
Vegetation Survivorship Monitoring
Page ii 12/07/2013
Acknowledgements
COOE would like to acknowledge the Department of Environment, Water and Natural Resources for support and comments on the draft final report.
COOE would like to acknowledge all participating landowners and the Hindmarsh Island
Landcare group for access to private land for site visits and monitoring.
Acknowledgments to GWLAP for assistance with site access and providing species identification resources of the 2012 plantings.
Vegetation Survivorship Monitoring
Page iii 12/07/2013
Table of Contents
1 Introduction ...................................................................................................... 1
1.1 Objectives ..........................................................................................................1
2 Methods ............................................................................................................. 1
2.1 Study Sites .........................................................................................................1
2.2 Vegetation Survival .............................................................................................5
2.3 Plant Health .......................................................................................................6
2.4 Data Analysis......................................................................................................6
3 Results ............................................................................................................... 6
3.1 Overall Results ...................................................................................................6
3.2 Survivorship of each species ................................................................................9
3.3 Plant Survivorship per Site and Zone ................................................................... 25
4 Discussion and Recommendations.................................................................. 82
5 Conclusion ....................................................................................................... 83
List of Tables
Table 1 Summary of zones identified within the region ................................................5
Table 2 Plant Health Scoring .....................................................................................6
Table 3 Overall vegetation survivorship across all sites.................................................7
Table 4 Summary of number of sites for each category of overall survivorship ...............9
Table 5 Summary of plant health across all sites monitored ..........................................9
Table 6 Summary of number of species for each category of overall survivorship ......... 10
Table 7 Plant survivorship for each species identified ................................................. 10
Table 8 Summary of number of species for each category of overall survivorship ......... 13
Table 9 Overall plant health of species identified ....................................................... 13
Table 10 Overall summary of plant survivorship per zone. ............................................ 14
Table 11 Plant survivorship within each zone for each species identified. ....................... 14

Vegetation Survivorship Monitoring
Page iv 12/07/2013
List of Figures
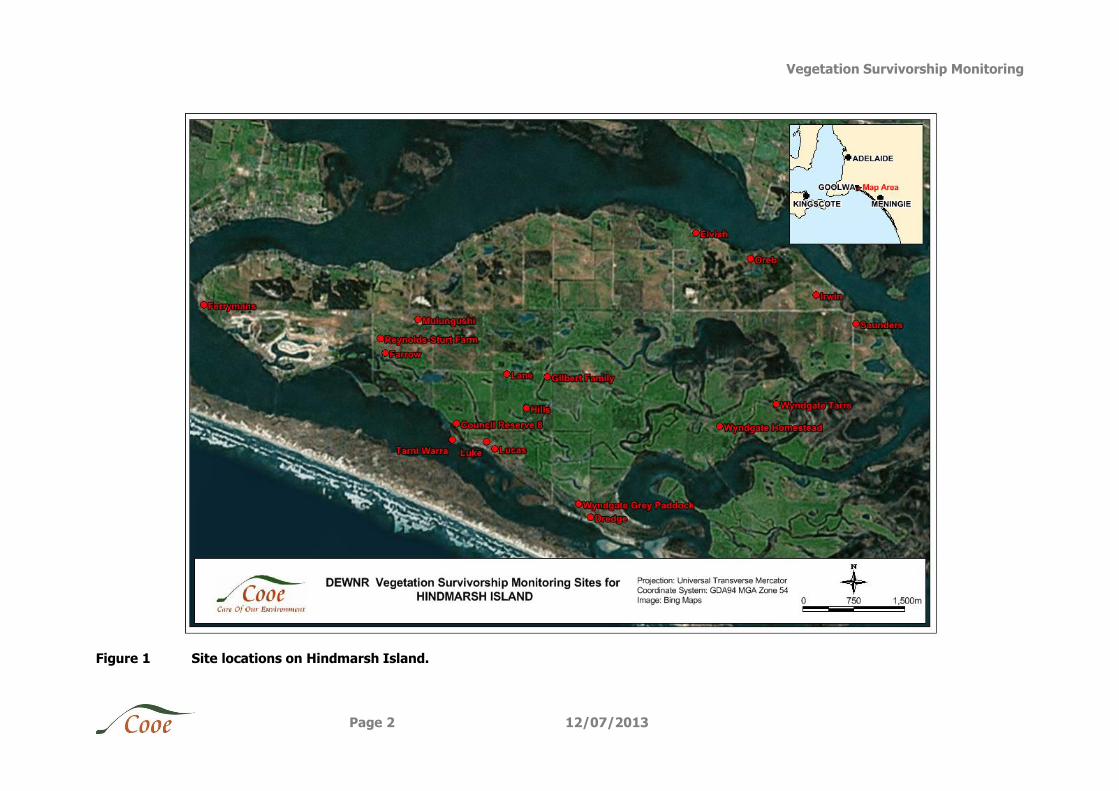
Figure 1 Site locations on Hindmarsh Island. ............................................................2
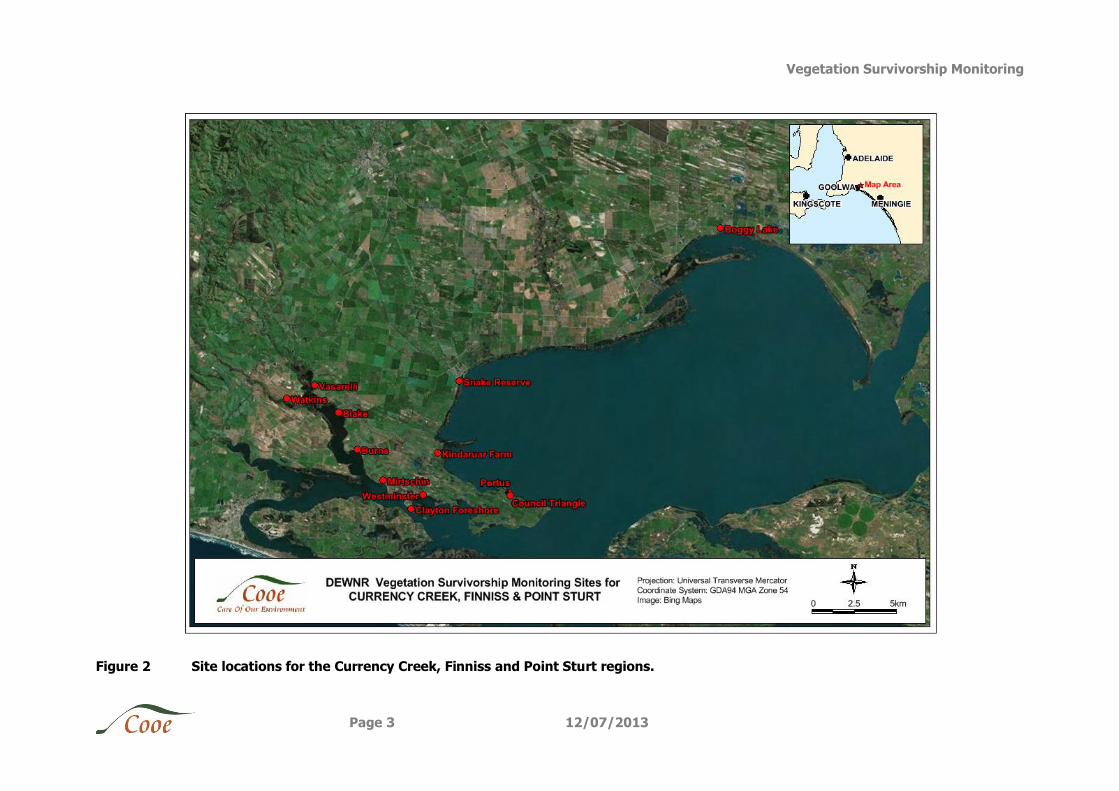
Figure 2 Site locations for the Currency Creek, Finniss and Point Sturt regions. ...............3
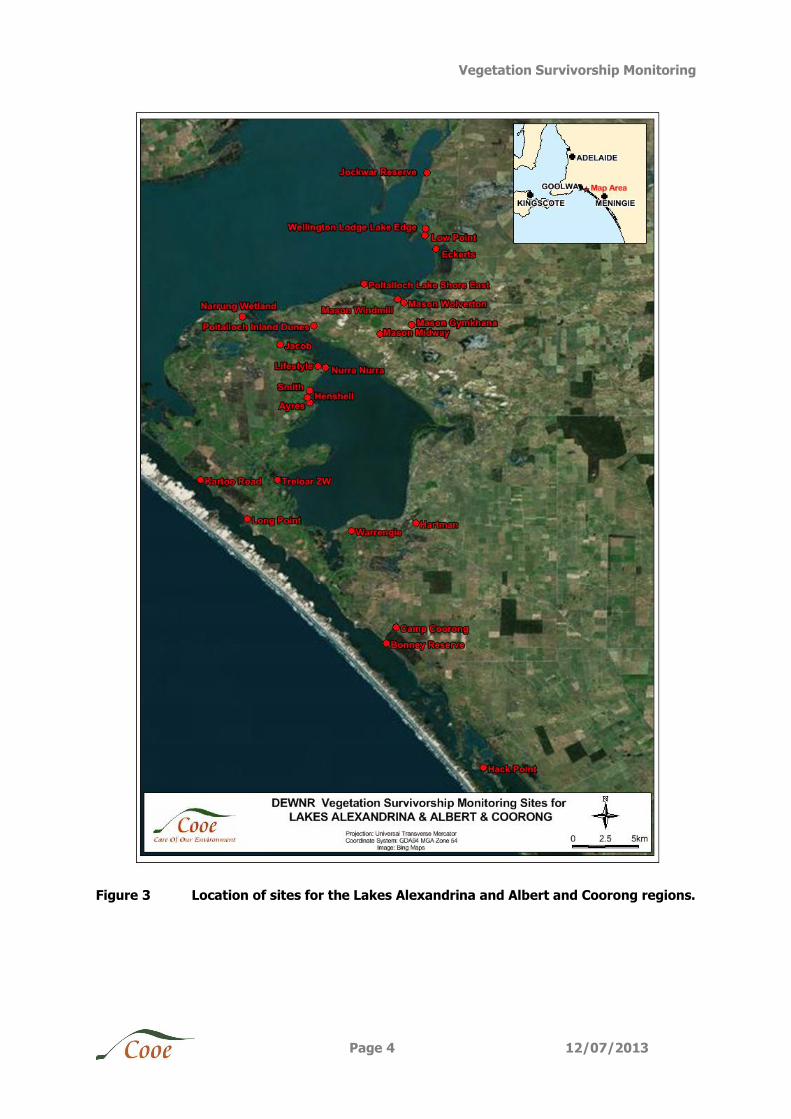
Figure 3 Location of sites for the Lakes Alexandrina and Albert and Coorong regions. ......4
List of Appendices
Appendix A Photographs of plant condition and survivorship issues ............................... 84
List of Plates
Plate 1 Results of no tree guards and grazing pressure on Allocasuarinaverticillata at
Bonney Reserve. ........................................................................................ 84
Plate 2 Ineffective planting at Camp Coorong. .......................................................... 84
Plate 3 Ineffective planting at Camp Coorong. .......................................................... 85
Plate 4 Extra tree guards to provide protection from grazing at Lifestyles .................... 85
Plate 5 Exotic grass species out competing natives at Blake Community...................... 86
Plate 6 Dye from herbicide spraying on biodegradable guards at Eckert ...................... 86
Plate 7 Spray drift at Mirtschin ................................................................................ 87
Vegetation Survivorship Monitoring
Page 1 12/07/2013
1 Introduction
The Department of Environment, Water and Natural Resources (DEWNR) Coorong, Lower Lakes and Murray Mouth (CLLMM) Program is delivering a five year restoration project in the CLLMM region. As an emergency response to prolonged drought, bioremediation and
revegetation activities were initiated in 2009. In 2012, 648,000 plants were planted as part of the CLLMM Vegetation Project covering an area of 406 hectares.
To assess the restoration activities in the CLLMM region, survival assessment of a sub-
sample of the plantings is required to enable success to be tracked and inform continued delivery improvements.
1.1 Objectives
The specific objectives of the project are to:
Estimate survivorship of the planting at 56 revegetation sites
Compare the survivorship of plant species surveyed across all sites
Provide an indication of the plant health of the surviving species
Provide an independent check against reported works completed.
Provide recommendations on any follow up management works required and improvements to future planting seasons.
2 Methods
2.1 Study Sites
The 2013 vegetation survivorship monitoring included a total of 56 sites. Sites can be grouped into three regions with 19Hindmarsh Island sites (Figure 1), 12Currency Creek, Finniss and Point Sturt sites (Figure 2) and 25 Lakes Alexandrina and Albert and Coorong
sites (Figure 3).
Vegetation Survivorship Monitoring
Page 2 12/07/2013
Figure 1 Site locations on Hindmarsh Island.
Vegetation Survivorship Monitoring
Page 3 12/07/2013
Figure 2 Site locations for the Currency Creek, Finniss and Point Sturt regions.
Vegetation Survivorship Monitoring
Page 4 12/07/2013
Figure 3 Location of sites for the Lakes Alexandrina and Albert and Coorong regions.
Vegetation Survivorship Monitoring
Page 5 12/07/2013
2.2 Vegetation Survival
The 2013 plant survivorship was calculated using a transect method with starting points
randomly generated to reduce site selection biases. Data collection involved surveyors identifying plants to species level and listing if the plants were alive or dead. A small number
of juvenile plants were not possible to ID to species level and were identified by genus (i.e. Acacia sp. 1). Similarly, some grass species lacked distinguishing characteristics for identification hence were identified as Sedge sp. Where it was not possible to identify dead
plants, “unknown species” was marked. Where a stake was present but no plant visible this was also marked as “unknown species”.
GPS waypoints, randomly allocated for each zone within each site, was used as the starting point of a transect. If the waypoint ended up in a location where no plantings were found within a 50m radius or within the wrong zone, a new location was allocated where possible.
At the waypoint, an assessment of the site was undertaken to identify the most appropriate direction to run the transect allowing sufficient space, within the same zone, to lay a 50m transect without crossing another transect. The basic sampling unit included two 1 x 50m
transects (which equated to one transect). All individual plants one metre to the left and right of the transect were tallied into columns of alive or dead.
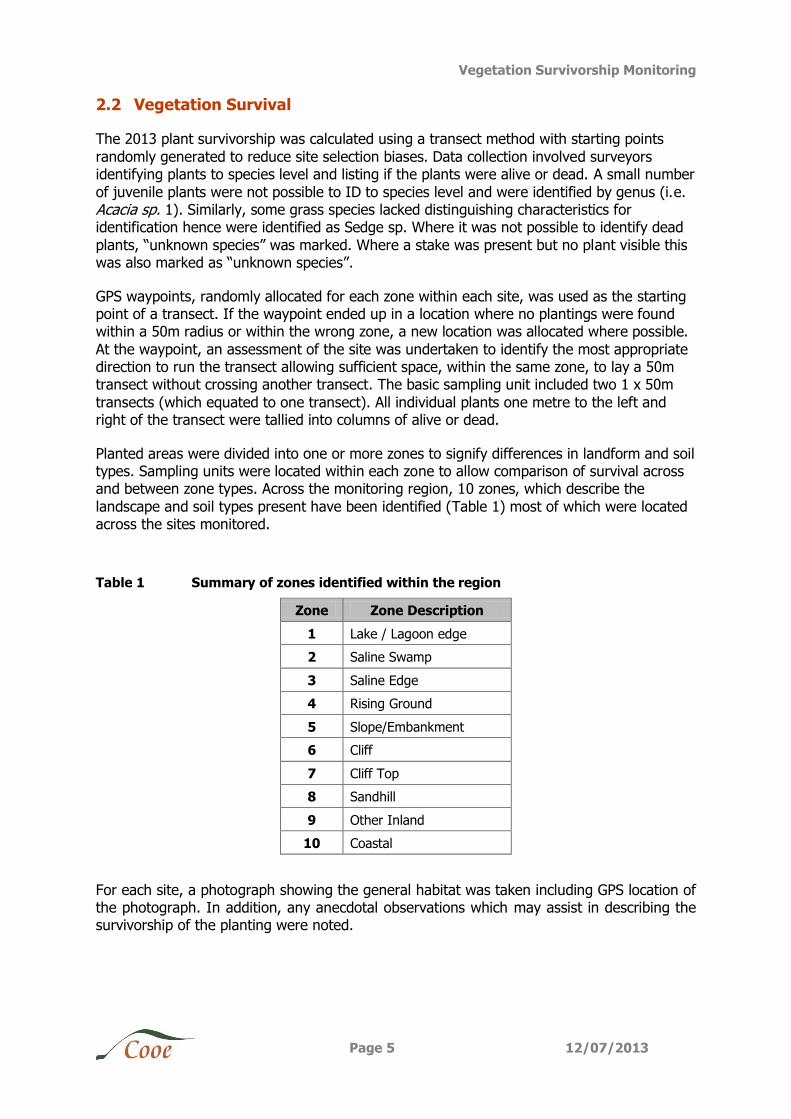
Planted areas were divided into one or more zones to signify differences in landform and soil types. Sampling units were located within each zone to allow comparison of survival across and between zone types. Across the monitoring region, 10 zones, which describe the
landscape and soil types present have been identified (Table 1) most of which were located across the sites monitored.
Table 1 Summary of zones identified within the region
Zone Zone Description
1 Lake / Lagoon edge
2 Saline Swamp
3 Saline Edge
4 Rising Ground
5 Slope/Embankment
6 Cliff
7 Cliff Top
8 Sandhill
9 Other Inland
10 Coastal
For each site, a photograph showing the general habitat was taken including GPS location of the photograph. In addition, any anecdotal observations which may assist in describing the survivorship of the planting were noted.
Vegetation Survivorship Monitoring
Page 6 12/07/2013
2.3 Plant Health
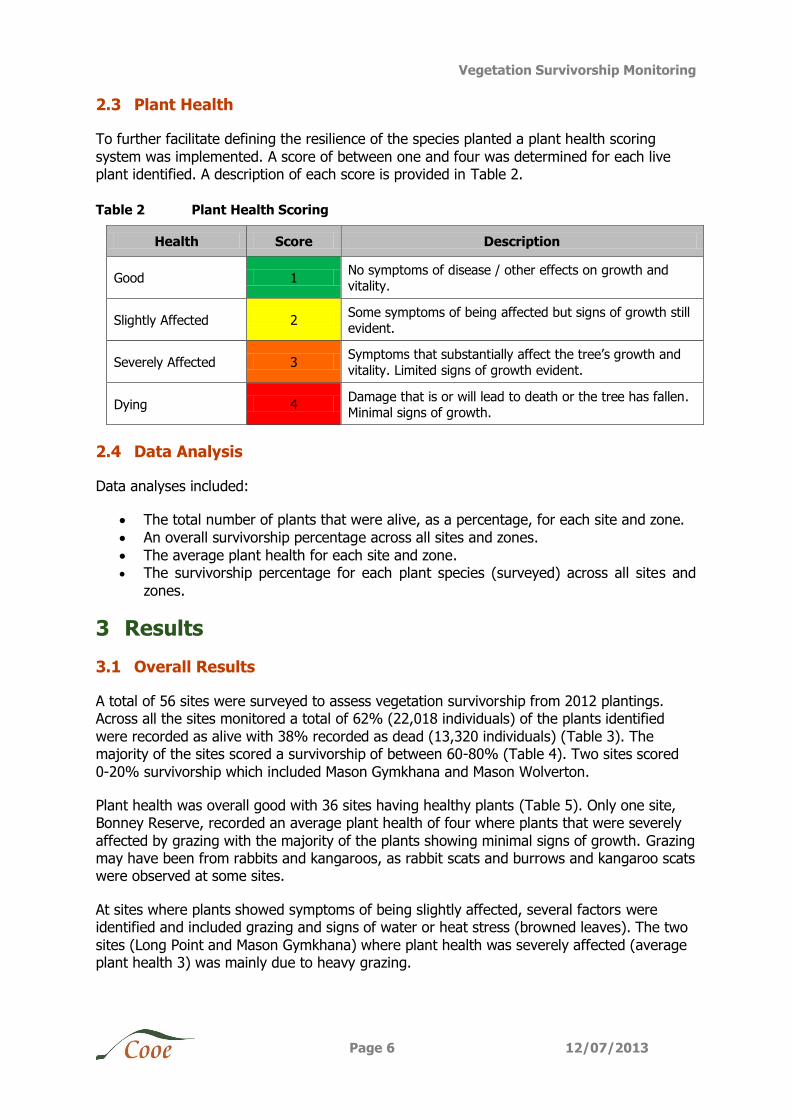
To further facilitate defining the resilience of the species planted a plant health scoring
system was implemented. A score of between one and four was determined for each live plant identified. A description of each score is provided in Table 2.
Table 2 Plant Health Scoring
Health Score Description
Good 1 No symptoms of disease / other effects on growth and vitality.
Slightly Affected 2 Some symptoms of being affected but signs of growth still evident.
Severely Affected 3 Symptoms that substantially affect the tree’s growth and vitality. Limited signs of growth evident.
Dying 4 Damage that is or will lead to death or the tree has fallen. Minimal signs of growth.
2.4 Data Analysis
Data analyses included:
The total number of plants that were alive, as a percentage, for each site and zone.
An overall survivorship percentage across all sites and zones.
The average plant health for each site and zone. The survivorship percentage for each plant species (surveyed) across all sites and
zones.
3 Results
3.1 Overall Results
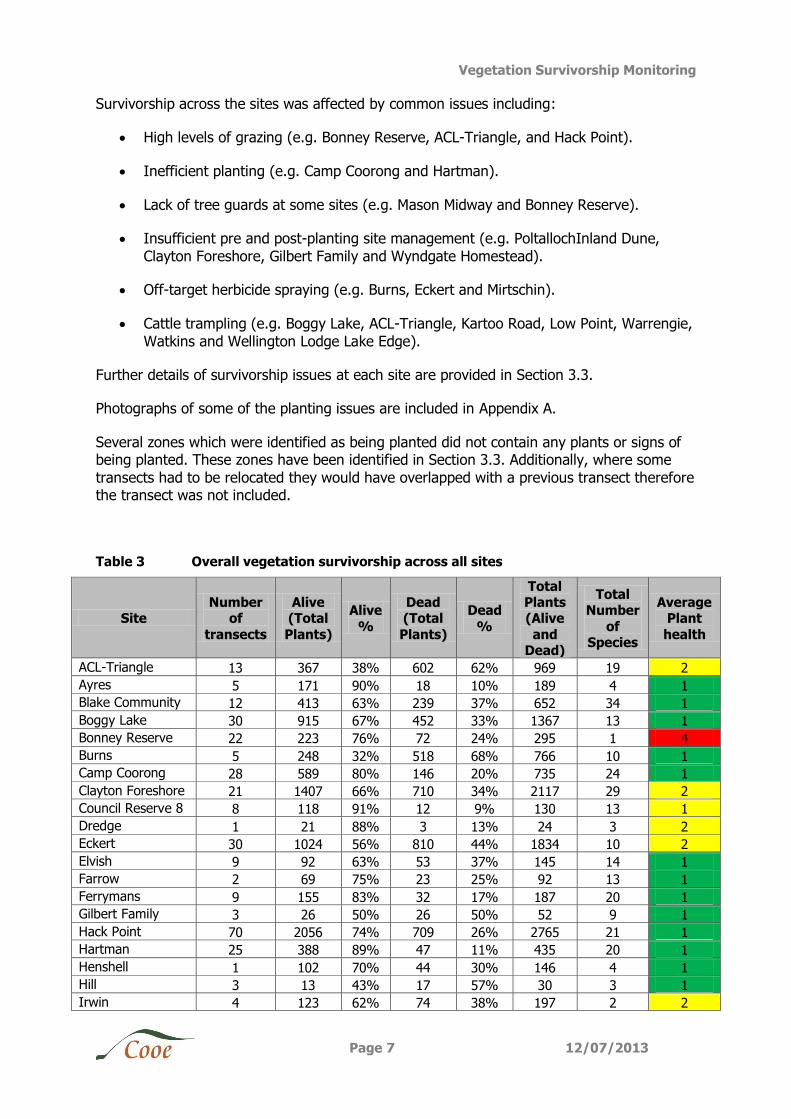
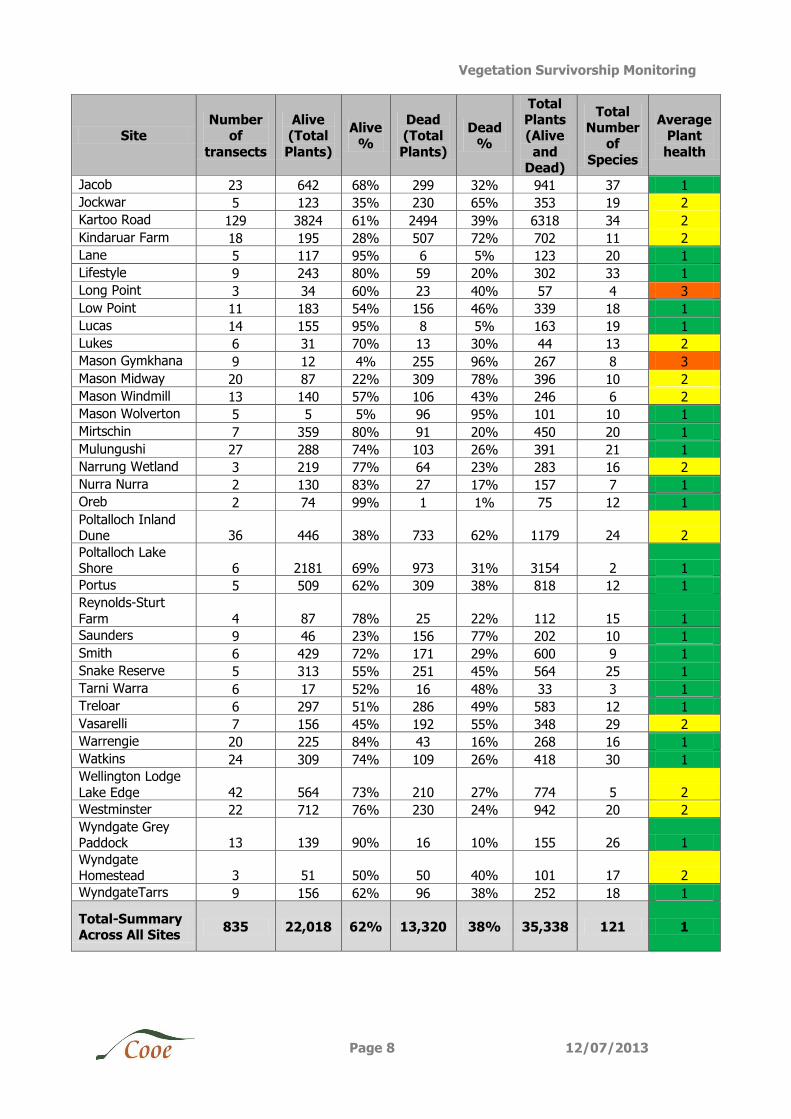
A total of 56 sites were surveyed to assess vegetation survivorship from 2012 plantings. Across all the sites monitored a total of 62% (22,018 individuals) of the plants identified
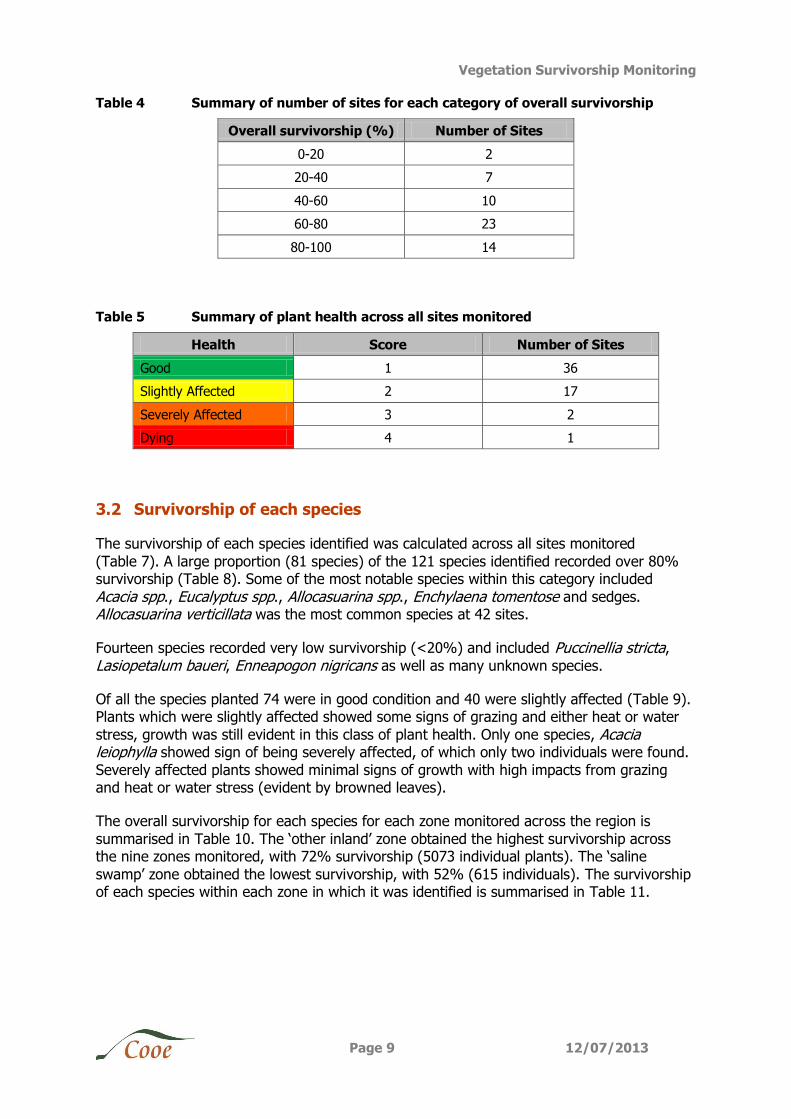
were recorded as alive with 38% recorded as dead (13,320 individuals) (Table 3). The majority of the sites scored a survivorship of between 60-80% (Table 4). Two sites scored
0-20% survivorship which included Mason Gymkhana and Mason Wolverton.
Plant health was overall good with 36 sites having healthy plants (Table 5). Only one site, Bonney Reserve, recorded an average plant health of four where plants that were severely
affected by grazing with the majority of the plants showing minimal signs of growth. Grazing may have been from rabbits and kangaroos, as rabbit scats and burrows and kangaroo scats were observed at some sites.
At sites where plants showed symptoms of being slightly affected, several factors were identified and included grazing and signs of water or heat stress (browned leaves). The two
sites (Long Point and Mason Gymkhana) where plant health was severely affected (average plant health 3) was mainly due to heavy grazing.
Vegetation Survivorship Monitoring
Page 7 12/07/2013
Survivorship across the sites was affected by common issues including:
High levels of grazing (e.g. Bonney Reserve, ACL-Triangle, and Hack Point).
Inefficient planting (e.g. Camp Coorong and Hartman).
Lack of tree guards at some sites (e.g. Mason Midway and Bonney Reserve).
Insufficient pre and post-planting site management (e.g. PoltallochInland Dune,
Clayton Foreshore, Gilbert Family and Wyndgate Homestead).
Off-target herbicide spraying (e.g. Burns, Eckert and Mirtschin).
Cattle trampling (e.g. Boggy Lake, ACL-Triangle, Kartoo Road, Low Point, Warrengie,
Watkins and Wellington Lodge Lake Edge).
Further details of survivorship issues at each site are provided in Section 3.3.
Photographs of some of the planting issues are included in Appendix A.
Several zones which were identified as being planted did not contain any plants or signs of being planted. These zones have been identified in Section 3.3. Additionally, where some
transects had to be relocated they would have overlapped with a previous transect therefore the transect was not included.
Table 3 Overall vegetation survivorship across all sites
Site Number
of
transects
Alive (Total
Plants)
Alive
%
Dead (Total
Plants)
Dead
%
Total Plants (Alive
and Dead)
Total Number
of Species
Average Plant
health
ACL-Triangle 13 367 38% 602 62% 969 19 2
Ayres 5 171 90% 18 10% 189 4 1
Blake Community 12 413 63% 239 37% 652 34 1
Boggy Lake 30 915 67% 452 33% 1367 13 1
Bonney Reserve 22 223 76% 72 24% 295 1 4
Burns 5 248 32% 518 68% 766 10 1
Camp Coorong 28 589 80% 146 20% 735 24 1
Clayton Foreshore 21 1407 66% 710 34% 2117 29 2
Council Reserve 8 8 118 91% 12 9% 130 13 1
Dredge 1 21 88% 3 13% 24 3 2
Eckert 30 1024 56% 810 44% 1834 10 2
Elvish 9 92 63% 53 37% 145 14 1
Farrow 2 69 75% 23 25% 92 13 1
Ferrymans 9 155 83% 32 17% 187 20 1
Gilbert Family 3 26 50% 26 50% 52 9 1
Hack Point 70 2056 74% 709 26% 2765 21 1
Hartman 25 388 89% 47 11% 435 20 1
Henshell 1 102 70% 44 30% 146 4 1
Hill 3 13 43% 17 57% 30 3 1
Irwin 4 123 62% 74 38% 197 2 2
Vegetation Survivorship Monitoring
Page 8 12/07/2013
Site Number
of
transects
Alive (Total
Plants)
Alive %
Dead (Total
Plants)
Dead %
Total Plants (Alive
and Dead)
Total Number
of
Species
Average Plant
health
Jacob 23 642 68% 299 32% 941 37 1
Jockwar 5 123 35% 230 65% 353 19 2
Kartoo Road 129 3824 61% 2494 39% 6318 34 2
Kindaruar Farm 18 195 28% 507 72% 702 11 2
Lane 5 117 95% 6 5% 123 20 1
Lifestyle 9 243 80% 59 20% 302 33 1
Long Point 3 34 60% 23 40% 57 4 3
Low Point 11 183 54% 156 46% 339 18 1
Lucas 14 155 95% 8 5% 163 19 1
Lukes 6 31 70% 13 30% 44 13 2
Mason Gymkhana 9 12 4% 255 96% 267 8 3
Mason Midway 20 87 22% 309 78% 396 10 2
Mason Windmill 13 140 57% 106 43% 246 6 2
Mason Wolverton 5 5 5% 96 95% 101 10 1
Mirtschin 7 359 80% 91 20% 450 20 1
Mulungushi 27 288 74% 103 26% 391 21 1
Narrung Wetland 3 219 77% 64 23% 283 16 2
Nurra Nurra 2 130 83% 27 17% 157 7 1
Oreb 2 74 99% 1 1% 75 12 1
Poltalloch Inland Dune 36 446 38% 733 62% 1179 24 2
Poltalloch Lake Shore 6 2181 69% 973 31% 3154 2 1
Portus 5 509 62% 309 38% 818 12 1
Reynolds-Sturt
Farm 4 87 78% 25 22% 112 15 1
Saunders 9 46 23% 156 77% 202 10 1
Smith 6 429 72% 171 29% 600 9 1
Snake Reserve 5 313 55% 251 45% 564 25 1
Tarni Warra 6 17 52% 16 48% 33 3 1
Treloar 6 297 51% 286 49% 583 12 1
Vasarelli 7 156 45% 192 55% 348 29 2
Warrengie 20 225 84% 43 16% 268 16 1
Watkins 24 309 74% 109 26% 418 30 1
Wellington Lodge
Lake Edge 42 564 73% 210 27% 774 5 2
Westminster 22 712 76% 230 24% 942 20 2
Wyndgate Grey Paddock 13 139 90% 16 10% 155 26 1
Wyndgate Homestead 3 51 50% 50 40% 101 17 2
WyndgateTarrs 9 156 62% 96 38% 252 18 1
Total-Summary Across All Sites
835 22,018 62% 13,320 38% 35,338 121 1
Vegetation Survivorship Monitoring
Page 9 12/07/2013
Table 4 Summary of number of sites for each category of overall survivorship
Overall survivorship (%) Number of Sites
0-20 2
20-40 7
40-60 10
60-80 23
80-100 14
Table 5 Summary of plant health across all sites monitored
Health Score Number of Sites
Good 1 36
Slightly Affected 2 17
Severely Affected 3 2
Dying 4 1
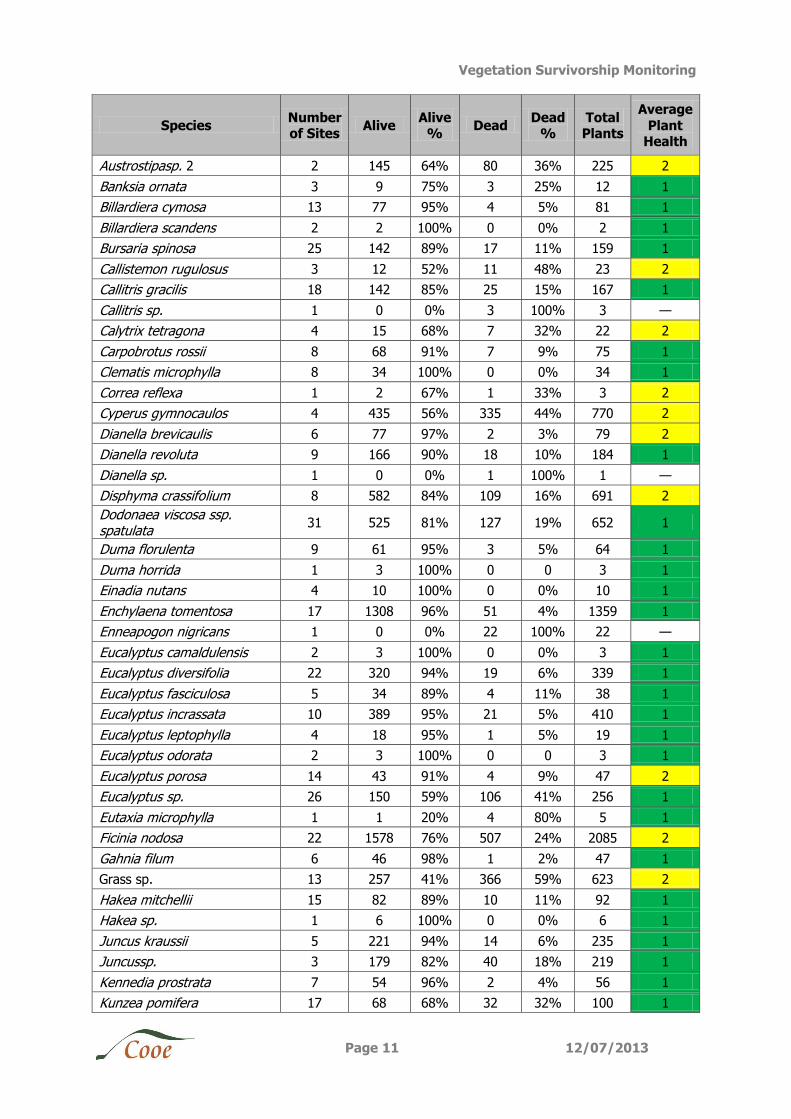
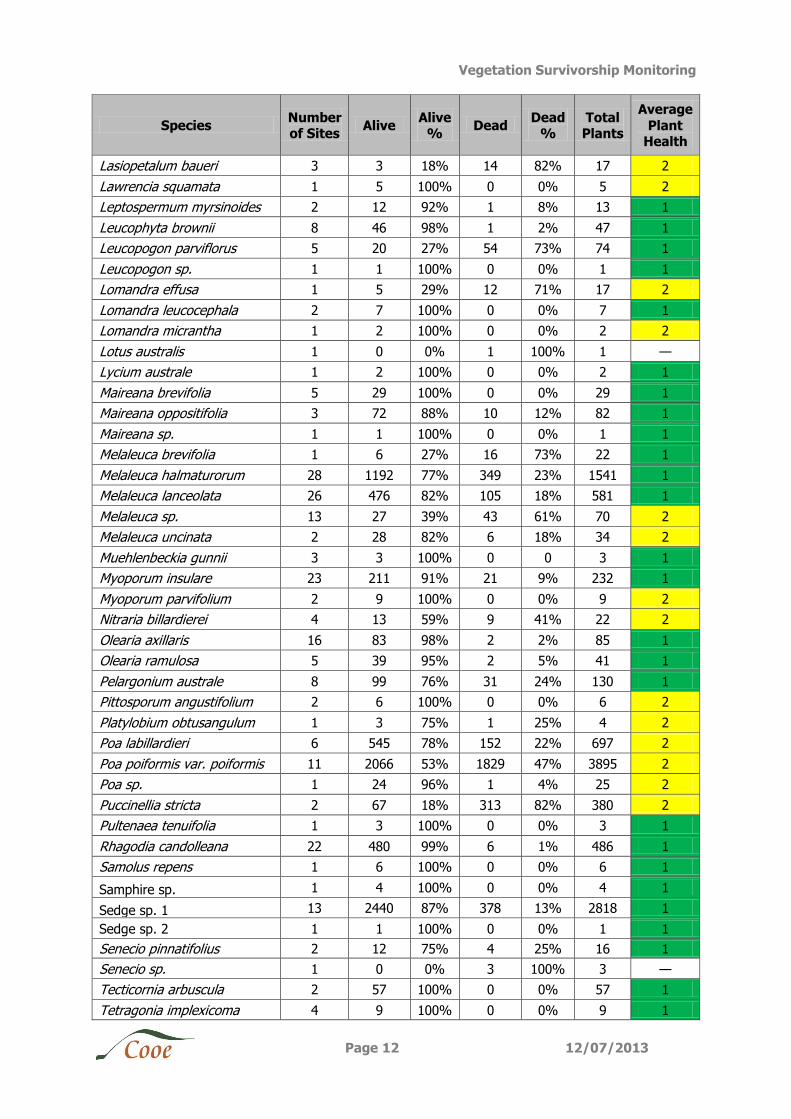
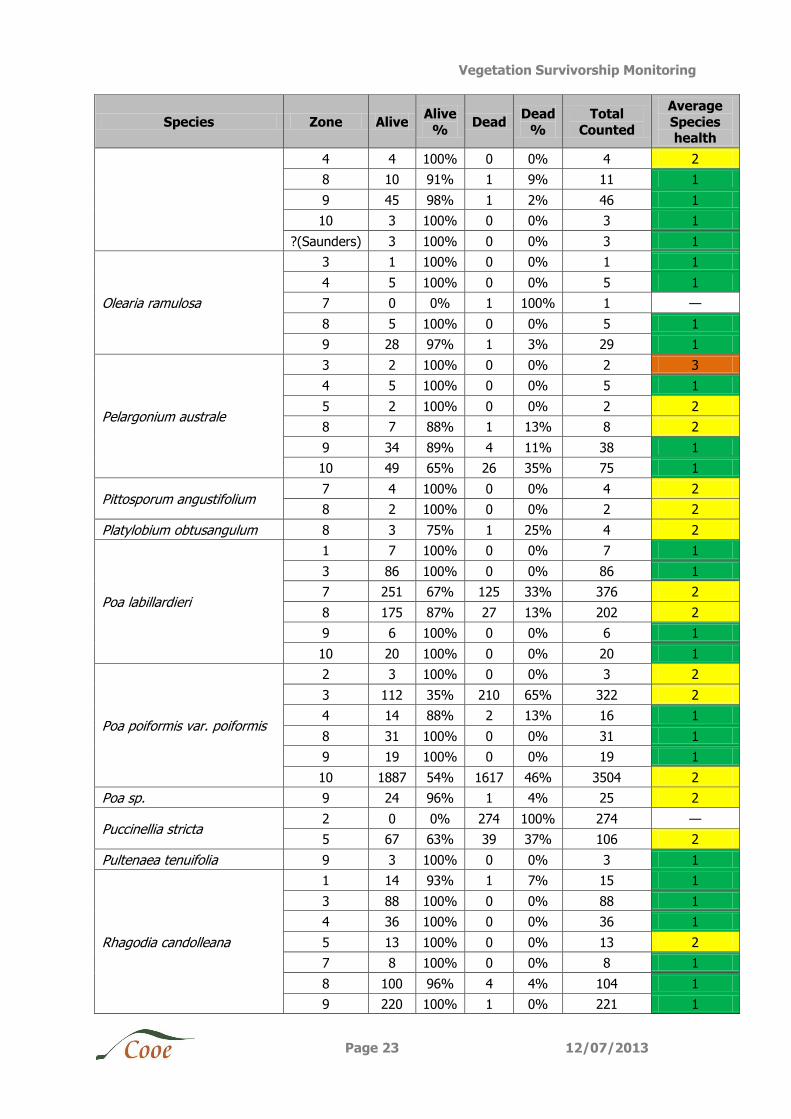
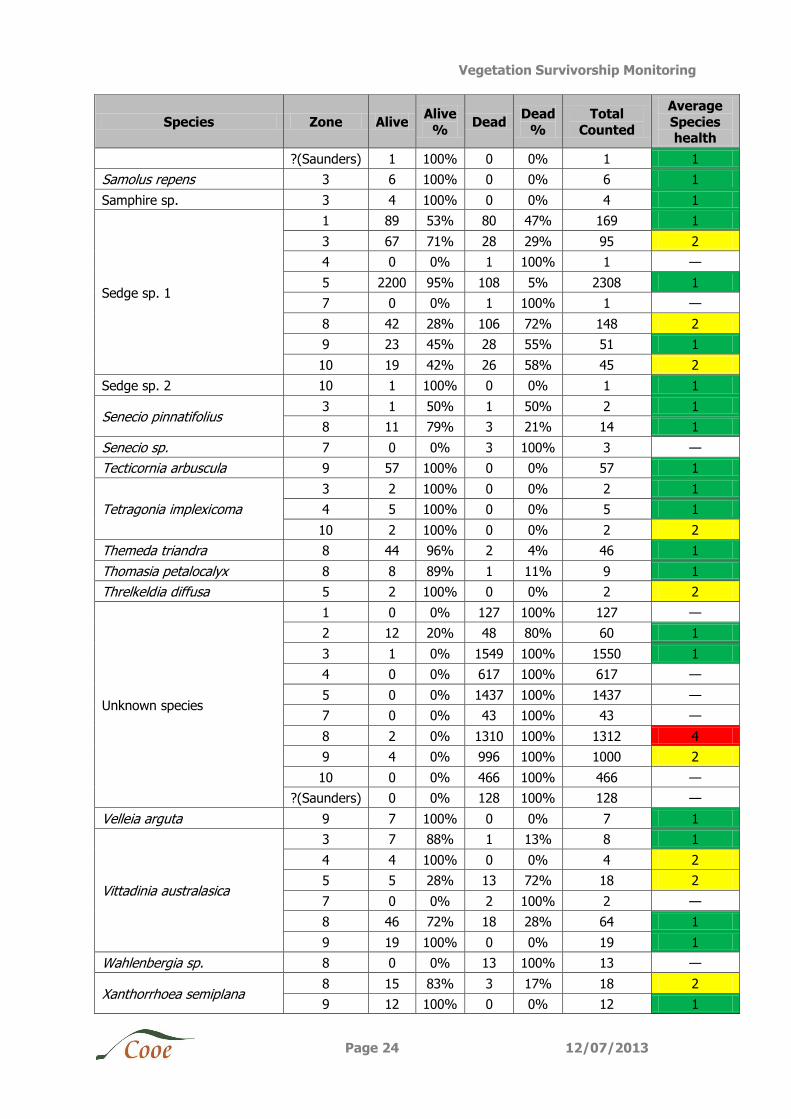
3.2 Survivorship of each species
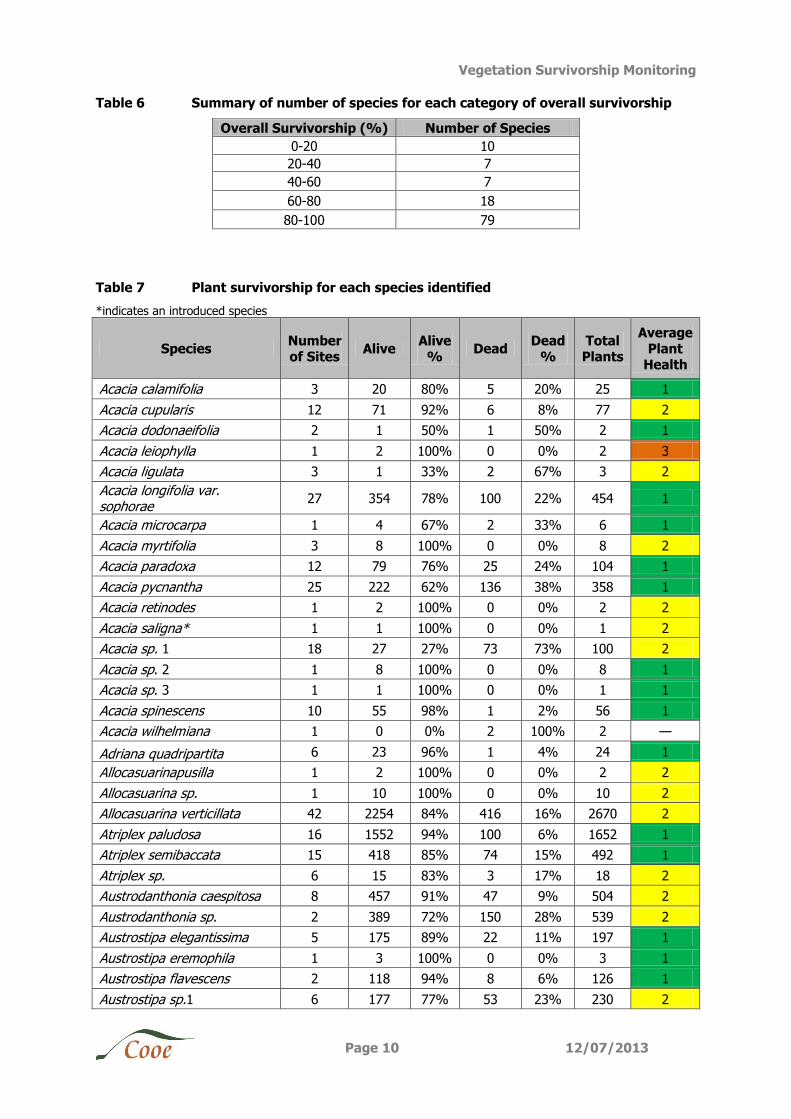
The survivorship of each species identified was calculated across all sites monitored
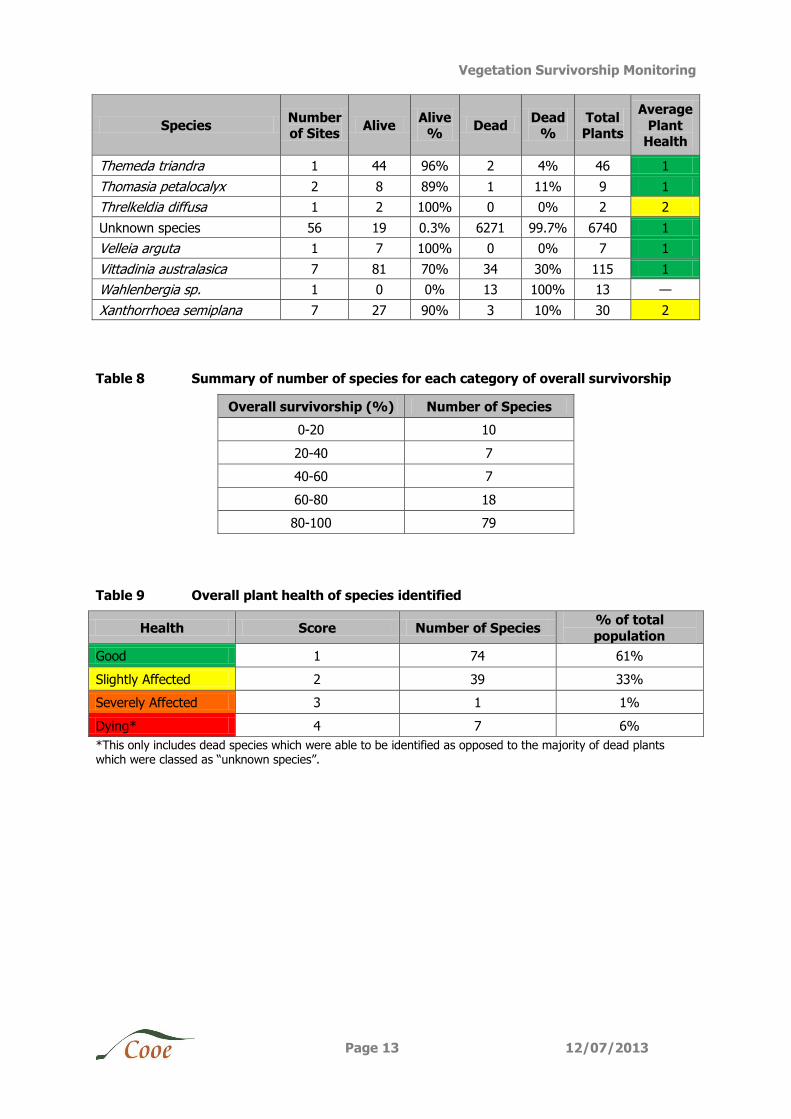
(Table 7). A large proportion (81 species) of the 121 species identified recorded over 80% survivorship (Table 8). Some of the most notable species within this category included
Acacia spp., Eucalyptus spp., Allocasuarina spp., Enchylaena tomentose and sedges. Allocasuarina verticillata was the most common species at 42 sites.
Fourteen species recorded very low survivorship (<20%) and included Puccinellia stricta,
Lasiopetalum baueri, Enneapogon nigricans as well as many unknown species.
Of all the species planted 74 were in good condition and 40 were slightly affected (Table 9). Plants which were slightly affected showed some signs of grazing and either heat or water
stress, growth was still evident in this class of plant health. Only one species, Acacia leiophylla showed sign of being severely affected, of which only two individuals were found.
Severely affected plants showed minimal signs of growth with high impacts from grazing and heat or water stress (evident by browned leaves).
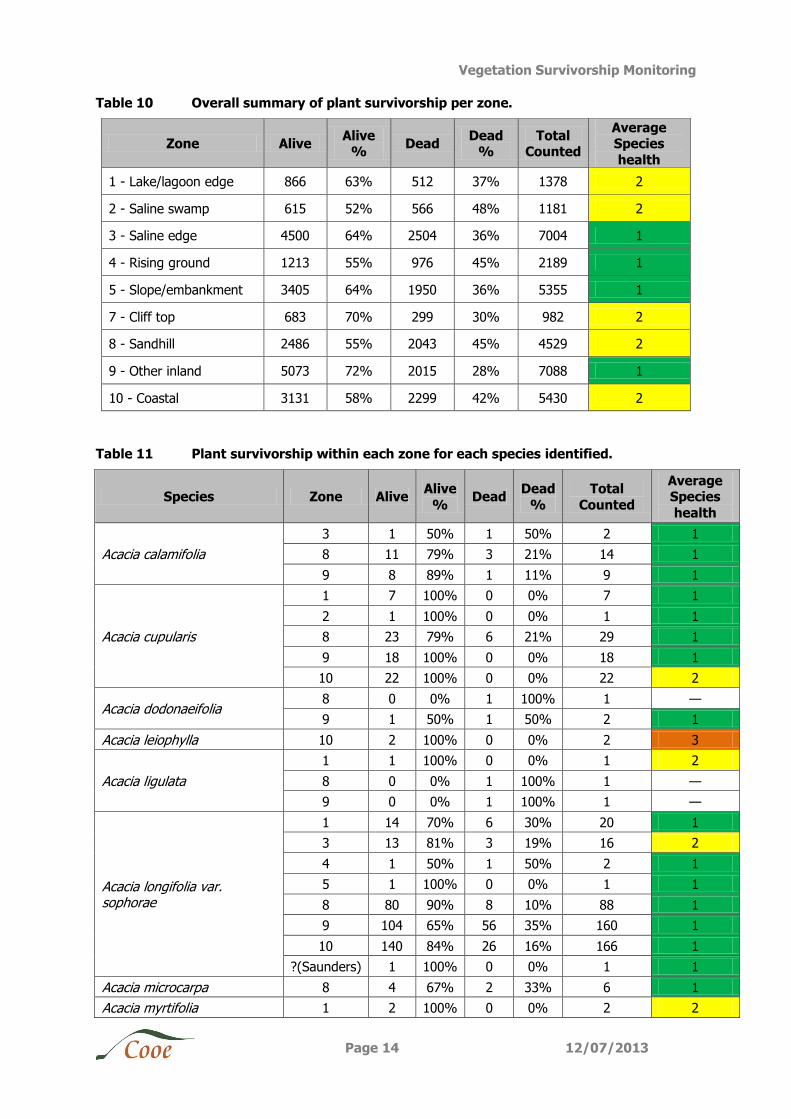
The overall survivorship for each species for each zone monitored across the region is
summarised in Table 10. The ‘other inland’ zone obtained the highest survivorship across the nine zones monitored, with 72% survivorship (5073 individual plants). The ‘saline
swamp’ zone obtained the lowest survivorship, with 52% (615 individuals). The survivorship of each species within each zone in which it was identified is summarised in Table 11.
Vegetation Survivorship Monitoring
Page 10 12/07/2013
Table 6 Summary of number of species for each category of overall survivorship
Overall Survivorship (%) Number of Species
0-20 10
20-40 7
40-60 7
60-80 18
80-100 79
Table 7 Plant survivorship for each species identified
*indicates an introduced species
Species Number of Sites
Alive Alive
% Dead
Dead %
Total Plants
Average Plant
Health
Acacia calamifolia 3 20 80% 5 20% 25 1
Acacia cupularis 12 71 92% 6 8% 77 2
Acacia dodonaeifolia 2 1 50% 1 50% 2 1
Acacia leiophylla 1 2 100% 0 0% 2 3
Acacia ligulata 3 1 33% 2 67% 3 2
Acacia longifolia var. sophorae
27 354 78% 100 22% 454 1
Acacia microcarpa 1 4 67% 2 33% 6 1
Acacia myrtifolia 3 8 100% 0 0% 8 2
Acacia paradoxa 12 79 76% 25 24% 104 1
Acacia pycnantha 25 222 62% 136 38% 358 1
Acacia retinodes 1 2 100% 0 0% 2 2
Acacia saligna* 1 1 100% 0 0% 1 2
Acacia sp. 1 18 27 27% 73 73% 100 2
Acacia sp. 2 1 8 100% 0 0% 8 1
Acacia sp. 3 1 1 100% 0 0% 1 1
Acacia spinescens 10 55 98% 1 2% 56 1
Acacia wilhelmiana 1 0 0% 2 100% 2 —
Adriana quadripartita 6 23 96% 1 4% 24 1
Allocasuarinapusilla 1 2 100% 0 0% 2 2
Allocasuarina sp. 1 10 100% 0 0% 10 2
Allocasuarina verticillata 42 2254 84% 416 16% 2670 2
Atriplex paludosa 16 1552 94% 100 6% 1652 1
Atriplex semibaccata 15 418 85% 74 15% 492 1
Atriplex sp. 6 15 83% 3 17% 18 2
Austrodanthonia caespitosa 8 457 91% 47 9% 504 2
Austrodanthonia sp. 2 389 72% 150 28% 539 2
Austrostipa elegantissima 5 175 89% 22 11% 197 1
Austrostipa eremophila 1 3 100% 0 0% 3 1
Austrostipa flavescens 2 118 94% 8 6% 126 1
Austrostipa sp.1 6 177 77% 53 23% 230 2
Vegetation Survivorship Monitoring
Page 11 12/07/2013
Species Number of Sites
Alive Alive
% Dead
Dead %
Total Plants
Average
Plant Health
Austrostipasp. 2 2 145 64% 80 36% 225 2
Banksia ornata 3 9 75% 3 25% 12 1
Billardiera cymosa 13 77 95% 4 5% 81 1
Billardiera scandens 2 2 100% 0 0% 2 1
Bursaria spinosa 25 142 89% 17 11% 159 1
Callistemon rugulosus 3 12 52% 11 48% 23 2
Callitris gracilis 18 142 85% 25 15% 167 1
Callitris sp. 1 0 0% 3 100% 3 —
Calytrix tetragona 4 15 68% 7 32% 22 2
Carpobrotus rossii 8 68 91% 7 9% 75 1
Clematis microphylla 8 34 100% 0 0% 34 1
Correa reflexa 1 2 67% 1 33% 3 2
Cyperus gymnocaulos 4 435 56% 335 44% 770 2
Dianella brevicaulis 6 77 97% 2 3% 79 2
Dianella revoluta 9 166 90% 18 10% 184 1
Dianella sp. 1 0 0% 1 100% 1 —
Disphyma crassifolium 8 582 84% 109 16% 691 2
Dodonaea viscosa ssp. spatulata
31 525 81% 127 19% 652 1
Duma florulenta 9 61 95% 3 5% 64 1
Duma horrida 1 3 100% 0 0 3 1
Einadia nutans 4 10 100% 0 0% 10 1
Enchylaena tomentosa 17 1308 96% 51 4% 1359 1
Enneapogon nigricans 1 0 0% 22 100% 22 —
Eucalyptus camaldulensis 2 3 100% 0 0% 3 1
Eucalyptus diversifolia 22 320 94% 19 6% 339 1
Eucalyptus fasciculosa 5 34 89% 4 11% 38 1
Eucalyptus incrassata 10 389 95% 21 5% 410 1
Eucalyptus leptophylla 4 18 95% 1 5% 19 1
Eucalyptus odorata 2 3 100% 0 0 3 1
Eucalyptus porosa 14 43 91% 4 9% 47 2
Eucalyptus sp. 26 150 59% 106 41% 256 1
Eutaxia microphylla 1 1 20% 4 80% 5 1
Ficinia nodosa 22 1578 76% 507 24% 2085 2
Gahnia filum 6 46 98% 1 2% 47 1
Grass sp. 13 257 41% 366 59% 623 2
Hakea mitchellii 15 82 89% 10 11% 92 1
Hakea sp. 1 6 100% 0 0% 6 1
Juncus kraussii 5 221 94% 14 6% 235 1
Juncussp. 3 179 82% 40 18% 219 1
Kennedia prostrata 7 54 96% 2 4% 56 1
Kunzea pomifera 17 68 68% 32 32% 100 1
Vegetation Survivorship Monitoring
Page 12 12/07/2013
Species Number of Sites
Alive Alive
% Dead
Dead %
Total Plants
Average
Plant Health
Lasiopetalum baueri 3 3 18% 14 82% 17 2
Lawrencia squamata 1 5 100% 0 0% 5 2
Leptospermum myrsinoides 2 12 92% 1 8% 13 1
Leucophyta brownii 8 46 98% 1 2% 47 1
Leucopogon parviflorus 5 20 27% 54 73% 74 1
Leucopogon sp. 1 1 100% 0 0% 1 1
Lomandra effusa 1 5 29% 12 71% 17 2
Lomandra leucocephala 2 7 100% 0 0% 7 1
Lomandra micrantha 1 2 100% 0 0% 2 2
Lotus australis 1 0 0% 1 100% 1 —
Lycium australe 1 2 100% 0 0% 2 1
Maireana brevifolia 5 29 100% 0 0% 29 1
Maireana oppositifolia 3 72 88% 10 12% 82 1
Maireana sp. 1 1 100% 0 0% 1 1
Melaleuca brevifolia 1 6 27% 16 73% 22 1
Melaleuca halmaturorum 28 1192 77% 349 23% 1541 1
Melaleuca lanceolata 26 476 82% 105 18% 581 1
Melaleuca sp. 13 27 39% 43 61% 70 2
Melaleuca uncinata 2 28 82% 6 18% 34 2
Muehlenbeckia gunnii 3 3 100% 0 0 3 1
Myoporum insulare 23 211 91% 21 9% 232 1
Myoporum parvifolium 2 9 100% 0 0% 9 2
Nitraria billardierei 4 13 59% 9 41% 22 2
Olearia axillaris 16 83 98% 2 2% 85 1
Olearia ramulosa 5 39 95% 2 5% 41 1
Pelargonium australe 8 99 76% 31 24% 130 1
Pittosporum angustifolium 2 6 100% 0 0% 6 2
Platylobium obtusangulum 1 3 75% 1 25% 4 2
Poa labillardieri 6 545 78% 152 22% 697 2
Poa poiformis var. poiformis 11 2066 53% 1829 47% 3895 2
Poa sp. 1 24 96% 1 4% 25 2
Puccinellia stricta 2 67 18% 313 82% 380 2
Pultenaea tenuifolia 1 3 100% 0 0% 3 1
Rhagodia candolleana 22 480 99% 6 1% 486 1
Samolus repens 1 6 100% 0 0% 6 1
Samphire sp. 1 4 100% 0 0% 4 1
Sedge sp. 1 13 2440 87% 378 13% 2818 1
Sedge sp. 2 1 1 100% 0 0% 1 1
Senecio pinnatifolius 2 12 75% 4 25% 16 1
Senecio sp. 1 0 0% 3 100% 3 —
Tecticornia arbuscula 2 57 100% 0 0% 57 1
Tetragonia implexicoma 4 9 100% 0 0% 9 1
Vegetation Survivorship Monitoring
Page 13 12/07/2013
Species Number of Sites
Alive Alive
% Dead
Dead %
Total Plants
Average
Plant Health
Themeda triandra 1 44 96% 2 4% 46 1
Thomasia petalocalyx 2 8 89% 1 11% 9 1
Threlkeldia diffusa 1 2 100% 0 0% 2 2
Unknown species 56 19 0.3% 6271 99.7% 6740 1
Velleia arguta 1 7 100% 0 0% 7 1
Vittadinia australasica 7 81 70% 34 30% 115 1
Wahlenbergia sp. 1 0 0% 13 100% 13 —
Xanthorrhoea semiplana 7 27 90% 3 10% 30 2
Table 8 Summary of number of species for each category of overall survivorship
Overall survivorship (%) Number of Species
0-20 10
20-40 7
40-60 7
60-80 18
80-100 79
Table 9 Overall plant health of species identified
Health Score Number of Species % of total
population
Good 1 74 61%
Slightly Affected 2 39 33%
Severely Affected 3 1 1%
Dying* 4 7 6%
*This only includes dead species which were able to be identified as opposed to the majority of dead plants which were classed as “unknown species”.
Vegetation Survivorship Monitoring
Page 14 12/07/2013
Table 10 Overall summary of plant survivorship per zone.
Zone Alive Alive
% Dead
Dead %
Total Counted
Average Species
health
1 - Lake/lagoon edge 866 63% 512 37% 1378 2
2 - Saline swamp 615 52% 566 48% 1181 2
3 - Saline edge 4500 64% 2504 36% 7004 1
4 - Rising ground 1213 55% 976 45% 2189 1
5 - Slope/embankment 3405 64% 1950 36% 5355 1
7 - Cliff top 683 70% 299 30% 982 2
8 - Sandhill 2486 55% 2043 45% 4529 2
9 - Other inland 5073 72% 2015 28% 7088 1
10 - Coastal 3131 58% 2299 42% 5430 2
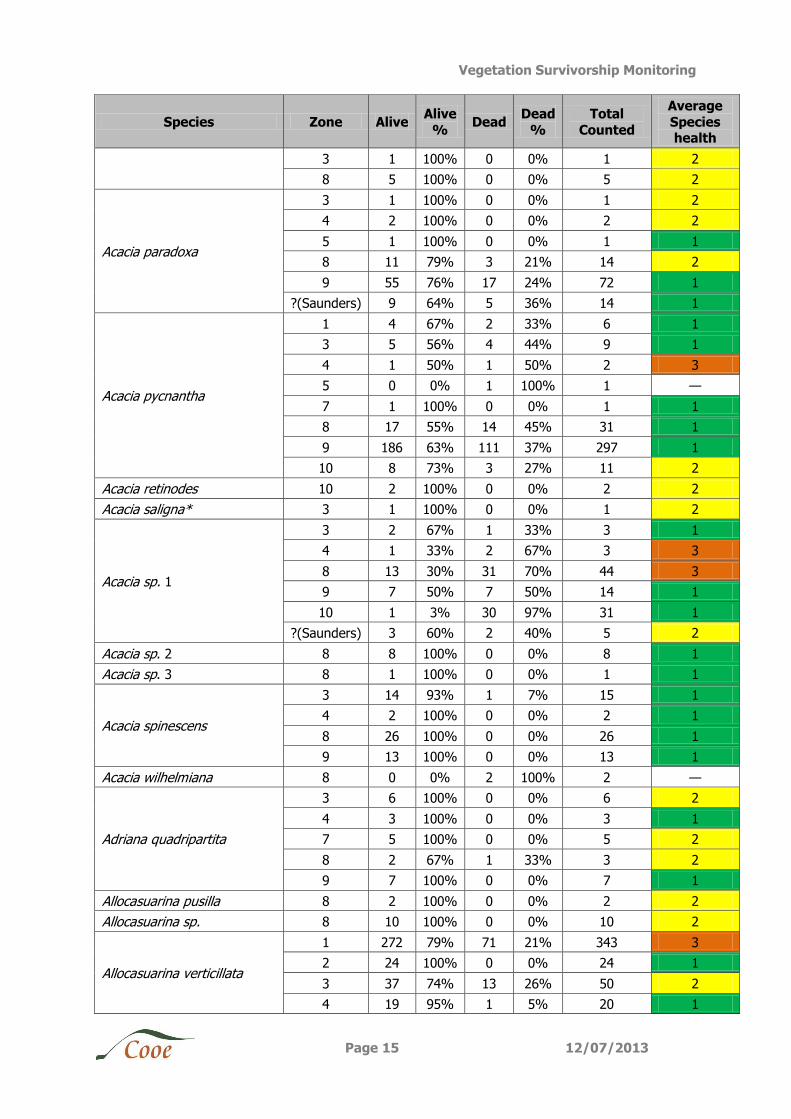
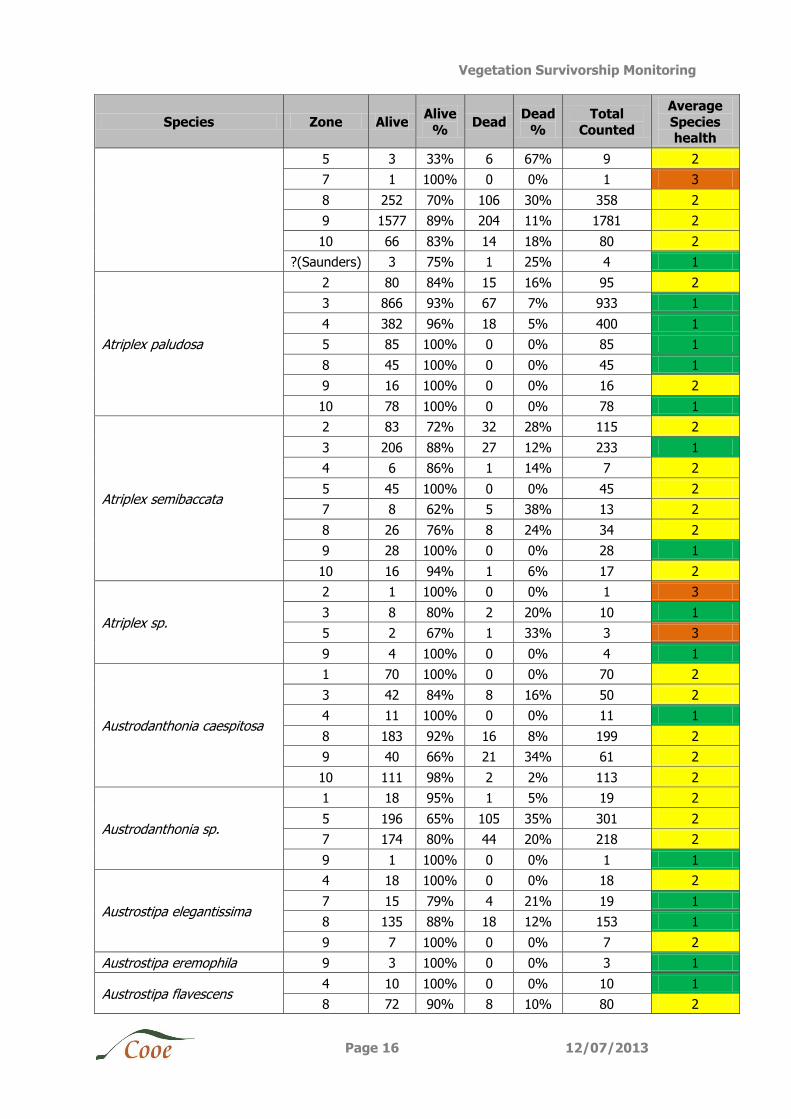
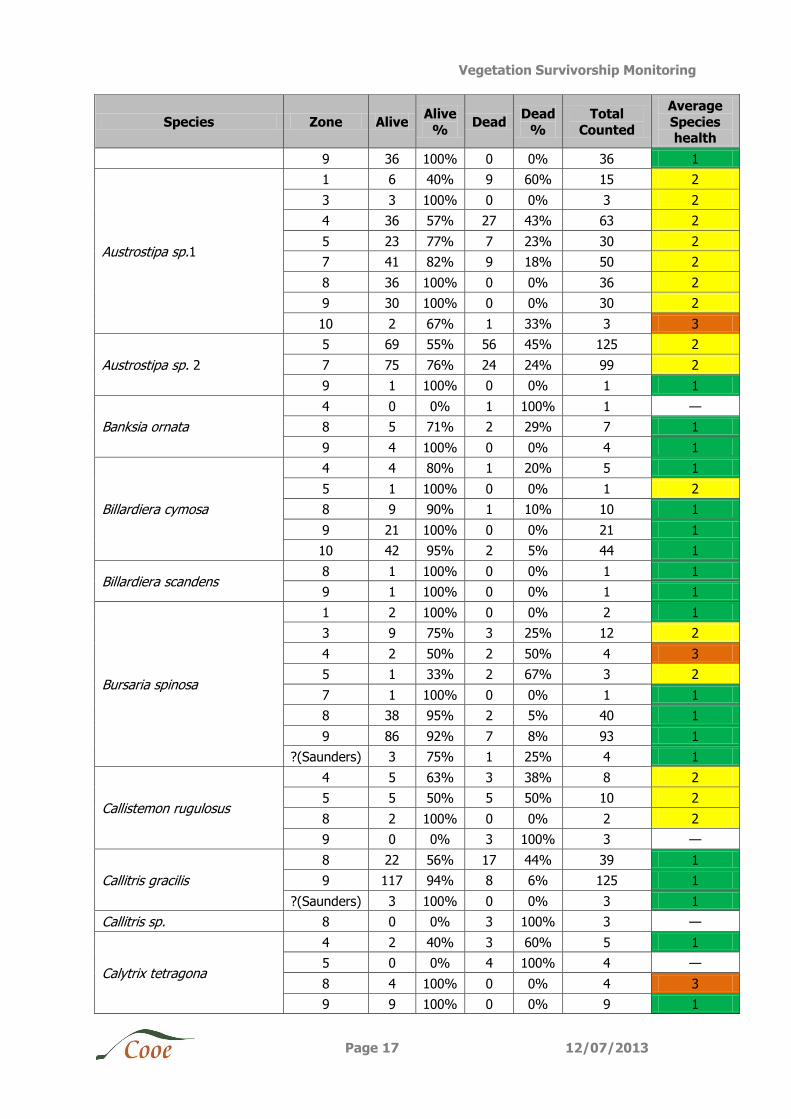
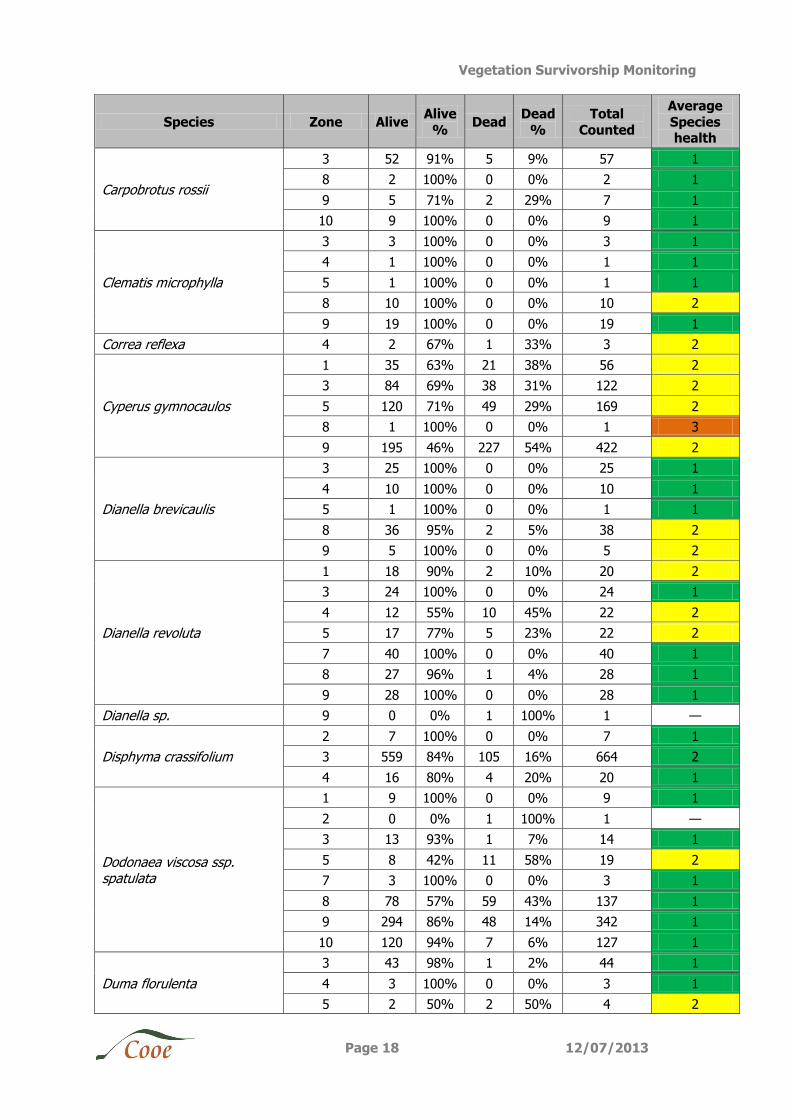
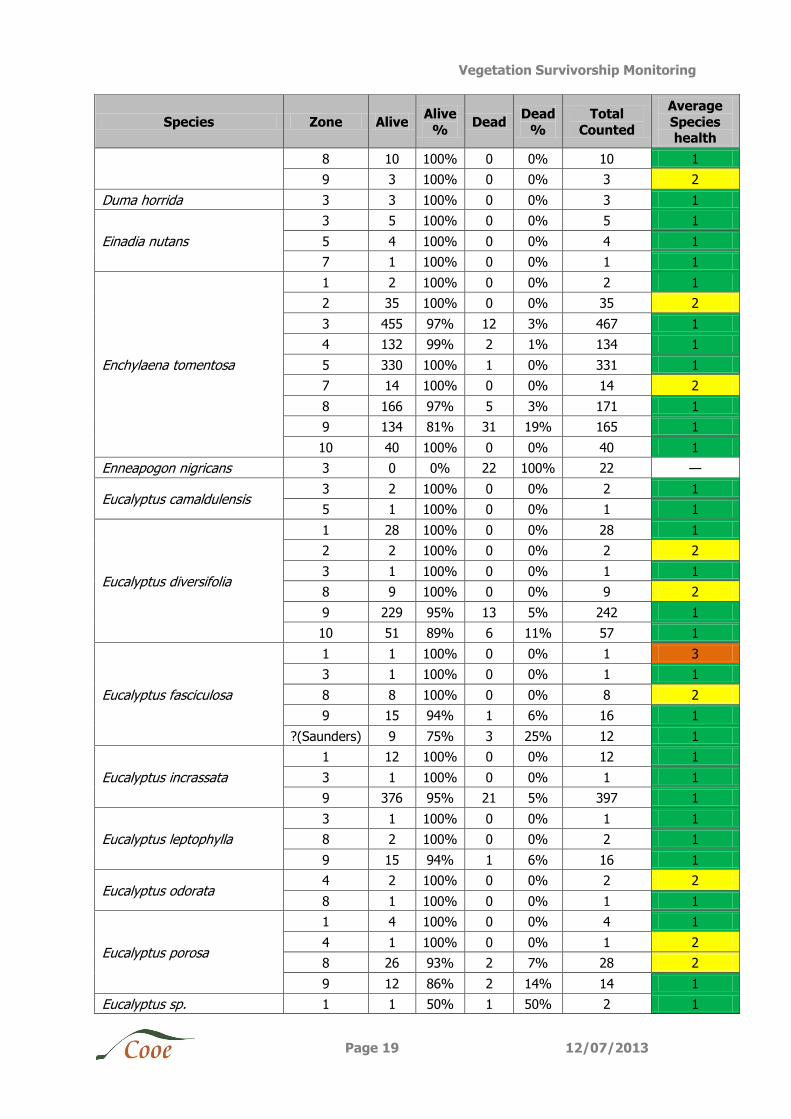
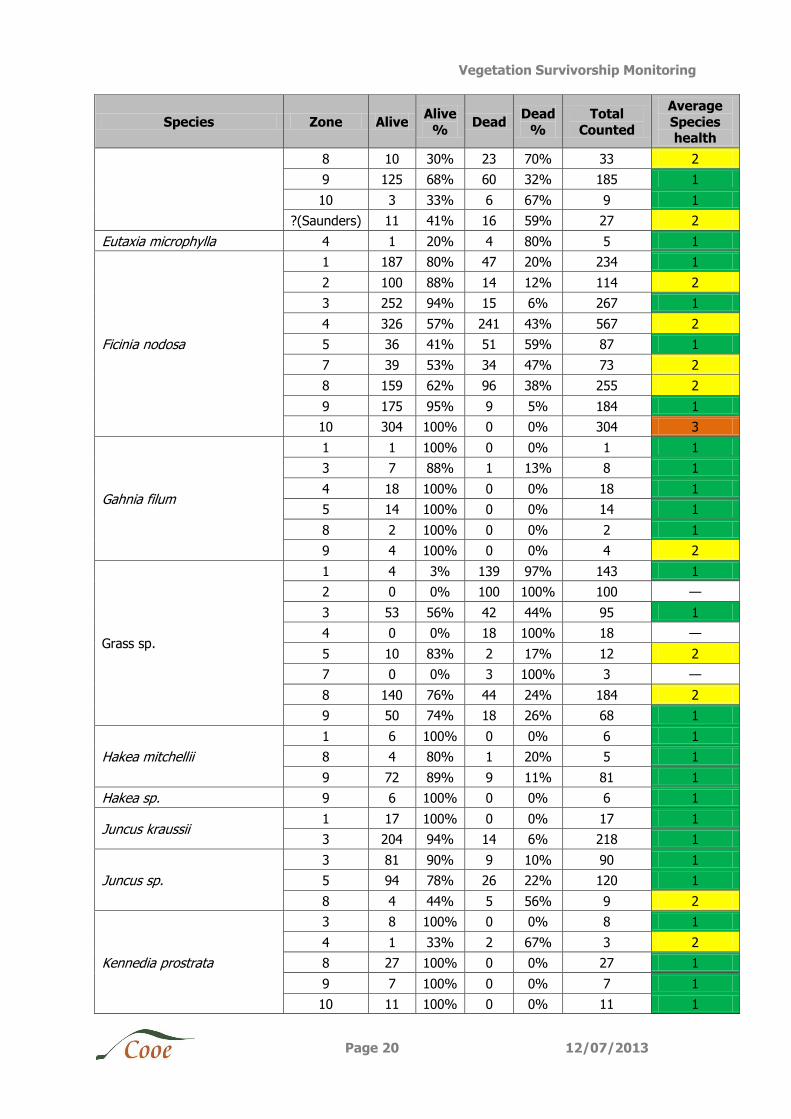
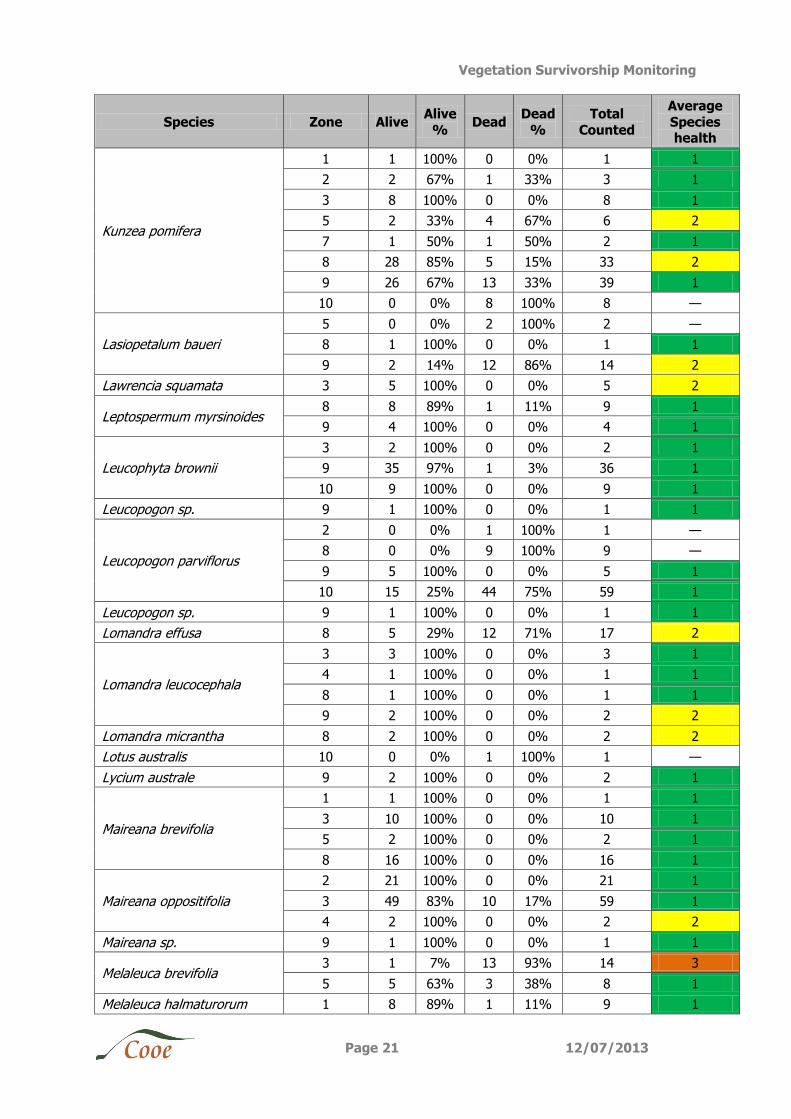
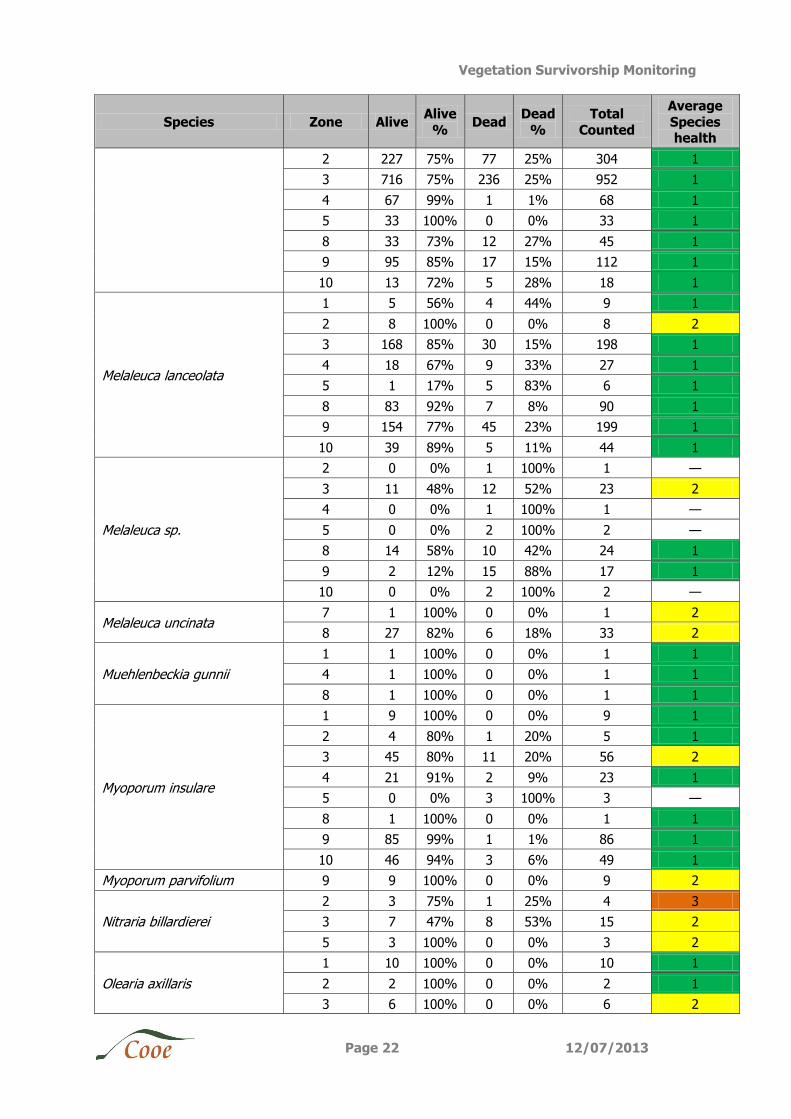
Table 11 Plant survivorship within each zone for each species identified.
Species Zone Alive Alive
% Dead
Dead
%
Total
Counted
Average Species
health
Acacia calamifolia
3 1 50% 1 50% 2 1
8 11 79% 3 21% 14 1
9 8 89% 1 11% 9 1
Acacia cupularis
1 7 100% 0 0% 7 1
2 1 100% 0 0% 1 1
8 23 79% 6 21% 29 1
9 18 100% 0 0% 18 1
10 22 100% 0 0% 22 2
Acacia dodonaeifolia 8 0 0% 1 100% 1 —
9 1 50% 1 50% 2 1
Acacia leiophylla 10 2 100% 0 0% 2 3
Acacia ligulata
1 1 100% 0 0% 1 2
8 0 0% 1 100% 1 —
9 0 0% 1 100% 1 —
Acacia longifolia var. sophorae
1 14 70% 6 30% 20 1
3 13 81% 3 19% 16 2
4 1 50% 1 50% 2 1
5 1 100% 0 0% 1 1
8 80 90% 8 10% 88 1
9 104 65% 56 35% 160 1
10 140 84% 26 16% 166 1
?(Saunders) 1 100% 0 0% 1 1
Acacia microcarpa 8 4 67% 2 33% 6 1
Acacia myrtifolia 1 2 100% 0 0% 2 2
Vegetation Survivorship Monitoring
Page 15 12/07/2013
Species Zone Alive Alive
% Dead
Dead
%
Total
Counted
Average
Species health
3 1 100% 0 0% 1 2
8 5 100% 0 0% 5 2
Acacia paradoxa
3 1 100% 0 0% 1 2
4 2 100% 0 0% 2 2
5 1 100% 0 0% 1 1
8 11 79% 3 21% 14 2
9 55 76% 17 24% 72 1
?(Saunders) 9 64% 5 36% 14 1
Acacia pycnantha
1 4 67% 2 33% 6 1
3 5 56% 4 44% 9 1
4 1 50% 1 50% 2 3
5 0 0% 1 100% 1 —
7 1 100% 0 0% 1 1
8 17 55% 14 45% 31 1
9 186 63% 111 37% 297 1
10 8 73% 3 27% 11 2
Acacia retinodes 10 2 100% 0 0% 2 2
Acacia saligna* 3 1 100% 0 0% 1 2
Acacia sp. 1
3 2 67% 1 33% 3 1
4 1 33% 2 67% 3 3
8 13 30% 31 70% 44 3
9 7 50% 7 50% 14 1
10 1 3% 30 97% 31 1
?(Saunders) 3 60% 2 40% 5 2
Acacia sp. 2 8 8 100% 0 0% 8 1
Acacia sp. 3 8 1 100% 0 0% 1 1
Acacia spinescens
3 14 93% 1 7% 15 1
4 2 100% 0 0% 2 1
8 26 100% 0 0% 26 1
9 13 100% 0 0% 13 1
Acacia wilhelmiana 8 0 0% 2 100% 2 —
Adriana quadripartita
3 6 100% 0 0% 6 2
4 3 100% 0 0% 3 1
7 5 100% 0 0% 5 2
8 2 67% 1 33% 3 2
9 7 100% 0 0% 7 1
Allocasuarina pusilla 8 2 100% 0 0% 2 2
Allocasuarina sp. 8 10 100% 0 0% 10 2
Allocasuarina verticillata
1 272 79% 71 21% 343 3
2 24 100% 0 0% 24 1
3 37 74% 13 26% 50 2
4 19 95% 1 5% 20 1
Vegetation Survivorship Monitoring
Page 16 12/07/2013
Species Zone Alive Alive
% Dead
Dead
%
Total
Counted
Average
Species health
5 3 33% 6 67% 9 2
7 1 100% 0 0% 1 3
8 252 70% 106 30% 358 2
9 1577 89% 204 11% 1781 2
10 66 83% 14 18% 80 2
?(Saunders) 3 75% 1 25% 4 1
Atriplex paludosa
2 80 84% 15 16% 95 2
3 866 93% 67 7% 933 1
4 382 96% 18 5% 400 1
5 85 100% 0 0% 85 1
8 45 100% 0 0% 45 1
9 16 100% 0 0% 16 2
10 78 100% 0 0% 78 1
Atriplex semibaccata
2 83 72% 32 28% 115 2
3 206 88% 27 12% 233 1
4 6 86% 1 14% 7 2
5 45 100% 0 0% 45 2
7 8 62% 5 38% 13 2
8 26 76% 8 24% 34 2
9 28 100% 0 0% 28 1
10 16 94% 1 6% 17 2
Atriplex sp.
2 1 100% 0 0% 1 3
3 8 80% 2 20% 10 1
5 2 67% 1 33% 3 3
9 4 100% 0 0% 4 1
Austrodanthonia caespitosa
1 70 100% 0 0% 70 2
3 42 84% 8 16% 50 2
4 11 100% 0 0% 11 1
8 183 92% 16 8% 199 2
9 40 66% 21 34% 61 2
10 111 98% 2 2% 113 2
Austrodanthonia sp.
1 18 95% 1 5% 19 2
5 196 65% 105 35% 301 2
7 174 80% 44 20% 218 2
9 1 100% 0 0% 1 1
Austrostipa elegantissima
4 18 100% 0 0% 18 2
7 15 79% 4 21% 19 1
8 135 88% 18 12% 153 1
9 7 100% 0 0% 7 2
Austrostipa eremophila 9 3 100% 0 0% 3 1
Austrostipa flavescens 4 10 100% 0 0% 10 1
8 72 90% 8 10% 80 2
Vegetation Survivorship Monitoring
Page 17 12/07/2013
Species Zone Alive Alive
% Dead
Dead
%
Total
Counted
Average
Species health
9 36 100% 0 0% 36 1
Austrostipa sp.1
1 6 40% 9 60% 15 2
3 3 100% 0 0% 3 2
4 36 57% 27 43% 63 2
5 23 77% 7 23% 30 2
7 41 82% 9 18% 50 2
8 36 100% 0 0% 36 2
9 30 100% 0 0% 30 2
10 2 67% 1 33% 3 3
Austrostipa sp. 2
5 69 55% 56 45% 125 2
7 75 76% 24 24% 99 2
9 1 100% 0 0% 1 1
Banksia ornata
4 0 0% 1 100% 1 —
8 5 71% 2 29% 7 1
9 4 100% 0 0% 4 1
Billardiera cymosa
4 4 80% 1 20% 5 1
5 1 100% 0 0% 1 2
8 9 90% 1 10% 10 1
9 21 100% 0 0% 21 1
10 42 95% 2 5% 44 1
Billardiera scandens 8 1 100% 0 0% 1 1
9 1 100% 0 0% 1 1
Bursaria spinosa
1 2 100% 0 0% 2 1
3 9 75% 3 25% 12 2
4 2 50% 2 50% 4 3
5 1 33% 2 67% 3 2
7 1 100% 0 0% 1 1
8 38 95% 2 5% 40 1
9 86 92% 7 8% 93 1
?(Saunders) 3 75% 1 25% 4 1
Callistemon rugulosus
4 5 63% 3 38% 8 2
5 5 50% 5 50% 10 2
8 2 100% 0 0% 2 2
9 0 0% 3 100% 3 —
Callitris gracilis
8 22 56% 17 44% 39 1
9 117 94% 8 6% 125 1
?(Saunders) 3 100% 0 0% 3 1
Callitris sp. 8 0 0% 3 100% 3 —
Calytrix tetragona
4 2 40% 3 60% 5 1
5 0 0% 4 100% 4 —
8 4 100% 0 0% 4 3
9 9 100% 0 0% 9 1
Vegetation Survivorship Monitoring
Page 18 12/07/2013
Species Zone Alive Alive
% Dead
Dead
%
Total
Counted
Average
Species health
Carpobrotus rossii
3 52 91% 5 9% 57 1
8 2 100% 0 0% 2 1
9 5 71% 2 29% 7 1
10 9 100% 0 0% 9 1
Clematis microphylla
3 3 100% 0 0% 3 1
4 1 100% 0 0% 1 1
5 1 100% 0 0% 1 1
8 10 100% 0 0% 10 2
9 19 100% 0 0% 19 1
Correa reflexa 4 2 67% 1 33% 3 2
Cyperus gymnocaulos
1 35 63% 21 38% 56 2
3 84 69% 38 31% 122 2
5 120 71% 49 29% 169 2
8 1 100% 0 0% 1 3
9 195 46% 227 54% 422 2
Dianella brevicaulis
3 25 100% 0 0% 25 1
4 10 100% 0 0% 10 1
5 1 100% 0 0% 1 1
8 36 95% 2 5% 38 2
9 5 100% 0 0% 5 2
Dianella revoluta
1 18 90% 2 10% 20 2
3 24 100% 0 0% 24 1
4 12 55% 10 45% 22 2
5 17 77% 5 23% 22 2
7 40 100% 0 0% 40 1
8 27 96% 1 4% 28 1
9 28 100% 0 0% 28 1
Dianella sp. 9 0 0% 1 100% 1 —
Disphyma crassifolium
2 7 100% 0 0% 7 1
3 559 84% 105 16% 664 2
4 16 80% 4 20% 20 1
Dodonaea viscosa ssp. spatulata
1 9 100% 0 0% 9 1
2 0 0% 1 100% 1 —
3 13 93% 1 7% 14 1
5 8 42% 11 58% 19 2
7 3 100% 0 0% 3 1
8 78 57% 59 43% 137 1
9 294 86% 48 14% 342 1
10 120 94% 7 6% 127 1
Duma florulenta
3 43 98% 1 2% 44 1
4 3 100% 0 0% 3 1
5 2 50% 2 50% 4 2
Vegetation Survivorship Monitoring
Page 19 12/07/2013
Species Zone Alive Alive
% Dead
Dead
%
Total
Counted
Average
Species health
8 10 100% 0 0% 10 1
9 3 100% 0 0% 3 2
Duma horrida 3 3 100% 0 0% 3 1
Einadia nutans
3 5 100% 0 0% 5 1
5 4 100% 0 0% 4 1
7 1 100% 0 0% 1 1
Enchylaena tomentosa
1 2 100% 0 0% 2 1
2 35 100% 0 0% 35 2
3 455 97% 12 3% 467 1
4 132 99% 2 1% 134 1
5 330 100% 1 0% 331 1
7 14 100% 0 0% 14 2
8 166 97% 5 3% 171 1
9 134 81% 31 19% 165 1
10 40 100% 0 0% 40 1
Enneapogon nigricans 3 0 0% 22 100% 22 —
Eucalyptus camaldulensis 3 2 100% 0 0% 2 1
5 1 100% 0 0% 1 1
Eucalyptus diversifolia
1 28 100% 0 0% 28 1
2 2 100% 0 0% 2 2
3 1 100% 0 0% 1 1
8 9 100% 0 0% 9 2
9 229 95% 13 5% 242 1
10 51 89% 6 11% 57 1
Eucalyptus fasciculosa
1 1 100% 0 0% 1 3
3 1 100% 0 0% 1 1
8 8 100% 0 0% 8 2
9 15 94% 1 6% 16 1
?(Saunders) 9 75% 3 25% 12 1
Eucalyptus incrassata
1 12 100% 0 0% 12 1
3 1 100% 0 0% 1 1
9 376 95% 21 5% 397 1
Eucalyptus leptophylla
3 1 100% 0 0% 1 1
8 2 100% 0 0% 2 1
9 15 94% 1 6% 16 1
Eucalyptus odorata 4 2 100% 0 0% 2 2
8 1 100% 0 0% 1 1
Eucalyptus porosa
1 4 100% 0 0% 4 1
4 1 100% 0 0% 1 2
8 26 93% 2 7% 28 2
9 12 86% 2 14% 14 1
Eucalyptus sp. 1 1 50% 1 50% 2 1
Vegetation Survivorship Monitoring
Page 20 12/07/2013
Species Zone Alive Alive
% Dead
Dead
%
Total
Counted
Average
Species health
8 10 30% 23 70% 33 2
9 125 68% 60 32% 185 1
10 3 33% 6 67% 9 1
?(Saunders) 11 41% 16 59% 27 2
Eutaxia microphylla 4 1 20% 4 80% 5 1
Ficinia nodosa
1 187 80% 47 20% 234 1
2 100 88% 14 12% 114 2
3 252 94% 15 6% 267 1
4 326 57% 241 43% 567 2
5 36 41% 51 59% 87 1
7 39 53% 34 47% 73 2
8 159 62% 96 38% 255 2
9 175 95% 9 5% 184 1
10 304 100% 0 0% 304 3
Gahnia filum
1 1 100% 0 0% 1 1
3 7 88% 1 13% 8 1
4 18 100% 0 0% 18 1
5 14 100% 0 0% 14 1
8 2 100% 0 0% 2 1
9 4 100% 0 0% 4 2
Grass sp.
1 4 3% 139 97% 143 1
2 0 0% 100 100% 100 —
3 53 56% 42 44% 95 1
4 0 0% 18 100% 18 —
5 10 83% 2 17% 12 2
7 0 0% 3 100% 3 —
8 140 76% 44 24% 184 2
9 50 74% 18 26% 68 1
Hakea mitchellii
1 6 100% 0 0% 6 1
8 4 80% 1 20% 5 1
9 72 89% 9 11% 81 1
Hakea sp. 9 6 100% 0 0% 6 1
Juncus kraussii 1 17 100% 0 0% 17 1
3 204 94% 14 6% 218 1
Juncus sp.
3 81 90% 9 10% 90 1
5 94 78% 26 22% 120 1
8 4 44% 5 56% 9 2
Kennedia prostrata
3 8 100% 0 0% 8 1
4 1 33% 2 67% 3 2
8 27 100% 0 0% 27 1
9 7 100% 0 0% 7 1
10 11 100% 0 0% 11 1
Vegetation Survivorship Monitoring
Page 21 12/07/2013
Species Zone Alive Alive
% Dead
Dead
%
Total
Counted
Average
Species health
Kunzea pomifera
1 1 100% 0 0% 1 1
2 2 67% 1 33% 3 1
3 8 100% 0 0% 8 1
5 2 33% 4 67% 6 2
7 1 50% 1 50% 2 1
8 28 85% 5 15% 33 2
9 26 67% 13 33% 39 1
10 0 0% 8 100% 8 —
Lasiopetalum baueri
5 0 0% 2 100% 2 —
8 1 100% 0 0% 1 1
9 2 14% 12 86% 14 2
Lawrencia squamata 3 5 100% 0 0% 5 2
Leptospermum myrsinoides 8 8 89% 1 11% 9 1
9 4 100% 0 0% 4 1
Leucophyta brownii
3 2 100% 0 0% 2 1
9 35 97% 1 3% 36 1
10 9 100% 0 0% 9 1
Leucopogon sp. 9 1 100% 0 0% 1 1
Leucopogon parviflorus
2 0 0% 1 100% 1 —
8 0 0% 9 100% 9 —
9 5 100% 0 0% 5 1
10 15 25% 44 75% 59 1
Leucopogon sp. 9 1 100% 0 0% 1 1
Lomandra effusa 8 5 29% 12 71% 17 2
Lomandra leucocephala
3 3 100% 0 0% 3 1
4 1 100% 0 0% 1 1
8 1 100% 0 0% 1 1
9 2 100% 0 0% 2 2
Lomandra micrantha 8 2 100% 0 0% 2 2
Lotus australis 10 0 0% 1 100% 1 —
Lycium australe 9 2 100% 0 0% 2 1
Maireana brevifolia
1 1 100% 0 0% 1 1
3 10 100% 0 0% 10 1
5 2 100% 0 0% 2 1
8 16 100% 0 0% 16 1
Maireana oppositifolia
2 21 100% 0 0% 21 1
3 49 83% 10 17% 59 1
4 2 100% 0 0% 2 2
Maireana sp. 9 1 100% 0 0% 1 1
Melaleuca brevifolia 3 1 7% 13 93% 14 3
5 5 63% 3 38% 8 1
Melaleuca halmaturorum 1 8 89% 1 11% 9 1
Vegetation Survivorship Monitoring
Page 22 12/07/2013
Species Zone Alive Alive
% Dead
Dead
%
Total
Counted
Average
Species health
2 227 75% 77 25% 304 1
3 716 75% 236 25% 952 1
4 67 99% 1 1% 68 1
5 33 100% 0 0% 33 1
8 33 73% 12 27% 45 1
9 95 85% 17 15% 112 1
10 13 72% 5 28% 18 1
Melaleuca lanceolata
1 5 56% 4 44% 9 1
2 8 100% 0 0% 8 2
3 168 85% 30 15% 198 1
4 18 67% 9 33% 27 1
5 1 17% 5 83% 6 1
8 83 92% 7 8% 90 1
9 154 77% 45 23% 199 1
10 39 89% 5 11% 44 1
Melaleuca sp.
2 0 0% 1 100% 1 —
3 11 48% 12 52% 23 2
4 0 0% 1 100% 1 —
5 0 0% 2 100% 2 —
8 14 58% 10 42% 24 1
9 2 12% 15 88% 17 1
10 0 0% 2 100% 2 —
Melaleuca uncinata 7 1 100% 0 0% 1 2
8 27 82% 6 18% 33 2
Muehlenbeckia gunnii
1 1 100% 0 0% 1 1
4 1 100% 0 0% 1 1
8 1 100% 0 0% 1 1
Myoporum insulare
1 9 100% 0 0% 9 1
2 4 80% 1 20% 5 1
3 45 80% 11 20% 56 2
4 21 91% 2 9% 23 1
5 0 0% 3 100% 3 —
8 1 100% 0 0% 1 1
9 85 99% 1 1% 86 1
10 46 94% 3 6% 49 1
Myoporum parvifolium 9 9 100% 0 0% 9 2
Nitraria billardierei
2 3 75% 1 25% 4 3
3 7 47% 8 53% 15 2
5 3 100% 0 0% 3 2
Olearia axillaris
1 10 100% 0 0% 10 1
2 2 100% 0 0% 2 1
3 6 100% 0 0% 6 2
Vegetation Survivorship Monitoring
Page 23 12/07/2013
Species Zone Alive Alive
% Dead
Dead
%
Total
Counted
Average
Species health
4 4 100% 0 0% 4 2
8 10 91% 1 9% 11 1
9 45 98% 1 2% 46 1
10 3 100% 0 0% 3 1
?(Saunders) 3 100% 0 0% 3 1
Olearia ramulosa
3 1 100% 0 0% 1 1
4 5 100% 0 0% 5 1
7 0 0% 1 100% 1 —
8 5 100% 0 0% 5 1
9 28 97% 1 3% 29 1
Pelargonium australe
3 2 100% 0 0% 2 3
4 5 100% 0 0% 5 1
5 2 100% 0 0% 2 2
8 7 88% 1 13% 8 2
9 34 89% 4 11% 38 1
10 49 65% 26 35% 75 1
Pittosporum angustifolium 7 4 100% 0 0% 4 2
8 2 100% 0 0% 2 2
Platylobium obtusangulum 8 3 75% 1 25% 4 2
Poa labillardieri
1 7 100% 0 0% 7 1
3 86 100% 0 0% 86 1
7 251 67% 125 33% 376 2
8 175 87% 27 13% 202 2
9 6 100% 0 0% 6 1
10 20 100% 0 0% 20 1
Poa poiformis var. poiformis
2 3 100% 0 0% 3 2
3 112 35% 210 65% 322 2
4 14 88% 2 13% 16 1
8 31 100% 0 0% 31 1
9 19 100% 0 0% 19 1
10 1887 54% 1617 46% 3504 2
Poa sp. 9 24 96% 1 4% 25 2
Puccinellia stricta 2 0 0% 274 100% 274 —
5 67 63% 39 37% 106 2
Pultenaea tenuifolia 9 3 100% 0 0% 3 1
Rhagodia candolleana
1 14 93% 1 7% 15 1
3 88 100% 0 0% 88 1
4 36 100% 0 0% 36 1
5 13 100% 0 0% 13 2
7 8 100% 0 0% 8 1
8 100 96% 4 4% 104 1
9 220 100% 1 0% 221 1
Vegetation Survivorship Monitoring
Page 24 12/07/2013
Species Zone Alive Alive
% Dead
Dead
%
Total
Counted
Average
Species health
?(Saunders) 1 100% 0 0% 1 1
Samolus repens 3 6 100% 0 0% 6 1
Samphire sp. 3 4 100% 0 0% 4 1
Sedge sp. 1
1 89 53% 80 47% 169 1
3 67 71% 28 29% 95 2
4 0 0% 1 100% 1 —
5 2200 95% 108 5% 2308 1
7 0 0% 1 100% 1 —
8 42 28% 106 72% 148 2
9 23 45% 28 55% 51 1
10 19 42% 26 58% 45 2
Sedge sp. 2 10 1 100% 0 0% 1 1
Senecio pinnatifolius 3 1 50% 1 50% 2 1
8 11 79% 3 21% 14 1
Senecio sp. 7 0 0% 3 100% 3 —
Tecticornia arbuscula 9 57 100% 0 0% 57 1
Tetragonia implexicoma
3 2 100% 0 0% 2 1
4 5 100% 0 0% 5 1
10 2 100% 0 0% 2 2
Themeda triandra 8 44 96% 2 4% 46 1
Thomasia petalocalyx 8 8 89% 1 11% 9 1
Threlkeldia diffusa 5 2 100% 0 0% 2 2
Unknown species
1 0 0% 127 100% 127 —
2 12 20% 48 80% 60 1
3 1 0% 1549 100% 1550 1
4 0 0% 617 100% 617 —
5 0 0% 1437 100% 1437 —
7 0 0% 43 100% 43 —
8 2 0% 1310 100% 1312 4
9 4 0% 996 100% 1000 2
10 0 0% 466 100% 466 —
?(Saunders) 0 0% 128 100% 128 —
Velleia arguta 9 7 100% 0 0% 7 1
Vittadinia australasica
3 7 88% 1 13% 8 1
4 4 100% 0 0% 4 2
5 5 28% 13 72% 18 2
7 0 0% 2 100% 2 —
8 46 72% 18 28% 64 1
9 19 100% 0 0% 19 1
Wahlenbergia sp. 8 0 0% 13 100% 13 —
Xanthorrhoea semiplana 8 15 83% 3 17% 18 2
9 12 100% 0 0% 12 1
Vegetation Survivorship Monitoring
Page 25 12/07/2013
3.3 Plant Survivorship per Site and Zone
The following section summarises the vegetation survivorship for each site monitored. A
photograph showing the overall condition of the site is provided including site observations that may provide some explanation to the survivorship results obtained.
The number and percentage of alive and dead plants is displayed within each site and across each zone. The number of species identified does not include the dead “unknown species”. The site ID is indicated in brackets next to the site name.
Vegetation Survivorship Monitoring
Page 26 12/07/2013
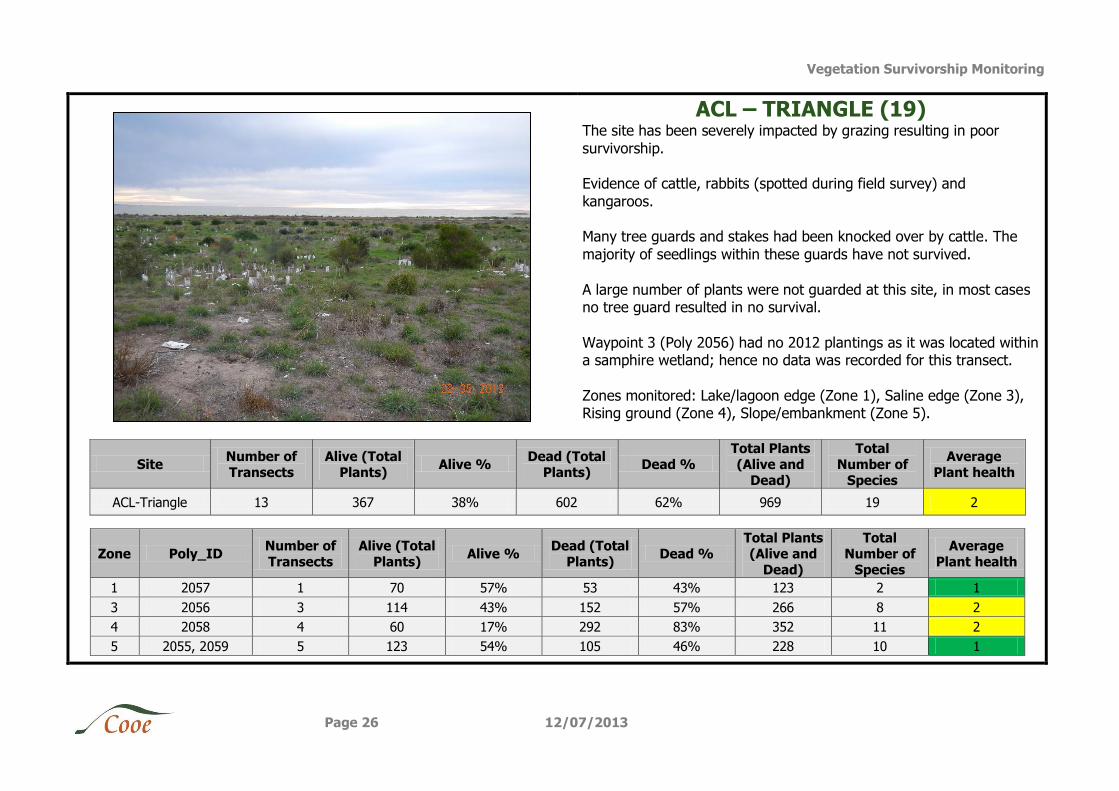
ACL – TRIANGLE (19) The site has been severely impacted by grazing resulting in poor
survivorship. Evidence of cattle, rabbits (spotted during field survey) and
kangaroos. Many tree guards and stakes had been knocked over by cattle. The
majority of seedlings within these guards have not survived.
A large number of plants were not guarded at this site, in most cases no tree guard resulted in no survival.
Waypoint 3 (Poly 2056) had no 2012 plantings as it was located within a samphire wetland; hence no data was recorded for this transect.
Zones monitored: Lake/lagoon edge (Zone 1), Saline edge (Zone 3), Rising ground (Zone 4), Slope/embankment (Zone 5).
Site Number of Transects
Alive (Total Plants)
Alive % Dead (Total
Plants) Dead %
Total Plants (Alive and
Dead)
Total Number of
Species
Average Plant health
ACL-Triangle 13 367 38% 602 62% 969 19 2
Zone Poly_ID Number of Transects
Alive (Total Plants)
Alive % Dead (Total
Plants) Dead %
Total Plants (Alive and
Dead)
Total Number of
Species
Average Plant health
1 2057 1 70 57% 53 43% 123 2 1
3 2056 3 114 43% 152 57% 266 8 2
4 2058 4 60 17% 292 83% 352 11 2
5 2055, 2059 5 123 54% 105 46% 228 10 1
Vegetation Survivorship Monitoring
Page 27 12/07/2013
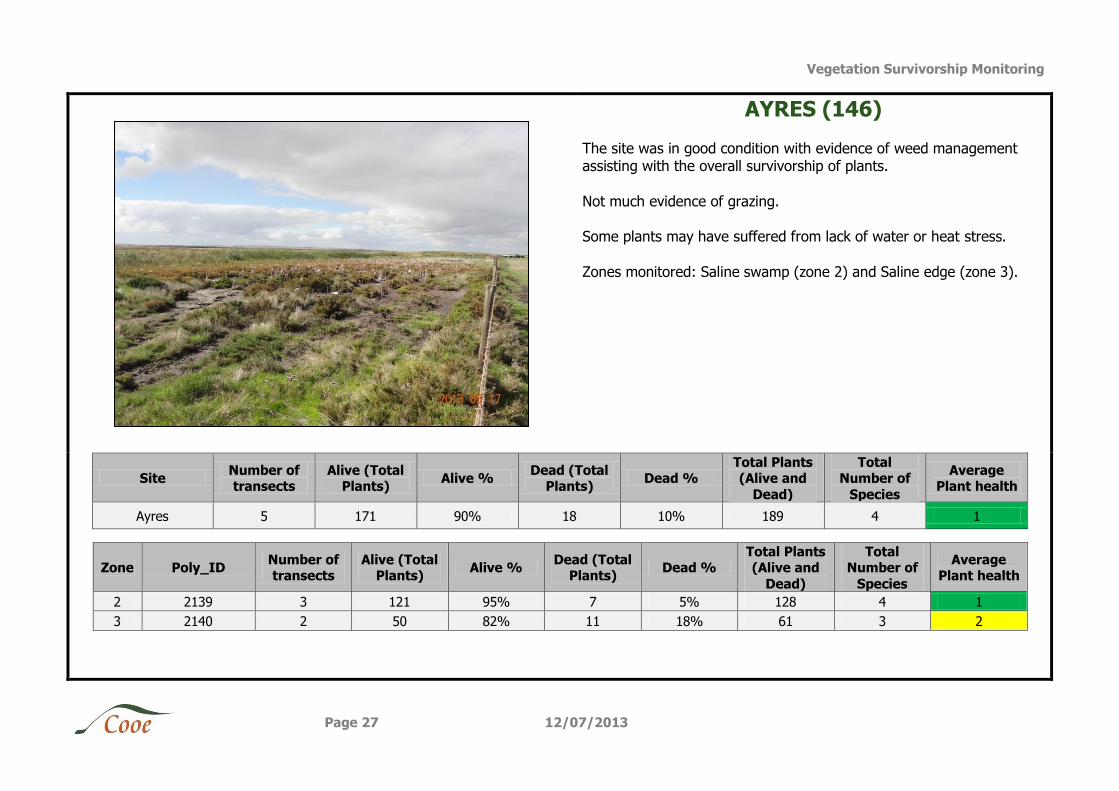
AYRES (146)
The site was in good condition with evidence of weed management assisting with the overall survivorship of plants.
Not much evidence of grazing. Some plants may have suffered from lack of water or heat stress.
Zones monitored: Saline swamp (zone 2) and Saline edge (zone 3).
Site Number of transects
Alive (Total Plants)
Alive % Dead (Total
Plants) Dead %
Total Plants (Alive and
Dead)
Total Number of
Species
Average Plant health
Ayres 5 171 90% 18 10% 189 4 1
Zone Poly_ID Number of transects
Alive (Total Plants)
Alive % Dead (Total
Plants) Dead %
Total Plants (Alive and
Dead)
Total Number of
Species
Average Plant health
2 2139 3 121 95% 7 5% 128 4 1
3 2140 2 50 82% 11 18% 61 3 2
Vegetation Survivorship Monitoring
Page 28 12/07/2013
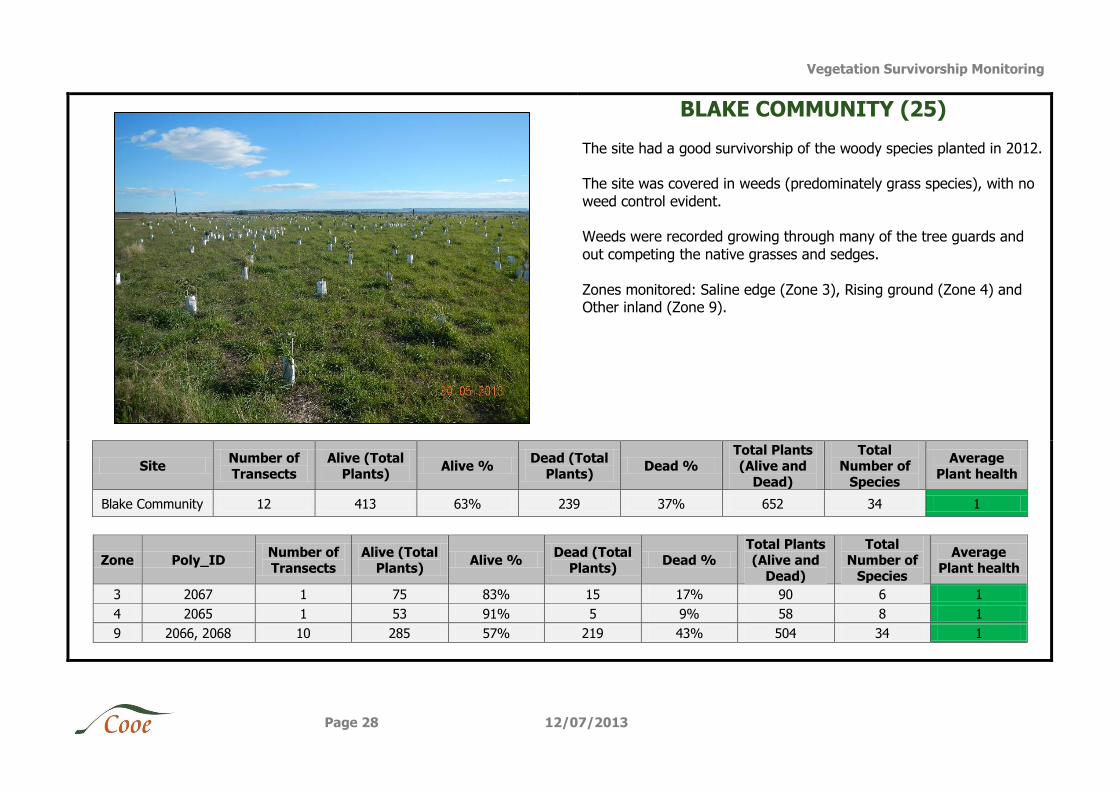
BLAKE COMMUNITY (25)
The site had a good survivorship of the woody species planted in 2012. The site was covered in weeds (predominately grass species), with no
weed control evident. Weeds were recorded growing through many of the tree guards and
out competing the native grasses and sedges.
Zones monitored: Saline edge (Zone 3), Rising ground (Zone 4) and Other inland (Zone 9).
Site Number of Transects
Alive (Total Plants)
Alive % Dead (Total
Plants) Dead %
Total Plants (Alive and
Dead)
Total Number of
Species
Average Plant health
Blake Community 12 413 63% 239 37% 652 34 1
Zone Poly_ID Number of Transects
Alive (Total Plants)
Alive % Dead (Total
Plants) Dead %
Total Plants (Alive and
Dead)
Total Number of
Species
Average Plant health
3 2067 1 75 83% 15 17% 90 6 1
4 2065 1 53 91% 5 9% 58 8 1
9 2066, 2068 10 285 57% 219 43% 504 34 1
Vegetation Survivorship Monitoring
Page 29 12/07/2013
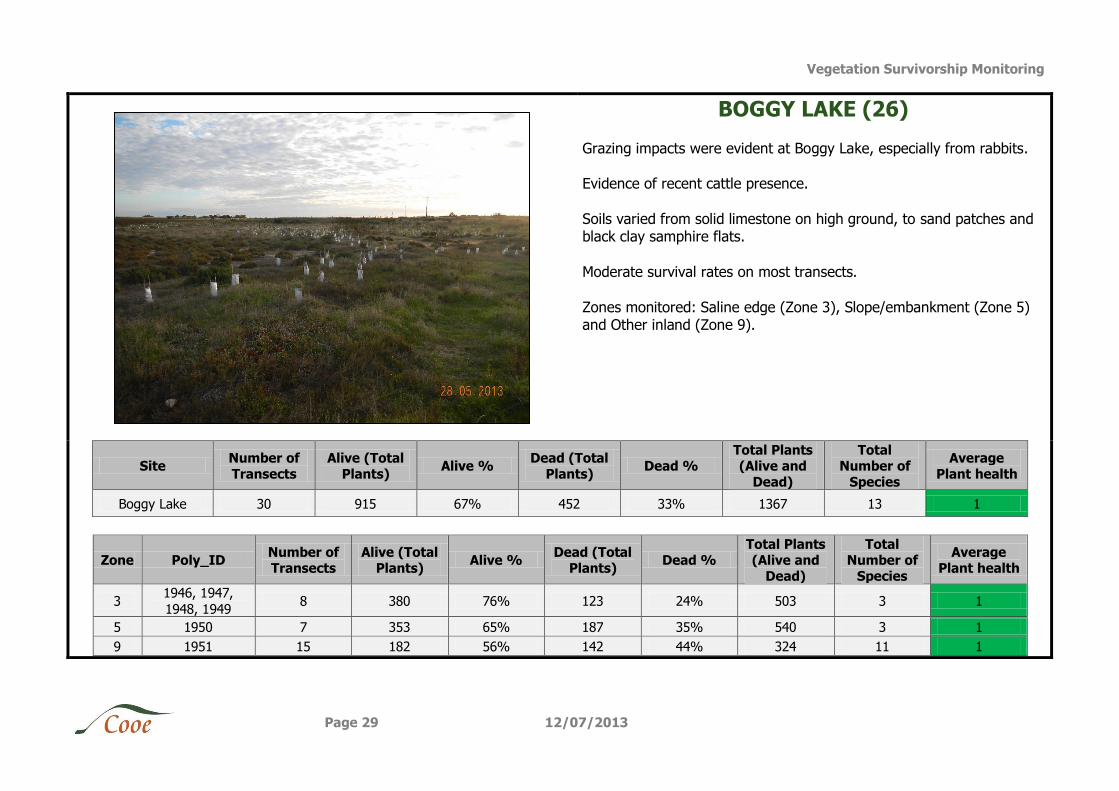
BOGGY LAKE (26)
Grazing impacts were evident at Boggy Lake, especially from rabbits. Evidence of recent cattle presence.
Soils varied from solid limestone on high ground, to sand patches and black clay samphire flats.
Moderate survival rates on most transects.
Zones monitored: Saline edge (Zone 3), Slope/embankment (Zone 5) and Other inland (Zone 9).
Site Number of Transects
Alive (Total Plants)
Alive % Dead (Total
Plants) Dead %
Total Plants (Alive and
Dead)
Total Number of
Species
Average Plant health
Boggy Lake 30 915 67% 452 33% 1367 13 1
Zone Poly_ID Number of Transects
Alive (Total Plants)
Alive % Dead (Total
Plants) Dead %
Total Plants (Alive and
Dead)
Total Number of
Species
Average Plant health
3 1946, 1947,
1948, 1949 8 380 76% 123 24% 503 3 1
5 1950 7 353 65% 187 35% 540 3 1
9 1951 15 182 56% 142 44% 324 11 1
Vegetation Survivorship Monitoring
Page 30 12/07/2013
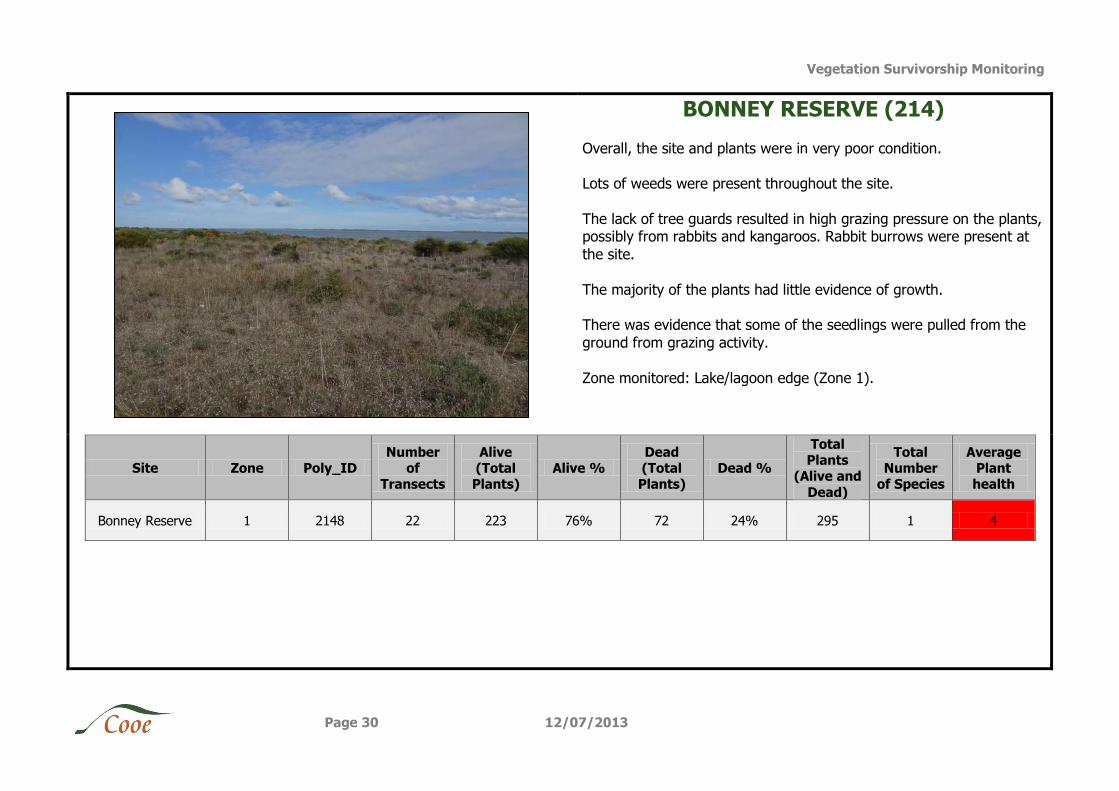
BONNEY RESERVE (214)
Overall, the site and plants were in very poor condition. Lots of weeds were present throughout the site.
The lack of tree guards resulted in high grazing pressure on the plants, possibly from rabbits and kangaroos. Rabbit burrows were present at
the site.
The majority of the plants had little evidence of growth. There was evidence that some of the seedlings were pulled from the
ground from grazing activity.
Zone monitored: Lake/lagoon edge (Zone 1).
Site Zone Poly_ID Number
of Transects
Alive (Total Plants)
Alive % Dead (Total Plants)
Dead %
Total Plants
(Alive and
Dead)
Total Number
of Species
Average Plant health
Bonney Reserve 1 2148 22 223 76% 72 24% 295 1 4
Vegetation Survivorship Monitoring
Page 31 12/07/2013
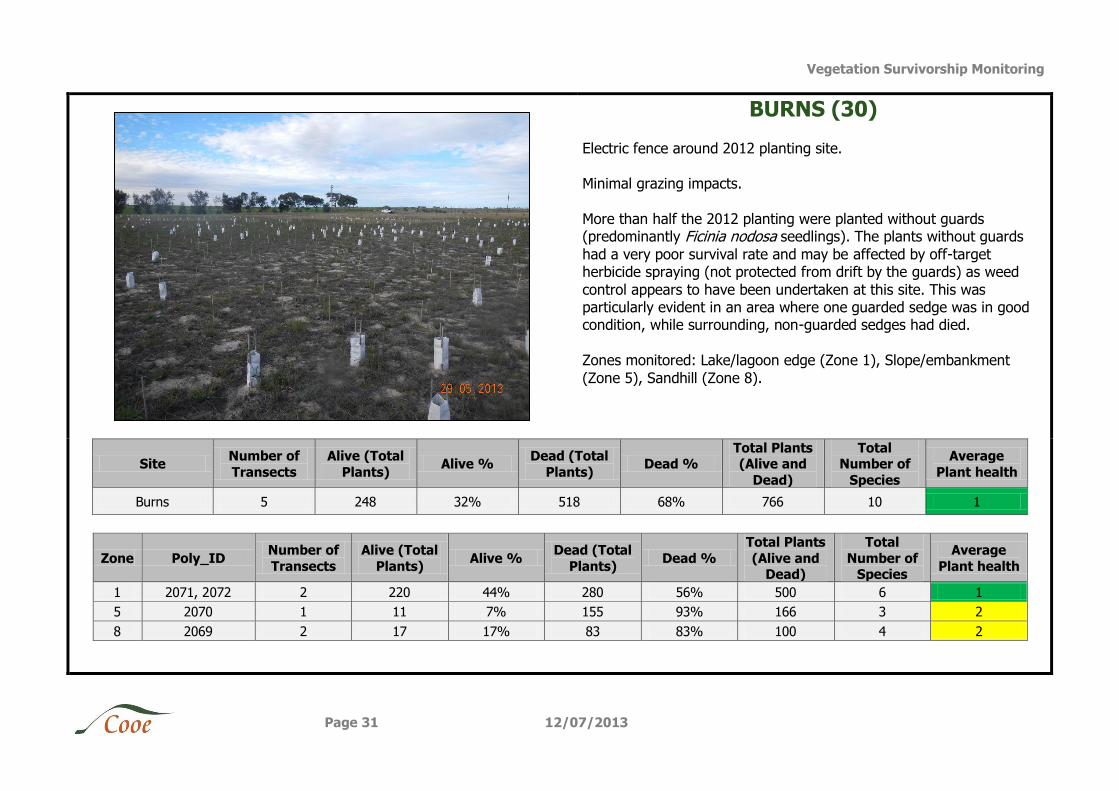
BURNS (30)
Electric fence around 2012 planting site. Minimal grazing impacts.
More than half the 2012 planting were planted without guards (predominantly Ficinia nodosa seedlings). The plants without guards
had a very poor survival rate and may be affected by off-target herbicide spraying (not protected from drift by the guards) as weed
control appears to have been undertaken at this site. This was particularly evident in an area where one guarded sedge was in good condition, while surrounding, non-guarded sedges had died.
Zones monitored: Lake/lagoon edge (Zone 1), Slope/embankment
(Zone 5), Sandhill (Zone 8).
Site Number of
Transects
Alive (Total
Plants) Alive %
Dead (Total
Plants) Dead %
Total Plants (Alive and
Dead)
Total Number of
Species
Average
Plant health
Burns 5 248 32% 518 68% 766 10 1
Zone Poly_ID Number of
Transects
Alive (Total
Plants) Alive %
Dead (Total
Plants) Dead %
Total Plants
(Alive and Dead)
Total
Number of Species
Average
Plant health
1 2071, 2072 2 220 44% 280 56% 500 6 1
5 2070 1 11 7% 155 93% 166 3 2
8 2069 2 17 17% 83 83% 100 4 2
Vegetation Survivorship Monitoring
Page 32 12/07/2013
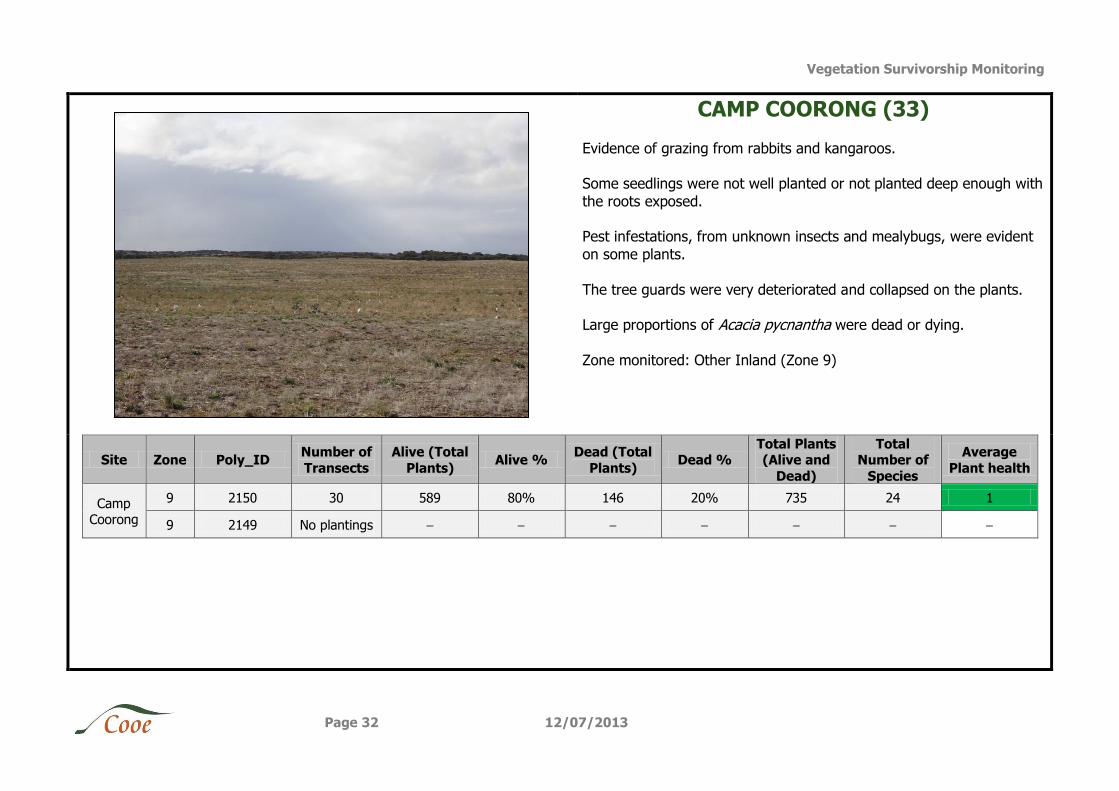
CAMP COORONG (33)
Evidence of grazing from rabbits and kangaroos. Some seedlings were not well planted or not planted deep enough with
the roots exposed. Pest infestations, from unknown insects and mealybugs, were evident
on some plants.
The tree guards were very deteriorated and collapsed on the plants. Large proportions of Acacia pycnantha were dead or dying.
Zone monitored: Other Inland (Zone 9)
Site Zone Poly_ID Number of
Transects
Alive (Total
Plants) Alive %
Dead (Total
Plants) Dead %
Total Plants (Alive and
Dead)
Total Number of
Species
Average
Plant health
Camp Coorong
9 2150 30 589 80% 146 20% 735 24 1
9 2149 No plantings
Vegetation Survivorship Monitoring
Page 33 12/07/2013
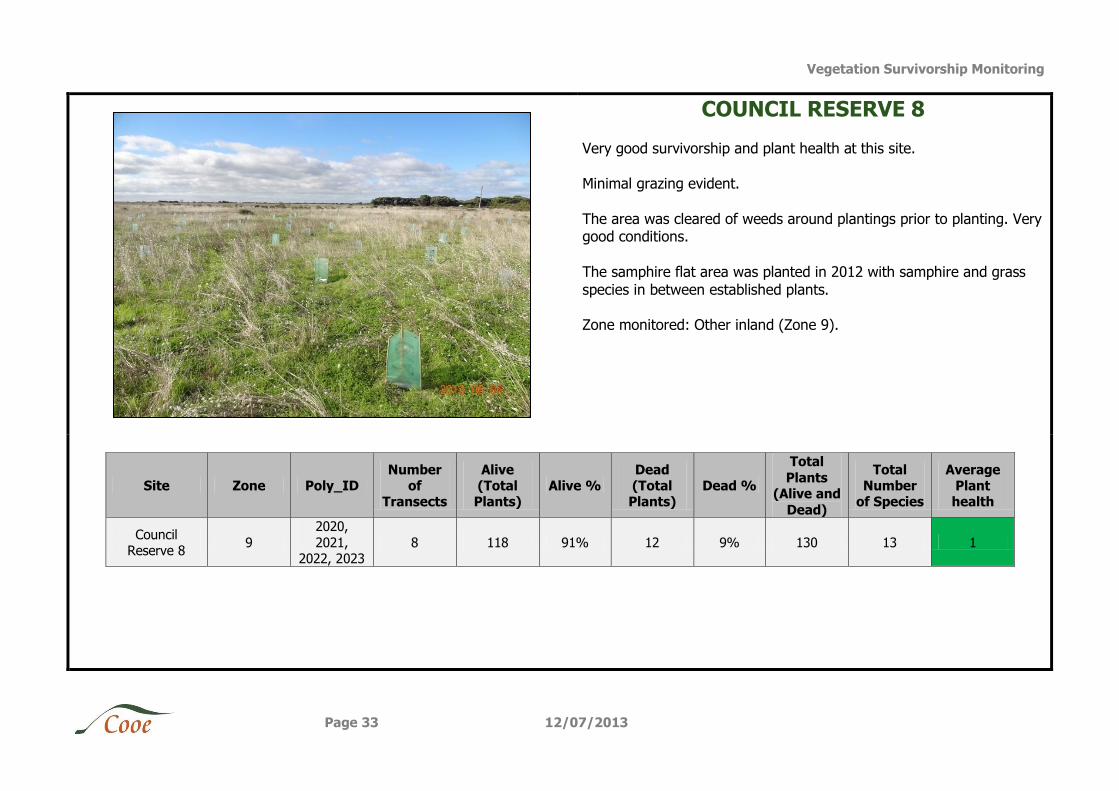
COUNCIL RESERVE 8
Very good survivorship and plant health at this site. Minimal grazing evident.
The area was cleared of weeds around plantings prior to planting. Very good conditions.
The samphire flat area was planted in 2012 with samphire and grass
species in between established plants. Zone monitored: Other inland (Zone 9).
Site Zone Poly_ID Number
of Transects
Alive (Total Plants)
Alive % Dead (Total Plants)
Dead %
Total
Plants (Alive and
Dead)
Total Number
of Species
Average Plant health
Council Reserve 8
9
2020,
2021, 2022, 2023
8 118 91% 12 9% 130 13 1
Vegetation Survivorship Monitoring
Page 34 12/07/2013
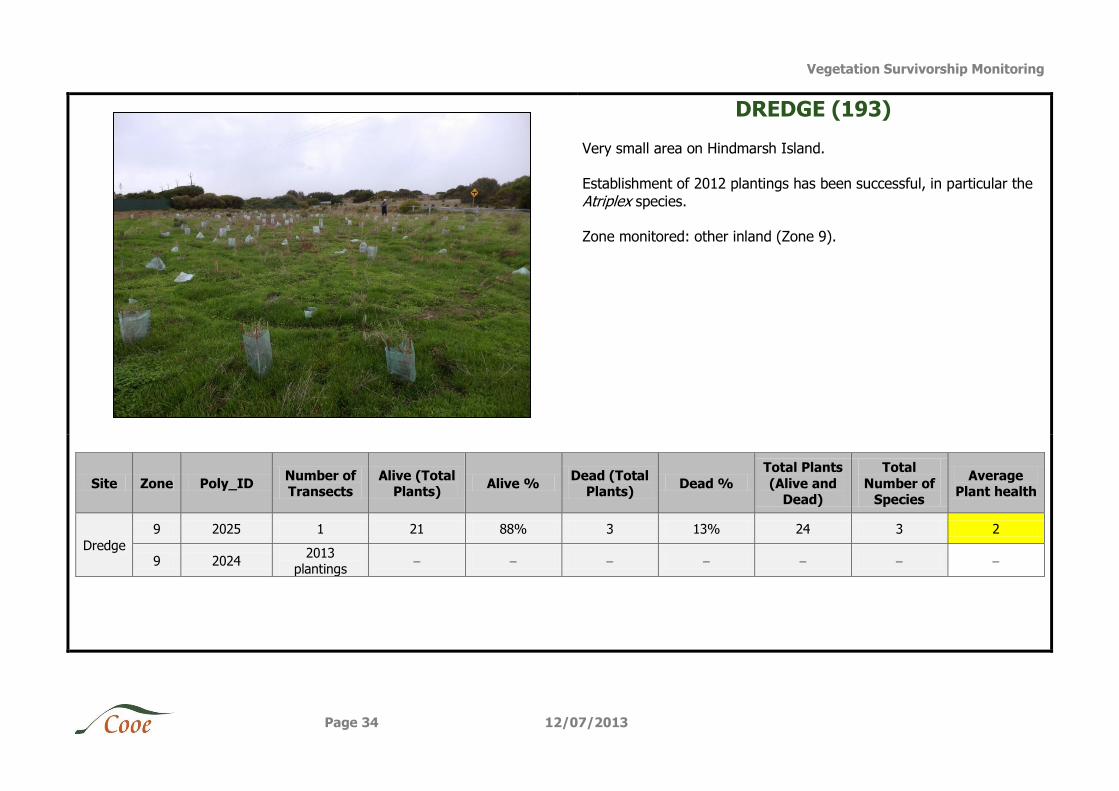
DREDGE (193)
Very small area on Hindmarsh Island. Establishment of 2012 plantings has been successful, in particular the
Atriplex species. Zone monitored: other inland (Zone 9).
Site Zone Poly_ID Number of Transects
Alive (Total Plants)
Alive % Dead (Total
Plants) Dead %
Total Plants
(Alive and Dead)
Total
Number of Species
Average Plant health
Dredge
9 2025 1 21 88% 3 13% 24 3 2
9 2024 2013
plantings
Vegetation Survivorship Monitoring
Page 35 12/07/2013
ECKERT (149)
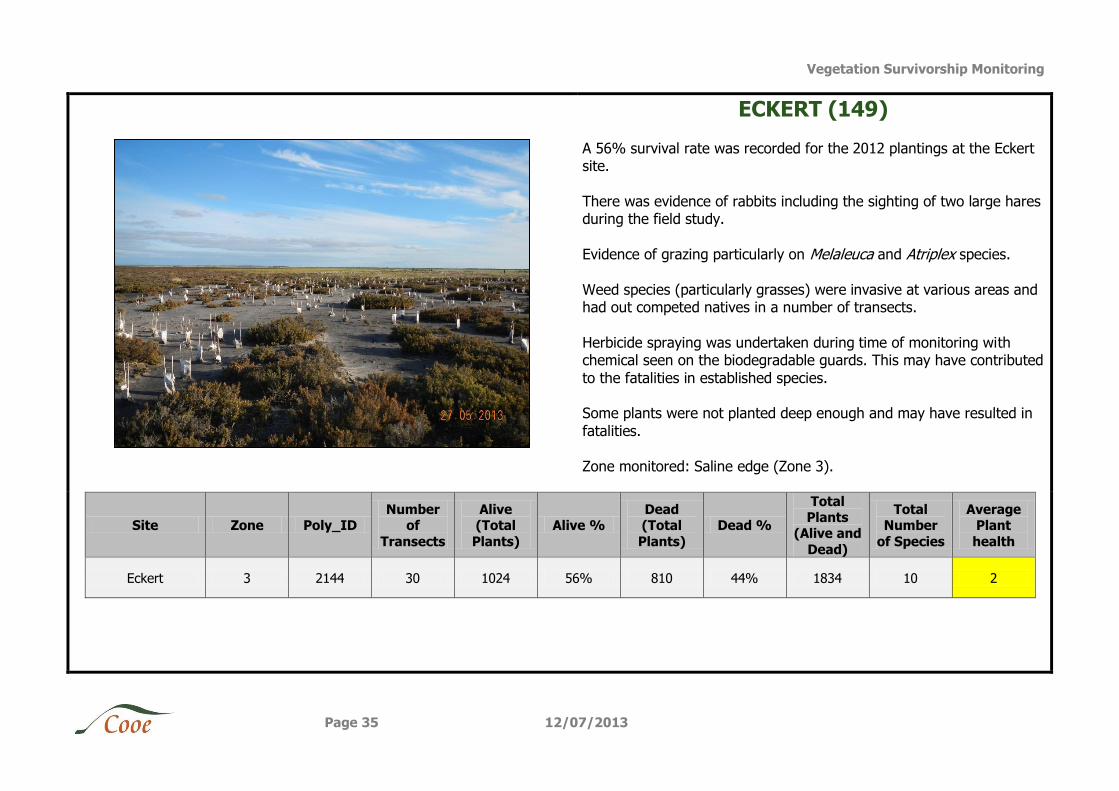
A 56% survival rate was recorded for the 2012 plantings at the Eckert site.
There was evidence of rabbits including the sighting of two large hares during the field study.
Evidence of grazing particularly on Melaleuca and Atriplex species.
Weed species (particularly grasses) were invasive at various areas and had out competed natives in a number of transects.
Herbicide spraying was undertaken during time of monitoring with chemical seen on the biodegradable guards. This may have contributed
to the fatalities in established species. Some plants were not planted deep enough and may have resulted in
fatalities.
Zone monitored: Saline edge (Zone 3).
Site Zone Poly_ID Number
of
Transects
Alive (Total
Plants)
Alive % Dead (Total
Plants)
Dead %
Total Plants
(Alive and
Dead)
Total Number
of Species
Average Plant
health
Eckert 3 2144 30 1024 56% 810 44% 1834 10 2
Vegetation Survivorship Monitoring
Page 36 12/07/2013
ELVISH
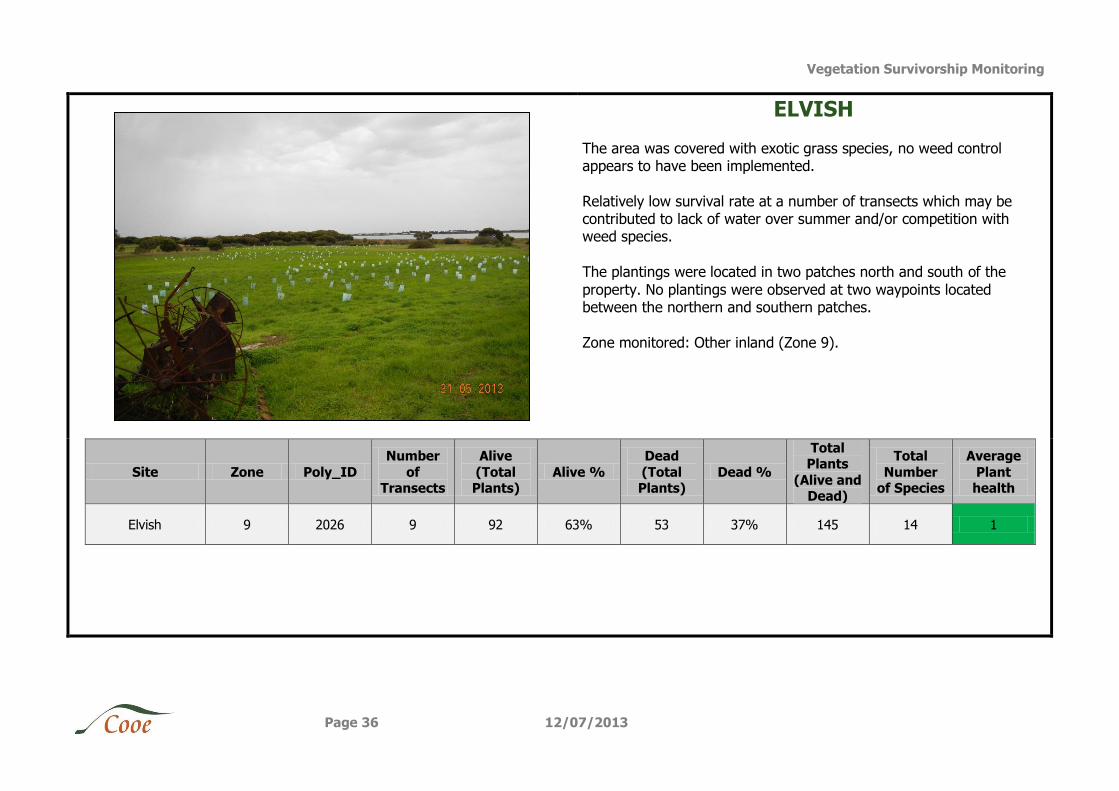
The area was covered with exotic grass species, no weed control appears to have been implemented.
Relatively low survival rate at a number of transects which may be contributed to lack of water over summer and/or competition with weed species.
The plantings were located in two patches north and south of the
property. No plantings were observed at two waypoints located between the northern and southern patches.
Zone monitored: Other inland (Zone 9).
Site Zone Poly_ID
Number
of Transects
Alive
(Total Plants)
Alive %
Dead
(Total Plants)
Dead %
Total Plants
(Alive and Dead)
Total
Number of Species
Average
Plant health
Elvish 9 2026 9 92 63% 53 37% 145 14 1
Vegetation Survivorship Monitoring
Page 37 12/07/2013
FARROW (194)
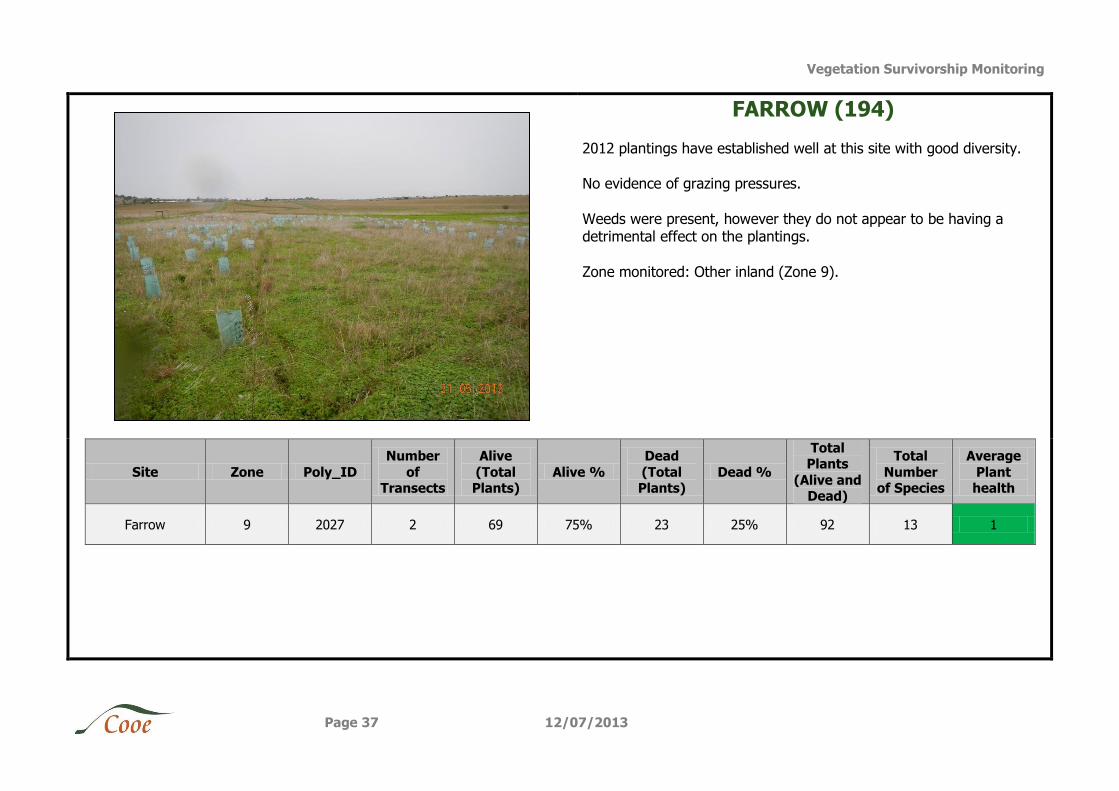
2012 plantings have established well at this site with good diversity. No evidence of grazing pressures.
Weeds were present, however they do not appear to be having a detrimental effect on the plantings.
Zone monitored: Other inland (Zone 9).
Site Zone Poly_ID
Number
of Transects
Alive
(Total Plants)
Alive %
Dead
(Total Plants)
Dead %
Total Plants
(Alive and Dead)
Total
Number of Species
Average
Plant health
Farrow 9 2027 2 69 75% 23 25% 92 13 1
Vegetation Survivorship Monitoring
Page 38 12/07/2013
FERRYMANS (195)
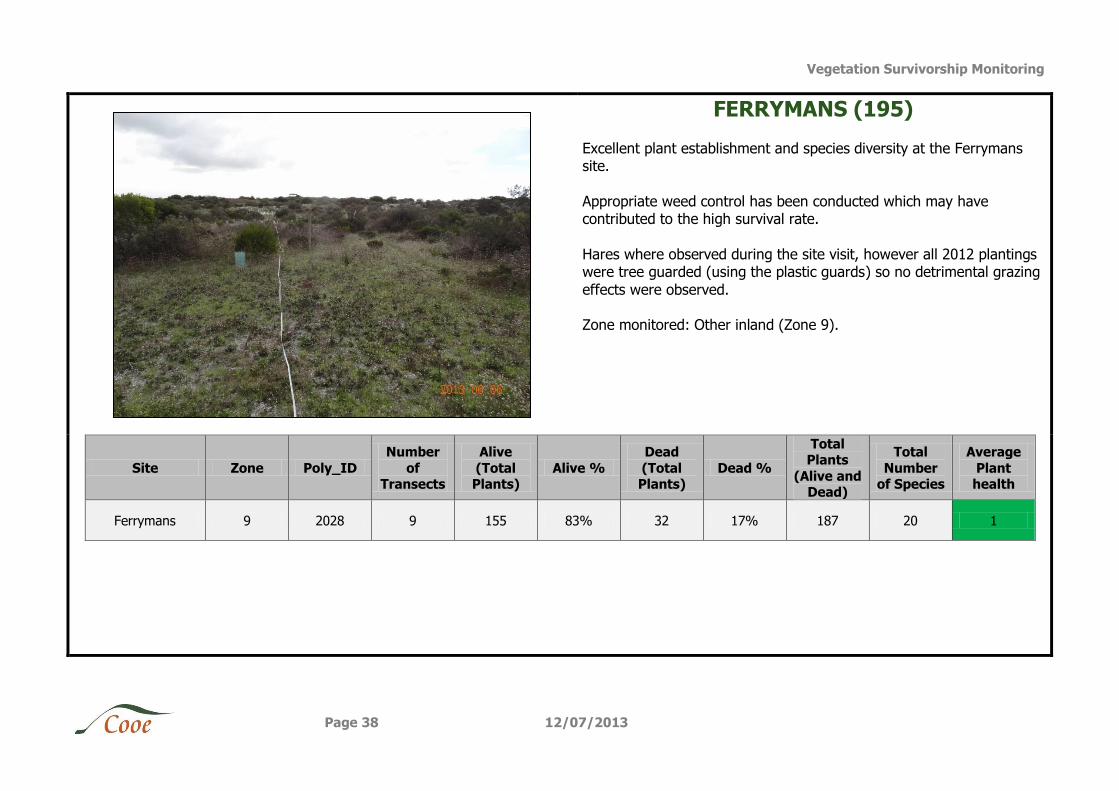
Excellent plant establishment and species diversity at the Ferrymans site.
Appropriate weed control has been conducted which may have contributed to the high survival rate.
Hares where observed during the site visit, however all 2012 plantings were tree guarded (using the plastic guards) so no detrimental grazing
effects were observed. Zone monitored: Other inland (Zone 9).
Site Zone Poly_ID
Number
of Transects
Alive
(Total Plants)
Alive %
Dead
(Total Plants)
Dead %
Total Plants
(Alive and Dead)
Total
Number of Species
Average
Plant health
Ferrymans 9 2028 9 155 83% 32 17% 187 20 1
Vegetation Survivorship Monitoring
Page 39 12/07/2013
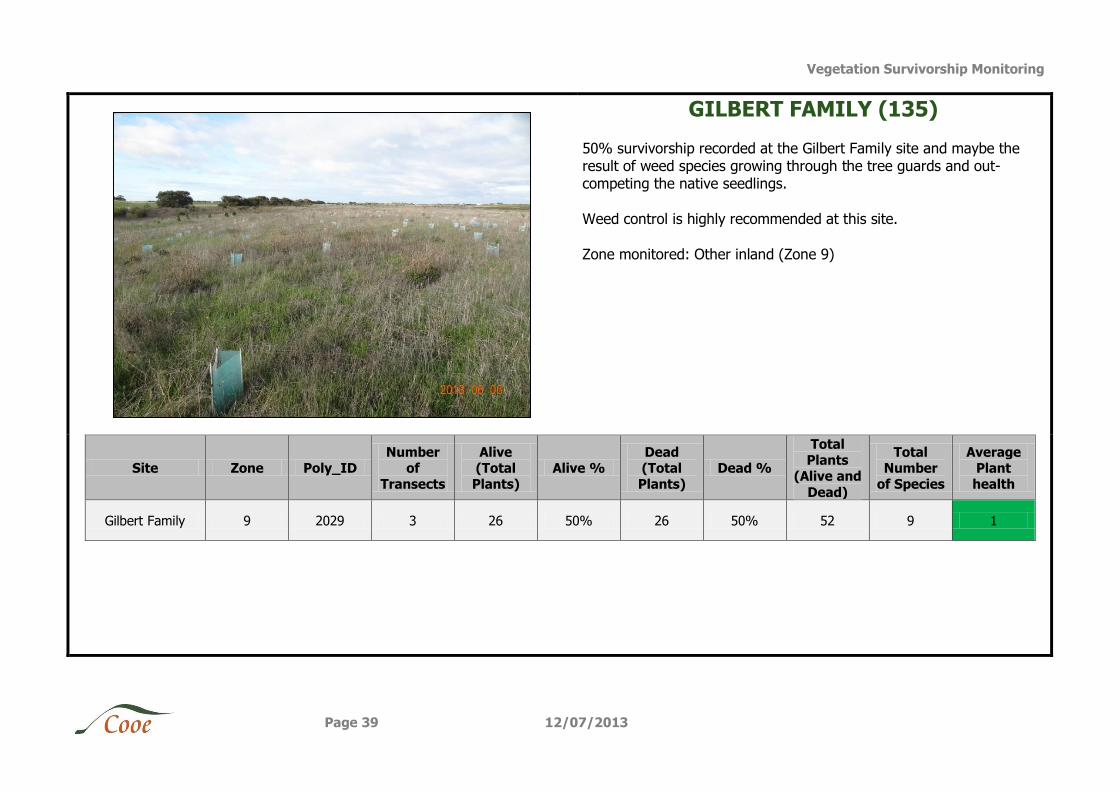
GILBERT FAMILY (135)
50% survivorship recorded at the Gilbert Family site and maybe the result of weed species growing through the tree guards and out-competing the native seedlings.
Weed control is highly recommended at this site.
Zone monitored: Other inland (Zone 9)
Site Zone Poly_ID Number
of Transects
Alive (Total Plants)
Alive % Dead (Total Plants)
Dead %
Total Plants
(Alive and
Dead)
Total Number
of Species
Average Plant health
Gilbert Family 9 2029 3 26 50% 26 50% 52 9 1
Vegetation Survivorship Monitoring
Page 40 12/07/2013
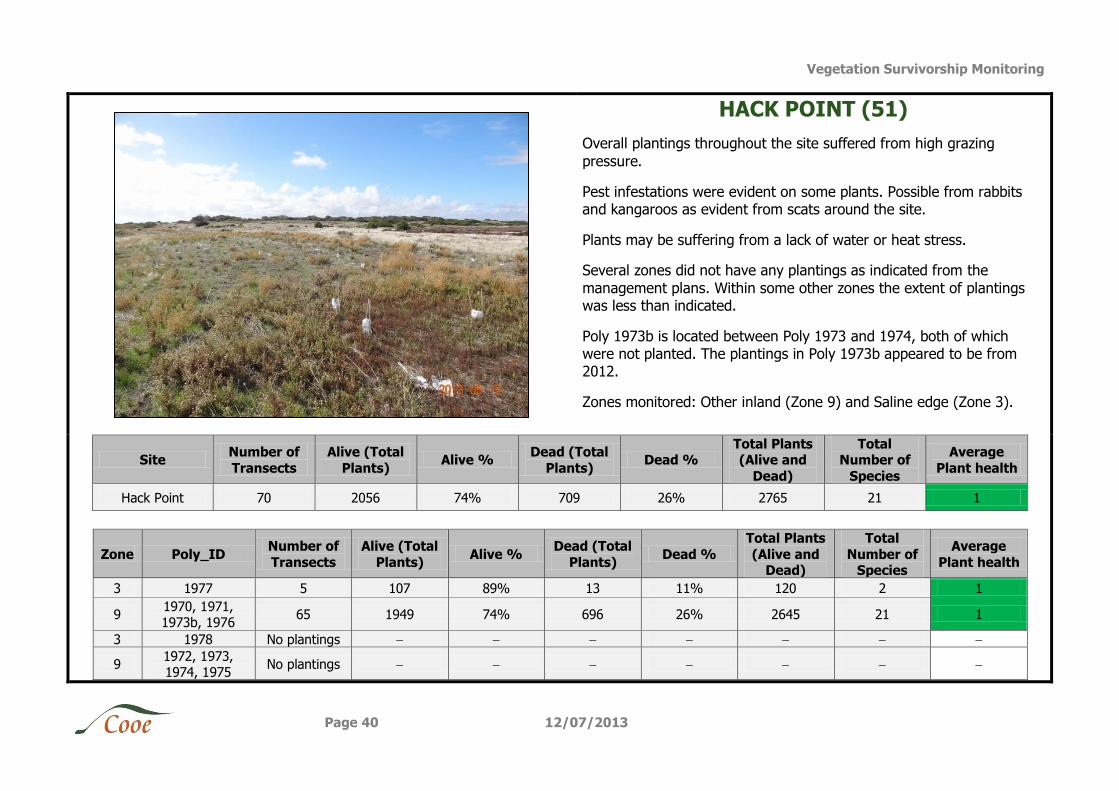
HACK POINT (51)
Overall plantings throughout the site suffered from high grazing
pressure.
Pest infestations were evident on some plants. Possible from rabbits and kangaroos as evident from scats around the site.
Plants may be suffering from a lack of water or heat stress.
Several zones did not have any plantings as indicated from the
management plans. Within some other zones the extent of plantings was less than indicated.
Poly 1973b is located between Poly 1973 and 1974, both of which were not planted. The plantings in Poly 1973b appeared to be from 2012.
Zones monitored: Other inland (Zone 9) and Saline edge (Zone 3).
Site Number of
Transects
Alive (Total
Plants) Alive %
Dead (Total
Plants) Dead %
Total Plants (Alive and
Dead)
Total Number of
Species
Average
Plant health
Hack Point 70 2056 74% 709 26% 2765 21 1
Zone Poly_ID Number of
Transects
Alive (Total
Plants) Alive %
Dead (Total
Plants) Dead %
Total Plants
(Alive and Dead)
Total
Number of Species
Average
Plant health
3 1977 5 107 89% 13 11% 120 2 1
9 1970, 1971, 1973b, 1976
65 1949 74% 696 26% 2645 21 1
3 1978 No plantings
9 1972, 1973, 1974, 1975
No plantings
Vegetation Survivorship Monitoring
Page 41 12/07/2013
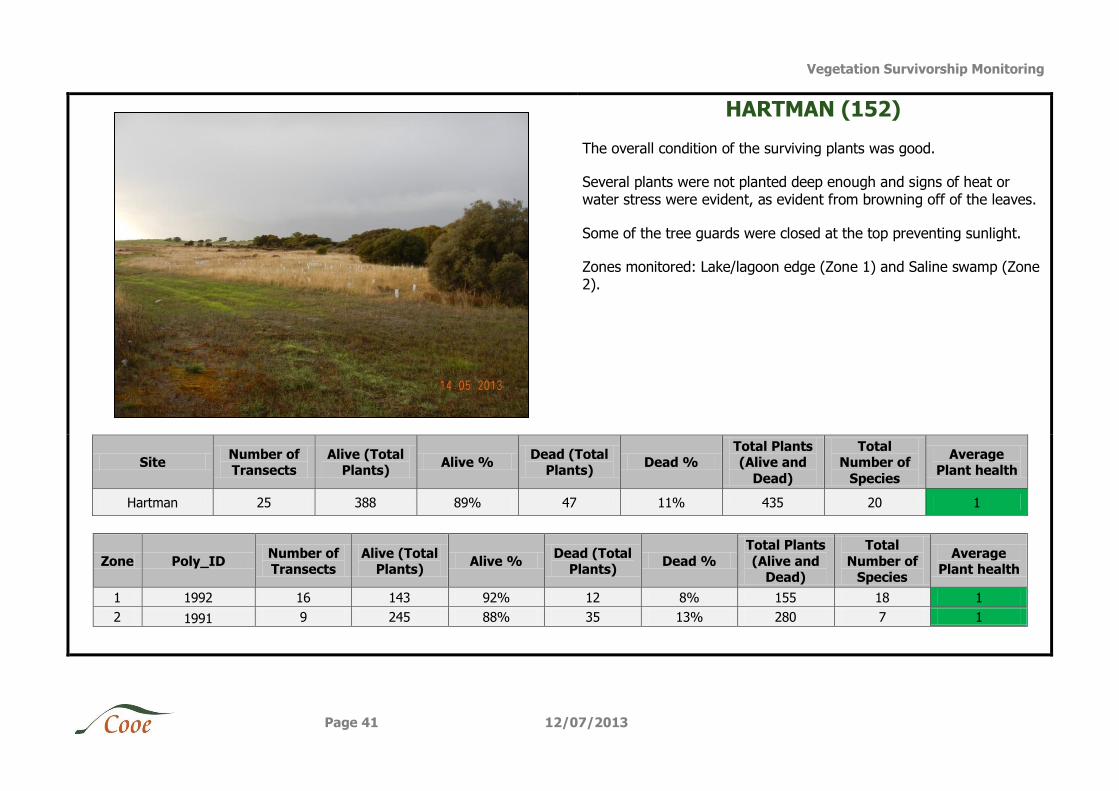
HARTMAN (152)
The overall condition of the surviving plants was good.
Several plants were not planted deep enough and signs of heat or water stress were evident, as evident from browning off of the leaves.
Some of the tree guards were closed at the top preventing sunlight.
Zones monitored: Lake/lagoon edge (Zone 1) and Saline swamp (Zone 2).
Site Number of Transects
Alive (Total Plants)
Alive % Dead (Total
Plants) Dead %
Total Plants (Alive and
Dead)
Total Number of
Species
Average Plant health
Hartman 25 388 89% 47 11% 435 20 1
Zone Poly_ID Number of Transects
Alive (Total Plants)
Alive % Dead (Total
Plants) Dead %
Total Plants
(Alive and Dead)
Total
Number of Species
Average Plant health
1 1992 16 143 92% 12 8% 155 18 1
2 1991 9 245 88% 35 13% 280 7 1
Vegetation Survivorship Monitoring
Page 42 12/07/2013
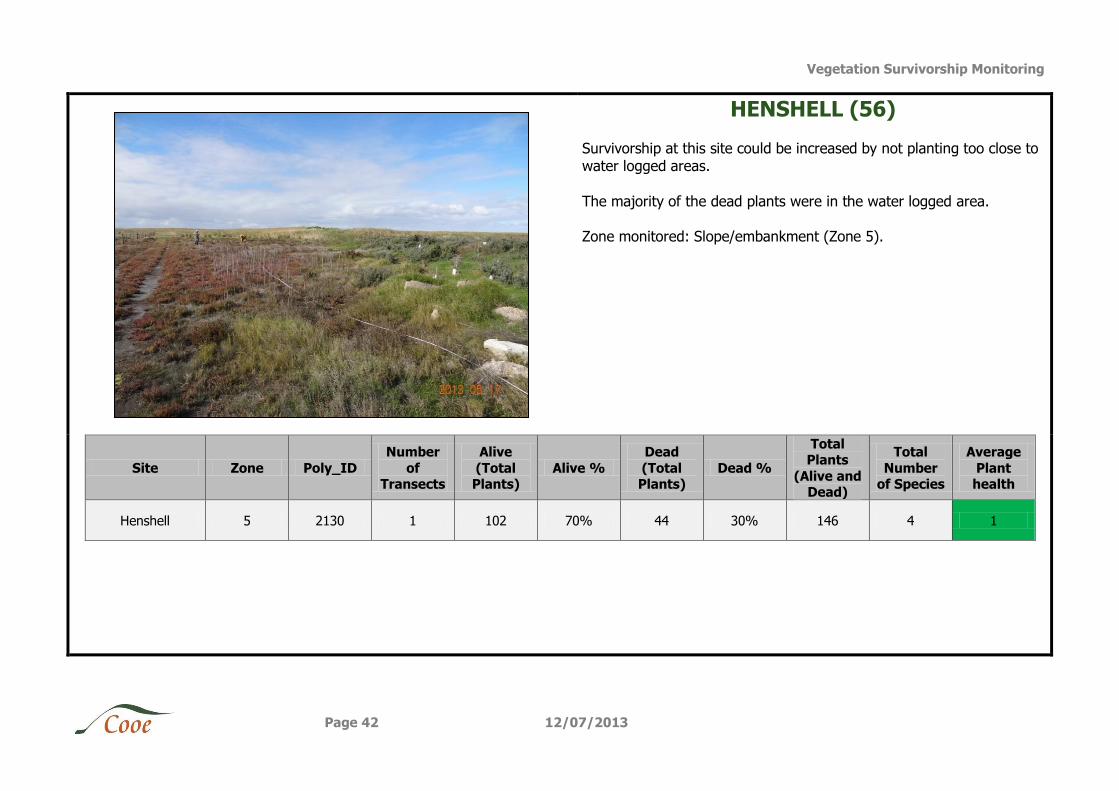
HENSHELL (56)
Survivorship at this site could be increased by not planting too close to water logged areas.
The majority of the dead plants were in the water logged area. Zone monitored: Slope/embankment (Zone 5).
Site Zone Poly_ID
Number
of Transects
Alive
(Total Plants)
Alive %
Dead
(Total Plants)
Dead %
Total Plants
(Alive and Dead)
Total
Number of Species
Average
Plant health
Henshell 5 2130 1 102 70% 44 30% 146 4 1
Vegetation Survivorship Monitoring
Page 43 12/07/2013
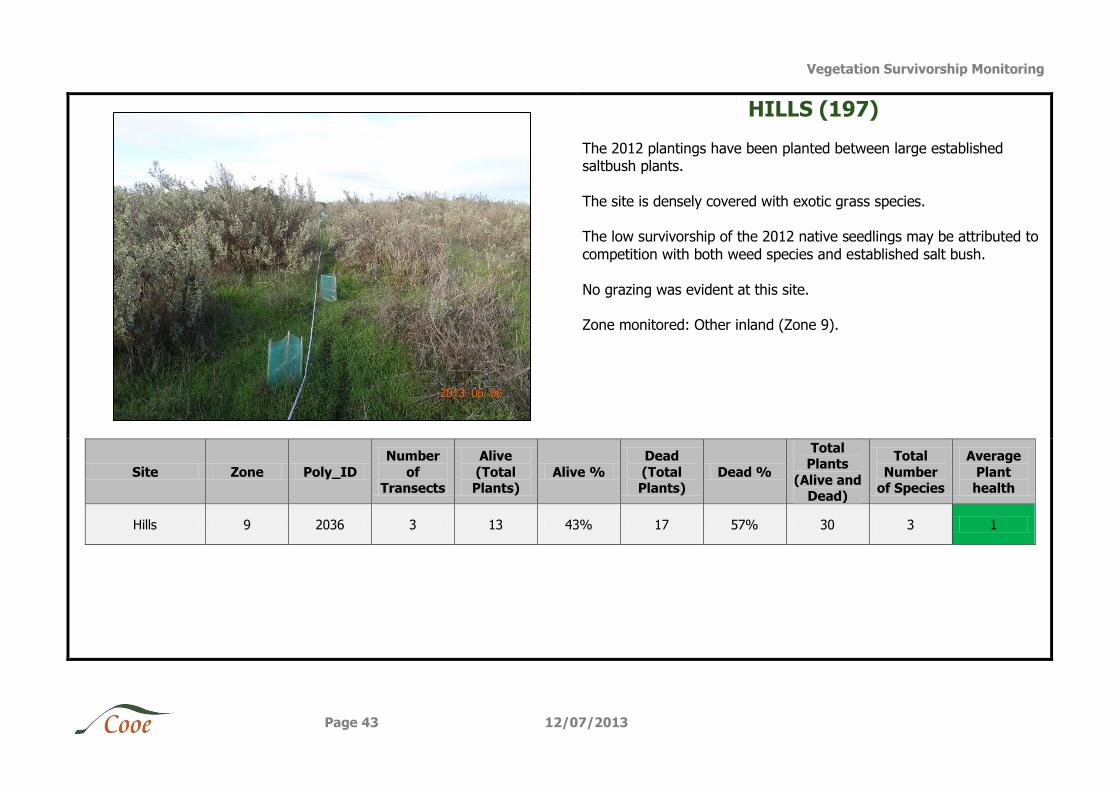
HILLS (197)
The 2012 plantings have been planted between large established saltbush plants.
The site is densely covered with exotic grass species. The low survivorship of the 2012 native seedlings may be attributed to
competition with both weed species and established salt bush.
No grazing was evident at this site. Zone monitored: Other inland (Zone 9).
Site Zone Poly_ID
Number
of Transects
Alive
(Total Plants)
Alive %
Dead
(Total Plants)
Dead %
Total Plants
(Alive and Dead)
Total
Number of Species
Average
Plant health
Hills 9 2036 3 13 43% 17 57% 30 3 1
Vegetation Survivorship Monitoring
Page 44 12/07/2013
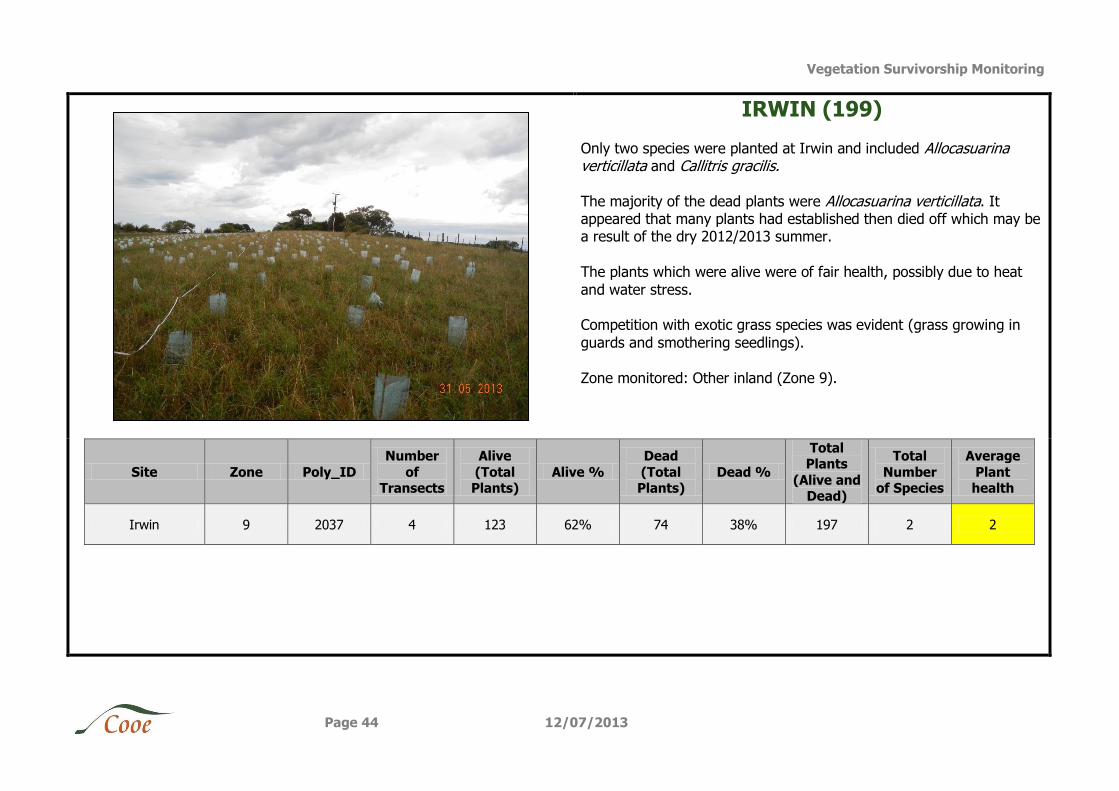
IRWIN (199)
Only two species were planted at Irwin and included Allocasuarina verticillata and Callitris gracilis.
The majority of the dead plants were Allocasuarina verticillata. It appeared that many plants had established then died off which may be a result of the dry 2012/2013 summer.
The plants which were alive were of fair health, possibly due to heat
and water stress. Competition with exotic grass species was evident (grass growing in
guards and smothering seedlings).
Zone monitored: Other inland (Zone 9).
Site Zone Poly_ID
Number
of Transects
Alive
(Total Plants)
Alive %
Dead
(Total Plants)
Dead %
Total Plants
(Alive and Dead)
Total
Number of Species
Average
Plant health
Irwin 9 2037 4 123 62% 74 38% 197 2 2
Vegetation Survivorship Monitoring
Page 45 12/07/2013
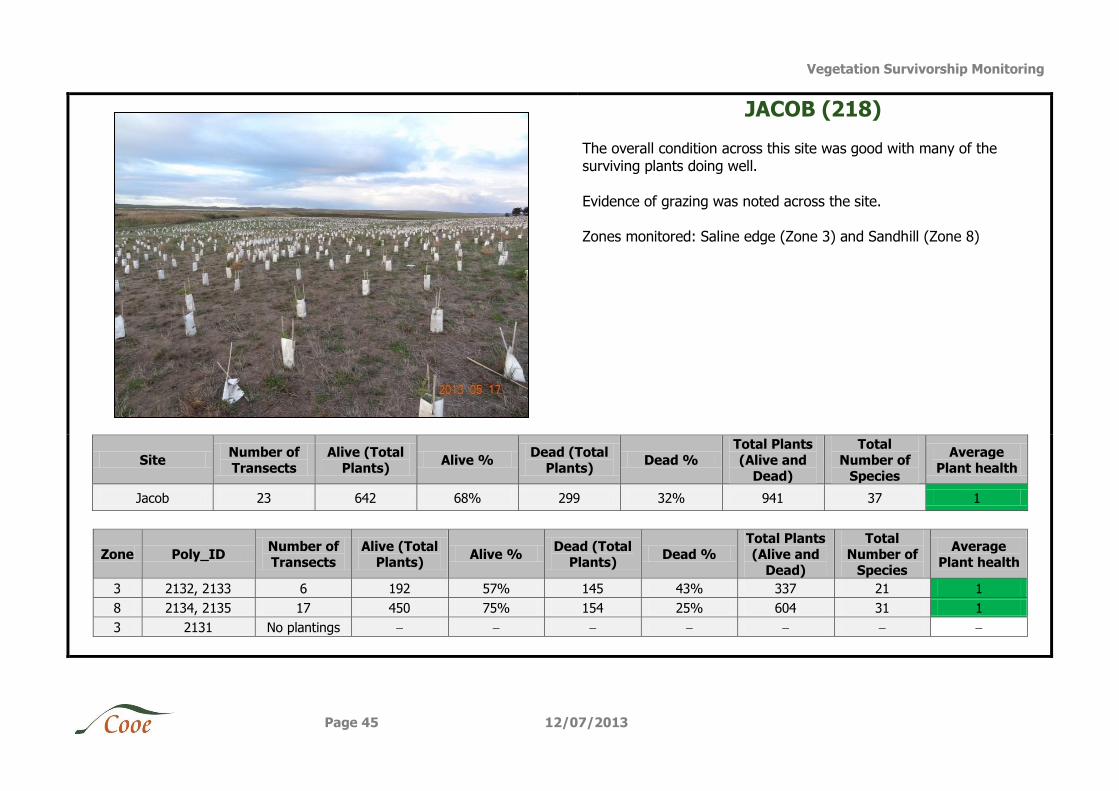
JACOB (218)
The overall condition across this site was good with many of the surviving plants doing well.
Evidence of grazing was noted across the site. Zones monitored: Saline edge (Zone 3) and Sandhill (Zone 8)
Site Number of Transects
Alive (Total Plants)
Alive % Dead (Total
Plants) Dead %
Total Plants (Alive and
Dead)
Total Number of
Species
Average Plant health
Jacob 23 642 68% 299 32% 941 37 1
Zone Poly_ID Number of Transects
Alive (Total Plants)
Alive % Dead (Total
Plants) Dead %
Total Plants (Alive and
Dead)
Total Number of
Species
Average Plant health
3 2132, 2133 6 192 57% 145 43% 337 21 1
8 2134, 2135 17 450 75% 154 25% 604 31 1
3 2131 No plantings
Vegetation Survivorship Monitoring
Page 46 12/07/2013
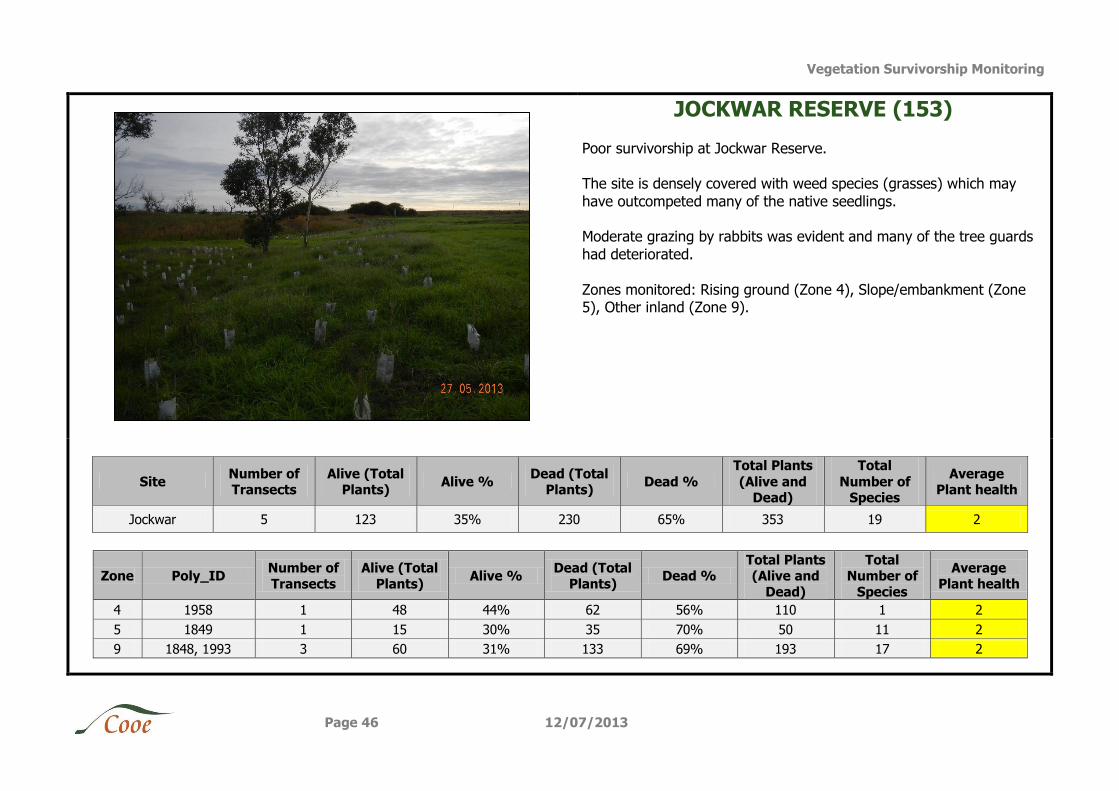
JOCKWAR RESERVE (153)
Poor survivorship at Jockwar Reserve. The site is densely covered with weed species (grasses) which may
have outcompeted many of the native seedlings. Moderate grazing by rabbits was evident and many of the tree guards
had deteriorated.
Zones monitored: Rising ground (Zone 4), Slope/embankment (Zone 5), Other inland (Zone 9).
Site Number of Transects
Alive (Total Plants)
Alive % Dead (Total
Plants) Dead %
Total Plants
(Alive and Dead)
Total
Number of Species
Average Plant health
Jockwar 5 123 35% 230 65% 353 19 2
Zone Poly_ID Number of Transects
Alive (Total Plants)
Alive % Dead (Total
Plants) Dead %
Total Plants (Alive and
Dead)
Total Number of
Species
Average Plant health
4 1958 1 48 44% 62 56% 110 1 2
5 1849 1 15 30% 35 70% 50 11 2
9 1848, 1993 3 60 31% 133 69% 193 17 2
Vegetation Survivorship Monitoring
Page 47 12/07/2013
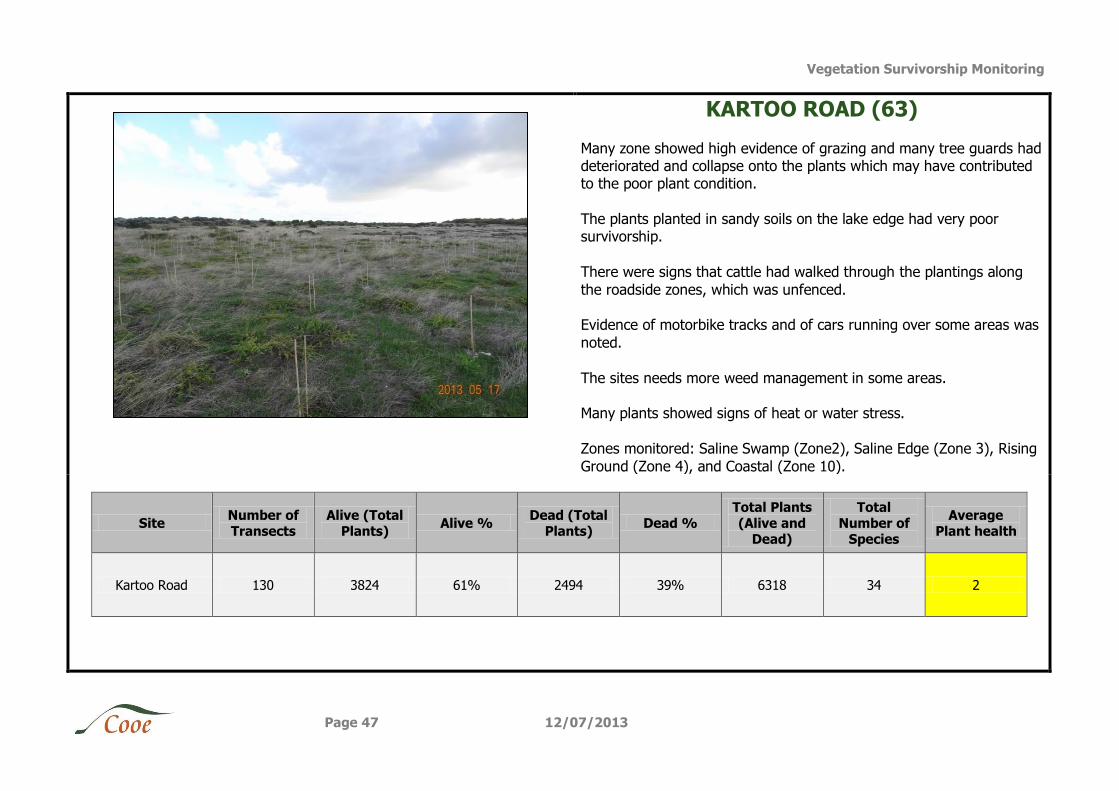
KARTOO ROAD (63)
Many zone showed high evidence of grazing and many tree guards had deteriorated and collapse onto the plants which may have contributed to the poor plant condition.
The plants planted in sandy soils on the lake edge had very poor survivorship.
There were signs that cattle had walked through the plantings along
the roadside zones, which was unfenced. Evidence of motorbike tracks and of cars running over some areas was
noted.
The sites needs more weed management in some areas. Many plants showed signs of heat or water stress.
Zones monitored: Saline Swamp (Zone2), Saline Edge (Zone 3), Rising
Ground (Zone 4), and Coastal (Zone 10).
Site Number of Transects
Alive (Total Plants)
Alive % Dead (Total
Plants) Dead %
Total Plants (Alive and
Dead)
Total Number of
Species
Average Plant health
Kartoo Road 130 3824 61% 2494 39% 6318 34 2
Vegetation Survivorship Monitoring
Page 48 12/07/2013
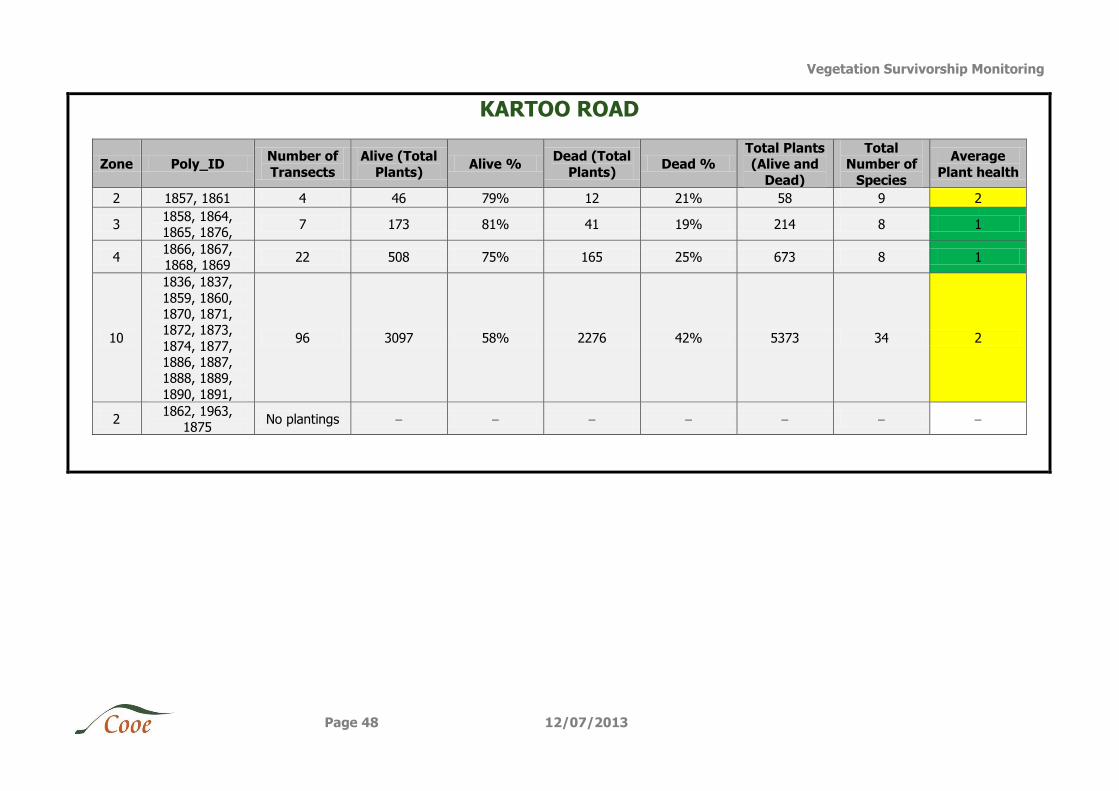
KARTOO ROAD
Zone Poly_ID Number of
Transects
Alive (Total
Plants) Alive %
Dead (Total
Plants) Dead %
Total Plants (Alive and
Dead)
Total Number of
Species
Average
Plant health
2 1857, 1861 4 46 79% 12 21% 58 9 2
3 1858, 1864, 1865, 1876,
7 173 81% 41 19% 214 8 1
4 1866, 1867, 1868, 1869
22 508 75% 165 25% 673 8 1
10
1836, 1837,
1859, 1860, 1870, 1871, 1872, 1873,
1874, 1877, 1886, 1887, 1888, 1889,
1890, 1891,
96 3097 58% 2276 42% 5373 34 2
2 1862, 1963,
1875 No plantings
Vegetation Survivorship Monitoring
Page 49 12/07/2013
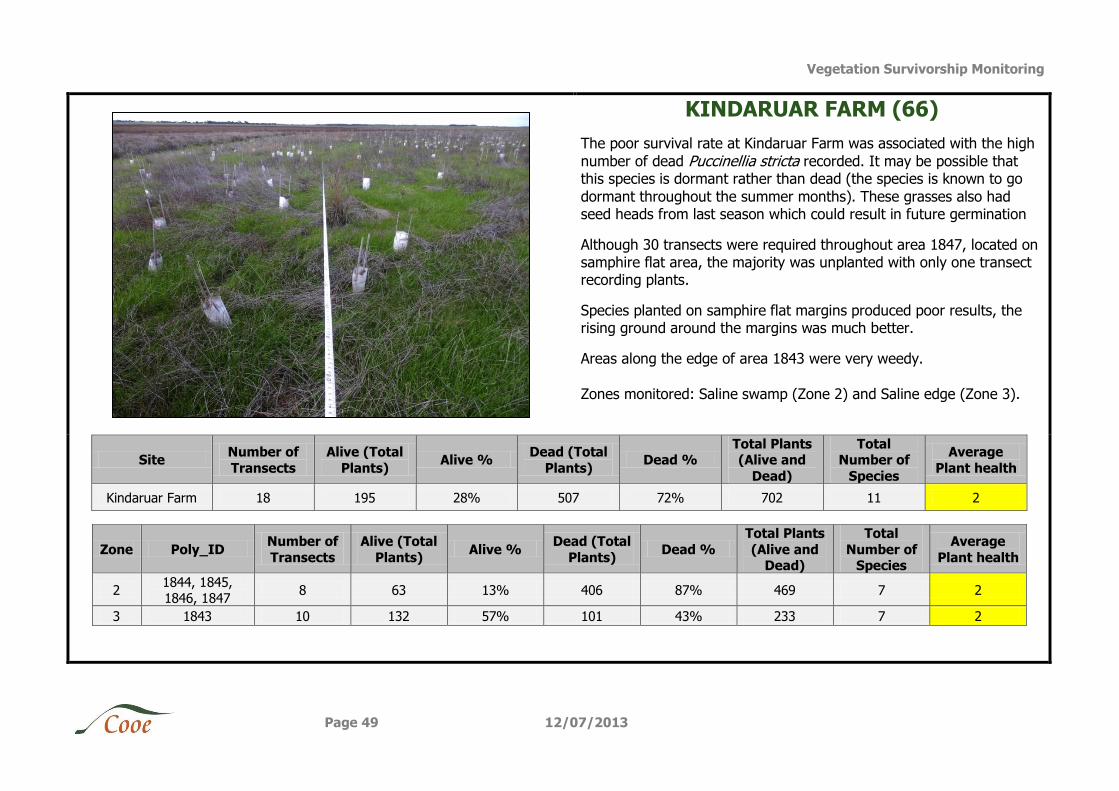
KINDARUAR FARM (66)
The poor survival rate at Kindaruar Farm was associated with the high
number of dead Puccinellia stricta recorded. It may be possible that this species is dormant rather than dead (the species is known to go
dormant throughout the summer months). These grasses also had seed heads from last season which could result in future germination
Although 30 transects were required throughout area 1847, located on samphire flat area, the majority was unplanted with only one transect recording plants.
Species planted on samphire flat margins produced poor results, the rising ground around the margins was much better.
Areas along the edge of area 1843 were very weedy.
Zones monitored: Saline swamp (Zone 2) and Saline edge (Zone 3).
Site Number of
Transects
Alive (Total
Plants) Alive %
Dead (Total
Plants) Dead %
Total Plants (Alive and
Dead)
Total Number of
Species
Average
Plant health
Kindaruar Farm 18 195 28% 507 72% 702 11 2
Zone Poly_ID Number of
Transects
Alive (Total
Plants) Alive %
Dead (Total
Plants) Dead %
Total Plants
(Alive and Dead)
Total
Number of Species
Average
Plant health
2 1844, 1845, 1846, 1847
8 63 13% 406 87% 469 7 2
3 1843 10 132 57% 101 43% 233 7 2
Vegetation Survivorship Monitoring
Page 50 12/07/2013
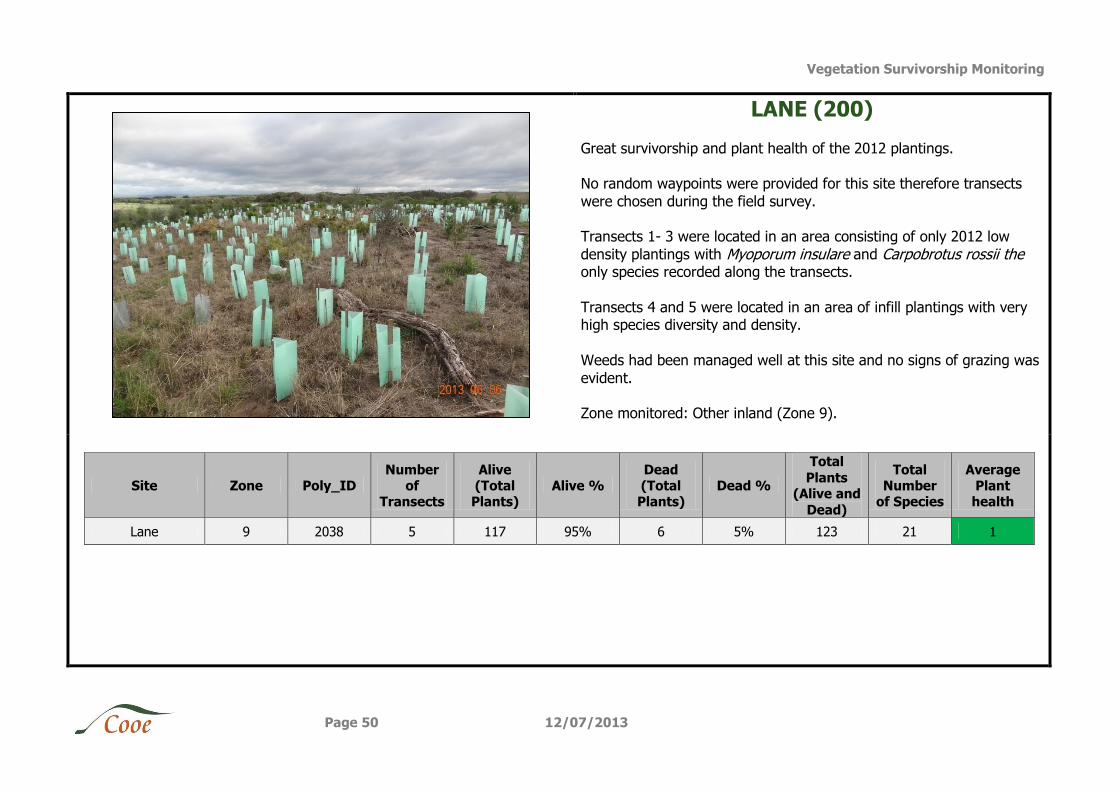
LANE (200)
Great survivorship and plant health of the 2012 plantings. No random waypoints were provided for this site therefore transects
were chosen during the field survey. Transects 1- 3 were located in an area consisting of only 2012 low
density plantings with Myoporum insulare and Carpobrotus rossii the only species recorded along the transects.
Transects 4 and 5 were located in an area of infill plantings with very high species diversity and density.
Weeds had been managed well at this site and no signs of grazing was
evident. Zone monitored: Other inland (Zone 9).
Site Zone Poly_ID Number
of Transects
Alive (Total Plants)
Alive % Dead (Total Plants)
Dead %
Total
Plants (Alive and
Dead)
Total Number
of Species
Average Plant health
Lane 9 2038 5 117 95% 6 5% 123 21 1
Vegetation Survivorship Monitoring
Page 51 12/07/2013
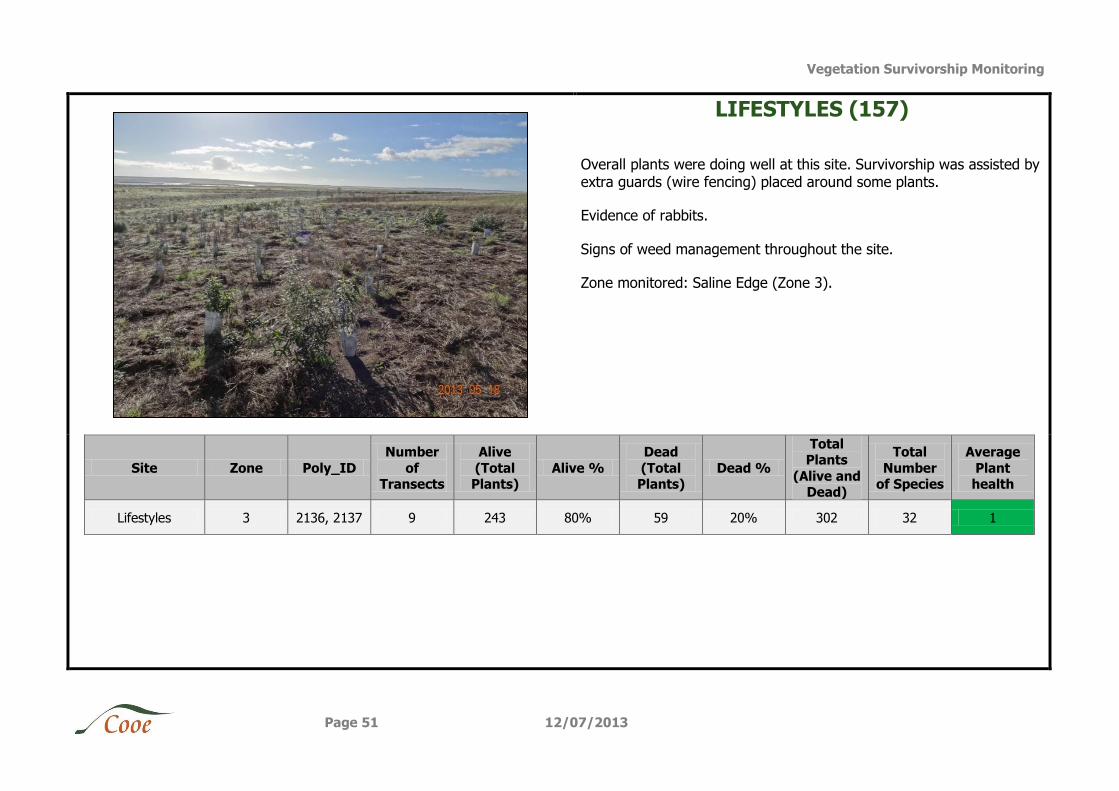
LIFESTYLES (157)
Overall plants were doing well at this site. Survivorship was assisted by extra guards (wire fencing) placed around some plants.
Evidence of rabbits.
Signs of weed management throughout the site.
Zone monitored: Saline Edge (Zone 3).
Site Zone Poly_ID
Number
of Transects
Alive
(Total Plants)
Alive %
Dead
(Total Plants)
Dead %
Total Plants
(Alive and Dead)
Total
Number of Species
Average
Plant health
Lifestyles 3 2136, 2137 9 243 80% 59 20% 302 32 1
Vegetation Survivorship Monitoring
Page 52 12/07/2013
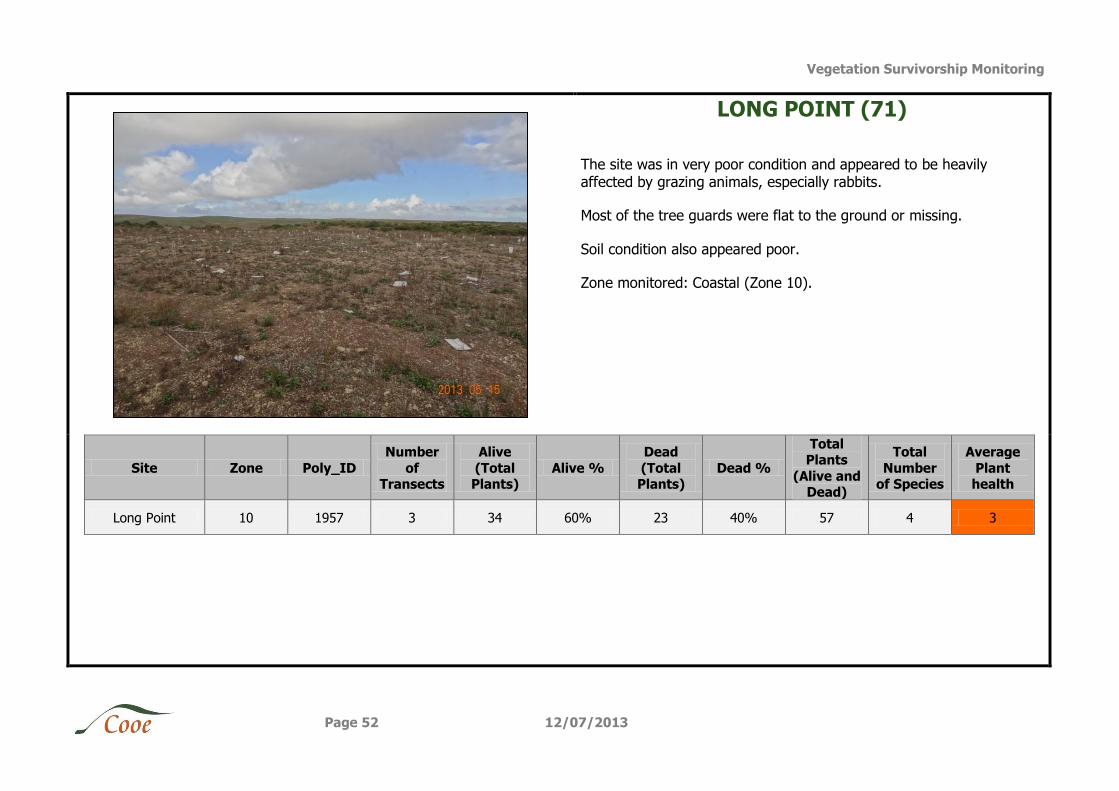
LONG POINT (71)
The site was in very poor condition and appeared to be heavily affected by grazing animals, especially rabbits.
Most of the tree guards were flat to the ground or missing.
Soil condition also appeared poor.
Zone monitored: Coastal (Zone 10).
Site Zone Poly_ID
Number
of Transects
Alive
(Total Plants)
Alive %
Dead
(Total Plants)
Dead %
Total Plants
(Alive and Dead)
Total
Number of Species
Average
Plant health
Long Point 10 1957 3 34 60% 23 40% 57 4 3
Vegetation Survivorship Monitoring
Page 53 12/07/2013
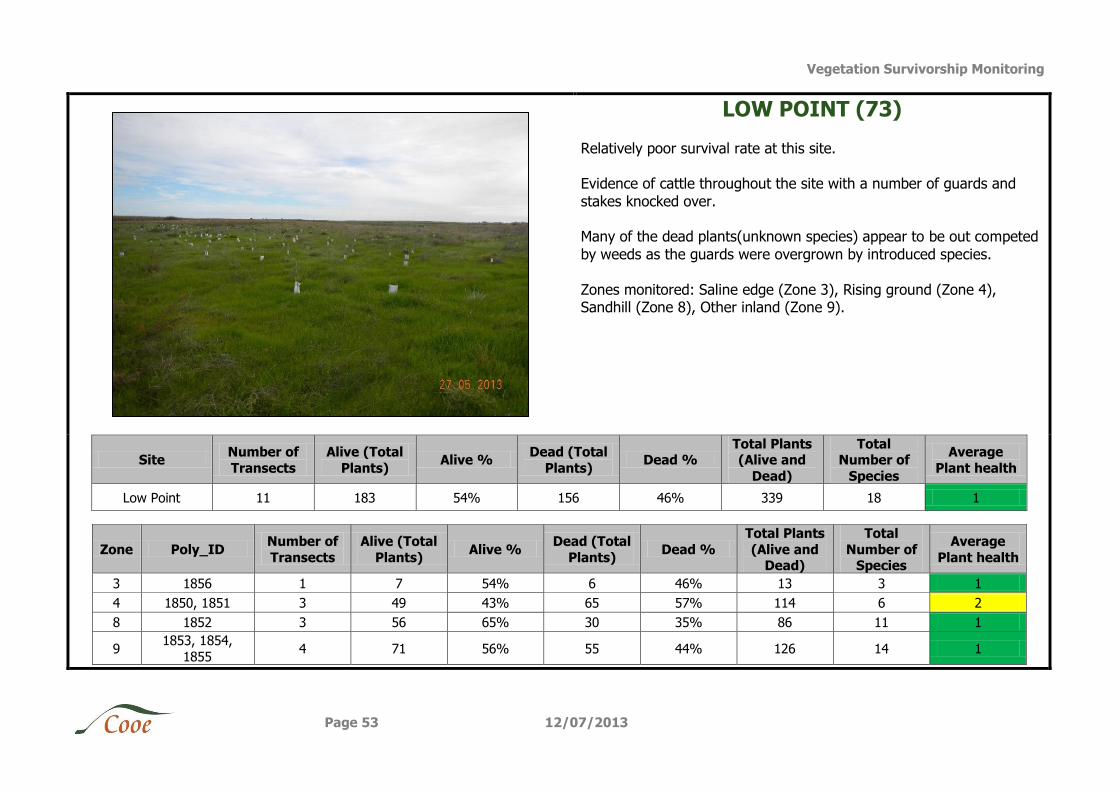
LOW POINT (73)
Relatively poor survival rate at this site. Evidence of cattle throughout the site with a number of guards and
stakes knocked over. Many of the dead plants(unknown species) appear to be out competed
by weeds as the guards were overgrown by introduced species.
Zones monitored: Saline edge (Zone 3), Rising ground (Zone 4), Sandhill (Zone 8), Other inland (Zone 9).
Site Number of
Transects
Alive (Total
Plants) Alive %
Dead (Total
Plants) Dead %
Total Plants (Alive and
Dead)
Total Number of
Species
Average
Plant health
Low Point 11 183 54% 156 46% 339 18 1
Zone Poly_ID Number of
Transects
Alive (Total
Plants) Alive %
Dead (Total
Plants) Dead %
Total Plants
(Alive and Dead)
Total
Number of Species
Average
Plant health
3 1856 1 7 54% 6 46% 13 3 1
4 1850, 1851 3 49 43% 65 57% 114 6 2
8 1852 3 56 65% 30 35% 86 11 1
9 1853, 1854,
1855 4 71 56% 55 44% 126 14 1
Vegetation Survivorship Monitoring
Page 54 12/07/2013
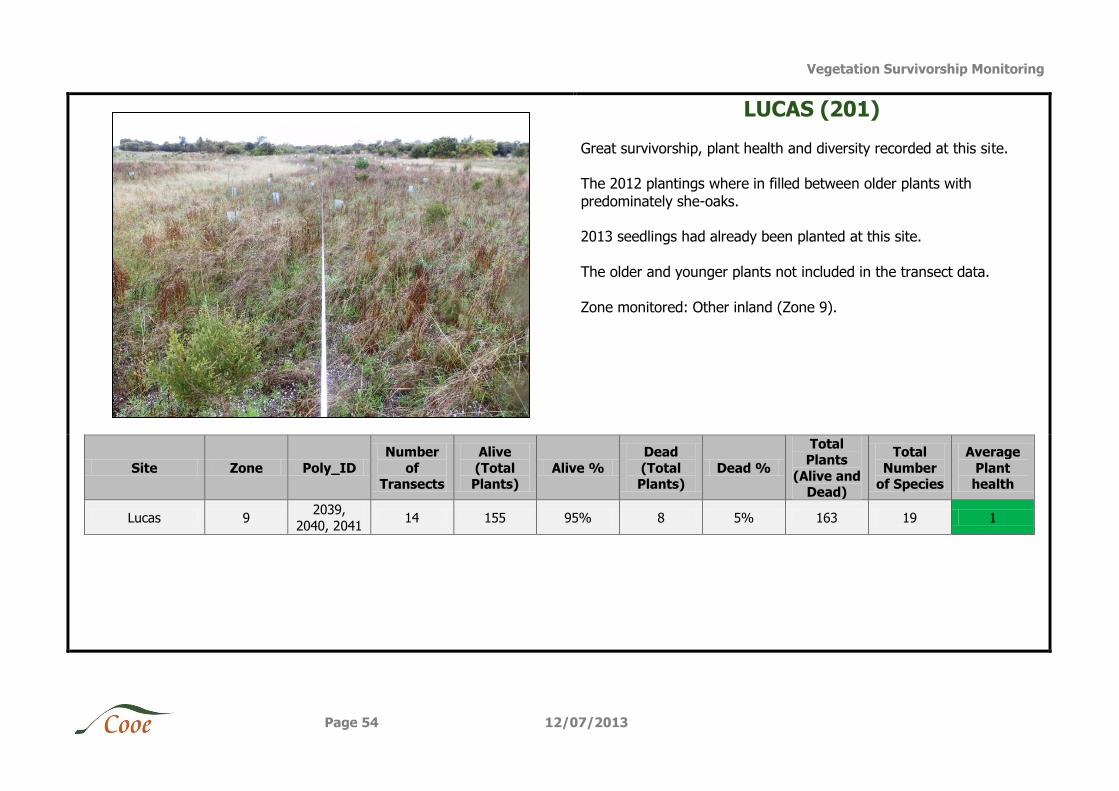
LUCAS (201)
Great survivorship, plant health and diversity recorded at this site. The 2012 plantings where in filled between older plants with
predominately she-oaks. 2013 seedlings had already been planted at this site.
The older and younger plants not included in the transect data.
Zone monitored: Other inland (Zone 9).
Site Zone Poly_ID
Number
of Transects
Alive
(Total Plants)
Alive %
Dead
(Total Plants)
Dead %
Total Plants
(Alive and Dead)
Total
Number of Species
Average
Plant health
Lucas 9 2039,
2040, 2041 14 155 95% 8 5% 163 19 1
Vegetation Survivorship Monitoring
Page 55 12/07/2013
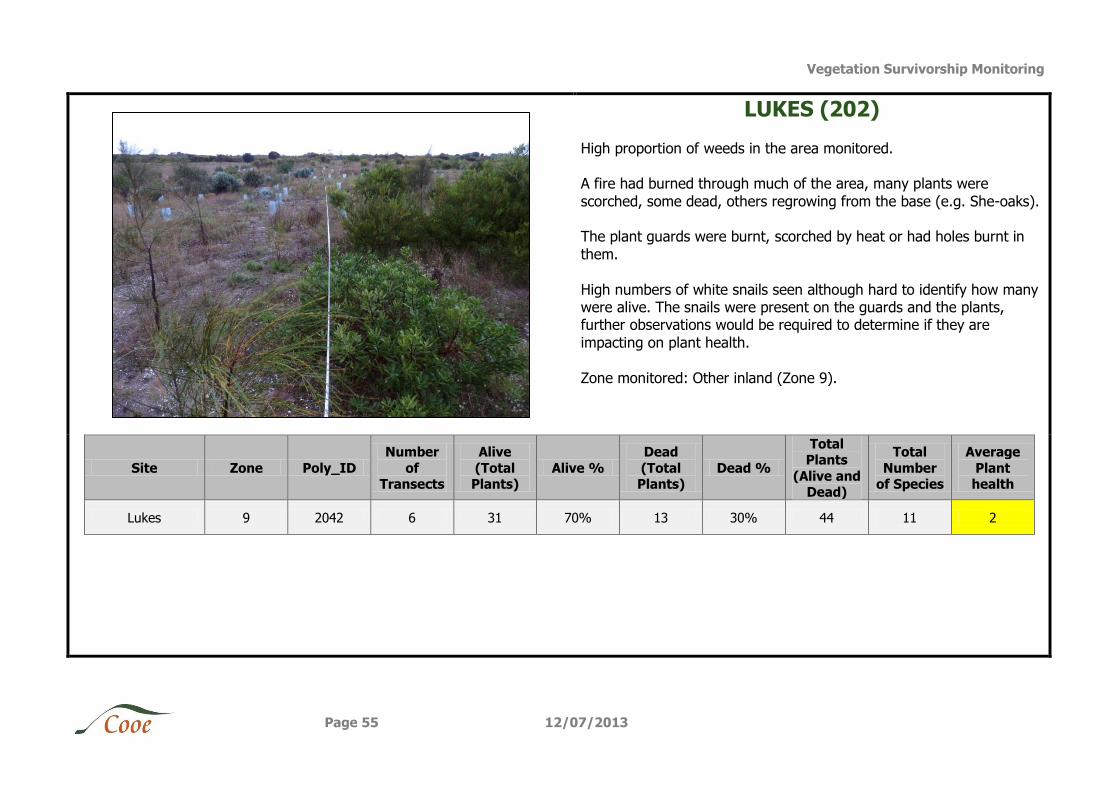
LUKES (202)
High proportion of weeds in the area monitored. A fire had burned through much of the area, many plants were
scorched, some dead, others regrowing from the base (e.g. She-oaks). The plant guards were burnt, scorched by heat or had holes burnt in
them.
High numbers of white snails seen although hard to identify how many were alive. The snails were present on the guards and the plants, further observations would be required to determine if they are
impacting on plant health.
Zone monitored: Other inland (Zone 9).
Site Zone Poly_ID
Number
of Transects
Alive
(Total Plants)
Alive %
Dead
(Total Plants)
Dead %
Total Plants
(Alive and Dead)
Total
Number of Species
Average
Plant health
Lukes 9 2042 6 31 70% 13 30% 44 11 2
Vegetation Survivorship Monitoring
Page 56 12/07/2013
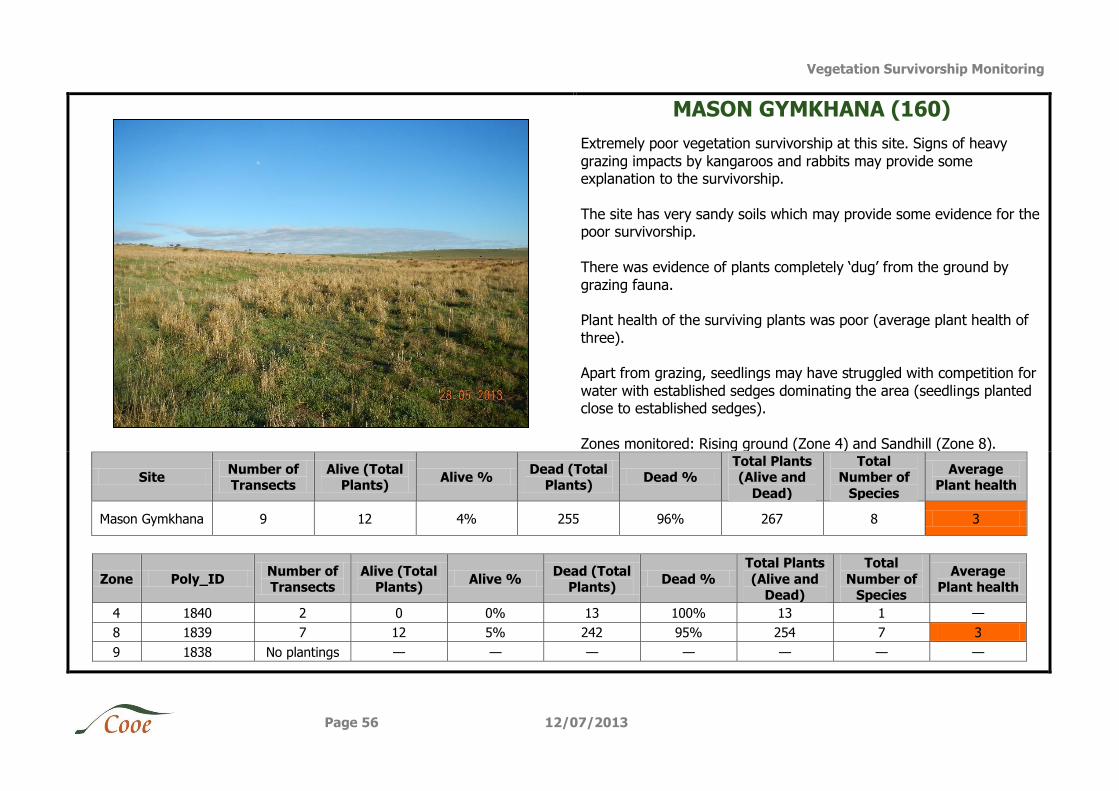
MASON GYMKHANA (160)
Extremely poor vegetation survivorship at this site. Signs of heavy
grazing impacts by kangaroos and rabbits may provide some explanation to the survivorship.
The site has very sandy soils which may provide some evidence for the poor survivorship.
There was evidence of plants completely ‘dug’ from the ground by
grazing fauna. Plant health of the surviving plants was poor (average plant health of
three). Apart from grazing, seedlings may have struggled with competition for
water with established sedges dominating the area (seedlings planted close to established sedges).
Zones monitored: Rising ground (Zone 4) and Sandhill (Zone 8).
Site Number of Transects
Alive (Total Plants)
Alive % Dead (Total
Plants) Dead %
Total Plants (Alive and
Dead)
Total Number of
Species
Average Plant health
Mason Gymkhana 9 12 4% 255 96% 267 8 3
Zone Poly_ID Number of Transects
Alive (Total Plants)
Alive % Dead (Total
Plants) Dead %
Total Plants
(Alive and Dead)
Total
Number of Species
Average Plant health
4 1840 2 0 0% 13 100% 13 1 —
8 1839 7 12 5% 242 95% 254 7 3
9 1838 No plantings — — — — — — —
Vegetation Survivorship Monitoring
Page 57 12/07/2013
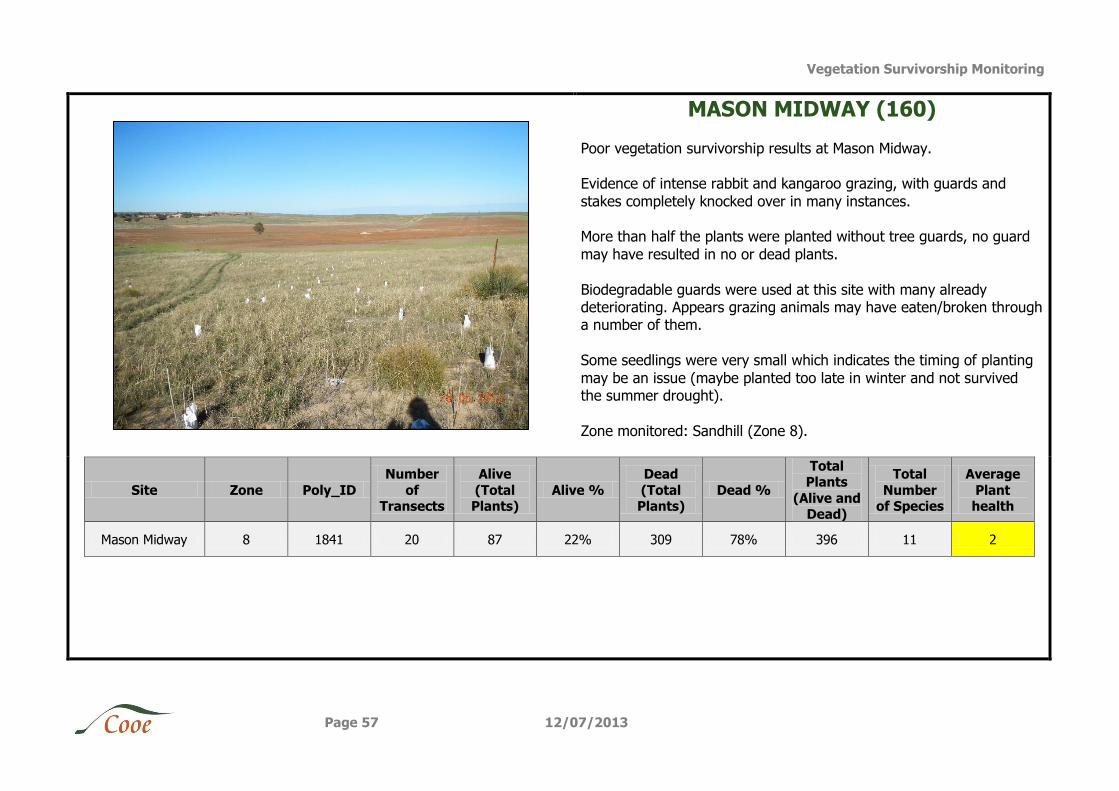
MASON MIDWAY (160)
Poor vegetation survivorship results at Mason Midway. Evidence of intense rabbit and kangaroo grazing, with guards and
stakes completely knocked over in many instances. More than half the plants were planted without tree guards, no guard
may have resulted in no or dead plants.
Biodegradable guards were used at this site with many already deteriorating. Appears grazing animals may have eaten/broken through a number of them.
Some seedlings were very small which indicates the timing of planting
may be an issue (maybe planted too late in winter and not survived the summer drought).
Zone monitored: Sandhill (Zone 8).
Site Zone Poly_ID
Number
of Transects
Alive
(Total Plants)
Alive %
Dead
(Total Plants)
Dead %
Total Plants
(Alive and Dead)
Total
Number of Species
Average
Plant health
Mason Midway 8 1841 20 87 22% 309 78% 396 11 2
Vegetation Survivorship Monitoring
Page 58 12/07/2013
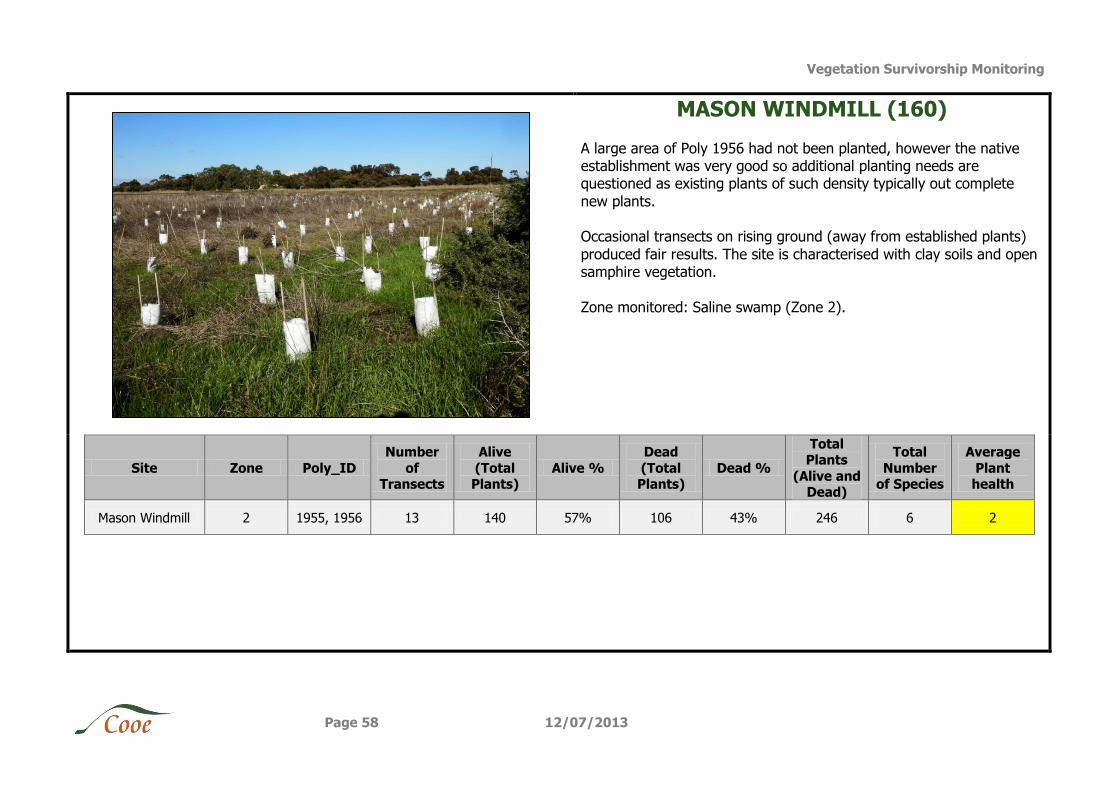
MASON WINDMILL (160)
A large area of Poly 1956 had not been planted, however the native establishment was very good so additional planting needs are questioned as existing plants of such density typically out complete
new plants. Occasional transects on rising ground (away from established plants)
produced fair results. The site is characterised with clay soils and open samphire vegetation.
Zone monitored: Saline swamp (Zone 2).
Site Zone Poly_ID
Number
of Transects
Alive
(Total Plants)
Alive %
Dead
(Total Plants)
Dead %
Total Plants
(Alive and Dead)
Total
Number of Species
Average
Plant health
Mason Windmill 2 1955, 1956 13 140 57% 106 43% 246 6 2
Vegetation Survivorship Monitoring
Page 59 12/07/2013
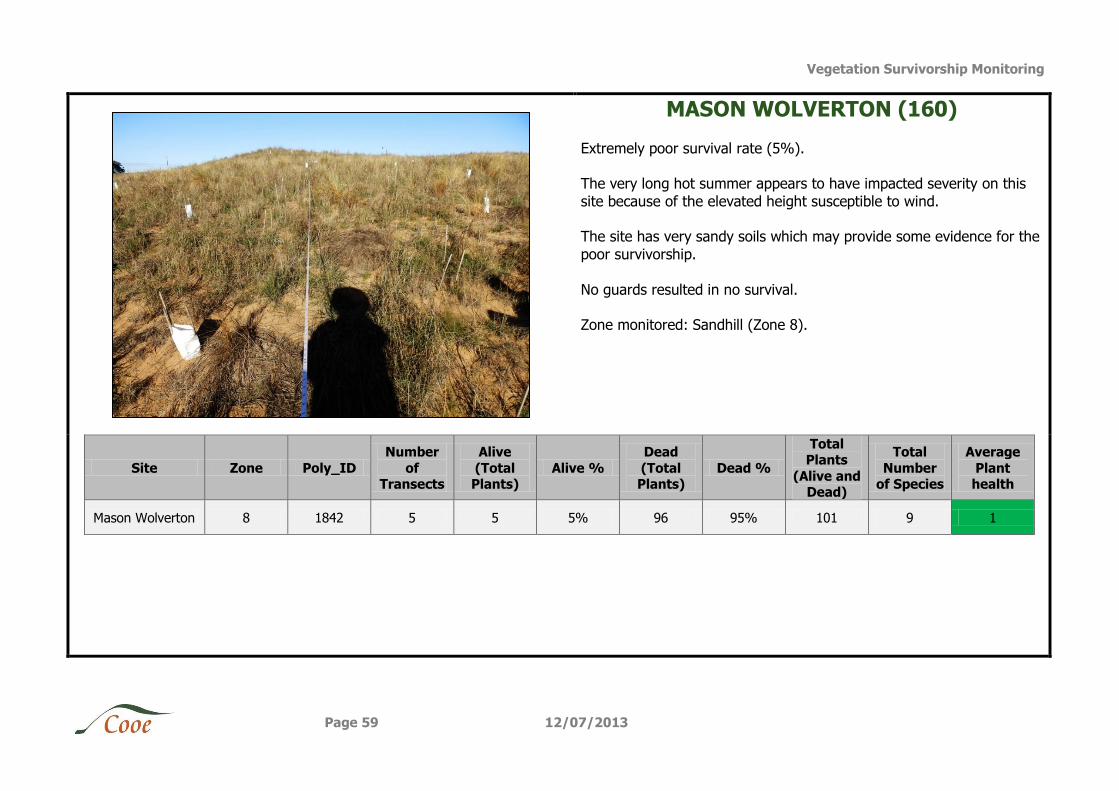
MASON WOLVERTON (160)
Extremely poor survival rate (5%). The very long hot summer appears to have impacted severity on this
site because of the elevated height susceptible to wind. The site has very sandy soils which may provide some evidence for the
poor survivorship.
No guards resulted in no survival. Zone monitored: Sandhill (Zone 8).
Site Zone Poly_ID
Number
of Transects
Alive
(Total Plants)
Alive %
Dead
(Total Plants)
Dead %
Total Plants
(Alive and Dead)
Total
Number of Species
Average
Plant health
Mason Wolverton 8 1842 5 5 5% 96 95% 101 9 1
Vegetation Survivorship Monitoring
Page 60 12/07/2013
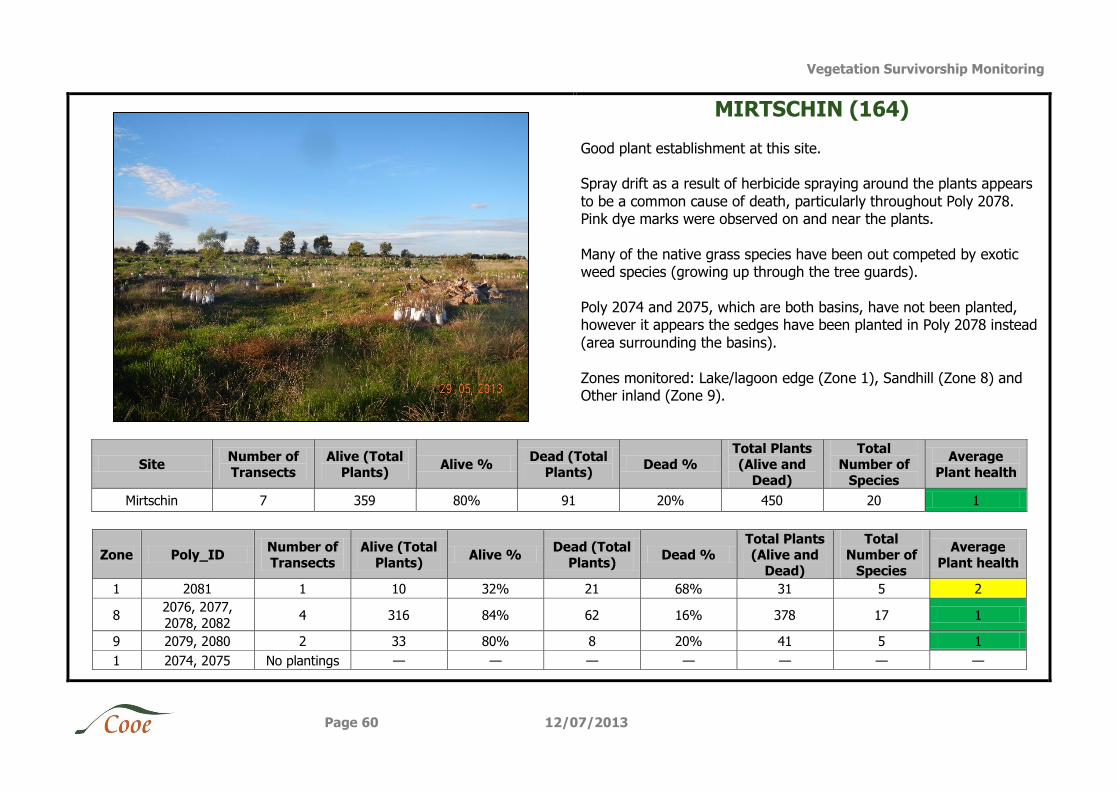
MIRTSCHIN (164)
Good plant establishment at this site. Spray drift as a result of herbicide spraying around the plants appears
to be a common cause of death, particularly throughout Poly 2078. Pink dye marks were observed on and near the plants.
Many of the native grass species have been out competed by exotic weed species (growing up through the tree guards).
Poly 2074 and 2075, which are both basins, have not been planted, however it appears the sedges have been planted in Poly 2078 instead
(area surrounding the basins).
Zones monitored: Lake/lagoon edge (Zone 1), Sandhill (Zone 8) and Other inland (Zone 9).
Site Number of Transects
Alive (Total Plants)
Alive % Dead (Total
Plants) Dead %
Total Plants (Alive and
Dead)
Total Number of
Species
Average Plant health
Mirtschin 7 359 80% 91 20% 450 20 1
Zone Poly_ID Number of Transects
Alive (Total Plants)
Alive % Dead (Total
Plants) Dead %
Total Plants (Alive and
Dead)
Total Number of
Species
Average Plant health
1 2081 1 10 32% 21 68% 31 5 2
8 2076, 2077,
2078, 2082 4 316 84% 62 16% 378 17 1
9 2079, 2080 2 33 80% 8 20% 41 5 1
1 2074, 2075 No plantings — — — — — — —
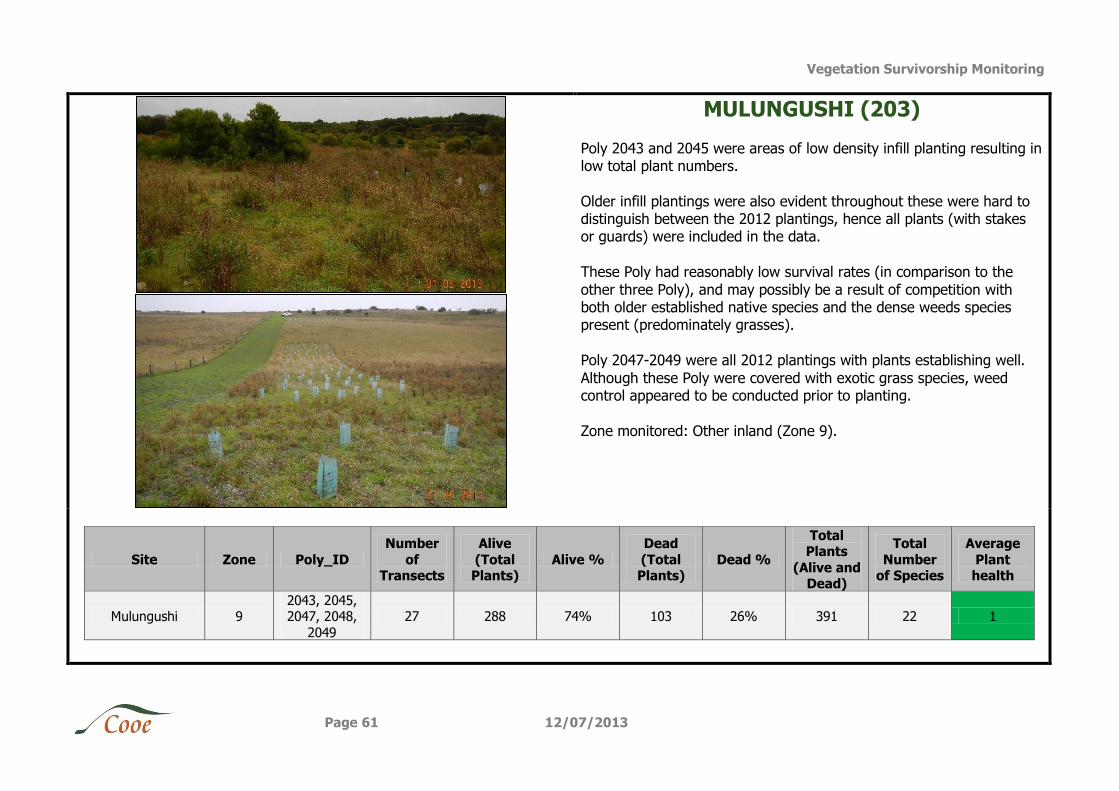
Vegetation Survivorship Monitoring
Page 61 12/07/2013
MULUNGUSHI (203)
Poly 2043 and 2045 were areas of low density infill planting resulting in low total plant numbers.
Older infill plantings were also evident throughout these were hard to distinguish between the 2012 plantings, hence all plants (with stakes or guards) were included in the data.
These Poly had reasonably low survival rates (in comparison to the
other three Poly), and may possibly be a result of competition with both older established native species and the dense weeds species present (predominately grasses).
Poly 2047-2049 were all 2012 plantings with plants establishing well.
Although these Poly were covered with exotic grass species, weed control appeared to be conducted prior to planting.
Zone monitored: Other inland (Zone 9).
Site Zone Poly_ID
Number
of Transects
Alive
(Total Plants)
Alive %
Dead
(Total Plants)
Dead %
Total Plants
(Alive and Dead)
Total
Number of Species
Average
Plant health
Mulungushi 9 2043, 2045, 2047, 2048,
2049
27 288 74% 103 26% 391 22 1
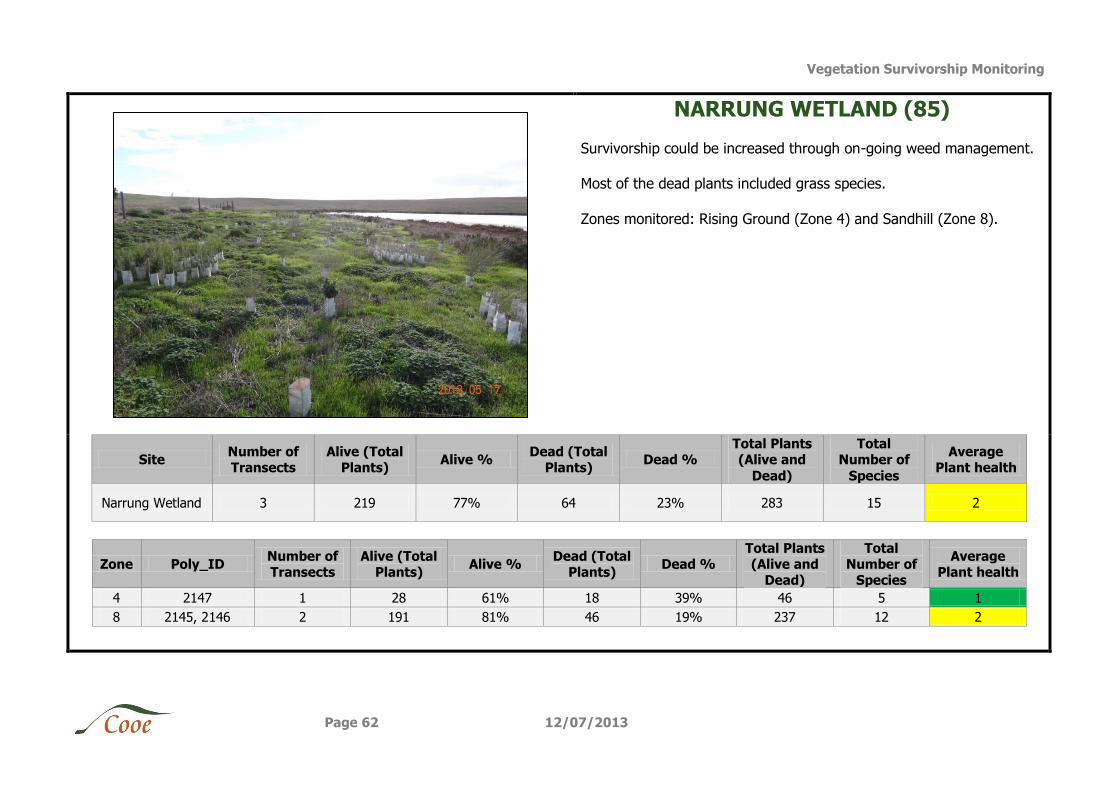
Vegetation Survivorship Monitoring
Page 62 12/07/2013
NARRUNG WETLAND (85)
Survivorship could be increased through on-going weed management. Most of the dead plants included grass species.
Zones monitored: Rising Ground (Zone 4) and Sandhill (Zone 8).
Site Number of Transects
Alive (Total Plants)
Alive % Dead (Total
Plants) Dead %
Total Plants (Alive and
Dead)
Total Number of
Species
Average Plant health
Narrung Wetland 3 219 77% 64 23% 283 15 2
Zone Poly_ID Number of Transects
Alive (Total Plants)
Alive % Dead (Total
Plants) Dead %
Total Plants (Alive and
Dead)
Total Number of
Species
Average Plant health
4 2147 1 28 61% 18 39% 46 5 1
8 2145, 2146 2 191 81% 46 19% 237 12 2
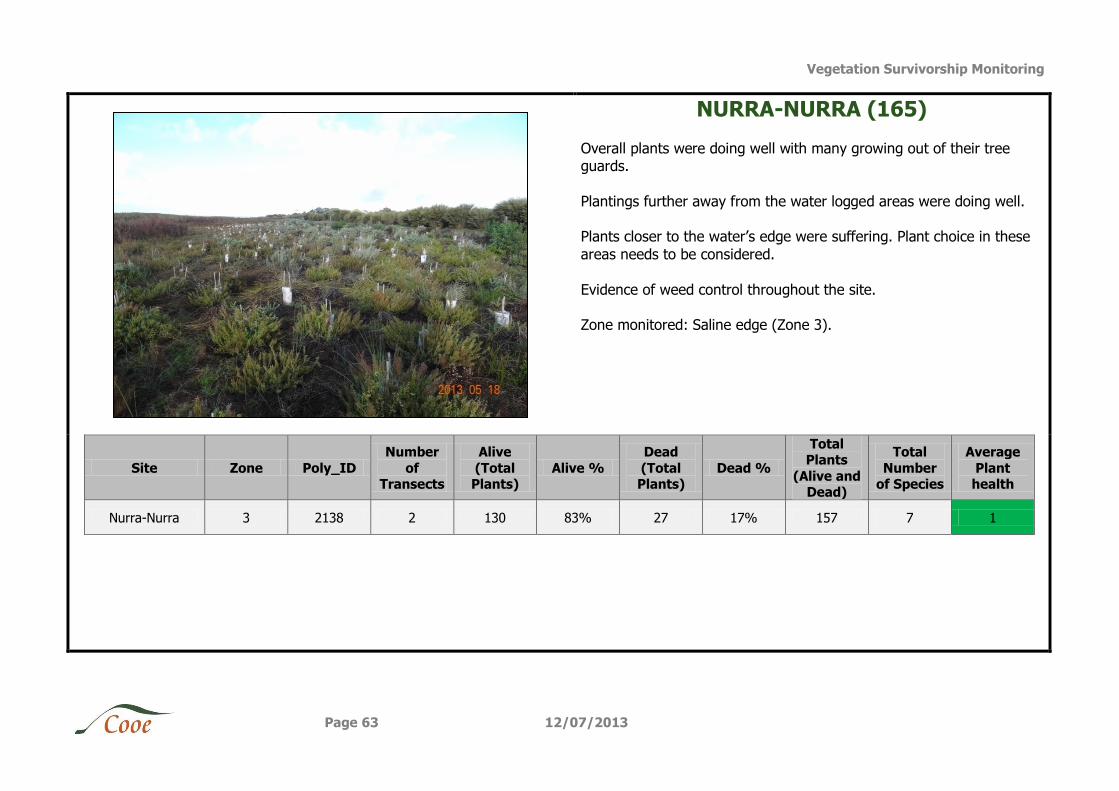
Vegetation Survivorship Monitoring
Page 63 12/07/2013
NURRA-NURRA (165)
Overall plants were doing well with many growing out of their tree guards.
Plantings further away from the water logged areas were doing well. Plants closer to the water’s edge were suffering. Plant choice in these
areas needs to be considered.
Evidence of weed control throughout the site. Zone monitored: Saline edge (Zone 3).
Site Zone Poly_ID
Number
of Transects
Alive
(Total Plants)
Alive %
Dead
(Total Plants)
Dead %
Total Plants
(Alive and Dead)
Total
Number of Species
Average
Plant health
Nurra-Nurra 3 2138 2 130 83% 27 17% 157 7 1
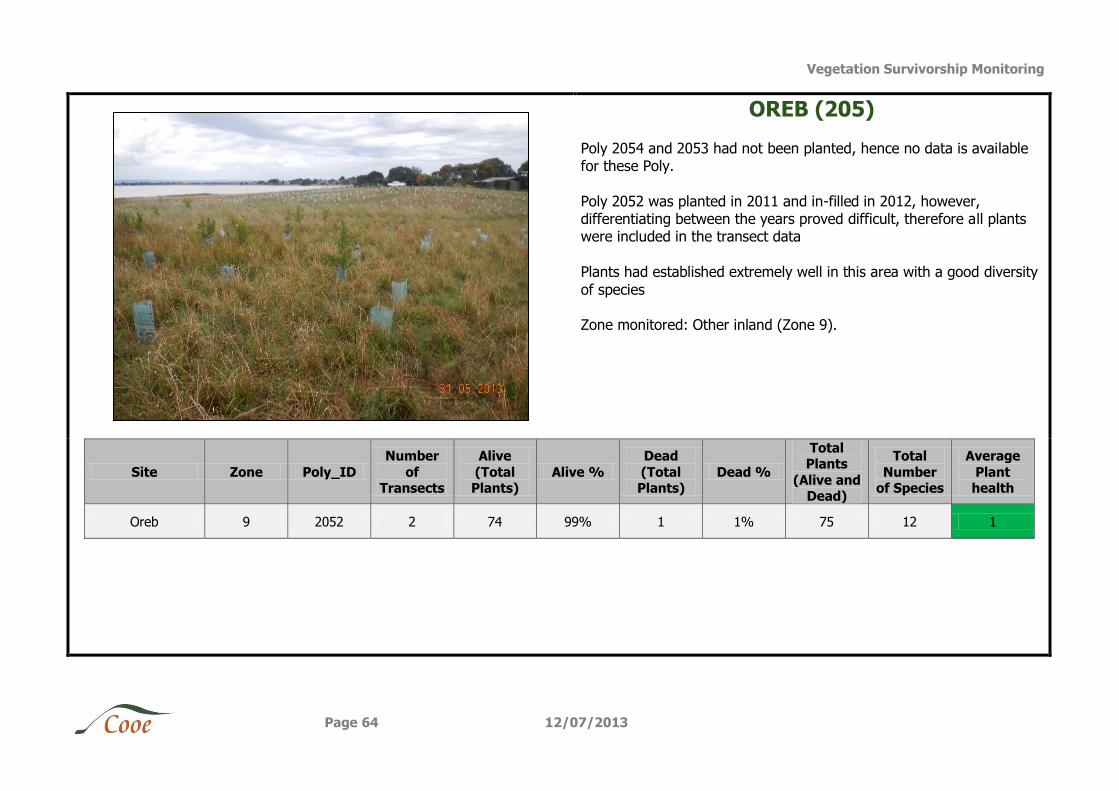
Vegetation Survivorship Monitoring
Page 64 12/07/2013
OREB (205)
Poly 2054 and 2053 had not been planted, hence no data is available for these Poly.
Poly 2052 was planted in 2011 and in-filled in 2012, however, differentiating between the years proved difficult, therefore all plants were included in the transect data
Plants had established extremely well in this area with a good diversity
of species
Zone monitored: Other inland (Zone 9).
Site Zone Poly_ID
Number
of Transects
Alive
(Total Plants)
Alive %
Dead
(Total Plants)
Dead %
Total Plants
(Alive and Dead)
Total
Number of Species
Average
Plant health
Oreb 9 2052 2 74 99% 1 1% 75 12 1
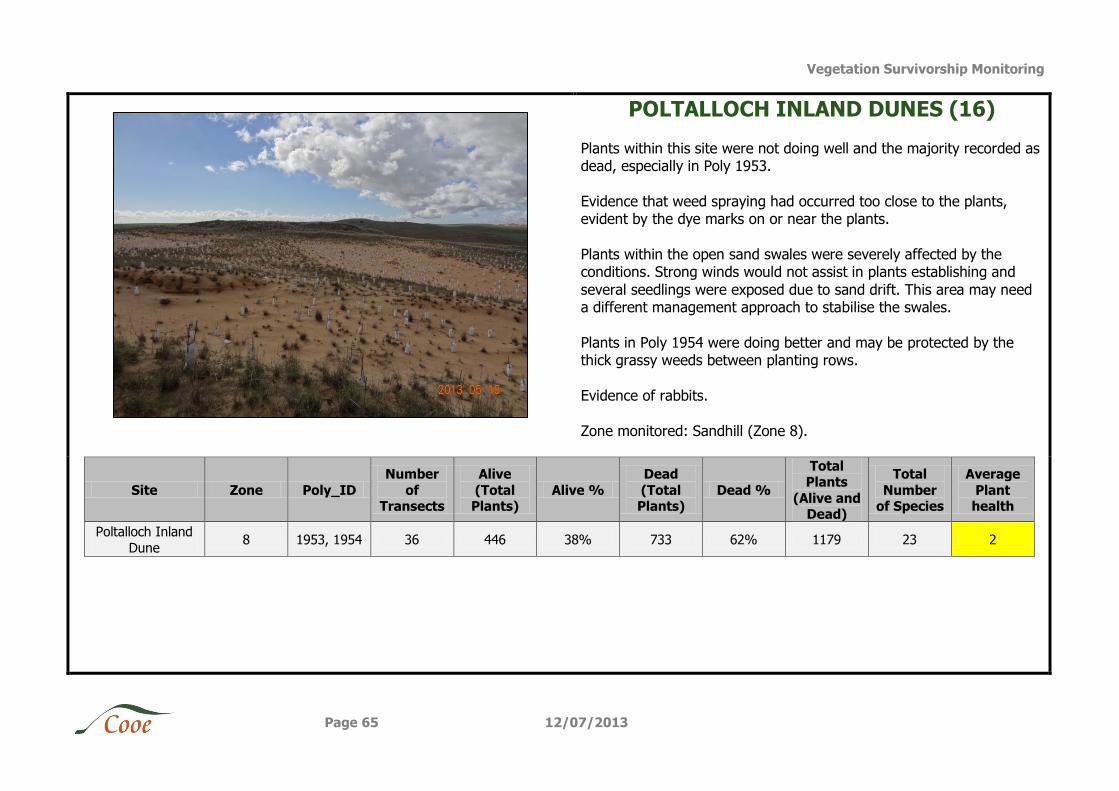
Vegetation Survivorship Monitoring
Page 65 12/07/2013
POLTALLOCH INLAND DUNES (16)
Plants within this site were not doing well and the majority recorded as dead, especially in Poly 1953.
Evidence that weed spraying had occurred too close to the plants, evident by the dye marks on or near the plants.
Plants within the open sand swales were severely affected by the conditions. Strong winds would not assist in plants establishing and
several seedlings were exposed due to sand drift. This area may need a different management approach to stabilise the swales.
Plants in Poly 1954 were doing better and may be protected by the thick grassy weeds between planting rows.
Evidence of rabbits.
Zone monitored: Sandhill (Zone 8).
Site Zone Poly_ID
Number
of Transects
Alive
(Total Plants)
Alive %
Dead
(Total Plants)
Dead %
Total Plants
(Alive and Dead)
Total
Number of Species
Average
Plant health
Poltalloch Inland
Dune 8 1953, 1954 36 446 38% 733 62% 1179 23 2
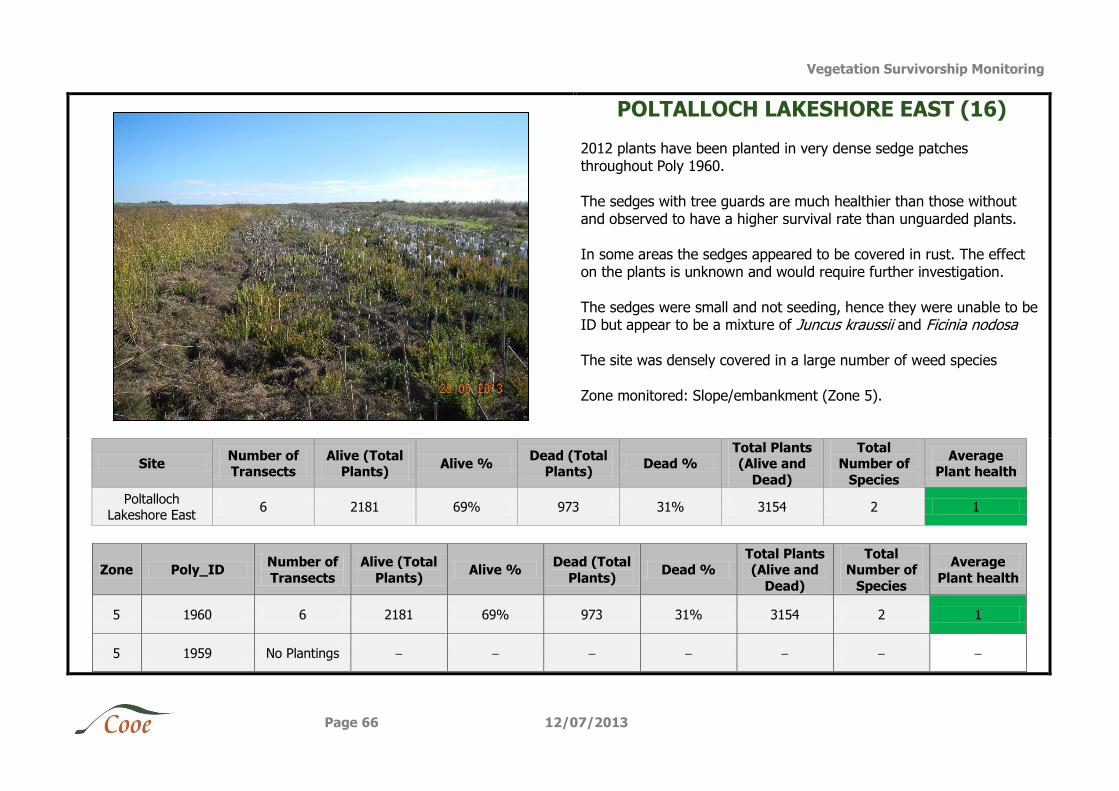
Vegetation Survivorship Monitoring
Page 66 12/07/2013
POLTALLOCH LAKESHORE EAST (16)
2012 plants have been planted in very dense sedge patches throughout Poly 1960.
The sedges with tree guards are much healthier than those without and observed to have a higher survival rate than unguarded plants.
In some areas the sedges appeared to be covered in rust. The effect on the plants is unknown and would require further investigation.
The sedges were small and not seeding, hence they were unable to be ID but appear to be a mixture of Juncus kraussii and Ficinia nodosa The site was densely covered in a large number of weed species
Zone monitored: Slope/embankment (Zone 5).
Site Number of Transects
Alive (Total Plants)
Alive % Dead (Total
Plants) Dead %
Total Plants (Alive and
Dead)
Total Number of
Species
Average Plant health
Poltalloch Lakeshore East
6 2181 69% 973 31% 3154 2 1
Zone Poly_ID Number of
Transects
Alive (Total
Plants) Alive %
Dead (Total
Plants) Dead %
Total Plants (Alive and
Dead)
Total Number of
Species
Average
Plant health
5 1960 6 2181 69% 973 31% 3154 2 1
5 1959 No Plantings
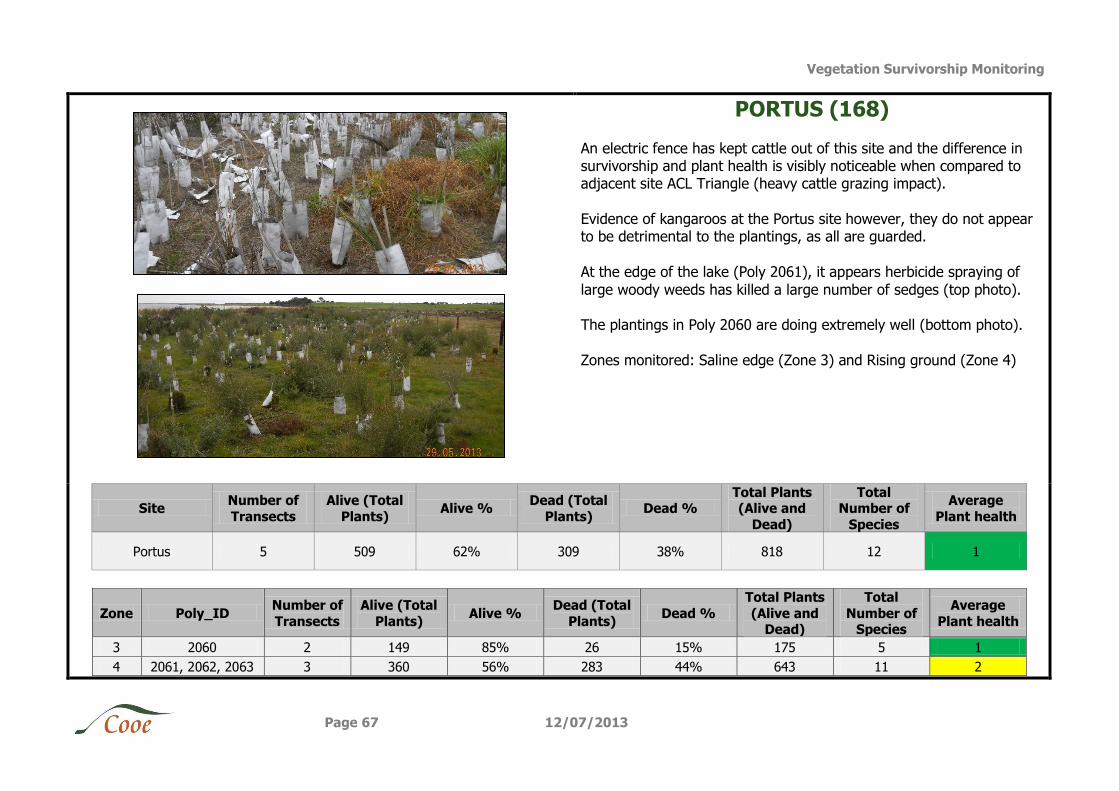
Vegetation Survivorship Monitoring
Page 67 12/07/2013
PORTUS (168)
An electric fence has kept cattle out of this site and the difference in survivorship and plant health is visibly noticeable when compared to adjacent site ACL Triangle (heavy cattle grazing impact).
Evidence of kangaroos at the Portus site however, they do not appear to be detrimental to the plantings, as all are guarded.
At the edge of the lake (Poly 2061), it appears herbicide spraying of
large woody weeds has killed a large number of sedges (top photo). The plantings in Poly 2060 are doing extremely well (bottom photo).
Zones monitored: Saline edge (Zone 3) and Rising ground (Zone 4)
Site Number of
Transects
Alive (Total
Plants) Alive %
Dead (Total
Plants) Dead %
Total Plants (Alive and
Dead)
Total Number of
Species
Average
Plant health
Portus 5 509 62% 309 38% 818 12 1
Zone Poly_ID Number of
Transects
Alive (Total
Plants) Alive %
Dead (Total
Plants) Dead %
Total Plants
(Alive and Dead)
Total
Number of Species
Average
Plant health
3 2060 2 149 85% 26 15% 175 5 1
4 2061, 2062, 2063 3 360 56% 283 44% 643 11 2
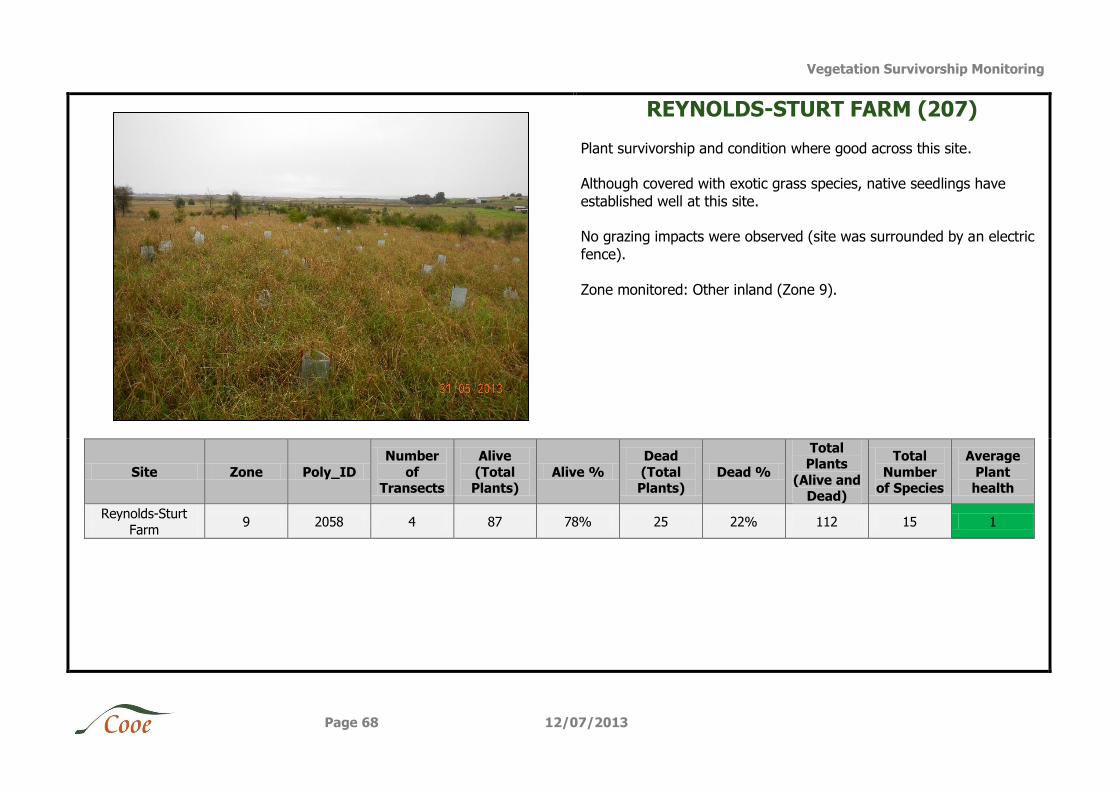
Vegetation Survivorship Monitoring
Page 68 12/07/2013
REYNOLDS-STURT FARM (207)
Plant survivorship and condition where good across this site. Although covered with exotic grass species, native seedlings have
established well at this site. No grazing impacts were observed (site was surrounded by an electric
fence).
Zone monitored: Other inland (Zone 9).
Site Zone Poly_ID
Number
of Transects
Alive
(Total Plants)
Alive %
Dead
(Total Plants)
Dead %
Total Plants
(Alive and Dead)
Total
Number of Species
Average
Plant health
Reynolds-Sturt
Farm 9 2058 4 87 78% 25 22% 112 15 1
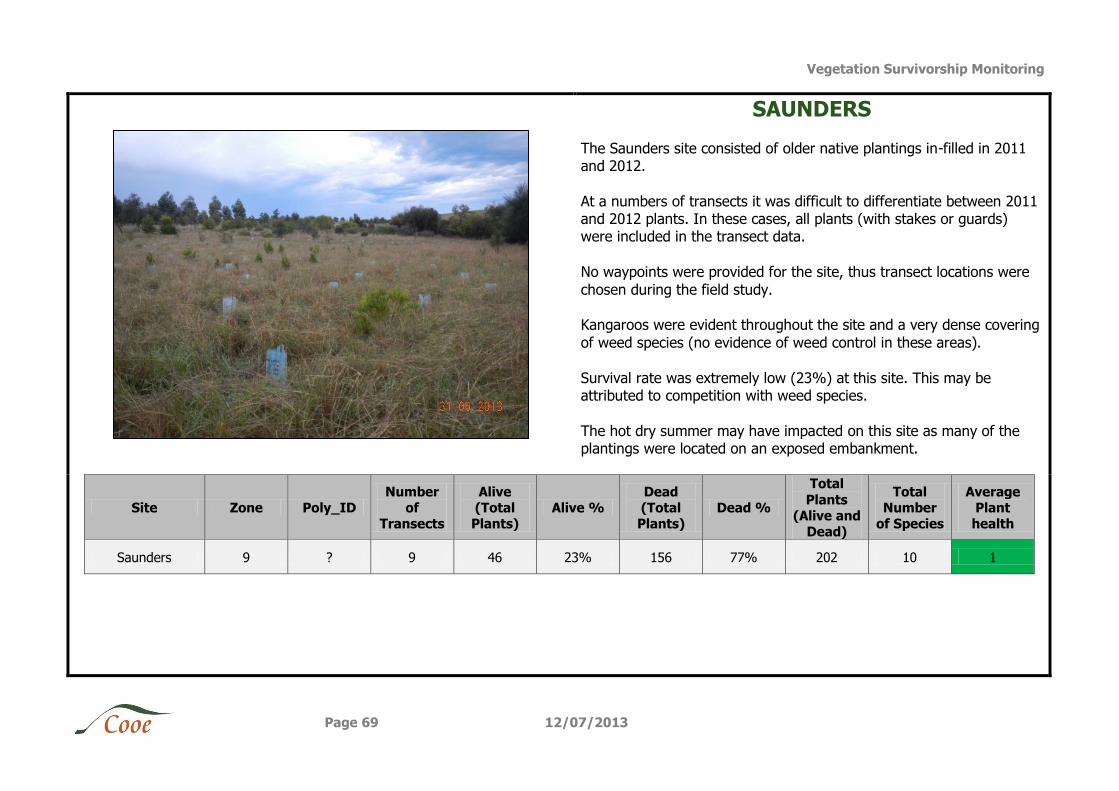
Vegetation Survivorship Monitoring
Page 69 12/07/2013
SAUNDERS
The Saunders site consisted of older native plantings in-filled in 2011 and 2012.
At a numbers of transects it was difficult to differentiate between 2011 and 2012 plants. In these cases, all plants (with stakes or guards) were included in the transect data.
No waypoints were provided for the site, thus transect locations were
chosen during the field study. Kangaroos were evident throughout the site and a very dense covering
of weed species (no evidence of weed control in these areas).
Survival rate was extremely low (23%) at this site. This may be attributed to competition with weed species.
The hot dry summer may have impacted on this site as many of the plantings were located on an exposed embankment.
Site Zone Poly_ID Number
of Transects
Alive (Total Plants)
Alive % Dead (Total Plants)
Dead %
Total
Plants (Alive and
Dead)
Total Number
of Species
Average Plant health
Saunders 9 ? 9 46 23% 156 77% 202 10 1
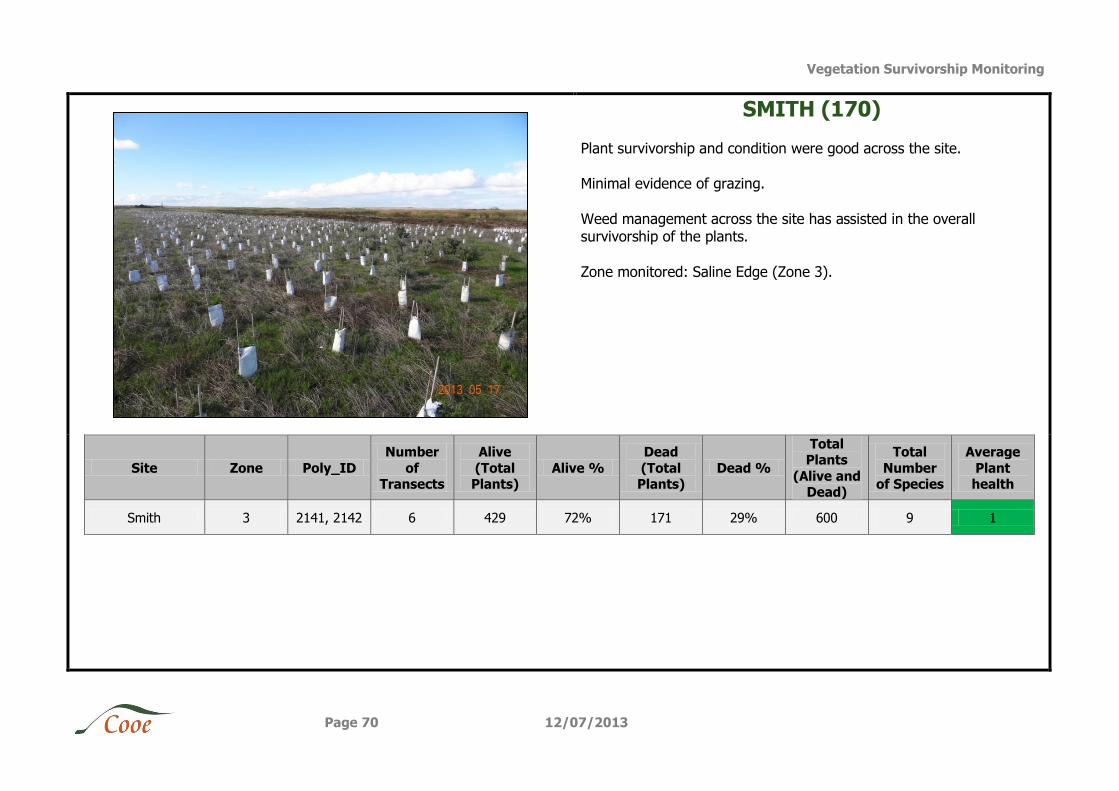
Vegetation Survivorship Monitoring
Page 70 12/07/2013
SMITH (170)
Plant survivorship and condition were good across the site. Minimal evidence of grazing.
Weed management across the site has assisted in the overall survivorship of the plants.
Zone monitored: Saline Edge (Zone 3).
Site Zone Poly_ID
Number
of Transects
Alive
(Total Plants)
Alive %
Dead
(Total Plants)
Dead %
Total Plants
(Alive and Dead)
Total
Number of Species
Average
Plant health
Smith 3 2141, 2142 6 429 72% 171 29% 600 9 1
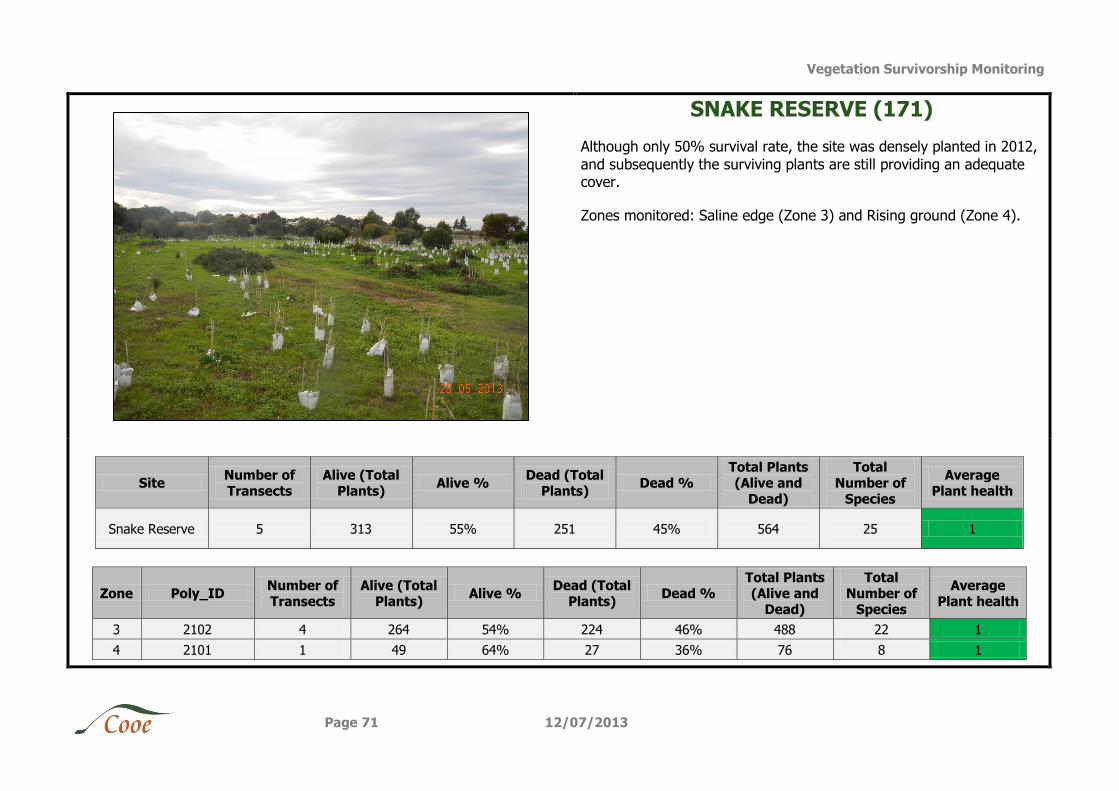
Vegetation Survivorship Monitoring
Page 71 12/07/2013
SNAKE RESERVE (171)
Although only 50% survival rate, the site was densely planted in 2012,
and subsequently the surviving plants are still providing an adequate cover.
Zones monitored: Saline edge (Zone 3) and Rising ground (Zone 4).
Site Number of Transects
Alive (Total Plants)
Alive % Dead (Total
Plants) Dead %
Total Plants (Alive and
Dead)
Total Number of
Species
Average Plant health
Snake Reserve 5 313 55% 251 45% 564 25 1
Zone Poly_ID Number of Transects
Alive (Total Plants)
Alive % Dead (Total
Plants) Dead %
Total Plants (Alive and
Dead)
Total Number of
Species
Average Plant health
3 2102 4 264 54% 224 46% 488 22 1
4 2101 1 49 64% 27 36% 76 8 1
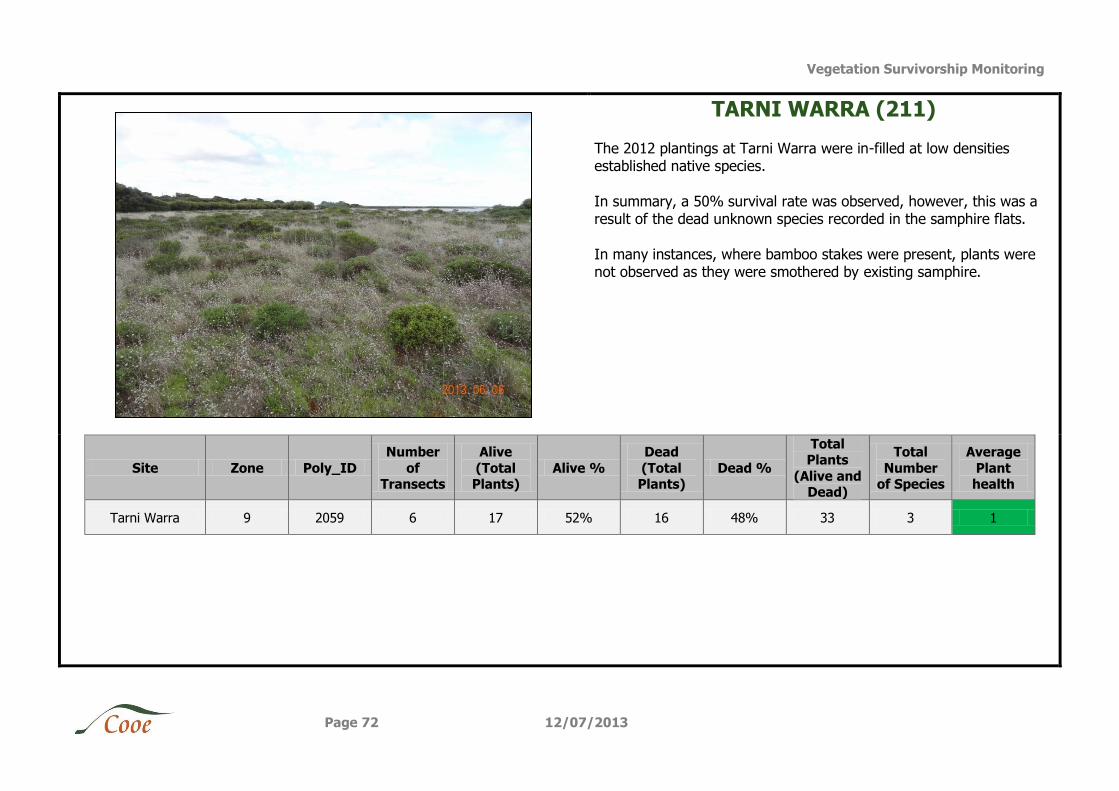
Vegetation Survivorship Monitoring
Page 72 12/07/2013
TARNI WARRA (211)
The 2012 plantings at Tarni Warra were in-filled at low densities established native species.
In summary, a 50% survival rate was observed, however, this was a result of the dead unknown species recorded in the samphire flats.
In many instances, where bamboo stakes were present, plants were not observed as they were smothered by existing samphire.
Site Zone Poly_ID
Number
of Transects
Alive
(Total Plants)
Alive %
Dead
(Total Plants)
Dead %
Total Plants
(Alive and Dead)
Total
Number of Species
Average
Plant health
Tarni Warra 9 2059 6 17 52% 16 48% 33 3 1
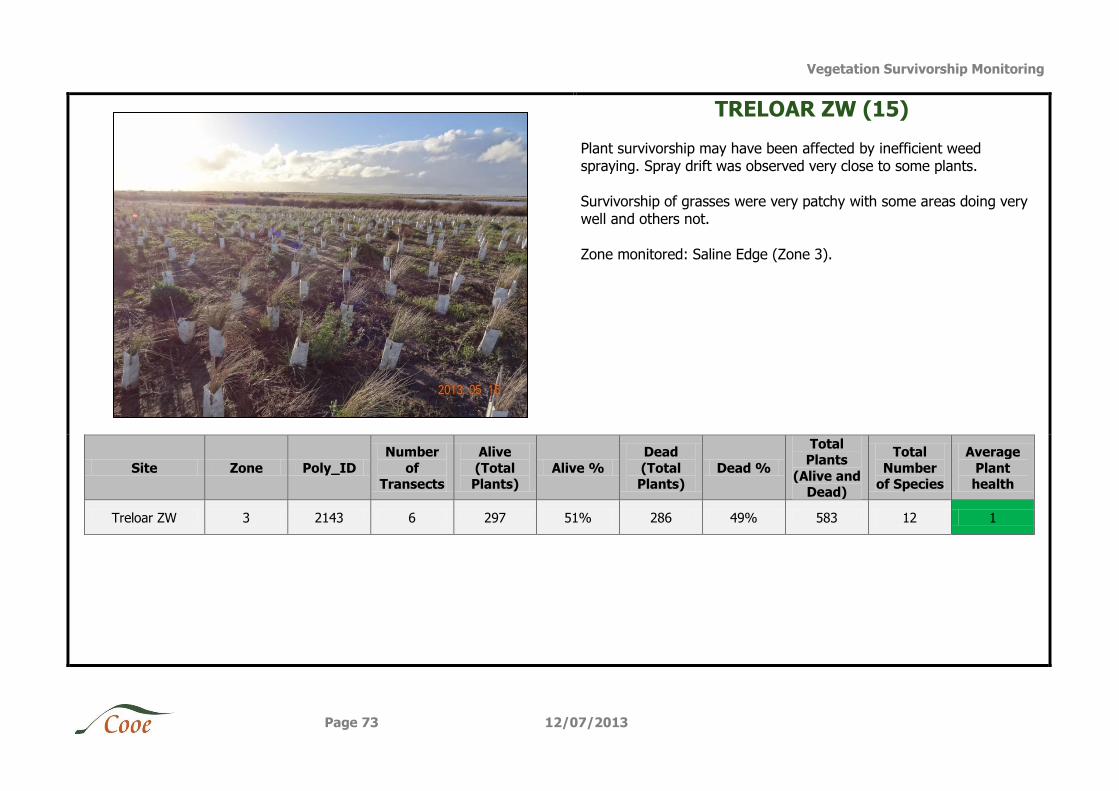
Vegetation Survivorship Monitoring
Page 73 12/07/2013
TRELOAR ZW (15)
Plant survivorship may have been affected by inefficient weed spraying. Spray drift was observed very close to some plants.
Survivorship of grasses were very patchy with some areas doing very well and others not.
Zone monitored: Saline Edge (Zone 3).
Site Zone Poly_ID
Number
of Transects
Alive
(Total Plants)
Alive %
Dead
(Total Plants)
Dead %
Total Plants
(Alive and Dead)
Total
Number of Species
Average
Plant health
Treloar ZW 3 2143 6 297 51% 286 49% 583 12 1
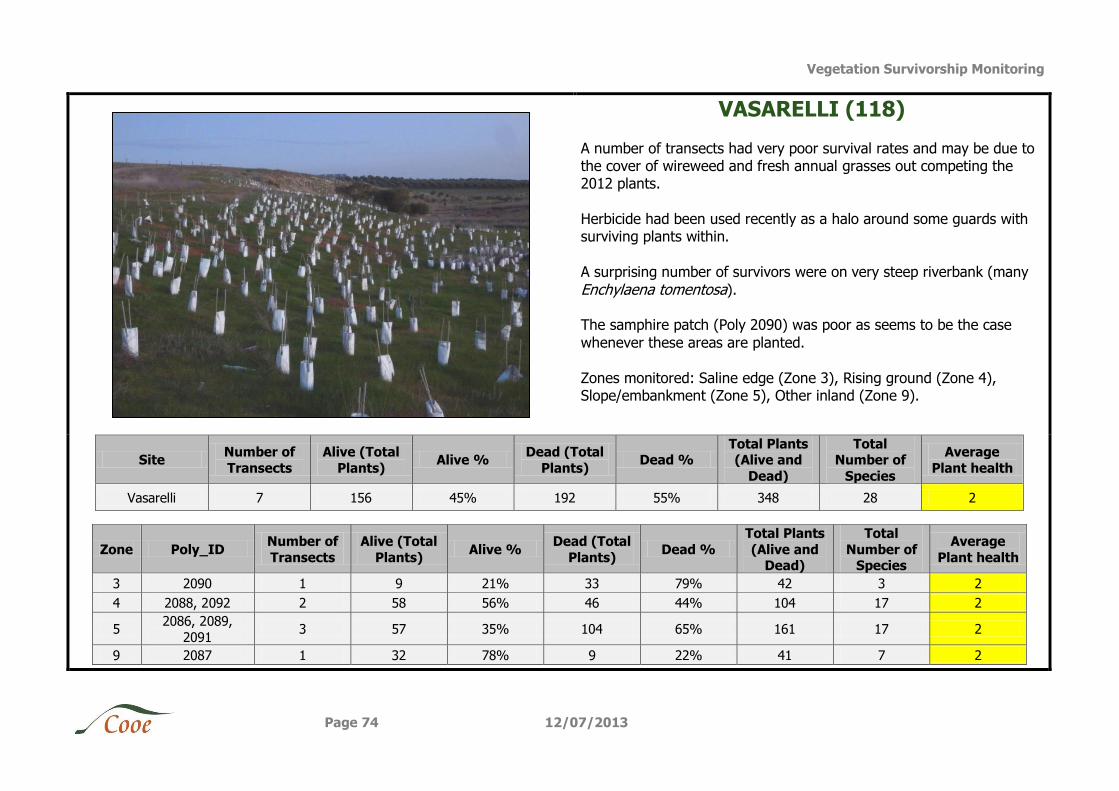
Vegetation Survivorship Monitoring
Page 74 12/07/2013
VASARELLI (118)
A number of transects had very poor survival rates and may be due to the cover of wireweed and fresh annual grasses out competing the 2012 plants.
Herbicide had been used recently as a halo around some guards with surviving plants within.
A surprising number of survivors were on very steep riverbank (many
Enchylaena tomentosa). The samphire patch (Poly 2090) was poor as seems to be the case
whenever these areas are planted.
Zones monitored: Saline edge (Zone 3), Rising ground (Zone 4), Slope/embankment (Zone 5), Other inland (Zone 9).
Site Number of
Transects
Alive (Total
Plants) Alive %
Dead (Total
Plants) Dead %
Total Plants (Alive and
Dead)
Total Number of
Species
Average
Plant health
Vasarelli 7 156 45% 192 55% 348 28 2
Zone Poly_ID Number of
Transects
Alive (Total
Plants) Alive %
Dead (Total
Plants) Dead %
Total Plants
(Alive and Dead)
Total
Number of Species
Average
Plant health
3 2090 1 9 21% 33 79% 42 3 2
4 2088, 2092 2 58 56% 46 44% 104 17 2
5 2086, 2089,
2091 3 57 35% 104 65% 161 17 2
9 2087 1 32 78% 9 22% 41 7 2
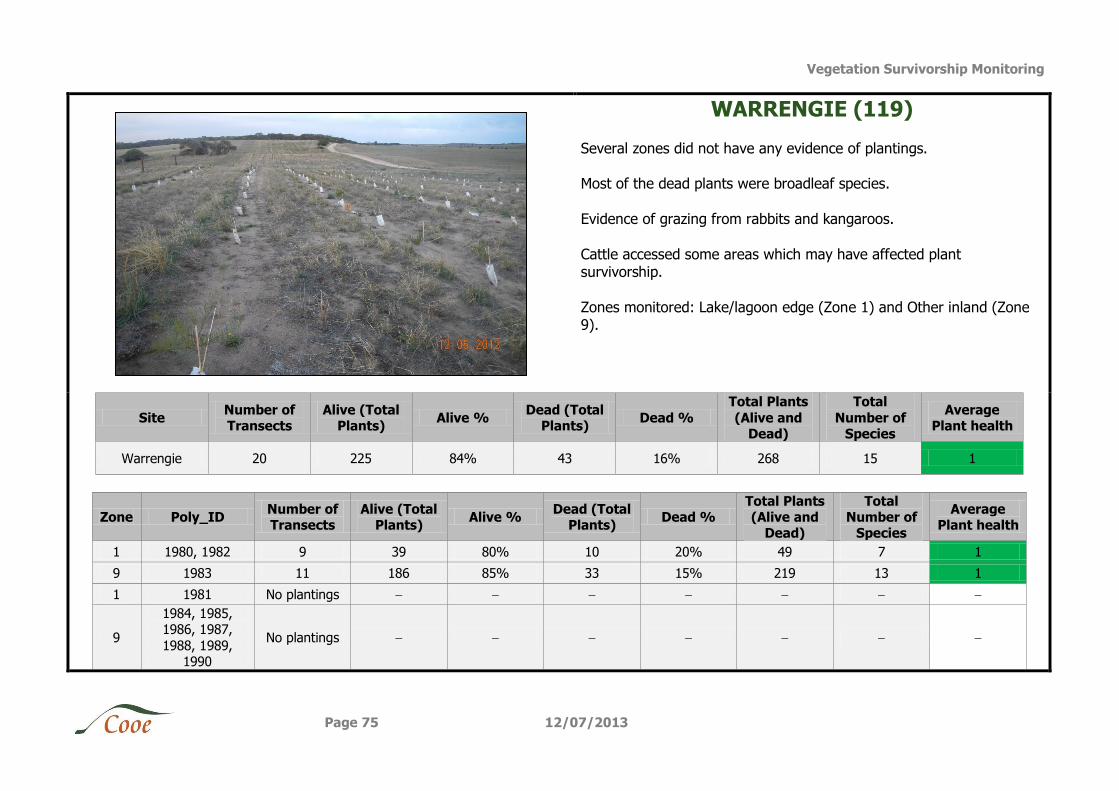
Vegetation Survivorship Monitoring
Page 75 12/07/2013
WARRENGIE (119)
Several zones did not have any evidence of plantings. Most of the dead plants were broadleaf species.
Evidence of grazing from rabbits and kangaroos.
Cattle accessed some areas which may have affected plant survivorship.
Zones monitored: Lake/lagoon edge (Zone 1) and Other inland (Zone 9).
Site Number of Transects
Alive (Total Plants)
Alive % Dead (Total
Plants) Dead %
Total Plants
(Alive and Dead)
Total
Number of Species
Average Plant health
Warrengie 20 225 84% 43 16% 268 15 1
Zone Poly_ID Number of Transects
Alive (Total Plants)
Alive % Dead (Total
Plants) Dead %
Total Plants (Alive and
Dead)
Total Number of
Species
Average Plant health
1 1980, 1982 9 39 80% 10 20% 49 7 1
9 1983 11 186 85% 33 15% 219 13 1
1 1981 No plantings
9
1984, 1985, 1986, 1987,
1988, 1989, 1990
No plantings
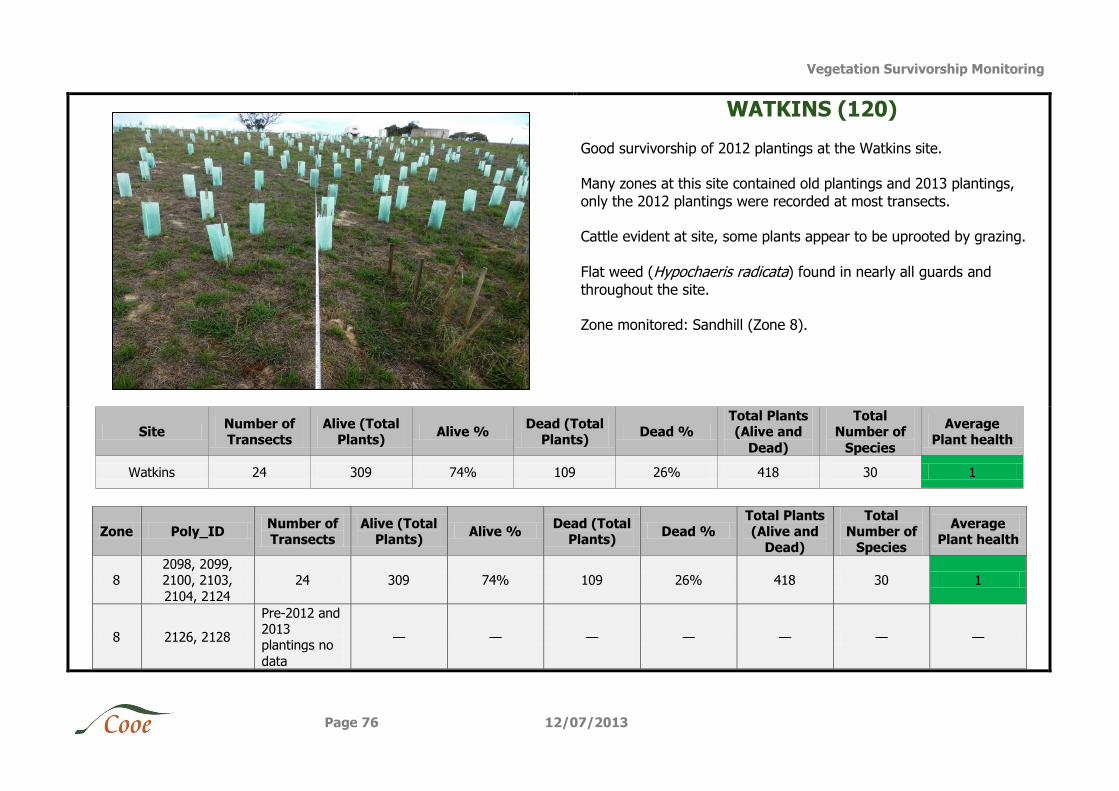
Vegetation Survivorship Monitoring
Page 76 12/07/2013
WATKINS (120)
Good survivorship of 2012 plantings at the Watkins site. Many zones at this site contained old plantings and 2013 plantings,
only the 2012 plantings were recorded at most transects. Cattle evident at site, some plants appear to be uprooted by grazing.
Flat weed (Hypochaeris radicata) found in nearly all guards and
throughout the site.
Zone monitored: Sandhill (Zone 8).
Site Number of Transects
Alive (Total Plants)
Alive % Dead (Total
Plants) Dead %
Total Plants (Alive and
Dead)
Total Number of
Species
Average Plant health
Watkins 24 309 74% 109 26% 418 30 1
Zone Poly_ID Number of Transects
Alive (Total Plants)
Alive % Dead (Total
Plants) Dead %
Total Plants (Alive and
Dead)
Total Number of
Species
Average Plant health
8 2098, 2099, 2100, 2103,
2104, 2124
24 309 74% 109 26% 418 30 1
8 2126, 2128
Pre-2012 and 2013 plantings no
data
— — — — — — —
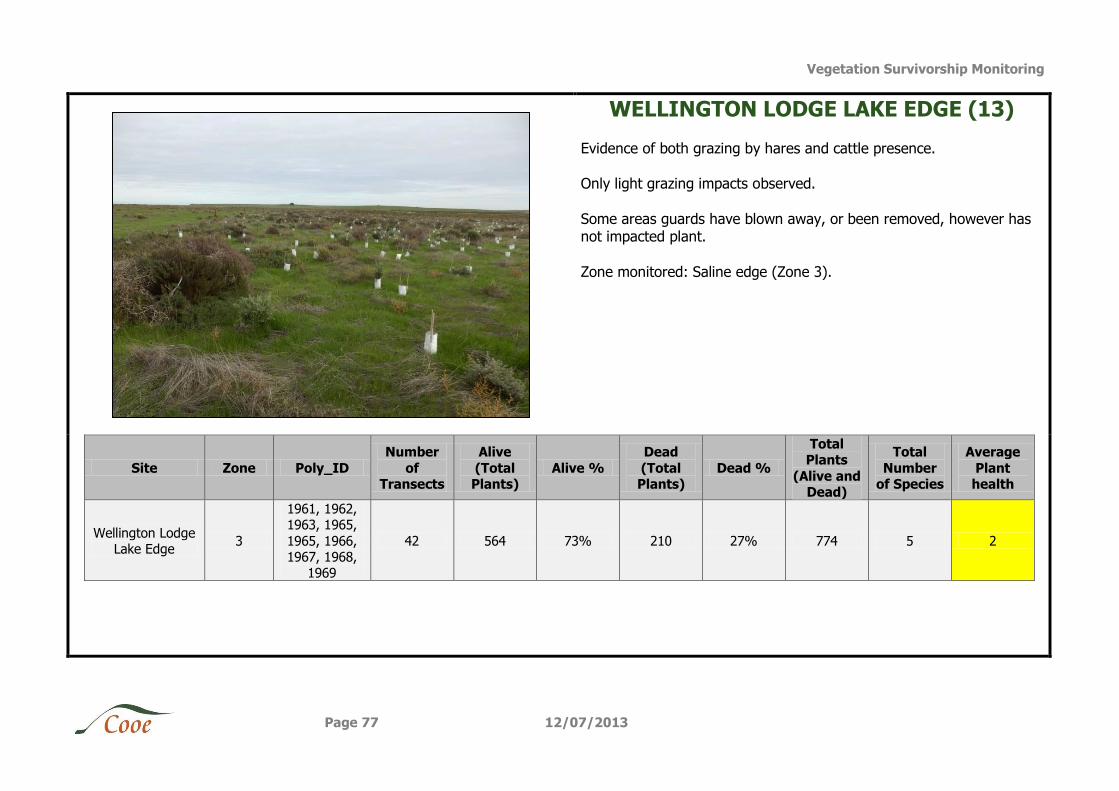
Vegetation Survivorship Monitoring
Page 77 12/07/2013
WELLINGTON LODGE LAKE EDGE (13)
Evidence of both grazing by hares and cattle presence. Only light grazing impacts observed.
Some areas guards have blown away, or been removed, however has not impacted plant.
Zone monitored: Saline edge (Zone 3).
Site Zone Poly_ID
Number
of Transects
Alive
(Total Plants)
Alive %
Dead
(Total Plants)
Dead %
Total Plants
(Alive and Dead)
Total
Number of Species
Average
Plant health
Wellington Lodge Lake Edge
3
1961, 1962, 1963, 1965,
1965, 1966, 1967, 1968,
1969
42 564 73% 210 27% 774 5 2
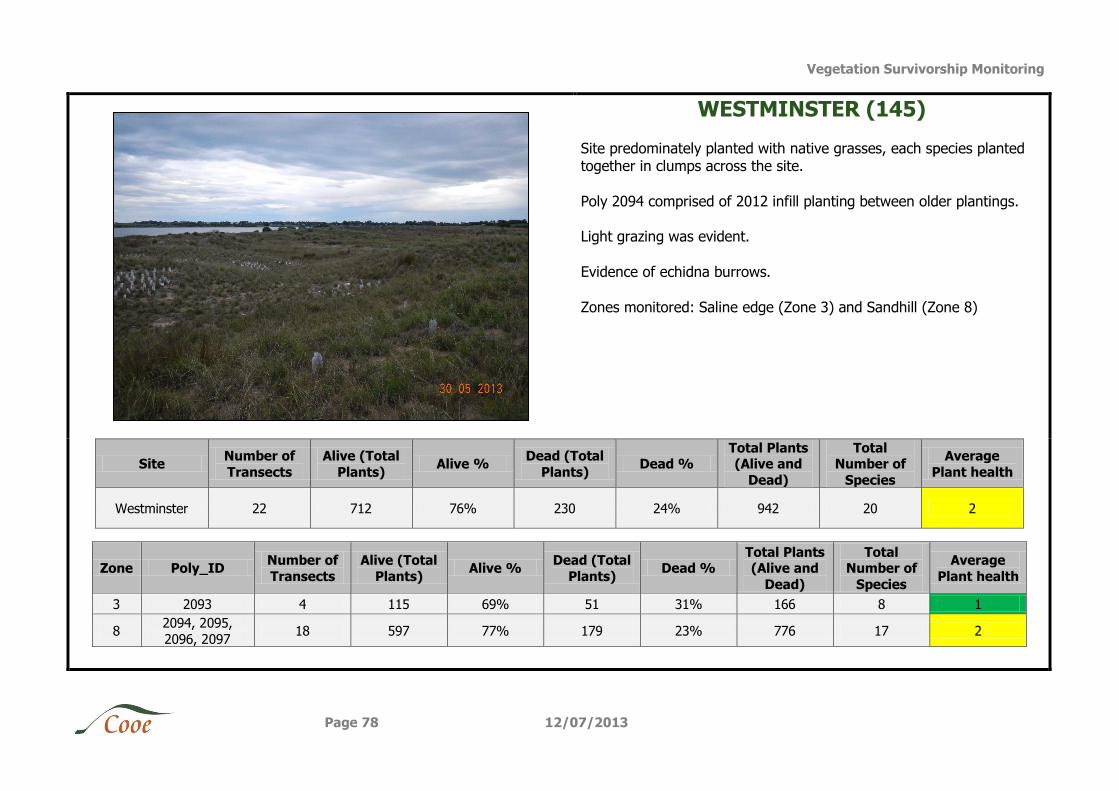
Vegetation Survivorship Monitoring
Page 78 12/07/2013
WESTMINSTER (145)
Site predominately planted with native grasses, each species planted together in clumps across the site.
Poly 2094 comprised of 2012 infill planting between older plantings. Light grazing was evident.
Evidence of echidna burrows.
Zones monitored: Saline edge (Zone 3) and Sandhill (Zone 8)
Site Number of
Transects
Alive (Total
Plants) Alive %
Dead (Total
Plants) Dead %
Total Plants (Alive and
Dead)
Total Number of
Species
Average
Plant health
Westminster 22 712 76% 230 24% 942 20 2
Zone Poly_ID Number of
Transects
Alive (Total
Plants) Alive %
Dead (Total
Plants) Dead %
Total Plants (Alive and
Dead)
Total Number of
Species
Average
Plant health
3 2093 4 115 69% 51 31% 166 8 1
8 2094, 2095,
2096, 2097 18 597 77% 179 23% 776 17 2
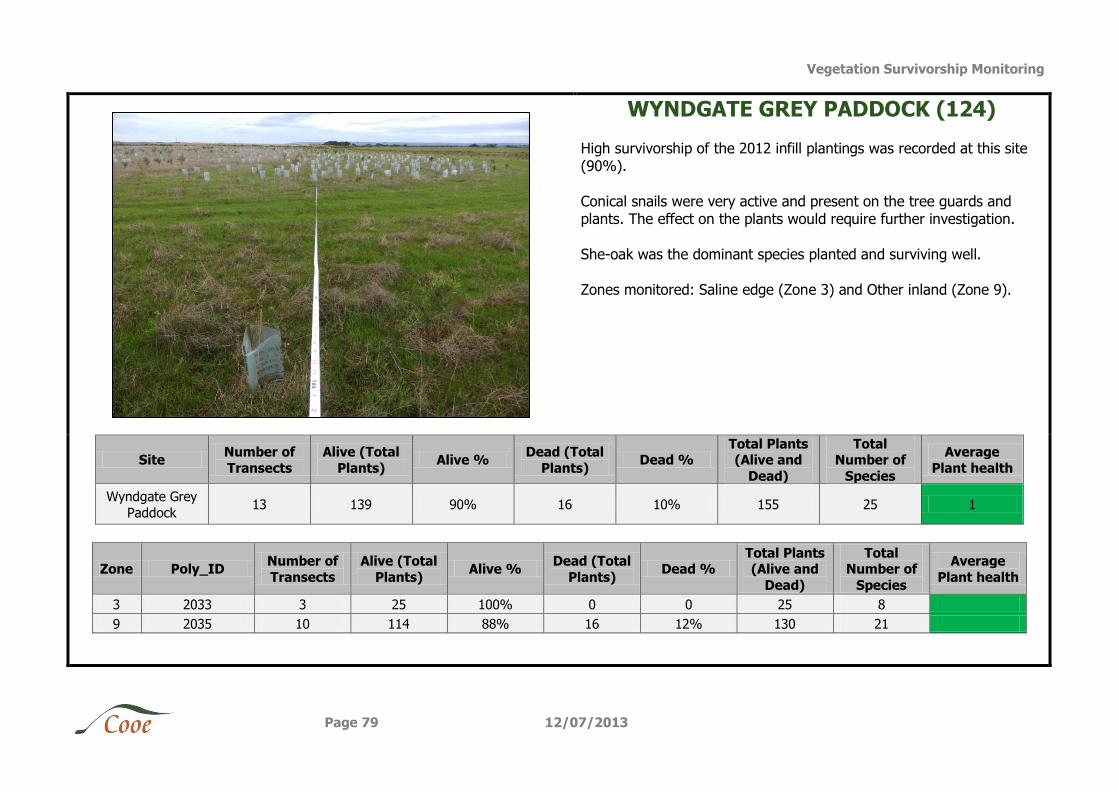
Vegetation Survivorship Monitoring
Page 79 12/07/2013
WYNDGATE GREY PADDOCK (124)
High survivorship of the 2012 infill plantings was recorded at this site (90%).
Conical snails were very active and present on the tree guards and plants. The effect on the plants would require further investigation.
She-oak was the dominant species planted and surviving well.
Zones monitored: Saline edge (Zone 3) and Other inland (Zone 9).
Site Number of
Transects
Alive (Total
Plants) Alive %
Dead (Total
Plants) Dead %
Total Plants (Alive and
Dead)
Total Number of
Species
Average
Plant health
Wyndgate Grey
Paddock 13 139 90% 16 10% 155 25 1
Zone Poly_ID Number of
Transects
Alive (Total
Plants) Alive %
Dead (Total
Plants) Dead %
Total Plants (Alive and
Dead)
Total Number of
Species
Average
Plant health
3 2033 3 25 100% 0 0 25 8
9 2035 10 114 88% 16 12% 130 21
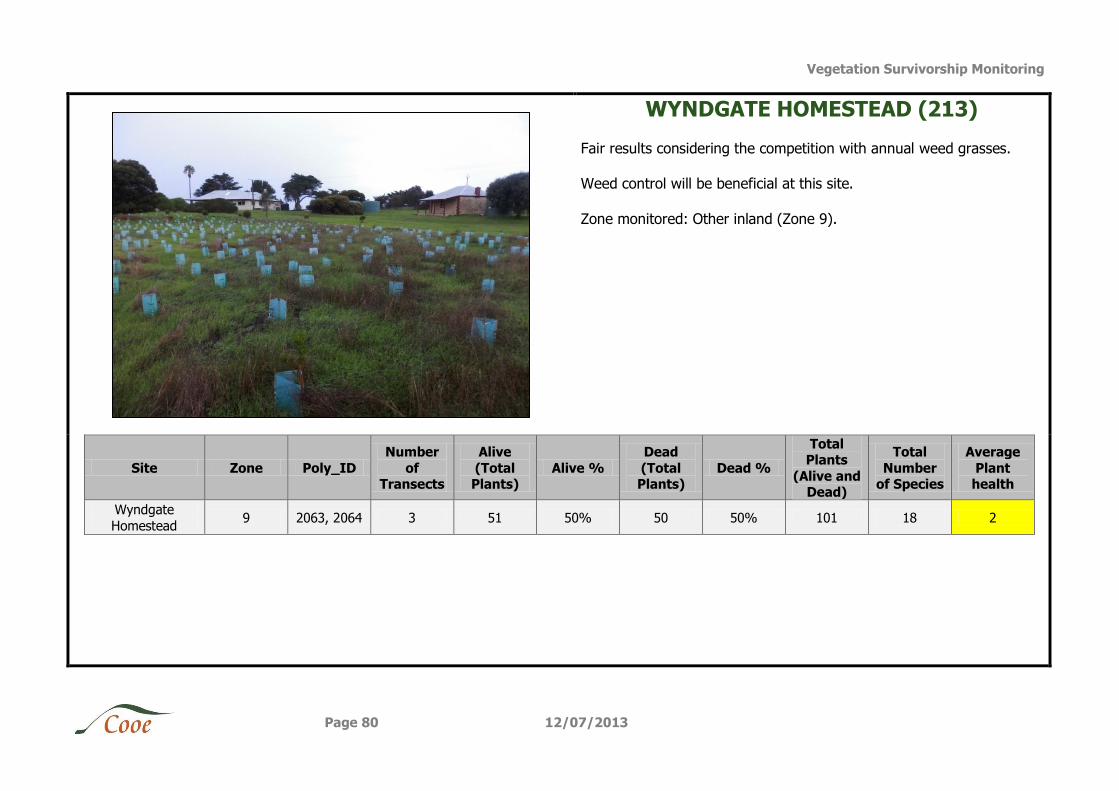
Vegetation Survivorship Monitoring
Page 80 12/07/2013
WYNDGATE HOMESTEAD (213)
Fair results considering the competition with annual weed grasses. Weed control will be beneficial at this site.
Zone monitored: Other inland (Zone 9).
Site Zone Poly_ID
Number
of Transects
Alive
(Total Plants)
Alive %
Dead
(Total Plants)
Dead %
Total Plants
(Alive and Dead)
Total
Number of Species
Average
Plant health
Wyndgate
Homestead 9 2063, 2064 3 51 50% 50 50% 101 18 2
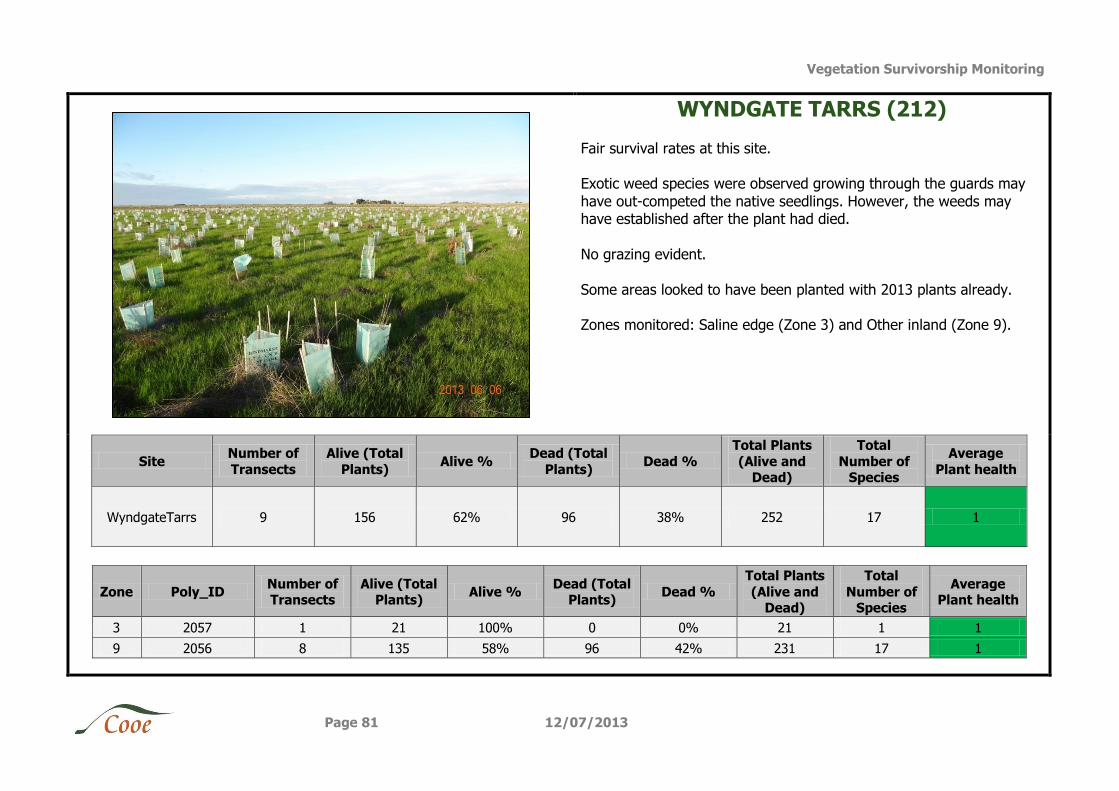
Vegetation Survivorship Monitoring
Page 81 12/07/2013
WYNDGATE TARRS (212)
Fair survival rates at this site. Exotic weed species were observed growing through the guards may
have out-competed the native seedlings. However, the weeds may have established after the plant had died.
No grazing evident.
Some areas looked to have been planted with 2013 plants already. Zones monitored: Saline edge (Zone 3) and Other inland (Zone 9).
Site Number of
Transects
Alive (Total
Plants) Alive %
Dead (Total
Plants) Dead %
Total Plants
(Alive and Dead)
Total
Number of Species
Average
Plant health
WyndgateTarrs 9 156 62% 96 38% 252 17 1
Zone Poly_ID Number of Transects
Alive (Total Plants)
Alive % Dead (Total
Plants) Dead %
Total Plants
(Alive and Dead)
Total
Number of Species
Average Plant health
3 2057 1 21 100% 0 0% 21 1 1
9 2056 8 135 58% 96 42% 231 17 1
Vegetation Survivorship Monitoring
Page 82 12/07/2013
4 Discussion and Recommendations
The overall vegetation survivorship for the 2012 plantings was 62%. A total of 121 species were identified across all 56 sites monitored of which 61% were in good condition and 33% were slightly affected. Only 1% of the species identified were severely affected. Survivorship
of Acacia spp., Eucalyptus spp., Allocasuarina spp., Enchylaena tomentose and sedges was excellent with greater than 80 % survivorship across all sites. The survivorship of Puccinellia stricta, Lasiopetalum baueri, Enneapogon nigricans and many unknown species was very
poor with <20 % survivorship across all sites.
The following observations were noted which may provide some explanation for the
survivorship obtained:
Plants with no tree guards were highly affected by grazing either from hares, rabbits
or kangaroos. Evidence of cattle through some sites was also observed.
Some plants were inefficiently planted (e.g. not planted below ground level). These
sites included Camp Coorong and Hartman.
Weed spraying was too close to plantings at some sites.
Some weeds were out-competing some plantings.
Some areas within some sites were not suitable for plantings (e.g. sand swales and
water logged zones). Sites included Poltalloch Inland Dune, Henshell, Kindaruar Farm and Nurra-Nurra.
Samphire flats, where planted, produced poor results; much natural regeneration of
samphire was observed in stranded litter zones. Trying to introduce other plants (e.g. Melaleuca halmaturorum) into these low samphire areas appears futile.
Introduction of cattle to an area with new plantings proved detrimental to the
survival rate.
To improve the survivorship of future plantings the following recommendations are
suggested:
Pre-planting management could include strategies such as fencing, pest and weed
control.
Additionally, soil testing at some sites could assist in planning where some species
could be planted.
Pest control, especially for rabbits, needs to be ongoing as this was the major
contribution to plant deaths.
Tree guards proved to be vital in the survivorship of plants and should be included in
all future plantings.
The type of tree guard needs to be considered. Biodegradable tree guards were
affected by grazing and observed to collapse onto the seedlings.
Livestock need to be kept off planted areas either through strategic fencing of some
areas or providing information to landowners regarding keeping livestock off the planted areas. Cattle were evident at Boggy Lake, ACL-Triangle, Kartoo Road, Low
Point, Warrengie, Watkins and Wellington Lodge Lake Edge.
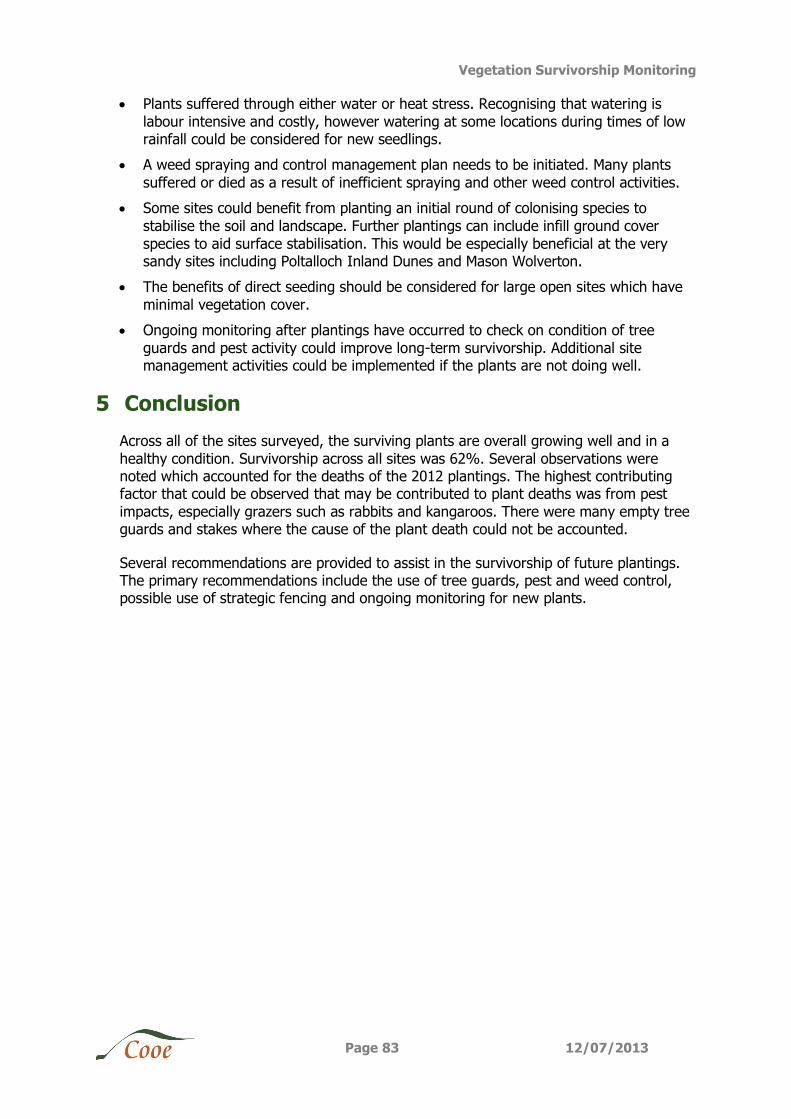
Vegetation Survivorship Monitoring
Page 83 12/07/2013
Plants suffered through either water or heat stress. Recognising that watering is
labour intensive and costly, however watering at some locations during times of low rainfall could be considered for new seedlings.
A weed spraying and control management plan needs to be initiated. Many plants
suffered or died as a result of inefficient spraying and other weed control activities.
Some sites could benefit from planting an initial round of colonising species to
stabilise the soil and landscape. Further plantings can include infill ground cover
species to aid surface stabilisation. This would be especially beneficial at the very sandy sites including Poltalloch Inland Dunes and Mason Wolverton.
The benefits of direct seeding should be considered for large open sites which have
minimal vegetation cover.
Ongoing monitoring after plantings have occurred to check on condition of tree
guards and pest activity could improve long-term survivorship. Additional site management activities could be implemented if the plants are not doing well.
5 Conclusion
Across all of the sites surveyed, the surviving plants are overall growing well and in a
healthy condition. Survivorship across all sites was 62%. Several observations were noted which accounted for the deaths of the 2012 plantings. The highest contributing factor that could be observed that may be contributed to plant deaths was from pest
impacts, especially grazers such as rabbits and kangaroos. There were many empty tree guards and stakes where the cause of the plant death could not be accounted.
Several recommendations are provided to assist in the survivorship of future plantings. The primary recommendations include the use of tree guards, pest and weed control, possible use of strategic fencing and ongoing monitoring for new plants.
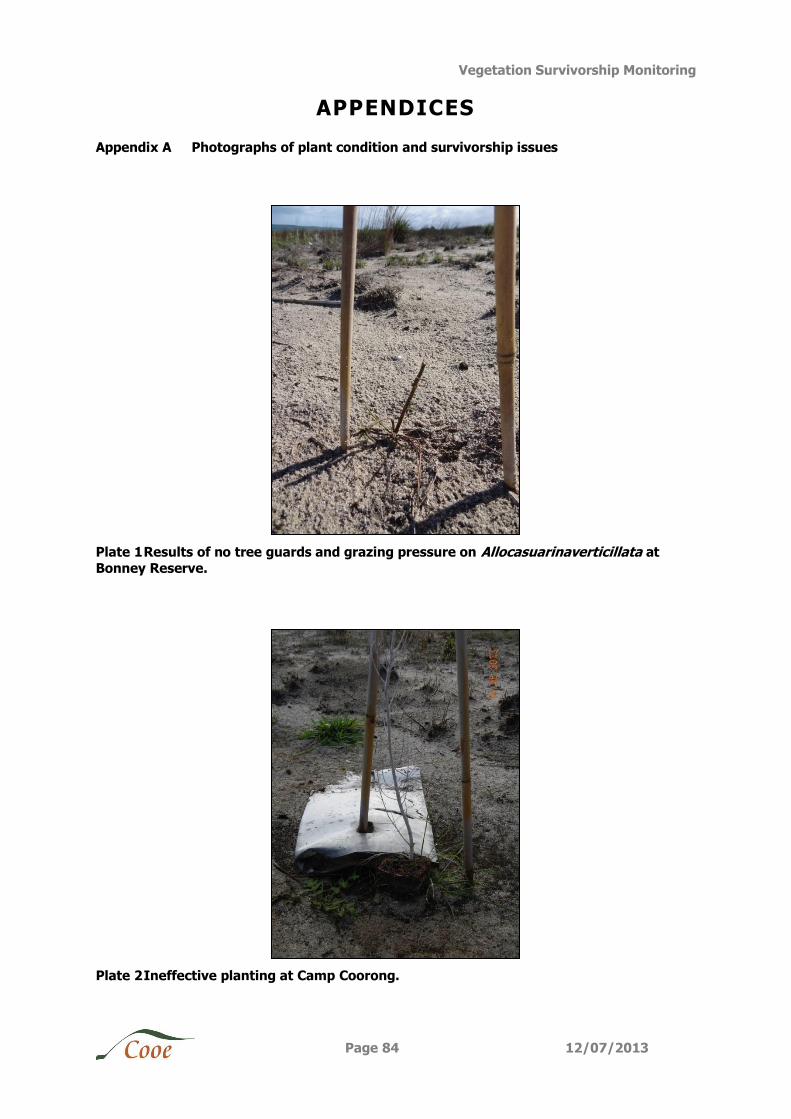
Vegetation Survivorship Monitoring
Page 84 12/07/2013
APPENDICES
Appendix A Photographs of plant condition and survivorship issues
Plate 1 Results of no tree guards and grazing pressure on Allocasuarinaverticillata at
Bonney Reserve.
Plate 2 Ineffective planting at Camp Coorong.
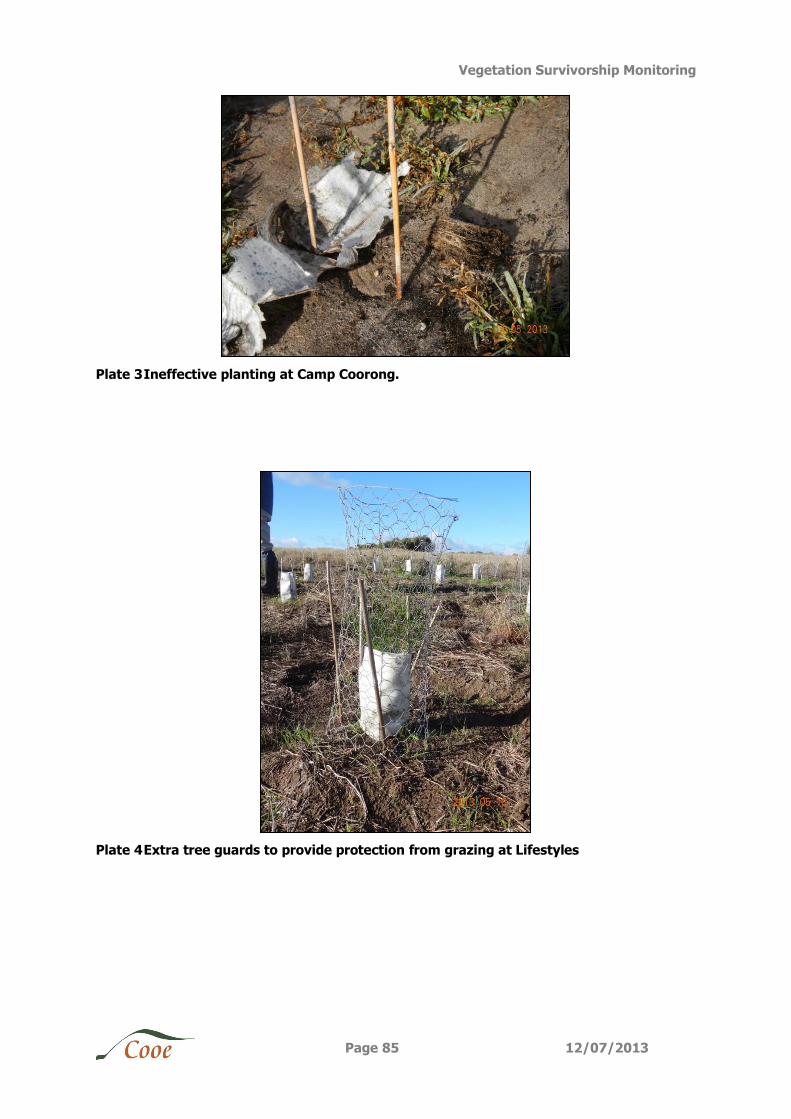
Vegetation Survivorship Monitoring
Page 85 12/07/2013
Plate 3 Ineffective planting at Camp Coorong.
Plate 4 Extra tree guards to provide protection from grazing at Lifestyles
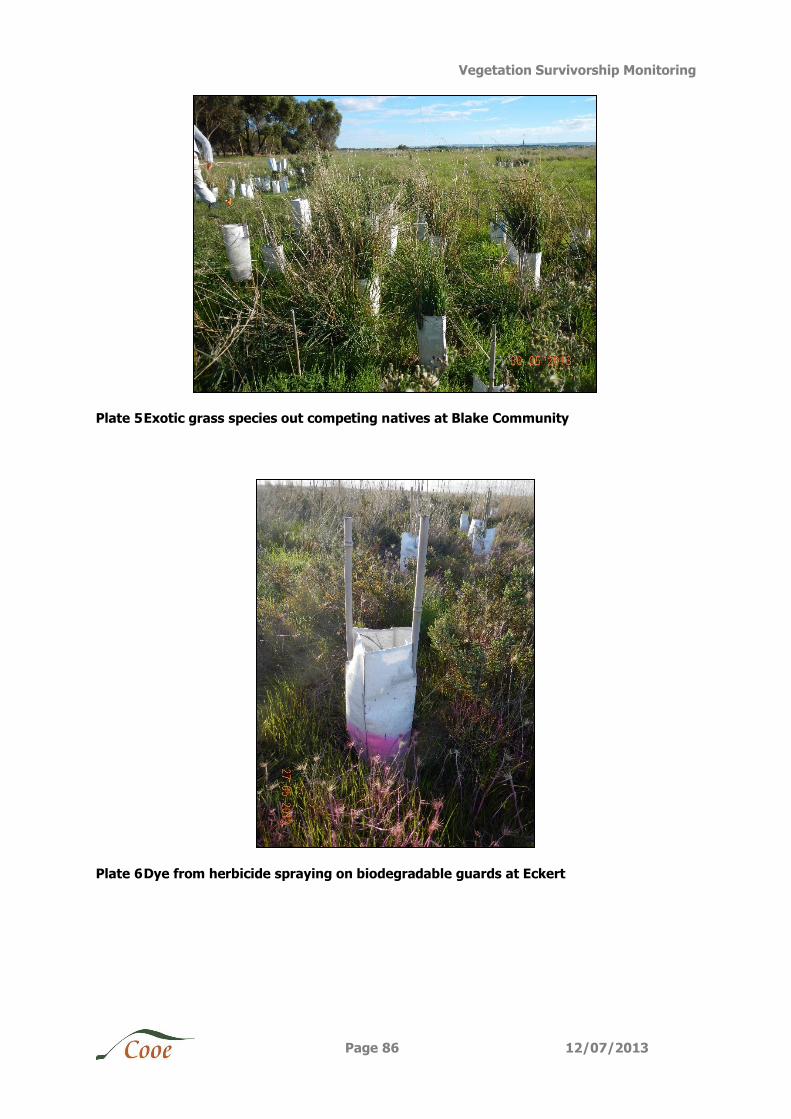
Vegetation Survivorship Monitoring
Page 86 12/07/2013
Plate 5 Exotic grass species out competing natives at Blake Community
Plate 6 Dye from herbicide spraying on biodegradable guards at Eckert
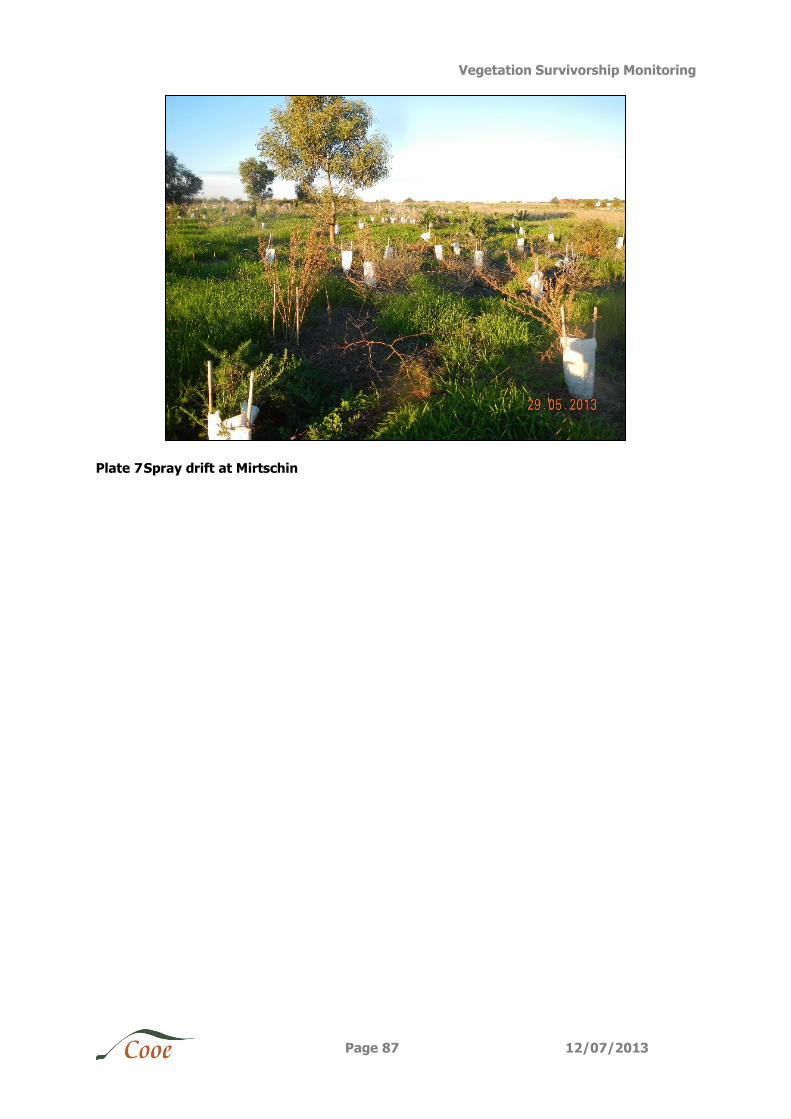
Vegetation Survivorship Monitoring
Page 87 12/07/2013
Plate 7 Spray drift at Mirtschin