Embed Size (px)
Citation preview
1
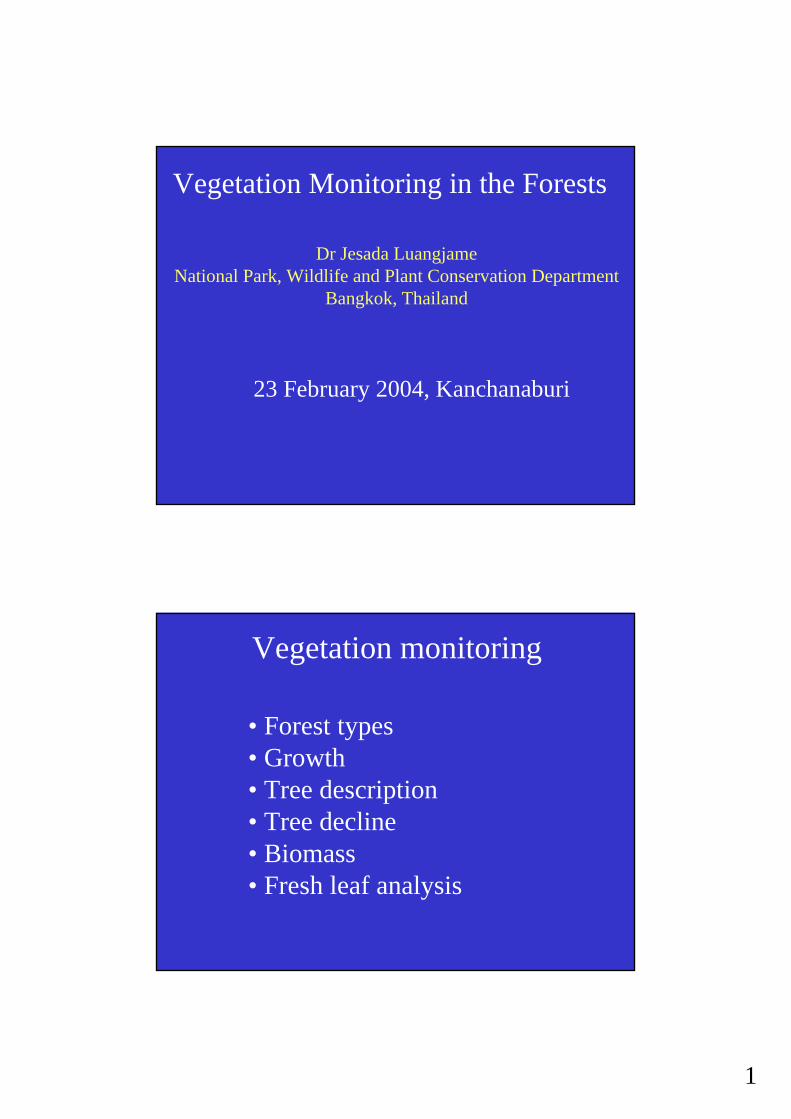
Vegetation Monitoring in the Forests
Dr Jesada LuangjameNational Park, Wildlife and Plant Conservation Department
Bangkok, Thailand
23 February 2004, Kanchanaburi
Vegetation monitoring
• Forest types• Growth• Tree description• Tree decline• Biomass• Fresh leaf analysis
2
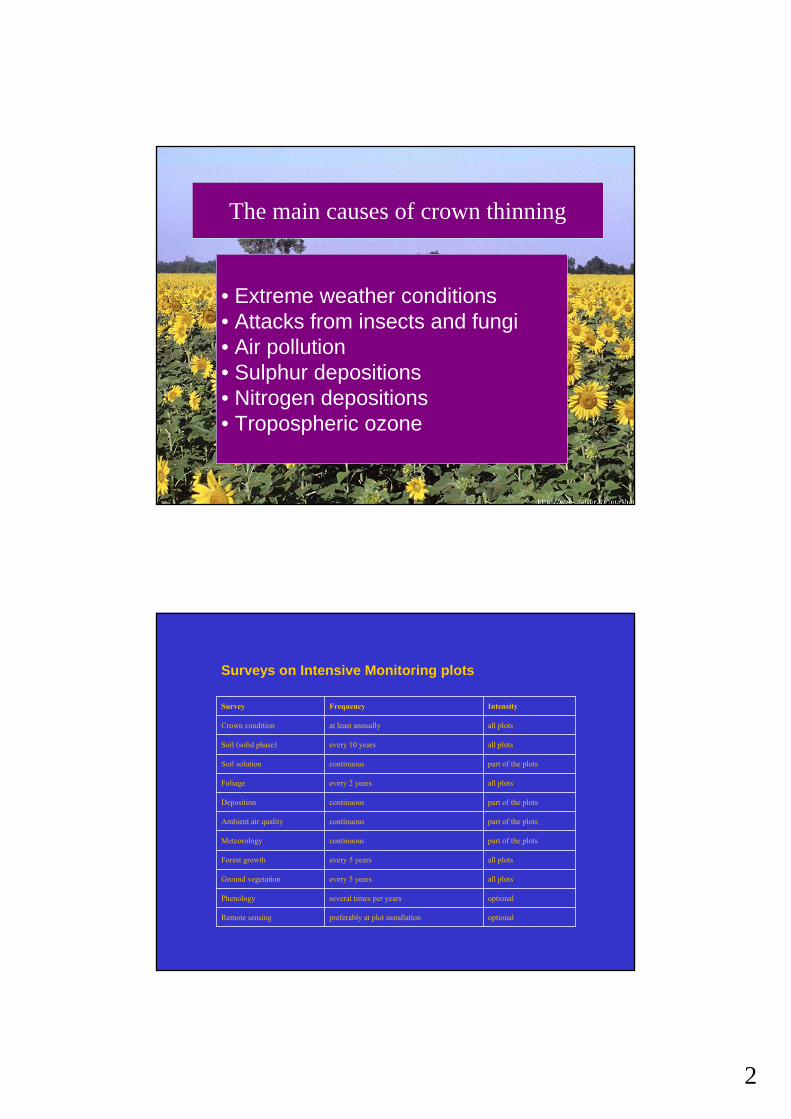
The main causes of crown thinning
• Extreme weather conditions• Attacks from insects and fungi• Air pollution• Sulphur depositions• Nitrogen depositions• Tropospheric ozone
Surveys on Intensive Monitoring plots
optionalpreferably at plot installationRemote sensingoptionalseveral times per yearsPhenologyall plotsevery 5 yearsGround vegetationall plotsevery 5 yearsForest growthpart of the plotscontinuousMeteorologypart of the plotscontinuousAmbient air qualitypart of the plotscontinuousDepositionall plotsevery 2 yearsFoliagepart of the plotscontinuousSoil solutionall plotsevery 10 yearsSoil (solid phase)all plotsat least annuallyCrown conditionIntensityFrequencySurvey
3
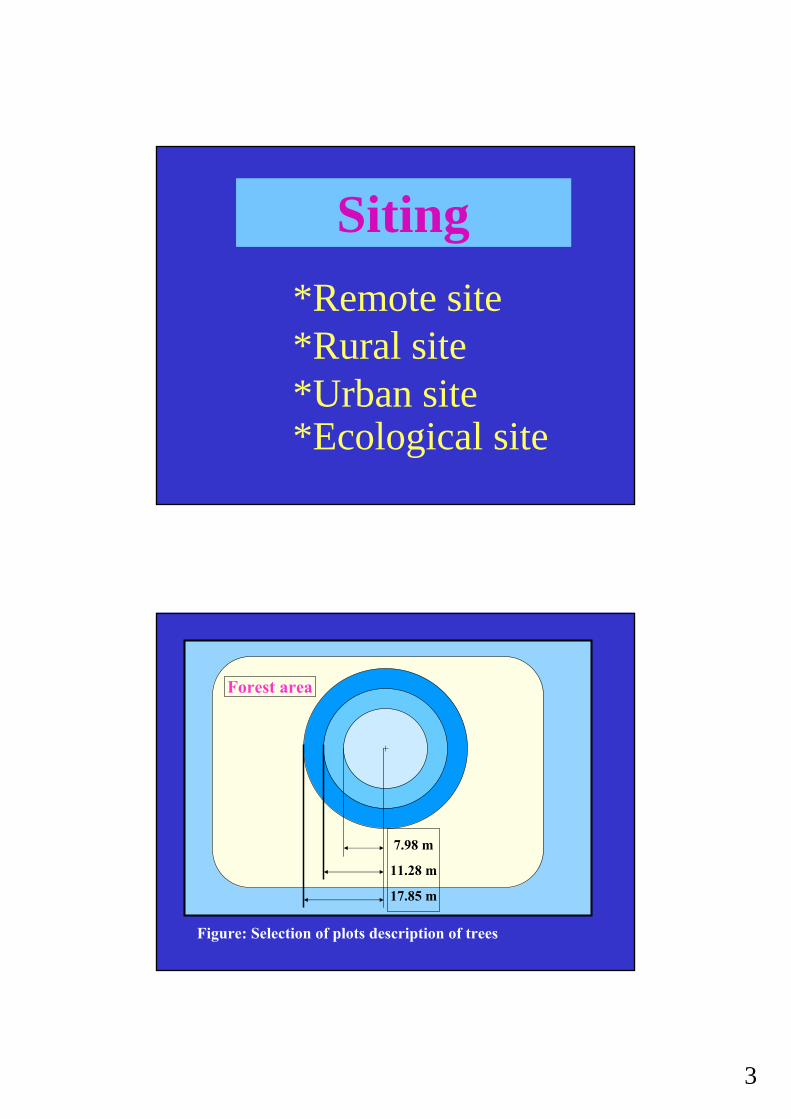
Siting*Remote site*Rural site*Urban site*Ecological site
7.98 m11.28 m17.85 m
Forest area
+
Figure: Selection of plots description of trees
4
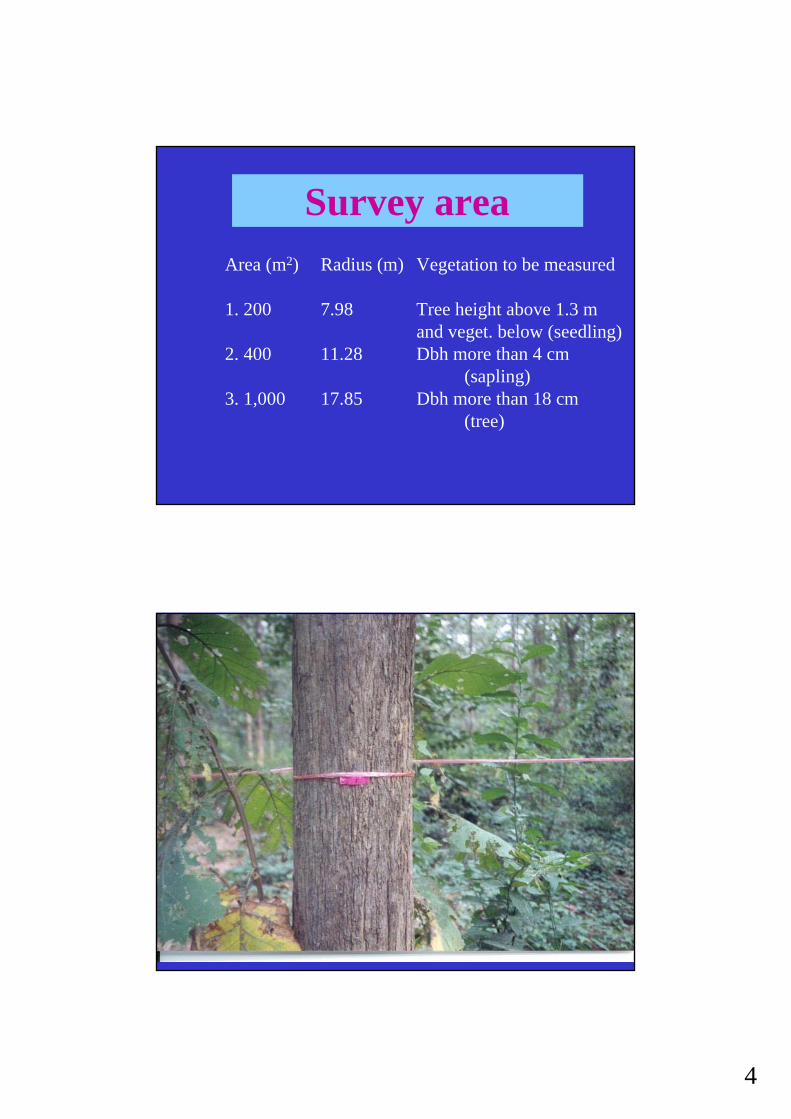
Survey areaArea (m2) Radius (m) Vegetation to be measured
1. 200 7.98 Tree height above 1.3 mand veget. below (seedling)
2. 400 11.28 Dbh more than 4 cm(sapling)
3. 1,000 17.85 Dbh more than 18 cm(tree)
5
6
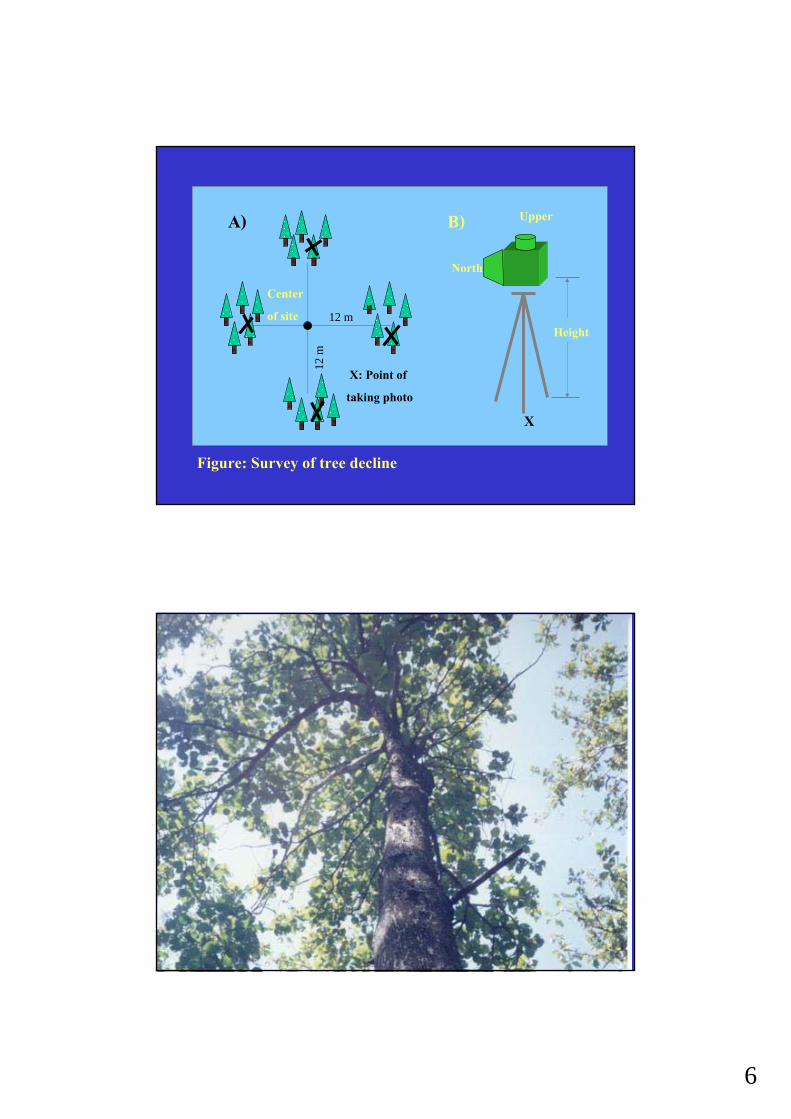
Centerof site
X: Point of taking photo
A) B)North
Height
Upper
X
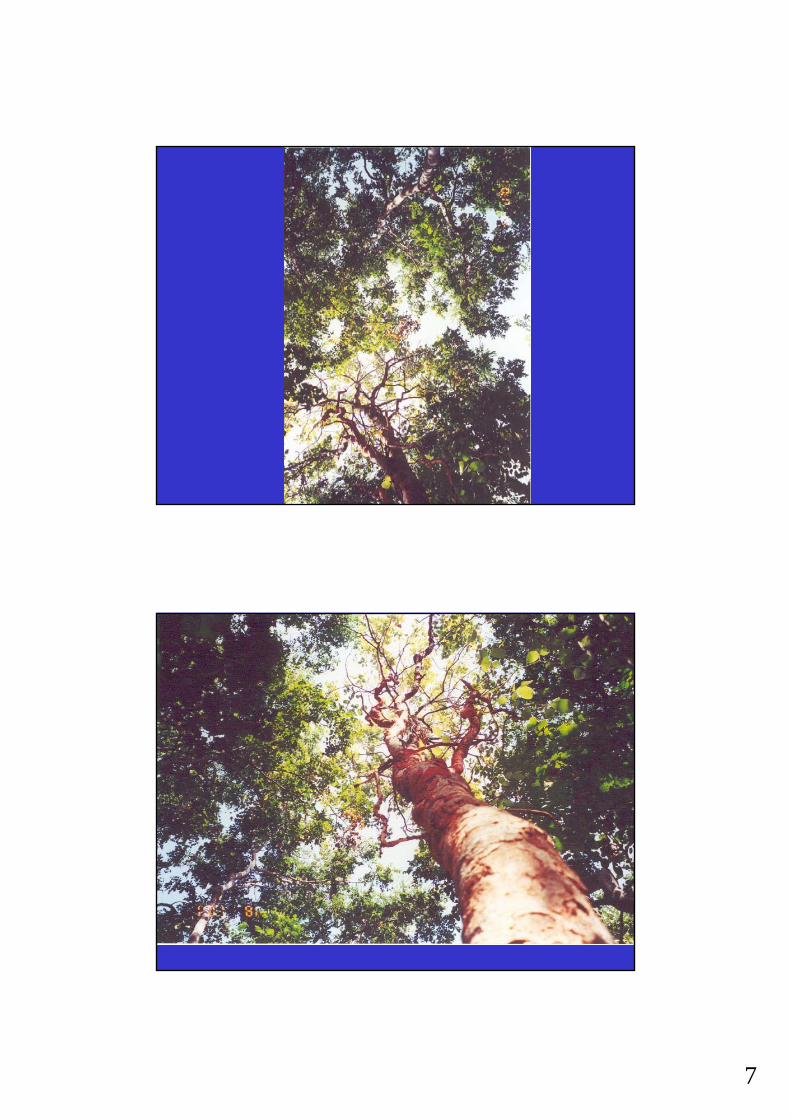
Figure: Survey of tree decline
12 m12
m
7
8
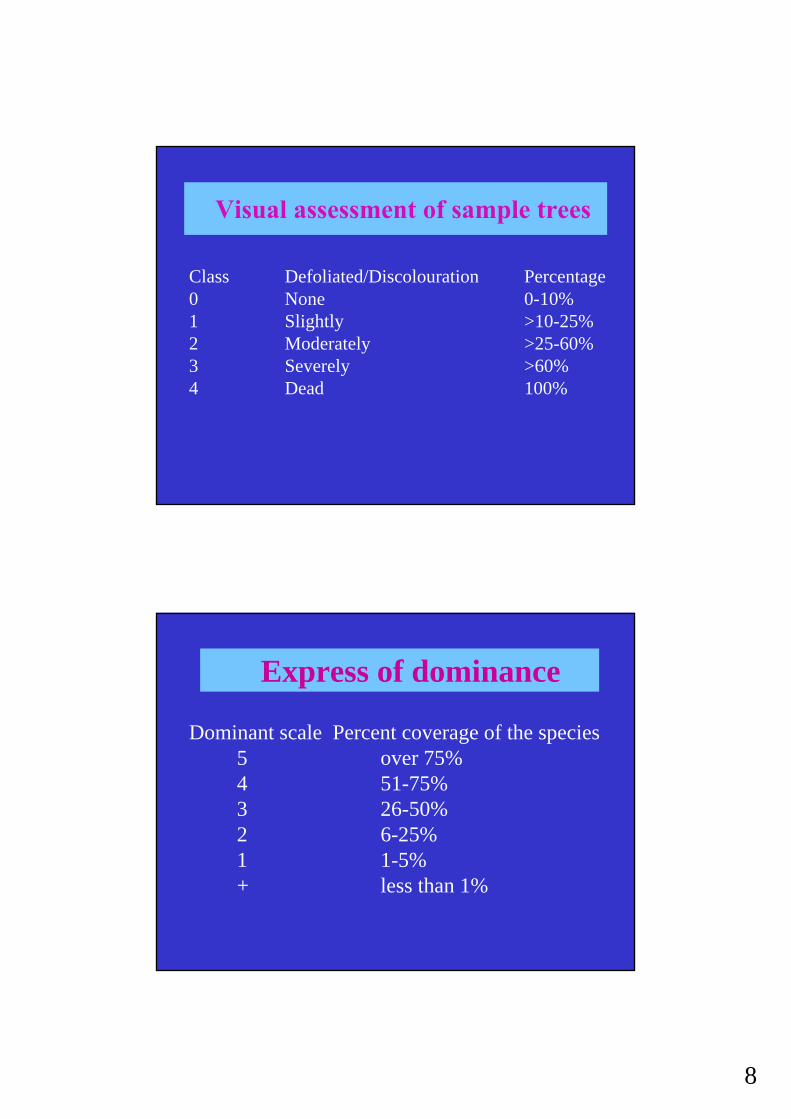
Visual assessment of sample treesClass Defoliated/Discolouration Percentage0 None 0-10%1 Slightly >10-25%2 Moderately >25-60%3 Severely >60%4 Dead 100%
Express of dominance
Dominant scale Percent coverage of the species5 over 75%4 51-75%3 26-50%2 6-25%1 1-5%+ less than 1%
9
10
11
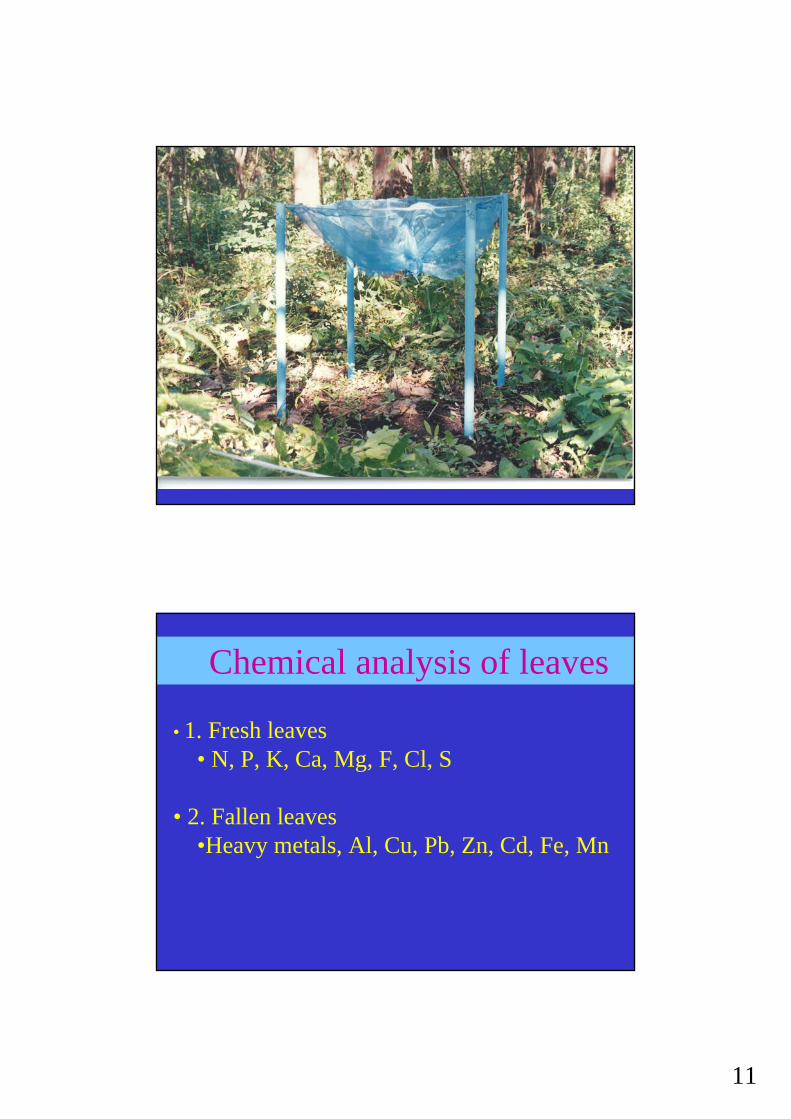
Chemical analysis of leaves
• 1. Fresh leaves• N, P, K, Ca, Mg, F, Cl, S
• 2. Fallen leaves•Heavy metals, Al, Cu, Pb, Zn, Cd, Fe, Mn
12
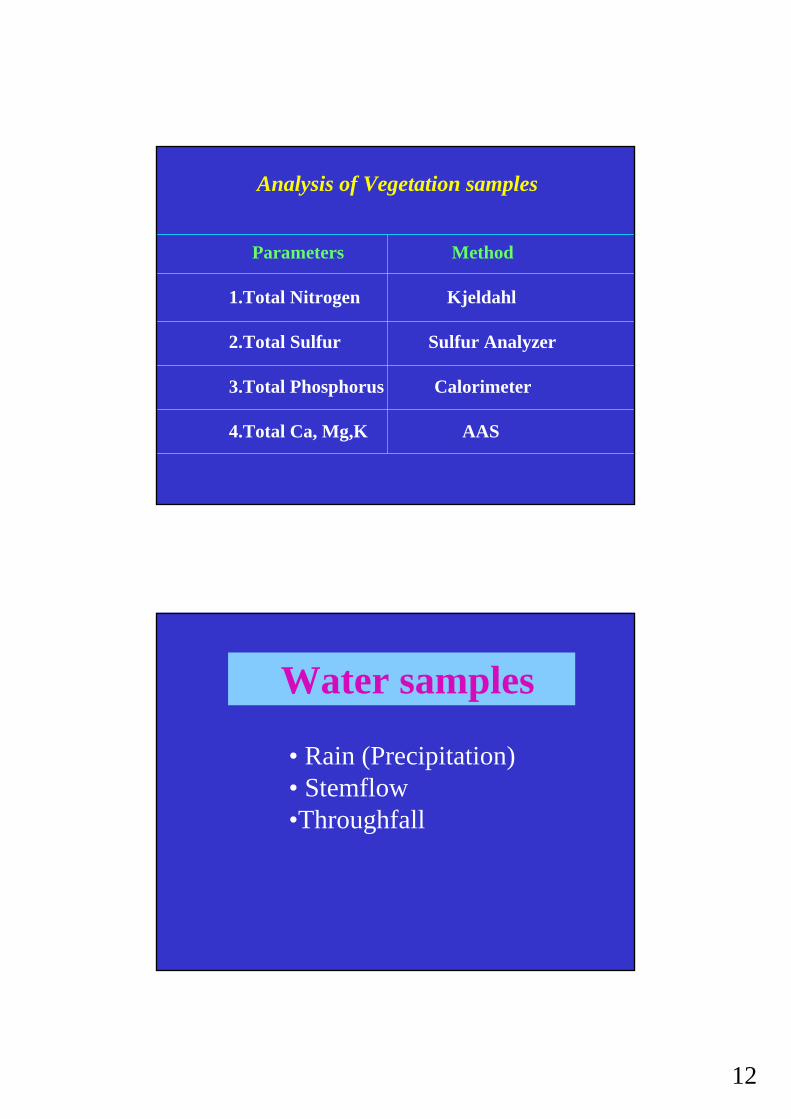
Analysis of Vegetation samples
Parameters Method
1.Total Nitrogen Kjeldahl
2.Total Sulfur Sulfur Analyzer
3.Total Phosphorus Calorimeter
4.Total Ca, Mg,K AAS
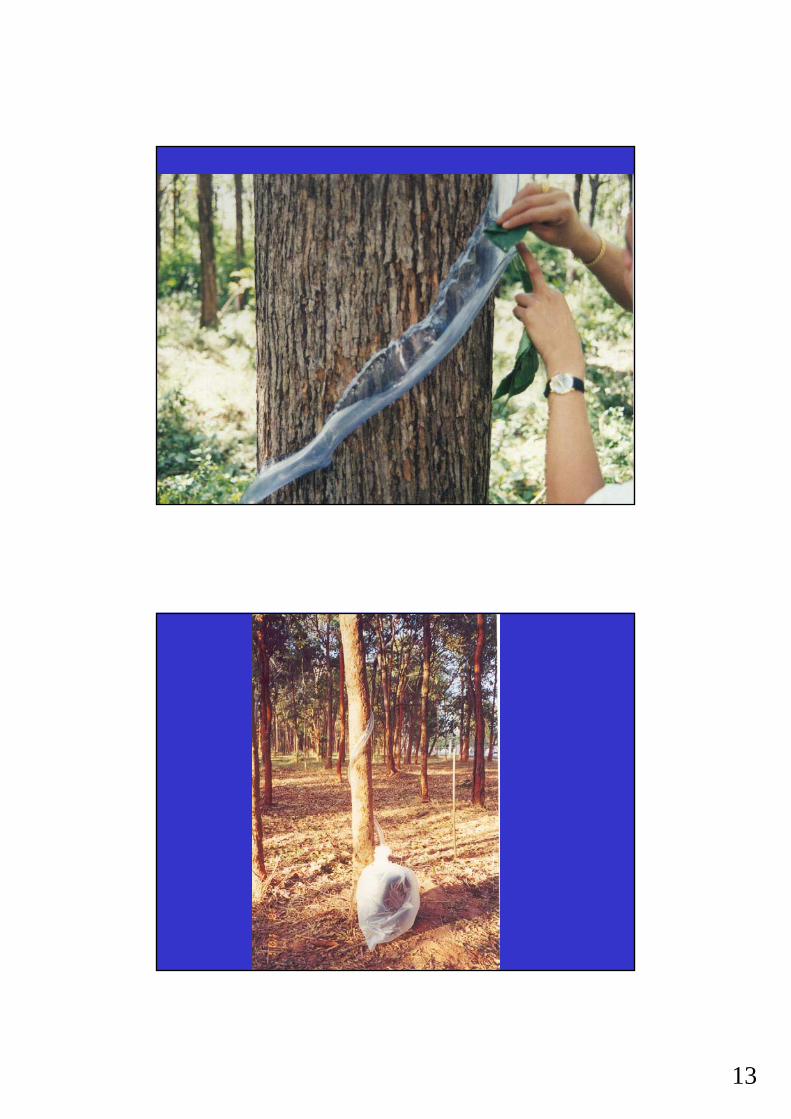
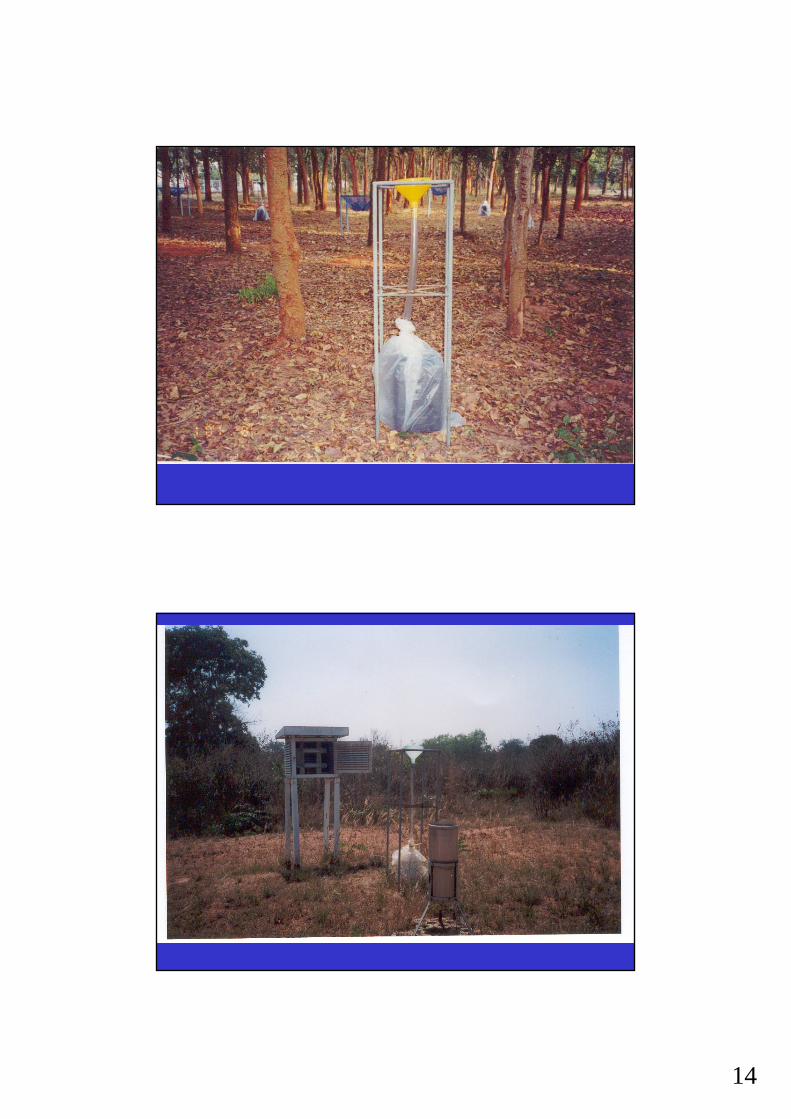
Water samples
• Rain (Precipitation)• Stemflow•Throughfall
13
14
15
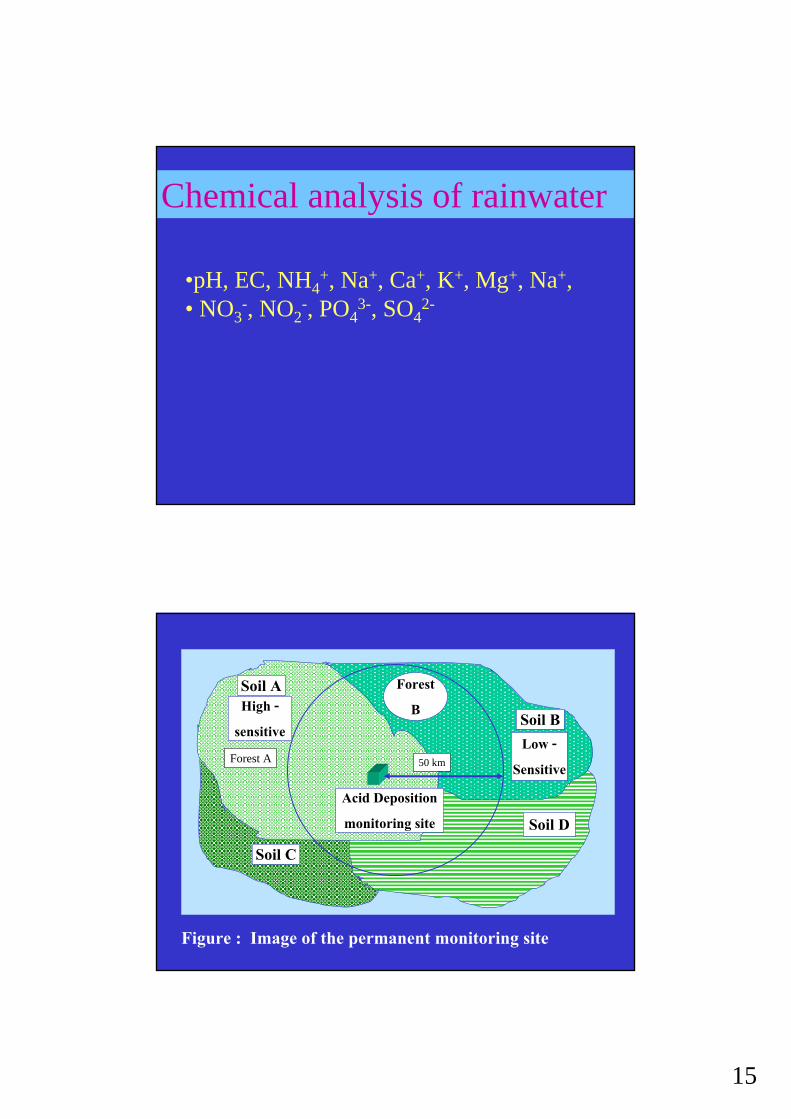
Chemical analysis of rainwater
•pH, EC, NH4+, Na+, Ca+, K+, Mg+, Na+,
• NO3-, NO2
-, PO43-, SO4
2-
Figure : Image of the permanent monitoring site
50 km
Soil AHigh -
sensitive Soil B
Soil D
Low -Sensitive
ForestB
Acid Depositionmonitoring site
Soil C
50 kmForest A
16
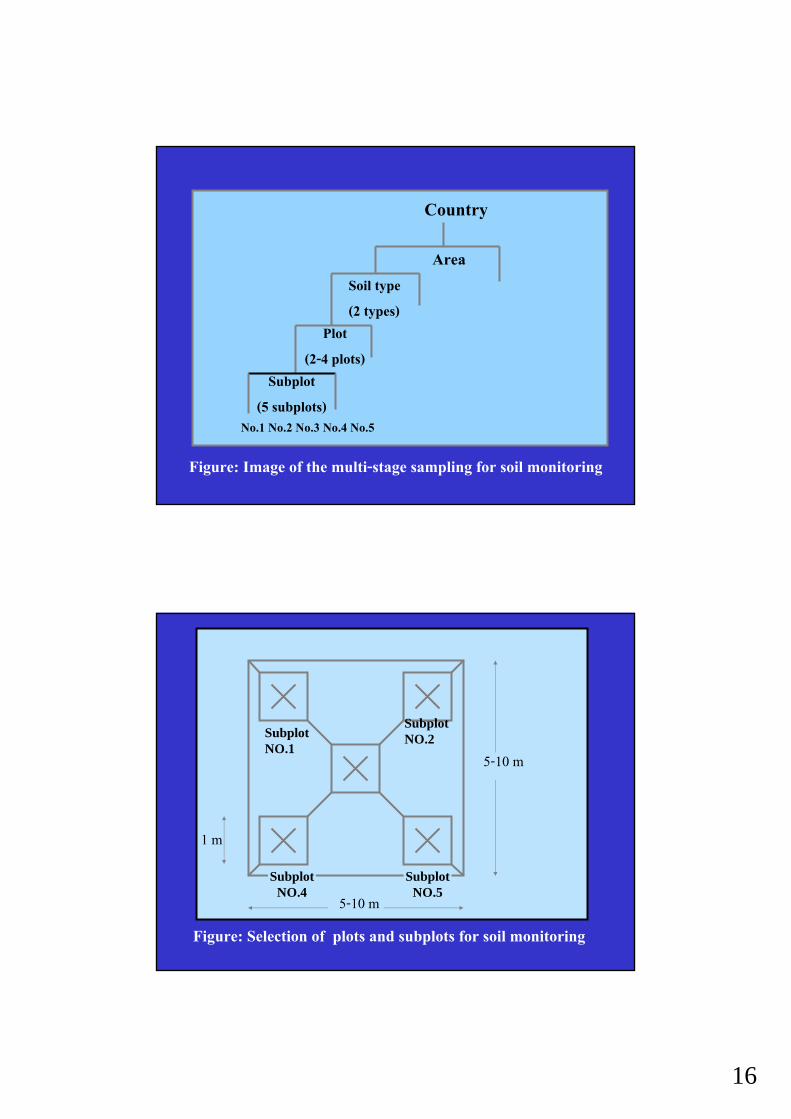
Country
AreaSoil type(2 types)
Plot(2-4 plots)
Subplot(5 subplots)
No.1 No.2 No.3 No.4 No.5
Figure: Image of the multi-stage sampling for soil monitoring
SubplotNO.1
SubplotNO.2
SubplotNO.4
SubplotNO.55-10 m
5-10 m
1 m
Figure: Selection of plots and subplots for soil monitoring
17
18
19
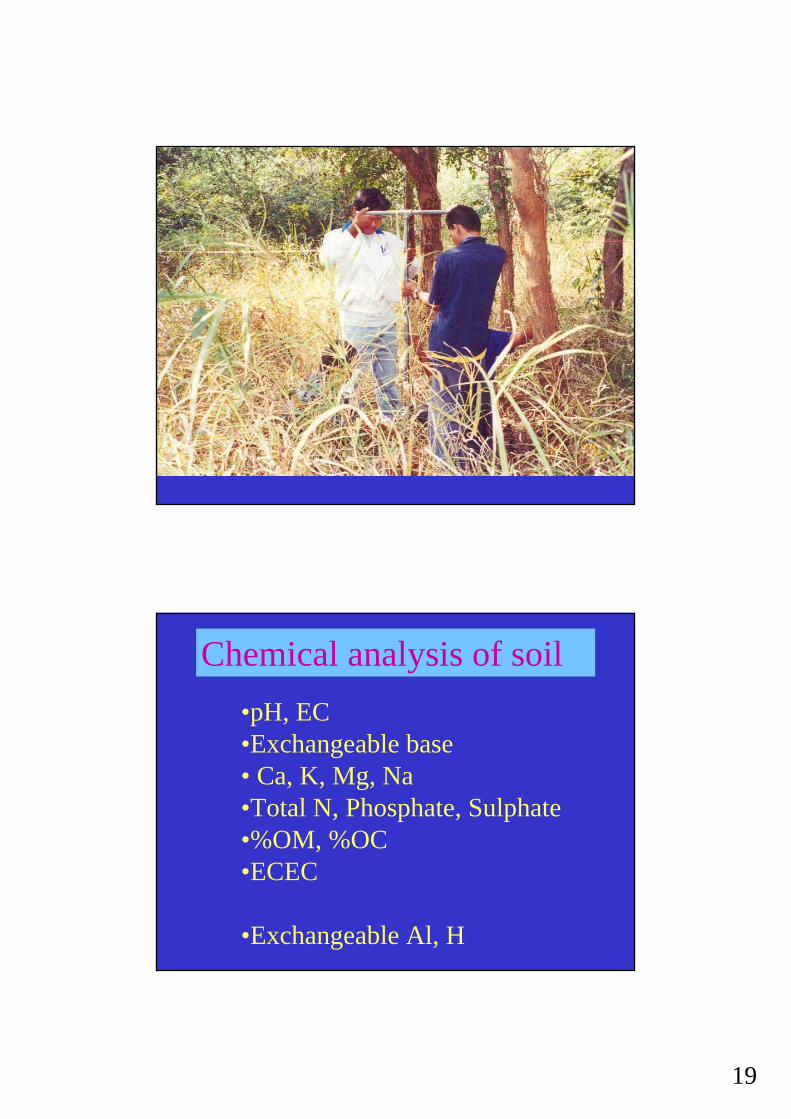
Chemical analysis of soil•pH, EC•Exchangeable base• Ca, K, Mg, Na•Total N, Phosphate, Sulphate•%OM, %OC•ECEC
•Exchangeable Al, H
20
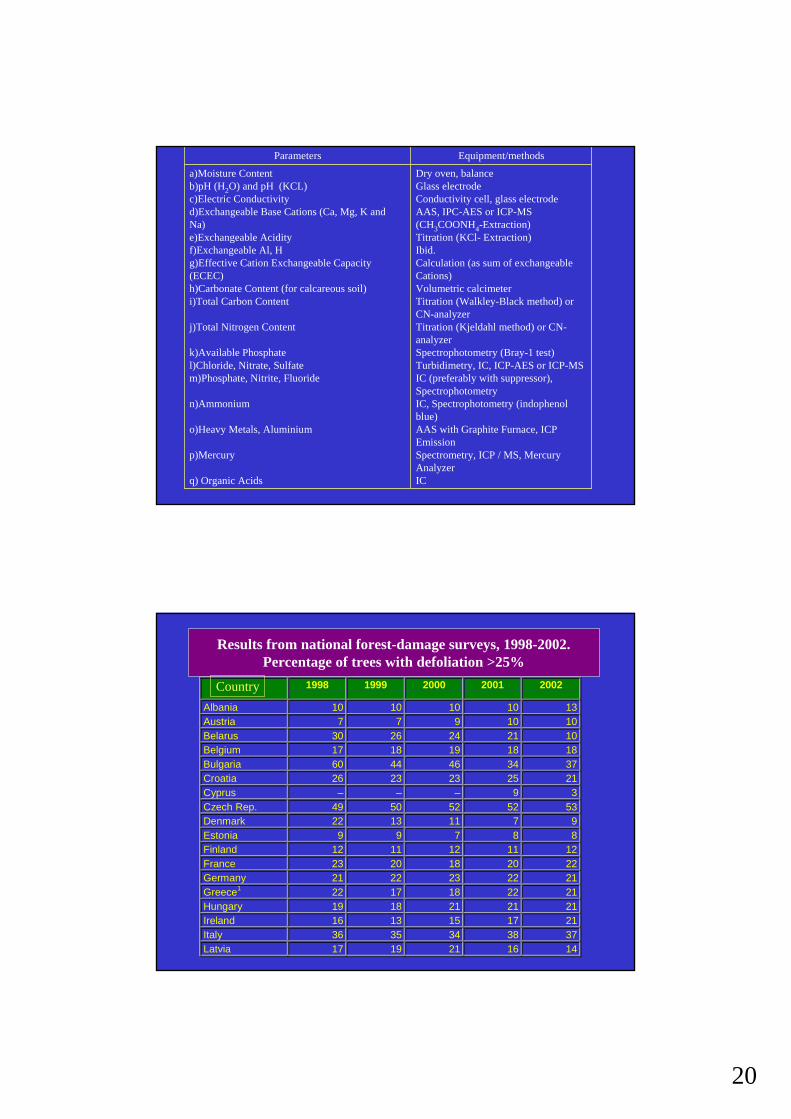
Dry oven, balanceGlass electrodeConductivity cell, glass electrodeAAS, IPC-AES or ICP-MS(CH3COONH4-Extraction)Titration (KCl- Extraction)Ibid.Calculation (as sum of exchangeable Cations)Volumetric calcimeterTitration (Walkley-Black method) or CN-analyzerTitration (Kjeldahl method) or CN-analyzerSpectrophotometry (Bray-1 test)Turbidimetry, IC, ICP-AES or ICP-MSIC (preferably with suppressor), SpectrophotometryIC, Spectrophotometry (indophenolblue)AAS with Graphite Furnace, ICP EmissionSpectrometry, ICP / MS, Mercury AnalyzerIC
a)Moisture Contentb)pH (H2O) and pH (KCL)c)Electric Conductivityd)Exchangeable Base Cations (Ca, Mg, K and Na)e)Exchangeable Acidityf)Exchangeable Al, Hg)Effective Cation Exchangeable Capacity (ECEC)h)Carbonate Content (for calcareous soil)i)Total Carbon Content
j)Total Nitrogen Content
k)Available Phosphatel)Chloride, Nitrate, Sulfate m)Phosphate, Nitrite, Fluoride
n)Ammonium
o)Heavy Metals, Aluminium
p)Mercury
q) Organic Acids
Equipment/methodsParameters
Results from national forest-damage surveys, 1998-2002. Percentage of trees with defoliation >25%
1998 1999 2000 2001 2002 Albania 10 10 10 10 13 Austria 7 7 9 10 10 Belarus 30 26 24 21 10 Belgium 17 18 19 18 18 Bulgaria 60 44 46 34 37 Croatia 26 23 23 25 21 Cyprus – – – 9 3 Czech Rep. 49 50 52 52 53 Denmark 22 13 11 7 9 Estonia 9 9 7 8 8 Finland 12 11 12 11 12 France 23 20 18 20 22 Germany 21 22 23 22 21 Greece1 22 17 18 22 21 Hungary 19 18 21 21 21 Ireland 16 13 15 17 21 Italy 36 35 34 38 37 Latvia 17 19 21 16 14
Country
21
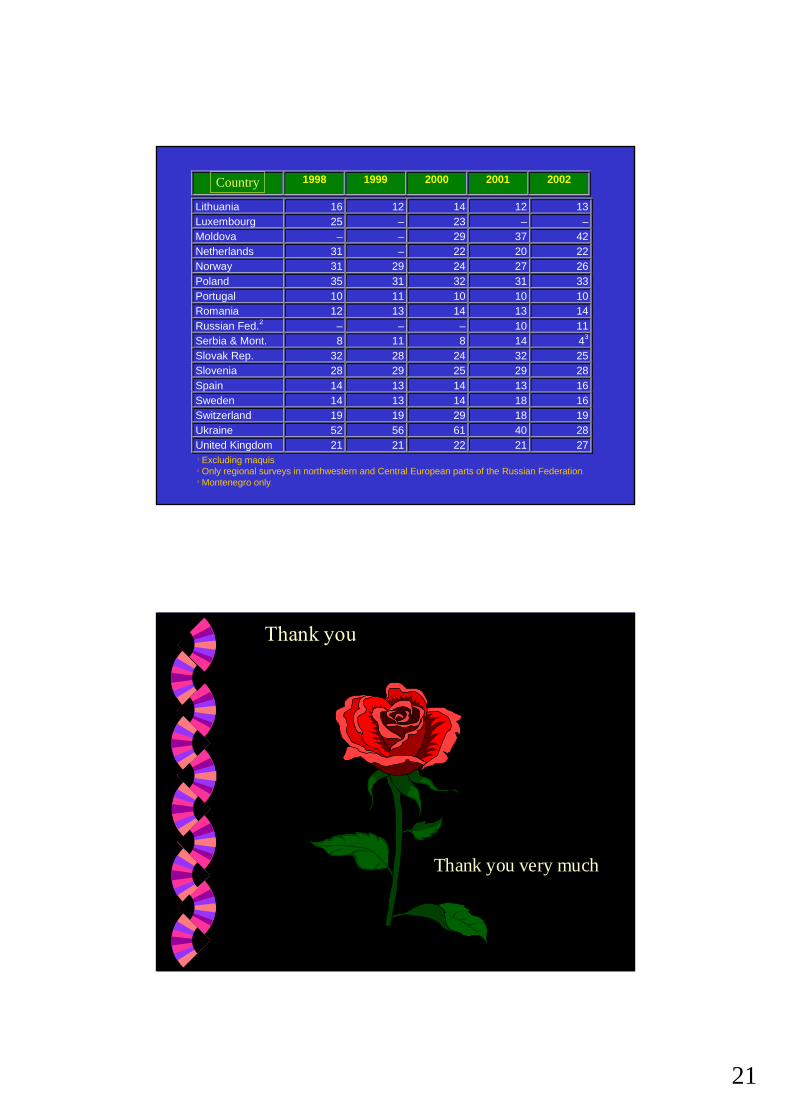
1998 1999 2000 2001 2002
Lithuania 16 12 14 12 13 Luxembourg 25 – 23 – – Moldova – – 29 37 42 Netherlands 31 – 22 20 22 Norway 31 29 24 27 26 Poland 35 31 32 31 33 Portugal 10 11 10 10 10 Romania 12 13 14 13 14 Russian Fed.2 – – – 10 11 Serbia & Mont. 8 11 8 14 43 Slovak Rep. 32 28 24 32 25 Slovenia 28 29 25 29 28 Spain 14 13 14 13 16 Sweden 14 13 14 18 16 Switzerland 19 19 29 18 19 Ukraine 52 56 61 40 28 United Kingdom 21 21 22 21 27
1 Excluding maquis.2 Only regional surveys in northwestern and Central European parts of the Russian Federation.3 Montenegro only.
Country
Thank you
Thank you very much


![Whole-ecosystem experimental manipulations of tropical forests · vegetation structure in tropical forests [13]. Correlated changes in abundances of taxa do not necessarily imply](https://img.pdfslide.us/doc/110x75/5f5f9c82e391e54aaf52aaea/whole-ecosystem-experimental-manipulations-of-tropical-forests-vegetation-structure.jpg)